
Galectin-3 not Galectin-9 as a candidate prognosis marker for hepatocellular carcinoma
- Published
- Accepted
- Received
- Academic Editor
- Vladimir Uversky
- Subject Areas
- Gastroenterology and Hepatology, Oncology
- Keywords
- Hepatocellular carcinoma, Galectin-3, Galectin-9, Prognosis
- Copyright
- © 2020 Kong et al.
- Licence
- This is an open access article distributed under the terms of the Creative Commons Attribution License, which permits unrestricted use, distribution, reproduction and adaptation in any medium and for any purpose provided that it is properly attributed. For attribution, the original author(s), title, publication source (PeerJ) and either DOI or URL of the article must be cited.
- Cite this article
- 2020. Galectin-3 not Galectin-9 as a candidate prognosis marker for hepatocellular carcinoma. PeerJ 8:e9949 https://doi.org/10.7717/peerj.9949
Abstract
Background
Galectins (Gal) are a family of protein that bind to the β-galactoside of glycoproteins. It modulates a variety of biological functions, such as tumor growth, angiogenesis and tumor metastasis. A series of experimental and clinical evidences have been reported to support a correlation between galectin expressions and neoplastic transformation, progression and prognosis. The objective of this study was to estimate the expression of Gal-3 and Gal-9 in order to evaluate their relation to hepatocellular carcinoma (HCC) -related clinical features and their prognostic values.
Methods
We evaluated Gal-3 and Gal-9 expression in 247 HCC patients by a tissue microarray immunohistochemistry method, then analyzed the relationship between expression levels of Gal-3 and Gal-9 protein and tumor parameters or clinical outcomes.
Results
The Gal-3 expression was significantly higher in tumor tissues compared with adjacent non-tumor tissues (P < 0.001), while no significant differences of Gal-9 was detected (P = 0.222). A higher Gal-3 expression was significantly associated with lymph-vascular invasion (P = 0.049), poor histological differentiation (P = 0.016), and no cirrhosis (P = 0.040). In contrast, a lower Gal-9 expression was related to lymph-vascular invasion (P = 0.012) and poor histological differentiation (P = 0.002). Survival analysis showed that patients with higher Gal-3 expression had worse overall survival (P = 0.012) , however no correlation was found between Gal-9 expression and survival (P = 0.185). Multivariate analysis showed that multiple tumor (HR = 1.94, 95% CI [1.36–2.78]), tumor size ≥ 5 cm (HR = 1.51, 95% CI [1.07–2.12]), Lymph-vascular invasion (HR = 1.45, 95% CI [1.00–2.10]) and Gal-3 expression (HR = 1.57, 95% CI [1.06–2.33]) were independent influencing factors of prognosis in patients with hepatocellular carcinoma.
Conclusion
Gal-3 was expected to serve as a novel prognostic marker of hepatocellular carcinoma, while Gal-9 expression was only related to tumor progression.
Introduction
Hepatocellular carcinoma (HCC), which accounts 75∼85% of primary liver cancer, remains the sixth common cancer worldwide and the fourth most cause of cancer mortality (Bray et al., 2018). In China, over 422,000 people die every year as the result of liver tumors (Chen et al., 2016). Surgical resection is the most common treatment method for early-stage HCC, local ablation, transcatheter tumour treatment, chemotherapy, multikinase inhibitor and immunotherapy are options for patients who are unsuitable for surgical resection (Johnston & Khakoo, 2019). However, the outcome and prognosis of HCC are disappointing, about 70% subjects develop recurrence within 5 years after resection (Tabrizian et al., 2015). The five-year survival is poor compared with other gastrointestinal malignant tumors (Bosetti, Turati & La Vecchia, 2014). In China, the five-year survival rate is about 37% after surgical resection (Yang et al., 2015b). However, for the low resectable rate at the time of diagnosis the five-year survival rate is only 12.1% in all liver tumors patients (Zeng et al., 2018). Some factors can predict the outcomes and prognosis of HCC, however, existed conventional prognostic indicators are poor at predicting the prognosis of HCC (Wu et al., 2019; Sapisochin & Bruix, 2017). Therefore, discovering new marker for predicting the prognosis of HCC after surgical resection is crucial to improve its management and long-term survival.
As a family of animal lectins, galectins (Gal) bind β-galactosides through conserved sequence elements of the carbohydrate recognition domain (CRD). Galectins are involved in the pathogenesis of HCC. Gal-1, Gal-3 and Gal-4 are up-regulated in HCC cells, whereas Gal-8 and Gal-9 are down-regulated in tumor hepatocytes (Wu et al., 2012; Jiang et al., 2014; Cai et al., 2014; Zhang et al., 2012). This abnormal expression relates to tumor growth, tumor cell migration and invasion, tumor metastasis, and poor prognosis. Gal-3 and Gal-9 also play key roles in inflammation- and fibrosis-related liver pathologies (Bacigalupo et al., 2013).
Galectin-3 is a multifunctional member of galectin family. It has been reported that Gal-3 is over-expressed in several cancers, including breast cancer, cervical cancer, gastric cancer, colon cancer and renal cell cancer (Ebrahim et al., 2014). Higher expression of Gal-3 can suppress tumor cell apoptosis (Nakahara, Oka & Raz, 2005), facilitate tumor metastasis by modulating innate anti-tumor immunity (Radosavljevic et al., 2012) and stimulate tumor capillary tube formation (Nangia-Makker et al., 2000). In HCC, related research reported that expression of Gal-3 is associated with vascular invasion and histological differentiation, up-regulated expression of Gal-3 was closely related to a poor prognosis (Matsuda et al., 2008). However Gal-3 expression is not significantly associated with clinicopathological parameters in the study of Jiang et al. (2014).
Galectin-9 is a new member of the galectin protein family (Jiang et al., 2013). The role of Gal-9 in cancer is complicated. In breast cancer, it can induce tumor cell aggregation and adhesion, and high Gal-9 expression is closely related to reduced metastasis and low recurrence (Irie et al., 2005; Yamauchi et al., 2006). Similar findings were also observed in malignant melanoma and HCC (Zhang et al., 2012; Kageshita et al., 2002). However in clear-cell renal cell carcinoma, high expression of Gal-9 is associated with poor survival and early recurrence (Fu et al., 2015). Paradoxically, Gal-9 is a ligand of T cell immunoglobulin and mucin-domain containing-3 (TIM-3), combining with TIM-3, Gal-9 triggers the termination of T-cell mediated immunity (Li et al., 2012).
Conflicting results exist on the analysis of relationship between clinicopathological parameters and Gal-3 expression (Jiang et al., 2014; Matsuda et al., 2008) and the limited reports of Gal-9 in HCC in previous literatures. Hence, the function of Galectin-3 and Galectin-9 and their correlation with tumor prognosis remain largely unknown. To evaluate the role of the expression of Gal-3 and Gal-9 during HCC occurrence and their prognostic values, we examined the Gal-3 and Gal-9 protein expression in HCC tumor tissue and paired non-tumor tissue, then explored the association of the protein expression with patient clinical characteristics and prognosis in this study.
Material and Methods
Study population
Between October 2008 and May 2013, a total of 247 patients including 195 men and 52 women with HCC who underwent surgery at the First Hospital of Jilin University were enrolled in this study. No patients received chemotherapy or radiotherapy before the surgical operation. Two independent pathologists confirmed the diagnosis of HCC and evaluated immunohistochemical findings. Paired adjacent normal samples were collected from 110 patients for comparison. Patients age range from 23 to 83 years, with a mean age of 54.3 years.
Ethics statement
The study protocol was approved by the Ethics Committee of the First Hospital of Jilin University (18YY228-001). Written informed consent was obtained from all of the patients.
Follow-up and outcomes collection
All the subjects underwent follow-up by telephone calls in three months, six months, and one year after the surgical resection and every one year later until death or the last scheduled follow-up. The subjects who were lost to follow-up at the first time of telephone interview, or died of compliments of the surgical operation in the perioperative period were excluded from the survival analysis. The duration from the date of surgical operation to the date of death or the date of the last successful interview was defined as the survival time. The last interview of this study was in May 2019.
Immunohistochemistry
Briefly, after routine dewaxing, the sections (4 um in width) from the tissue microarry (TMA) blocks were boiled in the 10mmol citrate buffer for 2.5min in a pressure cooker for epitope retrieval. After blocking endogenous peroxidase activity with 3% H2O2, all sections were incubated with anti-human galectin-9 polyclonal antibody (1:250 diluted, ab69630, Abcam, UK) and galectin-3 monoclonal antibody (1:100 diluted, ZA-0534, Zhongshan jinqiao, China) for 2.5 h at 37 °C. The slides were further treated with horseradish peroxidase-labeled secondary antibody for 15 min at room temperature (MXB, China). The slides were visualized using 3, 3-Diaminobenzidine (DAB) and were counterstained with hematoxylin. For negative controls, tumor slides were treated with the IgG isotypes from rabbit (normal rabbit IgG, sc-2027, Santacruz, USA) to replacement of primary antibody. All negative controls demonstrated negligible background stain.
Two independent pathologists who were blinded to clinical data and outcome evaluated the stained slides. The expression of Gal-3 and Gal-9 were assessed by doing an H-sore, which combines staining intensity and percentages of cells stained (McCarty Jr et al., 1985). The H-score (range of 0–300) was calculated using the following equation: H-score = i1 × P1 + i2 × P2 + i3 × P3. i means the intensity of staining (no staining = i0, weak staining = i1, moderate staining = i2 and strong staining = i3) and P represents percentages of stained cells within intensities varying from 0 to 100. The H-score = 0 is defined as a complete negative staining. The discrepancies of stained cells were resolved by calculating the means of the scores, and the discrepancies of staining intensity were discussed by the two pathologists to reach a consensus.
Statistical analysis
The H-score of Gal-9 and Gal-3 expression are presented as (interquartile ranges) and categorical variables were expressed as numbers and frequencies (%). The Wilcoxon matched-pairs signed-rank test was used when comparing the expression of Gal-3 and Gal-9 in tumor tissue and adjacent non-tumor tissue (Table 1). The Mann–Whitney test was used to evaluate the correlation between clinicopathological characters and expressions of Gal-3 and Gal-9 in tumor tissue (Table 2). Optimal cut-off values of Gal-3 and Gal-9 were calculated by time-dependent receiver operating characteristic (ROC) curves in the R language for survival analysis. The overall survival rate was estimated using Kaplan–Meier method and compared by the log-rank test. The Cox proportional hazards model was performed to assess factors potentially associated with prognosis of patients with HCC (Table 3). Variables with P values below or equal to 0.10 in univariate analysis were included in the multivariate model. Hazard ratio (HR) and corresponding 95% confidence intervals (95% CI) were used to determine the strength of statistical associations. A two-sided P-value below or equal to 0.05 was considered significant. Statistical analyses were performed using SPSS software package 18.0 (SPSS Inc. USA).
| Group | N | Expression of Galectin-3 | Median H-score (quartile) | P | Expression of Galectin-9 | Median H-score (quartile) | P | ||
|---|---|---|---|---|---|---|---|---|---|
| 0–120 | 121–300 | 0–100 | 101–300 | ||||||
| Tumor tissue | 110 | 77 (70.0%) | 33 (30.0%) | 0(0–180) | <0.001 | 68(61.8%) | 42(38.2%) | 90(10–180) | 0.222 |
| Adjacent non-tumor tissue | 110 | 100(90.9%) | 10(9.1%) | 0(0–0) | 59(53.6%) | 51(36.4%) | 90(90–180) | ||
| Character | n | Expression of Galectin-3 | Median H-score (quartile) | P | Expression of Galectin-9 | Median H-score (quartile) | P | ||
|---|---|---|---|---|---|---|---|---|---|
| 0–120 | 121–300 | 0–100 | 101–300 | ||||||
| Gender | |||||||||
| Male | 195 | 157 (80.5%) | 38 (19.5%) | 0(0–80) | 0.390 | 110 (56.4%) | 85 (43.6%) | 90(40–180) | 0.984 |
| Female | 52 | 44 (84.6%) | 8 (15.4%) | 0(0–90) | 28 (53.8%) | 24 (46.2%) | 90(30–180) | ||
| Age | |||||||||
| ≤55ys | 127 | 100 (78.7%) | 27 (21.3%) | 0(0–120) | 0.110 | 74 (58.3%) | 53 (41.7%) | 90(20–180) | 0.643 |
| >55ys | 120 | 101 (84.2%) | 19 (15.8%) | 0(0–60) | 64 (53.3%) | 56 (46.7%) | 90(60–180) | ||
| HBV/HCV | |||||||||
| HBV positive | 158 | 123 (77.8%) | 35 (22.2%) | 0(0–120) | 0.052 | 90 (57.0%) | 68 (43.0%) | 90(30–180) | 0.817 |
| HCV positive | 45 | 41 (91.1%) | 4 (8.9%) | 0(0–0) | 25 (55.6%) | 20 (44.4%) | 90(40–180) | ||
| Negative | 44 | 37 (84.1%) | 7 (15.9%) | 0(0–60) | 23 (52.3%) | 21 (47.7%) | 90(40–180) | ||
| Number of tumor | |||||||||
| Single | 183 | 151 (82.5%) | 32 (17.5%) | 0(0–80) | 0.061 | 99 (54.1%) | 84 (45.9%) | 90(50–180) | 0.561 |
| Multiple | 64 | 50 (78.1%) | 14 (21.9%) | 7.5(0-112.5) | 39 (60.9%) | 25 (39.1%) | 90(5–180) | ||
| Tumor size | |||||||||
| ≤5 cm | 137 | 117 (85.4%) | 20 (14.6%) | 0(0–80) | 0.334 | 99 (54.1%) | 84 (45.9%) | 90(60–180) | 0.427 |
| >5 cm | 110 | 84 (74.6%) | 26 (23.4%) | 0(0–120) | 39 (60.9%) | 25 (39.1%) | 90(0–180) | ||
| Differentiation | |||||||||
| Poor | 75 | 59 (78.7%) | 16 (21.3%) | 15(0–100) | 0.016 | 49 (65.3%) | 26 (37.4%) | 80(0–180) | 0.002 |
| Moderate/well | 172 | 142 (82.6%) | 30 (17.4%) | 0(0–75) | 89 (51.7%) | 83 (48.3%) | 90(60–180) | ||
| Lymph-vascular invasion | |||||||||
| No | 138 | 117 (84.8%) | 21 (15.2%) | 0(0–60) | 0.049 | 71 (51.4%) | 67 (48.6%) | 90(67.5-180) | 0.012 |
| Yes | 109 | 84 (77.1%) | 25 (22.8%) | 0(0–110) | 67 (61.5%) | 42 (38.5%) | 90(0–180) | ||
| Cirrhosis | |||||||||
| No | 99 | 72 (72.7%) | 27 (27.3%) | 0(0–150) | 0.040 | 53 (53.5%) | 46 (46.5%) | 90(50–180) | 0.560 |
| Yes | 148 | 129 (87.2%) | 19 (17.8%) | 0(0–60) | 85 (57.4%) | 63 (42.6%) | 90(22.5-180) | ||
| AJCC clinical stage | |||||||||
| I | 109 | 95(87.2%) | 14 (12.8%) | 0(0–60) | 0.242 | 55 (50.5%) | 54 (49.5%) | 100(70–180) | 0.106 |
| II | 100 | 74 (74.0%) | 26 (26.0%) | 0(0–140) | 61 (61.0%) | 39 (39.0%) | 90(20–180) | ||
| III | 38 | 32 (84.2%) | 6 (15.8%) | 0(0–90) | 22 (57.9%) | 16 (42.1%) | 85(0–180) | ||
| Character | n | Univariate analysis | Multivariate analysisa | ||
|---|---|---|---|---|---|
| RR (95% CI) | P | RR (95% CI) | P | ||
| Number of tumor | |||||
| Single | 183 | Reference | Reference | ||
| Multiple | 64 | 2.21 (1.56–3.14) | <0.001 | 1.94 (1.36–2.78) | <0.001 |
| Tumor size | |||||
| ≤5 cm | 137 | Reference | Reference | ||
| >5 cm | 110 | 1.79(1.29–2.49) | 0.001 | 1.51(1.07–2.12) | 0.018 |
| Differentiation | |||||
| Poor | 75 | Reference | Reference | ||
| Moderate/well | 172 | 0.61(0.43–0.86) | 0.005 | 0.79(0.54–1.14) | 0.200 |
| Lymph-vascular invasion | |||||
| No | 138 | Reference | Reference | ||
| Yes | 109 | 1.96(1.41–2.73) | <0.001 | 1.45(1.00–2.10) | 0.050 |
| Galectin-3 | |||||
| ≤120 | 201 | Reference | Reference | ||
| >120 | 46 | 1.64(1.11–2.42) | 0.013 | 1.57(1.06–2.33) | 0.026 |
| Galectin-9 | |||||
| ≤100 | 138 | Reference | |||
| >100 | 109 | 1.25(0.90–1.73) | 0.187 | ||
Notes:
Results
Expression of Gal-3 and Gal-9 in tumor tissue and adjacent non-tumor tissue
Immunohistochemical analysis showed that Gal-3 and Gal-9 was diffuse stained mainly in the cytoplasm and weak stained in cell membrance and nucleus. Gal-3 and Gal-9 showed positive on tumor cells in 44.2% (121/274) and 80.7% (221/274) patients with HCC. The expression of Gal-3 and Gal-9 in liver tumor tissues was shown in Fig. 1. The positive and negative control of Gal-3 and Gal-9 were shown in Fig. S1.
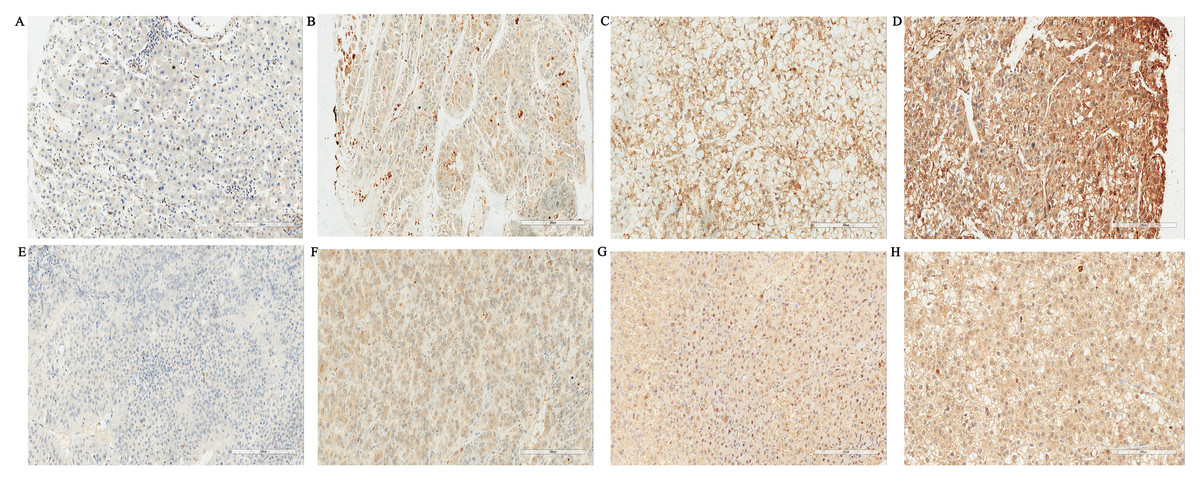
Figure 1: Expressions of Galectin-3 and Galectin-9 in liver tissues of tumor (SP, ×200).
(A) Negative expression of Galectin-3 in tumor cells of HCC; (B) Weak Galectin-3 positive staining in tumor cells of HCC; (C) Moderate Galectin-3 positive staining in tumor cells of HCC; (D) Strong Galectin-3 positive staining in tumor cells of HCC; (E) Negative expression of Galectin-9 in tumor cells of HCC; (F) Weak Galectin-9 positive staining in tumor cells of HCC; (G) Moderate Galectin-9 positive staining in tumor cells of HCC; (H) Strong Galectin-9 positive staining in tumor cells of HCC.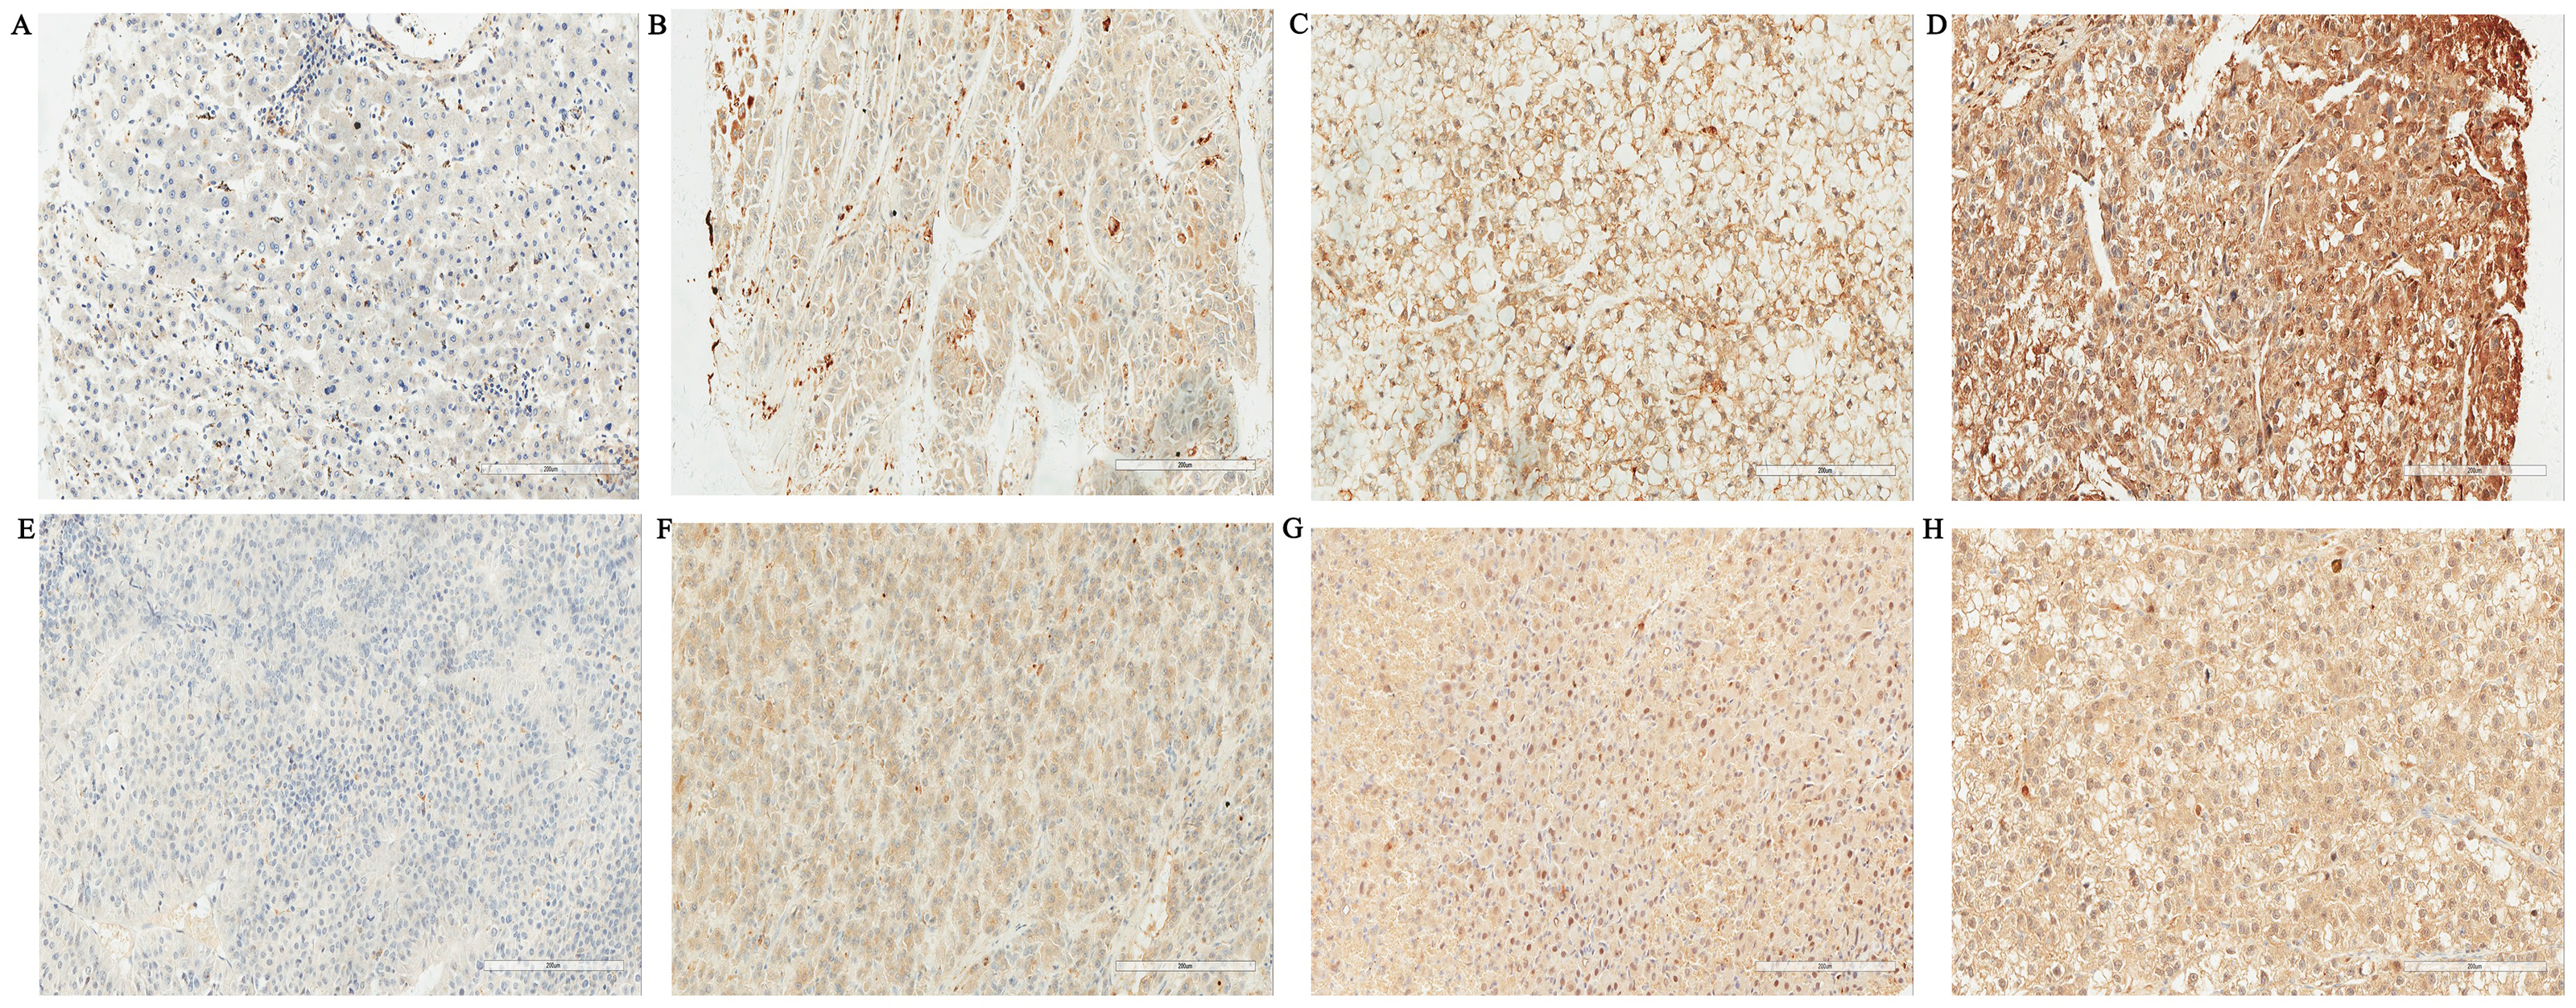
Among 110 paired samples, the Gal-3 expression was significantly higher in tumor tissues than that in adjacent hepatic tissues (P < 0.001). However, no significant difference was found in Gal-9 expression (P = 0.222), (Table 1). The distribution of expression of Gal-3 and Gal-9 in tumor tissue and adjacent non-tumor tissue was shown in Fig. 2.
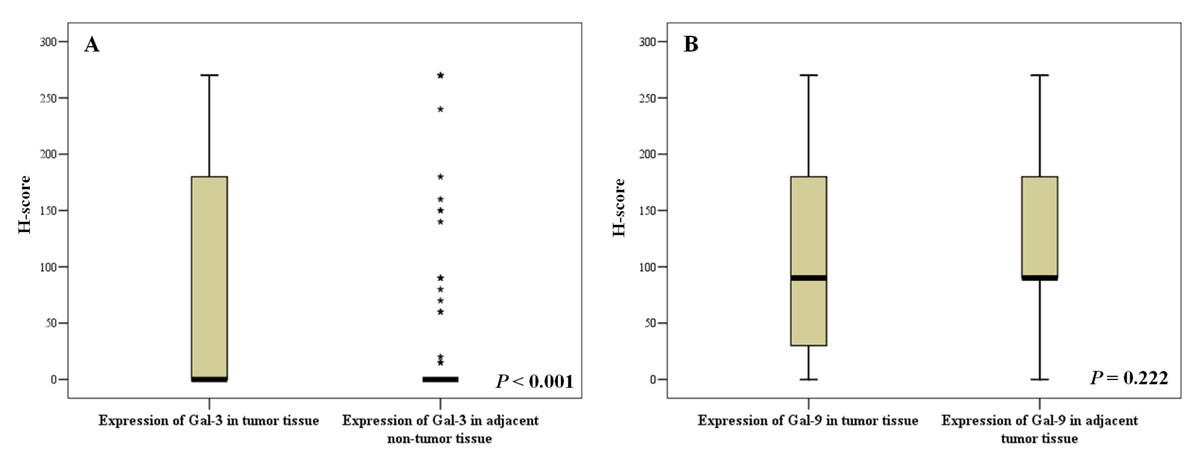
Figure 2: Expressions of Galectin-3 and Galectin-9 in liver tissues of tumor and adjacent non-tumor tissue.
(A) Distribution of Gal-3 expression; (B) Distribution of Gal-9 expression.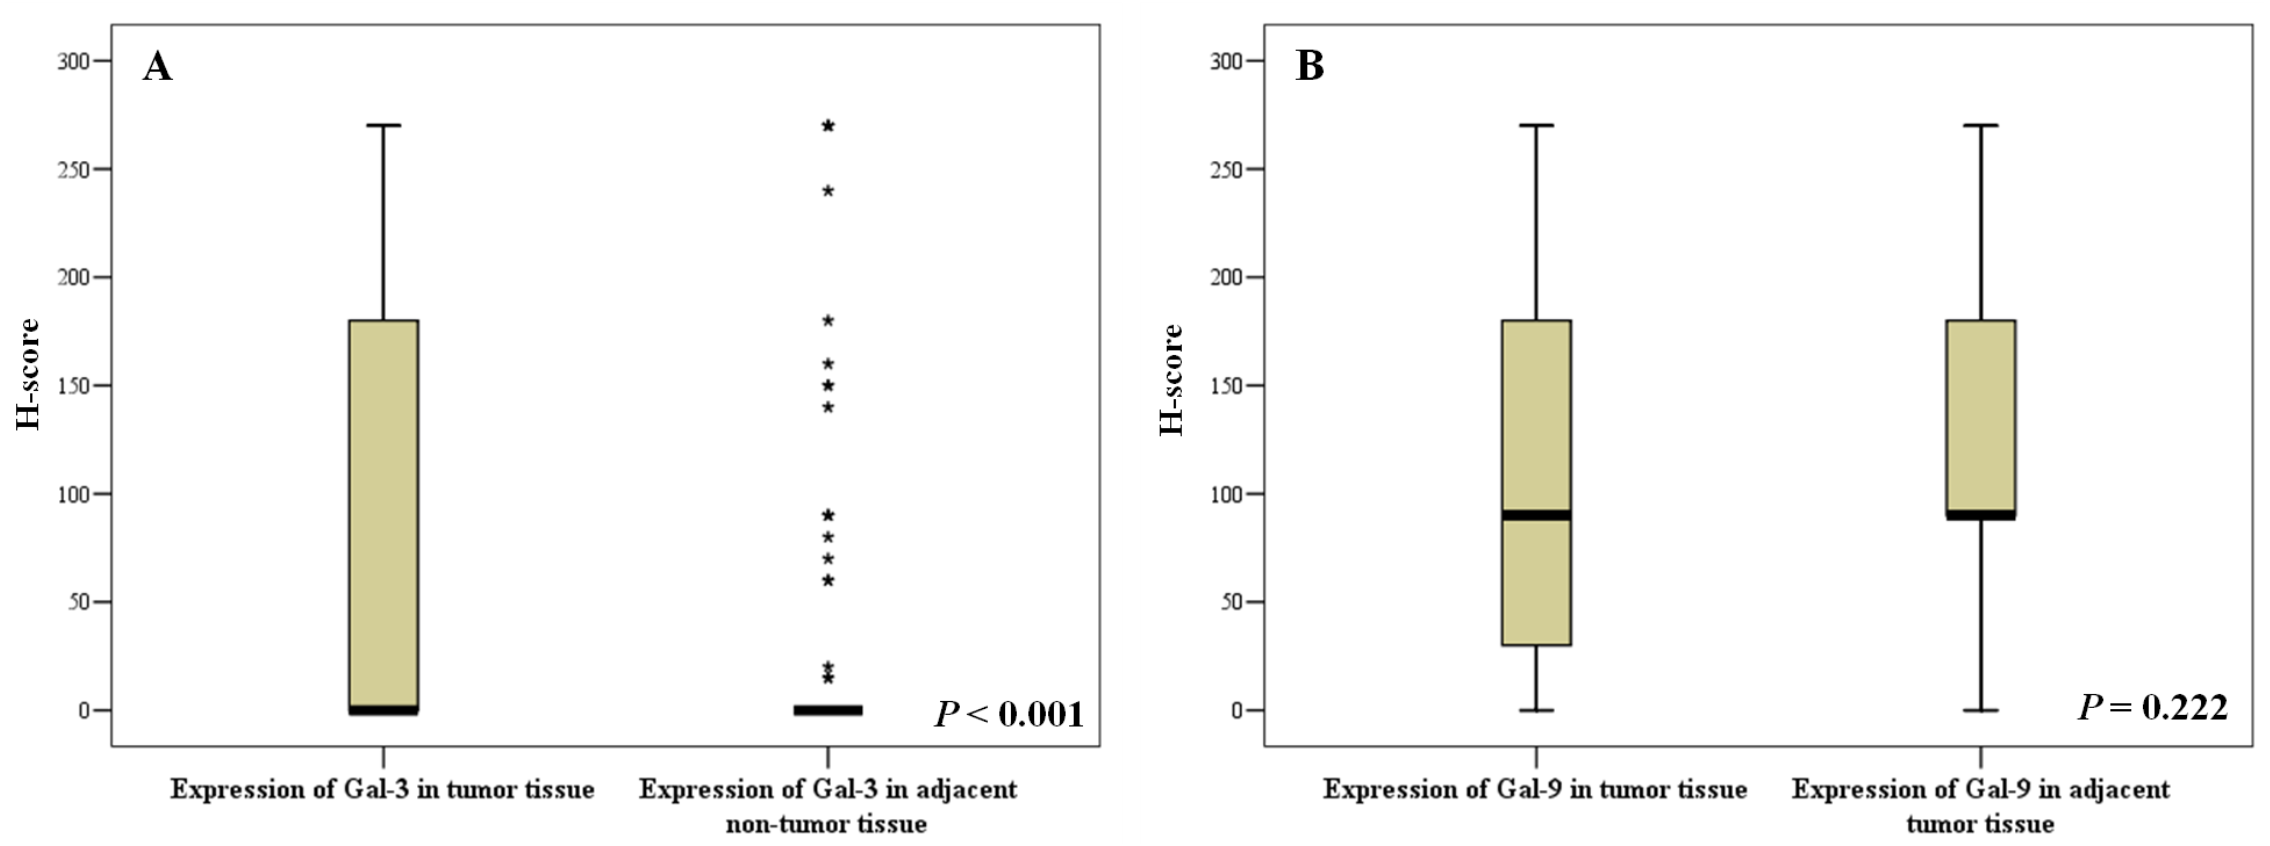
Clinicopathological characters associated with the expressions of Gal-3 and Gal-9
As showed in Table 2. The expression of Gal-3 was negatively associated with the subjects who had liver cirrhosis (P = 0.040). The expression levels of Gal-3 was significantly higher in patients with poor histological differentiation (P = 0.016) and lymph-vascular invasion (P = 0.049). However, Gal-9 expression was significantly lower in patients with poor histological differentiation (P = 0.002) and lymph-vascular invasion (P = 0.012).
Correlation between Gal-3 and Gal-9 expression and overall survival
The median follow-up time was 60 months (ranging from 3 to 128 months). During follow-up, 143 (57.9%) subjects have died of HCC, 2 (0.8%) patients died from other causes, 102 (41.3%) patients were still alive. The optimal cut-off values for Gal-3 and Gal-9 to best predict prognosis were obtained by time dependent-ROC, where the difference of the true positive (TP) and false positive (FP) was the maximum in predicting the 3-year survival. The results were H-score 120 for Gal-3 and H-score 100 for Gal-9, respectively. Kaplan–Meier survival curves of Gal-3 was plotted according to the H-score (H-score ≤ 120 and H-score >120), and the median survival time in each group were 69 months and 31months. The overall survival rate was significantly higher in Gal-3 H-score ≤ 120 group than H-score >120 group (Log-rank tests, P = 0.012) (Fig. 3). While median survival time in Gal-9 expression H-score ≤ 100 and H-score >100 were 71 months and 53 months. The overall survival rates of Gal-9 H-score ≤ 100 group and H-score >100 group were not significantly different (Log-rank tests, P = 0.185), see Fig. 3.
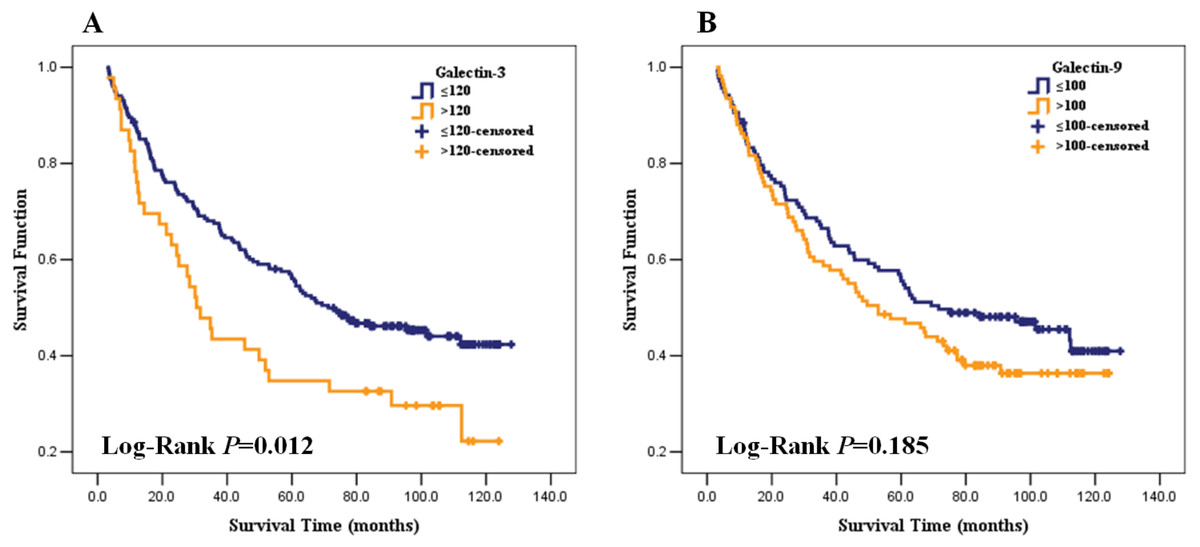
Figure 3: Association of Galection-3 and Galection-9 expression with overall survival in HCC patients.
(A) Galection-3 expression and survival curve; (B) Galection-9 expression and survival curve.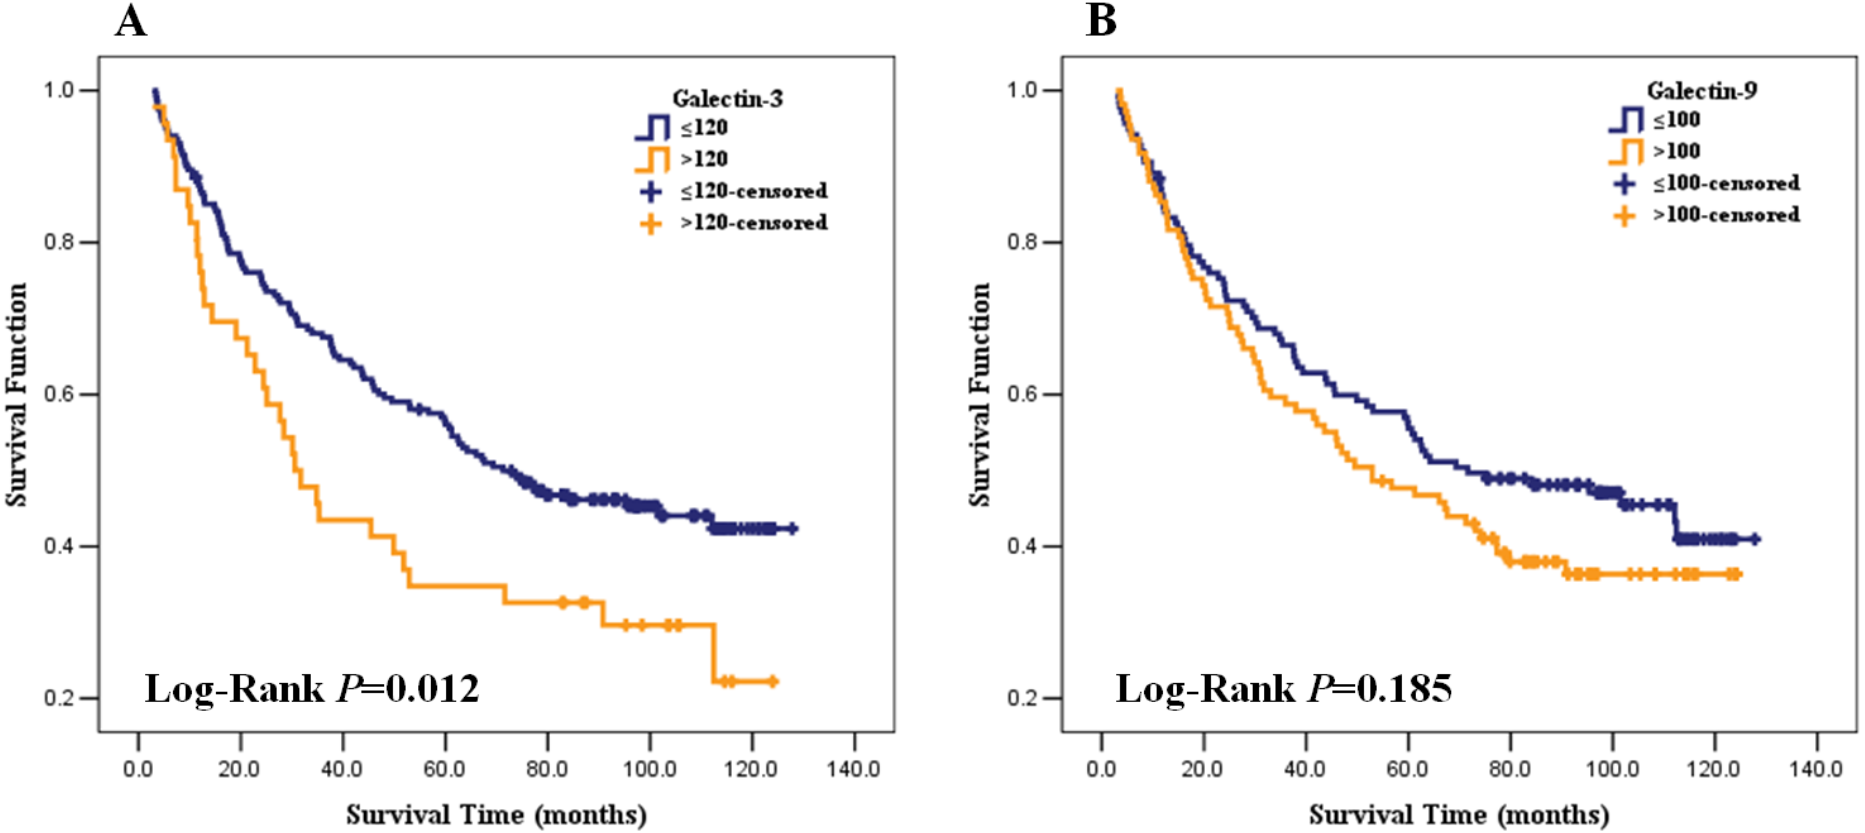
Independent prognostic marker of HCC
As shown in Table 3, in univariate analysis, multiple tumor (HR = 2.21, 95% CI [1.56–3.14]), tumor size ≥ 5 cm (HR = 1.79, 95% CI [1.29–2.49]), lymph-vascular invasion (HR = 1.96, 95% CI [1.41–2.73]), AJCC clinical stage (II vs I: HR = 2.02, 95% CI [1. 39-2.94]; III vs I1: HR = 3.80, 95% CI [2.39–6.02]) and high Gal-3 expression (HR = 1.64, 95% CI [1.11–2.42]) were associated with poor HCC prognosis, and differentiation moderate/well (HR = 0.61, 95% CI [0.43–0.86]) was positively associated with the overall survival rate of patients with HCC, while no relationship was showed between Gal-9 expression and survival (HR = 1.25, 95% CI [0.90–1.73]). AJCC clinical stage was not brought into multiple analyses, because it was the comprehensive index of number of tumor, tumor size and lymph-vascular invasion. After adjusted by sex and age, only number of tumor (HR = 1.94, 95% CI [1.36–2.78]), tumor size ≥ 5 cm (HR = 1.51, 95% CI [1.07–2.12]), lymph-vascular invasion (HR = 1.45, 95% CI [1.00–2.10]) and Gal-3 expression (HR = 1.57, 95% CI [1.06–2.33]) remained significant associated with the prognosis in HCC patients.
Discussion
The present study was performed on a well-characterized cohort to simultaneously evaluate the expression of Gal-3 and Gal-9 in patients with HCC. Compared with adjacent hepatic tissues, higher Gal-3 expression was observed in tumor tissues. Patients with higher Gal-3 expression had worse overall survival. Gal-3 expression in tumor tissue was found to be a potential prognostic marker in HCC.
The results of present study showed that Gal-3 expression was significantly higher in tumor tissues than that in adjacent hepatic tissues. It was consistent with previous reports (Matsuda et al., 2008; Jiang et al., 2014) and this tendency was also verified by Jiang et al. in mRNA expression by HCC lines (Jiang et al., 2014). Hsu et al. found that Gal-3 is not expressed in normal hepatocytes, while it is abundantly expressed in cirrhotic liver and hepatocellular carcinoma. It suggests that Gal-3 expression was induced in cirrhotic liver and hepatocellular carcinoma (Hsu et al., 1999). Gal-3 may take part in the formation of liver cirrhosis and hepatocellular carcinoma.
Our study confirmed that Gal-3 expression was significantly associated with lymph-vascular invasion and histological differentiation, and patients with higher Gal-3 expression had poor survival rate. It was reported by previous study (Matsuda et al., 2008). Apart from HCC, similar findings were also reported in gastric, colon and thyroid cancer (Miyazaki et al., 2002; Xu, el Naggar & Lotan, 1995; Nakamura et al., 1999). However, Jiang et al. found that Gal-3 expression had no apparent relationship with clinicopathological parameters in HCC (Jiang et al., 2014). The main reason for these differences may be a larger sample size in our study compared with the study of Jiang (n = 135). Another reason may be that the widely accepted semi-quantitative analysis (H-score system) was used to assess the Gal-3 expression in this study. Up-regulated Gal-3 promotes tumor growth, invasion, and migration in HCC cells in vitro (Jiang et al., 2014). Meanwhile, correlation between Gal-3 expression and micro-vessel density showed that increased Gal-3 expression in tumor cells promotes angiogenesis (Jiang et al., 2014). Collectively, this data suggested that Gal-3 may be an attractive candidate for the prediction of progression, metastasis and survival in patients with HCC.
Wang et al. reported that Gal-9 is up-regulated in human liver cancer cell lines compared to normal hepatocytes (Yang et al., 2015a). However, we found no significantly different Gal-9 expression between HCC tumor tissues and adjacent non-tumor tissues in this study. It was also different from the related study performed in other cancer, Gal-9 expression in cancer tissues of cervical squamous cell carcinoma is significant lower than that in normal epithelium (Liang et al., 2008). Previous study suggested that Gal-9 expression in tumor tissues is significantly higher than that in paired adjacent non-tumor tissues in gastric cancer (Jiang et al., 2013). The variation of Gal-9 expression appears to depend on the tissues, suggesting that the tumor specific factor may regulate the Gal-9 expression. Fewer studies focused on Gal-9 expression in HCC tumor tissues and paired normal tissues. We first found that similar expression levels of Gal-9 in HCC tumor tissues and paired adjacently non-tumor tissues. Gal-9 may not be related to hepatocarcinogenesis.
In present study, the finding that relative low expression Gal-9 was significantly correlated with histological differentiation and lymph-vascular invasion, is in accordance with results of a study reported by Zhang et al. (2012). In their study, Gal-9 expression is associated with histopathological grade, lymph node metastasis, vascular invasion and intrahepatic metastasis. The previous study confirmed that Gal-9 significantly inhibits the growth of HCC cell lines inducing apoptosis in vitro and in vivo (Fujita et al., 2015), and decreases the adhesion and invasive abilities of HepG2 cells toward extracellular matrix, and prevents the tumor metastasis (Zhang et al., 2012). However, no relationship was found between Gal-9 expression and survival time in patients with HCC based on our data. Inconsistence with our finding, under-expression of Gal-9 has been found associated with poor outcome in HCC by Sideras et al. (2017). One of the reasons for that may be in our study there are more HBV positive subjects. Enhanced expression of Gal-9 following HBV infection can interact with its ligand, T cell immunoglobulin and mucin-domain containing-3 (TIM-3), mediate T-cell senescence inducing tumor immune escape in HBV-associated HCC (Li et al., 2012; Lai et al., 2017). The other one is that the staining intensity and percentages of the stained cells were all used to assess the expression of Gal-9 in our study. The previous studies reported that Gal-9 expression is significantly associated survival time and acts as a prognostic role in various cancer, including breast cancer, gastric cancer, cervical carcinoma and malignant melanoma (Jiang et al., 2013; Zhang et al., 2012; Liang et al., 2008; Irie et al., 2005; Kageshita et al., 2002). The discrepancy from different studies may be due to tissue specificity of Gal-9 expression, genetic background, individual variation of immune state, and limited study cohort.
Conclusions
Gal-3 expression was related to tumor oncogenesis, progression and the prognosis of HCC. Gal-3 is expected to serve as a novel prognostic marker of hepatocellular carcinoma and may have treatment value in the future. However, Gal-9 expression was only related to tumor progression but may not be a candidate for the overall survival rate of patients with HCC.
Supplemental Information
Negative and positive control of Galectin-3 and Galectin-9 (SP, ×200)
(A) Negative expression of Galectin-3 in tumor cells of HCC; (B) Positive expression of Galectin-3 in tumor cells of thyroid papillary cancer; (C) Negative expression of Galectin-9 in tumor cells of HCC; (D) Positive expression of Galectin-9 in tumor cells of gastric cancer.