Article

Effects of Bark Stripping on Timber Production and Structure of Norway Spruce Forests in Relation to Climatic Factors

1
Faculty of Forestry and Wood Sciences, Czech University of Life Sciences Prague, Kamýcká 129, 165 00 Prague 6, Suchdol, Czech Republic
2
Department of Game Management, Forestry and Game Management Research Institute, v.v.i., Strnady 136, 252 02 Jíloviště, Czech Republic
3
Faculty of AgriSciences, Mendel University Brno, Zemědělská 1, 613 00 Brno, Czech Republic
*
Author to whom correspondence should be addressed.
Submission received: 17 February 2019 / Revised: 3 April 2019 / Accepted: 4 April 2019 / Published: 9 April 2019
(This article belongs to the Section Forest Ecology and Management)

Abstract

:
The aim of this study was to assess the effects of bark stripping caused by sika deer (Cervus nippon [Temminck]) on the production and structure of young Norway spruce (Picea abies L. Karst) forest stands (41–43 years). Production parameters, structure, diversity, and the dynamics of radial growth in selected forest stands in relation to climatic conditions were evaluated. Similar to other production parameters, stand volumes showed lower values on research plots heavily damaged by bark stripping (290 m3 ha−1) compared to stands with lower tree stem damages (441 m3 ha−1). A significant decrease in stem volume was recorded for trees with stem circumference damage higher than 1/3 of the stem circumference. In most cases, the trees were damaged between the ages of 10–23 years, specifically the radial growth was significantly lowered in this period. The diameter increment of damaged trees dropped to 64% of the healthy counterparts in this period. Bark stripping damages reached up to 93% of the stem circumference with a mean damage of 31%. Stem rot was found on 62% of damaged trees. In our study area, with respect to the terms of climatic conditions, precipitation had a higher effect on radial growth of the Norway spruce compared to temperature. The main limiting climatic factor of tree growth was the lack of precipitation within a growing season, particularly in June of the current year.

1. Introduction

Globally, most of the Earth’s surface has been changed by human activities. One of the most significant reasons these changes occur is agricultural land use [1,2,3]. However, amended agricultural landscapes were successfully colonized, e.g., by increasing wildlife populations of large ungulates which have been documented across many countries in Europe [4,5,6,7,8,9]. This increase has been driven not only by changes in land use, but also with the absence of natural predators (large carnivores), which have played a crucial role in the reduction of ungulate populations [10]. One of the species with increased population density is sika deer (Cervus nippon [Temminck]), which was first introduced from Japan to Europe after 1860 [11,12]. At the moment, the most abundant populations of sika deer within Europe can be found on the British Islands, in Germany, or in the Czech Republic [11,13,14,15,16,17].
High population density of hoofed game is naturally connected with damages found on agricultural crops [18] or forest stands [19,20,21] within the area. Young trees (of both coniferous and broadleaved species) are especially affected by browsing [22], as the assimilation shoots and sprouts provide natural aliment for deer [23]—though older trees could also be damaged by bark stripping. Browsed seedlings generally show significant deceleration in growth [24,25], and in extreme cases repeated browsing of young trees could lead to tree mortality [26]. The intensity of browsing is also influenced by environmental factors, such as altitude, type of vegetation or the structure of present phytocenosis [22,27].
To date, bark stripping caused by ungulates has not been sufficiently explained. One reason could be the relatively high content of nutrients found in the bark [28]. The occurrence of bark stripping is also higher in the areas with intensive human activity, where the deer usually hide under the cover of young forest stands [29]. The intensity of bark stripping is not only determined by population density of deer, but also by forest stand characteristics [30,31] including the age of the forest stands [21] or social position of the tree [32]. The damages are subsequently reflected in the economic evaluation of damaged wood [33,34], mainly because of frequent infections and spreading of the fungal pathogens in the stem [35,36,37]. Nevertheless, economic loss is one of several problems within these stands. Severe infection of multiple trees could cause the disintegration of the entire stand due to reduced resistance to both biotic and abiotic factors [38]. If more than 90% of stem circumference is stripped, the whole tree usually dies [27]. For a more complex evaluation of bark stripping impacts, the following four aspects are crucial: the length of time over which the bark stripping occurs, the size of the damaged trees or trunks, the frequency of repeated damage, and the recovery of the wounds [34].
Bark stripping in countries with a high population density of sika deer is an important point of interest in forestry because of the aforementioned reasons. In Japan, similar problems were found in local tree species, e.g., Sakhalin fir [Abies sachalinensis (Fr. Schmidt)] Masters or Japanese Larch [Larix kaempferi (Lamb) Carr.] [39], whereas the European populations of sika deer usually cause damage to the Norway spruce [Picea abies (L.) Karst.] [40] or the sitka spruce [Picea sitchensis (Bong.) Carr.] found in Scotland [34,41].
One of the largest European populations of sika deer is located in the Czech Republic [13,14]. Within the last 20 years, the number of hunted individuals of sika deer increased from 3835 in 1995 to 17,106 in 2018 [42] under the same regulations, but the actual population size is undoubtedly much higher. Damage intensity naturally increases with higher population density, especially in Norway spruce stands across Central and Western Europe [37,43,44]. Damaged stands generally cause a significant decrease in timber production, loss of stability, thus lowering the ability to provide their ecological and environmental functions [18,33,45,46,47,48]. The aim of this paper was to evaluate: (1) the timber production, structure, diversity, and interactions of measured parameters in Norway spruce stands exposed to different intensity of bark stripping caused by sika deer; and (2) the effects of bark stripping and stem rot on radial growth of Norway spruce in relation to climatic factors (temperature and precipitation). The study is focused on Norway spruce stands that are heavily influenced by sika deer, and stands without significant deer impact in comparable acidic sites in the western part of Bohemia (Czech Republic).

2. Materials and Methods
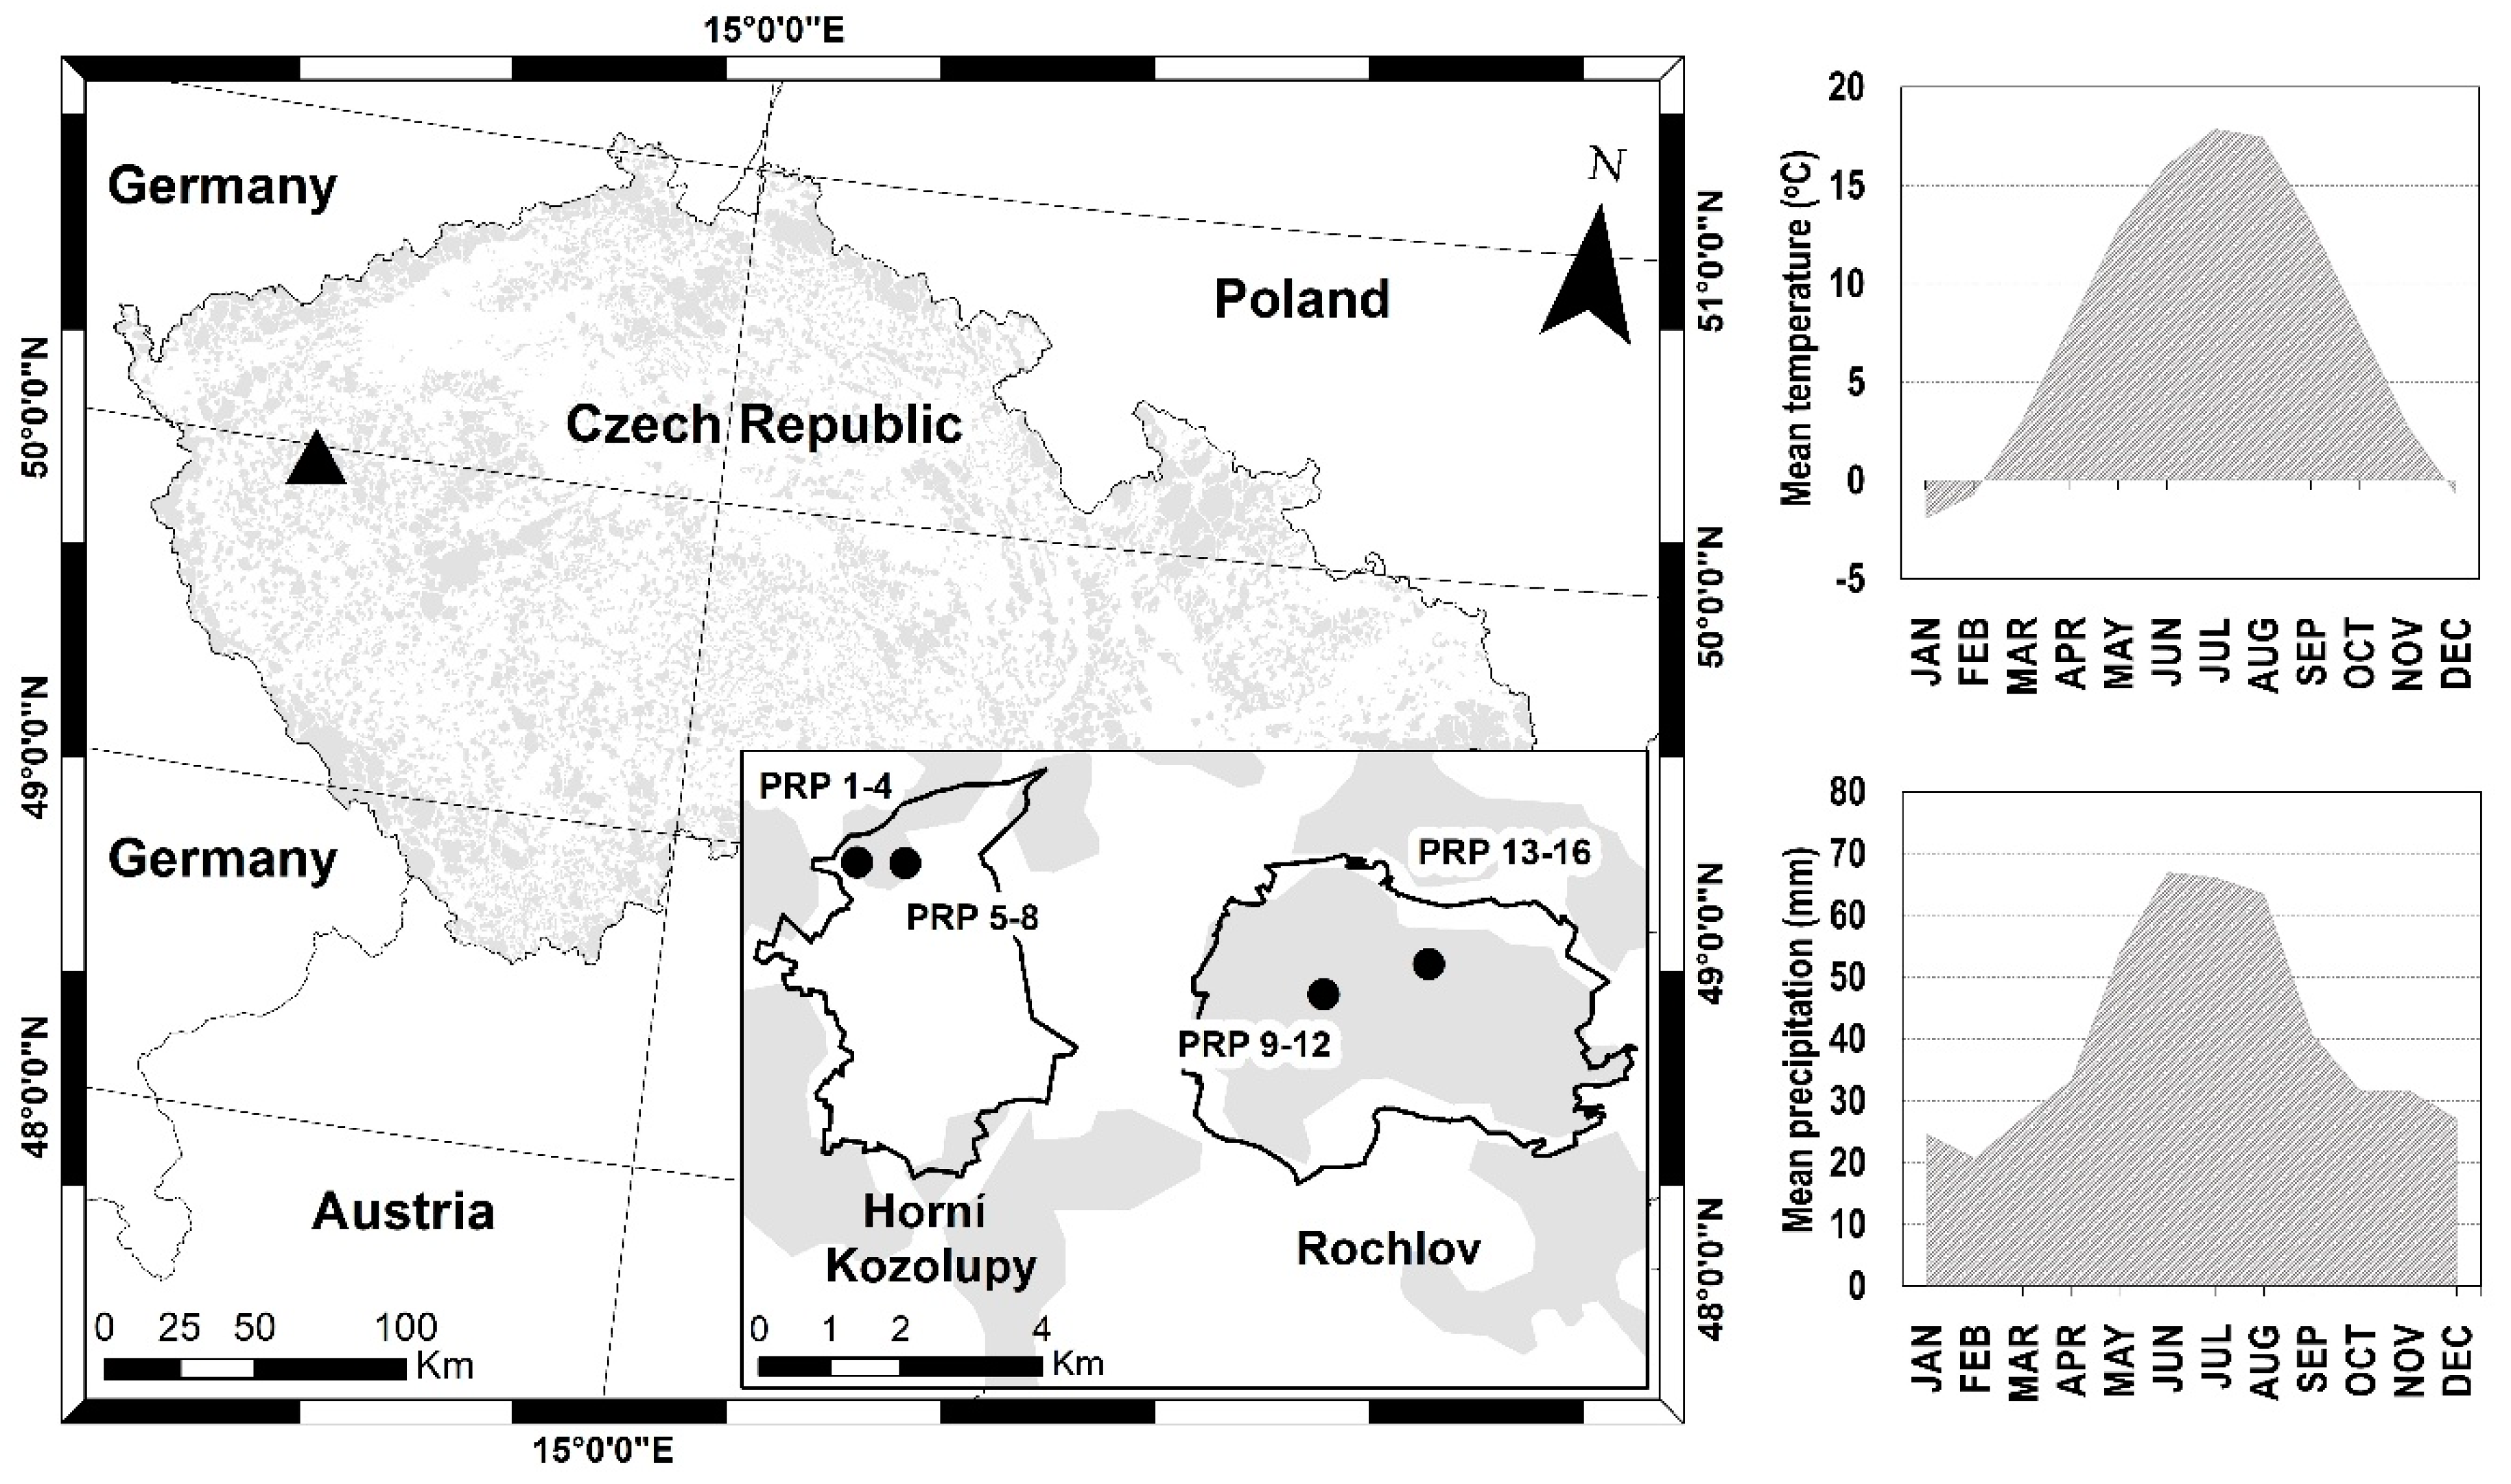
2.1. Study Area

The research was conducted on 16 permanent research plots (PRPs) established in planted monospecific Norway spruce forest stands in the western portion of the Západočeská Upland area (Natural Forest Area 6) in the Czech Republic (Figure 1). PRPs were situated in 4 localities in total (4 PRPs on each locality). Two localities (PRPs 1–8) were not under significant game influence (hunting district Horní Kozolupy, marked “LD plots” as “low game damage” further in text), however, the other two localities (PRPs 9–16) were under strong influence of Sika deer (hunting district Rochlov, marked “HD plots” as “high game damage” further in text). In the hunting district of Rochlov (HD plots), on average, 135 sika deer (Cervus nippon Temminck) individuals and 36 roe deer (Capreolus capreolus Linnaeus) individuals were hunted per year between 2013–2017. In the hunting district of Horní Kozolupy (LD plots), these numbers were significantly lower, on average, with 34 sika deer individuals and 26 roe deer individuals hunted per year within the same time period. The studied spruce stands on all PRPs were of similar age (41–43 years), according to the forest management plan. Site quality index and soil type (Cambisol) were identical between all PRPs. The stands were artificially established and protected by an iron fence for 9 to 11 years (depending on locality) after plantation. The altitude of the study locality ranged from 471 to 496 m a.s.l., with the bedrock mostly composed of slate and phyllite.
The mean annual temperature in the study area was approximately 7.7 °C [49], with the minimum temperature recorded in January (−1.9 °C), and the maximum recorded in July (17.9 °C). The mean annual precipitation ranged from 500 to 590 mm yr–1 with the lowest precipitation recorded in February (21 mm) and the greatest precipitation in June (67 mm), see Figure 1. The duration of snow-coverage was approximately 40 days, with the average maximum snow depth recorded at 20 cm. The vegetation season lasted ~155 days with a mean precipitation of 360 mm and a mean temperature of 13.9 °C. The study area qualified as a humid continental climate zone, characterized by warm to hot, humid summers and cold to severely cold winters (Dfb) according to the Köppen climate classification [50]. According to the detailed Quitt climate classification [51], the area can be classified in the cold climatic region (subregion CH 6). In terms of phytocoenology, all PRPs belong to Querceto-Fagetum acidophilum (Acidic Oak-Beech) and the alliance Luzulo-Fagion sylvaticae Lohmeyer et Tüxen in Tüxen 1954.

2.2. Data Collection

In November of 2017, Field-Map technology [52] was used to establish 16 square, individual, 100 m2 (10 × 10 m) PRPs. The measured characteristics within the tree layer were as follows: position of the tree and its crown projection (minimally at four directions perpendicular to each other) measured by Field-Map technology (IFER, Jílové u Prahy, Czech Republic), diameter at breast height (DBH130 cm ≥ 4 cm; to the nearest 1 mm) measured by Mantax Blue metal caliper (Haglöf, Långsele, Västernorrland, Sweden), and tree and live crown base height (to the nearest 0.1 m) measured by Laser Vertex hypsometer (Haglöf, Långsele, Västernorrland, Sweden). Game damage was evaluated and classified using the methodology of the Institute of Forest Ecosystem Research, Ltd. (IFER, Jílové u Prahy, Czech Republic) and Forest Management Institute (ÚHÚL, Brandýs nad Labem, Czech Republic) using national inventory measurements [53,54]. Bark stripping was measured along the girth of the tree stem using a tape (to the nearest 1 mm) at DBH and subsequently divided into three categories: healthy trees (damaged circumference ≤ 1/8 of the stem girth, 134 trees in total), low game damage (damaged circumference > 1/8 and ≤ 1/3 of stem girth, 62 trees in total), and high game damage (damaged circumference > 1/3 of stem girth, 54 trees in total) [53,55].
In 2017, increment core samples of 16 spruce trees on each of the 4 localities (4 cores on each PRP) were taken at DBH using a Pressler auger (Haglöf, Långsele, Västernorrland, Sweden). Thirty-two core samples were taken perpendicularly to the tree stem axis on the site damaged by bark stripping (HD plots, hunting district Rochlov) and another 32 samples were taken in an opposite, undamaged site (LD plots, hunting district Horní Kozolupy). Trees were randomly chosen by the RNG function (Excel, Microsoft). Tree-ring widths were measured to the nearest 0.01 mm with an Olympus (Tokyo, Japan) stereo microscope on a LINTAB measurement table (RINNTECH, Heidelberg, Germany) and recorded by the TSAPWIN software (RESISTOGRAPH, Heidelberg, Germany). Throughout the dendrochronological analysis, the occurrence of bark stripping damage (year) and stem rot (the percentage of diameter affected by rot) were visually recorded by significant color changes (fungi, black coloring in stripping damage, etc.), separations of ring widths, occurrences of defects (resin, rind galls, etc.), and changes in the mechanical structure of each sample.

2.3. Data Analyses

Based on the measured dendrometric data, stand characteristics including stand volume [56], stand density index (SDI) [57], crown closure [58], and crown projection area were computed for the tree layer. Height curves were constructed using the Näslund height-diameter function [59] (see Supplementary File S1—List of indices), and also the relationship between crown size and DBH was evaluated via linear regression.
To assess stand diversity, the following indices were computed using Sibyla 5 software [60]: Arten-Profile index as an indicator of vertical structure (using ratio of the basal area of tree species in stand layers) [61], diameter and height differentiation as indicators of structure differentiation (using ratio between tree diameters, heights and distances) [62], crown differentiation index (using minimum and maximum crown diameter), and total diversity index as indicator of complex stand diversity (using tree species diversity, diversity of vertical structure, diversity of tree spatial distribution, and diversity of crown differentiation) [63]. The PointPro 2 software (Zahradník & Puš, CULS, Prague, Czech Republic) was used for the computation of horizontal structure index. The spatial distribution of trees on PRPs was evaluated according to the Clark–Evans aggregation index (using real distances between two nearest trees and plot parameters) [64], such as horizontal structure of damaged trees. The criteria of diversity indices are shown in Table 1, and a detailed description is given by Pretzsch [65]. Detailed information about the computation of selected indices is provided in Supplementary File S1—List of indices.
Tree-ring increment series were individually cross dated (removal of errors connected with the occurrence of missing tree rings) using t-tests, and subsequently, visually checked according to the Yamaguchi [66] method. Particular curves from PRPs were detrended in a standard way and mean tree-ring series were created from collected data in the R software [67]. Annual tree-ring width was standardized by tree age and represented by tree ring width index. Package dplR [68] was used for creating smoothing spline for a different time window using built-in method to detrend, filter, and visualize the tree-ring series data [69].
Standard age detrended chronology was interleaved and plotted with a variety of splines (8 and 32-year splines) for removing short-term fluctuations. The analysis of negative pointer years was conducted according to Schweingruber et al. [70]. For each tree, the pointer year was identified as an extremely narrow tree ring that did not reach 40% of the average increment from the previous four years. A negative year was defined as the occurrence of a strong increment reduction in at least 20% of the trees on their respective plot. For modeling the diameter increments in relation to climate characteristics (monthly precipitation and temperature), the DENDROCLIM2002 software [71] was used for statistical relationships between climate and tree radial growth using correlation and response functions. The software used bootstrapped confidence intervals to estimate the significance of both correlation and response function coefficients. In this case, we used correlation and response functions for monthly precipitations and temperatures from May of the previous year to September of the current year in range with our climatic data. Climate data (1961–2015) were obtained approximately 30 km away from the meteorological station site in Kralovice (468 m a.s.l.; WGS84 49 °58′51″N, 13°29′06″E).
The relationship between production parameters (DBH, stand volume, height) of trees with different types of bark stripping damage (healthy trees, low game damage and high game damage; 250 trees in total) was tested using the Kruskal–Wallis test with subsequent multiple comparisons (according to Siegel & Castellan [72]). The assumptions of ANOVA (normality) was not met in all cases. For modeling the stem volume of each particular tree (based on DBH and stem circumference damage), a generalized linear model with gamma distribution was used. For evaluating the differences in stem volume predicted by the model between LD and HD plots, separate models for LD and HD plots were constructed, and their differences were evaluated. Parameters for the model were chosen to be easily measurable in the field (DBH and circumference damage). An inverse value was used as a link function. All computations related to the Kruskal–Wallis test and the generalized linear model were performed in R software [67]. Three-dimensional plots were made using Gnuplot 5.2. The unconstrained principal component analysis (PCA) was performed in the CANOCO 5 program [73] to analyze the relationships between production parameters, diversity, structural characteristics, game damage, and similarity of all 16 PRPs. Data were centered and standardized during the analysis. The results of the PCA analysis were visualized in the form of an ordination diagram. Situational maps were created in the ArcGIS 10 software (ESRI).

3. Results

3.1. Production of Spruce Stands

In 2017, the number of trees per hectare was comparable (difference of 6.1%) in PRPs between both hunting districts, specifically ranging from 1100 to 2200 trees in PRPs established on LD plots, and 1200 to 2000 trees in PRPs established on HD plots. However, a greater difference (19.0%) was observed in the stand density index (SDI from 0.81 to 0.99 on LD plots and from 0.49 to 0.97 on HD plots) with both averaging higher indicators of stand density in favor of HD plots. Crown closure ranged from 77.3–93.9% in PRPs and showed higher variability in HD plots (by 8.0%), such as in SDI (by 62.9%). Differences were also found in production characteristics. A mean DBH of 20.03 cm (±3.42 SD) was observed in LD plots, and a mean DBH of 17.49 cm (±1.37 SD) was found in HD plots. A similar trend was found with respect to mean height: 20.07 m in LD plots and 17.53 m in HD plots. The mean total stand volume on LD plots was 440.5 m3 ha−1 (±112 SD) and 289.9 m3 ha−1 (±73 SD) on HD plots. The total stand basal area ranged between 41.0 and 64.7 m2 ha–1 within LD plots and 23.7–51.0 m2 ha–1 within HD plots. The dominant height (HDOM) was comparable in all localities (1LD–4LD: 26.5 m, 4LD–8LD: 26.3 m, 9HD–12HD: 22.0 m, and 13HD–16HD: 24.2 m), however, in HD plots, where individual tree tops had an occurrence of bark damage and rotting, HDOM was lower. Detailed information is presented in Table 2.
Näslund height-diameter functions were computed to evaluate the differences in height to diameter ratio between selected damage levels, see Figure 2. The coefficient of determination was observed to be 0.61 with respect to healthy trees and 0.54 with respect to trees with high game damage (values are also depicted in the plot). Trees with small damage showed a low coefficient of determination. Computed parameters for healthy trees: a = 1.00, and b = 0.18; trees with small damage: a = 0.46, and b = 0.22; trees with high game damage: a = 1.09, and b = 0.18).
The relationship between crown diameter and DBH was assessed by linear regression (Figure 3). Observed functions altogether with coefficients of determination are presented in the respective figure. Crown diameter of healthy trees appeared to follow a linear trend with stable variation around the regression line and a relatively high coefficient of determination (R2 = 0.61) when related to DBH, whilst trees with greater game damage showed a rather high variation at lower DBH resulting in a relatively low coefficient of determination.

3.2. Stand Diversity and Structure

The prevailing spatial pattern (horizontal structure) of trees was random with a tendency of regular distribution on all PRPs, and a significantly regular structure was observed on three plots (7 LD, 14 HD, and 15 HD; see Table 3). The vertical structure (according to A index) was low to moderately-varied on LD plots (A = 0.103–0.494) and moderately to strongly-varied on HD plots (A = 0.218–0.627). Diameter differentiation was low on both variants of plots (TMd = 0.108–0.225), with respect to height differentiation (TMh = 0.063–0.170). Higher structural diversity was generally observed on HD plots compared to LD plots. Total stand diversity, B, (including species diversity, crown differentiation, vertical and horizontal structure) identified monotonous structures on all PRPs, while the highest total diversity was observed on PRP 11 (high game damage plot, B = 3.041) and the lowest on PRP 3 (low game damage plot, B = 1.952). For detailed information see Table 3.

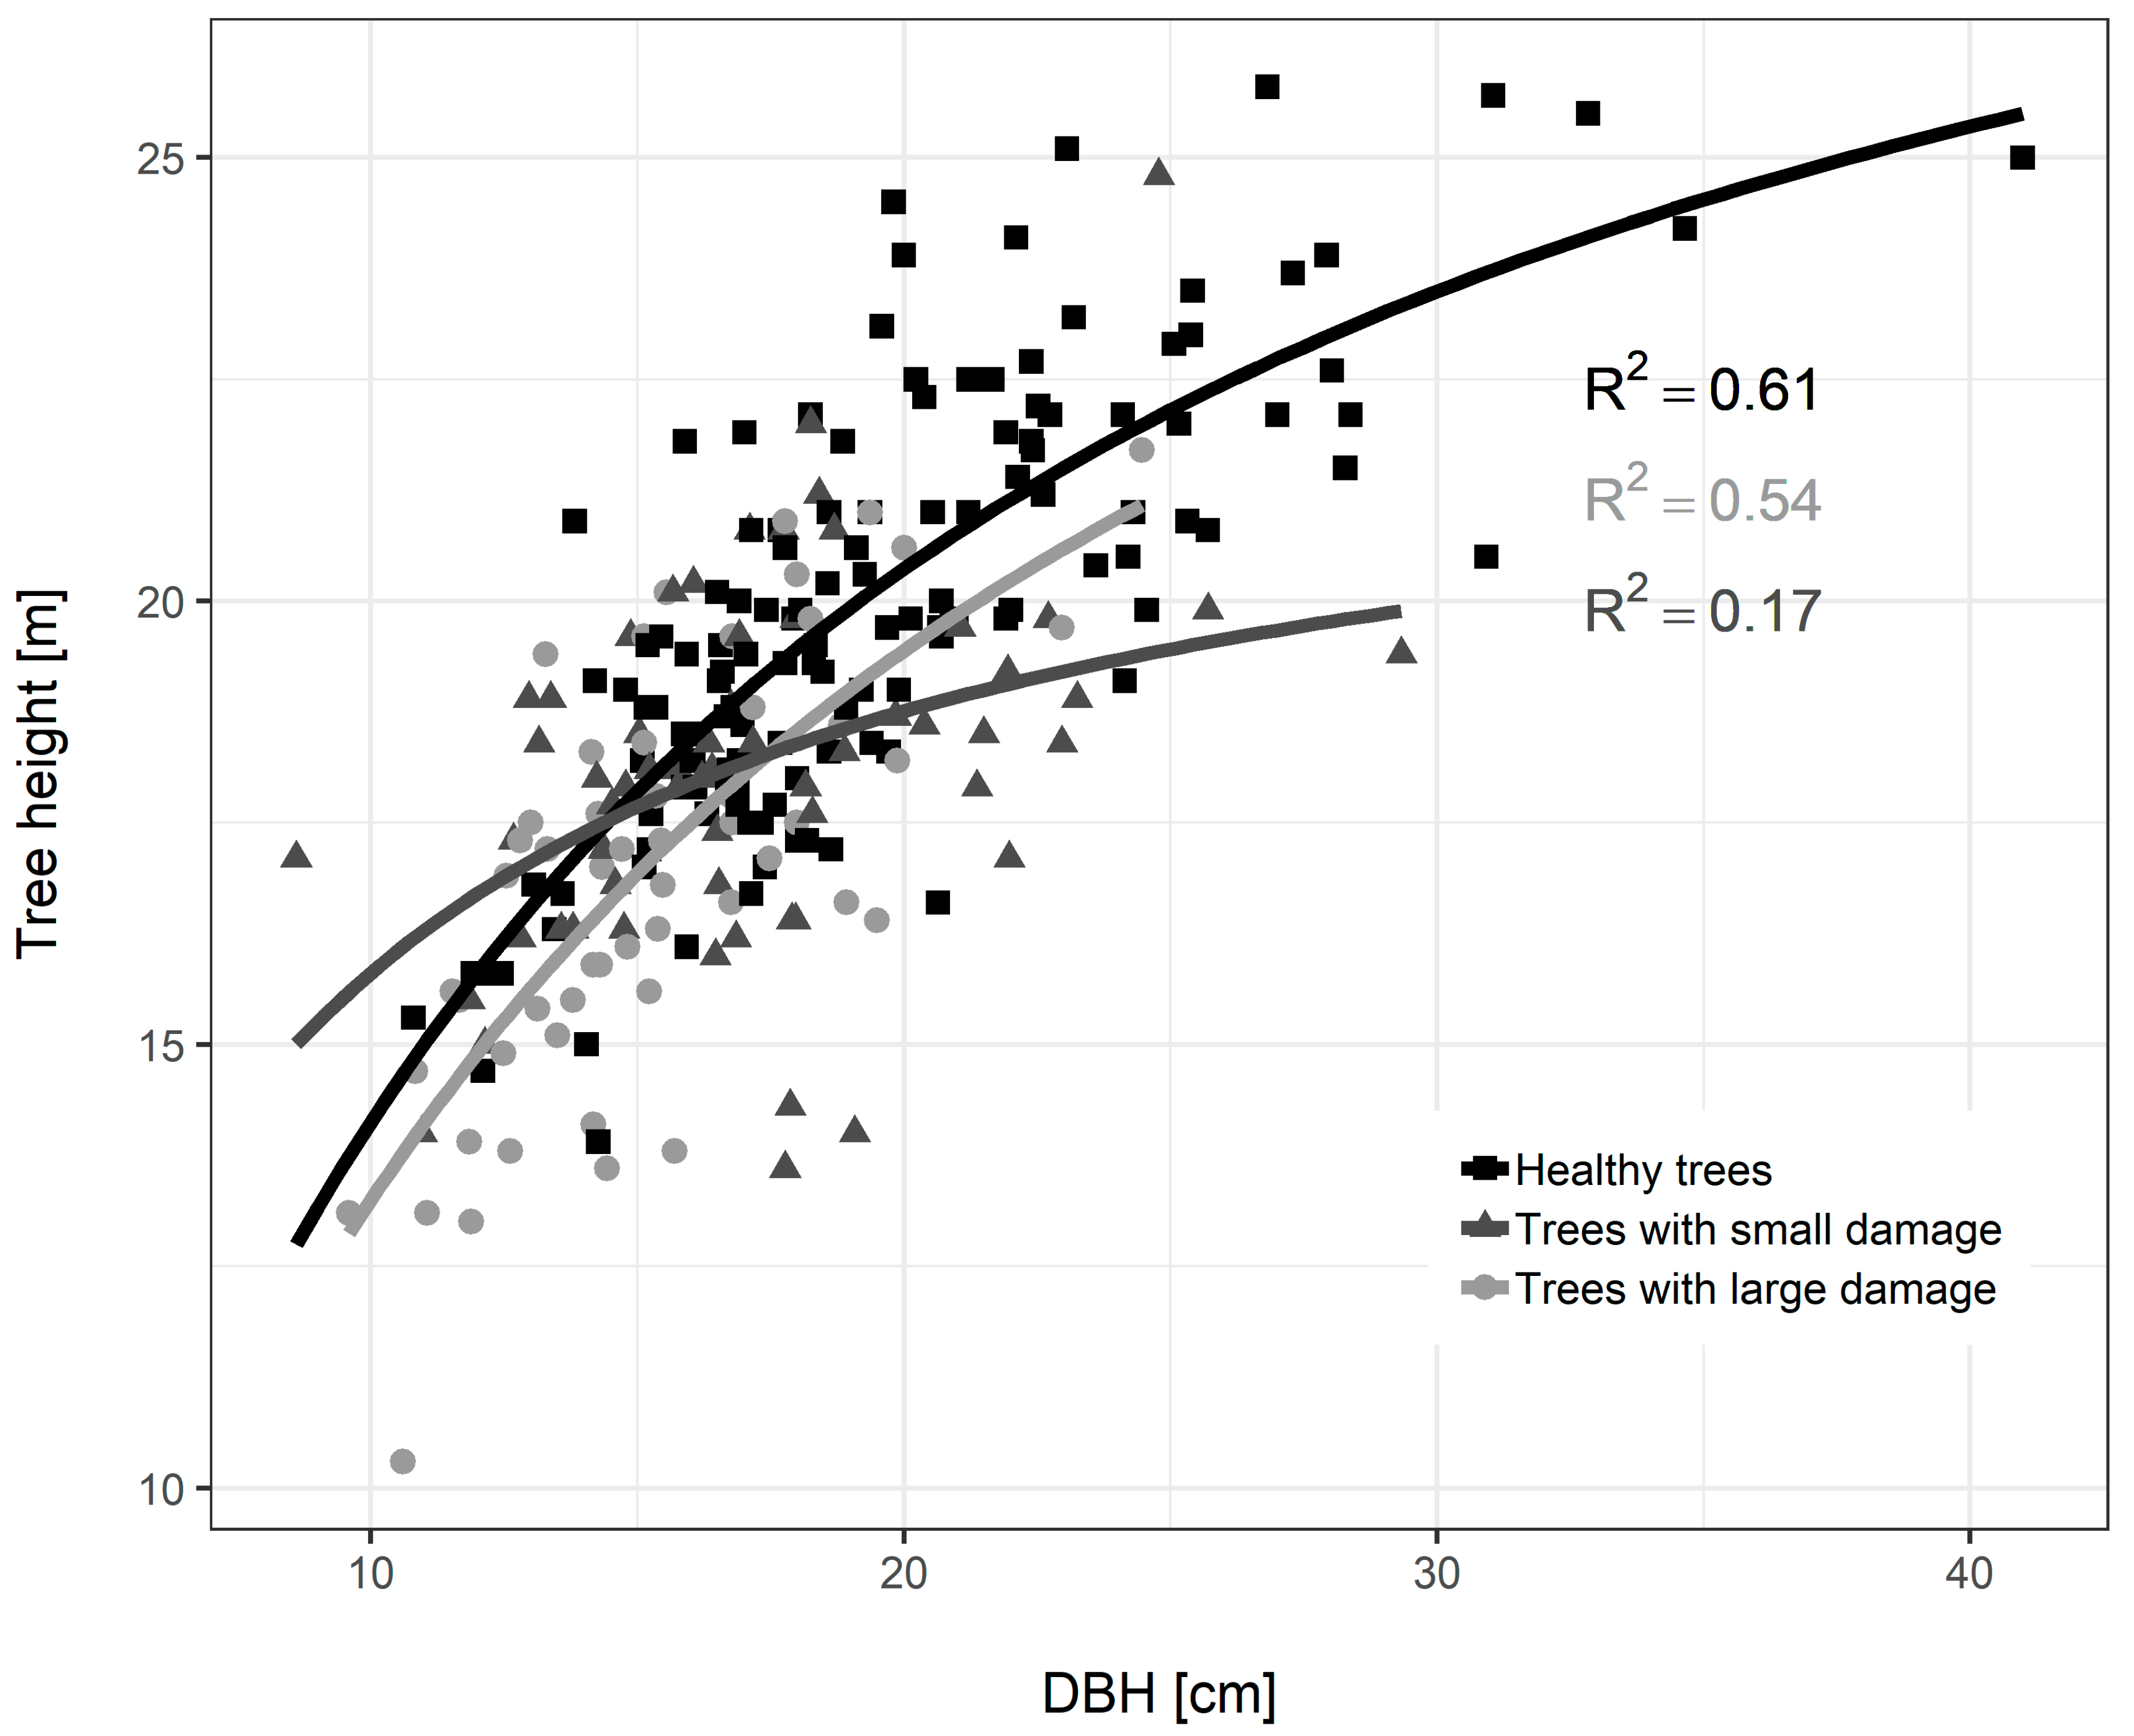
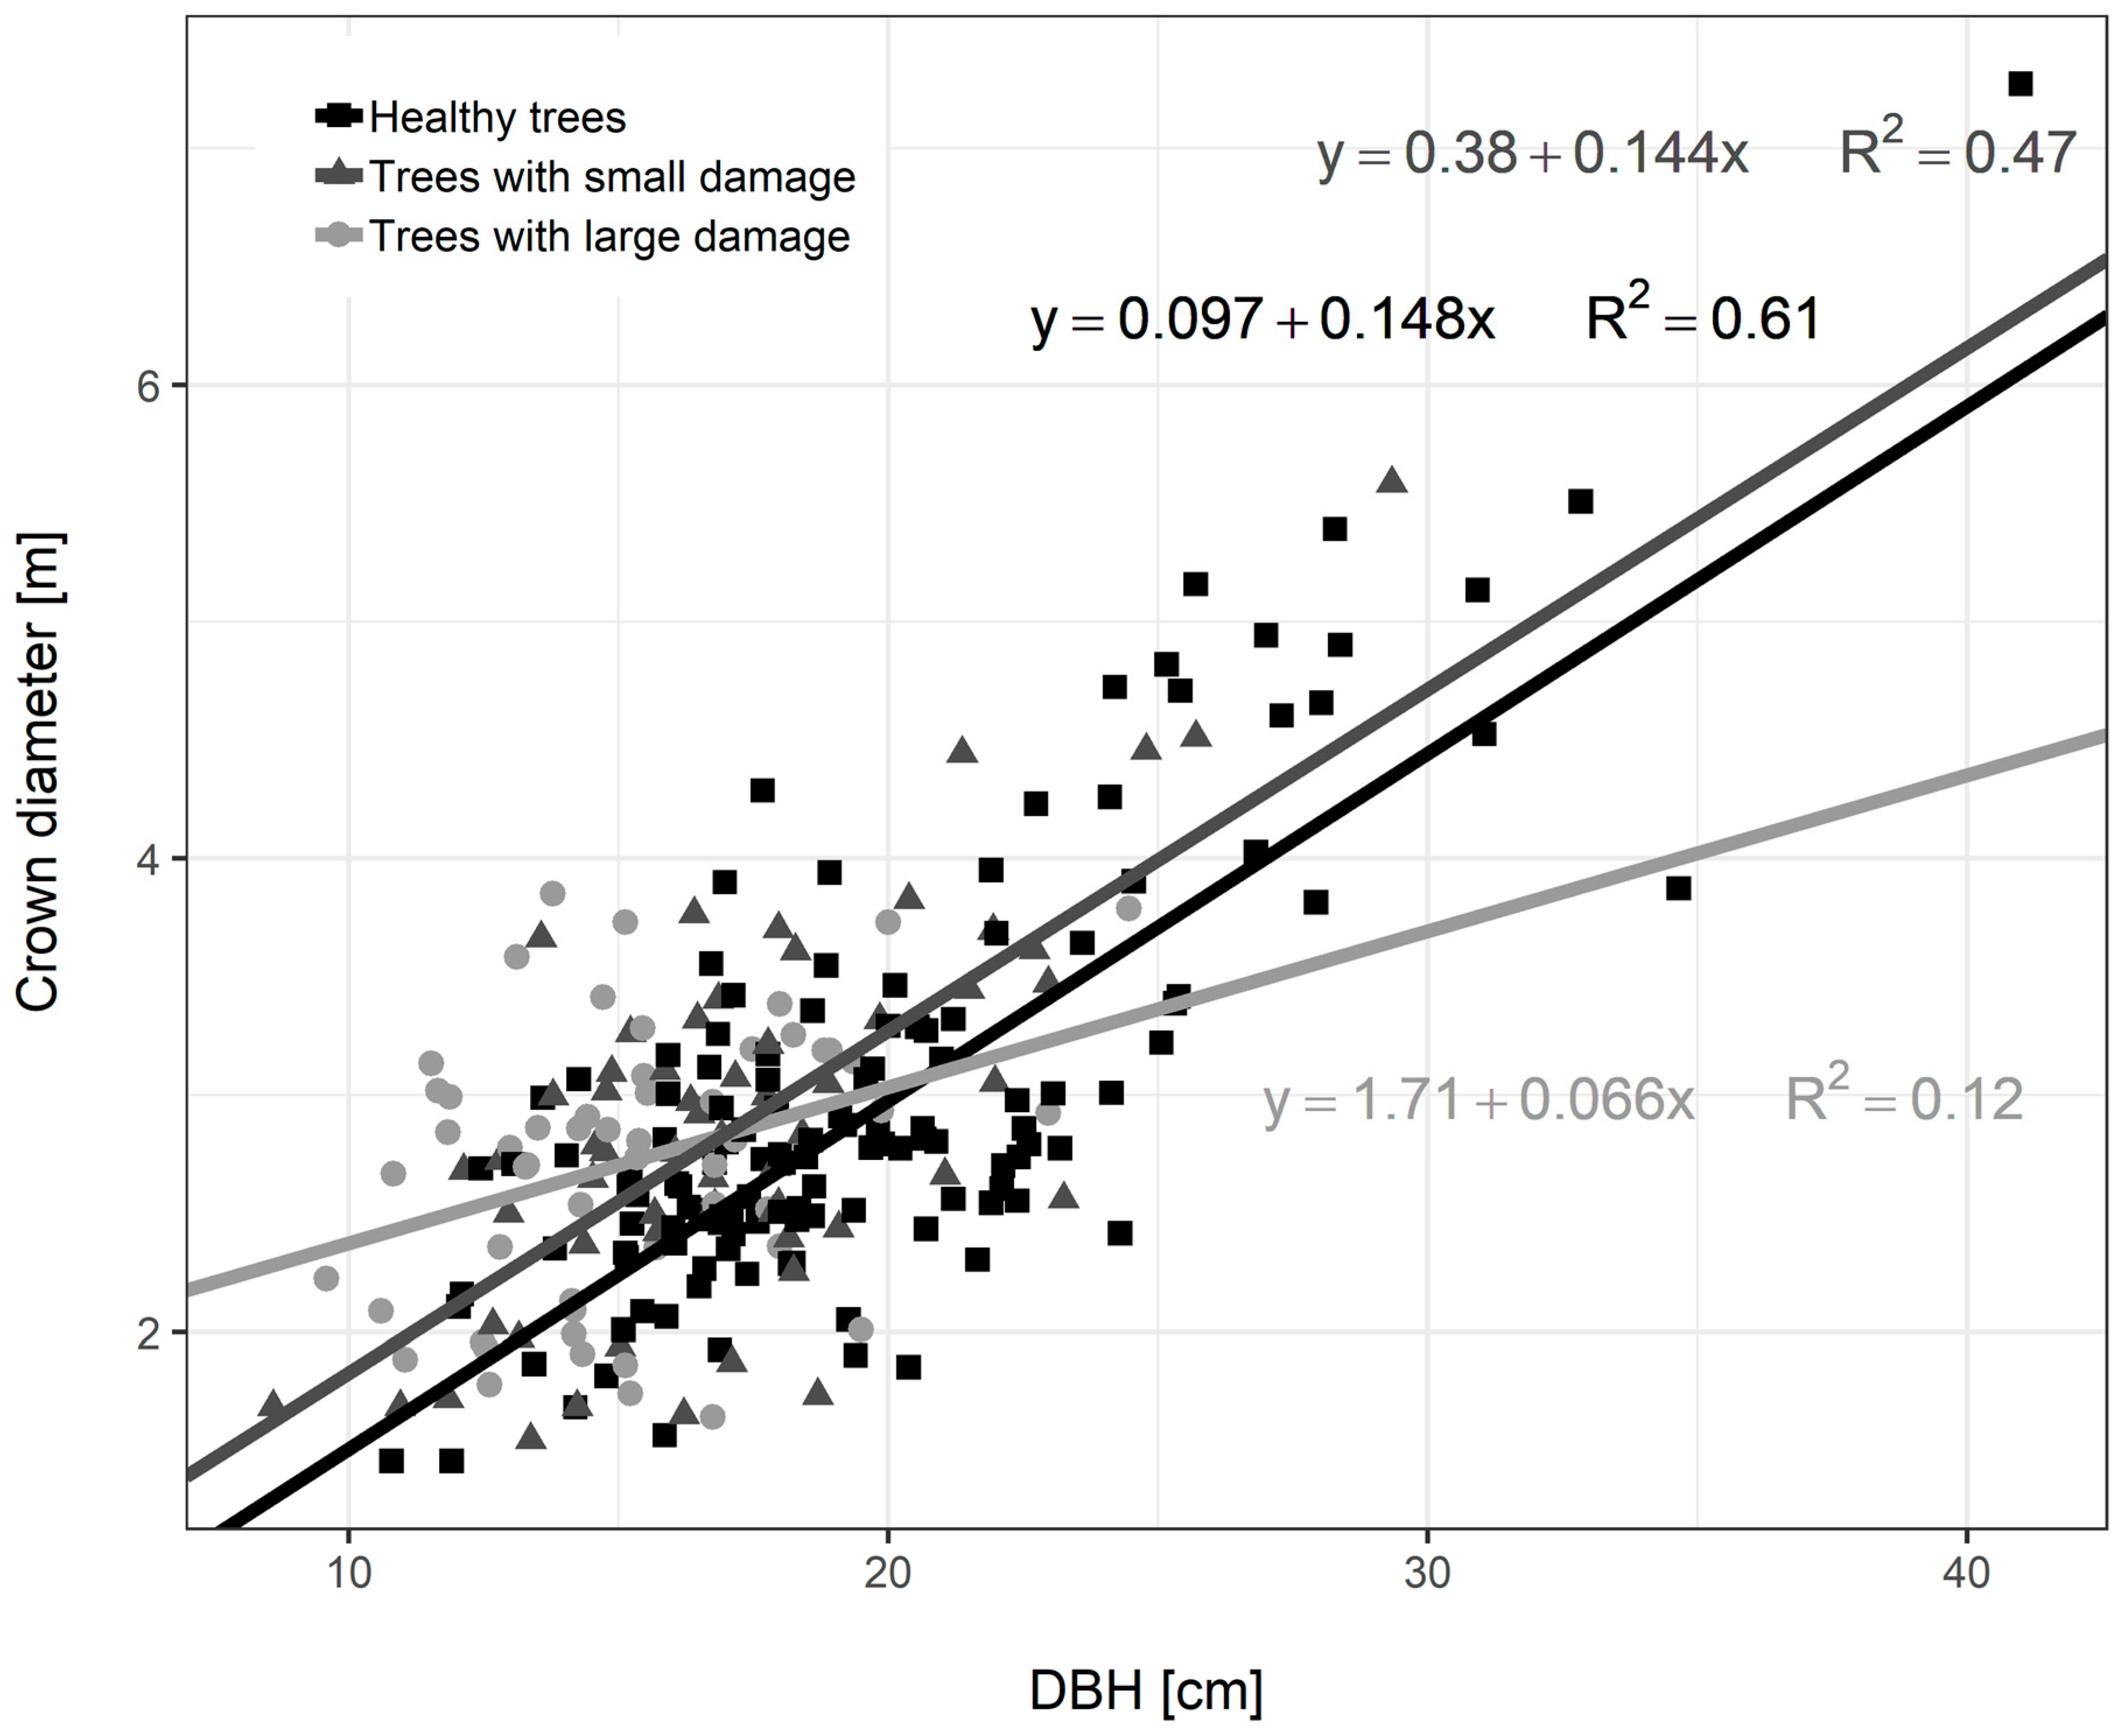
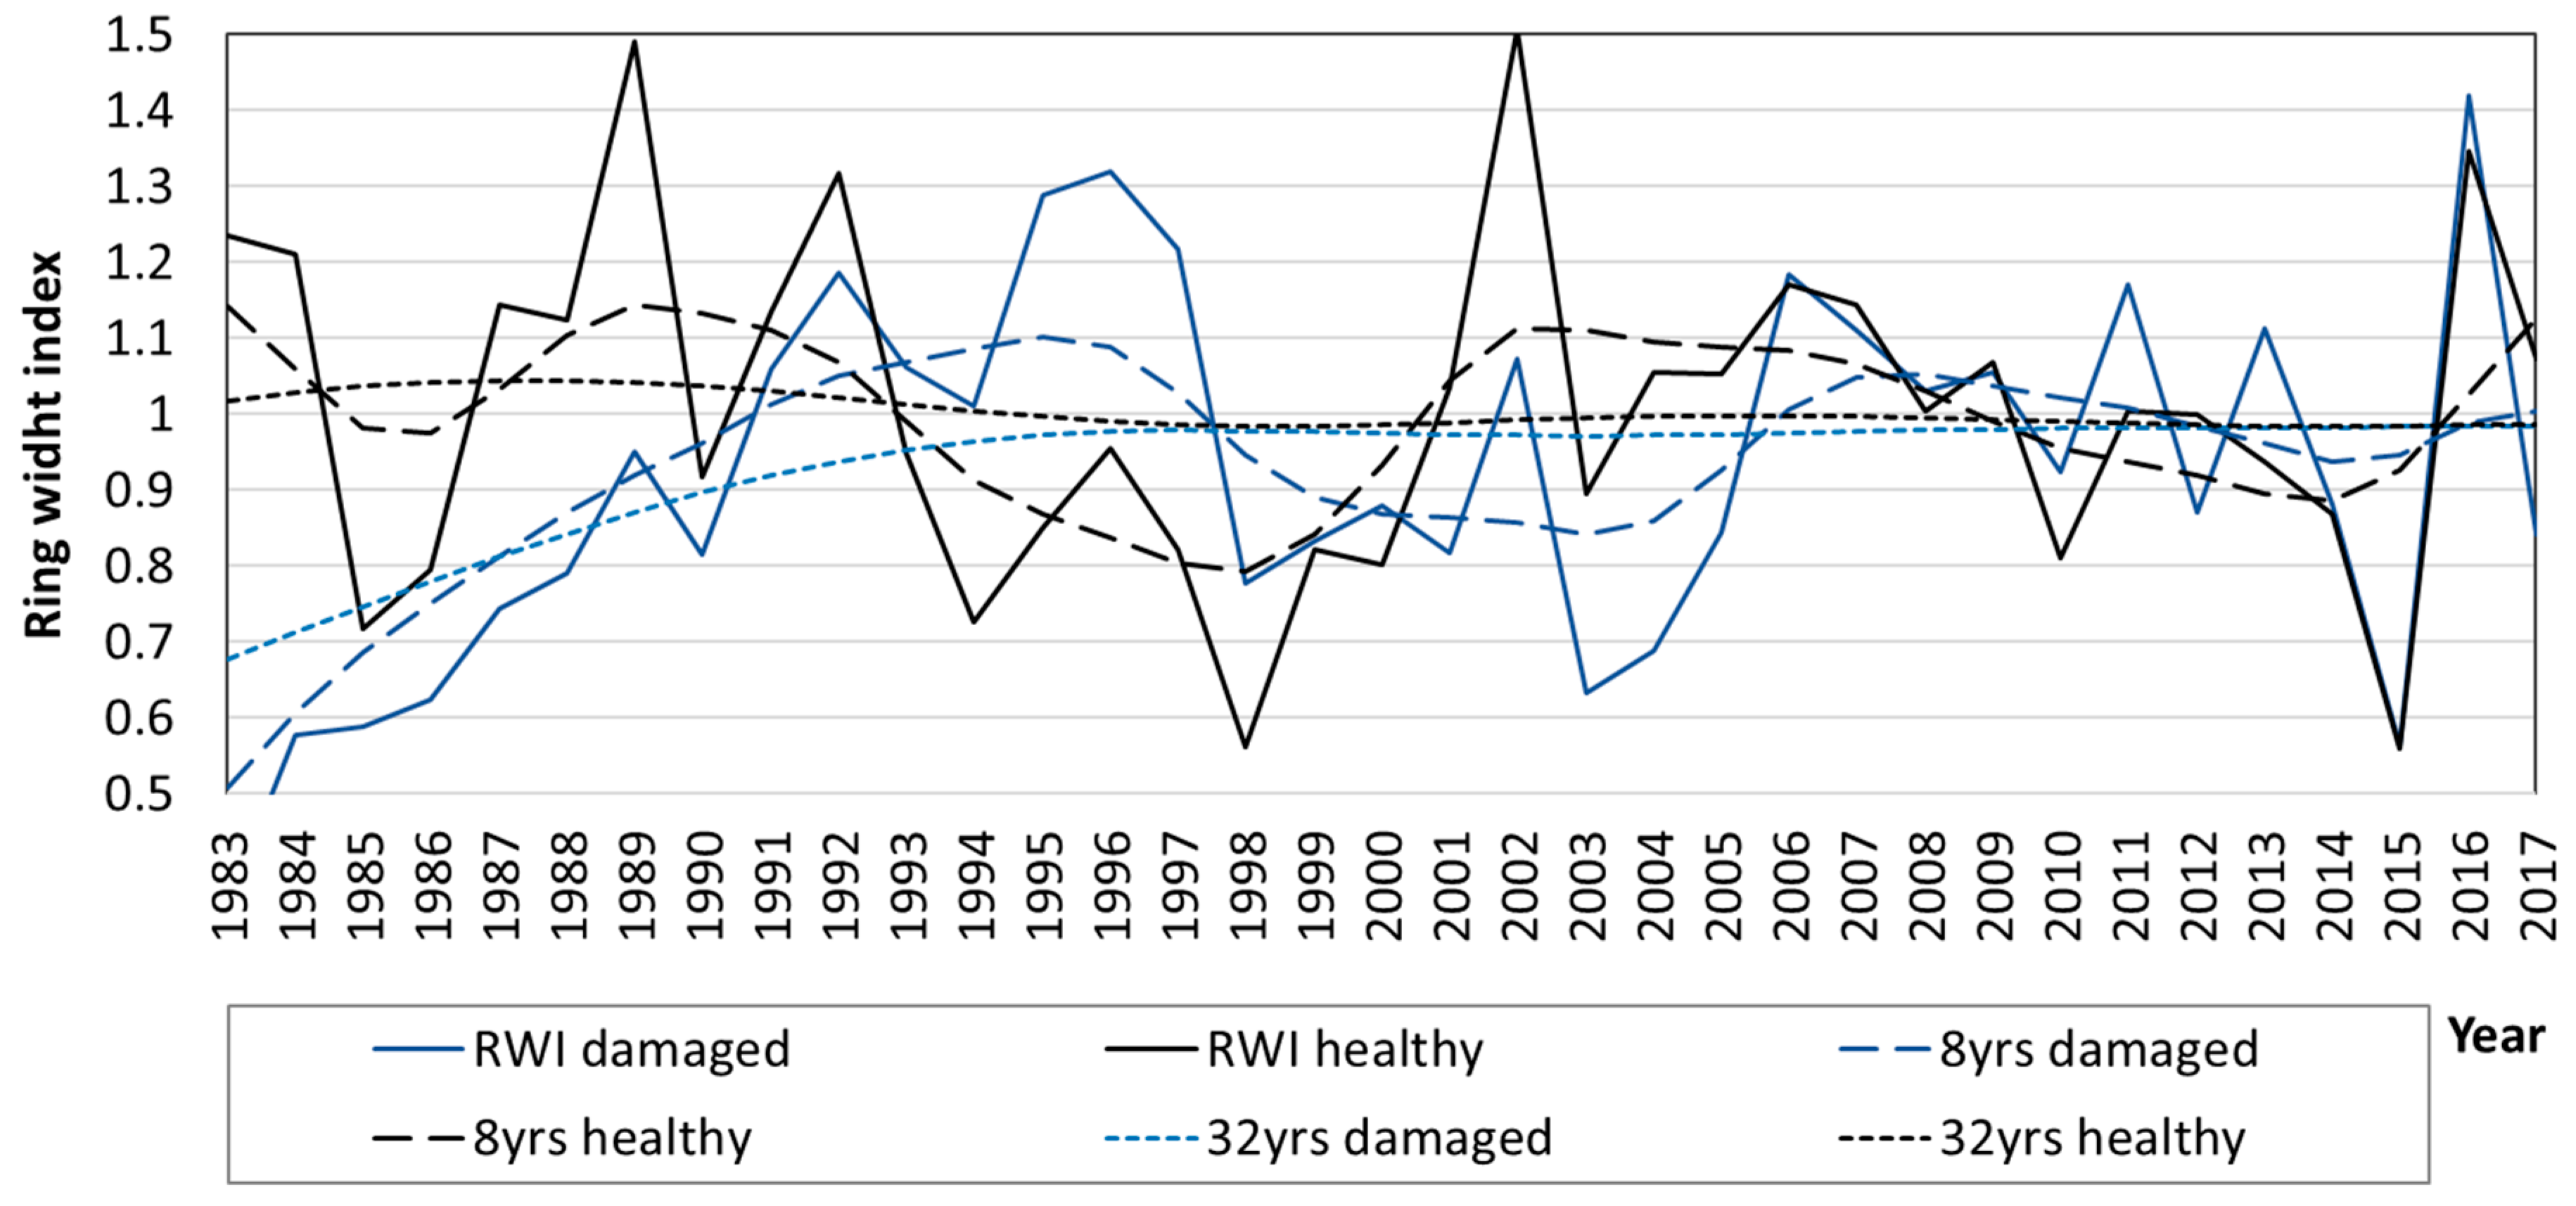
3.3. Diameter Growth of Norway Spruce

A comparison of the average tree-ring curves for all 16 PRPs shows their high rate of agreement among them (t-tests ≥ 5.1). This consistency allowed us to develop a regional standard chronology for the spruce stands in the Zapadoceska Upland region. The regional standard tree-ring chronology indicated a difference in the dynamics of radial growth, especially on HD plots (Figure 4). Until 1992, radial increments of spruce on damaged plots was considerably lower that on LD plots. For example, in 1983 the mean radial growth reached only 28.8% of normal (healthy) diameter increments. Since the impact of game attack subsided in 1992, radial growth of both variants (healthy vs trees with high damage) was relatively balanced.
The low radial increments that occurred in 1998 and 2015 qualified them as negative pointer years. The first half of 1998 had the warmest recorded temperatures (8.2 °C, long-term mean 6.1 °C) since 1961 (the beginning of meteorological measurements). In 2015, low increments were caused by extremely high temperatures (annual temperature 9.9 °C, long-term mean 7.9 °C), with low amounts of precipitation (for example in February 2 mm, long-term mean 21 mm). Moreover, PRPs established on HD plots were also found to be a negative pointer year in 2003. This year was the driest year recorded from 1961 through 2017 (304 mm, long-term mean 488 mm), especially with respect to the vegetation season (196 mm, long-term mean 325 mm).
Regarding the effects of precipitation and temperatures, significant (p < 0.05) correlations were observed in 5 months in cases of trees with large damage (5 significant values) compared to healthy trees (1 significant correlation). Diameter increments recorded between 1983 and 2017 positively correlated with the precipitation in June of the previous year (r = 0.30) and the current year (r = 0.40), while it was negatively correlated with precipitation in January of the current year (r = −0.38). Temperature had significant positive effects on radial growth in July of the previous year (r = 0.37) and in February of the current year (r = 0.29) for trees with high game damage. However, with respect to healthy trees, there was only one positive correlation of radial growth found with precipitation, specifically in April of the current year (r = 0.29).

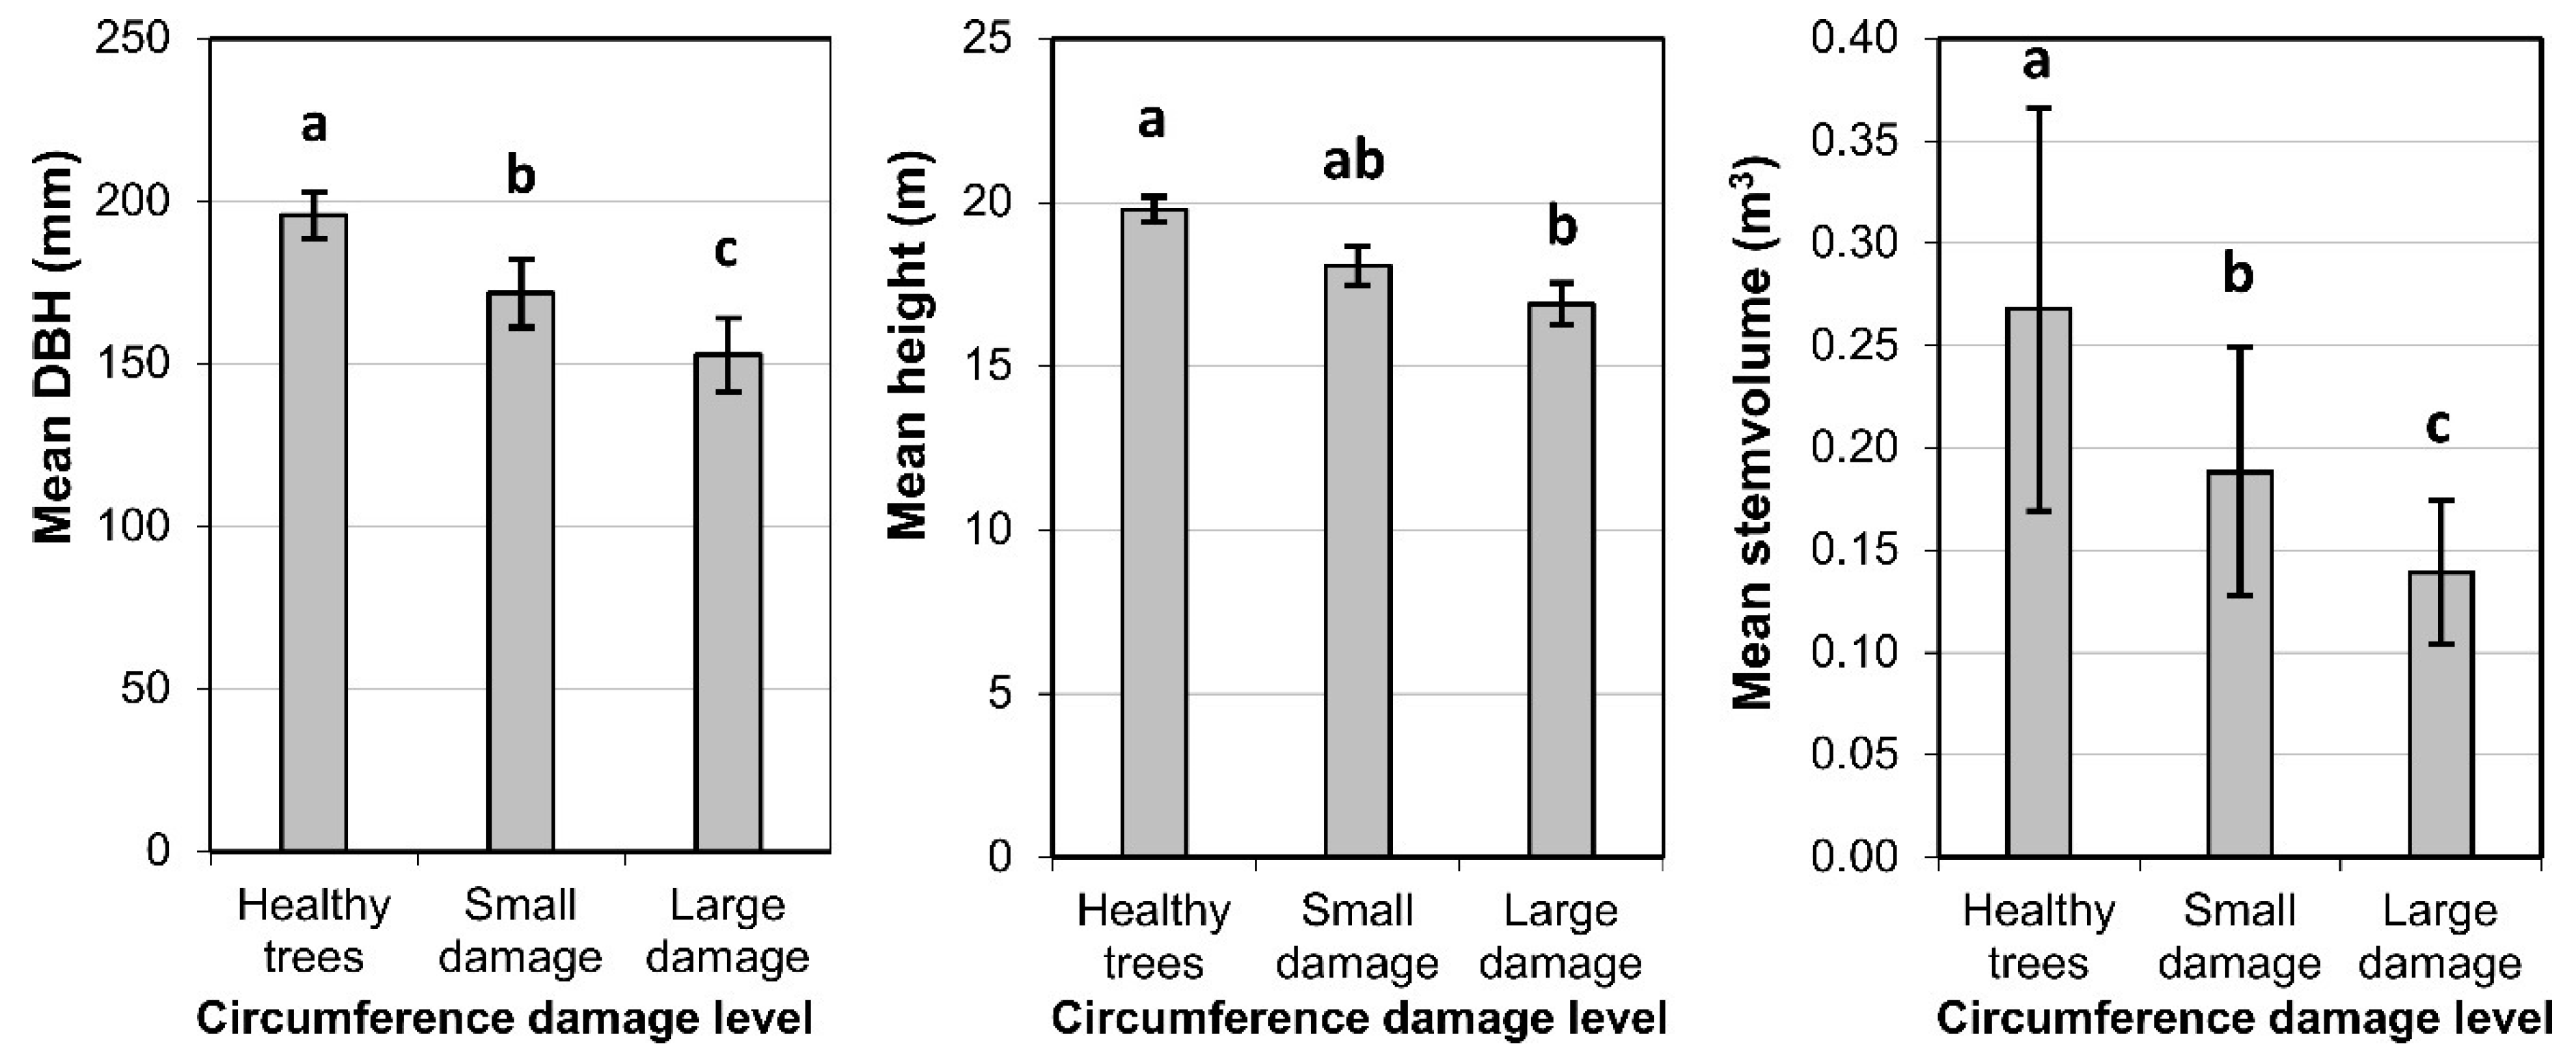
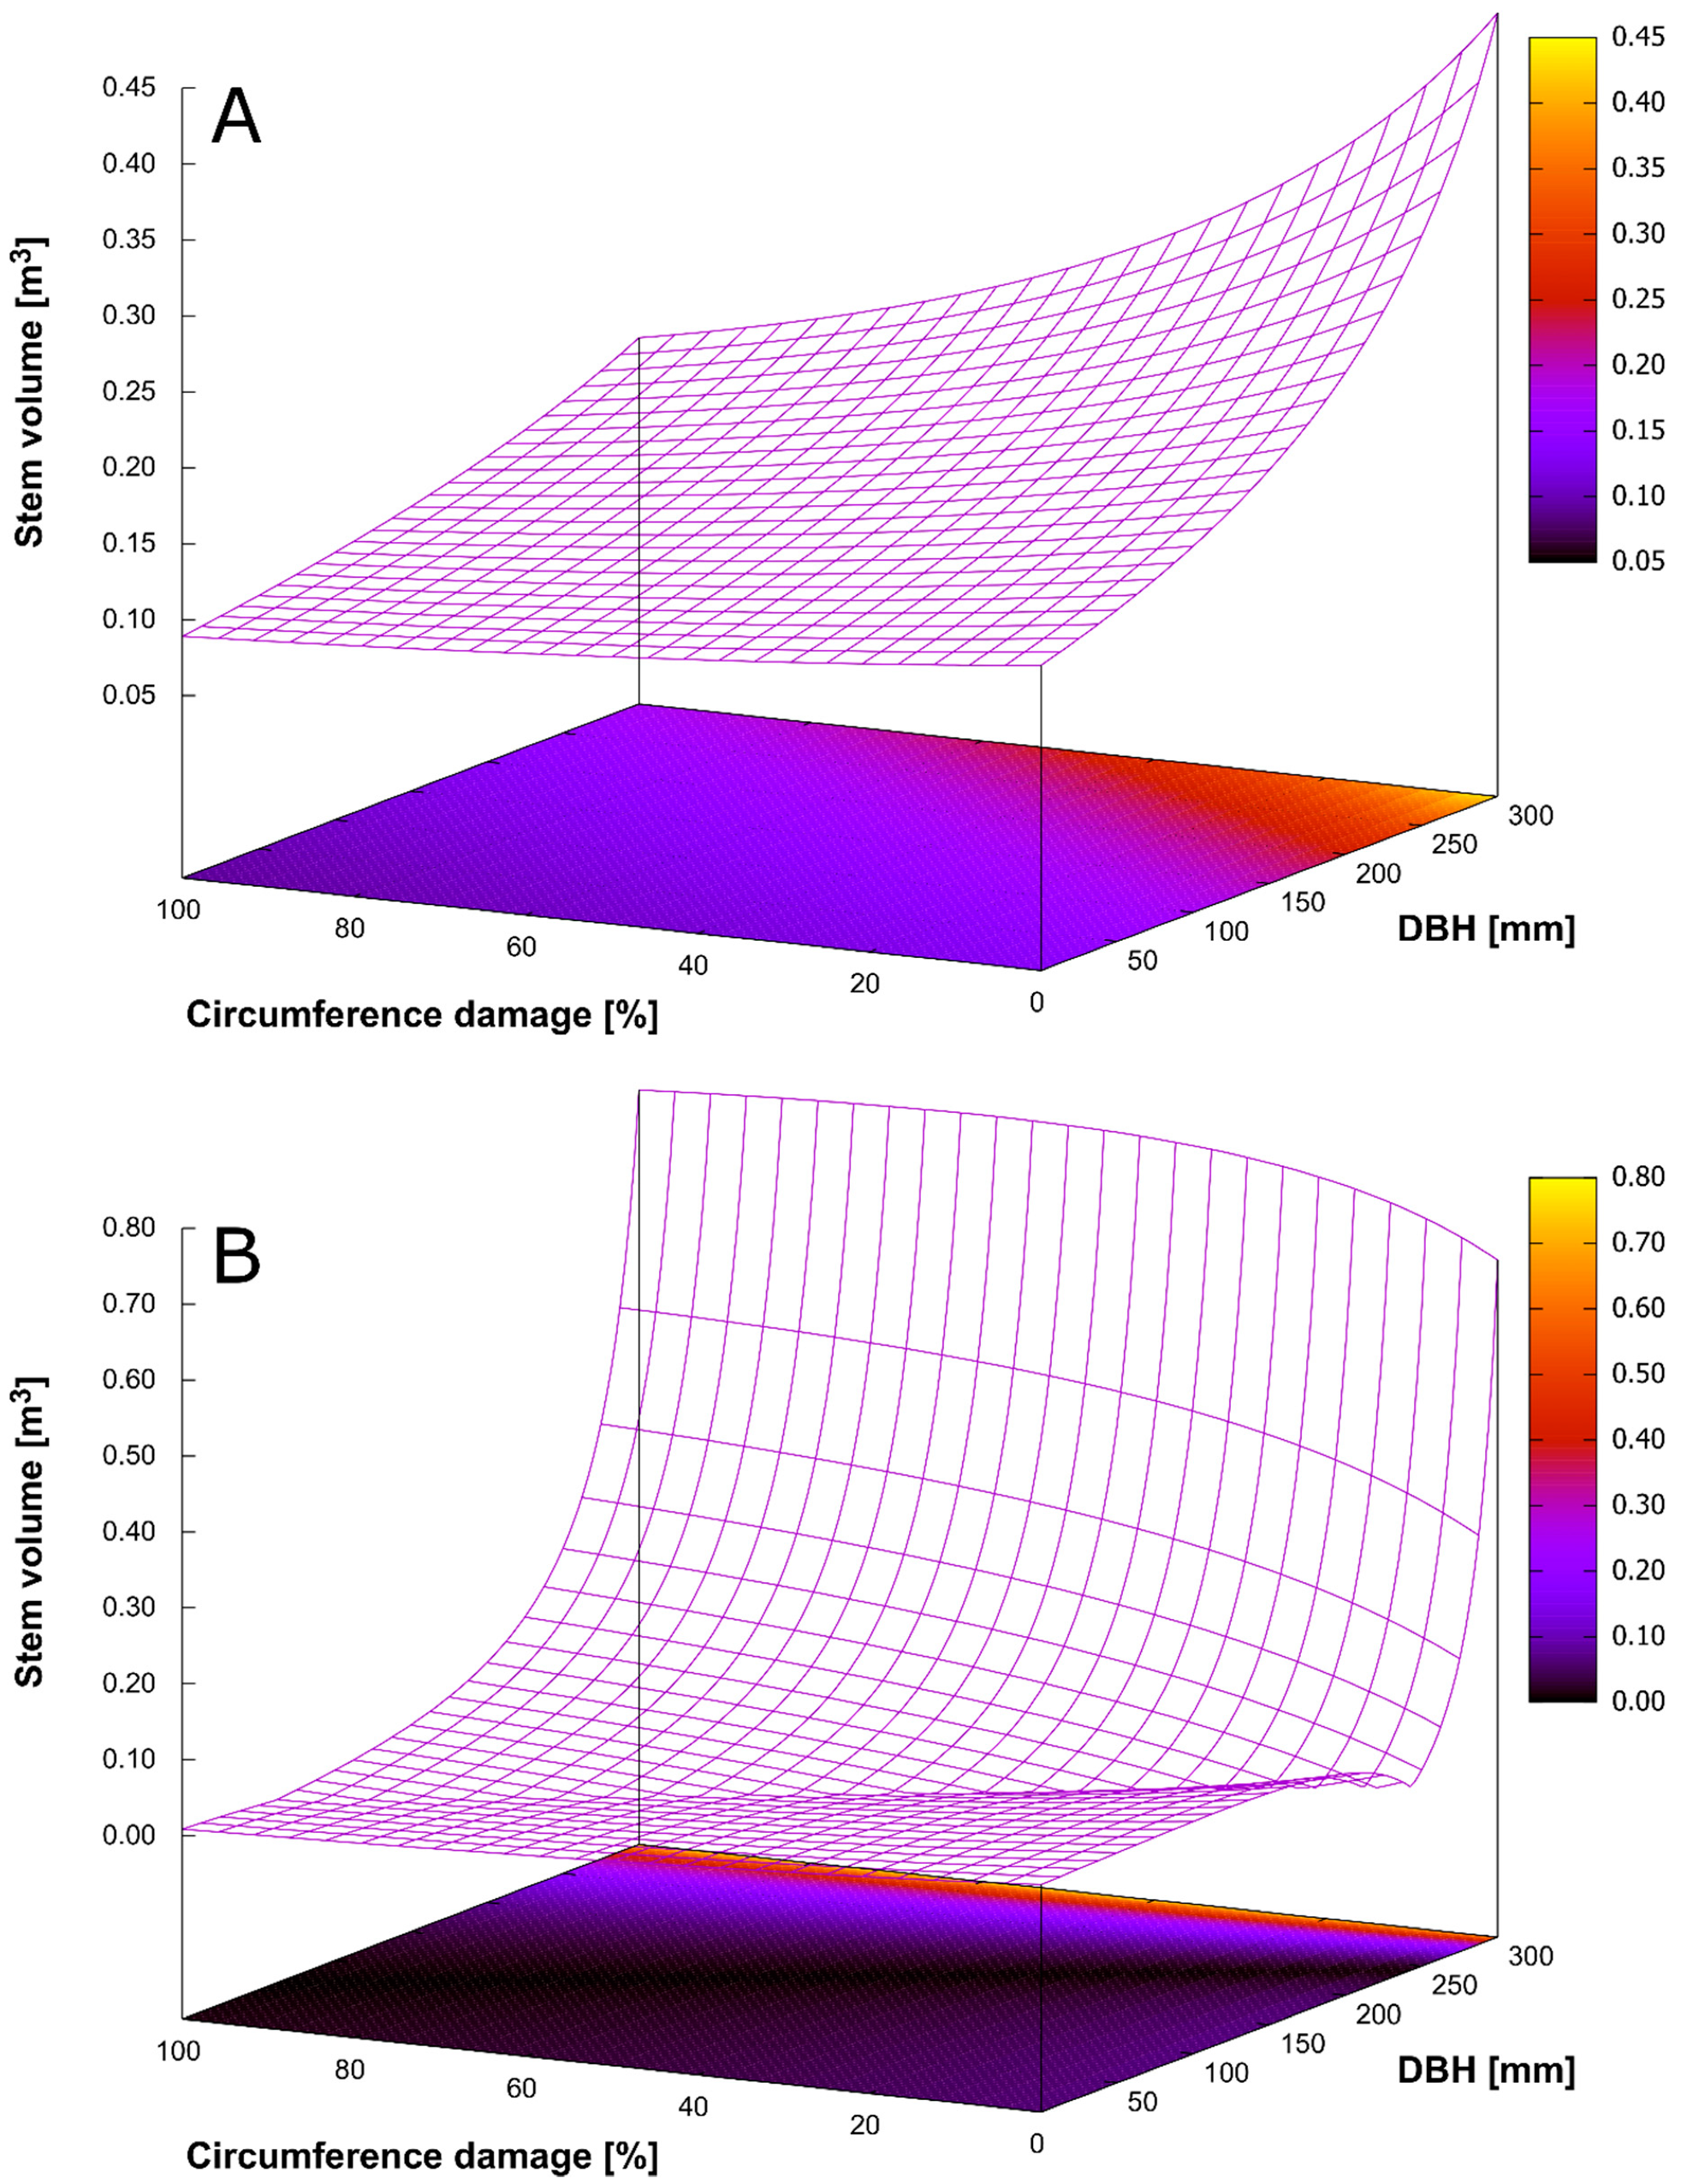
3.4. Bark Stripping Damage and Stem Rot

A large difference was found between the bark stripping damage on forest stands in studied hunting districts. On LD plots, 16.6% of trees were damaged by game with a mean damage of 3.1% of stem circumference. The opposite situation was observed on HD plots, where a ratio of 92.7% with a mean damage of 31.2% of damaged stem girth was observed. Overall, stem rot was found in 62.1% of trees that were damaged by bark striping. Fresh bark stripping was found only in 7.3% of damaged stems. Stem rot was not detected in unharmed trees. According to dendrochronology, damages by bark stripping occurred on trees between 10–23 years old. Stem rot reached up to 17.6% (±14.7 SD) of the tree diameter in trees damaged by bark stripping. The analysis of spatial patterns of damaged trees (by Clark–Evans index) showed higher aggregations compared to spatial distributions of all trees on the PRPs.
Significant differences were observed on all PRPs with respect to mean tree height (Kruskal–Wallis test, chi-squared = 55.2, p < 0.001), DBH (Kruskal–Wallis test, chi-squared = 42.7, p < 0.001), as well as in tree volume (Kruskal–Wallis test, chi-squared = 50.1, p < 0.001, see Figure 5) when comparing healthy trees (circumference damage ≤ 1/8 of stem girth) to those with less damage (circumference damage ≥ 1/8 and ≤ 1/3 of stem girth), and those with more damage (circumference damage ≥ 1/3 of stem girth). Mean DBH was significantly higher in healthy trees (19.6 cm) compared to trees with high damage (15.3 cm, p ≤ 0.001), with similar results found in mean height (19.8 m vs. 16.9 m), and tree volume (0.27 m3 vs. 0.14 m3).
A generalized linear model (for more information see Material and Methods, Data Analyses section) was presented in the following form (simplified notation of model from R software):
stem volume ~ DBH + Circumference damage
For results of the model, see Table 4. The goodness-of-fit was evaluated using the ratio of residual to null deviance (both values are present in respective table).
For a graphical representation of the model see Figure 6A. A rapid decrease in stem volume with respect to the presented surface plots, was illustrated when approximately one third of the stem circumference (measured at breast height, ca. 130 cm) was damaged by bark stripping. The decrease was naturally more striking with increasing stem damage percentages. Healthy trees could, according to the model, grow up to 0.5 m3 (or even more) of the stem volume for DBH at 30 cm, while these values could fluctuate to 50% or lower for seriously damaged trees. A similar decline was observed in trees with lower DBHs.
The differences between models for HD and LD plots are generally on very low level (Figure 6B) when applied to trees with DBH up to 25 cm. The overall model presented in Table 4 could be used for described conditions.

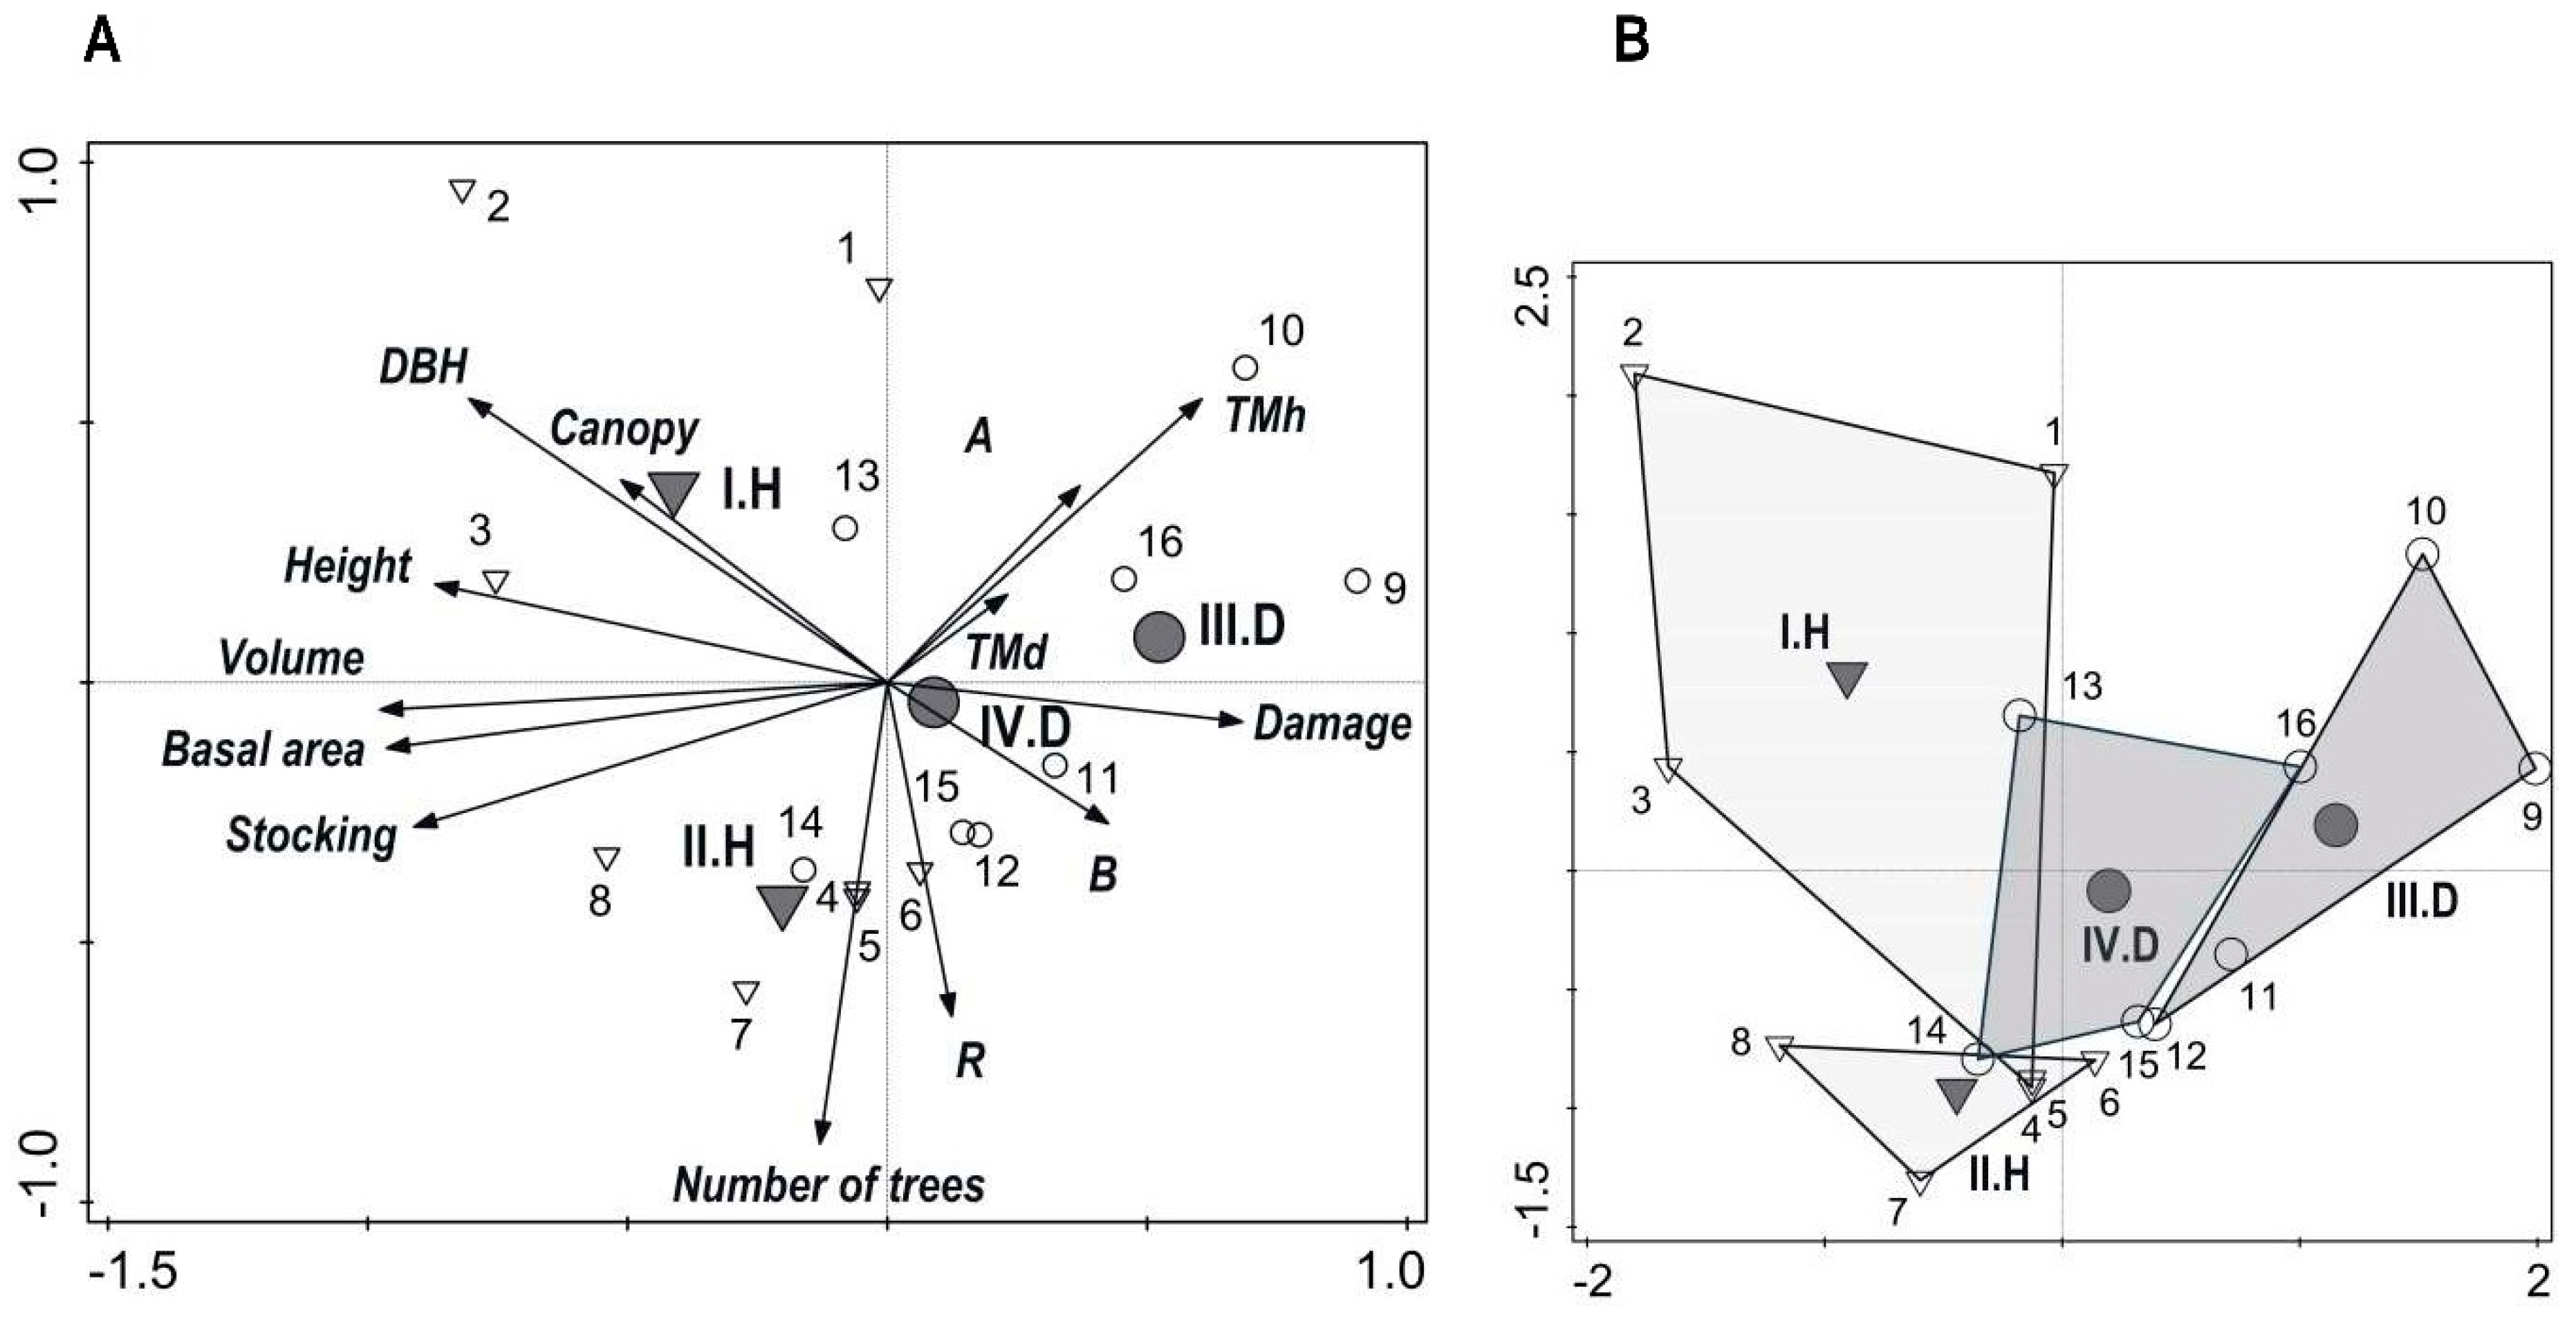
3.5. Relationships among Production, Diversity, and Game Damage

Results of the PCA analysis are presented in the ordination diagram in Figure 7. The first ordination axis explained 43.2% of data variability, the first two axes combined represented 61.1% of variability, and the first four axes all together explained 82.7% of data variability. The first x-axis represented stand volume and basal area with damages caused by game. The second y-axis represented the number of trees and spatial pattern of trees. Vertical diversity was observed to positively correlate with diameter and height differentiation. Total diversity negatively correlated with canopy closure and mean DBH. In terms of production, stand volume positively correlated with basal area, stocking, mean height, and DBH, while these parameters negatively correlated with bark stripping damage. The influence of game (LD plots vs. HD plots) showed low significance to mutual relationships among diversity indices compared to greater differences among production parameters. The LD plots with higher production parameters of timber occupy the left part of the diagram, while the high structural diversity and share of damage were typical for PRPs on HD plots.

4. Discussion

Under European conditions, bark stripping is a common damage caused to forest stands, especially by red deer (Cervus elaphus Linnaeus) or sika deer [37,70,71,72]. In the last decades, the intensity of damage caused to forest stands has been on the rise [21,36,37], due to increasing abundance of the aforementioned species [37,43,74]. Extensive damages to forest stands lead to significant loss in economic revenues [33], especially in regions where the Norway spruce is the main economic source with respect to forest management [75,76]. The monetary value of stands damaged by bark stripping ranges from 70–95% of the hypothetical value of healthy stands [77]. A positive relationship between bark stripping and population density of red deer was documented, e.g., throughout Europe [37,78,79], with respect to sika deer, with higher damage intensity found in Austria [74] or in native extension area (central Japan) [80].
In this study, the differences in growth parameters between stands in locations heavily affected by sika deer and forest stands with significantly lower sika deer activity were statistically supported. As a result of reduced growth of trees on forest sites with large observed damage was their overall stand volume of only 289.9 m3 ha−1 (± 73 SD) compared to healthy stands with mean stand volume of 440.5 m3 ha−1 (± 112 SD). The decrease in stand volume of damaged stands could be explained by their long-term damaging. The spreading of sika deer in studied territory happened after WWII, after destruction of game enclosures nearby where sika deer were reared [13,81]. The negative effects of sika deer browsing, or bark stripping, on forest stands have also been described by other authors [13,29,46,82]. Detailed information comes mostly from Japan where bark stripping caused by sika deer affects population dynamics and species composition of native cool-temperate mixed forest. The large scale of bark stripping (more than 70% of circumference of the stems) leads to a higher tree mortality of damaged trees [83]. Debarked trees are also susceptible to wind damage which results in wind-induced falling of coniferous trees through subsequent decay [80]. However, to date, the production of forest stands has not been satisfactorily described.
Not only production, but also stand structure and diversity were influenced by game [84]. In our study, higher structural diversity was observed on plots damaged by bark stripping compared to undamaged plots due to higher differentiation of slow growing damaged trees. In HD plots, higher crown differentiations were observed, as well as higher variability in crown closure and SDI between PRPs. Deer preference for trees with smaller DBHs was major contributing factor of higher canopy and stocking variability. Subsequently, the mortality of these heavily damaged trees by bark stripping accelerated the increase in canopy-gap ratio [21,80,85]. The creation of larger openings increased mosaicity of forest stands on HD plots, which created unsuitable even-aged forest management planning because of lower timber production. Similar to the vertical structure, the horizontal structure of forest stands was largely influenced not only by silvicultural practices, but also by ungulates [86,87]. As another pointer of health status and wood production, the relationship between crown diameter and DBH was analyzed as the structure of tree crown had a major effect on stemwood production [88]. Heavily damaged trees show high variation in crown diameter at lower DBHs compared to healthy trees, pointing out the irregularities or deformations of crowns of heavily damaged trees.
Månsson and Jarnemo [36] documented, that stems of Norway spruce damaged by red deer had thinner bark and lower branching in the bottom portion of the stem compared to healthy trees. Most commonly, the stands with a mean DBH of ~8–16 cm were damaged by red deer [21], although Welch et al. [32] showed a preferred DBH of 20 cm with respect to sitka spruce. Such values of DBH correspond to values recorded in our study: the actual mean DBH in LD plots was 20.0 cm with ±3.4 SD, and in HD plots the actual mean DBH was 17.5 cm with ±1.4 SD. Regarding age, the most damaged stands were between 18 and 38 years of age [89] with detailed information about critical stand age for bark stripping mentioned by Koltzenburg [90] and Čermák et al. [91], who estimated this critical age to range between 15–30 years old.
Furthermore, the scent of disintegrated bark layers has been found to stimulate red deer to eat it [34]. Repeated bark stripping occurs quite regularly on Norway spruce, as Büchsenmeister [92] documented, repeated bark stripping or different types of stem damage occur on 38% of previously damaged trees every year.
Previously published studies have primarily focused on describing bark stripping intensity and stem circumference damage [32,33,41]. However, it is also crucial to understand how bark stripping impacts wood quality, wood color [93] and fungal infection, which can cause decomposition of wood mass and stem deformations [18,38,93,94,95]. Wood from previously damaged trees are often infected by Stereum sanguinolentum (Alb. & Schwein.) Fr. in the first year after bark damage occurrences. Only 50 cm2 of debarked area on the stem is sufficient for penetration of fungal infection [38]. The probability of developing infection is higher in cases of wider damage or when trees are damaged at early ages [38,93,95,96]. The most suitable temperatures for infection development in Stereum sanguinolentum, range from −8.3 to 5.0 °C [93,97], which correspond to the mean temperatures in the Czech Republic during the non-vegetation season (1.7 °C according to Czech Hydrometeorological Institute (CHMI) [49]). Moreover, deer cause stem damages mainly in winter at time of high snow cover [98], when food availability is low [99], facilitating the possibility of infection.
In terms of climatic factors, the radial growth of spruce in lowland areas was influenced more by precipitation compared to temperature. Similarly, studies from other locations in the Czech Republic [100,101], Germany [102], Poland [103], and Slovakia [104] showed that temperature is the limiting factor of radial growth in mountainous regions, respectively the lack of precipitation in lowlands. Specifically, weather in June and July significantly impacts annual radial growth response [105,106], and is consistent with results reported in this study. Our data also revealed notable effects of climatic conditions in January, which could be due to frost. Temperatures in June and July positively affect growth of trees at higher altitudes [107,108]. The limiting effects of low temperatures are more significant, not only at high-altitude sites, but also at northern latitudes, while the importance of precipitation generally increases in southern latitudes [109].
Radial growth can be significantly affected by a variety of other factors, including air pollution, fungal pathogens, and bark stripping [101,108,110,111,112]. Comparing radial growth of healthy trees and trees damaged by bark stripping in our study, annual ring width of sensitive damaged spruce was significantly impacted by climatic factors compared to trees without damages. In our case of study of healthy trees, there was only one significant value observed (positive correlation with precipitation in April), probably due to the location of the study area at an intermediate elevation of the spruce range, similar to sites evaluated in Germany [102]. Damaged trees had reduced transpiration flow and were more stressed by abiotic factors compared to healthy trees without bark stripping. Growth of undamaged trees was positively correlated with precipitation in April only, likely due to this period coinciding with the beginning of growing season, therefore exhibiting the greatest growth dynamics and suitable climatic conditions. Similarly, in Switzerland, precipitation had a larger effect on the radial growth of damaged trees compared to health-dominant and health-suppressed trees [105]. Tree-ring analyses from Finland showed a strong positive correlation with June precipitation in damaged stands compared to a low observed correlation in healthy stands [113]. On our study site, June precipitation correlated with diameter increment and was much weaker in healthy stands compared to heavily damaged stands.
The sensitivity of Norway spruce forests damaged by bark striping is further enhanced by ongoing global climate change, including Czech Republic [106,114,115,116]. Furthermore, the frequency and duration of extreme climate events (droughts, temperature backlashes, and windstorms) has recently increased [117,118]. In combination with global warming and climatic stress, secondary damages to forest stands are often caused by bark beetles and fungal pathogens [119,120]. Decreased forest vitality makes stands more susceptible also to windthrow damage [119,121]. Specifically in the Czech Republic, the probability of drought between April and June increased by 50% since 1961 [122]. Starting 1961, the warmest six years for the last 20 years were observed with an average temperature increase of 0.04 °C per year (the largest increase was recorded for July [49]). Climate change has a significant negative effect on timber production of spruce forests and causes severe economic losses [120,123,124], especially in vulnerable spruce stands previously damaged by bark striping.

5. Conclusions

This study has estimated significant differences in growth characteristics of Norway spruce with different levels of stem circumference damage caused by sika deer. The total stand volume on sites with lower damage intensity was significantly higher compared to forest stands that were heavily debarked by sika deer. Damaged trees were also more susceptible to fluctuations in precipitation and temperature, while radial increments of healthy trees were relatively stable.
Therefore, it is possible to conclude that damaged Norway spruce stands show higher vulnerability to extreme climatic conditions, which could reduce their stability, resulting in reduced resistance to biotic and abiotic threats. Given the higher vulnerability to climatic extremes highlighted in this study and the increased climatic extremes predicted with climate change, the impacts of bark stripping on forest stands is likely to be greater in the future. Damaged stands are not only vulnerable to wind, frost or heavy snow damage, but also to drought, fungal infections or insects, such as bark beetles. Due to the numerous threats of damaged stands (especially in the context of global climatic changes), it is necessary to pay attention to hunting management practices so game damage does not exceed an ecologically acceptable limit. Preserving ecologically and economically effective management tools of local forests require a significant reduction in the density of local sika deer populations. This should include hunting, building winter game preserves, and/or feeding game in selected localities where game is concentrated and does not damage other stands in the area.

Supplementary Materials

The following are available online at https://0-www-mdpi-com.brum.beds.ac.uk/1999-4907/10/4/320/s1, S1: List of indices.

Author Contributions

Conceptualization, J.C., Z.V., and S.V.; methodology, J.C., Z.V., and S.V.; software, R.L.; validation, P.M. and F.H.; formal analysis, J.C., Z.V., R.L., and V.Š.; investigation, J.C. and Z.V.; resources, J.C. and F.H.; data curation, V.Š., R.L., and Z.V.; writing—original draft preparation, J.C., Z.V., S.V., P.M., F.H., and R.L.; visualization, R.L., V.Š., and Z.V.; supervision, P.M., F.H., and S.V.; project administration, J.C.; funding acquisition, F.H.

Funding

This research was funded by Grant Agency of Czech State Forests (project number 75), Ministry of Agriculture of Czech Republic (project No. QJ1630422) and by the Czech University of Life Sciences Prague, Faculty of Forestry and Wood Sciences (Excellent Output 2018).

Acknowledgments

We are grateful to an academic editor and three anonymous reviewers for their insightful comments and suggestions that greatly helped improve our manuscript.

Conflicts of Interest

The authors declare no conflict of interest.

References

  1. Ellis, E.C.; Goldewijk, K.K.; Siebert, S.; Lightman, D.; Ramankutty, N. Anthropogenic transformation of the biomes, 1700 to 2000. Glob. Ecol. Biogeogr. 2010, 19, 589–606. [Google Scholar] [CrossRef]
  2. Kreidenweis, U.; Humpenöder, F.; Kehoe, L.; Kuemmerle, T.; Bodirsky, B.L.; Lotze-Campen, H.; Popp, A. Pasture intensification is insufficient to relieve pressure on conservation priority areas in open agricultural markets. Glob. Chang. Biol. 2018, 24, 3199–3213. [Google Scholar] [CrossRef]
  3. Malek, Ž.; Verburg, P.H.; R Geijzendorffer, I.; Bondeau, A.; Cramer, W. Global change effects on land management in the Mediterranean region. Glob. Environ. Chang. 2018, 50, 238–254. [Google Scholar] [CrossRef]
  4. Baltzinger, M.; Mårell, A.; Archaux, F.; Pérot, T.; Leterme, F.; Deconchat, M. Overabundant ungulates in French Sologne? Increasing red deer and wild boar pressure may not threaten woodland birds in mature forest stands. Basic Appl. Ecol. 2016, 17, 552–563. [Google Scholar] [CrossRef] [Green Version]
  5. Bleier, N.; Lehoczki, R.; Újváry, D.; Szemethy, L.; Csányi, S. Relationships between wild ungulates density and crop damage in Hungary. Acta Theriol. (Warsz.) 2012, 57, 351–359. [Google Scholar] [CrossRef]
  6. Fattebert, J.; Baubet, E.; Slotow, R.; Fischer, C. Landscape effects on wild boar home range size under contrasting harvest regimes in a human-dominated agro-ecosystem. Eur. J. Wildl. Res. 2017, 63, 32. [Google Scholar] [CrossRef]
  7. Hagen, R.; Heurich, M.; Kröschel, M.; Herdtfelder, M. Synchrony in hunting bags: Reaction on climatic and human induced changes? Sci. Total Environ. 2014, 468–469, 140–146. [Google Scholar] [CrossRef]
  8. Heurich, M.; Brand, T.T.G.; Kaandorp, M.Y.; Šustr, P.; Müller, J.; Reineking, B. Country, cover or protection: What shapes the distribution of red deer and roe deer in the Bohemian Forest Ecosystem? PLoS ONE 2015, 10, e0120960. [Google Scholar] [CrossRef] [PubMed]
  9. Thulin, C.G.; Malmsten, J.; Ericsson, G. Opportunities and challenges with growing wildlife populations and zoonotic diseases in Sweden. Eur. J. Wildl. Res. 2015, 61, 649–656. [Google Scholar] [CrossRef]
  10. Kuijper, D.P.J.; de Kleine, C.; Churski, M.; van Hooft, P.; Bubnicki, J.; Jedrzejewska, B. Landscape of fear in Europe: Wolves affect spatial patterns of ungulate browsing in Bialowieża Primeval Forest, Poland. Ecography 2013, 36, 1263–1275. [Google Scholar] [CrossRef]
  11. Biedrzycka, A.; Solarz, W.; Okarma, H. Hybridization between native and introduced species of deer in Eastern Europe. J. Mammal. 2012, 93, 1331–1341. [Google Scholar] [CrossRef] [Green Version]
  12. Côté, S.; Rooney, T.; Tremblay, J.-P.; Dussault, C.; Waller, D. Ecological impacts of deer overabundance. Annu. Rev. Ecol. Evol. Syst. 2004, 35, 113–147. [Google Scholar] [CrossRef]
  13. Barančeková, M.; Krojerová-Prokešová, J.; Voloshina, I.V.; Myslenkov, A.I.; Kawata, Y.; Oshida, T.; Lamka, J.; Koubek, P. The origin and genetic variability of the Czech sika deer population. Ecol. Res. 2012, 27, 991–1003. [Google Scholar] [CrossRef]
  14. Bartoš, L. Sika Deer in Continental Europe. In Sika Deer; McCullough, D.R., Takatsuki, S., Kaji, K., Eds.; Springer: Tokyo, Japan, 2009; pp. 573–594. [Google Scholar]
  15. Pitra, C.; Rehbein, S.; Lutz, W. Tracing the genetic roots of the sika deer Cervus nippon naturalized in Germany and Austria. Eur. J. Wildl. Res. 2005, 51, 237–241. [Google Scholar] [CrossRef]
  16. Hannaford, J.; Pinn, E.H.; Diaz, A. The impact of sika deer grazing on the vegetation and infauna of Arne saltmarsh. Mar. Pollut. Bull. 2006, 53, 56–62. [Google Scholar] [CrossRef]
  17. Pérez-Espona, S.; Pemberton, J.M.; Putman, R. Red and sika deer in the British Isles, current management issues and management policy. Mamm. Biol. 2009, 74, 247–262. [Google Scholar] [CrossRef]
  18. Putman, R.J.; Moore, N.P. Impact of deer in lowland Britain on agriculture, forestry and conservation habitats. Mamm. Rev. 1998, 28, 141–164. [Google Scholar] [CrossRef]
  19. Bergvall, U.A.; Leimar, O. Directional associational plant defense from Red deer (Cervus elaphus) foraging decisions. Ecosphere 2017, 8, e01714. [Google Scholar] [CrossRef]
  20. Reimoser, F.; Putman, R.J. Impact of large ungulates on agriculture, forestry and conservation in Europe. In Ungulate Management in Europe: Problems and Practices; Putman, R.J., Apollonio, M., Andersen, R., Eds.; Cambridge University Press: Cambridge, UK, 2009. [Google Scholar]
  21. Vospernik, S. Probability of bark stripping damage by red deer (Cervus elaphus) in Austria. Silva Fenn. 2006, 40, 589–601. [Google Scholar] [CrossRef]
  22. Miller, G.R.; Kinnaird, J.W.; Cummins, R.P. Liability of Saplings to Browsing on a Red Deer Range in the Scottish Highlands. J. Appl. Ecol. 1982, 19, 941–951. [Google Scholar] [CrossRef]
  23. Kupferschmid, A.D.; Zimmermann, S.; Bugmann, H. Browsing regime and growth response of naturally regenerated Abies alba saplings along light gradients. For. Ecol. Manag. 2013, 310, 393–404. [Google Scholar] [CrossRef]
  24. Bobrowski, M.; Gillich, B.; Stolter, C. Modelling browsing of deer on beech and birch in northern Germany. For. Ecol. Manag. 2015, 358, 212–221. [Google Scholar] [CrossRef]
  25. Moser, B.; Schütz, M.; Hindenlang, K.E. Importance of alternative food resources for browsing by roe deer on deciduous trees: The role of food availability and species quality. For. Ecol. Manag. 2006, 226, 248–255. [Google Scholar] [CrossRef]
  26. Vandenberghe, C.; Freléchoux, F.; Buttler, A. The influence of competition from herbaceous vegetation and shade on simulated browsing tolerance of coniferous and deciduous saplings. Oikos 2008, 117, 415–423. [Google Scholar] [CrossRef] [Green Version]
  27. Gill, R.M.A. The influence of large herbivores on tree recruitment and forest dynamics. In Large Herbivore Ecology and Ecosystem Dynamics; Kjell, D., Bergström, D.P., Pastor, J., Eds.; Cambridge University Press: Cambridge, UK, 2006; pp. 170–193. [Google Scholar]
  28. Faber, W.E. Bark stripping by moose on young pinus sylvestris in south–central Sweden. Scand. J. For. Res. 1996, 11, 300–306. [Google Scholar] [CrossRef]
  29. Gossow, H. Fütterungsstandort und Rotwild schäle. Österreichische Forstzeitung 1988, 6, 53–54. [Google Scholar]
  30. Borkowski, J.; Ukalski, K. Bark stripping by red deer in a post-disturbance area: The importance of security cover. For. Ecol. Manag. 2012, 263, 17–23. [Google Scholar] [CrossRef]
  31. Jerina, K.; Dajčman, M.; Adamič, M. Red deer (Cervus elaphus) bark stripping on spruce with regard to spatial distribution of supplemental feeding places. Zb. gozdarstva Lesar. 2008, 86, 33–43. [Google Scholar]
  32. Welch, D.; Staines, B.W.; Scott, D.; Catt, D.C. Bark-stripping damage by red deer in Sitka spruce in Western Scotland. II. Qound size and position. Forestry 1988, 61, 245–254. [Google Scholar] [CrossRef]
  33. Gill, R.M.A. A Review of Damage by Mammals in North Temperate Forests: 1. Deer. Forestry 1992, 65, 145–169. [Google Scholar] [CrossRef] [Green Version]
  34. Welch, D.; Scott, D. Observations on bark-stripping by red deer in a Picea sitchensis forest in Western Scotland over a 35-year period. Scand. J. For. Res. 2017, 32, 473–480. [Google Scholar] [CrossRef]
  35. El Atta, H.A.; Hayes, A.J. Decay in Norway spruce caused by Stereum sanguinolentum Alb. & Schw. ex Fr. developing from extraction wounds. Forestry 1987, 60, 1–111. [Google Scholar]
  36. Månsson, J.; Jarnemo, A. Bark-stripping on Norway spruce by red deer in Sweden: Level of damage and relation to tree characteristics. Scand. J. For. Res. 2013, 28, 117–125. [Google Scholar] [CrossRef]
  37. Verheyden, H.; Ballon, P.; Bernard, V.; Saint-andrieux, C. Variations in bark-stripping by red deer Cervus elaphus across Europe. Mamm. Rev. 2006, 36, 217–234. [Google Scholar] [CrossRef]
  38. Vasiliauskas, R.; Stenlid, J.; Johansson, M. Fungi in bark peeling wounds of Picea abies in central Sweden. Eur. J. For. Pathol. 1996, 26, 285–296. [Google Scholar] [CrossRef]
  39. Akashi, N.; Terazawa, K. Bark stripping damage to conifer plantations in relation to the abundance of sika deer in Hokkaido, Japan. For. Ecol. Manag. 2005, 208, 77–83. [Google Scholar] [CrossRef]
  40. Hanzal, V.; Košinová, K.; Pokorný, R.; Janiszewski, P.; Hart, V. Weight parameters of body parts in sika deer (Cervus nippon nippon) from the Konstantinolázeňsko microregion, the Czech Republic. Cent. Eur. For. J. 2018, 64, 16–23. [Google Scholar] [CrossRef]
  41. Welch, D.; Scott, D. An estimate of timber degrade in Sitka spruce due to bark stripping by deer in a Scottish plantation. Forestry 2008, 81, 489–497. [Google Scholar] [CrossRef] [Green Version]
  42. CZSO. Výsledek mysliveckého hospodaření [The summary of game management in the Czech Republic]; CZSO: Prague, Czech Republic, 2018.
  43. Loison, A.; Toïgo, C.; Gaillard, J.M. Large herbivore biodiversity in European mountain ecosystems: Current status and challenges for the future. In Alpine Biodiversity—Pattern, Process and Change in Europe; Nagy, L., Ed.; Springer: Berlin, Germany, 2003; pp. 351–366. [Google Scholar]
  44. Ward, A.I. Expanding ranges of wild and feral deer in Great Britain. Mamm. Rev. 2005, 35, 165–173. [Google Scholar] [CrossRef]
  45. Allombert, S.; Stockton, S.; Martin, J.L. A natural experiment on the impact of overabundant deer on forest invertebrates. Conserv. Biol. 2005, 19, 1917–1929. [Google Scholar] [CrossRef]
  46. Ammer, C. Impact of ungulates on structure and dynamics of natural regeneration of mixed mountain forests in the Bavarian Alps. For. Ecol. Manag. 1996, 88, 43–53. [Google Scholar] [CrossRef]
  47. Gill, R.M.A.; Beardall, V. The impact of deer on woodlands: The effects of browsing and seed dispersal on vegetation structure and composition. Forestry 2001, 74, 209–218. [Google Scholar] [CrossRef]
  48. Fuller, R.J.; Gill, R.M.A. Ecological impacts of increasing numbers of deer in British woodland. Forestry 2001, 74, 193–199. [Google Scholar] [CrossRef] [Green Version]
  49. CHMI Czech Hydrometeorological Institute. Available online: Portal.chmi.cz (accessed on 10 February 2019).
  50. Köppen, W. Das {Geographische} {System} der {Klimate}; Gebrüder Borntraeger: Berlin, Germany, 1936; Volume 1. [Google Scholar]
  51. Quitt, E. Klimatické oblasti Československa [Climatic Regions of Czechoslovakia].; Academia: Prague, Czech Republic, 1971. [Google Scholar]
  52. Institute of Forest Ecosystem Research—Monitoring and Mapping Solutions; Institute of Forest Ecosystem Research: Jílové u Prahy, Czech Republic, 2017.
  53. Černý, M.; Cienciala, E.; Russ, R. Metodika terénního šetření v systému inventarizace krajiny CzechTerra [Survey Methodology in the CzechTerra Landscape Inventory System]; IFER—Ústav pro výzkum lesních ekosystémů, s.r.o.: Prague, Czech Republic, 2009. [Google Scholar]
  54. Forest Management Institute. National Forest Inventory in the Czech Republic 2001–2004; FMI: Brandýs nad Labem, Czech Republic, 2007. [Google Scholar]
  55. Kosmala, M.; Suchocka, M. Influence of Mechanical Damage on the Condition of Trees; Annals of Warsaw University of Life Sciences—SGGW: Warsaw, Poland, 2008. [Google Scholar]
  56. Petráš, R.; Pajtík, J. Sústava česko-slovenských objemových tabuliek drevín. For. J. Lesn. časopis 1991, 37, 49–56. [Google Scholar]
  57. Reineke, L.H. Prefecting a stand-density index for evenaged forests. J. Agric. Res. 1933, 46, 627–638. [Google Scholar]
  58. Crookston, N.L.; Stage, A.R. Percent Canopy Cover and Stand Structure Statistics from the Forest Vegetation Simulator; US Department of Agriculture, Forest Service, Rocky Mountain Research Station: Ogden, UT, USA, 1999.
  59. Naslund, M. Skogsförsöksanstaltens gallringsförsök i tallskog; Swedish Institute of Experimental Forestry: Stockholm, Sweden, 1937; Volume 29.
  60. Fabrika, M. Growth simulator SIBYLA and the possibilities of its applications in forest management. Lesn. časopis For. J. 2003, 49. [Google Scholar]
  61. Pretzsch, H. Wissen nutzbar machen für das Management von Waldökosystemen. Allg. Forstzeitschrift/Der Wald 2006, 1158–1159. [Google Scholar]
  62. Füldner, K. Strukturbeschreibung in Mischbeständen [Structure description of mixed stands]. Forstarchiv 1995, 66, 235–606. [Google Scholar]
  63. Jaehne, S.; Dohrenbusch, A. Ein Verfahren zur beurteilung der bestandesdiversitiit. Eur. J. For. Res. 1997, 116, 333–345. [Google Scholar] [CrossRef]
  64. Clark, P.J.; Evans, F.C. Distance to Nearest Neighbor as a Measure of Spatial Relationships in Populations. Ecology 1954, 35, 445–453. [Google Scholar] [CrossRef] [Green Version]
  65. Pretzsch, H. Forest Dynamics, Growth and Yield; Springer: Berlin/Heidelberg, Germany, 2009. [Google Scholar]
  66. Yamaguchi, D.K. A simple method for cross-dating increment cores from living trees. Can. J. For. Res. 1991, 21, 414–416. [Google Scholar] [CrossRef]
  67. R Core Team. R: A Language and Environment for Statistical Computing; R Foundation for Statistical Computing: Vienna, Austria, 2018. [Google Scholar]
  68. Bunn, A.G. A dendrochronology program library in R (dplR). Dendrochronologia 2008, 26, 115–124. [Google Scholar] [CrossRef]
  69. Bunn, A.G. Statistical and visual crossdating in R using the dplR library. Dendrochronologia 2010, 28, 251–258. [Google Scholar] [CrossRef]
  70. Schweingruber, F.H.; Eckstein, D.; Serre-Bachet, F.; Bräker, O.U. Identification, presentation and interpretation of event years and pointer years in dendrochronology. Dendrochronologia 1990, 8, 9–38. [Google Scholar]
  71. Biondi, F.; Waikul, K. DENDROCLIM2002: A C++ program for statistical calibration of climate signals in tree-ring chronologies. Comput. Geosci. 2004, 30, 303–311. [Google Scholar] [CrossRef]
  72. Siegel, S.; Castellan, N.J., Jr. Nonparametric Statistics for the Behavioral Sciences, 2nd ed.; Mcgraw-Hill Book Company: New York, NY, USA, 1988; ISBN 0-07-057357-3. [Google Scholar]
  73. Lepš, J.; Šmilauer, P. Multivariate Analysis of Ecological Data Using CANOCO; Cambridge University Press: Cambridge, UK, 2003. [Google Scholar]
  74. Völk, F.H. Bedeutung von Waldstruktur und Rotwildhege für die Schälhäufigkeit in den alpinen Bundesländern Österreichs. Z. Jagdwiss. 1999, 45, 1–16. [Google Scholar] [CrossRef]
  75. Girompaire, L.; Ballon, P. Conséquences de l’écorcage du cerf élaphe dans le massif des Vosges Alsaciennes. Rev. For. Française 1992, 6, 501–511. [Google Scholar] [CrossRef]
  76. Simon, J.; Kolář, C. Economic evaluation of bark stripping by red deer on the basis of analysis on a time growth series of spruce stands in the Hrubý Jeseník Mts. J. For. Sci. 2001, 47, 402–409. [Google Scholar]
  77. Eidmann, F.E. Wertminderung von Fichtenbestanden durch den schälschäden des Rotwildes. Forstarchiv 1952, 23, 65–69. [Google Scholar]
  78. Ueckermann, E. The causes of bark-stripping by cervids (Untersuchungen über die ursache des schälens des rotwildes). Z. Jagdwiss. 1956, 2. [Google Scholar]
  79. Pheiffer, J.; Hartfiel, B. Relation between winter feeding and the bark-stripping behaviour of red deer in the Eifel (Beziehungen zwischen der Winterfütterung und dem Schälverhalten des Rotwildes in der Eifel). Z. Jagdwiss. 1984, 30, 243–355. [Google Scholar]
  80. Shibata, E.; Torazawa, Y. Effects of bark stripping by sika deer, Cervus nippon, on wind damage to coniferous trees in subalpine forest of central Japan. J. For. Res. 2008, 13, 296–301. [Google Scholar] [CrossRef]
  81. Wolf, R. Historie chovu jelena siky na území České republiky. Introd. Spárkatá Zvěř 1999, 99, 52–56. [Google Scholar]
  82. Yokoyama, S.; Maeji, I.; Ueda, T.; Ando, M.; Shibata, E. Impact of bark stripping by sika deer, Cervus nippon, on subalpine coniferous forests in central Japan. For. Ecol. Manag. 2001, 140, 93–99. [Google Scholar] [CrossRef]
  83. Akashi, N.; Nakashizuka, T. Effects of bark-stripping by Sika deer (Cervus nippon) on population dynamics of a mixed forest in Japan. For. Ecol. Manag. 1999, 113, 75–82. [Google Scholar] [CrossRef]
  84. Vacek, Z.; Vacek, S.; Bílek, L.; Král, J.; Remeš, J.; Bulušek, D.; Králícek, I. Ungulate impact on natural regeneration in spruce-beech-fir stands in Černý důl nature reserve in the Orlické hory Mountains, case study from central sudetes. Forests 2014, 5, 2929–2946. [Google Scholar] [CrossRef]
  85. Gill, R.M.A. A review of damage by mammals in north temperate forest 3. Forestry 1992, 65, 363–388. [Google Scholar] [CrossRef]
  86. Vacek, Z. Structure and dynamics of spruce-beech-fir forests in Nature Reserves of the Orlické hory Mts. in relation to ungulate game. Cent. Eur. For. J. 2017, 63, 23–34. [Google Scholar] [CrossRef] [Green Version]
  87. Slanař, J.; Vacek, Z.; Vacek, S.; Bulušek, D.; Cukor, J.; Štefančík, I.; Bílek, L.; Krl, J. Long-term transformation of submontane spruce-beech forests in the Jizerské hory Mts.: Dynamics of natural regeneration. Cent. Eur. For. J. 2017, 63, 212–224. [Google Scholar] [CrossRef]
  88. Pulkkinen, P.; Pijykkij, T. Inherited narrow crown form, harvest index and stem biomass production in Norway spruce, Picea abies. Tree Physiol. 1990, 6, 381–391. [Google Scholar] [CrossRef]
  89. Lenz, O. Damage caused to trees by red deer. Schweiz. Z. Forstwes. 1964, 115, 13–14. [Google Scholar]
  90. Koltzenburg, C. Schutzwirkung durch mechanischbiologischen Schalschutz in Fichtenbestanden. Forst-Holzwirt 1985, 40, 471–475. [Google Scholar]
  91. Čermák, P.; Jankovský, L.; Lička, D.; Beránek, J.; Glogar, J. Damage to spruce stands by deer barking and subsequent rots in Forest Range Proklest, the Křtiny Training Forest Enterprise “Masaryk Forest” (the Drahany Upland). Acta Univ. Agric. Silvic. Mendel. Brun. 2004, 52, 165–174. [Google Scholar] [CrossRef] [Green Version]
  92. Büchsenmeister, R. The current situation as regards peeling damage in the forest: Austrian Forest Inventory 1986/90. Förderungsdienst 1995, 43, 312–320. [Google Scholar]
  93. Vasiliauskas, R.; Stenlid, J. Spread of Stereum sanguinolentum Vegetative Compatibility Groups within a Stand and within Stems of Picea abies. Silva Fenn. 1998, 32, 301–309. [Google Scholar] [CrossRef]
  94. Vasiliauskas, R. Patterns of wounding and decay in stems of Quercus robur due to bark peeling. Scand. J. For. Res. 1998, 13, 437–441. [Google Scholar] [CrossRef]
  95. Čermák, P.; Jankovský, L. Škody ohryzem, loupáním a následnými hnilobami; Lesnická práce: Kostelec nad Černými lesy, Czech Republic, 2006. [Google Scholar]
  96. Roll-Hansen, F.; Roll-Hansen, H. Microorganisms which invade Picea abies in seasonal stem wounds. For. Pathol. 1980, 10, 396–410. [Google Scholar] [CrossRef]
  97. Kallio, T.; Hallaksela, A.M. Biological-Control of Heterobasidion-Annosum (Fr) Bref (Fomes-annosus) in Finland. Eur. J. For. Pathol. 1979, 9, 298–308. [Google Scholar] [CrossRef]
  98. Welch, D.; Scott, D.; Staines, B. Bark stripping damage by red deer in Sitka spruce in Western Scotland. III. Trends in wound condition. Forestry 1997, 70, 113–120. [Google Scholar] [CrossRef]
  99. Jarnemo, A.; Minderman, J.; Bunnefeld, N.; Zidar, J.; Mansson, J. Managing landscapes for multiple objectives: Alternative forage can reduce the conflict between deer and forestry. Ecosphere 2014, 5. [Google Scholar] [CrossRef]
  100. Král, J.; Vacek, S.; Vacek, Z.; Putalová, T.; Bulušek, D.; Štefančík, I. Structure, development and health status of spruce forests affected by air pollution in the western Krkonoše Mts. in 1979–2014. For. J. 2015, 61, 175–187. [Google Scholar] [CrossRef]
  101. Králíček, I.; Vacek, Z.; Vacek, S.; Remeš, J.; Bulušek, D.; Král, J.; Štefančík, I.; Putalová, T. Dynamics and structure of mountain autochthonous spruce-beech forests: Impact of hilltop phenomenon, air pollutants and climate. Dendrobiology 2017, 77, 119–137. [Google Scholar] [CrossRef]
  102. Wilson, R.J.S.; Hopfmueller, M. Dendrochronological investigations of Norway spruce along an elevational transect in the Bavarian Forest, Germany. Dendrochronologia 2001, 19, 67–79. [Google Scholar]
  103. Savva, Y.; Oleksyn, J.; Reich, P.B.; Tjoelker, M.G.; Vaganov, E.A.; Modrzynski, J. Interannual growth response of Norway spruce to climate along an altitudinal gradient in the Tatra Mountains, Poland. Trees Struct. Funct. 2006, 20, 735–746. [Google Scholar] [CrossRef]
  104. Büntgen, U.; Frank, D.C.; Kaczka, R.J.; Verstege, A.; Zwijacz-Kozica, T.; Esper, J. Growth responses to climate in a multi-species tree-ring network in the {Western} {Carpathian} {Tatra} {Mountains}, {Poland} and {Slovakia}. Tree Physiol. 2007, 27, 689–702. [Google Scholar] [CrossRef]
  105. Meyer, F.D.; Bräker, O.U. Climate response in dominant and suppressed spruce trees, Picea abies (L.) karst., on a subalpine and lower montane site in Switzerland. Ecoscience 2001, 8, 105–114. [Google Scholar] [CrossRef]
  106. Vacek, S.; Hůnová, I.; Vacek, Z.; Hejcmanová, P.; Podrázský, V.; Král, J.; Putalová, T.; Moser, W.K. Effects of air pollution and climatic factors on Norway spruce forests in the Orlické hory Mts. (Czech Republic), 1979–2014. Eur. J. For. Res. 2015, 134, 1127–1142. [Google Scholar] [CrossRef]
  107. Andreassen, K.; Solberg, S.; Tveito, O.E.; Lystad, S.L. Regional differences in climatic responses of Norway spruce (Picea abies L. Karst) growth in Norway. For. Ecol. Manag. 2006, 222, 211–221. [Google Scholar] [CrossRef]
  108. Hauck, M.; Zimmermann, J.; Jacob, M.; Dulamsuren, C.; Bade, C.; Ahrends, B.; Leuschner, C. Rapid recovery of stem increment in Norway spruce at reduced SO2 levels in the Harz Mountains, Germany. Environ. Pollut. 2012, 164, 132–141. [Google Scholar] [CrossRef]
  109. Mäkinen, H.; Nöjd, P.; Kahle, H.P.; Neumann, U.; Tveite, B.; Mielikäinen, K.; Röhle, H.; Spiecker, H. Radial growth variation of Norway spruce (Picea abies (L.) Karst.) across latitudinal and altitudinal gradients in central and northern Europe. For. Ecol. Manag. 2002, 171, 243–259. [Google Scholar] [CrossRef]
  110. Putalová, T.; Vacek, Z.; Vacek, S.; Štefančík, I.; Bulušek, D.; Král, J. Tree-ring widths as an indicator of air pollution stress and climate conditions in different Norway spruce forest stands in the Krkonoše Mts. Cent. Eur. For. J. 2019, 65, 21–33. [Google Scholar]
  111. Kolář, T.; Čermák, P.; Oulehle, F.; Trnka, M.; Štěpánek, P.; Cudlín, P.; Hruška, J.; Büntgen, U.; Rybníček, M. Pollution control enhanced spruce growth in the “Black Triangle” near the Czech-Polish border. Sci. Total Environ. 2015, 538, 703–711. [Google Scholar] [CrossRef]
  112. Vacek, Z.; Vacek, S.; Bulušek, D.; Podrázský, V.; Remeš, J.; Král, J.; Putalová, T. Effect of fungal pathogens and climatic factors on production, biodiversity and health status of ash mountain forests. Dendrobiology 2017, 77, 161–175. [Google Scholar] [CrossRef]
  113. Mäkinen, H.; Nöjd, P.; Mielikäinen, K. Climatic signal in annual growth variation in damaged and healthy stands of Norway spruce [Picea abies (L.) Karst.] in southern Finland. Trees Struct. Funct. 2001, 15, 177–185. [Google Scholar] [CrossRef]
  114. Bradshaw, R.H.W.; Cowling, S.A.; Sykes, M.T. The effects of climate change on the distribution and management of Picea abies in Southern Scandinavia. Can. J. For. Res. 2000, 30, 1992–1998. [Google Scholar] [CrossRef]
  115. Allen, C.D.; Macalady, A.K.; Chenchouni, H.; Bachelet, D.; McDowell, N.; Vennetier, M.; Kitzberger, T.; Gigling, A.; Breshears, D.D.; Hogg, E.H.; et al. A global overview of drought and heat-induced tree mortality reveals emerging climate change risks for forests. For. Ecol. Manag. 2010, 259, 660–684. [Google Scholar] [CrossRef]
  116. Eastaugh, C.S.; Pötzelsberger, E.; Hasenauer, H. Assessing the impacts of climate change and nitrogen deposition on Norway spruce (Picea abies L. Karst) growth in Austria with BIOME-BGC. Tree Physiol. 2011, 31, 262–274. [Google Scholar] [CrossRef]
  117. Lindner, M.; Fitzgerald, J.B.; Zimmermann, N.E.; Reyer, C.; Delzon, S.; van der Maaten, E.; Schelhaas, M.J.; Lasch, P.; Eggers, J.; van der Maaten-Theunissen, M.; et al. Climate change and European forests: What do we know, what are the uncertainties, and what are the implications for forest management? J. Environ. Manag. 2014, 146, 69–83. [Google Scholar] [CrossRef]
  118. Lindner, M.; Maroschek, M.; Netherer, S.; Kremer, A.; Barbati, A.; Garcia-Gonzalo, J.; Seidl, R.; Delzon, S.; Corona, P.; Kolström, M.; et al. Climate change impacts, adaptive capacity, and vulnerability of European forest ecosystems. For. Ecol. Manag. 2010, 259, 698–709. [Google Scholar] [CrossRef]
  119. Schlyter, P.; Stjernquist, I.; Bärring, L.; Jönsson, A.M.; Nilsson, C. Assessment of the impacts of climate change and weather extremes on boreal forests in northern Europe, focusing on Norway spruce. Clim. Res. 2006, 31, 75–84. [Google Scholar] [CrossRef] [Green Version]
  120. Hlásny, T.; Barka, I.; Roessiger, J.; Kulla, L.; Trombik, J.; Sarvašová, Z.; Bucha, T.; Kovalčík, M.; Čihák, T. Conversion of Norway spruce forests in the face of climate change: A case study in Central Europe. Eur. J. For. Res. 2017, 136, 1013–1028. [Google Scholar] [CrossRef]
  121. Brázdil, R.; Stucki, P.; Szabó, P.; Řezníčková, L.; Dolák, L.; Dobrovolný, P.; Tolasz, R.; Kotyza, O.; Chromá, K.; Suchánková, S. Windstorms and forest disturbances in the Czech Lands: 1801–2015. Agric. For. Meteorol. 2018, 250–251, 47–63. [Google Scholar] [CrossRef]
  122. Trnka, M.; Brázdil, R.; Možný, M.; Štěpánek, P.; Dobrovolný, P.; Zahradníček, P.; Balek, J.; Semerádová, D.; Dumbrovský, M.; Hlavinka, P.; et al. Soil moisture trends in the Czech Republic between 1961 and 2012. Int. J. Climatol. 2015, 35, 3733–3747. [Google Scholar] [CrossRef]
  123. Hanewinkel, M.; Cullmann, D.A.; Schelhass, M.-J.; Nabuurs, G.-J.; Zimmermann, N.E. Climate change may cause severe loss in the economic value of European forest land. Nat. Clim. Chang. 2012, 3, 203–207. [Google Scholar] [CrossRef]
  124. Neuner, S.; Albrecht, A.; Cullmann, D.; Engels, F.; Griess, V.C.; Hahn, W.A.; Hanewinkel, M.; Härtl, F.; Kölling, C.; Staupendahl, K.; et al. Survival of Norway spruce remains higher in mixed stands under a dryer and warmer climate. Glob. Chang. Biol. 2015, 21, 935–946. [Google Scholar] [CrossRef]
Figure 1. Localization of permanent research plots established in Norway spruce stands in the hunting districts of Horní Kozolupy (LD plots) and Rochlov (HD plots) in the Západočeská Upland area and monthly climatic characteristics (mean temperature and sum of precipitation between 1961 and 2017). Wider areas of interest are marked by (▲) symbols. The grey layer in the map symbolizes forest areas in the Czech Republic.
Forests 10 00320 g001
Figure 2. The relationship between diameter at breast height (DBH) and tree height of healthy spruce trees (parameter a = 1.00, and b = 0.18), trees with small damage (parameter a = 0.46, and b = 0.22), and trees with high game damage (parameter a = 1.09, and b = 0.18).
Forests 10 00320 g002
Figure 3. The relationship between crown diameter and DBH for healthy trees and trees with high damage. The bold lines represent linear regression functions (presented in relevant color).
Forests 10 00320 g003
Figure 4. Standardized annual tree-ring increments of Norway spruce after removing the age trend (ring width index) and relevant smoothing splines (8- and 32-year spline).
Forests 10 00320 g004
Figure 5. Testing the differences in mean DBH, mean height, and mean stem volume between selected levels of stem girth damage. The Kruskal–Wallis test with relevant multiple comparisons was used; selected level of significance was α = 0.05. Indices above bars depict statistically significant differences between variants (different letters indicate significantly different variants). Error bars depict 95% confidence interval.
Forests 10 00320 g005
Figure 6. Graphical representation of the generalized linear model for stem volume prediction based on DBH and stem circumference damage (A) and the differences between separate models for LD and HD plots (B).
Forests 10 00320 g006
Figure 7. Ordination diagram showing results of Principal Component Analysis (PCA) for the relationships among production parameters of stand (mean DBH, mean Height, Basal area, Volume, Stocking SDI, Canopy Crown projection area), diversity (A Arten-profile index, R aggregation index, TMd diameter differentiation index; TMh height differentiation index, B total diversity index), and game damage (Damage). Plot symbols: ● plot with low game damage (LD plot), and ▼ plot with high game damage (HD plot). Numbers: 1–16—plot ID, and I.–IV.—locality.
Forests 10 00320 g007
Table 1. Overview of indices describing the biodiversity and their common interpretation.
CriterionQuantifiersLabelReferenceEvaluation
Horizontal structureAggregation indexR[64]mean value R = 1;
aggregation R < 1;
regularity R > 1
Vertical diversityArten-Profile indexA[61]range 0–1;
balanced vertical structure A < 0.3;
selection forest A > 0.9
Structure differentiationDiameter dif.TM[62]range 0–1;
low TM < 0.3;
very high differentiation TM > 0.7
Height dif.TMh
Crown dif.K[63]low K < 1;
very high differentiation K > 3
Complex diversityStand diversityB[63]monotonous structure B < 4;
uneven structure B = 6–8;
very diverse structure B > 9
Table 2. Stand characteristics of the tree layer on permanent research plots 1–16 in 2017 (LD—plots with low game damage; and HD—plots with high game damage).
PRPAgeDBH ± SDHeight ± SDStem Volume ± SDNumber of TreesBasal AreaStand VolumeHDRMAICCCPASDI
ycmmm3Trees ha−1m2 ha–1m3 ha–1 m3 ha–1 y−1%ha
1LD4320.9 ± 3.920.30 ± 2.430.304 ± 0.154120041.036597.18.581.11.670.74
2LD4326.3 ± 7.6.21.47 ± 2.020.492 ± 0.378110059.254181.612.693.92.800.98
3LD4323.8 ± 4.023.56 ± 1.460.446 ± 0.184130057.558099.013.585.41.920.98
4LD4316.8 ± 3.218.33 ± 1.350.179 ± 0.077190042.1341109.17.984.61.870.84
5LD4317.3 ± 2.719.22 ± 1.540.201 ± 0.085180042.5363111.18.478.61.540.82
6LD4317.6 ± 3.717.24 ± 2.150.186 ± 0.088170041.131698.07.378.91.560.81
7LD4318.1 ± 3.219.97 ± 1.600.227 ± 0.095190048.6430110.310.077.31.480.93
8LD4319.4 ± 4.020.49 ± 2.030.267 ± 0.153220064.7588105.613.782.31.730.99
9HD4114.7 ± 2.715.76 ± 1.880.117 ± 0.048140023.7164107.24.077.61.500.49
10HD4117.1 ± 4.917.25 ± 3.160.185 ± 0.159130029.8240100.95.980.01.620.58
11HD4117.8 ± 3.117.40 ± 2.230.187 ± 0.080150037.128097.86.881.31.680.73
12HD4117.2 ± 3.617.44 ± 2.280.180 ± 0.093180041.9323101.47.980.61.640.81
13HD4319.5 ± 5.017.92 ± 1.790.232 ± 0.146150044.634891.98.192.62.610.83
14HD4318.0 ± 4.717.80 ± 1.670.200 ± 0.143200051.040098.99.391.52.460.97
15HD4317.3 ± 3.719.09 ± 1.910.199 ± 0.110160037.4318110.37.483.61.810.73
16HD4318.3 ± 3.517.60 ± 2.610.205 ± 0.117120031.424696.25.778.41.530.60
Notes: SD: standard deviation, DBH: mean breast height diameter, HDR: height-diameter ratio (slenderness ratio), MAI: mean annual increment, CC: canopy closure, CPA: crown projection area, and SDI: stand density index.
Table 3. Diversity indices of tree layers on permanent research plots 1–16 in 2017 (LD—plots with low game damage; HD—plots with high game damage).
PRPRATMdTMhKB
1LD1.1530.4940.2060.1670.6392.213
2LD1.0230.4500.1710.0630.6322.065
3LD1.2190.1030.1590.0840.7541.952
4LD1.1730.2130.2020.0710.6222.811
5LD1.1730.2130.2020.0710.6222.811
6LD1.1730.2130.2020.0710.6222.811
7LD1.362 *0.3110.1600.0750.5432.019
8LD1.1700.4480.1660.0890.6072.680
9HD1.1430.5540.1670.1270.7912.413
10HD1.1380.6280.2640.1700.7282.813
11HD1.2330.6270.1080.1070.6973.041
12HD1.2460.5010.2180.0790.7262.334
13HD1.1870.3690.2220.0980.8121.976
14HD1.328 *0.3740.2250.0851.0022.074
15HD1.340 *0.2180.1860.1000.7762.201
16HD1.2900.3910.1930.1200.5582.314
Notes: R: aggregation index, A: Arten-Profile index, TMd: diameter differentiation index, TMh: height differentiation index, K: crown differentiation index, B: stand diversity index; * statistically significant (α = 0.05) result for horizontal structure (R index).
Table 4. Results of used generalized linear model. Provided p-values were related to the null hypotheses with the respective parameter equal to zero.
Generalized Linear Model (Gamma Distribution)Link Function: Inverse Value
Explanatory VariableValuep-Value
Constant7.643<0.001
DBH−0.018<0.001
Circumference damage0.036<0.001
Null deviance92.0
Residual deviance32.6

