Article

Chloroplast Genomes and Comparative Analyses among Thirteen Taxa within Myrsinaceae s.str. Clade (Myrsinoideae, Primulaceae)

1
College of Life Sciences, South China Agricultural University, Guangzhou 510642, China
2
Key Laboratory of Plant Resources Conservation and Sustainable Utilization, South China Botanical Garden, Chinese Academy of Sciences, Guangzhou 510650, China
3
Center of Plant Ecology, Core Botanical Gardens, Chinese Academy of Sciences, Guangzhou 510650, China
*
Authors to whom correspondence should be addressed.
Int. J. Mol. Sci. 2019, 20(18), 4534; https://0-doi-org.brum.beds.ac.uk/10.3390/ijms20184534
Submission received: 21 July 2019 / Revised: 2 September 2019 / Accepted: 10 September 2019 / Published: 13 September 2019
(This article belongs to the Special Issue Chloroplast 2.0)

Abstract

:
The Myrsinaceae s.str. clade is a tropical woody representative in Myrsinoideae of Primulaceae and has ca. 1300 species. The generic limits and alignments of this clade are unclear due to the limited number of genetic markers and/or taxon samplings in previous studies. Here, the chloroplast (cp) genomes of 13 taxa within the Myrsinaceae s.str. clade are sequenced and characterized. These cp genomes are typical quadripartite circle molecules and are highly conserved in size and gene content. Three pseudogenes are identified, of which ycf15 is totally absent from five taxa. Noncoding and large single copy region (LSC) exhibit higher levels of nucleotide diversity (Pi) than other regions. A total of ten hotspot fragments and 796 chloroplast simple sequence repeats (SSR) loci are found across all cp genomes. The results of phylogenetic analysis support the notion that the monophyletic Myrsinaceae s.str. clade has two subclades. Non-synonymous substitution rates (dN) are higher in housekeeping (HK) genes than photosynthetic (PS) genes, but both groups have a nearly identical synonymous substitution rate (dS). The results indicate that the PS genes are under stronger functional constraints compared with the HK genes. Overall, the study provides hypervariable molecular markers for phylogenetic reconstruction and contributes to a better understanding of plastid gene evolution in Myrsinaceae s.str. clade.

1. Introduction

According to the present circumscription, Primulaceae s.l. comprises Primuloideae, Myrsinoideae, Theophrastoideae, and Maesoideae [1,2]. In Myrsinoideae, there are ca. 1500 species in 49 genera [3], and previous molecular phylogenetic studies classified these species into five clades: Myrsinaceae s.str. (includes Aegiceras Gaertn. but not Maesa Forssk.), tribe Lysimachieae, Cyclamen L., Ardisiandra Hook. f., and Coris L. [3,4]. Most temperate genera in the Myrsinoideae subfamily are perennial herbs, whereas the woody genera are mainly tropical [3]. The Myrsinaceae s.str. clade is a tropical woody representative in Myrsinoideae—which contains only a few herbaceous taxa, such as several species in Labisia Lindl. and Ardisia subg. Bladhia (Thunb.) Mez—and shows high species diversity (ca. 1300 species).
In contrast to the well-studied herbaceous clade (such as Lysimachieae [5,6,7,8] or Cyclamen [9]), the generic limits and alignments in the woody clade (i.e., Myrsinaceae s.str. clade) are rather unclear [3,10]. The phylogenetic uncertainties within the woody clade are most likely due to the limited number of genetic markers and/or insufficient taxon sampling. To date, only eleven genera within the woody clade (which contains 39 genera in total [3]) have been sparsely sampled, and very few plastid molecular markers (such as rbcL, trnL-F, accD, rpoB, matK, and psbA-trnH) and nuclear ribosomal DNA (Internal transcribed spacer region of nuclear ribosomal DNA, ITS) were employed by previous studies [9,10,11]. Thus, it is necessary to strengthen the genomic basis of this clade for phylogenetic analyses and biodiversity inventory.
Chloroplast (cp) markers such as rbcL, matK, and trnL-trnF have been widely used in phylogenetic studies [12,13] as well as the phylogeography [14,15] and the identification of plant species [16,17] owing to their high copy numbers within a cell, uniparental inheritance feature, and moderate evolutionary rate. However, the limited number of chloroplast markers has prevented us from resolving the phylogenetic relationships among closely related taxa and plant groups that have undergone rapid radiations [18,19].
Compared with traditional cp markers, complete cp genome sequences can improve phylogenetic resolution and have been successfully used to infer phylogenetic relationships among taxa [12,20,21,22]. Cp genome is also an ideal candidate for high-throughput sequencing and assembly due to its small size, conserved sequence and structure, and high cellular copy number [23]. Therefore, the number of complete cp genomes has rocketed in the recent years with the advancement of high-throughput DNA sequencing technologies [24].
Until now, only two cp genomes (Ardisia polysticta Miq. and Ardisia crenata Sims) of the Myrsinaceae s.str. clade were available within GenBank. The evolutionary patterns of the cp genomes within this clade are yet to be uncovered. Therefore, this study aims to (1) sequence, assemble, and characterize the cp genomes of the 13 woody taxa within clade Myrsinaceae s.str., and (2) probe into the evolutionary patterns of the cp genomes within this clade by estimating substitution rates of protein-coding genes.

2. Results and Discussion

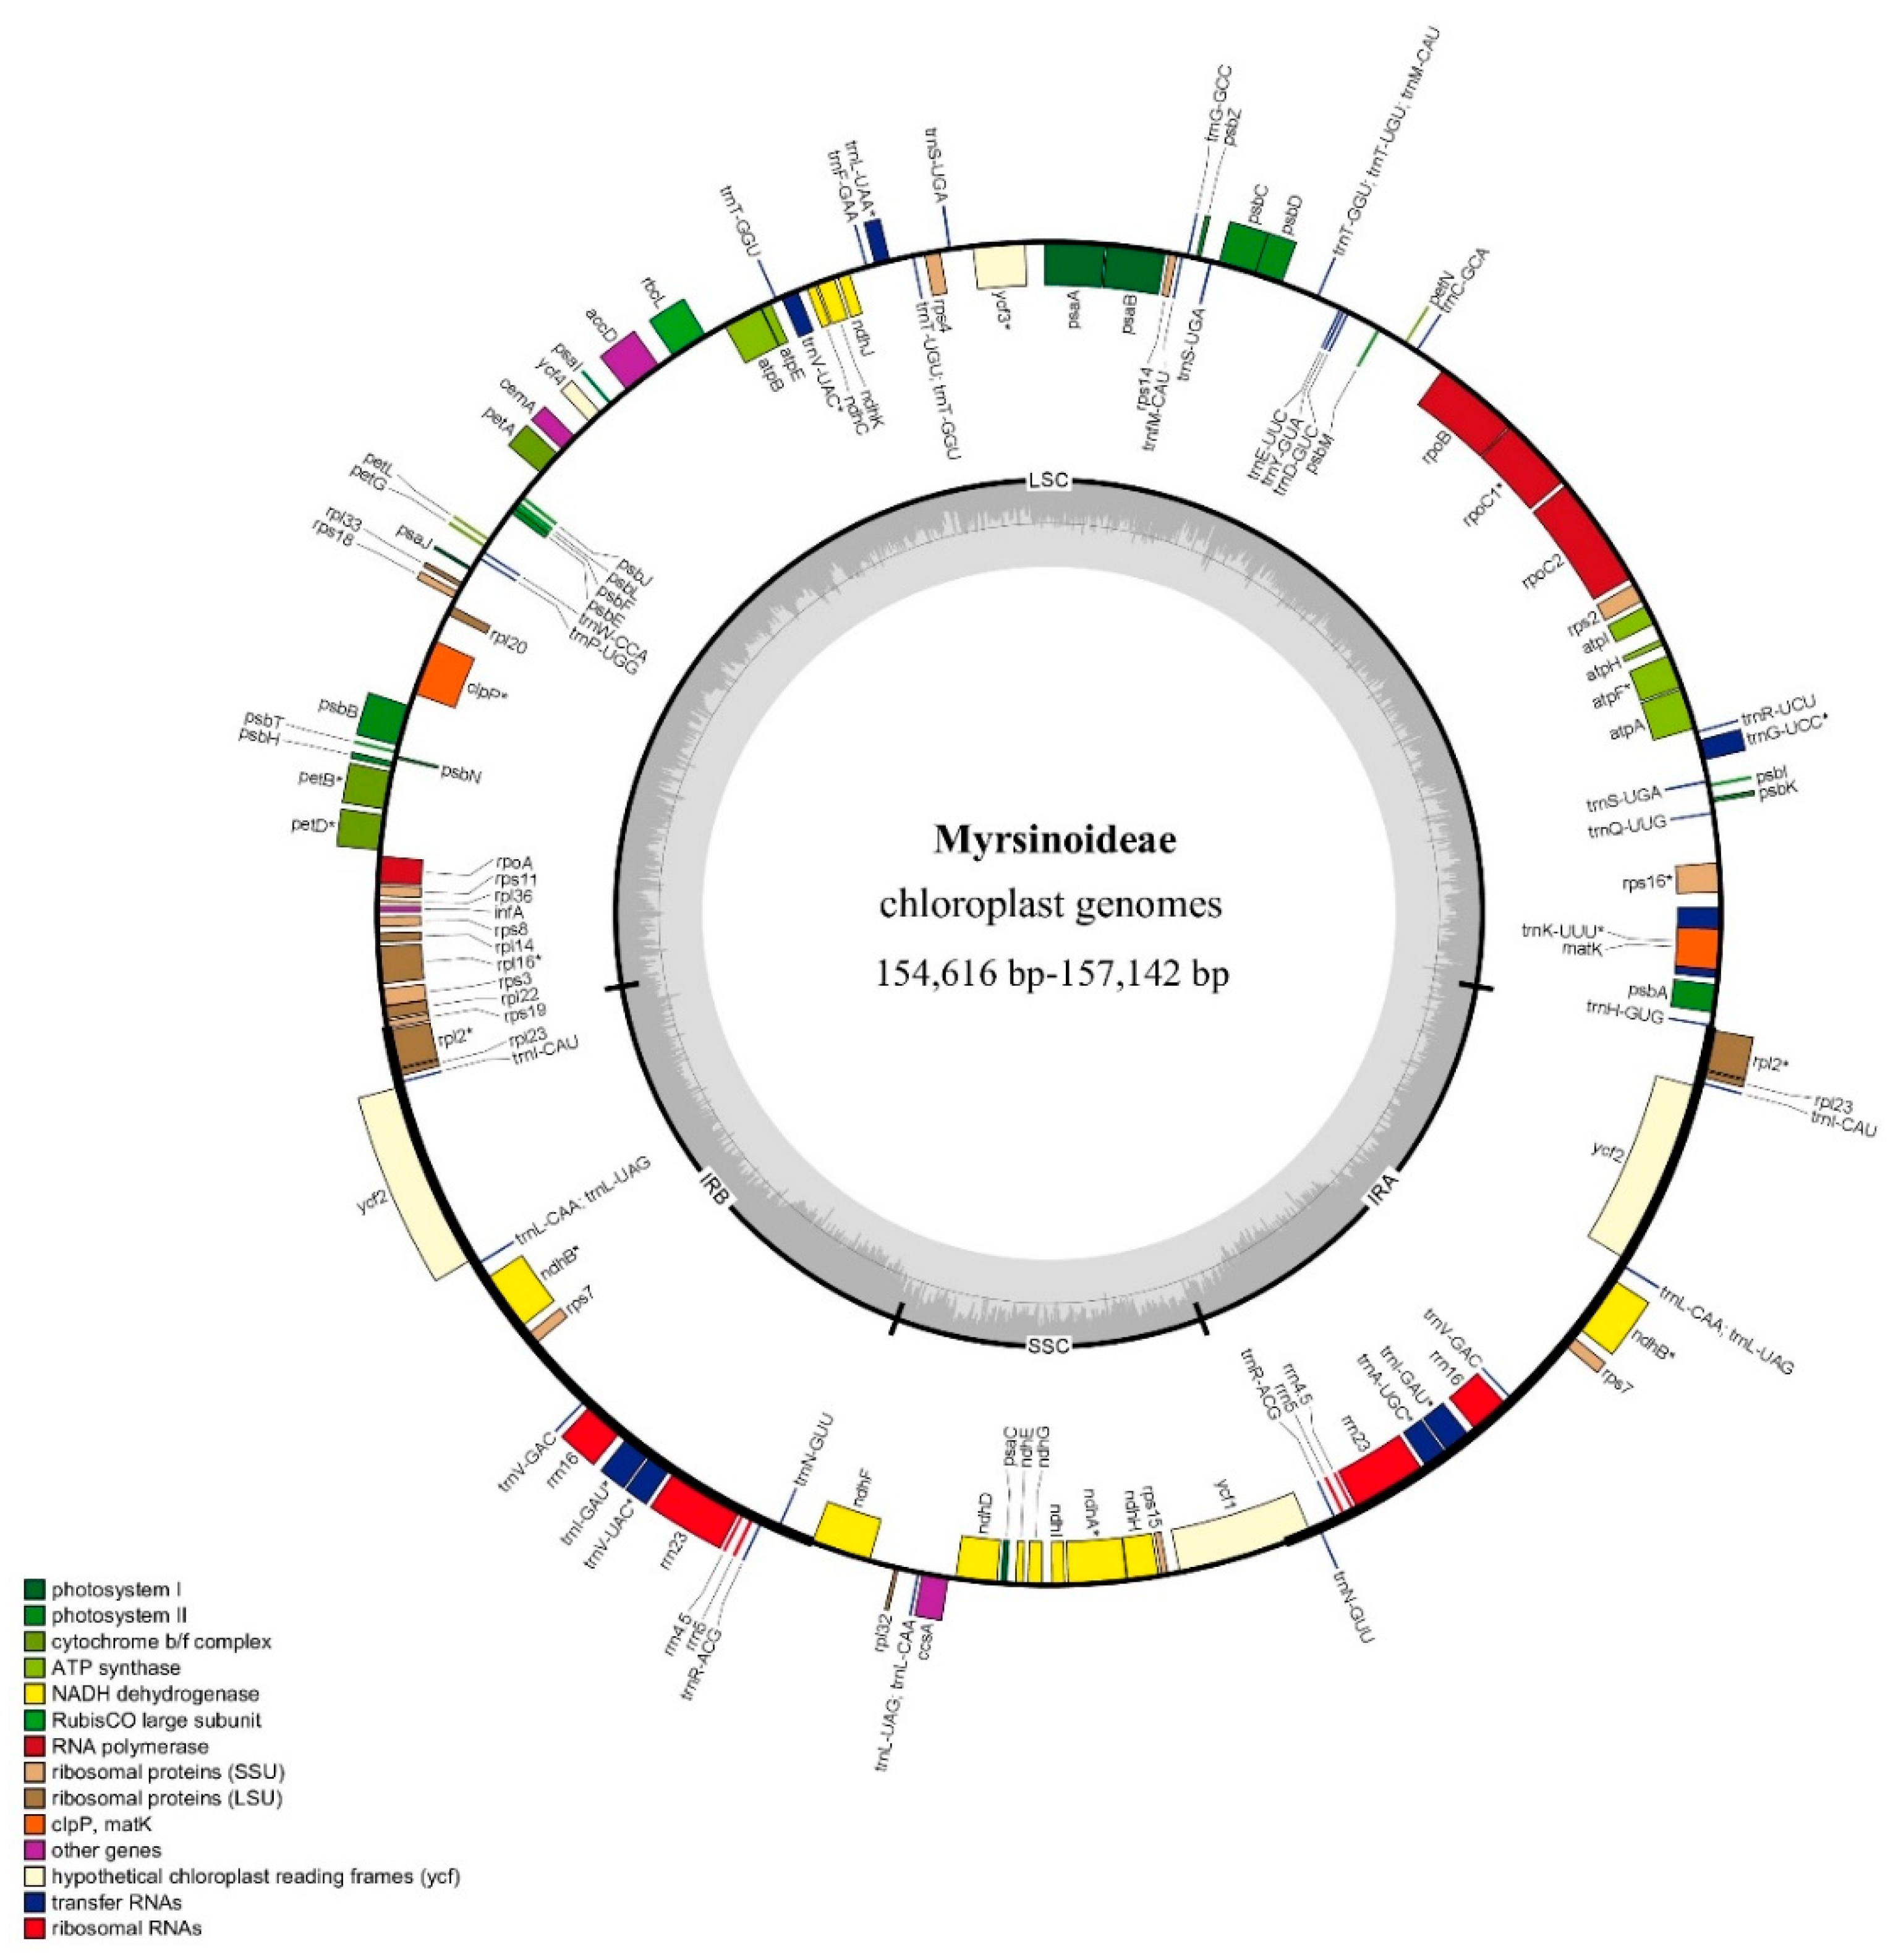
2.1. Chloroplast Genomes Features

The cp genome sizes of the 13 taxa range from 154,616 bp (Tapeinosperma netor Guillaumin) to 157,241 bp [Aegiceras corniculatum (L.) Blanco) (Figure 1; Table 1]. All cp genomes are typical quadripartite circle molecules consisting of a pair of inverted repeat regions (IRs) ranging from 26,196 bp [Ardisia solanacea (Poir.) Roxb.] to 25,538 bp [Tapeinosperma multiflorum (Gillespie) A.C. Sm.] separated by a large single copy region (LSC) ranging from 87,057 bp (Ae. corniculatum) to 85,683 bp (T. netor) and a small single copy region (SSC) varying from 18,440 bp (Parathesis donnell-smithii Mez) to 17,679 bp (T. netor). Boundaries of the LSC, the IR, and the SSC regions are shown in Figure 2. The rps19 and the ycf1 genes both reside at the boundary of the IR and the SC regions. Their truncated copies are found in each of the IR regions (Figure 2). Total GC content ranges from 36.9% [in Ae. coriniculatum, Embelia vestita Roxb., and Myrsine stolonifera (Koidz.) E. Walker] to 37.1% (in Ar. solanacea and T. netor) (Table 1). The GC content of the IR regions—varying from 42.9% (in Ae. coriniculatum, Em. vestita, Myrsine sandwicensis A. DC.) to 43.2% (Ar. solanacea)—is higher than that of the LSC (about 34.8%) and the SSC (about 30.2%) regions (Table S1).
A total of 113–114 genes are identified from all thirteen cp genomes, among which 79–80 are protein-coding genes, 30 are tRNA genes, and four are rRNA genes. Five to six of the protein-coding genes, seven of the tRNA genes, and all four rRNA genes in the IR regions are duplicate genes. Sixteen genes (i.e., atpF, ndhA, ndhB, petB, petD, rpl16, rpl2, rpoC1, rps12, rps16, trnAUGC, trnCACA, trnEUUC, trnKUUU, trnLUAA, and trnSCGA) contain a single intron, and two genes (clpP and ycf3) have two introns. Cp genome features of the woody taxa of Primulaceae are comparable to those of their herbal counterparts, namely, Lysimachia [25] and Primula [26].
Gene loss or pseudogenization of protein-coding genes in plastomes are common in angiosperms [27,28]. In the present study, three genes (infA, accD, and ycf15) are inferred to be pseudogenes in some taxa within clade Myrsinaceae s.str. (Table S1), which reoccurs in many plant lineages [28]. In Primulaceae, accD and infA pseudogenization has been reported in Primula species [26]. Moreover, accD is completely absent from three Primula taxa—Primula kwangtungensis W.W.Sm., Primula persimilis G. Hao, C.M. Hu & Y. Xu, and Primula sinensis Sabine ex Lindl. [26,29]. In seed plants, the accD and the infA genes transfer from the chloroplast to the nucleus genome [27], which is likely associated with their pseudogenization under relaxed purifying selection in plastome.
The ycf15 gene, which displays a small open reading frame (ORF) in tobacco, has been pseudogenized in several angiosperm lineages (e.g., [30,31,32,33]). Some studies assumed that the ycf15 may have originated from a non-functional intergenic sequence [30,33]. We find that ycf15 is absent from five taxa, namely, Elingamita johnsonii G.T.S.Baylis, T. multiflorum, T. netor, Pa. donnell-smithii and Parathesis chiapensis Fernald, and has pseudogenized in the remaining taxa (Table S1). Based on the phylogenetic distribution of ycf15, we speculate that it may have lost several times in clade Myrsinaceae s.str. (Figure 3). To our knowledge, this is the first report of ycf15 gene loss in Primulaceae [25,26], though its underlying mechanisms remain unknown.

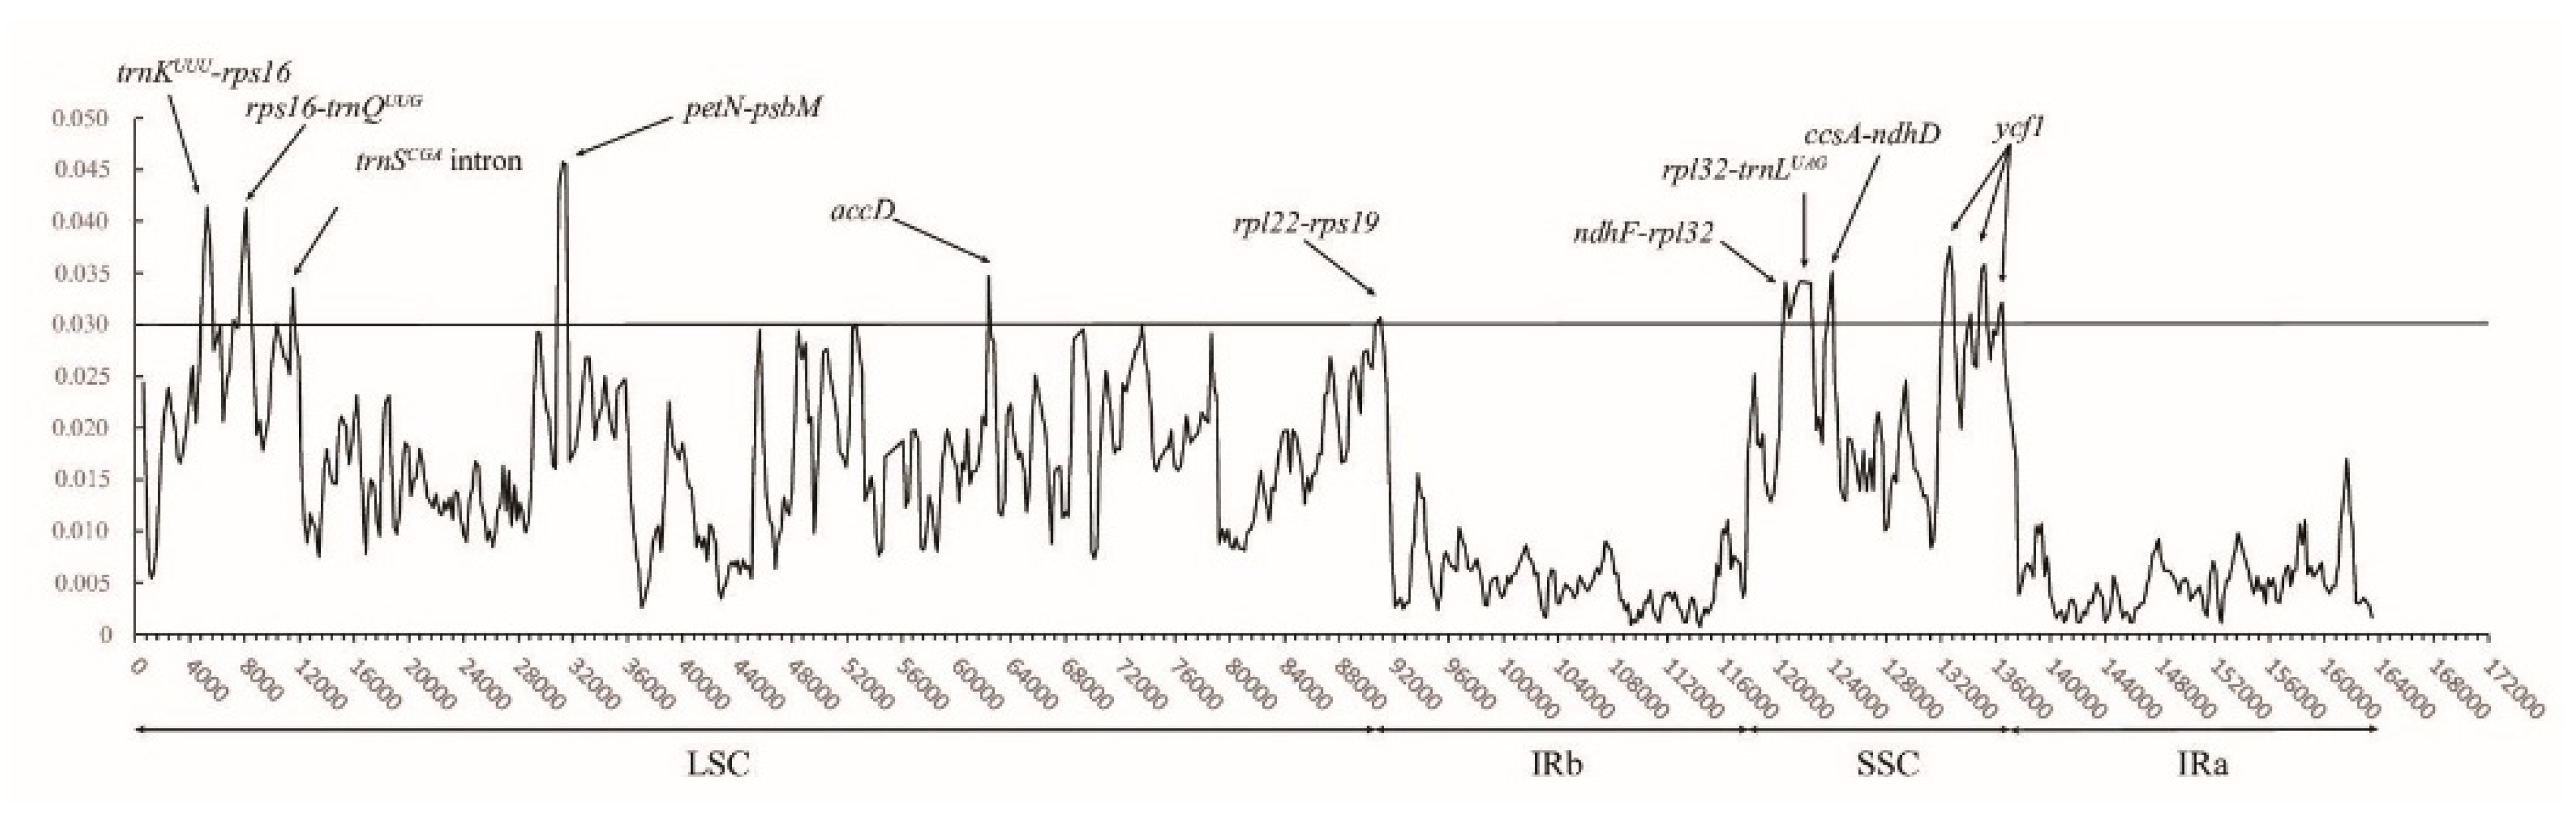
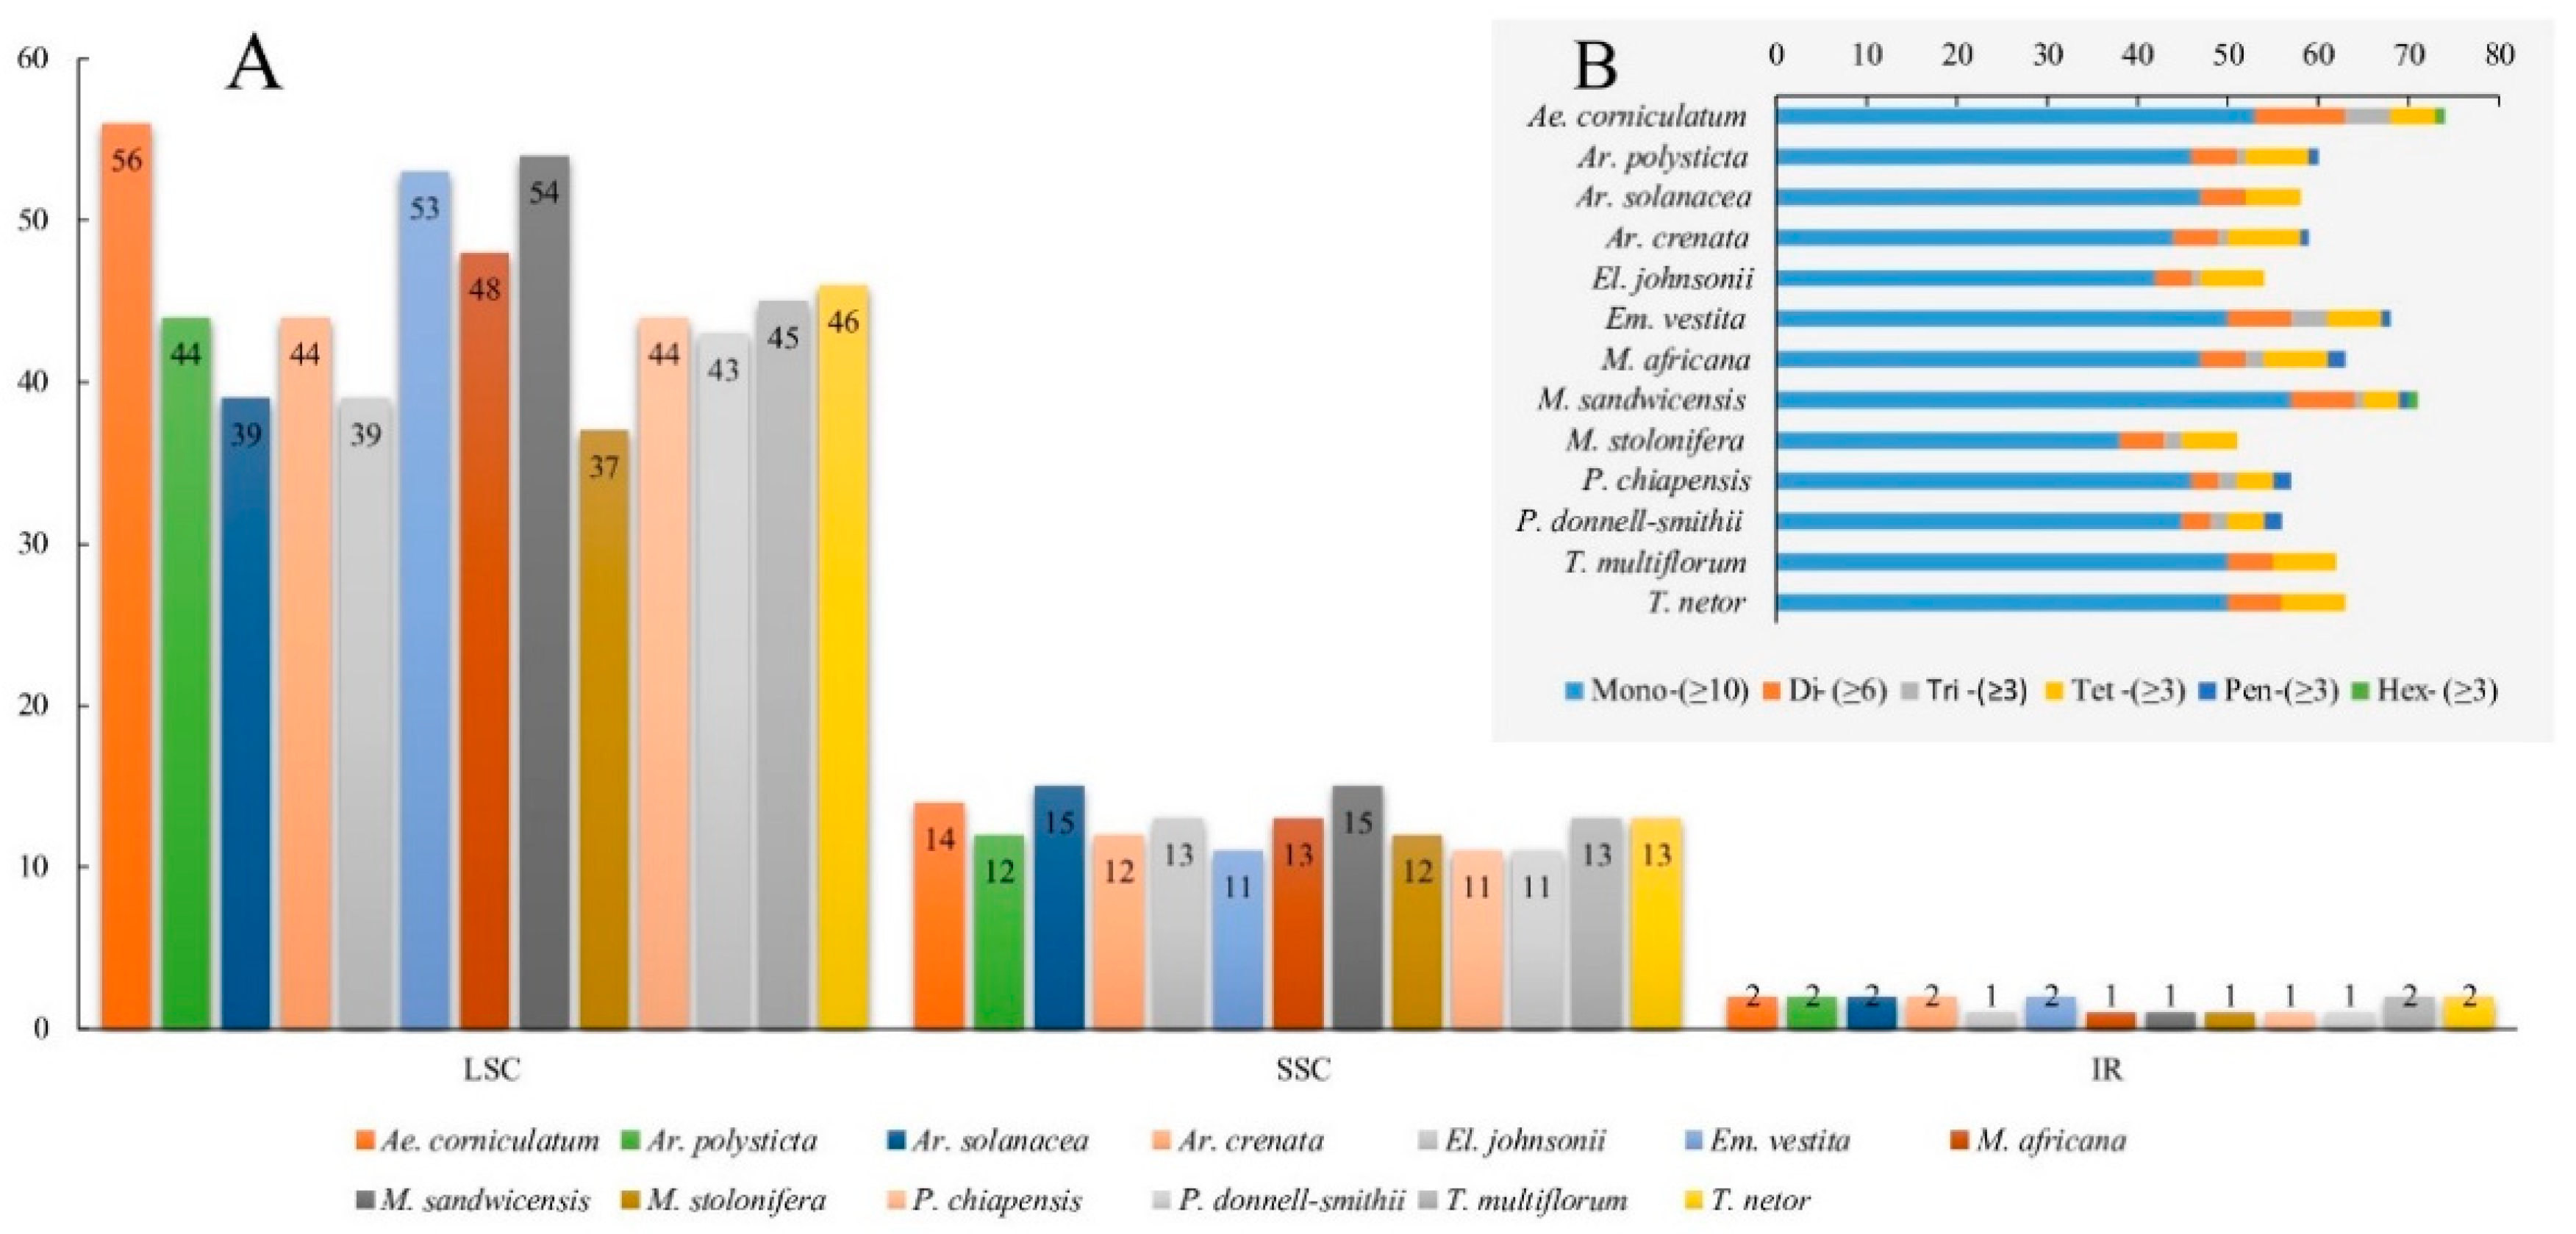
2.2. Hypervariable Regions and CpSSRs

The sequence identities of 13 cp genomes of the Myrsinaceae s.str. clade are plotted using mVISTA (Figure S1), which shows that these genomes are relatively conserved. Noncoding (intergenic spacers and introns) sequences and the LSC regions often exhibit higher nucleotide substitution rates than other regions in plastome [27]. In this study, a total of ten highly variable regions with Pi > 0.03 (i.e., trnKUUU-rps16, rps16-trnQUUG, trnSCGA intron, petN-psbM, accD, rpl22-rps19, ndhF-rpl32, rpl32-trnLUAG, ccsA-ndhD, and ycf1) are identified, among which the two most variable regions are petN-psbM (0.0457) and trnKUUU-rps16 (0.0414). As shown by Jansen and Ruhlman [27], all ten mutation hotspots are located in the SC regions, six of which are in the LSC region. In addition, the introns with Pi > 0.03 all reside in the LSC region.
The Pi values of the protein-coding genes vary from 0.0007 to 0.0375. Only two genes, accD and ycf1, exhibit high Pi values (>0.03). As in many other angiosperms lineages, ycf1 (5043–5610 bp in length) has two main divergence hotspots in clade Myrsinaceae s.str. (Figure 4) [34]. As a pseudogene in clade Myrsinaceae s.str., the relatively high nucleotide diversity of accD is presumably a result of relaxed selective pressure or the effects of Muller’s ratchet [35,36].
When compared with the results of Shaw et al. [37], the three hypervariable regions (rps16-trnQUUG, ndhF-rpl32, and rpl32-trnLUAG) identified here are among the highest-ranking variable regions in all 25 lineages of angiosperms. In addition, rbcL, trnL-F, accD, rpoB, matK, and psb-trnH were previously employed in the phylogenetic analyses of Myrsinoideae [9,10,11]. The highest Pi value is 0.0198 for rbcL, 0.0201 for trnL-F, 0.0346 for accD, 0.0163 for rpoB, 0.0239 for matK, and 0.0244 for psbA-trnH. Only accD is among the top ten variable regions for the Myrsinaceae s.str. clade in our study. Overall, these high variable cp regions detected here can be employed for constructing the phylogeny and the phylogeographic inferences of Myrsinoideae by future studies.
Simple sequence repeats (SSR) are useful markers for population genetic studies [38]. Chloroplast SSR markers (cpSSRs) have emerged as excellent tools in population genetics owing to their unique non-recombination and uniparental inheritance characteristics [39]. A total of 796 SSR loci with six types (i.e., mono-, di-, tri-, tetra-, penta-, and hexa-nucleotides) are identified in the 13 Myrsinaceae s.str. cp genomes. These cpSSRs are mainly located in the LSC region (74.37%), followed by the SSC (20.73%) and the IR (2.51%) regions (Figure 5). Among all cpSSRs identified in this study, most are mono-nucleotide repeats (77.26%), followed by tetr-nucleotide repeats (9.80%) and di-nucleotide repeats (8.80%) (Figure 5). Other types, namely, tri-nucleotide, penta-nucleotide, and hexa-nucleotide repeats, account for 2.64%, 1.26%, and 0.25% of all cpSSRs, respectively. In addition, seven cpSSR loci are shared across all 13 species in the Myrsinaceae s.str. clade (Table S2).

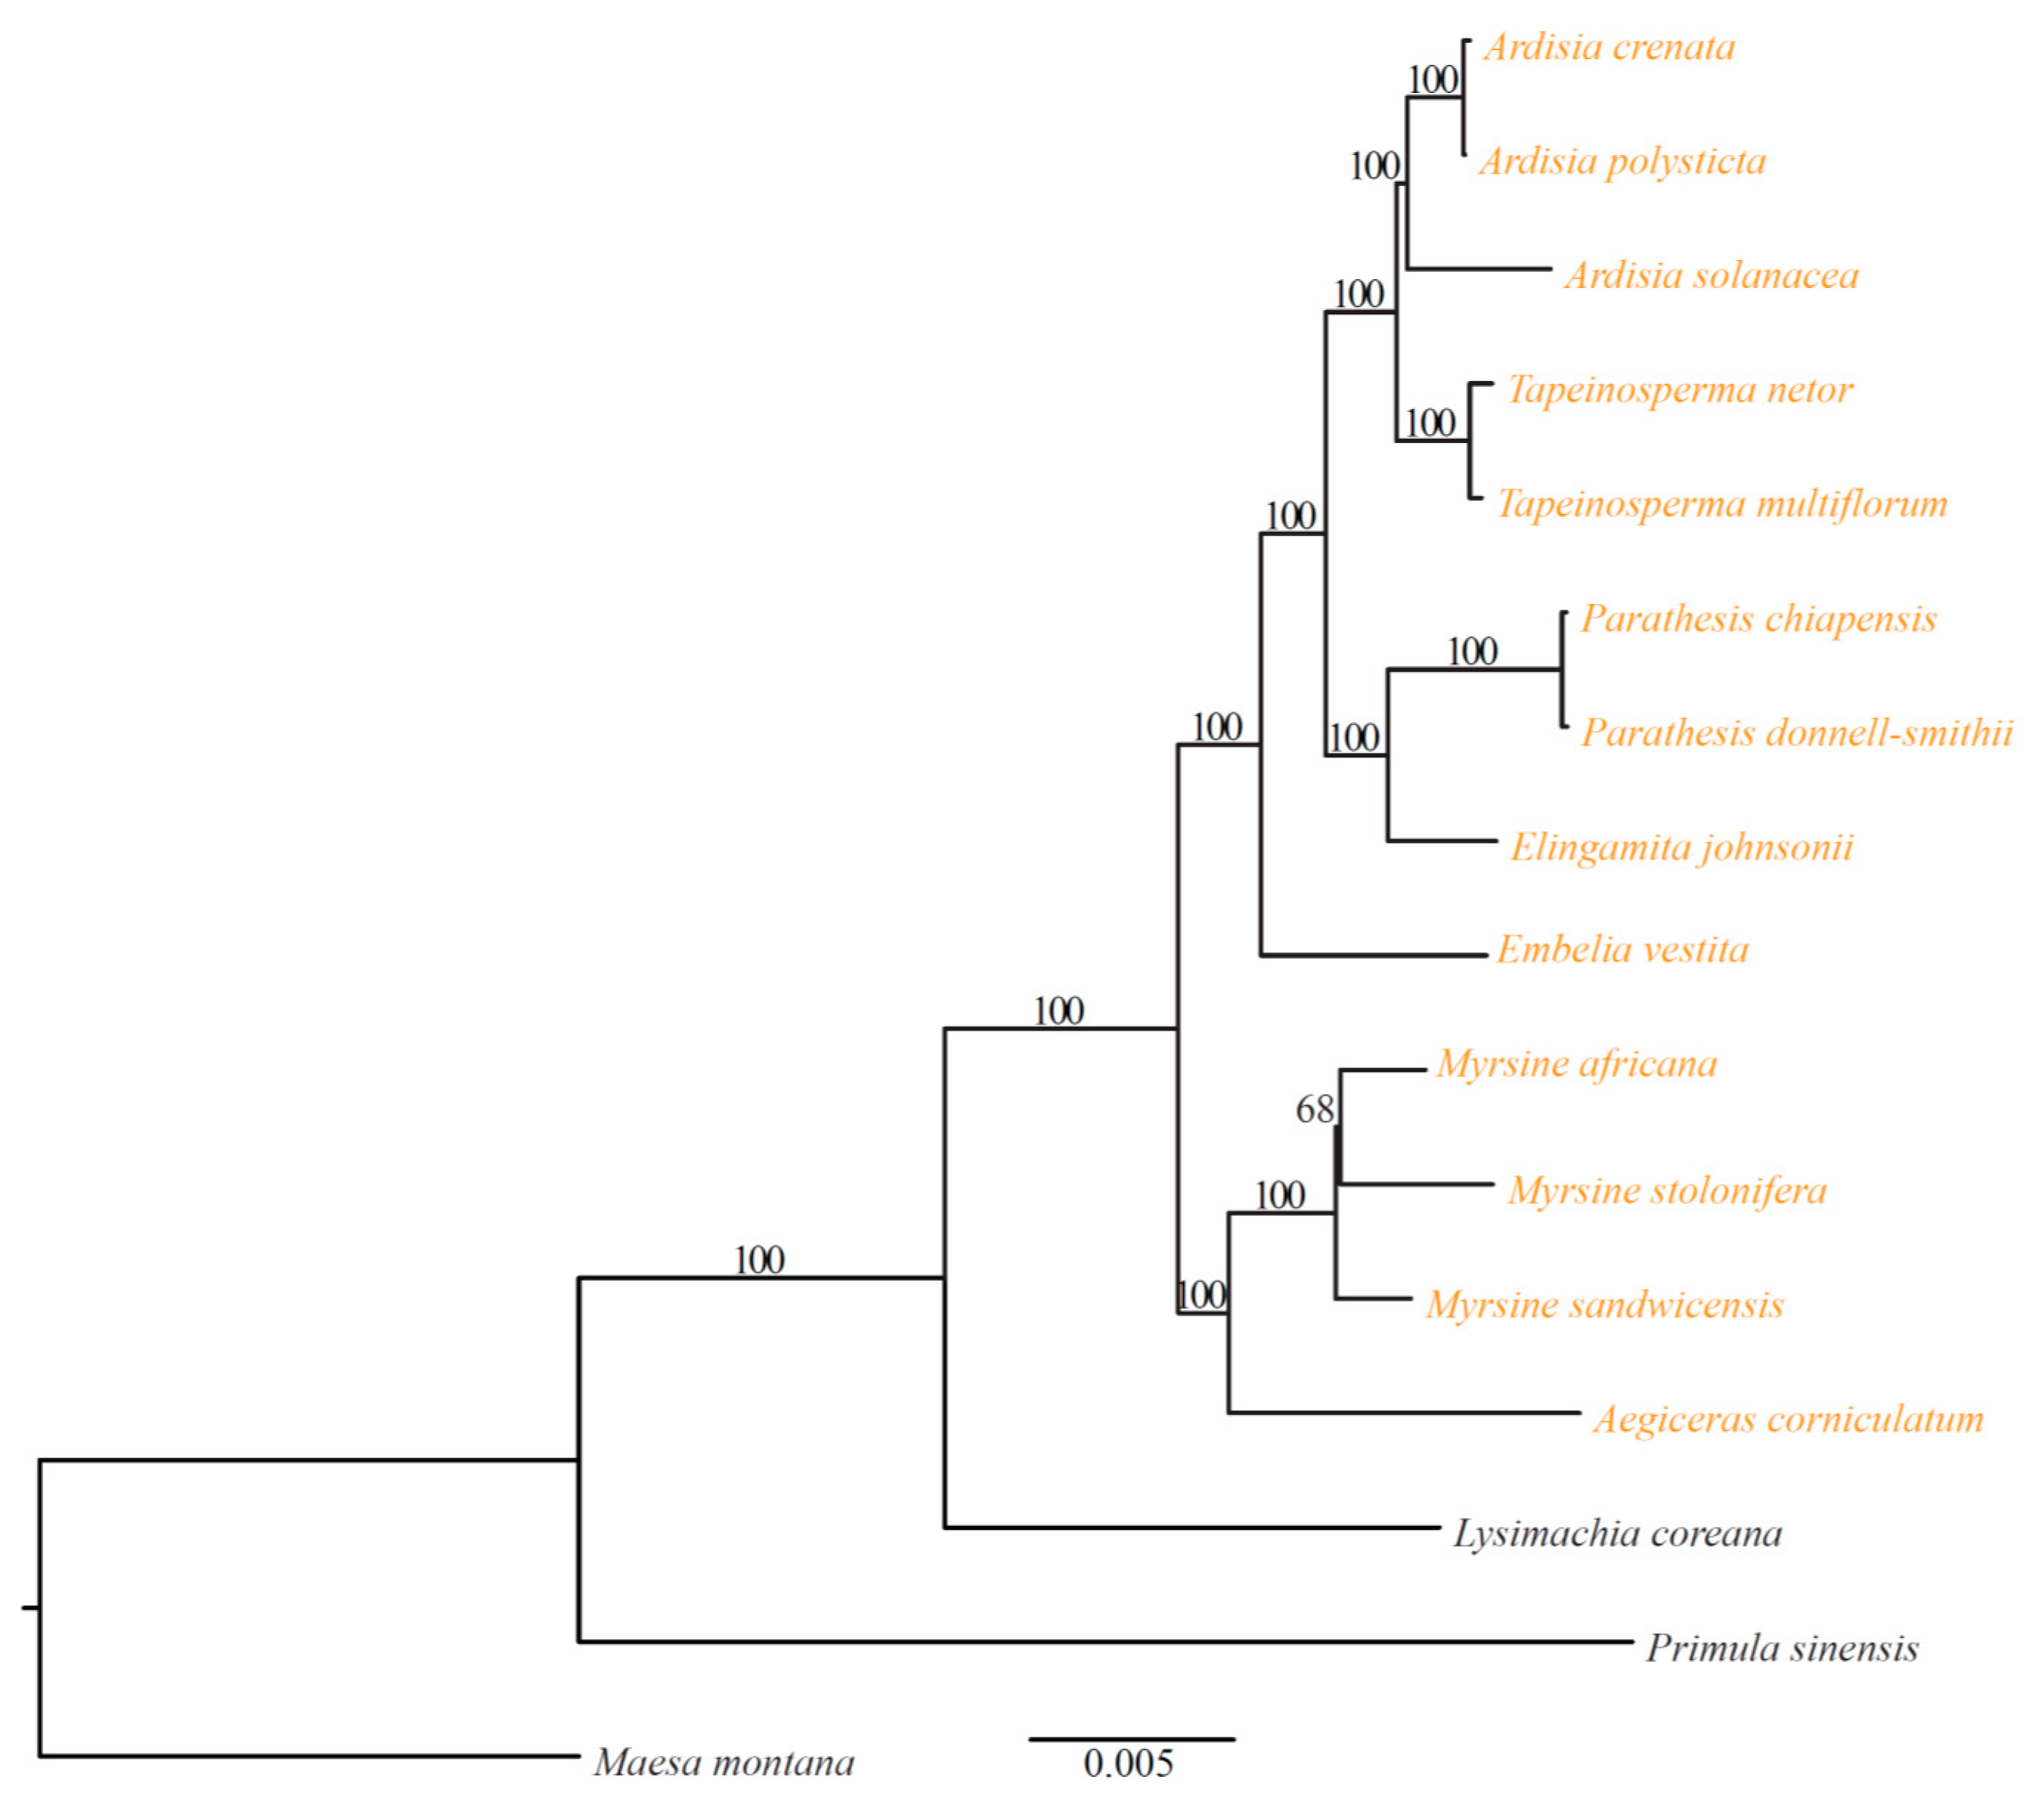
2.3. Phylogenetic Relationships

Clade Myrsinaceae s.str. contains ca. 39 genera and 1300 species and is the largest group of Primulaceae [3]. However, the generic limits and alignments of the Myrsinaceae s.str. clade are still unclear. In this study, phylogenetic analysis was performed based on 78 protein-coding genes (PCGs) in Myrsinoideae cp genomes using Lysimachia coreana Nakai, Pr. sinensis, and Maesa montana A. DC. as outgroups (Figure 3). Our phylogenetic results support the notion that clade Myrsinaceae s.str. is monophyletic and consists of two subclades. All Myrsine taxa and Ae. corniculatum cluster into the first subclade, and the remaining genera including Ardisia, Tapeinosperma, Parathesis, Elingamita and Embelia fall into the other clade (Figure 3). Almost all branches of the phylogenetic tree are strongly supported, as indicated by Figure 3. In addition, our results reveal that Aegiceras is closer to Myrsine but not to Ardisia and its allies (see [9]).

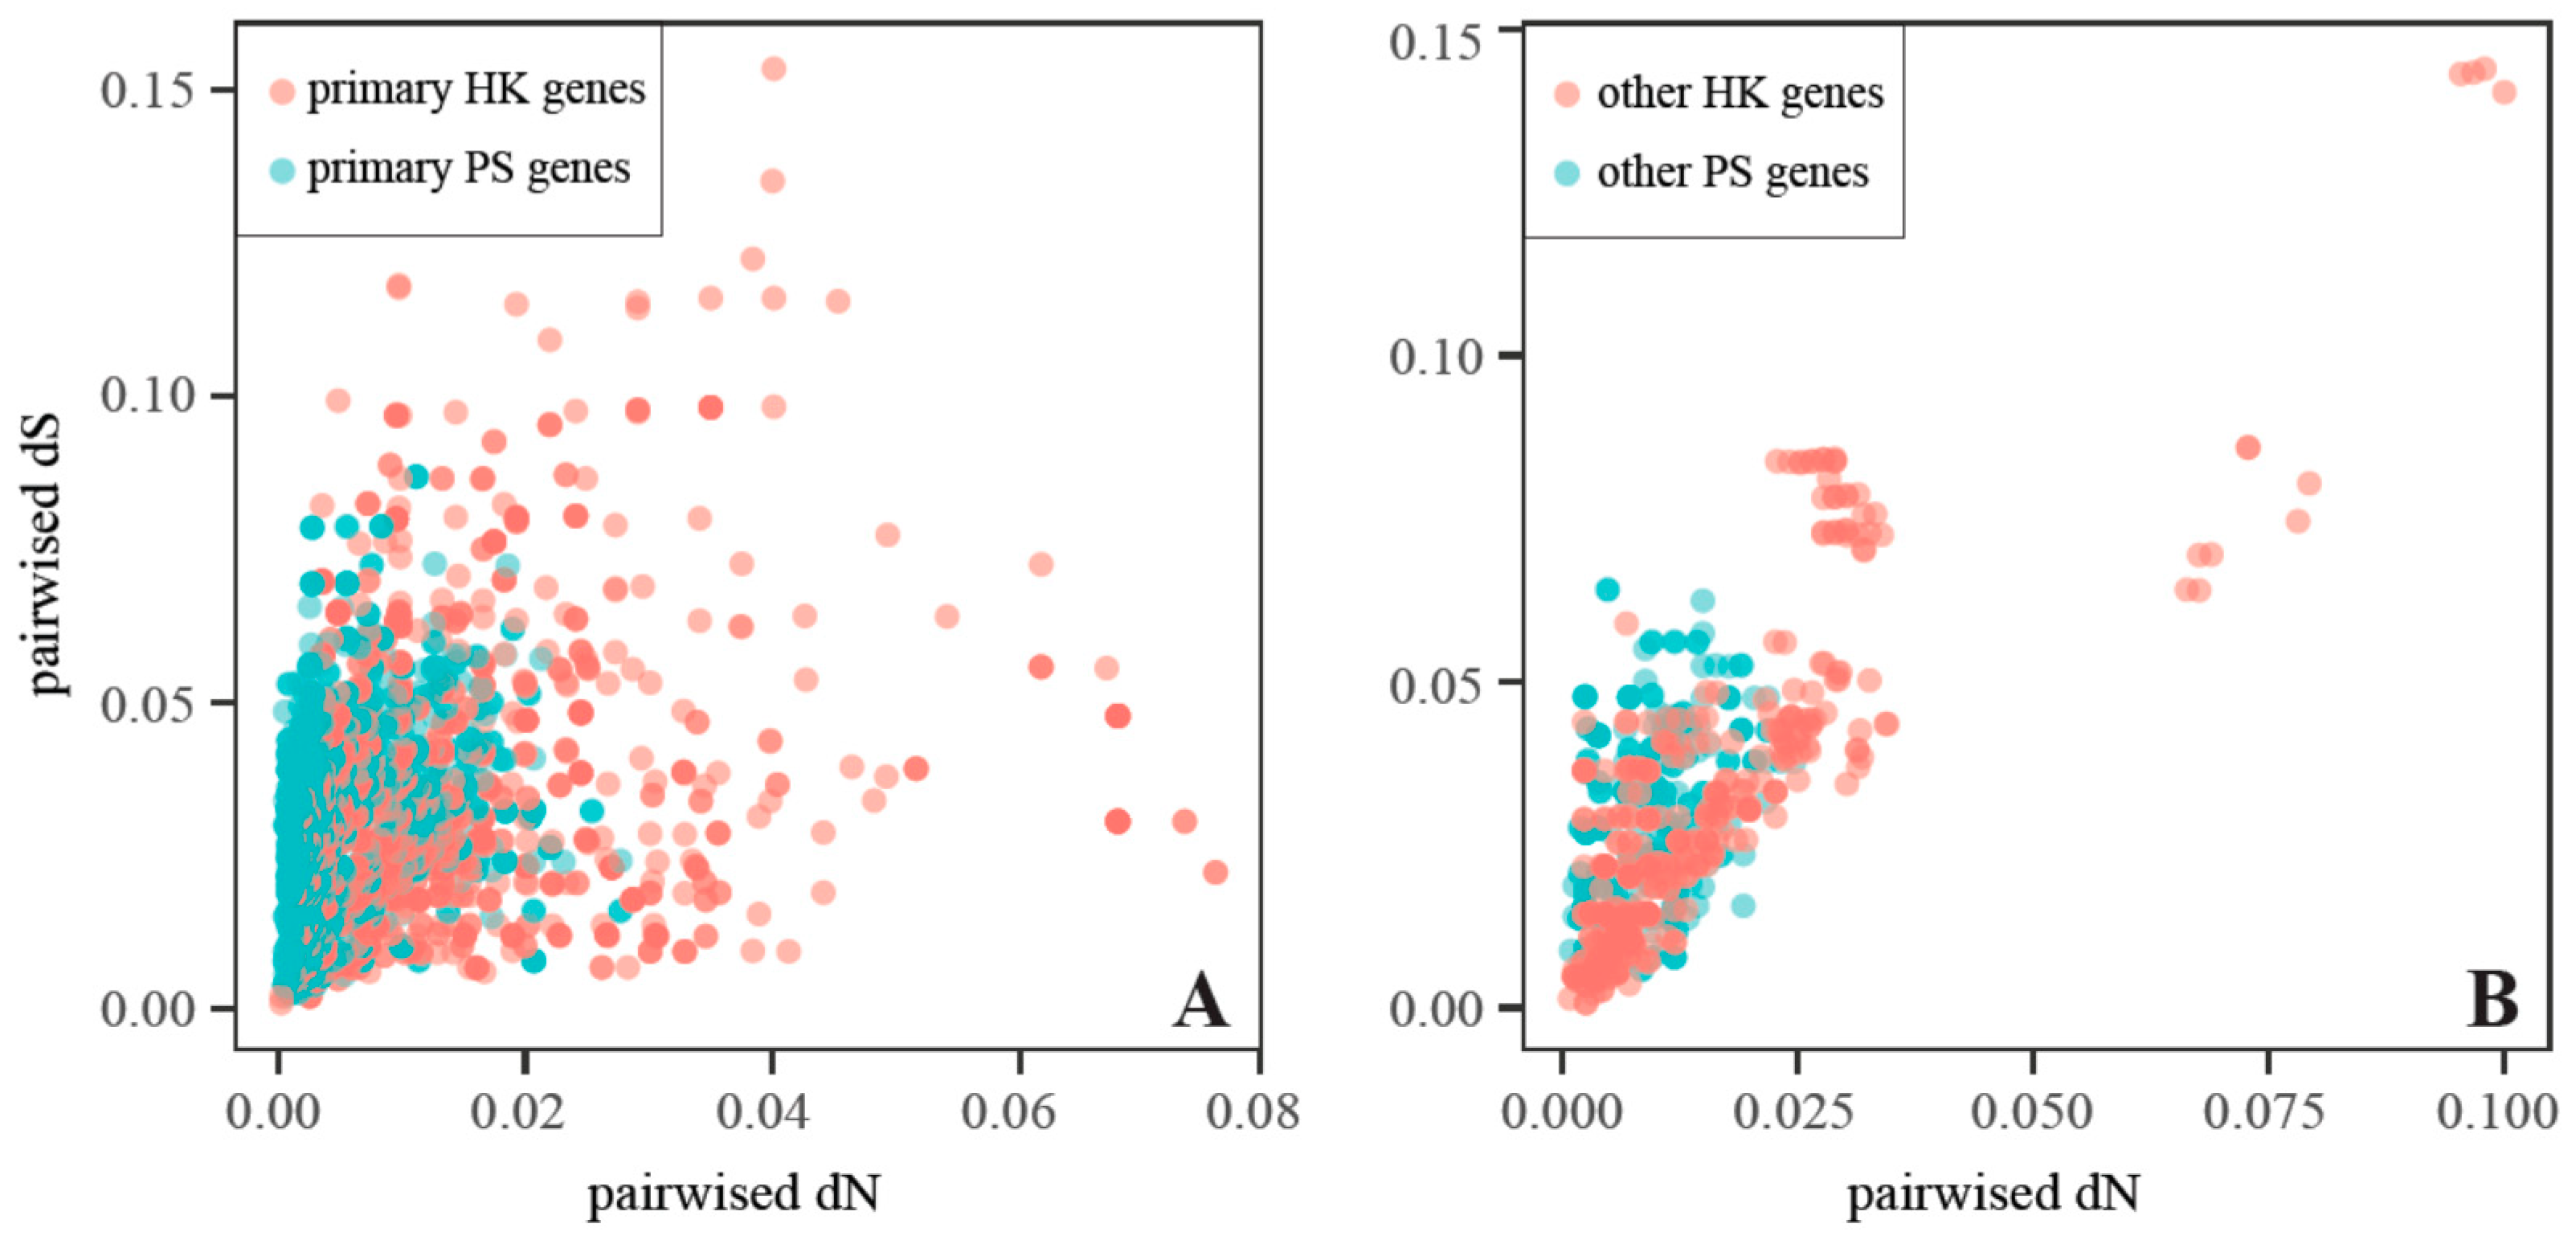
2.4. Substitution Rates and Their Variations among Genes

Substitution rates often vary considerably among genes in the cp genome [40]. Previous studies have reported a higher synonymous substitution rate (dS) than non-synonymous substitution rate (dN) due to natural selection [41]. Similarly, we find that the average dN values of the cp genes vary from 0.0013 to 0.1143 with a mean value of 0.0305, and the average dS values range from 0.0156 to 0.3445 with a mean value of 0.1096. In addition, the dN and the dS of each gene group vary from 0.0052 to 0.0806 (mean value: 0.0295) and 0.0327 to 0.1561 (mean value: 0.1054), respectively. Consistent with that observed in angiosperms [42], the mean synonymous substitution rate of the gene group is approximately three times faster than that of the non-synonymous substitution rate.
Substitution rate variation between the housekeeping (HK) and the photosynthetic (PS) genes in the cp genome was reported by Wicke and Schneeweiss [41]. We observe a significant difference in pairwise substitution rate between the primary HK and the primary PS genes (or between the other HK and other PS genes) across all 13 Myrsinaceae s.str. taxa (p < 0.001 based on non-parametric Wilcoxon rank sum tests). Both bivariate plots indicate that the rate distribution of HK genes is broader than that of PS genes (Figure 6), suggesting relatively lower purifying selection pressure on the HK genes than on the PS genes.
The boxplots in Figure 7 show that the dN values of the primary HK genes are significantly higher than those of the primary PS genes (non-parametric Wilcoxon rank sum tests, p < 0.001), whereas the dS values show no significant difference between the two categories (p = 0.2156; Figure 7). Thus, the PS genes have a lower dN/dS ratio compared with the HK genes (non-parametric Wilcoxon rank sum tests, p < 0.001, Figure 7), re-enforcing the idea that the PS genes are under stronger functional constraints than the HK genes [43].
The dN/dS ratio is an important indicator of selective pressure at the protein level, with ω > 1 suggesting positive selection [44]. However, positive selection is reasonable if dS summed over all branches on the tree is >0.5 (PAML FAQ, http://saf.bio.caltech.edu/saf_manuals/pamlFAQs.pdf). Here, the individual dN/dS ratios of psbK, petG, and psaJ are 2.6062, 1.1178, and 1.4159, respectively, but their dS values summed over all branches on the tree are extremely low—0.0199, 0.0257, and 0.0295 for psbK, petG, and psaJ, respectively. Accordingly, the high dN/dS ratios of the three genes are likely caused by insufficient mutation signals rather than positive selection.

3. Materials and Methods

3.1. Sampling

In the present study, plant (or DNA) samples of the thirteen woody species representing eight genera within clade Myrsinaceae s.str. were collected. The chloroplast genome sequences of two species (Ar. polysticta and Ar. crenata) were downloaded from GenBank (Table 1). Of the remaining eleven species, the DNAs of five species—Ar. solanacea, El. johnsonii, My. africana, My. sandwicensis, and T. netor—were generously provided by Kew DNA Bank of Royal Botanic Gardens, Kew (http://dnabank.science.kew.org/), and plant materials of the other six species were collected from the field and specimens. Refer to Table 1 for details on sample collection. Cp genomes of the thirteen woody species in clade Myrsinaceae s.str. were obtained and analyzed. L. coreana (clade Lysimachieae, Myrsinoideae; KM819521), Pr. sinensis (Primuloideae; KU321892), and Ma. montana (Maesoideae; KU569490), whose cp genomes are publicly available in GenBank, were used as outgroups for the phylogenetic analyses.

3.2. DNA Extraction and Sequencing

Total genomic DNA was extracted from dry leaves using a modified cetyltrimethyl ammonium bromide (CTAB) method [45]. DNA concentration was determined using the Qubit Fluorometer (Thermo Fisher Scientific, Waltham, MA, USA). The short-insert (ca. 500 bp) paired-end libraries were prepared using the TruePrepTM DNA Library Prep Kit V2 for Illumina (Vazyme Biotech Co., Ltd., Nanjing, China) following the manufacturer’s protocols. The libraries were sequenced on Illumina Hiseq X Ten platform (Illumina, Inc., San Diego, CA, USA) at Beijing Genomics Institute (Shenzhen, China) with read length of 150 bp. Raw sequencing data were qualified by FastQC v0.11.7 (http://www.bioinformatics.babraham.ac.uk/projects/fastqc/), and the adaptor sequences were removed by Trimmomatic 0.36 [46]. Approximately 2 Gb clean reads for each taxon were obtained.

3.3. Chloroplast Genome Assembly and Annotation

The clean sequences were assembled into complete cp genomes by NOVOPlasty 2.6.3 [47] using the cp genome of Ar. polysticta (Genbank No. NC_021121) as the reference with a default k-mer of 39. For samples that failed to yield complete cp genomes, we assembled the reads into scaffolds using Spades 3.11.1 [48]. The locations of scaffolds were determined using Blast 2.7.1 (http://blast.ncbi.nlm.nih.gov/) for generating a complete consensus sequence using the “Map to reference” function implemented in Geneious v11.0.3 [49].
Complete cp genomes were annotated using DOGMA v1.2 [50], and tRNAs were annotated using ARAGORN [51]. The raw annotations were subsequently examined and adjusted manually based on the reference cp genome (NC_021121) in Geneious (v11.0.3) to determine gene structures. The four SC-IR junctions in all cp genomes were examined for whether expansions or contractions of the IR regions had occurred. The complete annotated cp genome sequences were deposited in GenBank (Table 1). Circular cp genome maps were drawn using OrganellarGenome DRAW [52] with default settings and checked manually.

3.4. Identification of CpSSRs and Hypervariable Regions

Chloroplast simple sequence repeats (cpSSRs) were identified using MISA [53]. The minimum number of repeats was set as 10, 5, 4, 3, 3, and 3 for mono-, di-, tri-, tetra-, penta-, and hexa-nucleotide SSRs, respectively.
To detect hypervariable regions, the sequences of all 13 complete cp genomes were aligned using MAFFT v7.308 [54]. The sliding window analysis was conducted to evaluate nucleotide diversity (Pi) using DnaSP v6.11.01 [55] with a window size of 600 bp and a step size of 200 bp. The overall sequence identity among these cp genomes was plotted using mVISTA program under shuffle-LAGAN mode [56] with a reference of Ar. polysticta cp genome.

3.5. Phylogenetic Analyses

The 78 sequences of the protein-coding genes (PCGs) were extracted from all 13 cp genomes and aligned using the translation align function in MAFFT v7.308 with the L-INS-I method in Geneious. The genetic code was set as “Bacterial”, and the translation frame was set to 1. The aligned matrixes were concatenated into a super matrix for phylogenetic reconstruction. The best partition scheme was analyzed using PartitionFinder 2 with greedy search under the AICc criterion [57]. The maximum likelihood (ML) method was used for phylogenetic reconstruction by RAxML-HPC v8.2.20 [58] via CIPRES Science Gateway [59]. The ML analysis was performed with the GTR + Γ model under the best partitioning scheme. Node supports were evaluated by 1000 rapid bootstrap replicates. L. coreana, Pr. sinensis, and Ma. montana were used as outgroups.

3.6. Substitution Rate Estimation

To investigate the evolutionary patterns of the cp genomes, the rates of nonsynonymous (dN) and synonymous (dS) substitutions as well as the dN/dS ratios were determined using PAML’s codeml [60] with codon frequencies F3 × 4. Gaps were excluded using cleandata = 1 to avoid spurious rate inference [61]. The dN/dS ratios were estimated by excluding genes with dS value smaller than 0.001. Genes without nonsynonymous and/or synonymous mutations were also excluded from further statistical analyses. The ML tree constructed based on the cp protein-coding genes was used as a constraint tree. The shared protein-coding genes within clade Myrsinaceae s.str. were classified into the following categories: (1) primary housekeeping (HK) genes (rpo, rpl, and rps), primary photosynthetic (PS) genes (atp, ndh, pet, psa, and psb), other HK genes (clpP, matK, ycf1, and ycf2), and other PS genes (ccsA, cemA, rbcL, ycf3, and ycf4) according to the criteria described by Wicke et al. [62]; (2) concatenated gene sets for the functional groups; and (3) all individual genes [61]. Statistical analyses were performed using R 3.6.1 [63].

4. Conclusions

Here, we sequenced and characterized the complete cp genomes of 13 taxa within the Myrsinaceae s.str. clade of Primulaceae. These cp genomes are highly conserved in terms of size and gene content and are typical quadripartite circle molecules consisting of an LSC region, an SSC region, and a pair of separated IRs. Three genes (infA, accD, and ycf15) were inferred to be pseudogenes, and ycf15 was completely absent from five taxa. The noncoding regions (intergenic spacers and introns) and the LSC regions showed relatively higher nucleotide diversity (Pi) values than other regions. A total of ten hypervariable regions were identified. A total of 796 cpSSR loci under six types were found across the 13 cp genomes, 74.37% of which were found to be located in the LSC region. Results with the phylogenetic analyses suggest that Myrsinaceae s.str. is a monophyletic clade that contains two main subclades. The HK genes exhibited a significantly higher dN compared with the PS genes, whereas the dS values of HK and PS genes were similar. These results indicate that the PS genes underwent stronger functional constraints than the HK genes.

Supplementary Materials

Author Contributions

G.H. and H.Y. conceived and designed this study; X.Y. (Xiaokai Yan), H.Y. and Y.X. prepared the materials; X.Y. (Xiaokai Yan) and X.Y. (Xun Yuan) performed the experiments; X.Y. (Xiaokai Yan), T.L. and X.Y. (Xun Yuan) analyzed the data; X.Y. (Xiaokai Yan), H.Y. and G.H. wrote the manuscript. All authors gave final approval of the paper.

Funding

This research was supported by the National Natural Science Foundation of China (grant no. 31570193 to G.H. and grant no. 31570222 to H.Y.), the Department of Science and Technology of Guangdong Province (grant no. 2017A030303063 to Y.X. (Yuan Xu), and the Key Laboratory of Plant Resources Conservation and Sustainable Utilization, South China Botanical Garden, Chinese Academy of Sciences (grant no. PCU201801 to G.H.).

Acknowledgments

We thank George Ferguson in the Univ. of Arizona Herbarium for the access to Primulaceae specimens. We also thank Kew DNA Bank of the Royal Botanic Gardens (Richmond, London, UK) for kindly providing some Primulaceae DNAs. We acknowledge TopEdit LLC for the linguistic editing and proofreading during the preparation of this manuscript.

Conflicts of Interest

The authors declare no conflict of interest.

References

  1. Angiosperm Phylogeny Group. An update of the Angiosperm Phylogeny Group classification for the orders and families of flowering plants: APG III. Bot. J. Linn. Soc. 2009, 161, 105–121. [Google Scholar] [CrossRef] [Green Version]
  2. Chase, M.W.; Christenhusz, M.J.; Fay, M.F.; Byng, J.W.; Judd, W.S.; Soltis, D.E.; Mabberley, D.J.; Sennikov, A.N.; Soltis, P.S.; Stevens, P.F. An update of the Angiosperm Phylogeny Group classification for the orders and families of flowering plants: APG IV. Bot. J. Linn. Soc. 2016, 181, 1–20. [Google Scholar] [Green Version]
  3. Ståhl, B.; Anderberg, A.A. Myrsinaceae. In Flowering Plants. Dicotyledons: Celastrales, Oxalidales, Rosales, Cornales, Ericales; Kubitzki, K., Ed.; Springer: Berlin/Heidelberg, Germany, 2004. [Google Scholar]
  4. Kallersjo, M.; Bergqvist, G.; Anderberg, A.A. Generic realignment in primuloid families of the Ericales s.l.: A phylogenetic analysis based on DNA sequences from three chloroplast genes and morphology. Am. J. Bot. 2000, 87, 1325–1341. [Google Scholar] [CrossRef] [PubMed]
  5. Hao, G.; Yuan, Y.M.; Hu, C.M.; Ge, X.J.; Zhao, N.X. Molecular phylogeny of Lysimachia (Myrsinaceae) based on chloroplast trnL-F and nuclear ribosomal ITS sequences. Mol. Phylogenet. Evol. 2004, 31, 323–339. [Google Scholar] [CrossRef]
  6. Anderberg, A.A.; Manns, U.; Källersjö, M. Phylogeny and floral evolution of the Lysimachieae (Ericales, Myrsinaceae): Evidence from ndhF sequence data. Willdenowia 2007, 37, 407–421. [Google Scholar] [CrossRef]
  7. Oh, I.C.; Schönenberger, J.; Motley, T.J.; Myrenås, M.; Anderberg, A.A. Phylogenetic relationships among endemic Hawaiian Lysimachia (Ericales: Primulaceae): Insights from nuclear and chloroplast DNA sequence data. Pac. Sci. 2013, 67, 237–251. [Google Scholar] [CrossRef]
  8. Yan, H.F.; Zhang, C.Y.; Anderberg, A.A.; Hao, G.; Ge, X.J.; Wiens, J.J. What explains high plant richness in East Asia? Time and diversification in the tribe Lysimachieae (Primulaceae). New Phytol. 2018, 219, 436–448. [Google Scholar] [CrossRef] [PubMed]
  9. Yesson, C.; Toomey, N.H.; Culham, A. Cyclamen: Time, sea and speciation biogeography using a temporally calibrated phylogeny. J. Biogeogr. 2009, 36, 1234–1252. [Google Scholar] [CrossRef]
  10. Strijk, J.S.; Bone, R.E.; Thebaud, C.; Buerki, S.; Fritsch, P.W.; Hodkinson, T.R.; Strasberg, D. Timing and tempo of evolutionary diversification in a biodiversity hotspot: Primulaceae on Indian Ocean islands. J. Biogeogr. 2014, 41, 810–822. [Google Scholar] [CrossRef]
  11. Rose, J.P.; Kleist, T.J.; Lofstrand, S.D.; Drew, B.T.; Schonenberger, J.; Sytsma, K.J. Phylogeny, historical biogeography, and diversification of angiosperm order Ericales suggest ancient Neotropical and East Asian connections. Mol. Phylogenet. Evol. 2018, 122, 59–79. [Google Scholar] [CrossRef]
  12. Gitzendanner, M.A.; Soltis, P.S.; Yi, T.S.; Li, D.Z.; Soltis, D.E. Plastome phylogenetics: 30 years of inferences into plant evolution. Adv. Bot. Res. 2018, 85, 293–313. [Google Scholar]
  13. Soltis, D.; Soltis, P.; Endress, P.; Chase, M.W.; Manchester, S.; Judd, W.; Majure, L.; Mavrodiev, E. Phylogeny and Evolution of the Angiosperms: Revised and Updated Edition; University of Chicago Press: Chicago, IL, USA, 2018. [Google Scholar]
  14. Qiu, Y.X.; Fu, C.X.; Comes, H.P. Plant molecular phylogeography in China and adjacent regions: Tracing the genetic imprints of Quaternary climate and environmental change in the world’s most diverse temperate flora. Mol. Phylogenet. Evol. 2011, 59, 225–244. [Google Scholar] [CrossRef] [PubMed]
  15. Soltis, D.E.; Morris, A.B.; McLachlan, J.S.; Manos, P.S.; Soltis, P.S. Comparative phylogeography of unglaciated eastern North America. Mol. Ecol. 2006, 15, 4261–4293. [Google Scholar] [CrossRef] [PubMed]
  16. CBOL Plant Working Group; Hollingsworth, P.M.; Forrest, L.L.; Spouge, J.L.; Hajibabaei, M.; Ratnasingham, S.; van der Bank, M.; Chase, M.W.; Cowan, R.S.; Erickson, D.L.; et al. A DNA barcode for land plants. Proc. Natl. Acad. Sci. USA 2009, 106, 12794–12797. [Google Scholar] [Green Version]
  17. Hollingsworth, P.M.; Li, D.Z.; van der Bank, M.; Twyford, A.D. Telling plant species apart with DNA: From barcodes to genomes. Philos. Trans. R. Soc. 2016, 371, 20150338. [Google Scholar] [CrossRef] [PubMed]
  18. Carlsen, M.M.; Fér, T.; Schmickl, R.; Leong-Škorničková, J.; Newman, M.; Kress, W.J. Resolving the rapid plant radiation of early diverging lineages in the tropical Zingiberales: Pushing the limits of genomic data. Mol. Phylogenet. Evol. 2018, 128, 55–68. [Google Scholar] [CrossRef] [PubMed]
  19. Mitchell, N.; Lewis, P.O.; Lemmon, E.M.; Lemmon, A.R.; Holsinger, K.E. Anchored phylogenomics improves the resolution of evolutionary relationships in the rapid radiation of Protea L. Am. J. Bot. 2017, 104, 102–115. [Google Scholar] [CrossRef]
  20. Folk, R.A.; Mandel, J.R.; Freudenstein, J.V. A protocol for targeted enrichment of intron-containing sequence markers for recent radiations: A phylogenomic example from Heuchera (Saxifragaceae). Appl. Plant Sci. 2015, 3, 1500039. [Google Scholar] [CrossRef] [PubMed]
  21. Li, H.T.; Yi, T.S.; Gao, L.M.; Ma, P.F.; Zhang, T.; Yang, J.B.; Gitzendanner, M.A.; Fritsch, P.W.; Cai, J.; Luo, Y.; et al. Origin of angiosperms and the puzzle of the Jurassic gap. Nat. Plants 2019, 5, 461–470. [Google Scholar] [CrossRef] [PubMed]
  22. Ruhfel, B.R.; Gitzendanner, M.A.; Soltis, P.S.; Soltis, D.E.; Burleigh, J.G. From algae to angiosperms-inferring the phylogeny of green plants (Viridiplantae) from 360 plastid genomes. BMC Evol. Biol. 2014, 14, 23. [Google Scholar] [CrossRef]
  23. Mower, J.P.; Vickrey, T.L. Structural diversity among plastid genomes of land plants. In Advances in Botanical Research; Chaw, S.M., Jansen, R.K., Eds.; Academic Press: Cambridge, MA, USA, 2018; Volume 58, pp. 263–292. [Google Scholar]
  24. McKain, M.R.; Johnson, M.G.; Uribe-Convers, S.; Eaton, D.; Yang, Y. Practical considerations for plant phylogenomics. Appl. Plant Sci. 2018, 6, e1038. [Google Scholar] [CrossRef] [PubMed]
  25. Son, O.; Park, S.J. Complete chloroplast genome sequence of Lysimachia coreana (Primulaceae). Mitochondrial DNA 2016, 27, 2263–2265. [Google Scholar] [PubMed]
  26. Ren, T.; Yang, Y.C.; Zhou, T.; Liu, Z.L. Comparative plastid genomes of Primula species: Sequence divergence and phylogenetic relationships. Int. J. Mol. Sci. 2018, 19, 1050. [Google Scholar] [CrossRef] [PubMed]
  27. Jansen, R.K.; Ruhlman, T.A. Plastid genomes of seed plants. In Genomics of Chloroplasts and Mitochondria; Bock, R., Knoop, V., Eds.; Springer: Dordrecht, The Netherlands, 2012. [Google Scholar]
  28. Wolf, P.G.; Karol, K.G. Plastomes of Bryophytes, Lycophytes and Ferns. In Genomics of Chloroplasts and Mitochondria; Bock, R., Knoop, V., Eds.; Springer: Dordrecht, The Netherlands, 2012; pp. 89–102. [Google Scholar]
  29. Liu, T.J.; Zhang, C.Y.; Yan, H.F.; Zhang, L.; Ge, X.J.; Hao, G. Complete plastid genome sequence of Primula sinensis (Primulaceae): Structure comparison, sequence variation and evidence for accD transfer to nucleus. PeerJ 2016, 4, e2101. [Google Scholar] [CrossRef] [PubMed]
  30. Fu, C.N.; Li, H.T.; Milne, R.; Zhang, T.; Ma, P.F.; Yang, J.; Li, D.Z.; Gao, L.M. Comparative analyses of plastid genomes from fourteen Cornales species: Inferences for phylogenetic relationships and genome evolution. BMC Genom. 2017, 18, 965. [Google Scholar] [CrossRef]
  31. Guo, X.Y.; Liu, J.Q.; Hao, G.Q.; Zhang, L.; Mao, K.S.; Wang, X.J.; Zhang, D.; Ma, T.; Hu, Q.J.; Al-Shehbaz, I.A.; et al. Plastome phylogeny and early diversification of Brassicaceae. BMC Genom. 2017, 18, 176. [Google Scholar] [CrossRef] [PubMed]
  32. Liu, L.X.; Wang, Y.W.; He, P.Z.; Li, P.; Lee, J.; Soltis, D.E.; Fu, C.X. Chloroplast genome analyses and genomic resource development for epilithic sister genera Oresitrophe and Mukdenia (Saxifragaceae), using genome skimming data. BMC Genom. 2018, 19, 235. [Google Scholar] [CrossRef]
  33. Shi, C.; Liu, Y.; Huang, H.; Xia, E.H.; Zhang, H.B.; Gao, L.Z. Contradiction between plastid gene transcription and function due to complex posttranscriptional splicing: An exemplary study of ycf15 function and evolution in angiosperms. PLoS ONE 2013, 8, e59620. [Google Scholar] [CrossRef]
  34. Dong, W.; Xu, C.; Li, C.; Sun, J.; Zuo, Y.; Shi, S.; Cheng, T.; Guo, J.; Zhou, S. ycf1, the most promising plastid DNA barcode of land plants. Sci. Rep. 2015, 5, 8348. [Google Scholar] [CrossRef]
  35. Haigh, J. The accumulation of deleterious genes in a population—Muller’s Ratchet. Theor. Popul. Biol. 1978, 14, 251–267. [Google Scholar] [CrossRef]
  36. Martin, W.; Stoebe, B.; Goremykin, V.; Hansmann, S.; Hasegawa, M.; Kowallik, K.V. Gene transfer to the nucleus and the evolution of chloroplasts. Nature 1998, 393, 162–165. [Google Scholar] [CrossRef] [PubMed]
  37. Shaw, J.; Shafer, H.L.; Leonard, O.R.; Kovach, M.J.; Schorr, M.; Morris, A.B. Chloroplast DNA sequence utility for the lowest phylogenetic and phylogeographic inferences in angiosperms: The tortoise and the hare IV. Am. J. Bot. 2014, 101, 1987–2004. [Google Scholar] [CrossRef] [PubMed] [Green Version]
  38. Powell, W.; Machray, G.C.; Provan, J. Polymorphism revealed by simple sequence repeats. Trends Plant. Sci. 1996, 1, 215–222. [Google Scholar] [CrossRef]
  39. Weising, K.; Nybom, H.; Pfenninger, M.; Wolff, K.; Kahl, G. DNA Fingerprinting in Plants: Principles, Methods, and Applications, 2nd ed.; CRC Press: Boca Raton, FL, USA, 2005. [Google Scholar]
  40. Wolf, P.G. Plastid Genome Diversity. In Plant Genome Diversity Volume 1: Plant Genomes, Their Residents, and Their Evolutionary Dynamics; Wendel, J.F., Greilhuber, J., Dolezel, J., Leitch, I.J., Eds.; Springer: Vienna, Austria, 2012. [Google Scholar]
  41. Wicke, S.; Schneeweiss, G. Next-generation organellar genomics: Potentials and pitfalls of high-throughput technologies for molecular evolutionary studies and plant systematics. In Next Generation Sequencing in Plant Systematics; Hörandl, E., Appelhans, M., Eds.; Koeltz Scientific Books: Königstein, Germany, 2015. [Google Scholar]
  42. Drouin, G.; Daoud, H.; Xia, J. Relative rates of synonymous substitutions in the mitochondrial, chloroplast and nuclear genomes of seed plants. Mol. Phylogenet. Evol. 2008, 49, 827–831. [Google Scholar] [CrossRef] [PubMed]
  43. Wu, C.S.; Wang, T.J.; Wu, C.W.; Wang, Y.N.; Chaw, S.M. Plastome evolution in the sole hemiparasitic Genus Laurel Dodder (Cassytha) and insights into the plastid phylogenomics of Lauraceae. Genome Biol. Evol. 2017, 9, 2604–2614. [Google Scholar] [CrossRef] [PubMed]
  44. Yang, Z.; Nielsen, R.; Goldman, N.; Pedersen, A.M.K. Codon-substitution models for heterogeneous selection pressure at amino acid sites. Genetics 2000, 155, 431–449. [Google Scholar] [PubMed]
  45. Doyle, J.J.; Doyle, J.L. A rapid DNA isolation procedure for small quantities of fresh leaf tissue. Phytochem Bull 1987, 19, 11–15. [Google Scholar]
  46. Bolger, A.M.; Lohse, M.; Usadel, B. Trimmomatic: A flexible trimmer for Illumina sequence data. Bioinformatics 2014, 30, 2114–2120. [Google Scholar] [CrossRef]
  47. Dierckxsens, N.; Mardulyn, P.; Smits, G. NOVOPlasty: De novo assembly of organelle genomes from whole genome data. Nucleic Acids Res. 2017, 45, e18. [Google Scholar]
  48. Bankevich, A.; Nurk, S.; Antipov, D.; Gurevich, A.A.; Dvorkin, M.; Kulikov, A.S.; Lesin, V.M.; Nikolenko, S.I.; Pham, S.; Prjibelski, A.D.; et al. SPAdes: A new genome assembly algorithm and its applications to single-cell sequencing. J. Comput. Biol. 2012, 19, 455–477. [Google Scholar] [CrossRef]
  49. Kearse, M.; Moir, R.; Wilson, A.; Stones-Havas, S.; Cheung, M.; Sturrock, S.; Buxton, S.; Cooper, A.; Markowitz, S.; Duran, C.; et al. Geneious basic: An integrated and extendable desktop software platform for the organization and analysis of sequence data. Bioinformatics 2012, 28, 1647–1649. [Google Scholar] [CrossRef] [PubMed]
  50. Wyman, S.K.; Jansen, R.K.; Boore, J.L. Automatic annotation of organellar genomes with DOGMA. Bioinformatics 2004, 20, 3252–3255. [Google Scholar] [CrossRef] [PubMed] [Green Version]
  51. Laslett, D.; Canback, B. ARAGORN, a program to detect tRNA genes and tmRNA genes in nucleotide sequences. Nucleic Acids Res. 2004, 32, 11–16. [Google Scholar] [CrossRef] [PubMed]
  52. Lohse, M.; Drechsel, O.; Kahlau, S.; Bock, R. OrganellarGenomeDRAW-a suite of tools for generating physical maps of plastid and mitochondrial genomes and visualizing expression data sets. Nucleic Acids Res. 2013, 41, W575–W581. [Google Scholar] [CrossRef] [PubMed]
  53. Thiel, T.; Michalek, W.; Varshney, R.K.; Graner, A. Exploiting EST databases for the development and characterization of gene-derived SSR-markers in barley (Hordeum vulgare L.). Theor. Appl. Genet. 2003, 106, 411–422. [Google Scholar] [CrossRef] [PubMed]
  54. Katoh, K.; Standley, D.M. MAFFT multiple sequence alignment software version 7: Improvements in performance and usability. Mol. Biol. Evol. 2013, 30, 772–780. [Google Scholar] [CrossRef] [PubMed]
  55. Rozas, J.; Ferrer-Mata, A.; Sanchez-DelBarrio, J.C.; Guirao-Rico, S.; Librado, P.; Ramos-Onsins, S.E.; Sanchez-Gracia, A. DnaSP 6: DNA sequence polymorphism analysis of large data sets. Mol. Biol. Evol. 2017, 34, 3299–3302. [Google Scholar] [CrossRef]
  56. Frazer, K.A.; Pachter, L.; Poliakov, A.; Rubin, E.M.; Dubchak, I. VISTA: Computational tools for comparative genomics. Nucleic Acids Res. 2004, 32, W273–W279. [Google Scholar] [CrossRef]
  57. Lanfear, R.; Frandsen, P.B.; Wright, A.M.; Senfeld, T.; Calcott, B. PartitionFinder 2: New methods for selecting partitioned models of evolution for molecular and morphological phylogenetic analyses. Mol. Biol. Evol. 2017, 34, 772–773. [Google Scholar] [CrossRef]
  58. Stamatakis, A. RAxML version 8: A tool for phylogenetic analysis and post-analysis of large phylogenies. Bioinformatics 2014, 30, 1312–1313. [Google Scholar] [CrossRef]
  59. Miller, M.A.; Pfeiffer, W.; Schwartz, T. The CIPRES science gateway: Enabling high-impact science for phylogenetics researchers with limited resources. In Proceedings of the 1st Conference of the Extreme Science and Engineering Discovery Environment: Bridging from the eXtreme to the Campus and Beyond, Chicago, IL, USA, 16–20 July 2012; pp. 1–8. [Google Scholar]
  60. Yang, Z.H. PAML 4: Phylogenetic analysis by maximum likelihood. Mol. Biol. Evol. 2007, 24, 1586–1591. [Google Scholar] [CrossRef] [PubMed]
  61. Park, S.; Ruhlman, T.A.; Weng, M.L.; Hajrah, N.H.; Sabir, J.S.M.; Jansen, R.K. Contrasting patterns of nucleotide substitution rates provide insight into dynamic evolution of plastid and mitochondrial genomes of Geranium. Genome Biol. Evol. 2017, 9, 1766–1780. [Google Scholar] [CrossRef] [PubMed]
  62. Wicke, S.; Muller, K.F.; dePamphilis, C.W.; Quandt, D.; Bellot, S.; Schneeweiss, G.M. Mechanistic model of evolutionary rate variation en route to a nonphotosynthetic lifestyle in plants. Proc. Natl. Acad. Sci. USA 2016, 113, 9045–9050. [Google Scholar] [CrossRef] [PubMed] [Green Version]
  63. R Development Core Team. R: A Language and Environment for Statistical Computing; R Foundation for Statistical Computing: Vienna, Austria, 2019. [Google Scholar]
Figure 1. Map of the chloroplast genomes of Myrsinoideae species. Genes on the outer circle are transcribed in the counterclockwise direction, and those on the inner circle are transcribed in the clockwise direction. Bars of different colors indicate different functional groups.
Ijms 20 04534 g001
Figure 2. Comparisons of the boundaries between large single-copy (LSC), small single-copy (SSC), and inverted repeat (IR) regions among different Myrsinoideae cp genomes.
Ijms 20 04534 g002
Figure 3. Maximum likelihood (ML) phylogenetic tree of Myrsinoideae based on 78 protein-coding genes. Numbers on the branches are bootstrap values. Species in the Myrsinaceae s.str. clade is indicated by yellow.
Ijms 20 04534 g003
Figure 4. Nucleotide diversity (Pi) values across all Myrsinaceae s.str. cp genomes detected by sliding windows. X-axis, nucleotide positions in the cp genomes; Y-axis, nucleotide diversity (Pi) values. LSC: large single copy region; SSC: small single copy region; IR: inverted repeat region.
Ijms 20 04534 g004
Figure 5. The type and the distribution of chloroplast simple sequence repeats (cpSSRs) across all Myrsinaceae s.str. cp genomes. (A) The number of cpSSRs identified in different species. (B) cpSSR distribution in different species.
Ijms 20 04534 g005
Figure 6. Bivariate plots of pairwise synonymous (dS) and nonsynonymous (dN) substitution rates of the protein-coding genes from the Myrsinaceae s.str. cp genomes. (A) Bivariate plot of the dN vs. the dS of primary housekeeping (HK) and photosynthetic (PS) genes, (B) bivariate plot of the dN vs. the dS of the other HK and PS genes.
Ijms 20 04534 g006
Figure 7. Comparison of the dS, the dN, and the ω values between the chloroplast primary PS and HK genes within clade Myrsinaceae s.str.; (A) boxplot of the dN values, (B) boxplot of the dS values, (C) boxplot of the ω values. The p-values were calculated by non-parametric Wilcoxon rank sum tests in R.
Ijms 20 04534 g007
Table 1. Details on samples, vouchers, GenBank accessions, and features of the chloroplast genomes within the Myrsinaceae s.str. clade.
TaxonVoucher No./Herbarium CodeGenBank AccessionSize (bp)GC ContentGene No.Protein Coding GenetRNArRNA
Aegiceras comiculatumLiu150016/IBSCMN167882157,24136.9%11480304
Ardisia solanacea17988*/KMN094783156,51837.1%11480304
Ardisia polystictaNo dataKC465962156,50637.1%11380294
Aridisa crenataYxk160038/IBSCKM719568156,87637.1%11380304
Elingamita johnsonii958*/KMN094784156,18037.0%11379304
Embelia vestitaLiu150050/IBSCMN167884157,23836.9%11480304
Myrsine africana30087*/KMN165129156,43337.0%11480304
Myrsine sandwicensis38322*/HAWMN177700156,28437.0%11480304
Myrsine stoloniferaLiu150044/IBSCMN167883156,95336.9%11480304
Parathesis chiapensisAlush Nendes 6574/ARIZMN177699156,66637.0%11379304
Parathesis donnell-smithiiAlvaro Campos 3924/ARIZMN177698156,34437.0%11379304
Tapeinosperma multiflorum9361/MOMN177701155,16837.0%11379304
Tapeinosperma netor33984*/KMN177702154,61637.1%11379304
Note: * indicates the DNA identification (ID) number of the Royal Botanic Gardens Kew DNA Bank.

