A Study on Faster R-CNN-Based Subway Pedestrian Detection with ACE Enhancement

1
College of Electronic and Information Engineering, North China University of Technology, Shijingshan District, Beijing 100144, China
2
Beijing Urban Construction Design & Development Group Co., Ltd., Beijing 100037, China
*
Author to whom correspondence should be addressed.
Algorithms 2018, 11(12), 192; https://0-doi-org.brum.beds.ac.uk/10.3390/a11120192
Submission received: 13 September 2018
/
Revised: 10 November 2018
/
Accepted: 21 November 2018
/
Published: 26 November 2018
(This article belongs to the Special Issue Deep Learning for Image and Video Understanding)
Abstract
:At present, the problem of pedestrian detection has attracted increasing attention in the field of computer vision. The faster regions with convolutional neural network features (Faster R-CNN) are regarded as one of the most important techniques for studying this problem. However, the detection capability of the model trained by faster R-CNN is susceptible to the diversity of pedestrians’ appearance and the light intensity in specific scenarios, such as in a subway, which can lead to the decline in recognition rate and the offset of target selection for pedestrians. In this paper, we propose the modified faster R-CNN method with automatic color enhancement (ACE), which can improve sample contrast by calculating the relative light and dark relationship to correct the final pixel value. In addition, a calibration method based on sample categories reduction is presented to accurately locate the target for detection. Then, we choose the faster R-CNN target detection framework on the experimental dataset. Finally, the effectiveness of this method is verified with the actual data sample collected from the subway passenger monitoring video.
1. Introduction
As we know, the subway plays an important role in the urban public transport system, which can be exposed to a high security risk if the large quantities of passengers cannot be evacuated in a short time [1,2,3]. Thus, we need good means to analyze the high-density crowds. The current methods mainly include artificial statistics, infrared detection, video object detection, etc. The artificial statistics are unsustainable, and infrared detection has a low resolution. Therefore, more and more researchers pay attention to the video object detection, which can be combined with computer vision very well. In the field of computer vision, passenger flow detection has been studied for several decades, and it has been greatly improved regarding the detection accuracy with high efficiency. The researchers put forward a variety of algorithms. Document [4] adopts a local binary patterns (LBP) texture feature extraction method combined with a partial least squares regression (PLSR) model. However, this method is still in the experimental stage, and has not been widely applied. Document [5] collects the Haar features from pedestrian head-and-shoulder samples, and detects the pedestrian head using a strong classifier trained by AdaBoost algorithm. Furthermore, it further uses the bilinear interpolation algorithm to remove mistake detection windows with an inappropriate size. Document [6,7,8] makes comparisons between Haar-based and HOG-based algorithms on face recognition and pedestrian detection. The histogram of oriented gradients (HOG) extracts features by calculating the histogram of oriented gradients of the local region. Then, it uses the support vector machine (SVM) to train this feature set. The experimental results show that the passenger flow detection based on HOG features has a high success rate under the condition of integrated detected body with high image quality. However, for the case of partial body, the detection error can be very large. In [9,10], researchers realize the object detection with deep learning. It uses selective search to get around 2000 region proposals from an image. Then, each region proposal is resized to a fixed size, and the convolution neural network (CNN) is used to extract features for the feature map. Finally, the feature vector is put into the SVM classifier to judge whether it belongs to a certain feature class, and the position of the region proposal is adjusted by the regression classifier. Compared to the HOG-based algorithm on pedestrian detection, R-CNN can extract more features, such as textures, materials, and light. However, one drawback is the large amount of overlap between the region proposals in the image, which can lead to repeat computation in the process of extracting features. In order to solve this problem, fast R-CNN proposes two improvements: first, the entire image is normalized and sent directly to CNN, and then the fifth convolution layer gets the features of each region proposal. The second step is to put the bounding-box regression into the neural network, with the region classifier, to a multi-task model. This method enables object detection to improve efficiency while ensuring accuracy [11]. However, finding all the region proposals is also a very time-consuming process. To solve this problem, the faster R-CNN uses the region proposal network to directly train and get region proposals, which promotes the efficiency compared to the fast R-CNN [12,13,14,15,16]. However, when the image quality is poor, or the background is close to the color of person, the accuracy of the detection has dropped sharply. Aiming at this problem, this paper proposes to use an image enhancement algorithm to deal with the images first. The histogram equalization is a commonly used method of image enhancement, whose basic idea is to determine a mapping curve by using the histogram of the gray distribution of the image and, finally, achieve the purpose of improving image contrast. However, the histogram equalization is a method of adjusting the global image, which cannot effectively improve the local contrast [17,18,19]. In [20], researchers realize adaptive histogram equalization (AHE). Different from the histogram equalization, the AHE changes the image contrast by calculating the local histogram of the image, and then redistributes the luminance. Therefore, the algorithm is more suitable for improving the local contrast of the image to get more image details. However, AHE has the problem of over-amplifying the noise in the same area of the image. To solve this problem, the automatic color enhancement (ACE) algorithm is realized [21,22,23]. The algorithm calculates the luminance relationship between the target pixel and the surrounding pixels by difference methods, and the luminance is controlled by the luminance function, which is calculated by the spatial function and weighted processing. However, the complexity of the algorithm is higher. On this basis, [24] describes two fast approximations of ACE. First, use a polynomial approximation of the slope function to decompose the main computation into convolution. Second, an algorithm based on interpolating intensity levels also reduces the main computation to convolutions.
Moreover, we present a review of the most recent works on pedestrian detection. Fast feature pyramids is an effective method for pedestrian detection, which proposes that features computed at octave-spaced scale intervals are sufficient to approximate features on a finely sampled pyramid. Extrapolation is inexpensive as compared to direct feature computation. As a result, the approximation yields considerable speedups with negligible loss in detection accuracy [25]. Ref [26] presents a novel method for detecting pedestrians under adverse illumination conditions, which model the relations between RGB and thermal data, then transfer to a deep network to output the detection results. This method is competitive with previous methods on the Caltech dataset. Ref [27] proposes a joint deep learning framework for pedestrian detection, which includes feature extraction, deformation handling, occlusion handling, and classification. This method can maximize the strength of each component through all the components interacting with each other. Ref [28] presents a solution on how to integrate the inaccurate scores of part detectors when there are occlusions on pedestrian detection. With the development of deep learning technology, there are more and more demands on the sample set. It is well known that the quality of samples directly influences the generalization effect of the model. Nowadays, there are many pedestrian detection databases, such as INRIA, ETH, and MIT. The INRIA and MIT database are mostly single targets which cannot meet the requirements of intensive passenger flow detection. The ETH database is very different from the actual subway scene in the light environment. In order to establish the experimental data, we collected the specific subway passenger monitoring videos and use the manual annotation method to make a large number of dense data samples. When we choose the faster R-CNN target detection framework to experiment on the dataset, the detection capability of the model trained by faster R-CNN is susceptible to the diversity of pedestrians’ clothing and the light intensity, which can lead to the decline in recognition rate and the offset of bounding-box for pedestrians. In this paper, we propose the modified faster R-CNN method with automatic color enhancement (ACE), which can improve sample contrast by calculating the relative light and dark relationship to correct the final pixel value. In addition, a calibration method based on sample categories reduction is presented to accurately locate the bounding-box. In this paper, we reduce the sample category to two categories, filter the excess calibration target background, and improve the missing calibration box. Moreover, we test the performance under different category and different model.
The remainder of this paper is organized as follows. In Section 2, the method of sample processing that reduce the sample categories and apply fast automatic color enhancement (ACE) are introduced in detail. Section 3 provides a review of the faster R-CNN. In Section 4, we provide abundant experimental results in faster R-CNN detection system. Section 5 summarizes the key contributions of this paper and provides concluding remarks.
2. The Methods of Sample Processing
This paper aims to design an algorithm to detect subway passengers. In order to obtain the subway passenger data sample, we installed monitored devices at many Beijing subway stations. The viewing angle of these monitored devices is from top to bottom, and the original data collected is video. We took an image from every 10 frames in the video and made these images into a data sample. In order to improve the recognition effect, this paper uses the method of processing the sample. We reduce the sample categories, and then use the automatic color enhancement to improve sample contrast.
2.1. Reducing Sample Categories
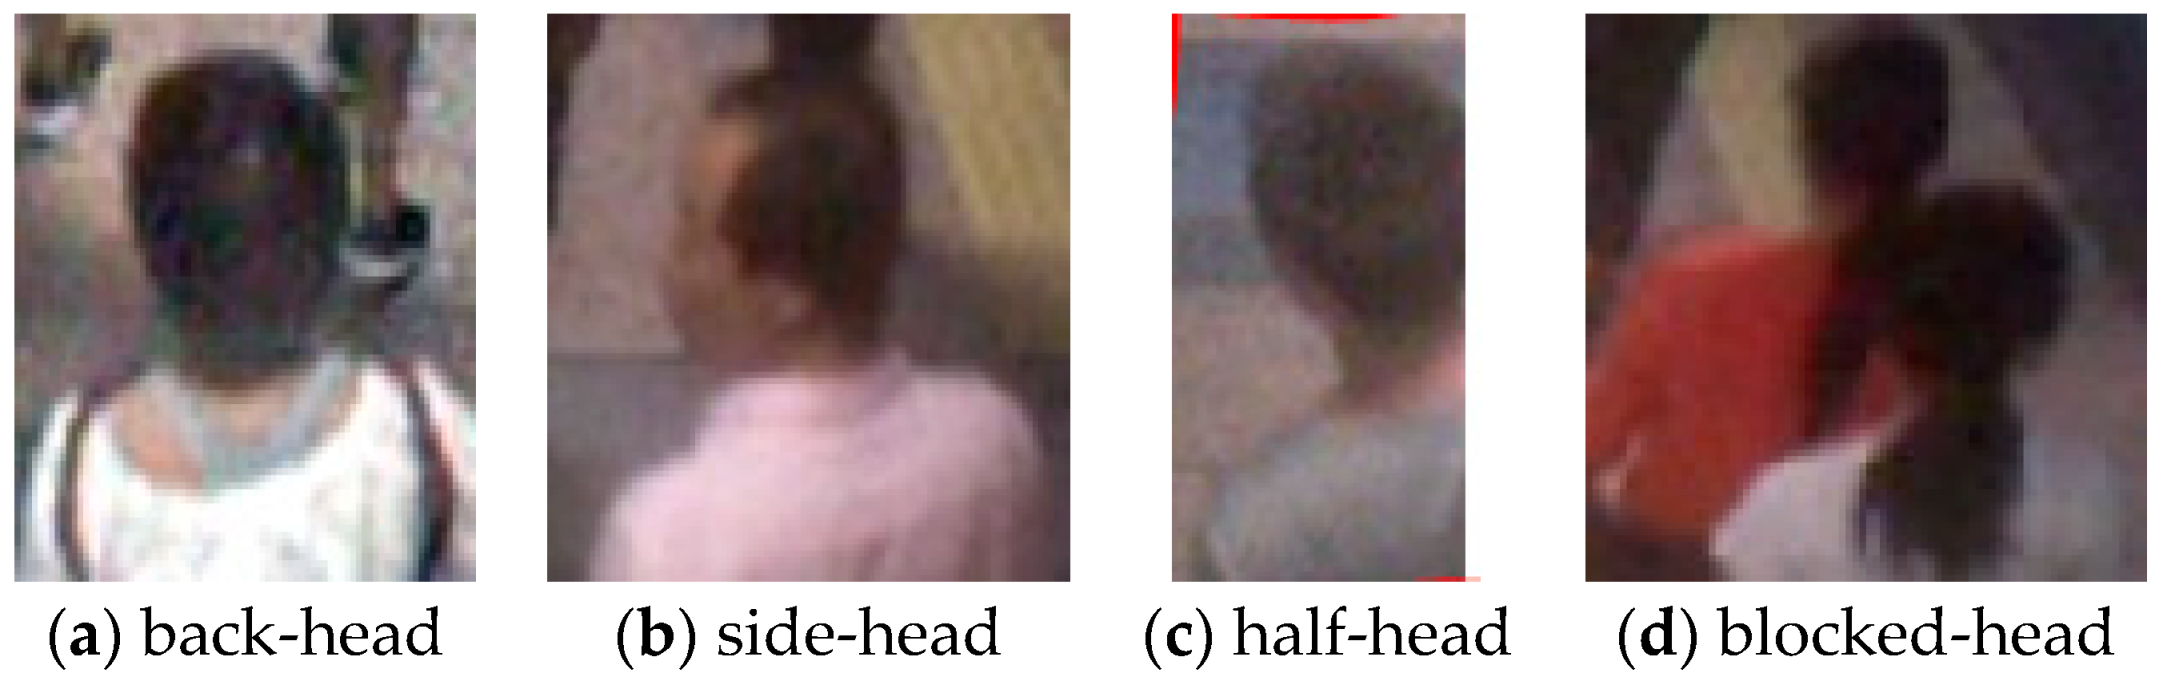
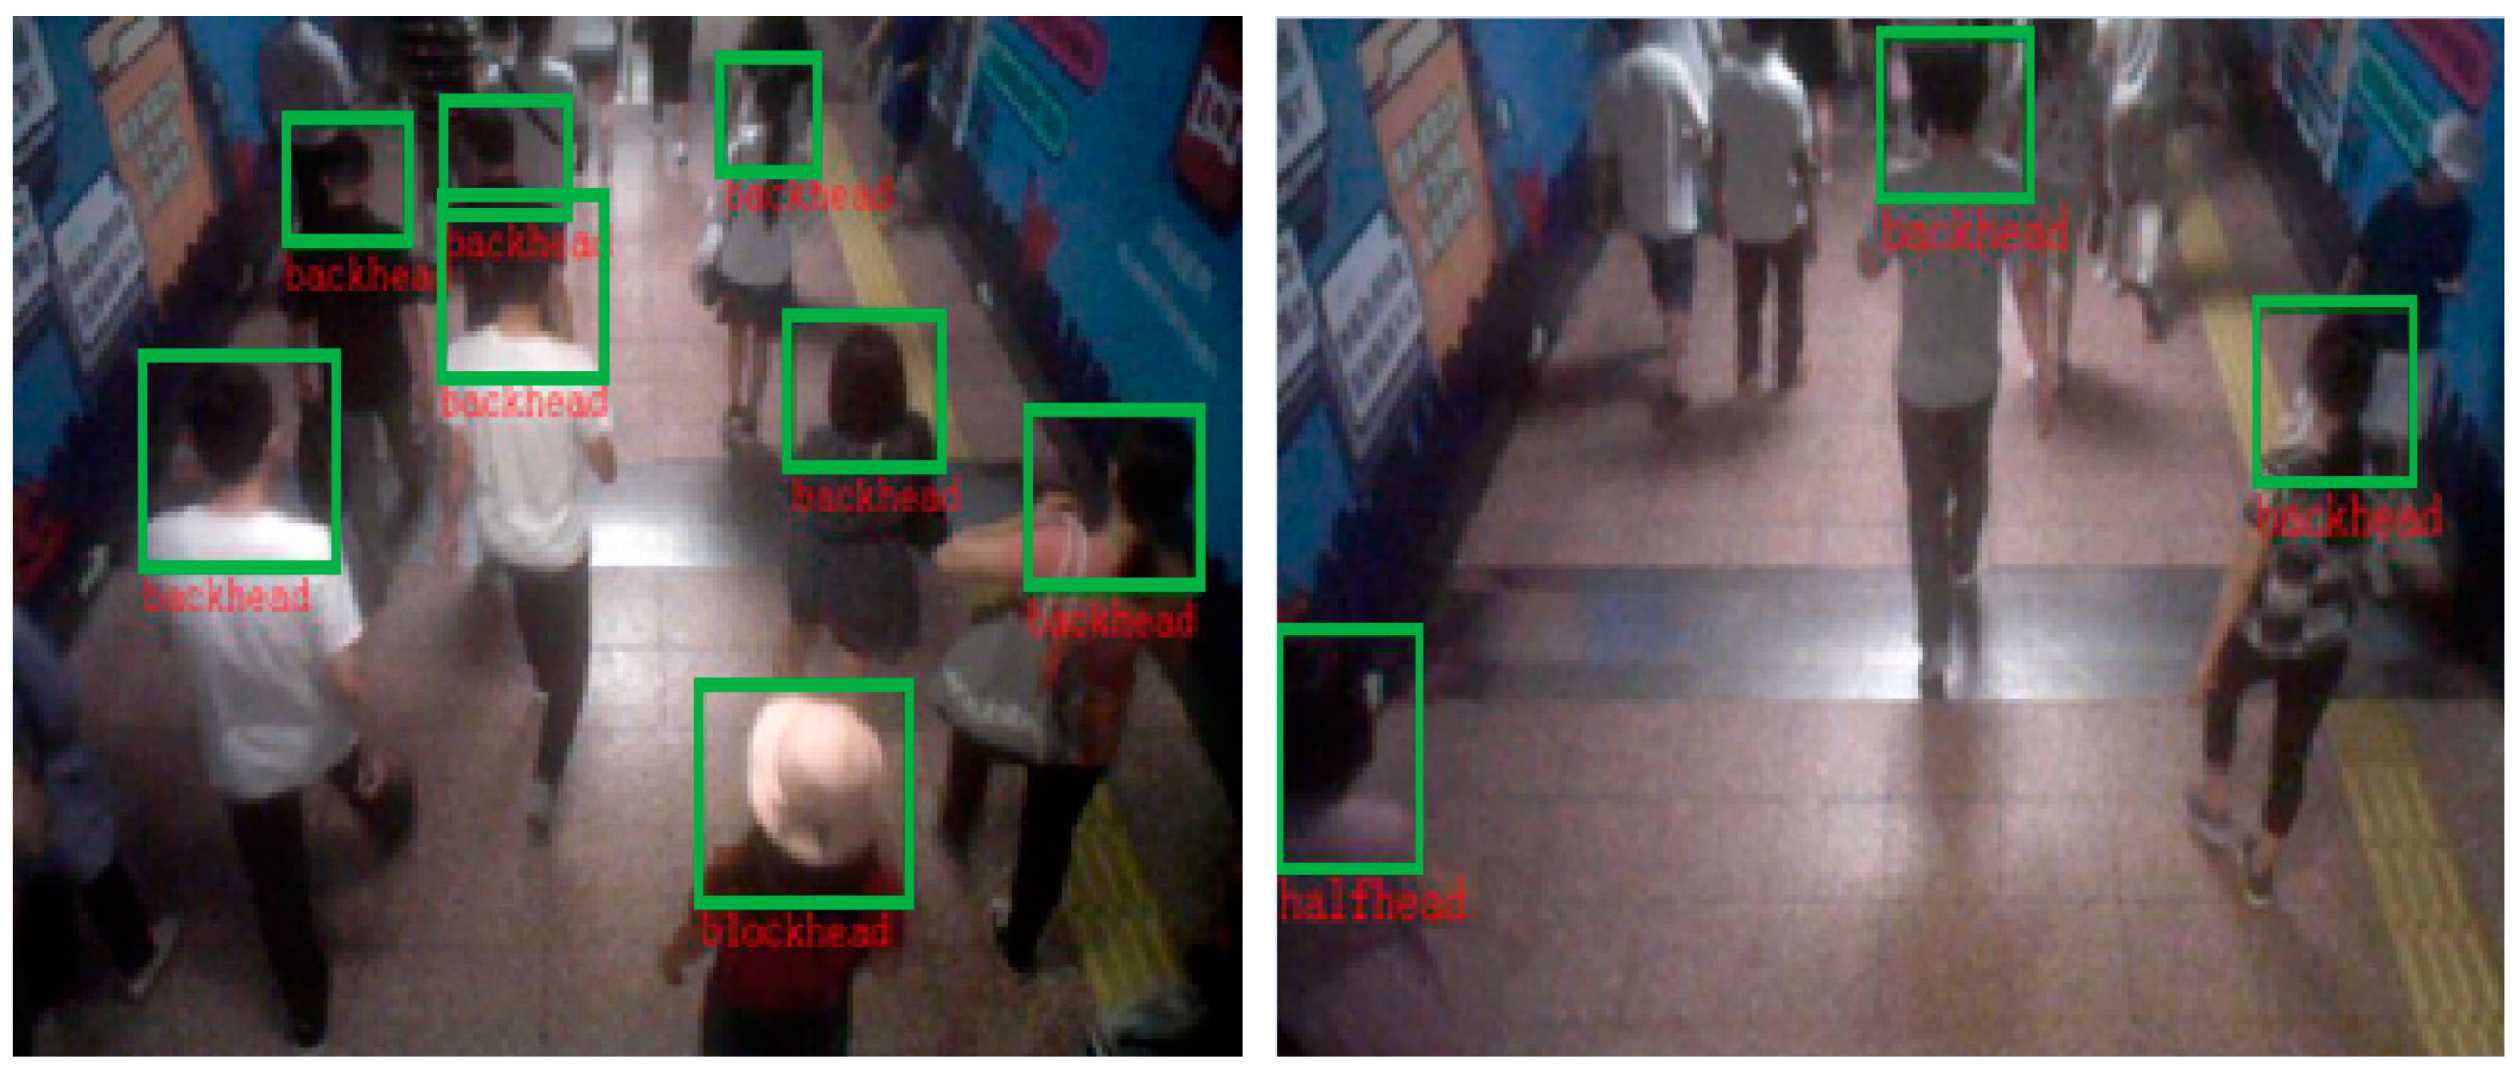
In multi-category calibration, we divided the data sample into four categories: back-head, side-head, partial-head, blocked-head, as shown in Figure 1.
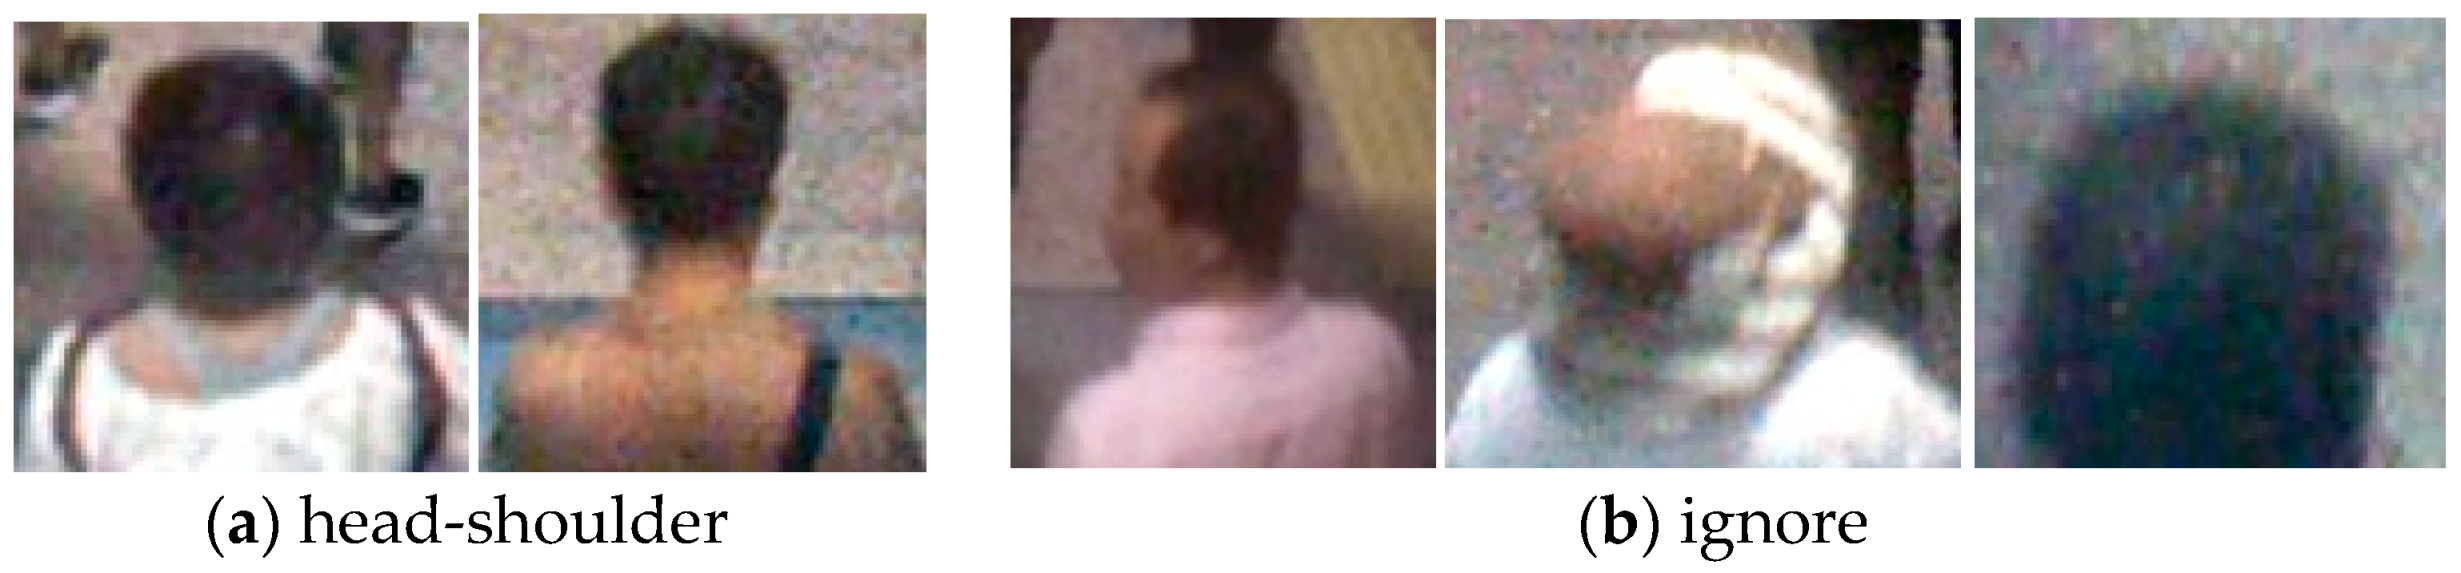
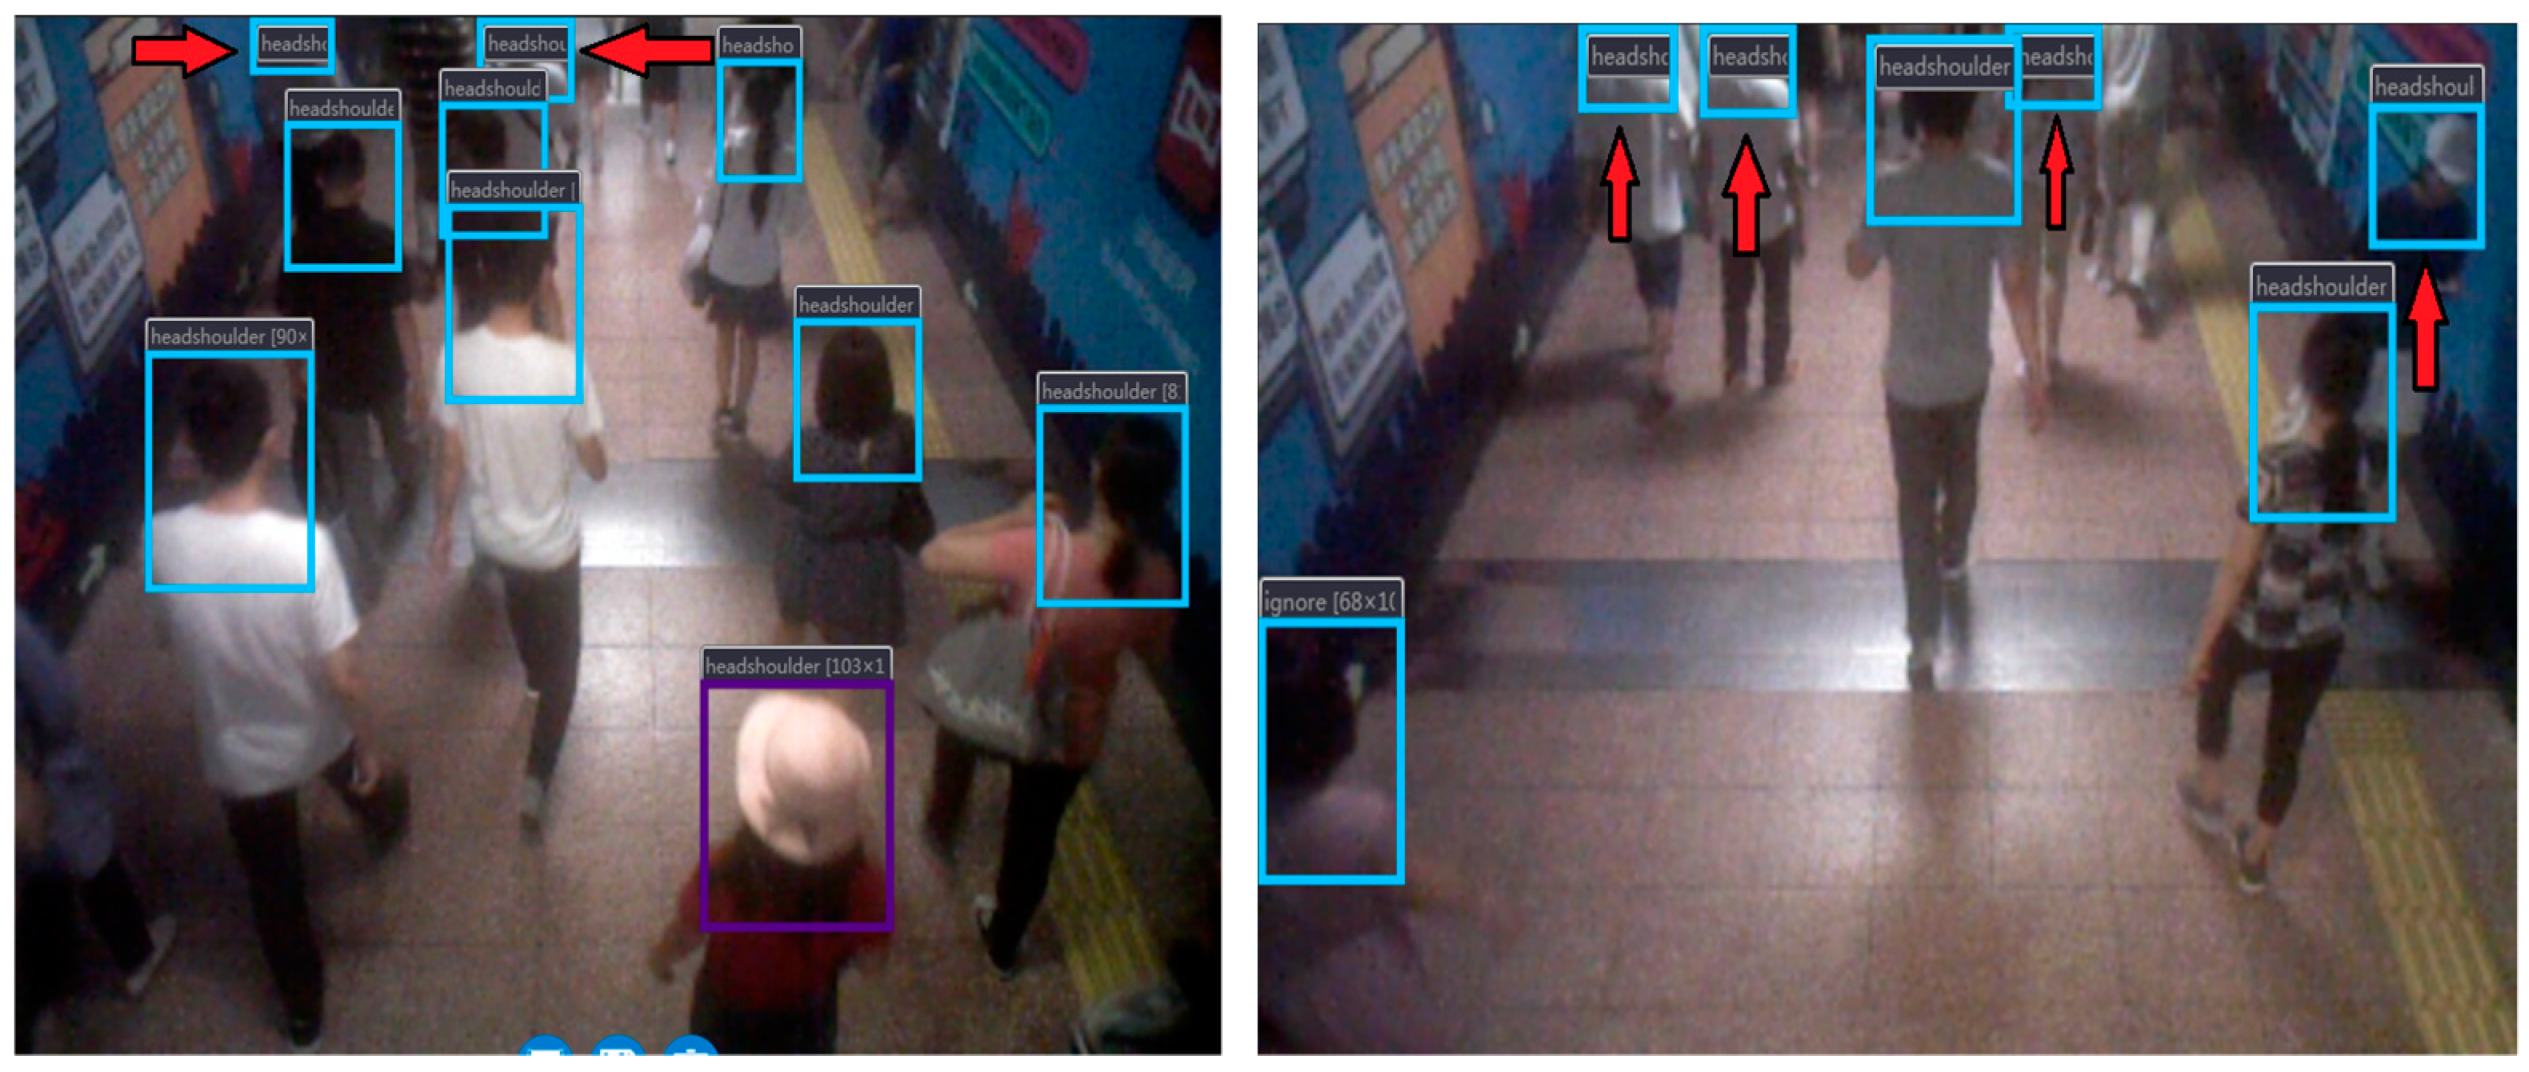
In less-category calibration, we divided the passenger flow into two categories: head-shoulder (same as the back-head category in the Figure 1), ignore (including the side-head, half-head, and blocked-head categories), as shown in Figure 2.
Then, these image samples are input to the VGG-16 neural network for extracting CNN features. After a stack of convolutional layers and max-pooling layers, the final layer of the VGG-16 use soft-max classifier. For this layer we have
where Xi is the feature vector extracted by the VGG-16 neural network for the input sample i (captured single image); wi is the weight learned by the neural network; and y is the predicted category label in the set of all the category labels.
2.2. Automatic Color Enhancement
Automatic color enhancement is an effective method for color image enhancement, which can adjust the image contrast. Firstly, this method uses the differential methods to get the relationship between the target point and the surrounding pixels. Secondly, the relative light and dark relationship is calculated to correct the final pixel value.
For a color image, the following operation is performed independently on the red, green, and blue channels, and R is the slope function
where denotes the input gray image scaled in [0, 1]; x and y are two different points in the image; and ‖x − y‖ denotes Euclidean distance, for some .
In the second stage, the enhanced color channel is scaled within [0, 1] as given below
The ACE is equivalent to the minimization problem represented by
where ω(x, y) = 1/‖x − y‖, and M = maxxR(x). Though ACE produces high-quality enhancement, the direct computation of (1) is complex, which cost O(N4) operations for an image. In the following sections, two fast approximations of ACE that can reduce the cost to O(N2logN) are described.
• Polynomial Approximation
By replacing sα with a polynomial, the summation in R can be decomposed into convolutions, which reduces the computation complexity to O(N2logN). The slope function sα(t) = min{max{αt, −1}, 1} can be approximated by an odd polynomial,
where it is possible to decompose t into a sum of convolutions:
where * is cyclic convolution over T2, and T2 is a periodic torus. For each x, the evaluation of αn(x) costs O(1) operations. The convolutions can be efficiently computed with discrete cosine transform in O(N2logN) operations. For an RGB color image, 3M convolutions need to be computed.
• Interpolation
Here, we decompose the computation of (1) into convolutions by using interpolation, using the boundary handling and discrete cosine transform convolutions. Define the sum
(Lj) is a sequence that min I = L1 < L2 < … < Lj = max I, Then, we approximate R(x) by piecewise linear interpolation:
3. The Introduction of Faster R-CNN
Following R-CNN and fast R-CNN, researchers realized the latest object detection method, faster R-CNN, to further reduce the running time of the detection network. They suggested a region proposal network (RPN) to generate an object bounding-box, which replaces the previous selective search and uses convolution features of the entire image with the detection network. RPN is a network based on full convolution, which can simultaneously predict each location target area box and target score of input images. RPN aims to produce high quality region proposal for the fast R-CNN classification and detection. RPN and fast R-CNN can share the features of convolution during training. Thus, the overall structure of fast R-CNN can be considered as the integration of “RPN + fast R-CNN”.
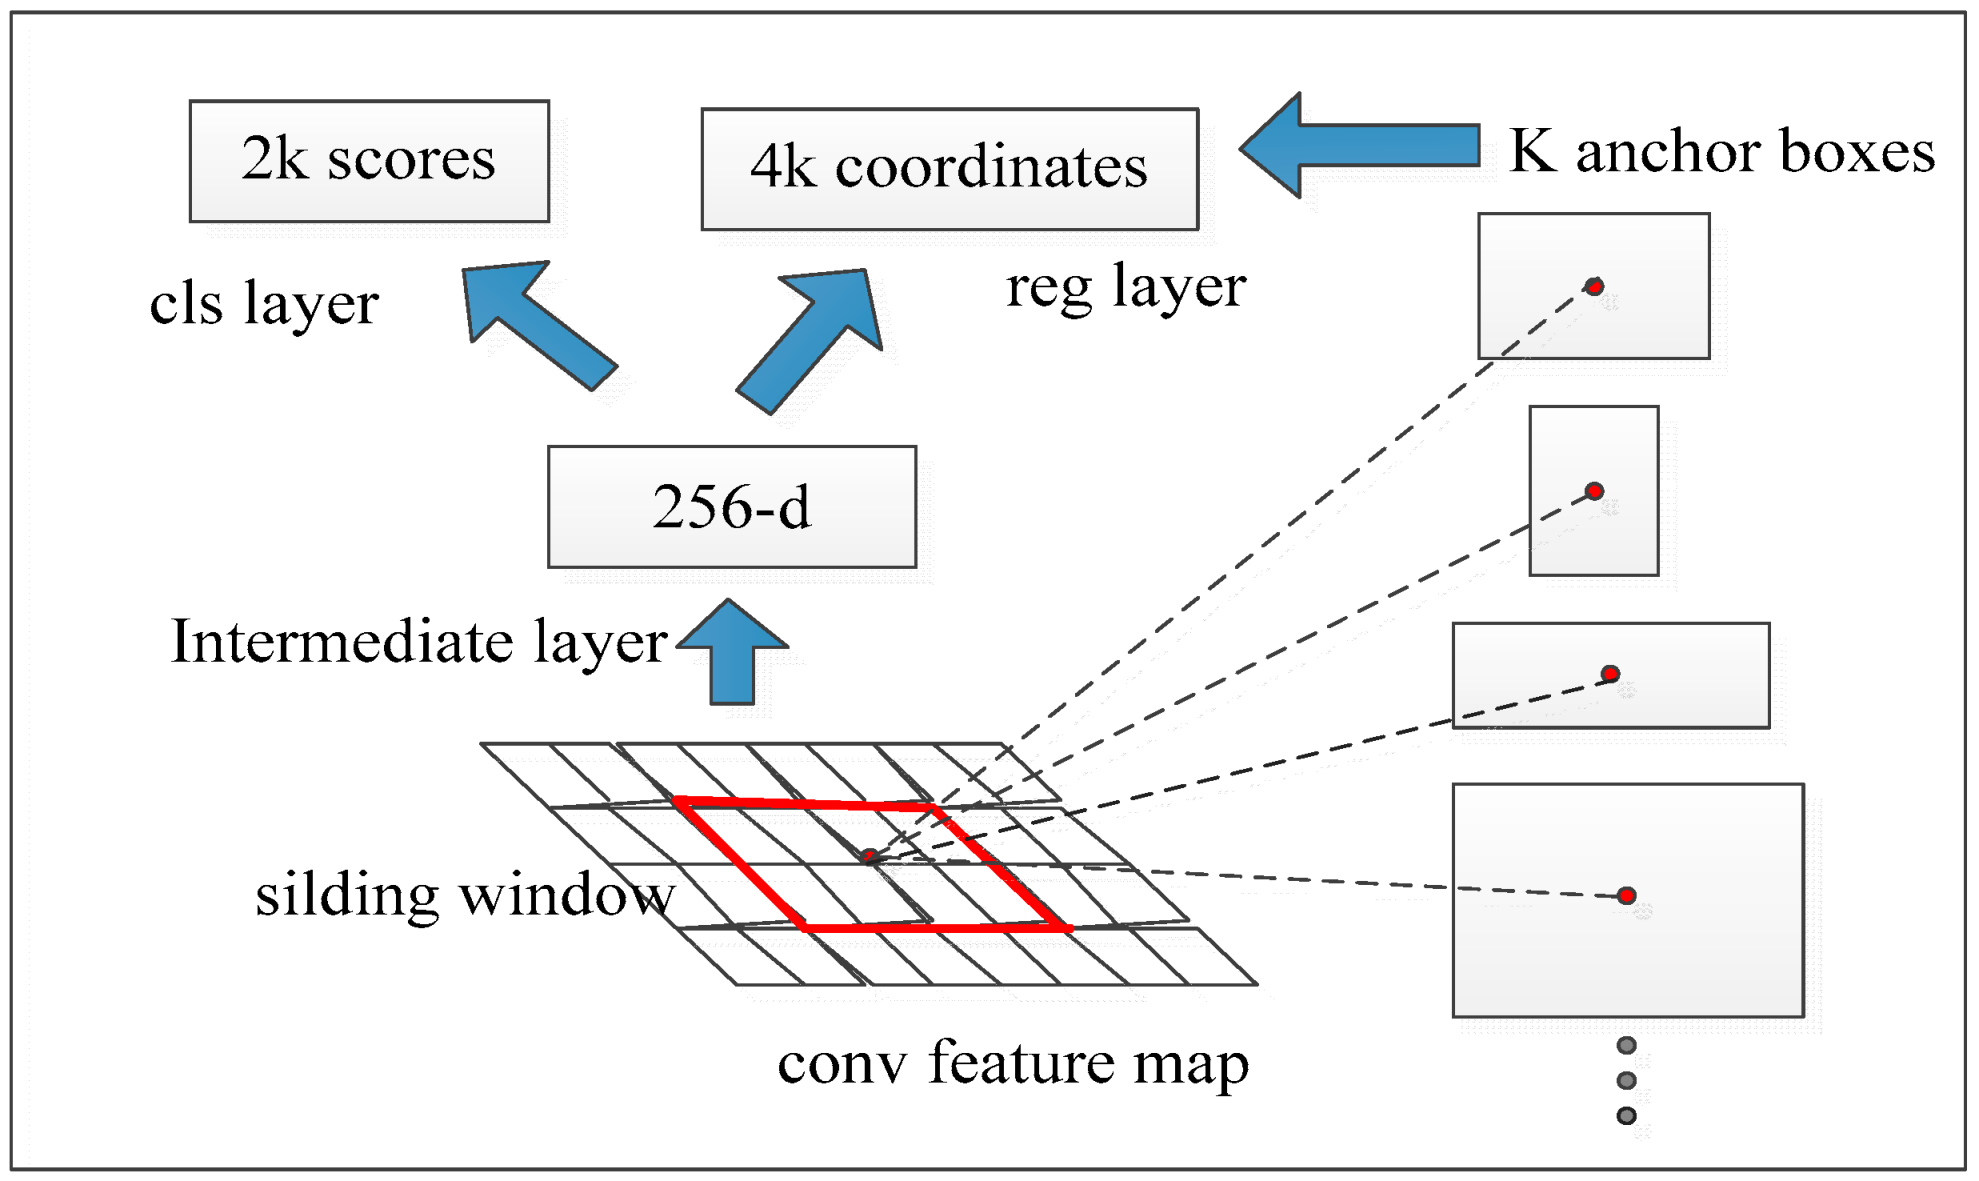
The RPN is connected to the feature map output by the last convolution layer through a sliding window (the red box in the Figure 3). Each window generates a 256-dimensional vector, which is further divided into two branches for classification and regression boxes. In addition, the researchers also propose the use of anchor, that is, the size of the original box of different proportions as the starting point of regression, rather than the entire window size. The method assumes that there are k types of anchor, then the final classification of the RPN has 2k outputs and the regression has 4k outputs.
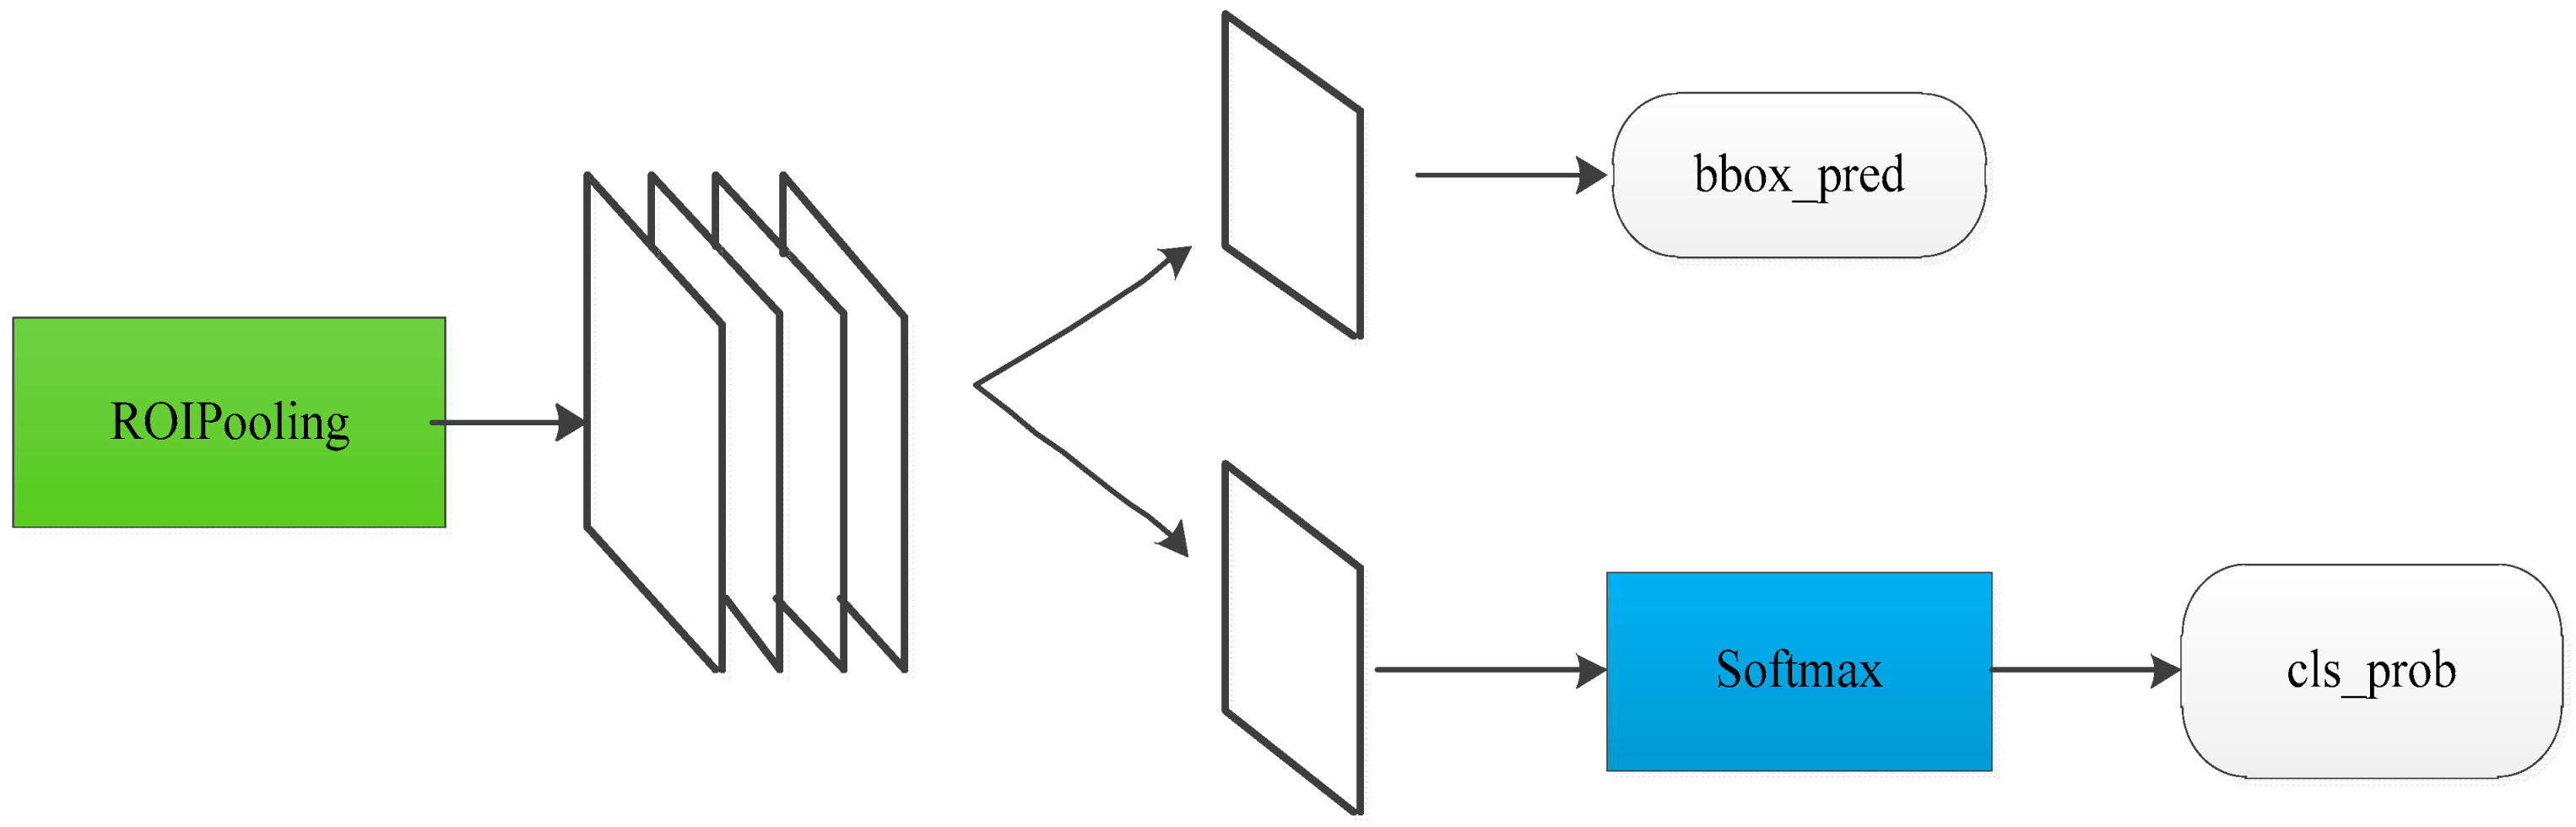
As is shown in the Figure 4, the next ROI (Region of Interest) pooling layer collects the input feature maps and proposals, combines the information, and extracts the proposal feature maps, and sends them to the subsequent full connection layer to determine the object category. On the stage of classification, the proposal feature maps that have been obtained are used to calculate the specific vector of each proposal through the full connect layer and soft-max classifier, then outputs the cls_prob (classification probability). At the same time, bounding-box regression is used again to obtain bbox_pred (the position offset of each proposal) for returning the object detection box.
4. The Experiments on Different Calibration Method and Using Image Enhancement to Process Samples
In this section, the dataset is described in detail. Then, we perform two groups of experiments using different calibration method. Next, we perform two groups of experiments using fast automatic color enhancement. Further, we perform experiments on the INRIA dataset and compare this with other state-of-the-art approaches on other public datasets.
4.1. The Description of Dataset
In order to cope with the hidden troubles that could arise when large quantities of passengers cannot be evacuated in a Beijing subway, our project aims to design a system to detect the numbers of subway passengers. Due to the high density of people in Beijing subway, other acknowledged datasets on pedestrian detection, such as INRIA, ETH, and MIT, cannot meet such density standards. Thus, these datasets cannot be used as training samples.
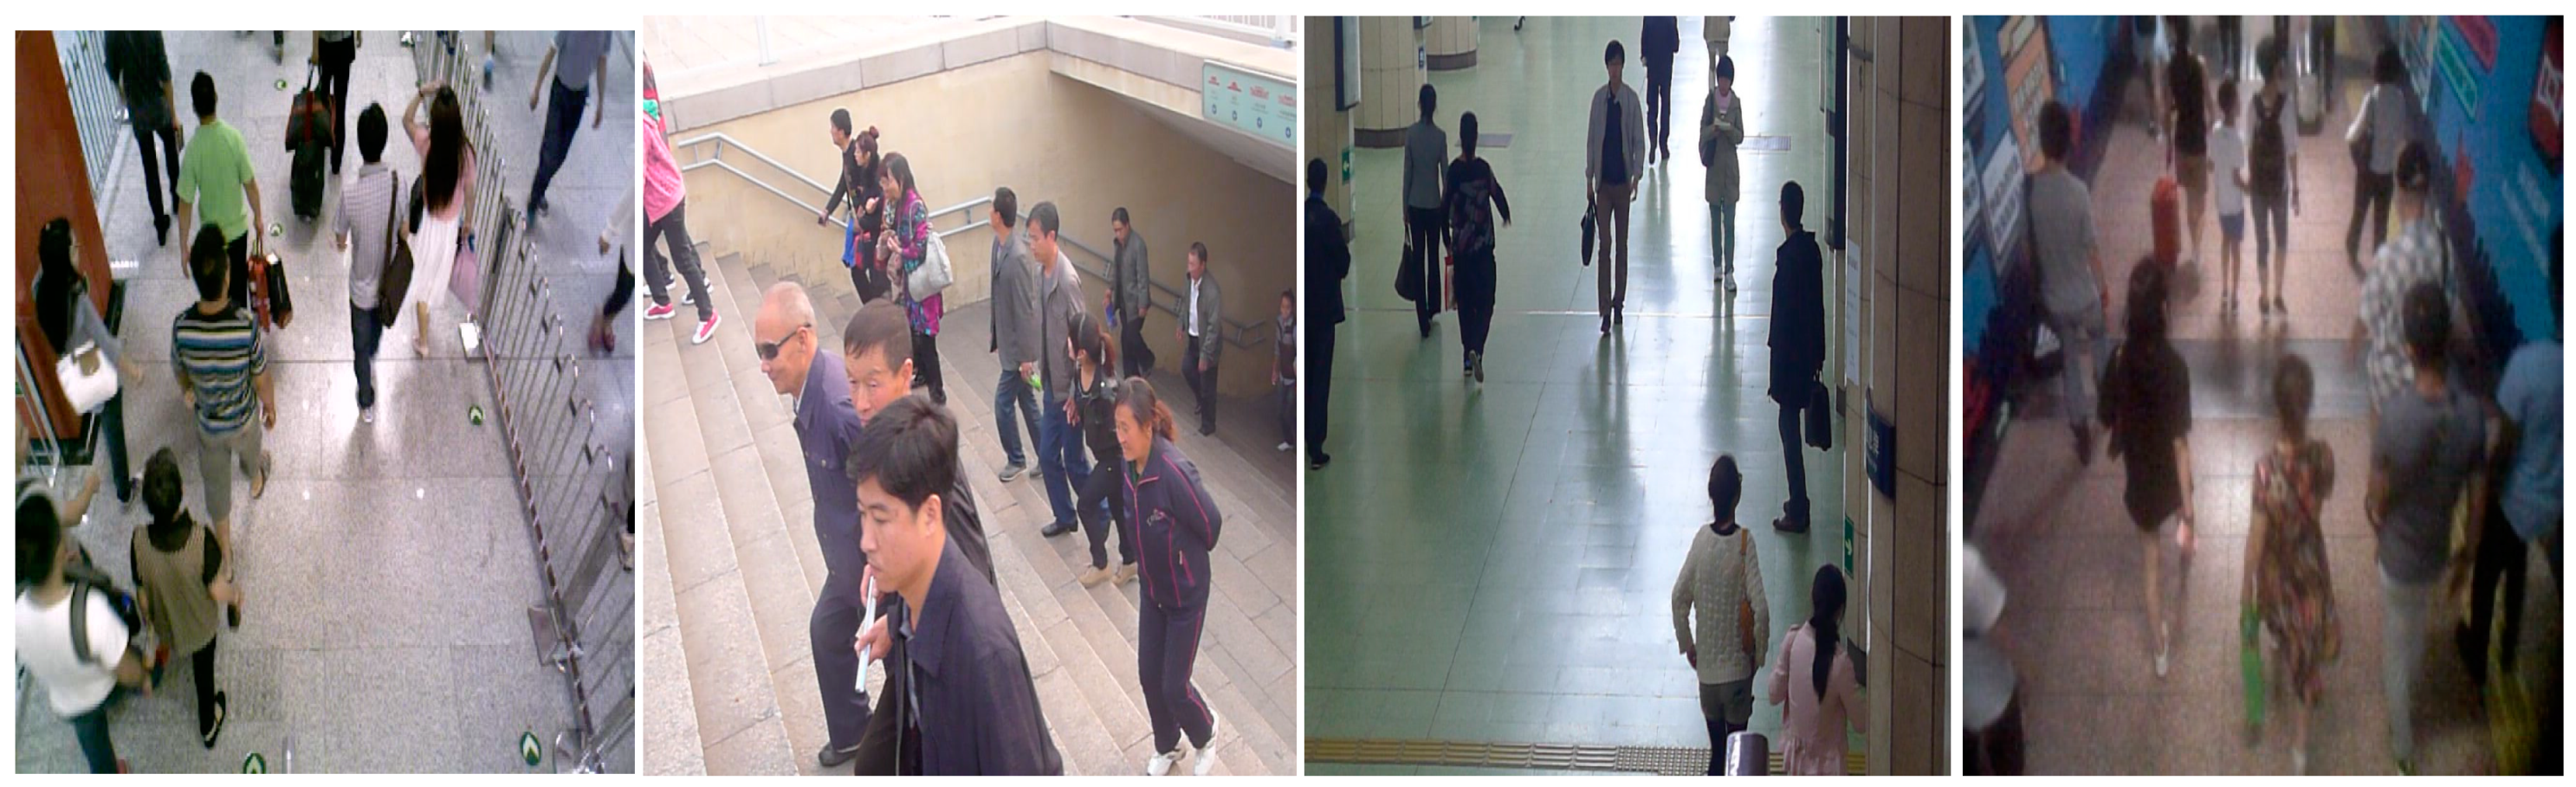
In order to obtain the subway passenger data sample, we installed monitored devices at many Beijing subway stations. The viewing angle of these monitored devices is from top to bottom, and the original data collected is video. We took an image from every 10 frames in the video, and made these images into a data sample. The data sample contains a total number of 10,854 images, each of which has size of 640 × 480. The different scenes of pedestrian flow in subway are shown in Figure 5.
4.2. The Performance of the Calibration Method
In the first experiment, we divide the data sample into four categories. Among all the categories, the back-head contains 36,135 rectangular calibration boxes, and the side-head, the half-head, and the blocked-head respectively contain 1772, 1550, and 1432 rectangular calibration boxes. We divide 10,854 images into a training set, a validation set, and a testing set. The training set contains 8000 images, the validation set contains 2000 images, and the remaining 854 images are for the test set. Next, we perform training on these data samples using VGG-16 network. The basic learning rate and the number of iterations are set to 0.001 and 70,000, respectively. For the RPN, we only use the first 300 proposals to balance the efficiency and accuracy. In order to further improve the accuracy, we focus on the issue of sample calibrating. It is well known that the quality of the training samples directly affects the generalization ability of the final model. Thus, we calibrate the data sample, again, for the results of the first experiment.
In the second experiment, we divide the passenger flow sample into two categories. The head–shoulder categories contain 43,954 rectangular calibration boxes, and the ignore categories contain 3933 rectangular calibration boxes. The calibration effects of two calibration results are shown separately in Figure 6 and Figure 7. The bounding-box contains too much background and misdetection in the first calibration. We start training on the VGG-16 networks according to the parameters of the experiment 1 after the data sample preparation completed. The results of two experiments are shown in Table 1.
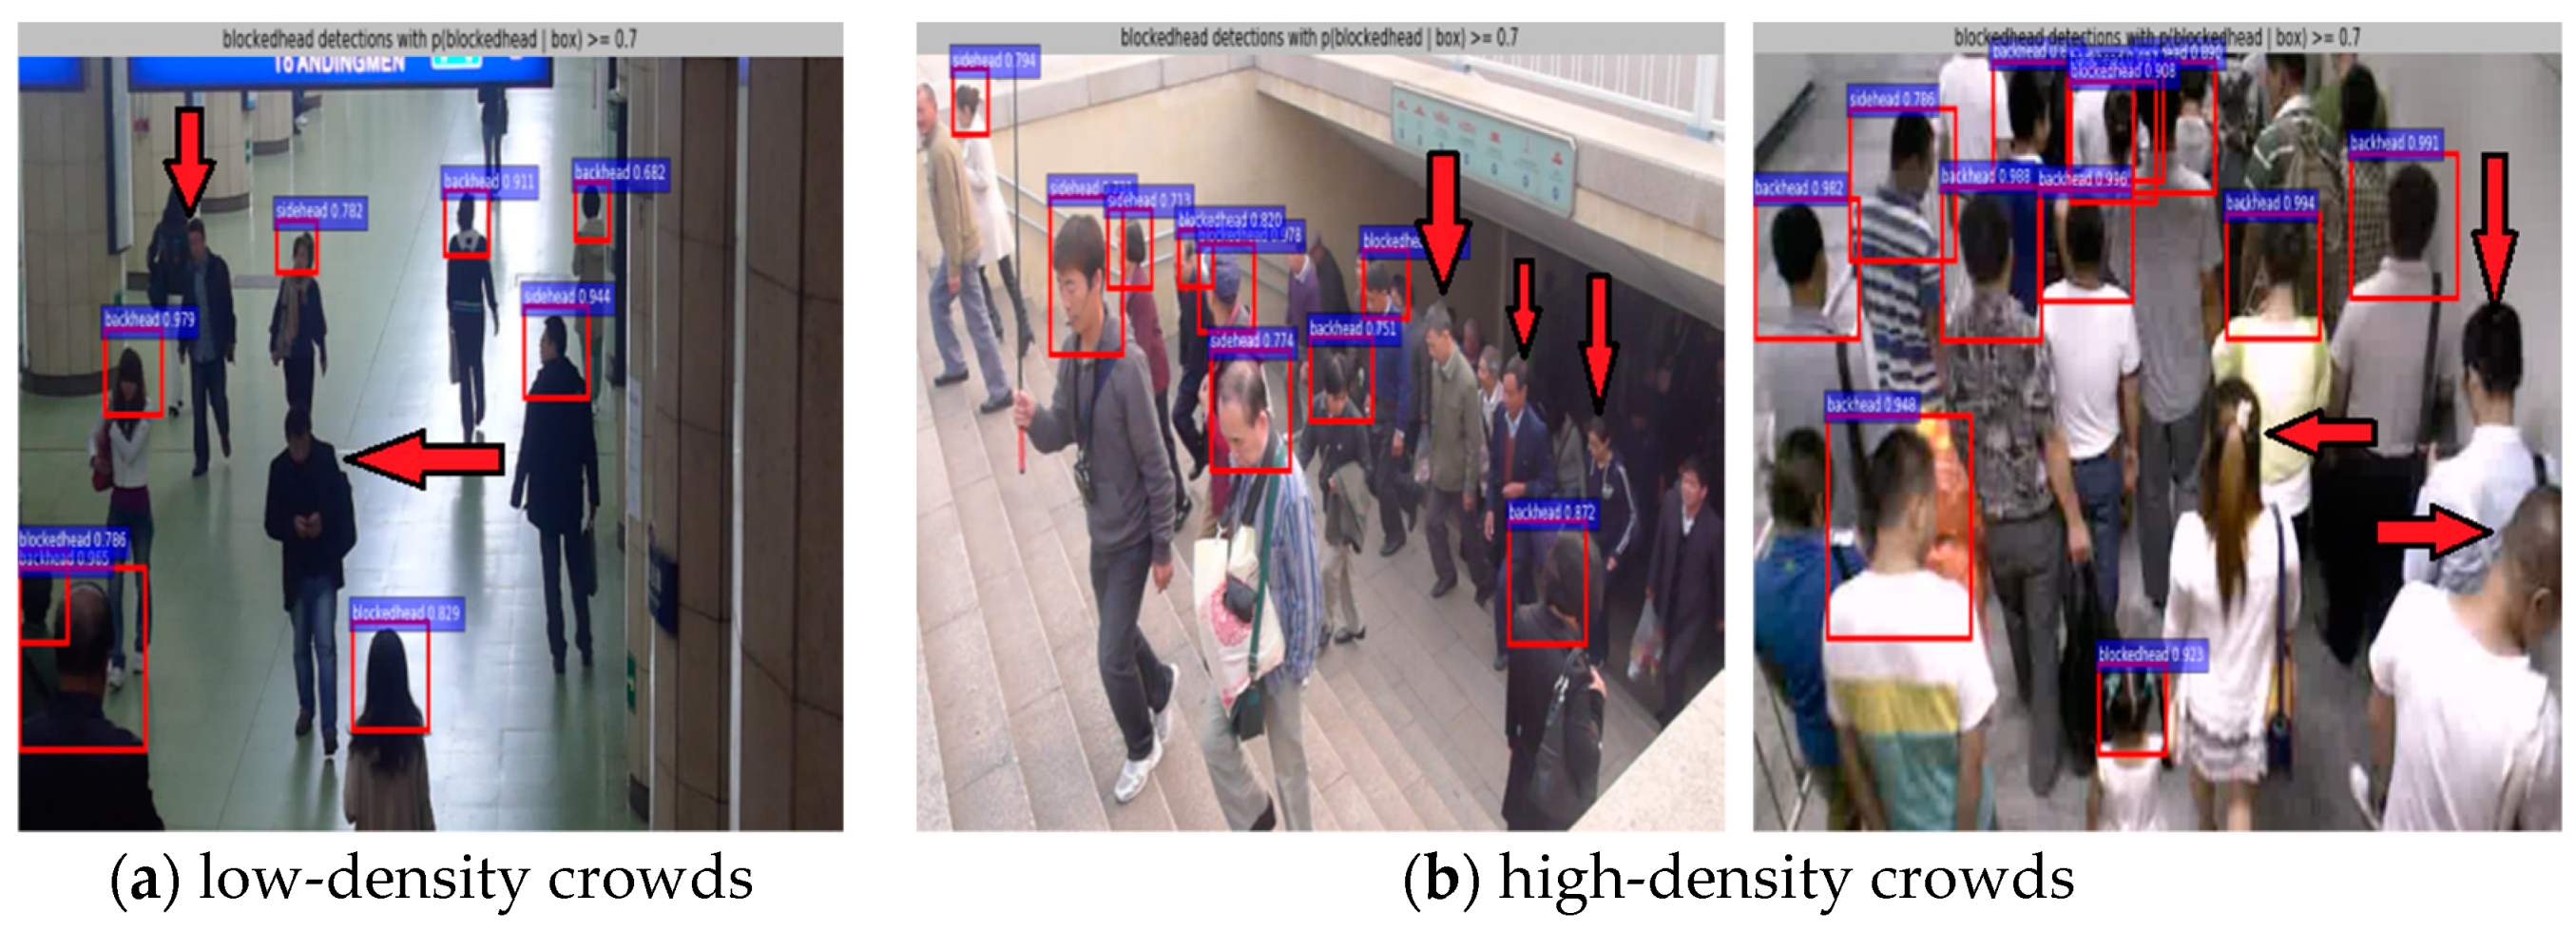
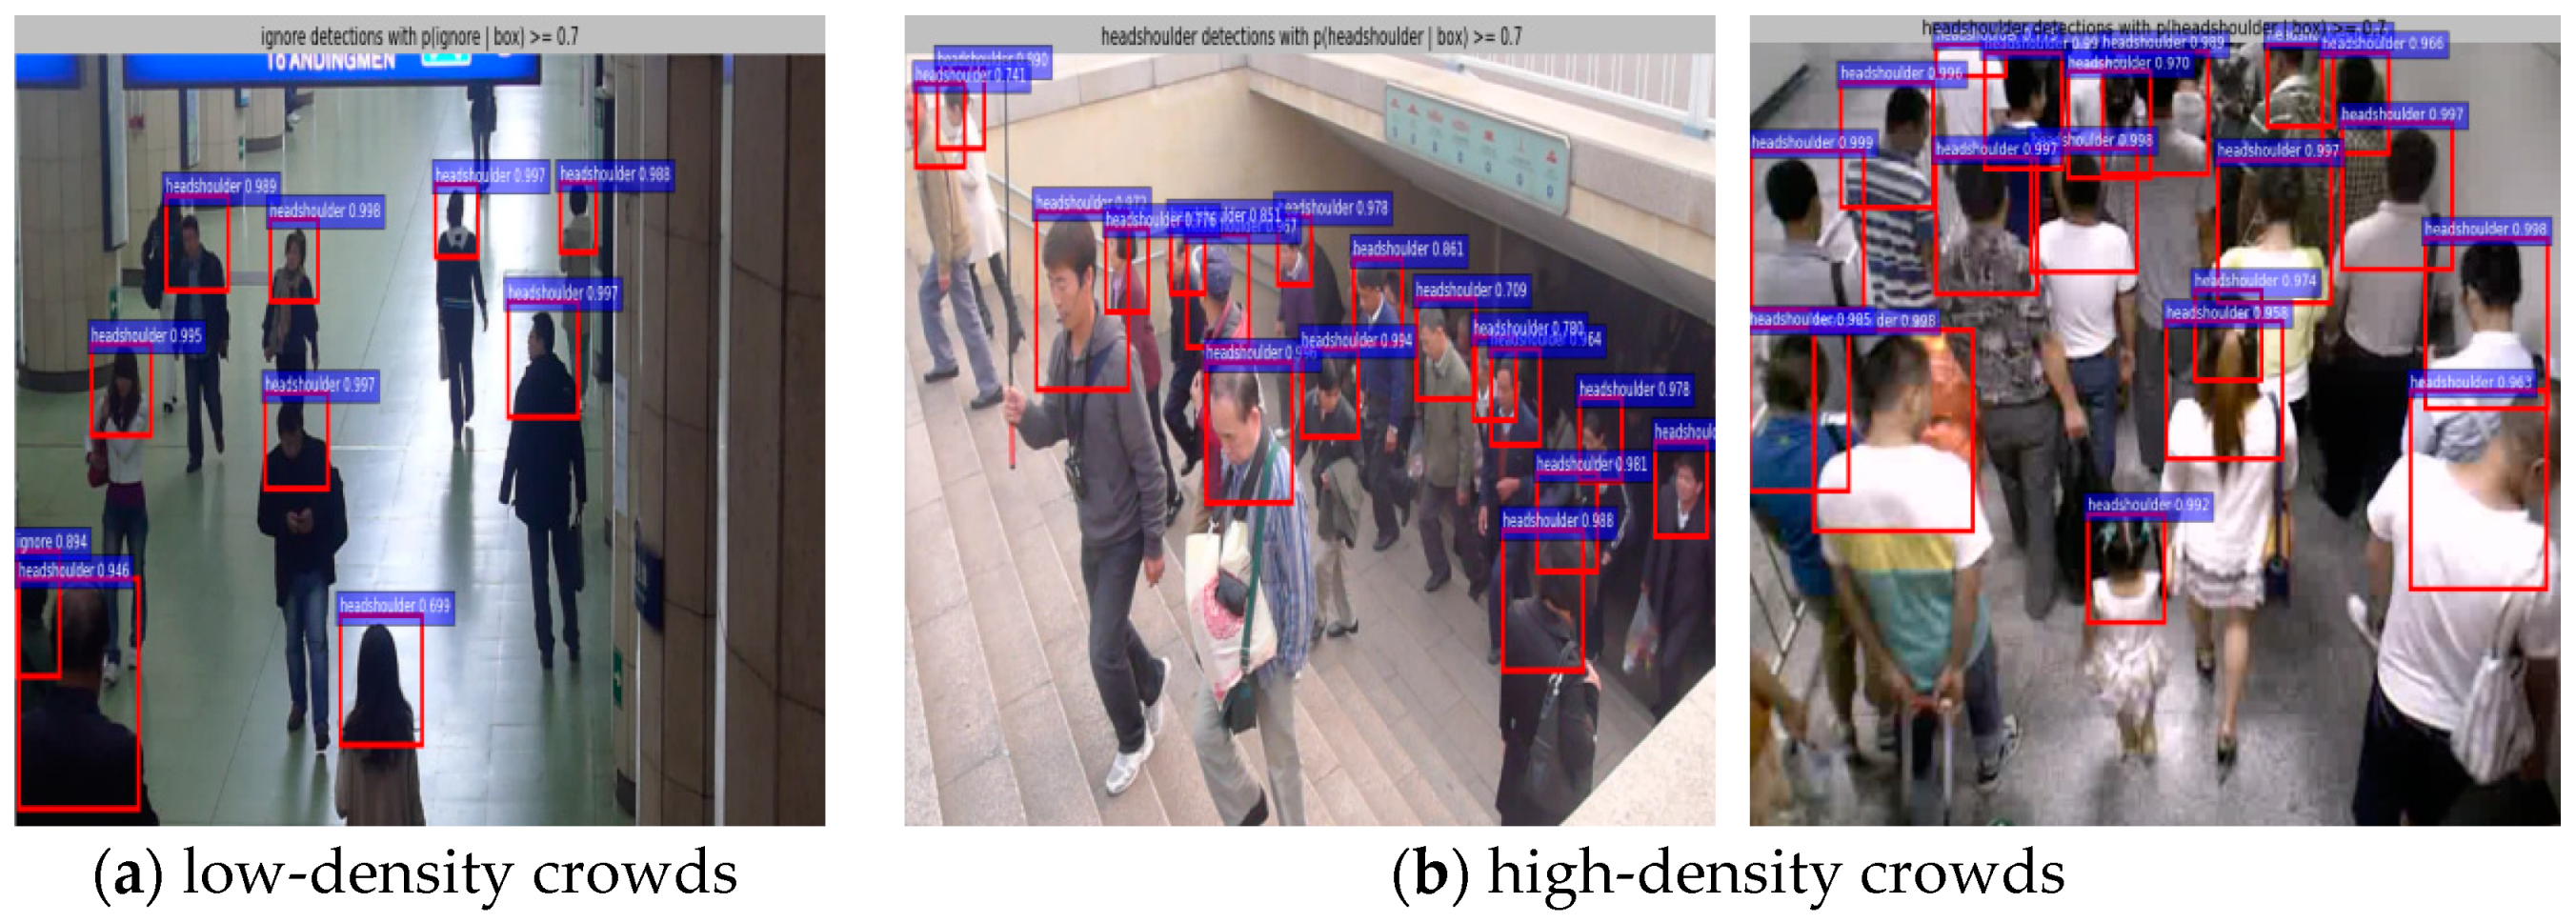
From the accuracy results, the second calibration method does increase the accuracy of networks. Further, two models trained by different calibration methods are tested in different sceneries. In Figure 8a and Figure 9a, the density of pedestrian flow is relatively sparse. In Figure 8b and Figure 9b, the density of pedestrian flow is relatively dense. Figure 8 shows the results of the VGG-16 model test results with 70,000 iterations in the first experiment, and Figure 9 shows the results of the VGG-16 model test with the same number of iterations in the second experiment. As we can see, the persons with the red arrow in Figure 8 are detected correctly in Figure 9. The model trained by less-category calibration has a better effect on detection.
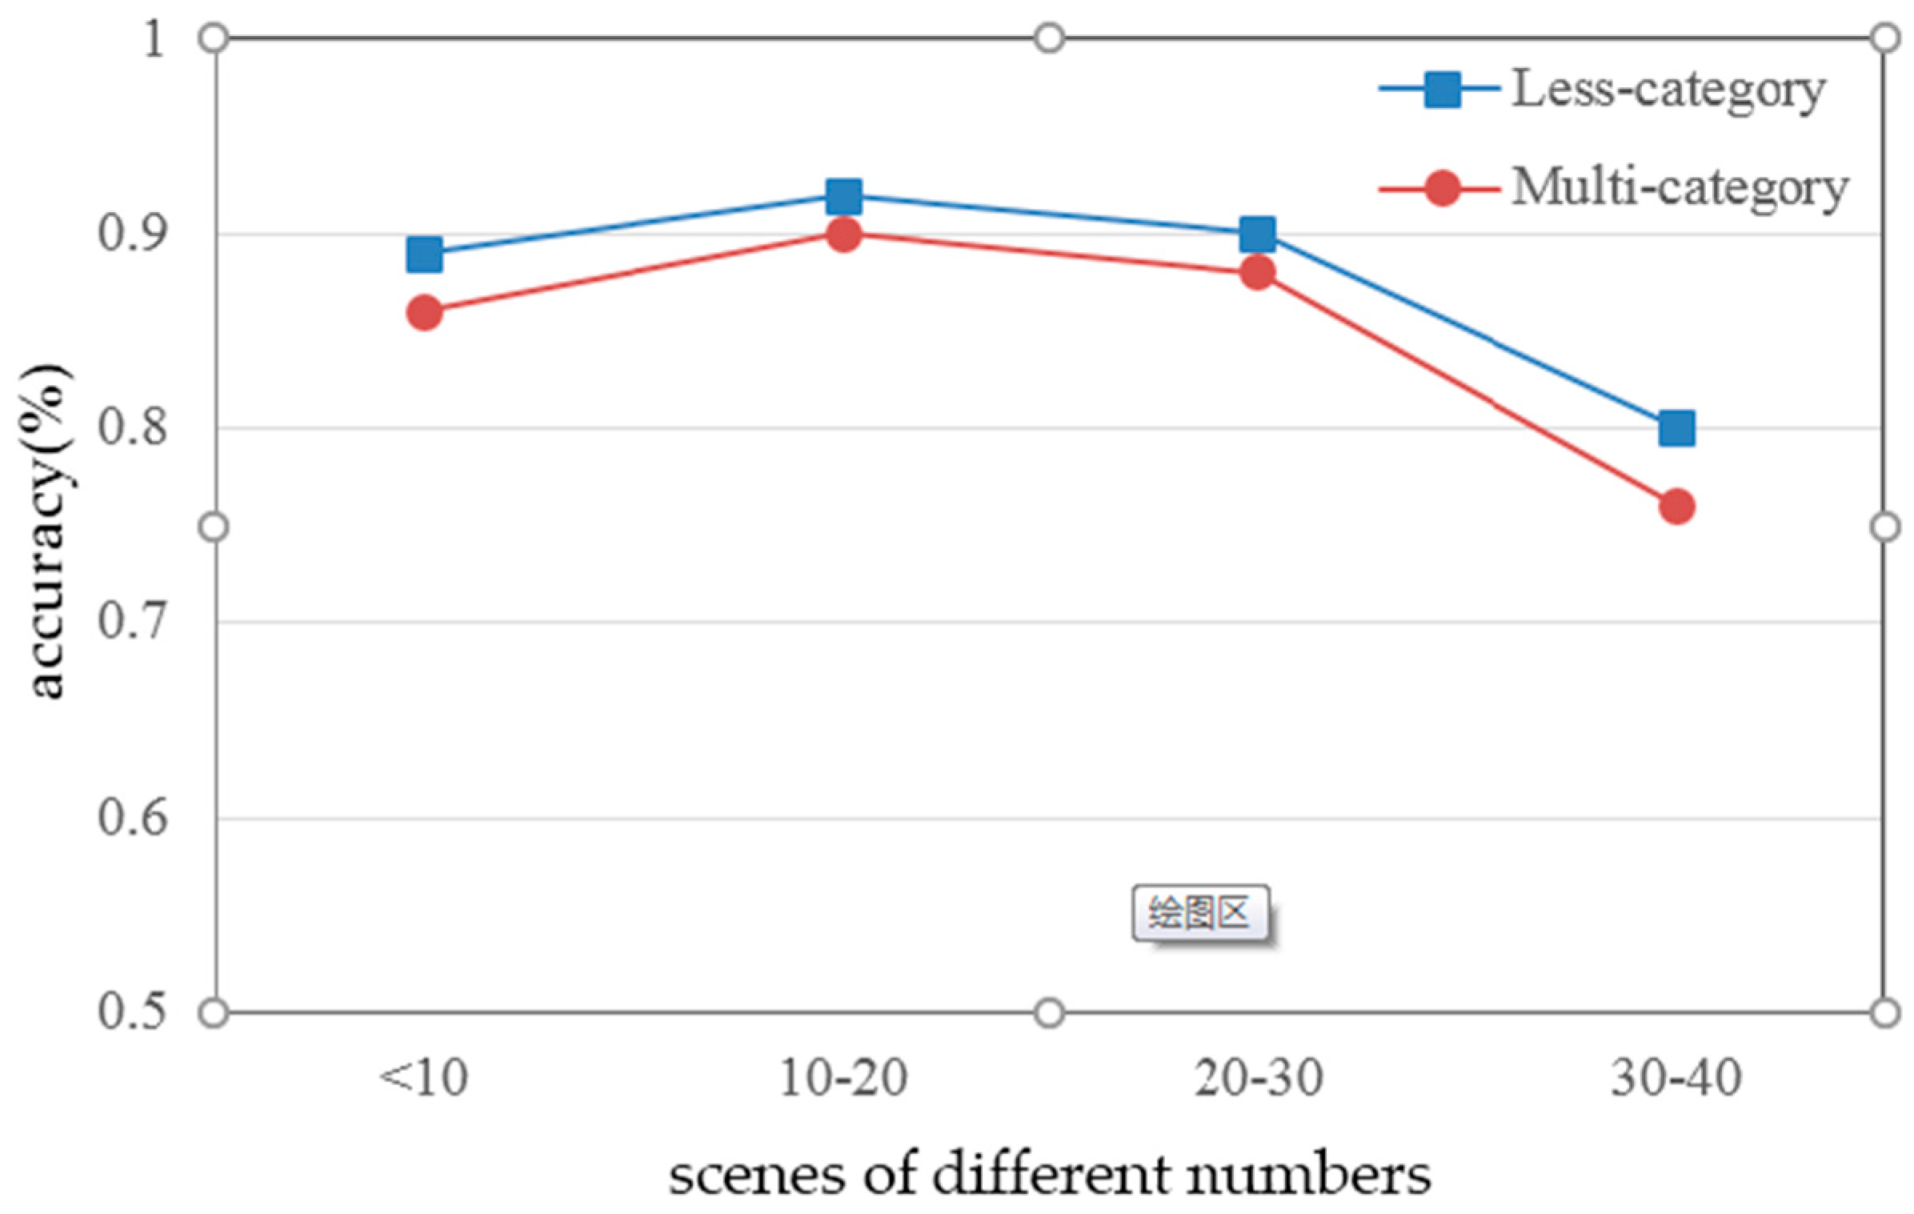
According to the comparison results, we find that the recognition rate of the model increases after we reduce the sample categories. We further divide the testing environment into four scenarios, and compare the detection accuracy, respectively, under the scenario where the number of people is less than 10, the number of people is between 10 and 20, the number of people is between 20 and 30, and the number of people is more than 40. Finally, we get the recognition rate of VGG-16 model in two experiments with different calibration methods, as shown in Figure 10, in which the recognition rate of the second experiment is higher than that of the first experiment.
4.3. Performance Analysis with Image Enhancement on Pedestrian Datasets
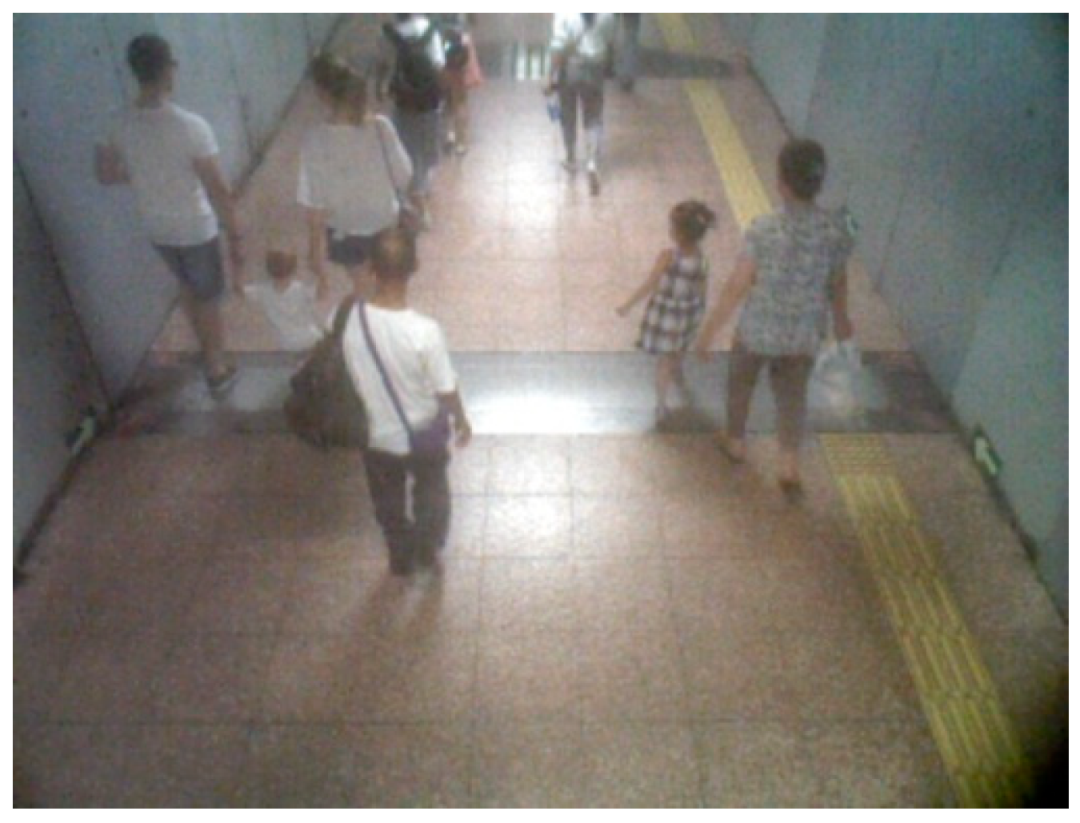
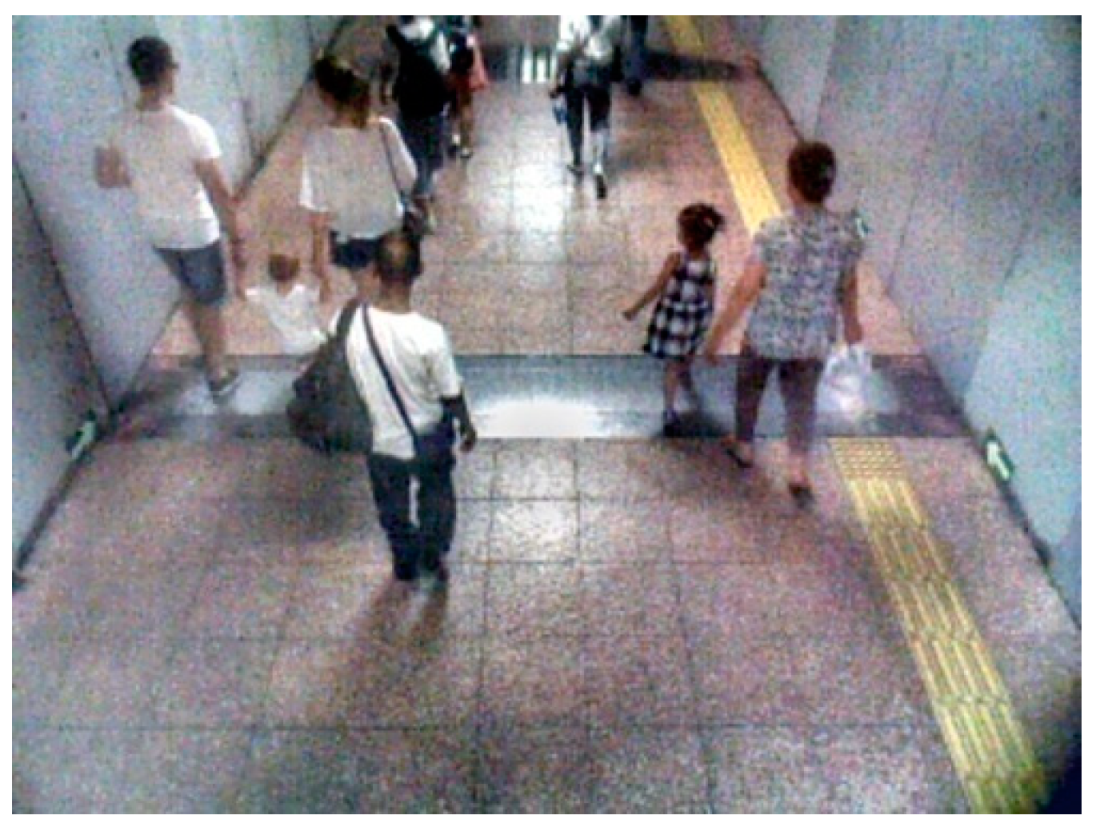
From the above experiments, we found that the less-category calibration could accurately locate the bounding-box and recognition rate. In this experiment, the fast ACE algorithm is used to automatically enhance the 10,854 pedestrian images and improve the image contrast. The enhancement results are shown in Figure 11 and Figure 12.
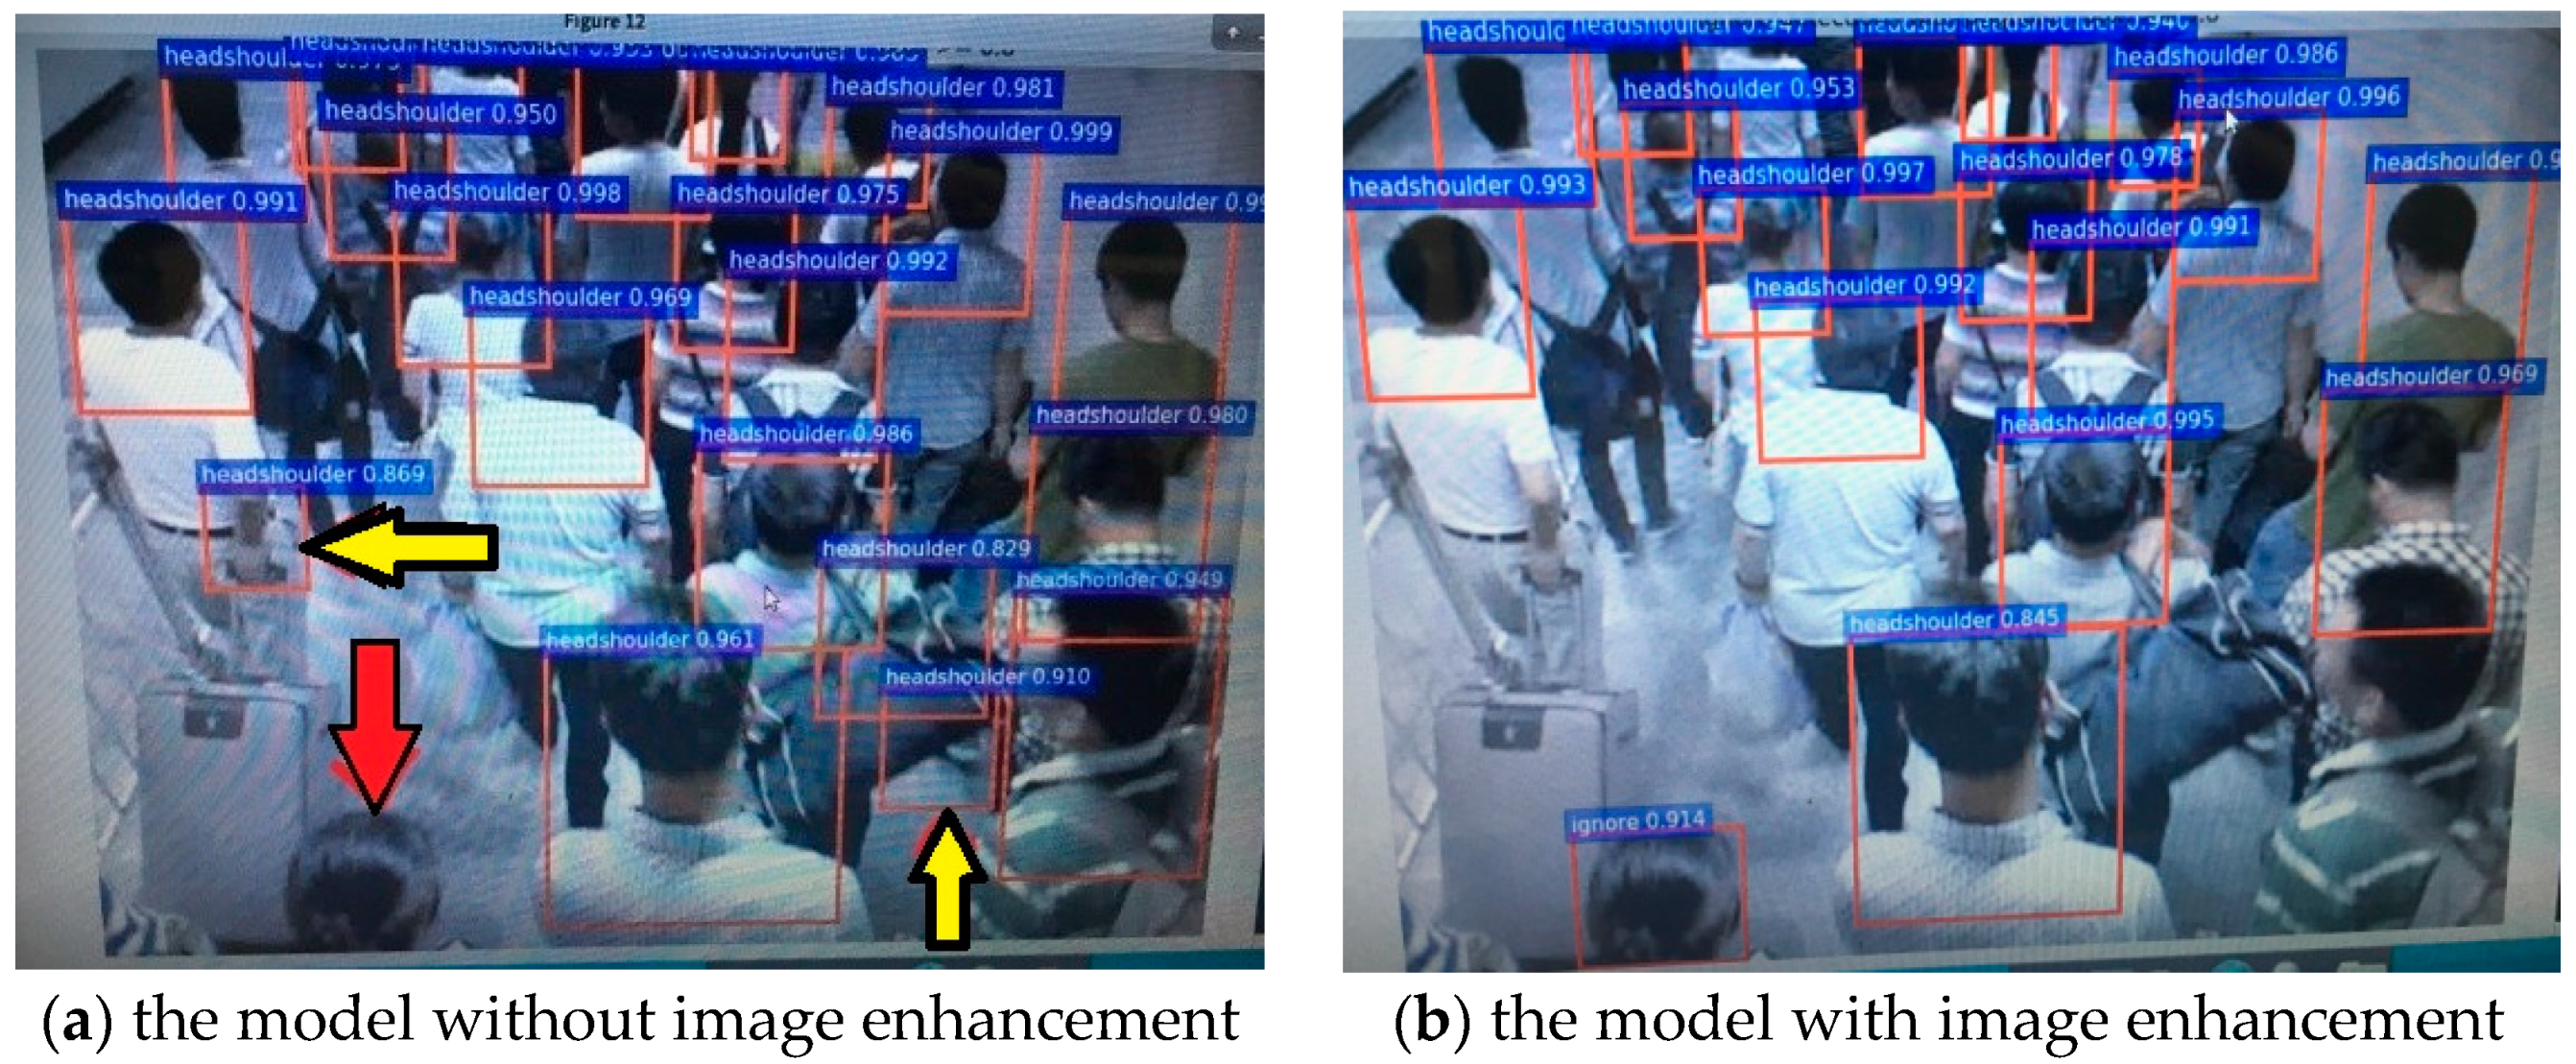
We use the less-category calibration to calibrate the samples in the dataset and select VGG-16 convolution neural network for training and testing, which are performed on the GPU Tesla K80 based on the deep learning framework of Caffe. There are 20 images in subway tunnels, selected from the testing set which contains 854 images, and we compared the specific detection effect (false and miss) of the single image between the model without enhancement and the model with enhancement, and one of them is shown in Figure 13. As we can see, the false-detection remarked by yellow arrow in Figure 13a does not happen in Figure 13b, and the person with the red arrow in Figure 13a is detected in the Figure 13b. Compared with the datasets without image enhancement, the testing accuracy of enhanced datasets increases by 5.2%.
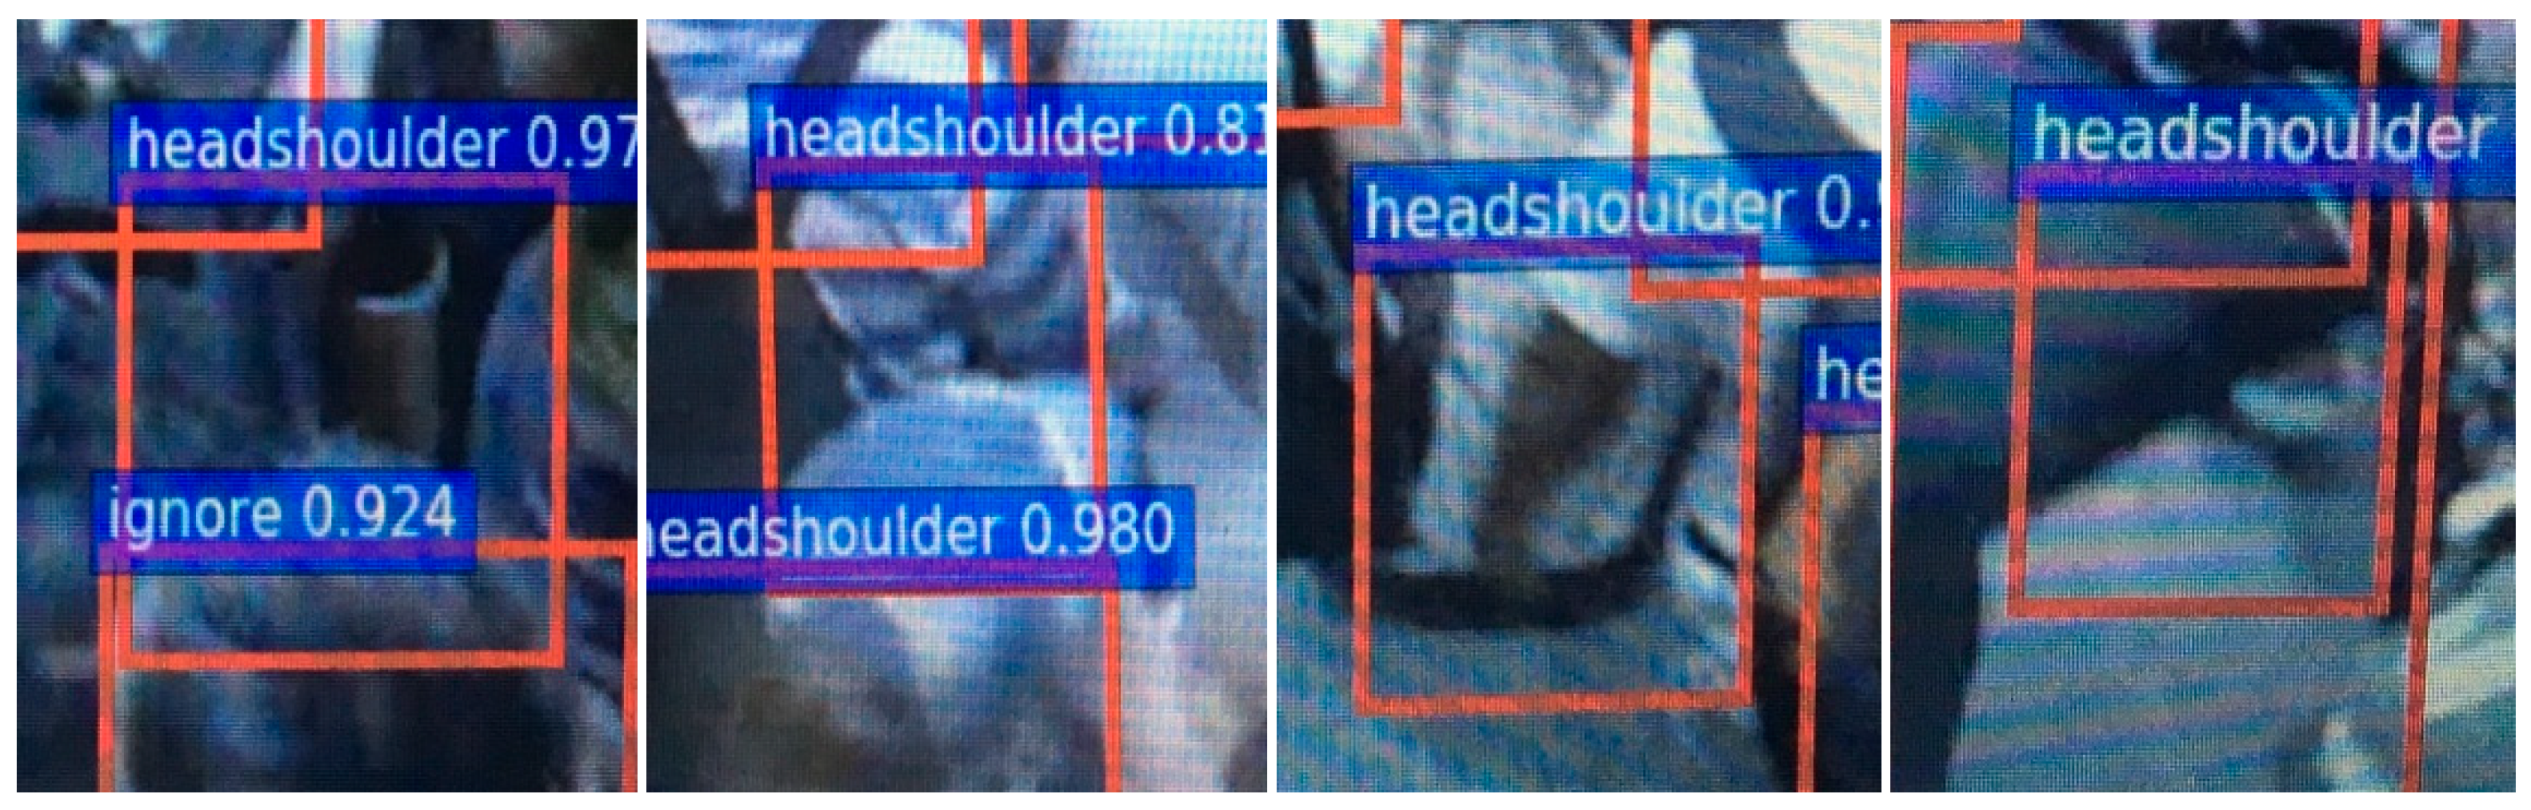
As we can see in the Figure 13, under the condition of dim light, the negative samples are similar to the head–shoulder samples that are easy to attribute to the positive samples for the model without enhancement. Moreover, the model with enhancement has obvious advantages on the sensibility to the color and contour, and less false- and misdetection. Figure 14 shows samples misclassified by the model without image enhancement.
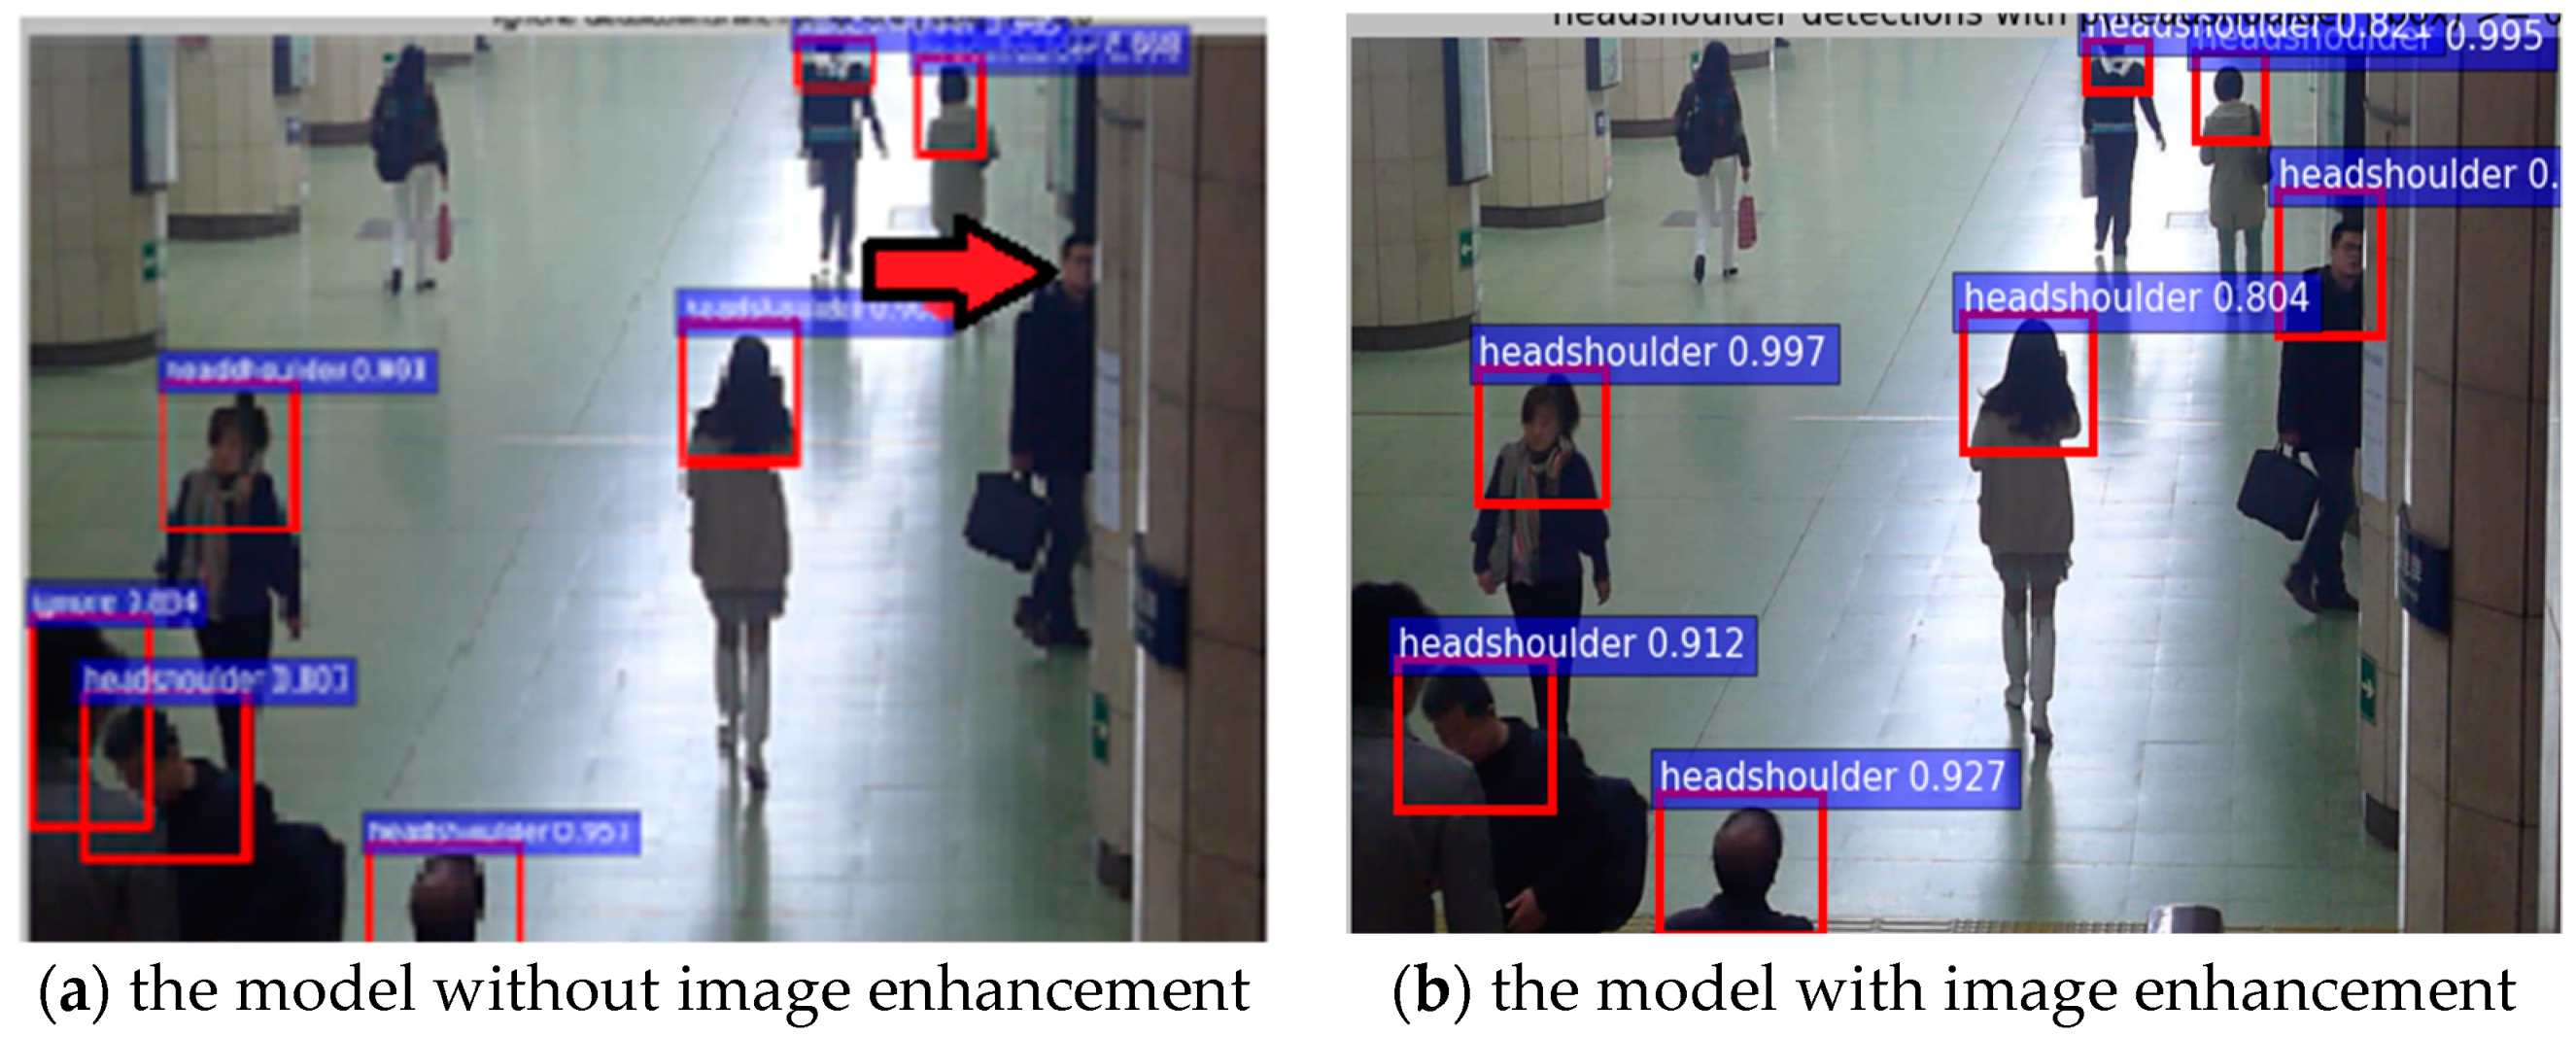
Then, twenty images in the subway platform are selected from the testing set. We compared the specific detection effect of the single image between the model without enhancement and the model with enhancement. Due to the high brightness and the large color difference between the background and pedestrian in Figure 15, the difference between the test effects on the two datasets is not obvious. However, compared with the non-enhanced dataset, the test accuracy of enhanced dataset still increases by 2.1%. The person with the red arrow in Figure 15a is detected in the Figure 15b.
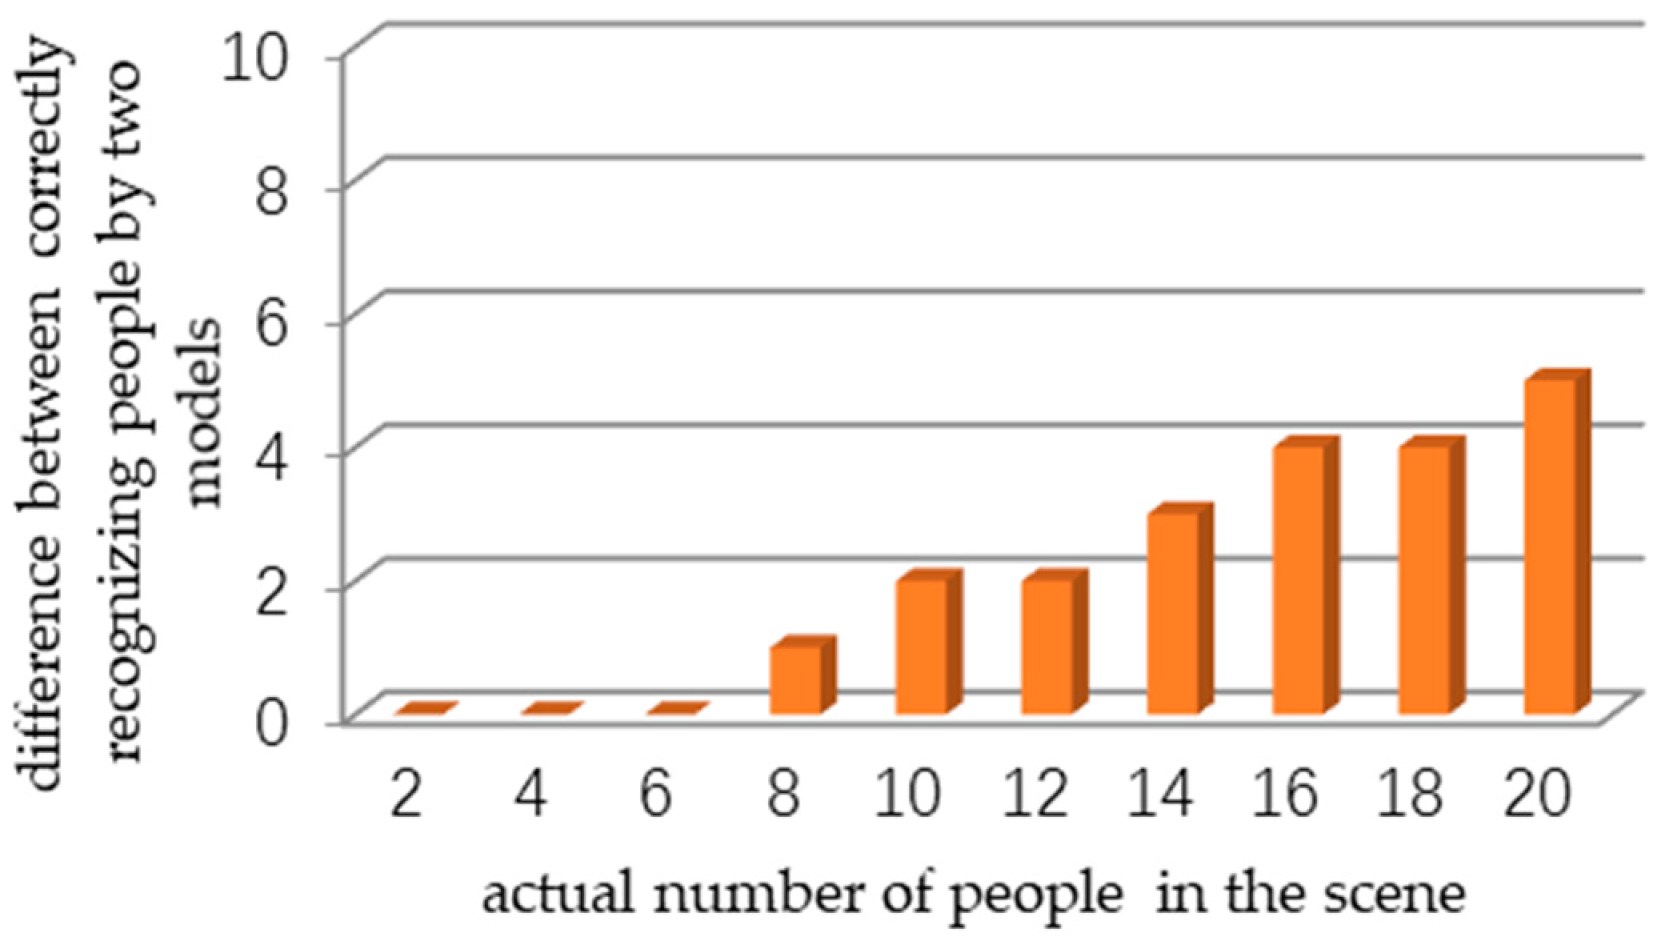
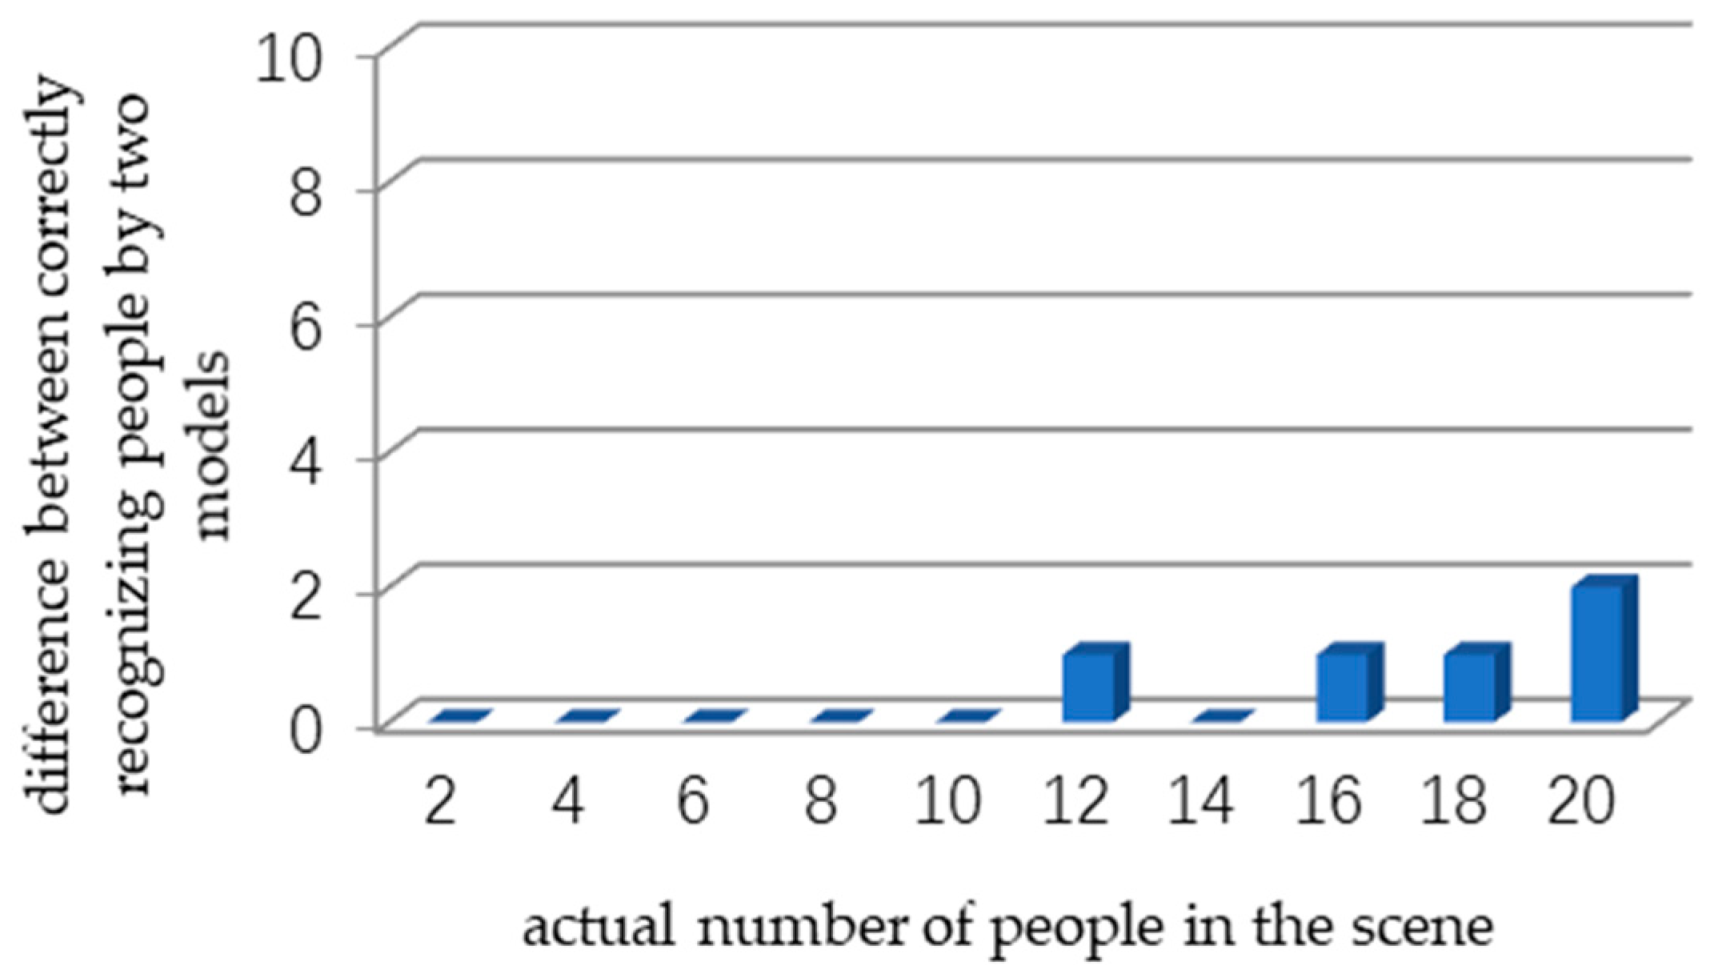
Furthermore, we conduct experiments in the subway tunnel with the number of pedestrians from 2 to 20, and compare the accuracy of the two models. As shown in Figure 16, a horizontal axis is the number of people in the scene; the vertical axis is the difference between correctly recognizing people by two models. The greater the difference is, the better the effect of the model with image enhancement is. The same experiment is also carried out on the subway platform, and the corresponding results are shown in Figure 17. In the bright environment, the difference between the two models is not obvious with the increase of the number of people. The mean average precision and used time taken by the enhanced model and unenhanced model are given in Table 2.
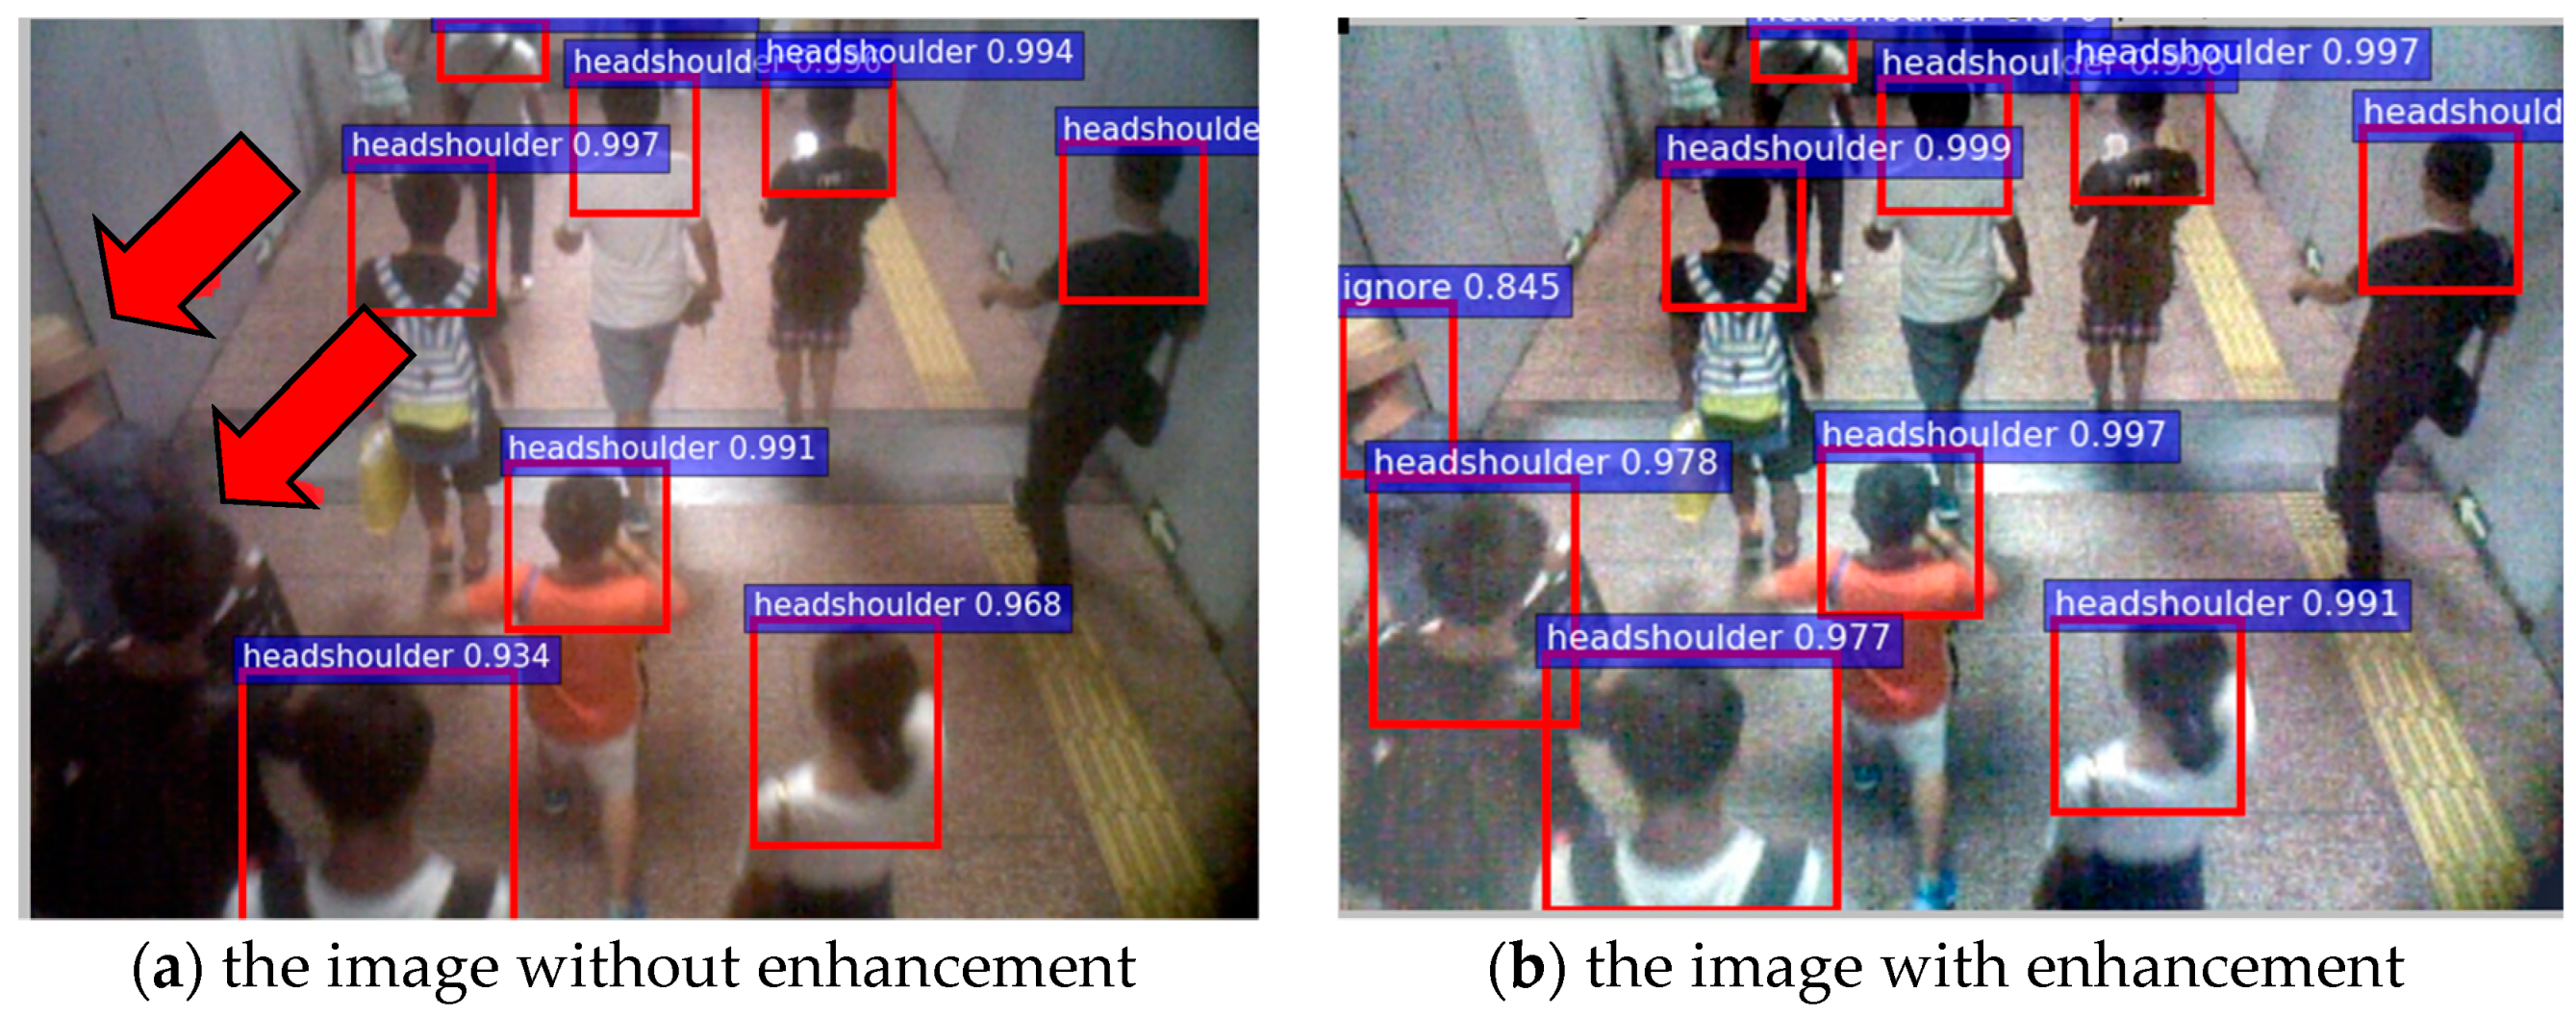
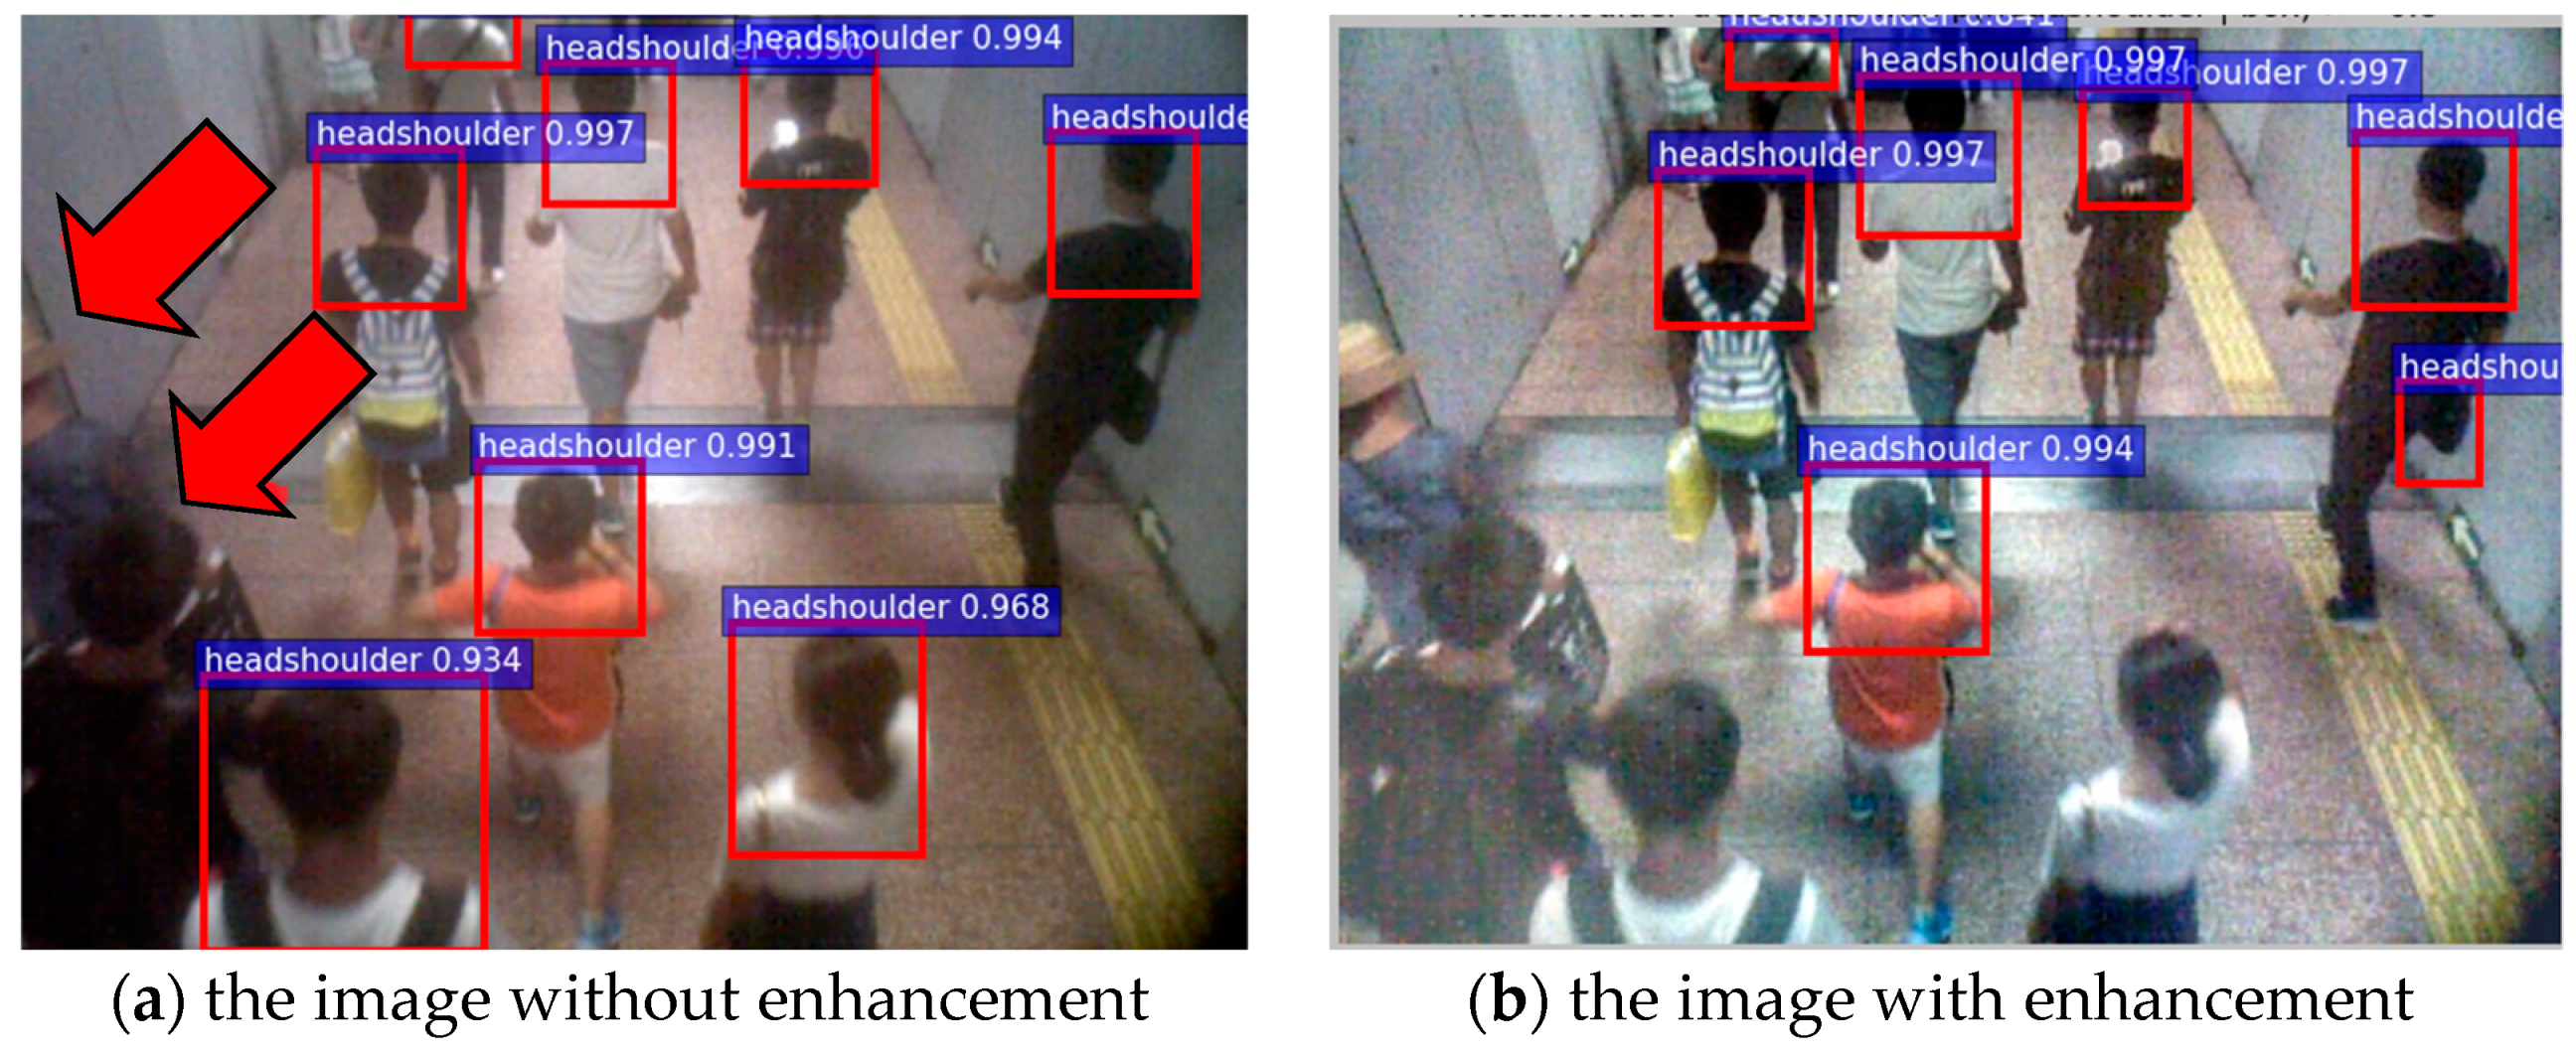
In order to further verify that the model with enhancement has obvious advantages on the sensibility to the color and contour of person, 20 images with enhancement and 20 images without enhancement in subway tunnels are selected for testing by the model with enhancement, and one of them is shown in Figure 18. As we can see, two persons with the red arrow in Figure 18a can be detected in the Figure 18b. At the same time, 20 images with enhancement and 20 images without enhancement in subway tunnels are selected for testing by the model without enhancement, and the results are shown in Figure 19. Two persons with the red arrow in Figure 19a cannot be detected in Figure 19b.
4.4. Performing Experiments on Other Datasets and Comparing with Other State-Of-The-Art Approaches on Other Public Datasets
4.4.1. The Summary of Public Pedestrian Datasets
We list the basic information of the public pedestrian datasets in Table 3.
The data source of Caltech and CVC is road, which is mainly used for pedestrian detection research in vehicle-assisted driving, and there are few pedestrians in every image. While both MIT and NICTA are single-person images, USC collects less pedestrian data. At present, the public pedestrian datasets mainly come from streets and roads. There is currently no subway pedestrian dataset. Therefore, this paper is mainly designed for pedestrian detection under the high-density crowd and dim lighting condition in Beijing subways.
4.4.2. The Experiment on Public Pedestrian Dataset
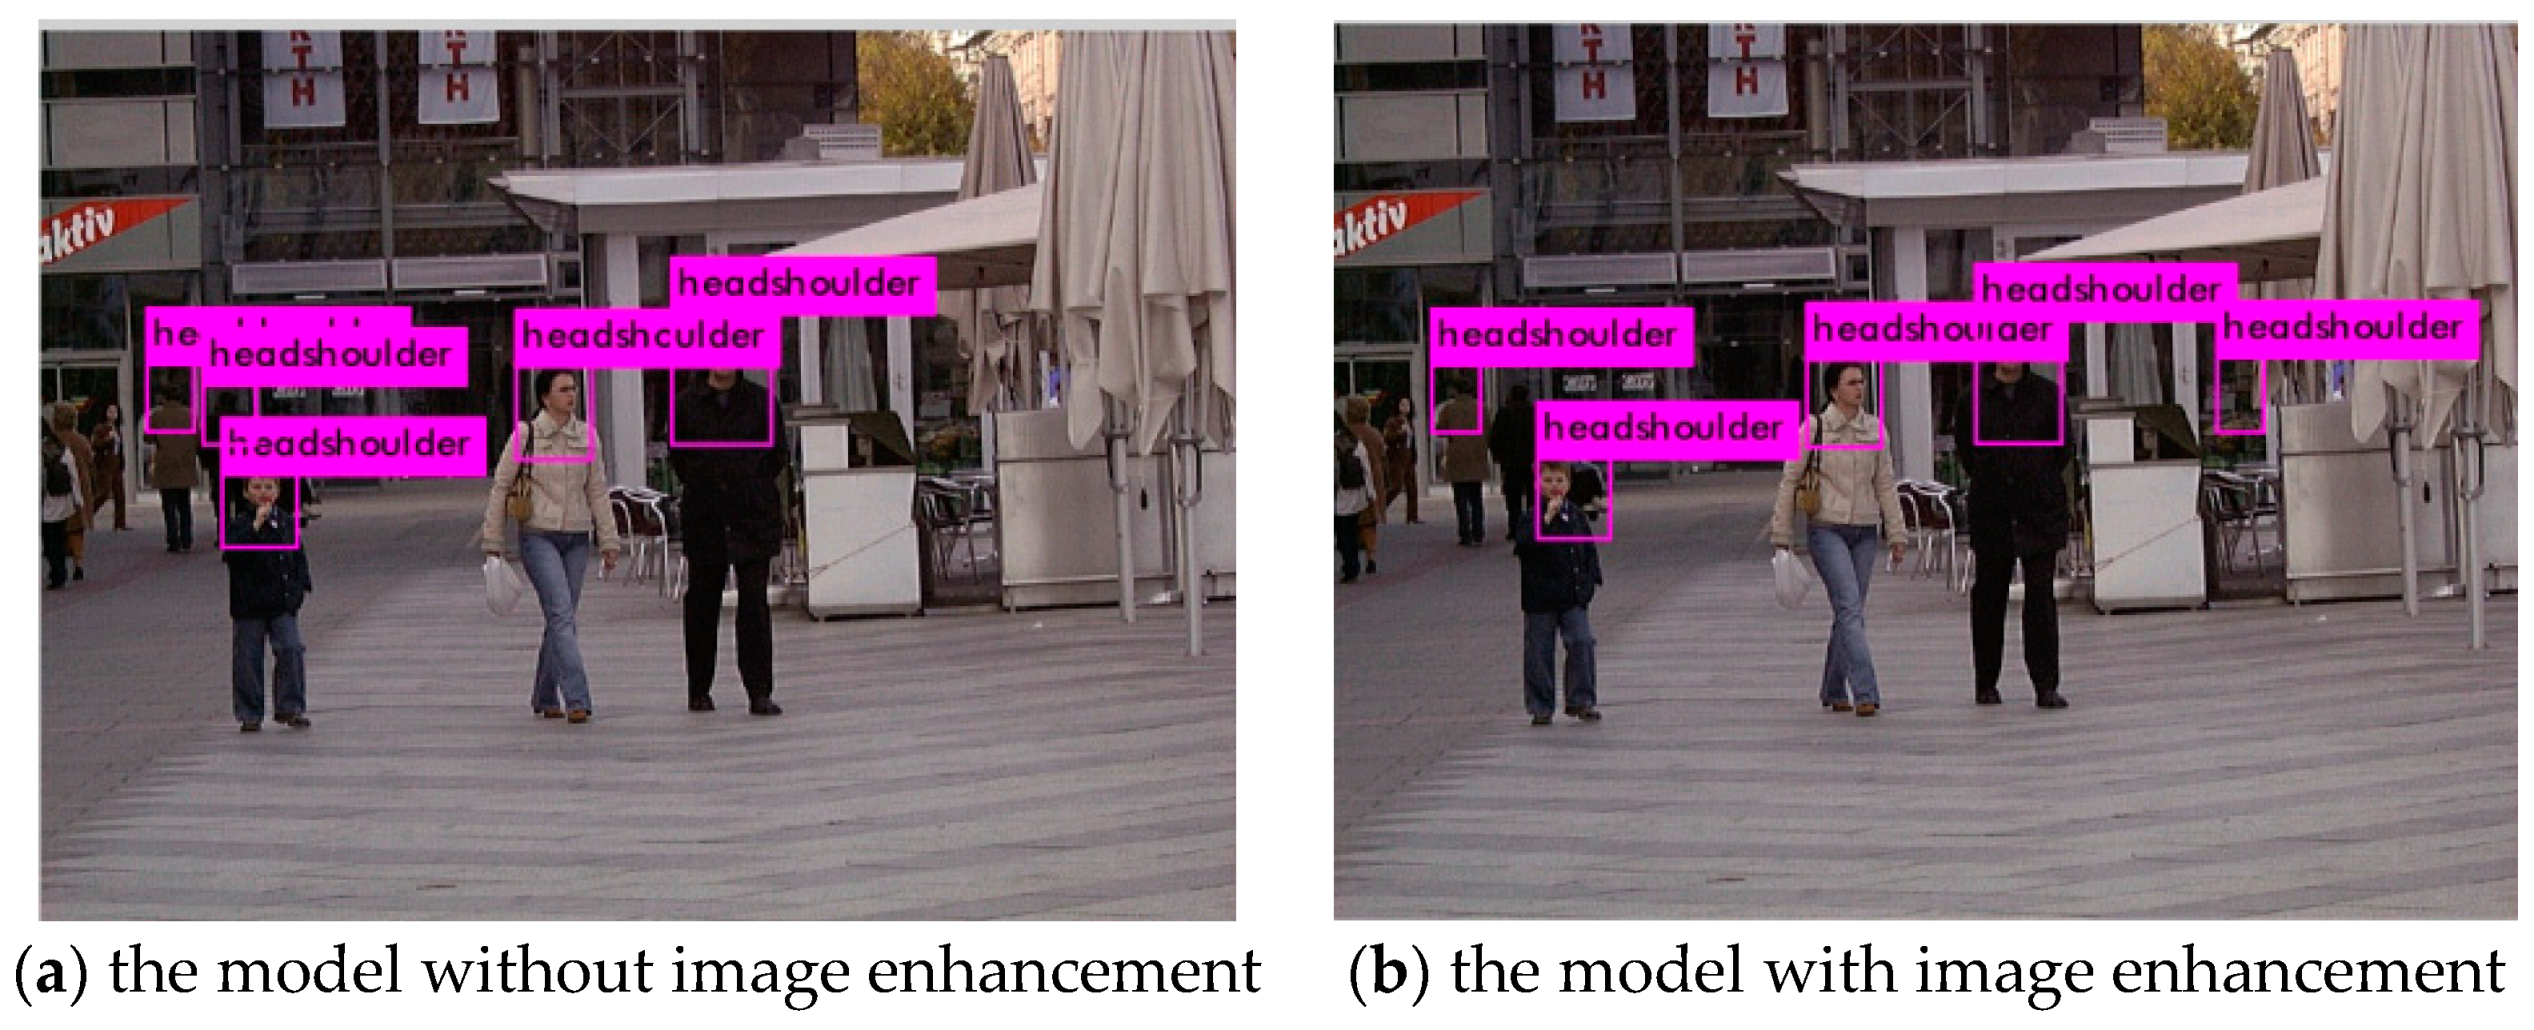
We perform two groups of experiments using fast automatic color enhancement on the INRIA, because the crowd density of this dataset is similar to that of subway pedestrian dataset. The INRIA data sample contains a total number of 902 images, each of which has size of 640 × 480. We divide the passenger flow sample into two categories. The head–shoulder categories contain 3034 rectangular calibration boxes, and the ignore categories contain 508 rectangular calibration boxes. We divide 902 images into a training set, a validation set, and a testing set. The training set contains 702 images and the validation set contains 100 images, and the remaining 100 images are for the testing set. We compared the specific detection effect (false and misdetection) of the single image between the model without enhancement and the model with enhancement. One of testing set images is shown in Figure 20. The mean average precision on the enhanced model and unenhanced model are given in Table 4. Due to the data source of INRIA being street, the brightness is high, and the color difference between the background and pedestrian is large. The test effect between the model without enhancement and the model with enhancement is close.
4.4.3. The Comparison of State-Of-The-Art Methods
5. Conclusions
In order to reduce the false- and misdetection, and accurately locate the bounding-box in subway pedestrian detection, this paper proposes a modified faster R-CNN method with automatic color enhancement (ACE), which can improve sample contrast. Then, a calibration method based on sample categories reduction is presented to correct the offset of bounding-box. Next, we chose the faster R-CNN target detection framework on the experimental dataset which was obtained in a Beijing subway. The experiment results show that, by this method, the accuracy rate of the pedestrians is improved by 3.2%. The correctness and applicability of the method in this paper has been verified.
Author Contributions
H.Q. has made substantial contributions to the conception of the work. M.W. has drafted the work and revised it critically for important intellectual content. C.Z. has made substantial contributions to the analysis and interpretation of data of the work. Y.W. has collected the data in the experiments. All of authors have approved the final version to be published.
Funding
National Key R & D Program of China [grant number 2017YFC0806005].
Acknowledgments
The authors wish to express their gratitude to the anonymous reviewers and the associate editor for their rigorous comments during the review process. In addition, authors also would like to thank experimenters in our laboratory for their great contribution in data-collection work. They are Zhen Jie, Tongyang Yuan, Kaixin Tian, and Lu Zhao. This work was supported by the National Key R & D Program of China [grant number 2017YFC0806005].
Conflicts of Interest
The authors declare no conflict of interest.
References
- Zhang, L. Safety Problems and Countermeasures of Subway Peak Passenger Flow; Urban Rail Transit Key Technology: Beijing, China, 2006. [Google Scholar]
- Zhang, B.; Xu, Z.S.; Zhao, Q.W.; Liu, Y.Y. A Study on Theoretical Calculation Method of Subway Safety Evacuation. Procedia Eng. 2014, 71, 597–604. [Google Scholar] [CrossRef]
- Zhou, X.J.; Yu, X.Y. Study on safety evacuation time for passengers in subway station and its application. Adv. Mater. Res. 2013, 671–674, 2965–2969. [Google Scholar] [CrossRef]
- Zhang, Y. Automatic detection technology of passenger density in Beijing Metro. China Railw. 2017, 4, 96–100. [Google Scholar]
- Chen, Y.Y.; Chen, N.; Zhou, Y.Y.; Lai, J.H.; Zhang, W.W. A Method of Automatic Pedestrian Counting in Metro Station Based on Machine Vision. J. Highw. Transp. Res. Dev. 2013, 30, 122–133. [Google Scholar]
- Han, N.; Chen, D.-W.; Zhong, Z.-C. Comparative Research on Algorithm of Passenger Flow Statistics System Based on Intelligent Video Technology. Information Technology 2016, 6, 45–48. (In Chinese) [Google Scholar]
- Zhang, M.; Chen, X.; Zhang, T. Human body detection model based on haar-HOG algorithm. Revista de la Facultad de Ingenieria 2017, 32, 76–82. [Google Scholar]
- Yi, Z.; Xue, J. Improving Hog descriptor accuracy using non-linear multi-scale space in people detection. In Proceedings of the 2014 ACM Southeast Regional Conference, ACM SE 2014, Kennesaw, GA, USA, 28–29 March 2014. [Google Scholar]
- Girshick, R.; Donahue, J.; Darrell, T.; Malik, J. Rich feature hierarchies for accurate object detection and semantic segmentation. In Proceedings of the IEEE Conference on Computer Vision and Pattern Recognition, Columbus, OH, USA, 23–28 June 2014. [Google Scholar]
- Huo, Z.; Xia, Y.; Zhang, B. Vehicle type classification and attribute prediction using multi-task RCNN. In Proceedings of the BioMedical Engineering and Informatics, CISP-BMEI 2016, Datong, China, 15–17 October 2016; pp. 564–569. [Google Scholar]
- Girshick, R. Fast R-CNN. In Proceedings of the IEEE Conference on Computer Vision and Pattern Recognition 2015, Washington, DC, USA, 7–13 December 2015. [Google Scholar]
- Jiang, H.; Learned-Miller, E. Face Detection with the Faster R-CNN. In Proceedings of the 2017 12th IEEE International Conference on Automatic Face & Gesture Recognition (FG 2017), Washington, DC, USA, 30 May–3 June 2017; pp. 650–657. [Google Scholar]
- Byeon, Y.H.; Kwak, K.C. A Performance Comparison of Pedestrian Detection Using Faster RCNN and ACF. In Proceedings of the 2017 6th IIAI International Congress on Advanced Applied Informatics, IIAI-AAI 2017, Hamamatsu, Japan, 9–13 July 2017; pp. 858–863. [Google Scholar]
- Zhao, X.; Li, W.; Zhang, Y.; Gulliver, T.A.; Chang, S.; Feng, Z. A faster RCNN-based pedestrian detection system. In Proceedings of the IEEE Vehicular Technology Conference, Montreal, QC, Canada, 18–21 September 2016. [Google Scholar]
- Roh, M.C.; Lee, J.Y. Refining faster-RCNN for accurate object detection. In Proceedings of the 15th IAPR International Conference on Machine Vision Applications, MVA 2017, Nagoya, Japan, 8–12 May 2017; pp. 514–517. [Google Scholar]
- Lokanath, M.; Kumar, K.S.; Keerthi, E.S. Accurate object classification and detection by faster-RCNN. In IOP Conference Series: Materials Science and Engineering; IOP Publishing: Bristol, UK, 2017; Volume 263. [Google Scholar]
- Pizer, S.M.; Amburn, E.P.; Austin, J.D.; Cromartie, R.; Geselowitz, A.; Greer, T.; ter Haar Romeny, B.; Zimmerman, J.B.; Zuiderveld, K. Adaptive Histogram Equalization and Its Variations. Comput. Vis. Graph. Image Process. 1987, 39, 355–368. [Google Scholar] [CrossRef]
- Zeng, Y.-C. Automatic local contrast enhancement using adaptive histogram adjustment. In Proceedings of the 2009 IEEE International Conference on Multimedia and Expo, ICME 2009, Hilton Cancun, Mexico, 28 June–3 July 2009; pp. 1318–1321. [Google Scholar]
- Gillespy, T., III. Optimized algorithm for adaptive histogram adjustment. Proc. SPIE Int. Soc. Opt. Eng. 1998, 3338, 1052–1055. [Google Scholar]
- Hummel, R. Image enhancement by histogram transformation. Comput. Graph. Image Process. 1977, 6, 184–185. [Google Scholar] [CrossRef]
- Gatta, C.; Rizzi, A.; Marini, D. ACE: An Automatic Color Equalization Algorithm. In Proceedings of the Conference on Color in Graphics, Imaging, and Vision, CGIV 2002 Final Program and Proceedings, Poitiers, France, 2–5 April 2002; pp. 316–320. [Google Scholar]
- Korpi-Anttila, J. Automatic color enhancement and scene change detection of moving pictures. In Proceedings of the Final Program and Proceedings—IS and T/SID Color Imaging Conference, Scottsdale, AZ, USA, 1 January 1999; pp. 243–246. [Google Scholar]
- Choudhury, A.; Medioni, G. Perceptually motivated automatic color contrast enhancement. In Proceedings of the 2009 IEEE 12th International Conference on Computer Vision Workshops, Kyoto, Japan, 27 September–4 October 2009; pp. 1893–1900. [Google Scholar]
- Getreuer, P. Automatic Color Enhancement (ACE) and its Fast Implementation. Image Process. Line 2012, 2, 266–277. [Google Scholar] [CrossRef] [Green Version]
- Dollár, P.; Appel, R.; Belongie, S.; Perona, P. Fast Feature Pyramids for Object Detection. IEEE Trans. Pattern Anal. Mach. Intell. 2014, 36, 1532–1545. [Google Scholar] [CrossRef] [PubMed] [Green Version]
- Xu, D.; Ouyang, W.; Ricci, E.; Wang, X.; Sebe, N. Learning Cross-Modal Deep Representations for Robust Pedestrian Detection. In Proceedings of the IEEE Conference on Computer Vision and Pattern Recognition (CVPR), Honolulu, HI, USA, 21–26 July 2017. [Google Scholar]
- Ouyang, W.; Zhou, H.; Li, H.; Li, Q.; Yan, J.; Wang, X. Jointly learning deep features, deformable parts, occlusion and classification for pedestrian detection. IEEE Trans. Pattern Anal. Mach. Intell. PAMI 2017, accepted. [Google Scholar] [CrossRef] [PubMed]
- Ouyang, W.; Zeng, X.; Wang, X. Partial Occlusion Handling in Pedestrian Detection with a Deep Model. IEEE Trans. Circuits Syst. Video Technol. TCSVT 2015, accepted. [Google Scholar] [CrossRef]
Figure 1.
Four categories of dataset.

Figure 2.
Two categories of dataset.

Figure 3.
Region proposal network.

Figure 4.
The structure of classification.

Figure 5.
Different scenes of pedestrian flow in Beijing subway.

Figure 6.
The first calibration effect.

Figure 7.
The second calibration effect.

Figure 8.
The first experimental results visualization.

Figure 9.
The second experimental results visualization.

Figure 10.
Comparison of the recognition rate curve in two experiments.

Figure 11.
The image without enhancement.

Figure 12.
The image with enhancement.

Figure 13.
The detection effect in subway tunnels.

Figure 14.
Samples misclassified by the model without enhancement.

Figure 15.
The detection effect in subway platform.

Figure 16.
The relationship between the number of people and difference between correctly recognizing people by two models in subway tunnels.
Figure 16.
The relationship between the number of people and difference between correctly recognizing people by two models in subway tunnels.

Figure 17.
The relationship between the number of people and difference between correctly recognizing people by two models in subway platform.
Figure 17.
The relationship between the number of people and difference between correctly recognizing people by two models in subway platform.

Figure 18.
The detection effect of the model with enhancement.

Figure 19.
The detection effect of the model without enhancement.

Figure 20.
The detection effect on INRIA dataset.


Table 1.
The training accuracy comparison between the first calibration and the second calibration.
| Calibration Method | Mean Average Precision |
|---|---|
| Multi-category | 58% |
| Less-category | 85% |
Table 2.
Comparison of two models.
| Method | Mean Average Precision | Time Taken/s |
|---|---|---|
| Unenhanced model | 87.3% | 37,740 |
| Enhanced model | 90.5% | 37,110 |
Table 3.
Public pedestrian datasets.
| Dataset | Scenario | Number of Pedestrians | Number of Images | Image Resolution |
|---|---|---|---|---|
| MIT | street | 924 | 924 | 64 × 128 |
| INRIA | street/park | 3542 | 902 | 640 × 480 |
| Caltech | road | 2300 | 250,000 | 640 × 480 |
| TUD | street | 1776 | 1092 | 720 × 576 |
| CVC | road | 1000 | 7175 | 640 × 480 |
| NICTA | street | 25,551 | 25,551 | 32 × 80 |
| USC | street | 313 | 250 | 640 × 480 |
Table 4.
Comparison of two models on INRIA dataset.
| Method | Mean Average Precision |
|---|---|
| Unenhanced model | 82.59% |
| Enhanced model | 83.34% |
© 2018 by the authors. Licensee MDPI, Basel, Switzerland. This article is an open access article distributed under the terms and conditions of the Creative Commons Attribution (CC BY) license (http://creativecommons.org/licenses/by/4.0/).
Share and Cite
MDPI and ACS Style
Qu, H.; Wang, M.; Zhang, C.; Wei, Y. A Study on Faster R-CNN-Based Subway Pedestrian Detection with ACE Enhancement. Algorithms 2018, 11, 192. https://0-doi-org.brum.beds.ac.uk/10.3390/a11120192
AMA Style
Qu H, Wang M, Zhang C, Wei Y. A Study on Faster R-CNN-Based Subway Pedestrian Detection with ACE Enhancement. Algorithms. 2018; 11(12):192. https://0-doi-org.brum.beds.ac.uk/10.3390/a11120192
Chicago/Turabian StyleQu, Hongquan, Meihan Wang, Changnian Zhang, and Yun Wei. 2018. "A Study on Faster R-CNN-Based Subway Pedestrian Detection with ACE Enhancement" Algorithms 11, no. 12: 192. https://0-doi-org.brum.beds.ac.uk/10.3390/a11120192
Note that from the first issue of 2016, this journal uses article numbers instead of page numbers. See further details here.