A Fuzzy-Based Decision Support Model for Risk Maturity Evaluation of Construction Organizations


1
Department of Building, Civil and Environmental Engineering, Concordia University, Sir George Williams Campus, 1455 De Maisonneuve Blvd. W., Montréal, QC H3G 1M8, Canada
2
Centre for Innovation in Construction and Infrastructure Engineering and Management (CICIEM), Department of Building, Civil and Environmental Engineering, Concordia University, 1455 de Maisonneuve Blvd, W., Montreal, QC H3G 1M8, Canada
*
Author to whom correspondence should be addressed.
Algorithms 2020, 13(5), 115; https://0-doi-org.brum.beds.ac.uk/10.3390/a13050115
Submission received: 12 March 2020
/
Revised: 14 April 2020
/
Accepted: 29 April 2020
/
Published: 2 May 2020
(This article belongs to the Special Issue Fuzzy Hybrid Systems for Construction Engineering and Management)
Abstract
:Risk maturity evaluation is an efficient tool which can assist construction organizations in the identification of their strengths and weaknesses in risk management processes and in taking necessary actions for the improvement of these processes. The accuracy of its results relies heavily on the quality of responses provided by participants specialized in these processes across the organization. Risk maturity models reported in the literature gave equal importance to participants’ responses during the model development, neglecting their level of authority in the organization as well as their level of expertise in risk management processes. Unlike the existing models, this paper presents a new risk maturity model that considers the relative importance of the responses provided by the participants in the model development. It considered their authority in the organization and their level of involvement in the risk management processes for calculating the relative weights associated with the risk maturity attributes. It employed an analytic network process (ANP) to model the interdependencies among the risk maturity attributes and utilizes the fuzzy set theory to incorporate the uncertainty associated with the ambiguity of the responses used in the model development. The developed model allows the construction organizations to have a more accurate and realistic view of their current performance in risk management processes. The application of the developed model was investigated by measuring the risk maturity level of an industrial partner working on civil infrastructure projects in Canada.
1. Introduction
Risk management is a crucial driver in the successful delivery of construction projects [1,2,3,4,5,6]. According to the Project Management Institute (PMI) [2], risk management processes include: planning the risk management, identifying the risks, performing a qualitative risk analysis, performing a quantitative risk analysis, planning risk responses, implementing risk responses and monitoring risks. The first is the most important process of a risk management program, as a risk not properly planned cannot be adequately managed.
Planning risk management describes the overall risk management strategy and defines how the risk management processes will be integrated with all the other project management activities [2,3]. To provide the greatest benefit to this process, a risk maturity evaluation study must be carried out at the early stage of this process to investigate the potential strengths and weaknesses of the organization in risk management processes.
This paper presents a decision support model for the risk maturity evaluation of construction organizations. It employed an analytic network process (ANP) to account for the interdependency between the introduced risk maturity attributes and utilized the fuzzy set theory to incorporate the uncertainty associated with the ambiguity of the responses used in the development of the model. Unlike the maturity models reported in the literature, the developed model accounted for the consideration of authority of the participants and their level of involvement in risk management processes.
2. Literature Review
Risk management in the construction industry has received considerable attention from researchers and industry professionals over the last four decades. The processes of risk management have been widely studied and documented in several international risk management standards and guidelines. Although each standard utilizes a different vocabulary to describe the processes, they mostly follow the same pattern. For instance, Table 1 shows the recent classification of risk management processes based on some major international standards including the Project Management Institute (PMI) [2], the International Organization for Standardization (ISO) [4], the the Association for the Advancement of Cost Engineering International (AACEI) [5] and the Institute of Risk Management (IRM) [6]. Through the examination of the processes presented in Table 1, one can map them into six processes: risk management planning, risk identification, risk analysis, risk response planning, risk responses implementation and risk monitoring.
The literature reveals that considerable work has been carried out on risk identification, analysis, responses and monitoring, but far less on risk management planning and risk response implementation. Planning for risk management is the first process in a risk management program and it defines the scope of the risk management as well as the appropriate approaches, tools and responsibilities [2,3,4,7]. In order to increase the efficiency and effectiveness of this process, a risk maturity evaluation study should be conducted to identify the performance level of the organization in its risk management program. Risk maturity provides a measurable tool that shows the degree of formality and progress in the application of the risk management processes according to a set of attributes [8].
Over the last decade, several risk maturity models were developed for construction projects. The study conducted by Zou et al. [9] is one of the earliest efforts, which introduced a new risk management maturity model (RM3) measuring the risk maturity level of the construction organizations in accordance with the four aspects of project management; standardization, measurement, control and continuous improvement. However, considering these aspects does not reflect the risk maturity level of organizations in different processes of risk management. In order to address this limitation, Jia et al. [7] developed a new risk maturity model measuring the risk maturity of organizations based on their level of maturity in the risk management processes as well as the organization management aspects. Their model, however, gave the same importance weight to individuals’ responses neglecting the individuals’ level of authority in the organization and their level of involvement in the risk management processes. It also did not consider the uncertainty associated with the responses, neglecting the ambiguity, subjectivity and the imprecision involved in the responses provided by these individuals. In the same year, Zhao et al. [10] introduced a new fuzzy enterprise risk management maturity model (ERMMM) enabling construction organizations to incorporate the uncertainty of the responses used in model development. However, no dependency was considered between the sixteen identified attributes which in turn reduced the accuracy of the results. One year later, Zhao et al. [11] applied their earlier developed ERMMM model on the three case studies to investigate the influence of the firm size on the enterprise risk management (ERM) implementation. However, considering the dependency between the risk maturity attributes remained lacking. Recently, Alashwal et al. [12] utilized the Organizational Project Management Maturity Model (OPM3) method introduced by the PMI [13] to measure the risk maturity level of the organization and to consider its impact on the firm size and organizational learning. Hoseini et al. [8] also developed a new generic risk maturity model (GRMM) to evaluate the performance of the construction organization in the application of the risk management program. However, their models focused on the theoretical aspects of the risk maturity evaluation without considering either the uncertainty resulting from individuals’ judgments or the dependency between the identified attributes.
In summary, as shown in Table 2, none of the of the above cited models are capable of simultaneously: (1) modeling the interdependencies between the risk maturity attributes, (2) capturing the uncertainty associated with individuals’ judgement, and (3) considering the importance weight of individuals’ responses in calculating the weights associated with the risk maturity attributes.
Unlike the models presented in the literature, this paper presents a novel risk management maturity model which is capable of modeling the interdependencies among the identified risk maturity attributes considered in the model development, capturing the uncertainty associated with the input data provided by individuals who participate in the model development, and considering the relative importance of the responses used in calculating the weights associated with the risk maturity attributes.
3. Research Methodology
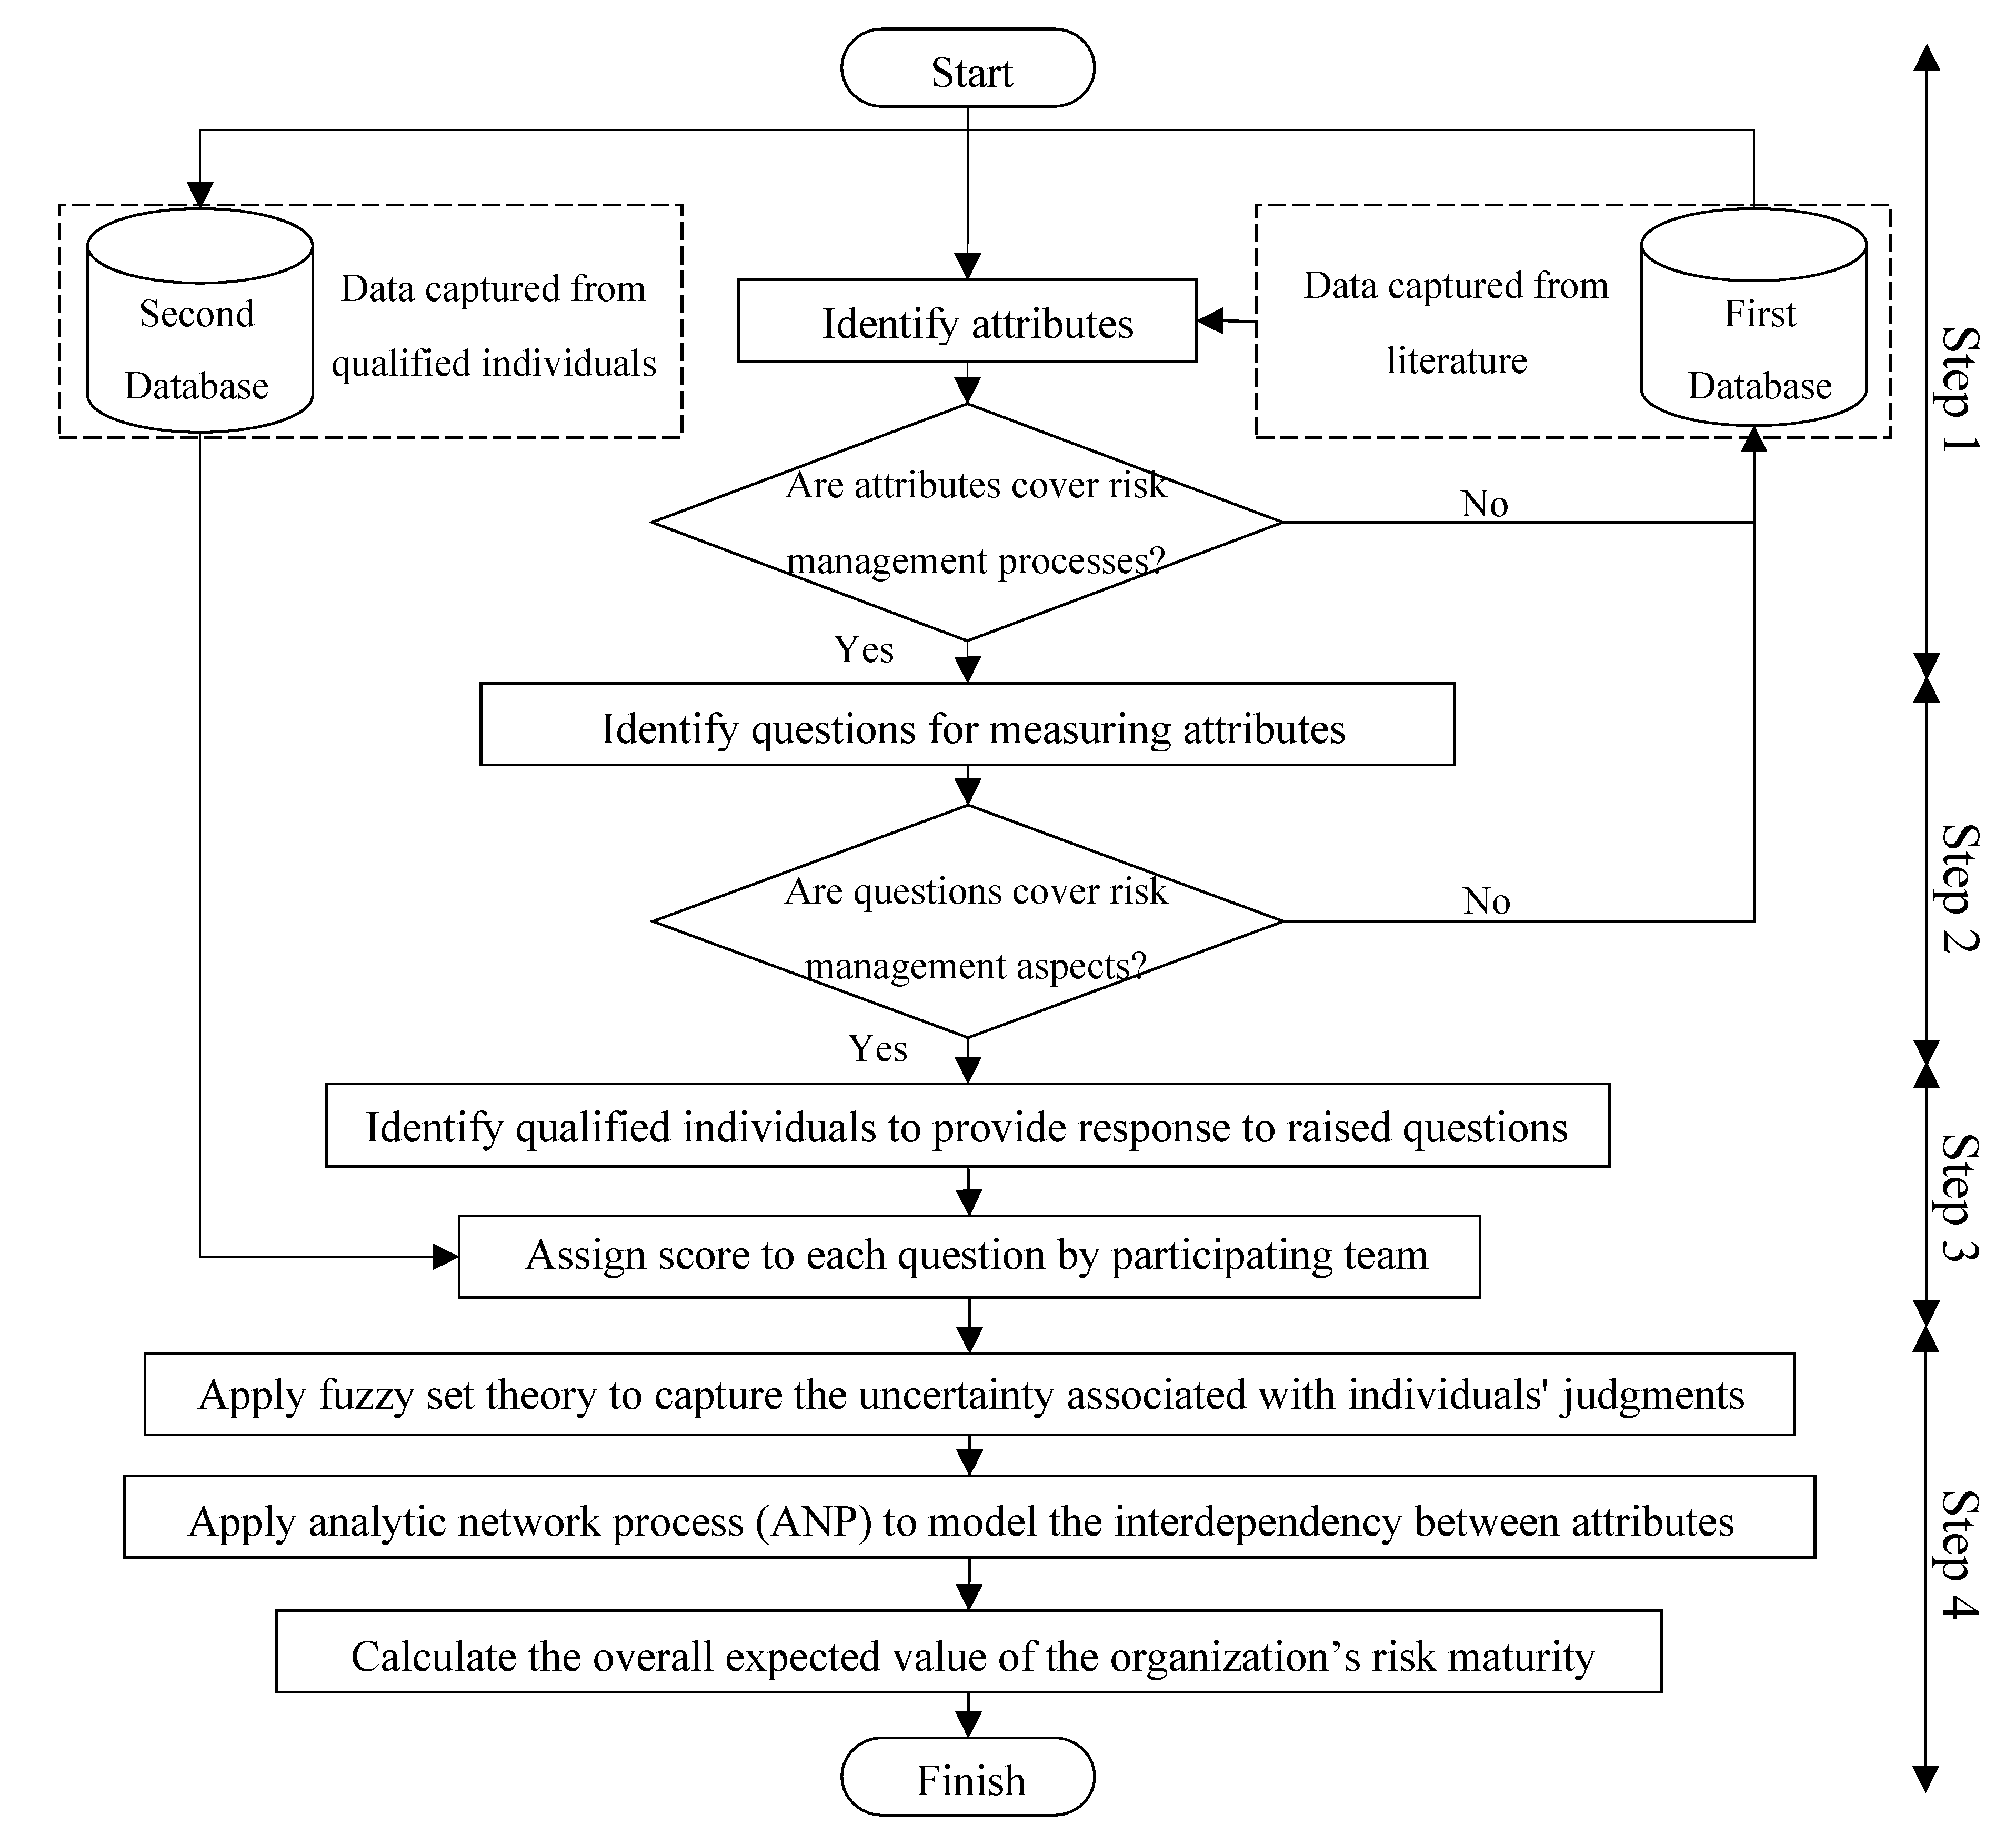
The developed model was designed to measure the risk management maturity level of construction organizations. The framework of the developed model is shown in Figure 1.
As shown in Figure 1, the developed model consisted of four steps. In the first step, six attributes were identified. These attributes covered all the processes of risk management recently introduced by international risk management standards [2,4]. In the second step, a set of questions for the evaluation of each risk maturity attribute were identified making use of different sources including standards, guidelines, academic articles and PhD theses. The questions were grouped and mapped into a questionnaire considering the feedback from members of the industrial partner. In this step an effort was made to tailor these questions to suit the construction industry. In the third step, a list of qualified individuals who were expected to participate in risk maturity evaluation was established. The required input data for measuring the maturity level of each attribute was captured from the qualified individuals utilizing the designed questionnaire. Finally, in the fourth step which is data analysis and evaluation, the overall expected value of the organization’s risk maturity is calculated. In this step the interdependency between the identified attributes along with the uncertainty associated with the collected input data are modeled utilizing an ANP and the fuzzy set theory respectively.
3.1. Identify Attributes
Identifying attributes is the first step of risk management maturity evaluation. Existing risk maturity models utilize different sets of attributes covering different aspects of project management. As shown in Table 3, these attributes mainly cover four aspects of project management: standardization, measurement, control and continuous improvement as recommended by [13].
However, according to the feedback received from the members of the industrial partner during the meeting sessions, it was found that it is more important for them to have a clear view of their capabilities and weaknesses in the risk management processes rather than project management aspects to enable them to identify areas of needed improvements in each process of risk management. As such, in this study the attributes were defined to cover the risk management processes according to the recent classification of risk management processes suggested by the PMI [2] and ISO [4]. Meanwhile, the defined questions are for measuring the maturity of the identified attributes, and they also cover the four aforementioned project management aspects. Therefore, out of the 30 attributes initially identified, 6 were considered: the ability to plan risk (APR), the ability to identify risk (AIR), the ability to analyze risk (AAR), the ability to plan risk responses (ARR), the ability to implement risk responses (AIRR) and finally the ability to monitor risk (AMR).
3.2. Identify Questions
The current questions for evaluating the construction risk management maturity were captured from different sources [5,7,8,9,10,12,13]. Collectively, this amounted to 249 questions which were utilized to measure the maturity level of different attributes. The questions that covered standardization and the continuous improvement aspects were clustered under the first attribute, while the rest which covered the measurement and control aspects of project management were utilized for the other attributes. Collaboratively with two senior members from the industrial partner this large set of questions was reduced to the 35 questions listed in Table 4.
The criteria used in this process were the suitability to construction and the elimination of redundancy and repetition. It should be noted that the first attribute in that table covers two aspects of the organization project management including standardization and continuous improvement. Therefore, in evaluating the maturity level of that attribute, 10 questions were defined, unlike the other attributes which utilized five questions each. The participating individuals were requested to assign a score for each question using a five-point scale. The answers received for these questions were used to calculate the risk maturity level of the organization. It must be pointed out that more questions could be used, but having less questions is an advantage, as pointed out by [9].
3.3. Identify Qualified Individuals
Identifying the right individuals with the specialized knowledge and experience of risk management ensures the accuracy and effectiveness of the risk maturity evaluation. According to the PMI [2], experts who have adequate knowledge of organizational strategy, benefit management, technical knowledge of the industry and the focus area of the project, duration and budget estimation, and risk identification, are expected to participate in the risk management program. However, the required professional profiles of participants in these areas were not provided. In order to address this issue, the profiles of the individuals who participated in the risk maturity evaluation of construction organizations were gathered from the literature as shown in Table 5. As shown in Table 5, the research conducted by [14] did not provide information about the profiles of the qualified individuals.
The information captured in Table 5 was used in a process to identify the suitable participants in assessing the risk maturity level of the industrial partner’s organization. In this process, a group of individuals were first identified and clustered into the three domains of organizational project management: portfolio management, program management and project management [13]. Considering those three dimensions constitutes valuable reference points when an organization assesses its maturity and plans for possible improvement [13]. Typically, top decision makers form the strategy at the portfolio level and the middle managers have a role in implementing the agreed upon strategies at the program and project levels [15]. The individuals who are expected to participate in the risk maturity evaluation of each attribute were then identified as shown in Table 6. The information captured by these individuals was utilized as the input data for the ANP and the fuzzy set theory to calculate the importance weight of each attribute as well as its degree of implementation.
3.4. Data Analysis and Evaluation
In this step, the data collected from the respondents were analyzed, making use of two methods: the ANP and the fuzzy set theory. Each is described subsequently.
3.4.1. Analytic Network Process (ANP)
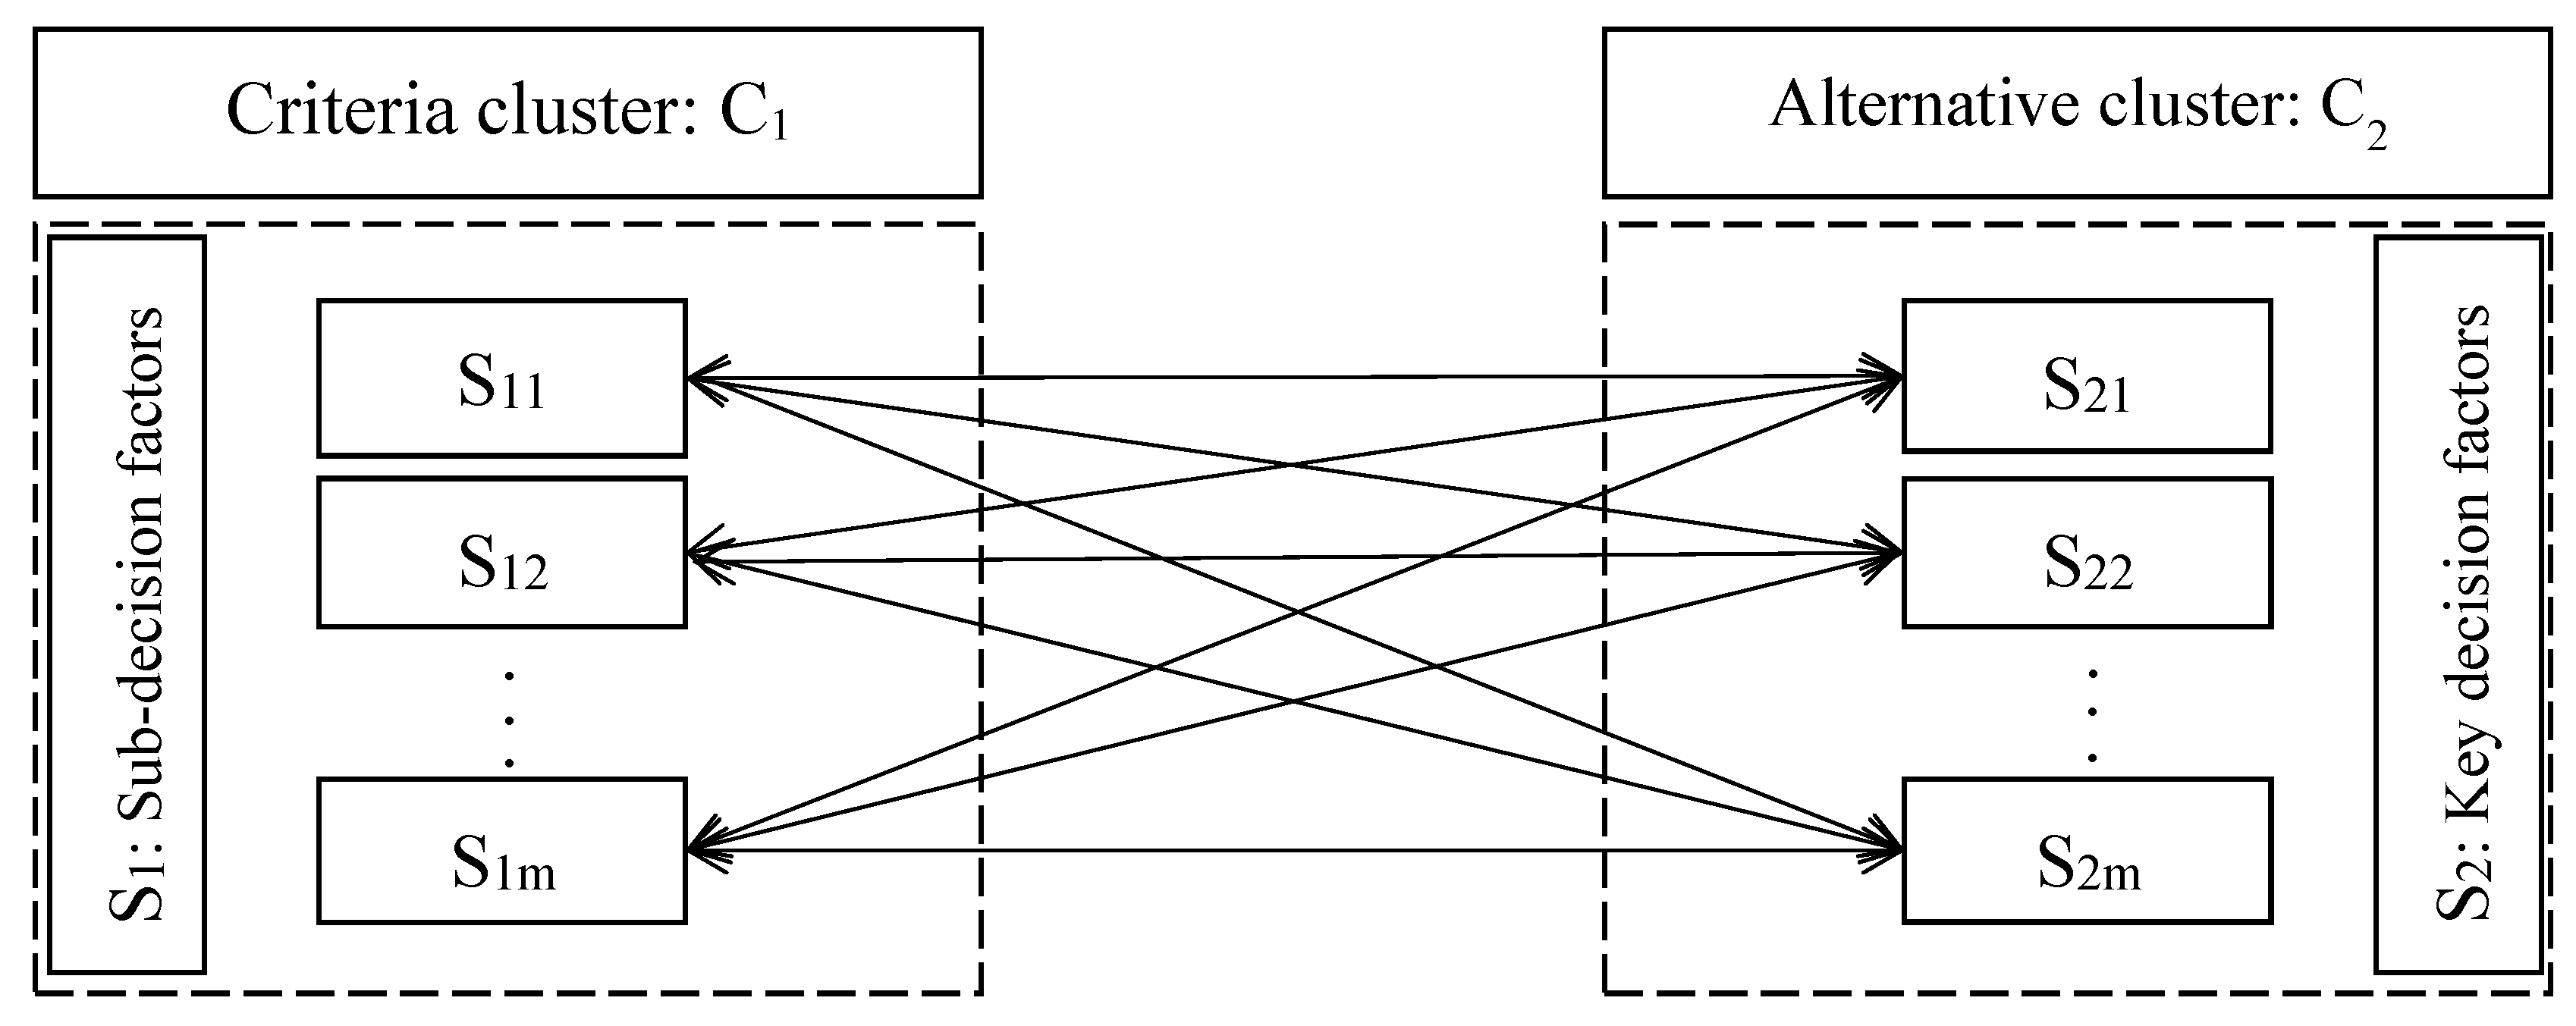
ANP is an advanced multi-criteria decision-making method which considers the interdependencies between different factors throughout a relationship network [7]. It determines the relative weights, which reflect the relative importance, of all the defined factors based on the data captured from the participants [16]. In this study, the Super Decisions software was employed for the computational processes [17]. Figure 2 shows a simple ANP network within two clusters, a criteria cluster (C1) and an alternative cluster (C2). The (C1) cluster includes the sub-decision factors and the (C2) cluster consists of key decision factors. The interdependency between the elements of these two clusters are shown with two-way arrows between them as shown in Figure 2. In this study, the sub-decision factors were individuals’ opinions and the key decision factors are the defined attributes APR, AIR, AAR, ARR, AIRR, and AMR.
The goal was to prioritize the attributes based on their relative weights. This was done by comparing: (1) the attributes with respect to each individual’s opinion, and (2) the individuals’ opinions with respect to each attribute. The five-point scale method was utilized for scoring the relative importance (1 = very low, 2 = low, 3 = medium, 4 = high and 5 = very high). For instance, in comparing attribute one with respect to the first individual, if this individual was involved in the maturity evaluation of that particular attribute (as shown in Table 6), it got a very high weight (5), otherwise its weight is considered as a function of its level of authority including high (individuals at portfolio level), medium (individuals at program level), low (individuals at project level). Subsequently, a comparison between the individuals’ opinions with respect to each of the attributes was performed on a pairwise basis. For instance, in the first part of the questionnaire, the individuals were asked to score how much importance does an attribute have compared to another attribute concerning the goal. The assigned weights were utilized to construct the pairwise comparison matrices corresponding to each cluster. For all the pairwise comparisons, the inconsistency ratios were less than 10% as recommended by Saaty [18]. Subsequently, these matrices were used as inputs to form the unweighted supermatrix. Then, the weighted supermatrix was attained by normalizing the unweighted supermatrix. In other words, each column in the unweighted supermatrix was normalized based on the summation of its cells. Finally, the limited supermatrix was generated by raising the weighted supermatrix to considerable powers until convergence. The first column in the limited matrix showed the global weights. By normalizing that column and summing up the weights, the attributes were prioritized based on their relative weights.
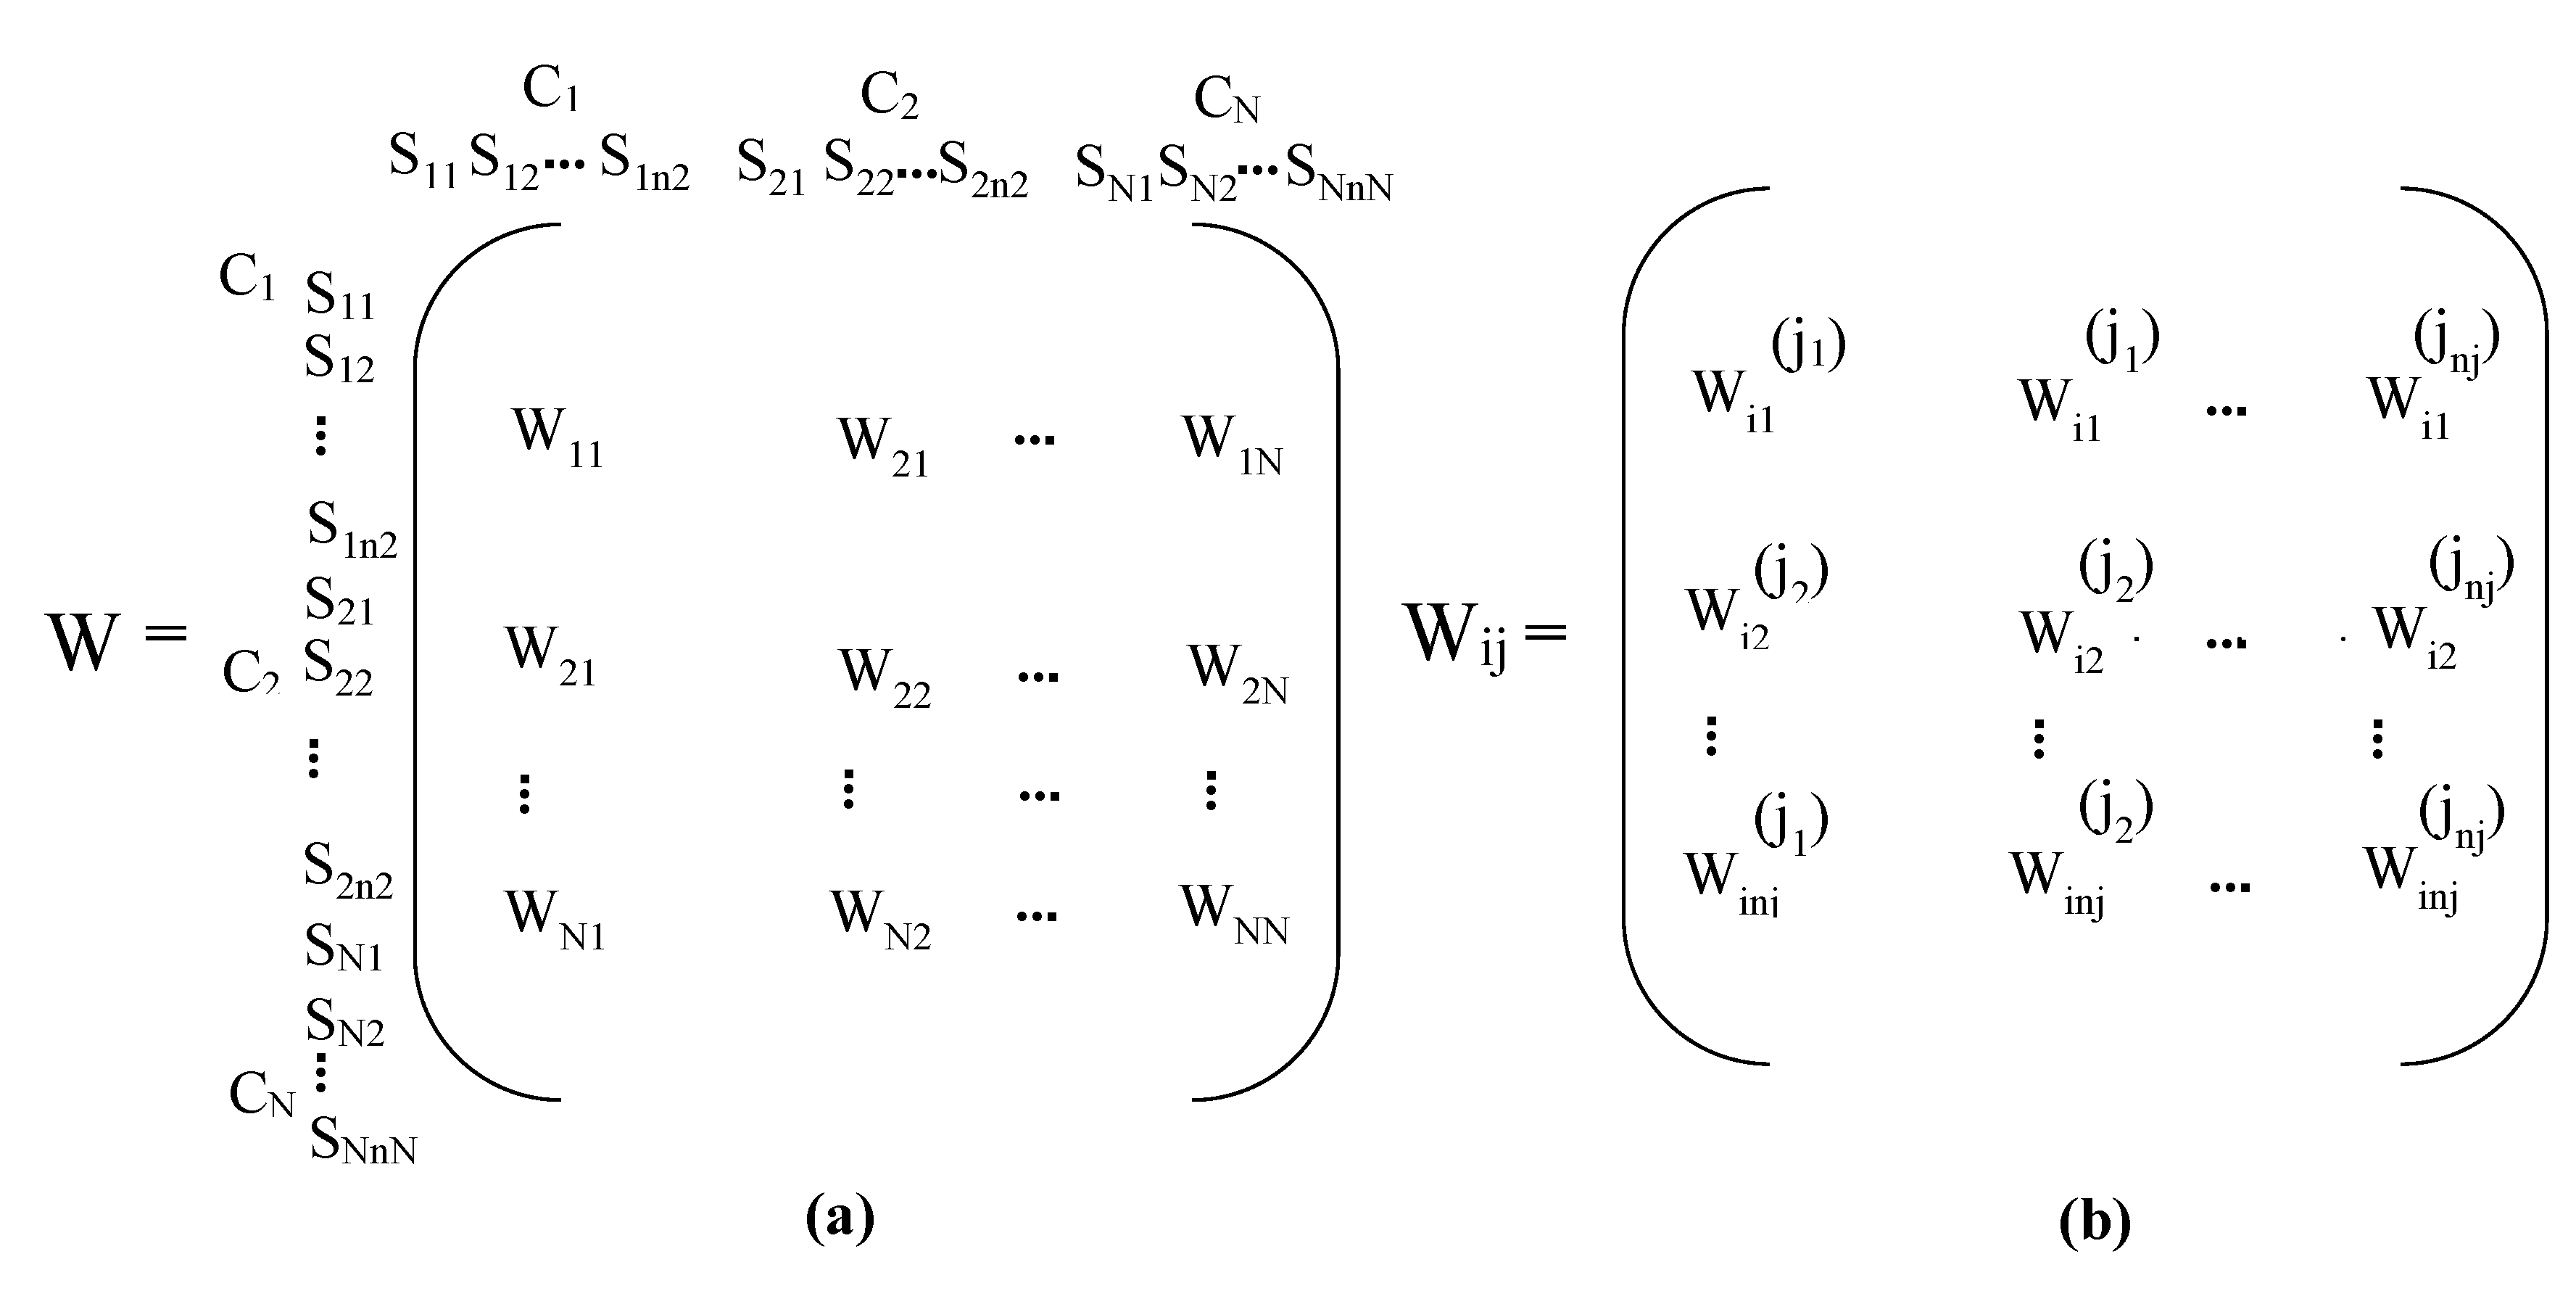
Figure 3 shows the elements of the ANP supermatrix and sub-matrix [19]. Considering the clusters in the decision network, Figure 2, as (Cp), p = 1, 2, …, m and given each cluster (np) elements, shown by (sp1, sp2, …, spmn), then Figure 3a represents the decision network’s supermatrix. (Wij) of the network supermatrix is shown in Figure 3b where (Wij) shows the dependency of the elements in the (ith) cluster on the elements in the (jth) cluster. In case there was no dependency between the two elements of the (ith) and (jth) clusters, zero value was entered in the supermatrix. The result of the ANP will be used in the following section to calculate the overall expected value of the organization risk maturity.
3.4.2. Fuzzy Set Theory
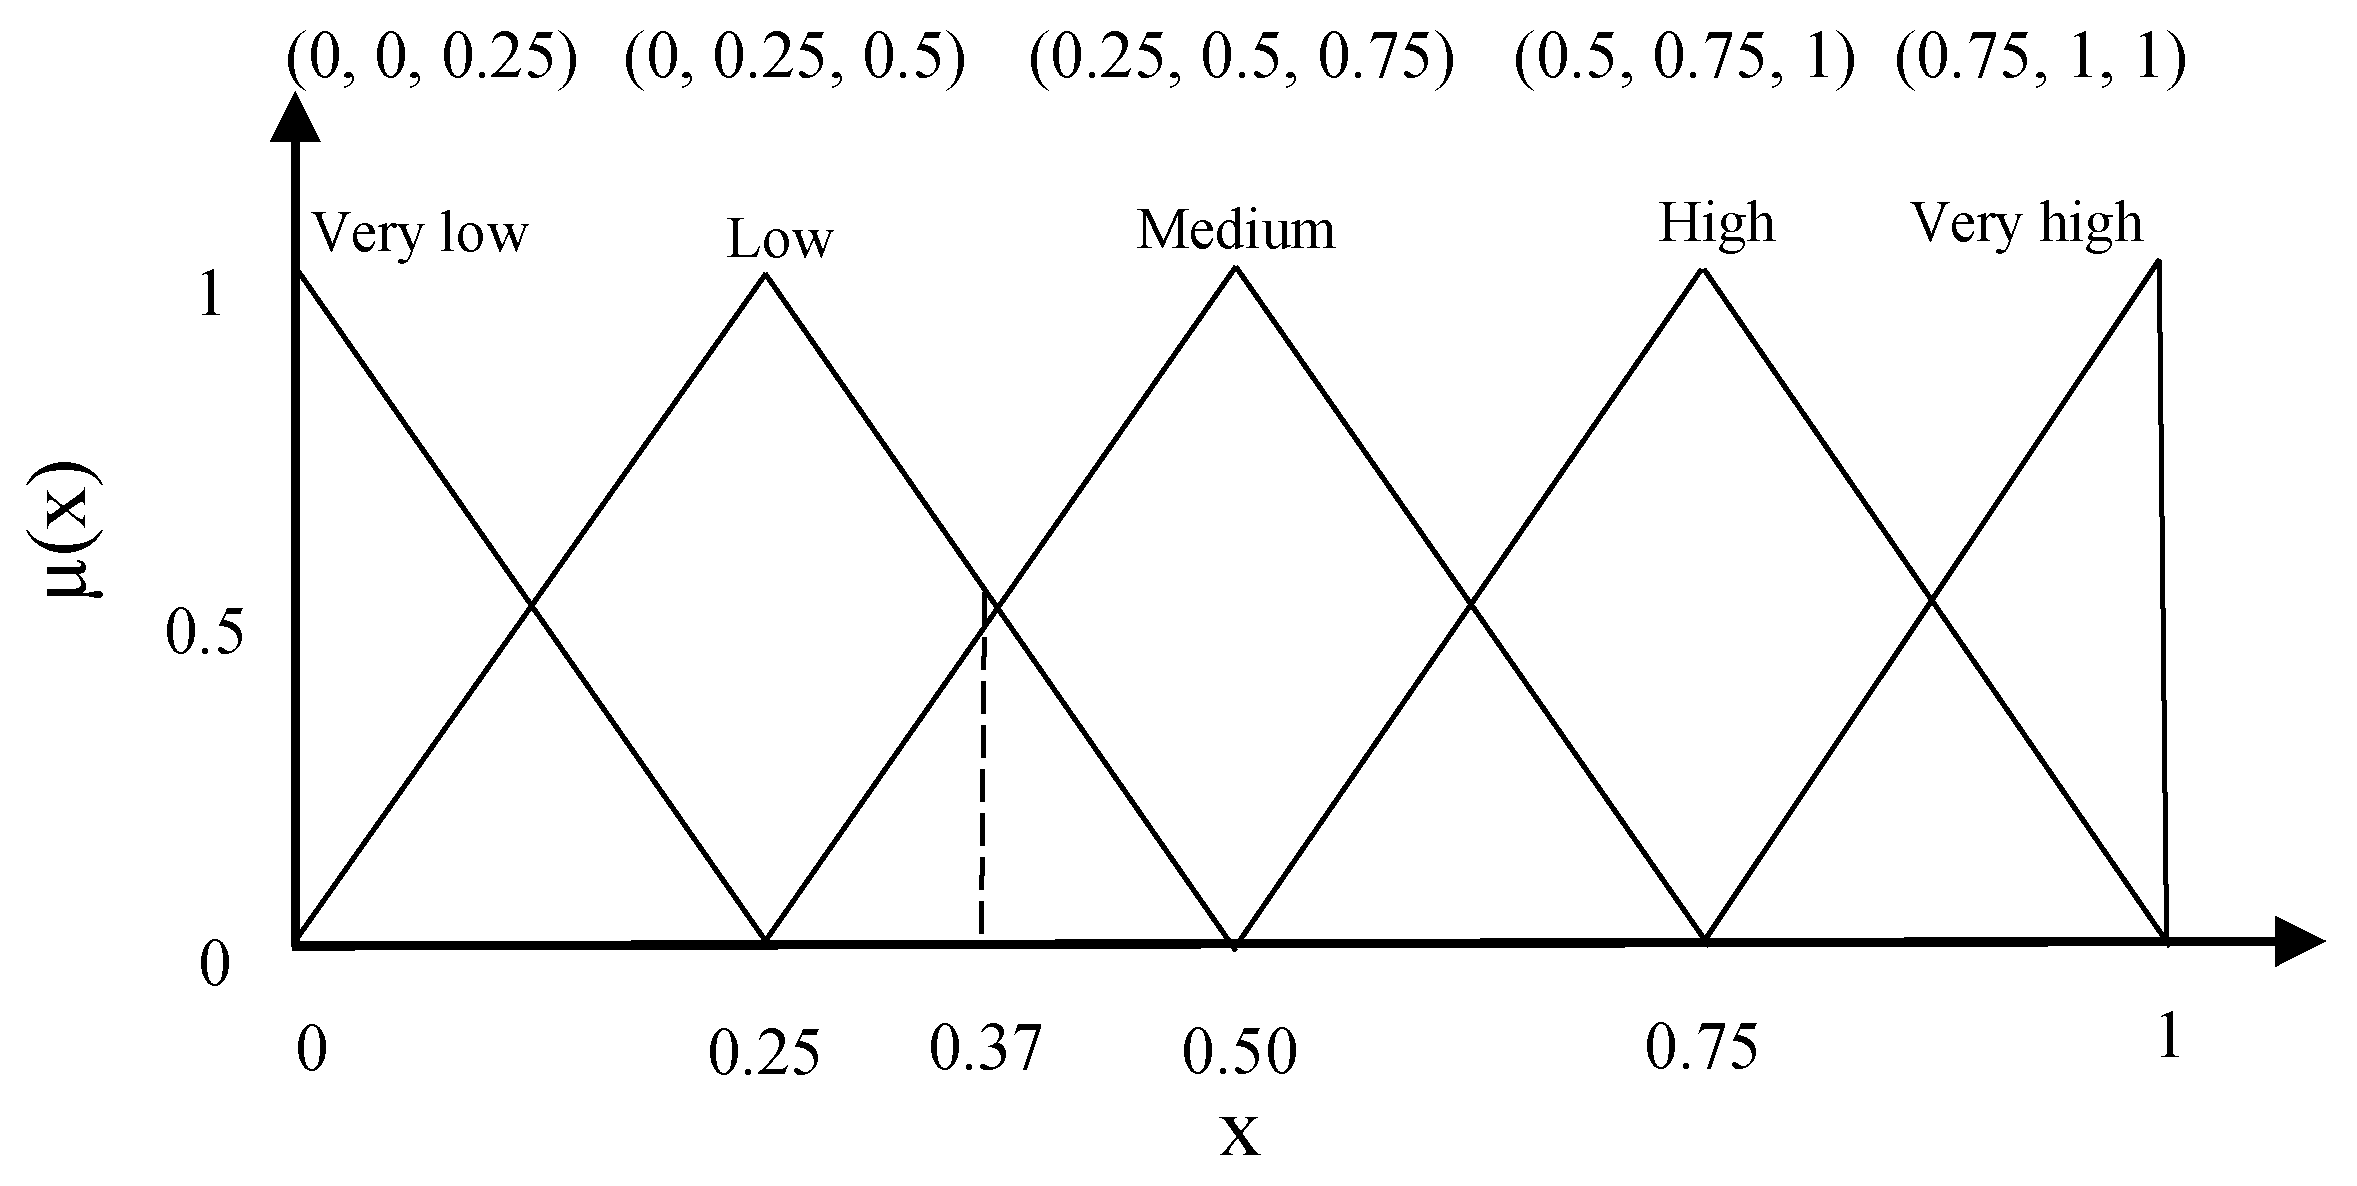
The fuzzy set theory is a frequently used method for managing construction risks [20,21,22]. The fuzzy representation of linguistic terms can capture the vagueness and imprecision associated with the input data provided by the participants [23]. In the second part of the questionnaire, the participants were asked to rate the degree of implementation corresponding to each risk maturity attribute. The input data collected from the qualified individuals was in a linguistic form, where values of 1 = very low, 2 = low, 3 = medium, 4 = high and 5 = very high. In order to transfer the linguistic term to a number, each linguistic value was represented with a fuzzy number as shown in Figure 4.
As shown in Figure 4, each fuzzy number has an overlap with its neighboring sets. It was pointed out by [24] that in most of the cases the overlap for triangle-to-triangle fuzzy regions varies between 25% and 50% of the fuzzy set base. In this study, the overlap was considered as 50% of fuzzy set base and the expected value of the organization’s risk maturity can be calculated using Equations (1)–(5).
The fuzzy implementation level associated with attribute (i) can be calculated according to the following equation [10]:
where (Fi) is the triangular fuzzy number of the attribute (i; fi1, fi2, fi3), which are the lower bound, strongest membership degree, and upper bound of (Fi), respectively; (n) is the number of questions associated with attribute (i); and (Fip) is the triangular fuzzy number associated with (pth) question of attribute (i). (Fip) is computed utilizing Equation (2):
where (k) is number of individuals who assess the implementation level of each question; (Fi pj) is the triangular fuzzy number of (pth)question of attribute (i) collected from (jth) individual. The triangular fuzzy number of the overall risk maturity of the organization (M) can be computed according to the Equations (3) and (4):
where (m1), (m2), (m3) are the lower bound, the strongest membership degree, and the upper bound of (M), respectively; (Wi) is the importance weight of the attribute (i) calculated by the ANP. The fuzzy number of the overall risk maturity is transferred to a crisp number employing the center of the area method, which is a commonly used method for defuzzification [25]. The expected value (EV) represents the defuzzified value of a fuzzy number according to Equation (4) [26]:
where, (a), (b), and (c) are triples of a triangular membership function. Therefore, in this study, the expected value of the organization risk maturity is calculated as Equation (5):
4. Results and Discussions
In order to demonstrate the applicability of the developed risk maturity model, the model was used to measure the risk maturity level of the industrial partner’s organization. The partner has over 50 years of extensive experience working on civil and infrastructure projects in Canada and is known as one of the leading general contractors in the country. In November 2019, a pilot study was conducted with the Assistant Director of the Innovation Department to finalize the list of qualified individuals who were expected to participate in this maturity assessment study. Table 7 shows the final list of the chosen qualified individuals which were clustered based on their level of authority in the organization and their involvement level in the maturity evaluation of each attribute.
A questionnaire survey was distributed to the identified individuals through their internal email address. Out of the 20 distributed questionnaires, a total of 14 questionnaires were completed reflecting a 70% response rate. The questionnaire was answered by one vice president, five project directors, three project managers, three preconstruction project managers, one bid coordinator, and one risk analyst, as shown in Table 8. As shown in Table 8, one respondent had more than 30 years of experience, nine respondents had 10–20 years of experience and the remaining had 5–10 years of experience.
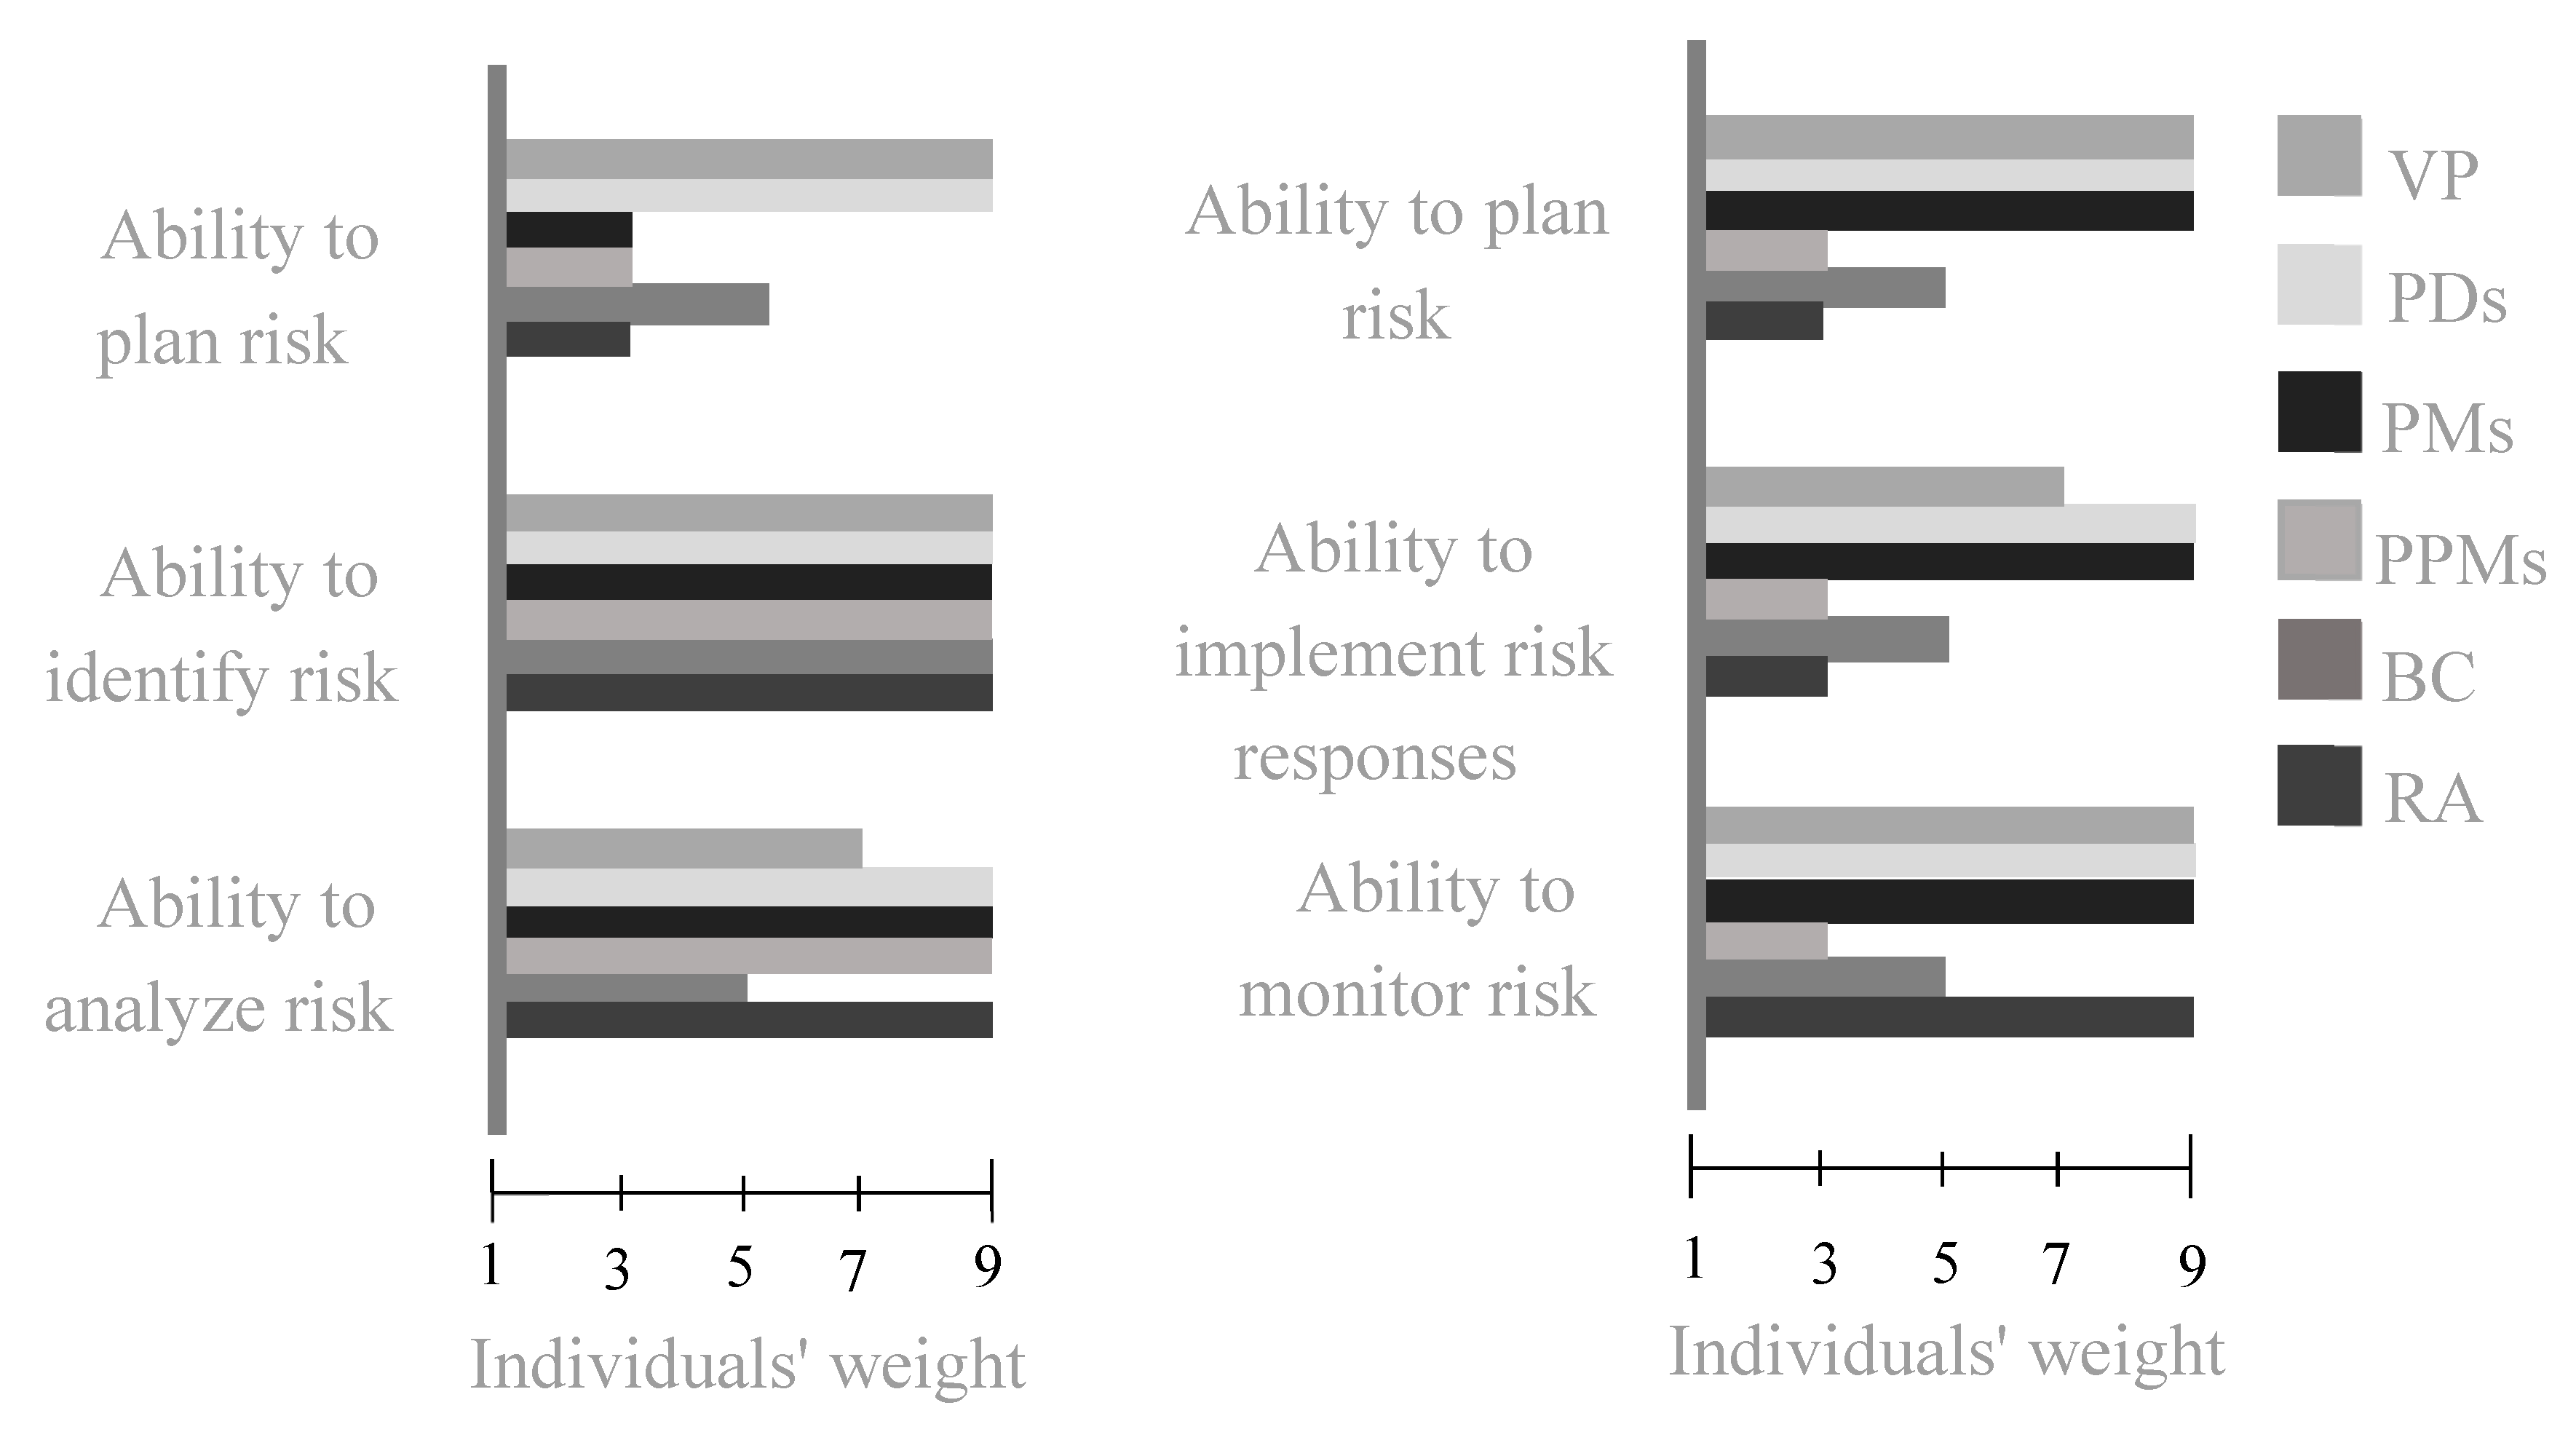
The individuals were asked to assign a score, expressing the relative importance of each attribute in comparison to the other attributes as well as its degree of implementation. The five-point scale method was utilized for that purpose, making it convenient for individuals to judge [10]. However, in this study, this scaling method was modified to a nine-point scale following the scaling method provided in the Super Decisions software. This means the values of 1, 2, 3, 4, 5 were equivalent to 1, 3, 5, 7, 9 respectively. Figure 5 shows the weight associated with each individual’s response for each attribute. These weights were utilized to form the pairwise comparison matrices.
Table 9 shows the individual’s opinions pairwise comparison matrix with regard to the first attribute which is the ability to plan risk. For instance, as shown in the first row of that matrix, the response provided by the vice president of the company (VP) was equally as important as the responses provided by individuals PD1 to PD5 and BC. The reason behind that is that all these individuals were involved in the maturity evaluation of that attribute and they all had a have weight of nine (9). However, it is strongly to very strongly more important than the responses provided by PM1 to PM3, PPM1 to PPM3 and RA. This is mainly because these individuals were not involved in the maturity evaluation of that attribute as shown in Table 7 and their level of authority in the organization was at a project level which was at low weight (3). The difference between the VP’s response weight with the responses provided by the PM1 to PM3, PPM1 to PPM3 and RA shows the importance of the VP’s response over those of the other which in this case is equal to six (6), as shown in the first row of Table 9.
The participants were then requested to performing the pairwise comparison of the importance of the six attributes as described earlier. For example, Table 10 shows the pairwise comparison between the attributes based on the response provided by the vice president of the company (VP). Given the provided response, the ability to plan risk (APR) was as important as the ability to analyze risk (AAR) and the ability to monitor risk (AMR). However, it was equal to moderately less important than the ability to identify risk (AIR), the ability to plan risk responses (ARR), and the ability to implement risk responses. The same process was carried out for the other individual participants and their corresponding pairwise comparison matrices were generated. Due to limited space, they are not shown here.
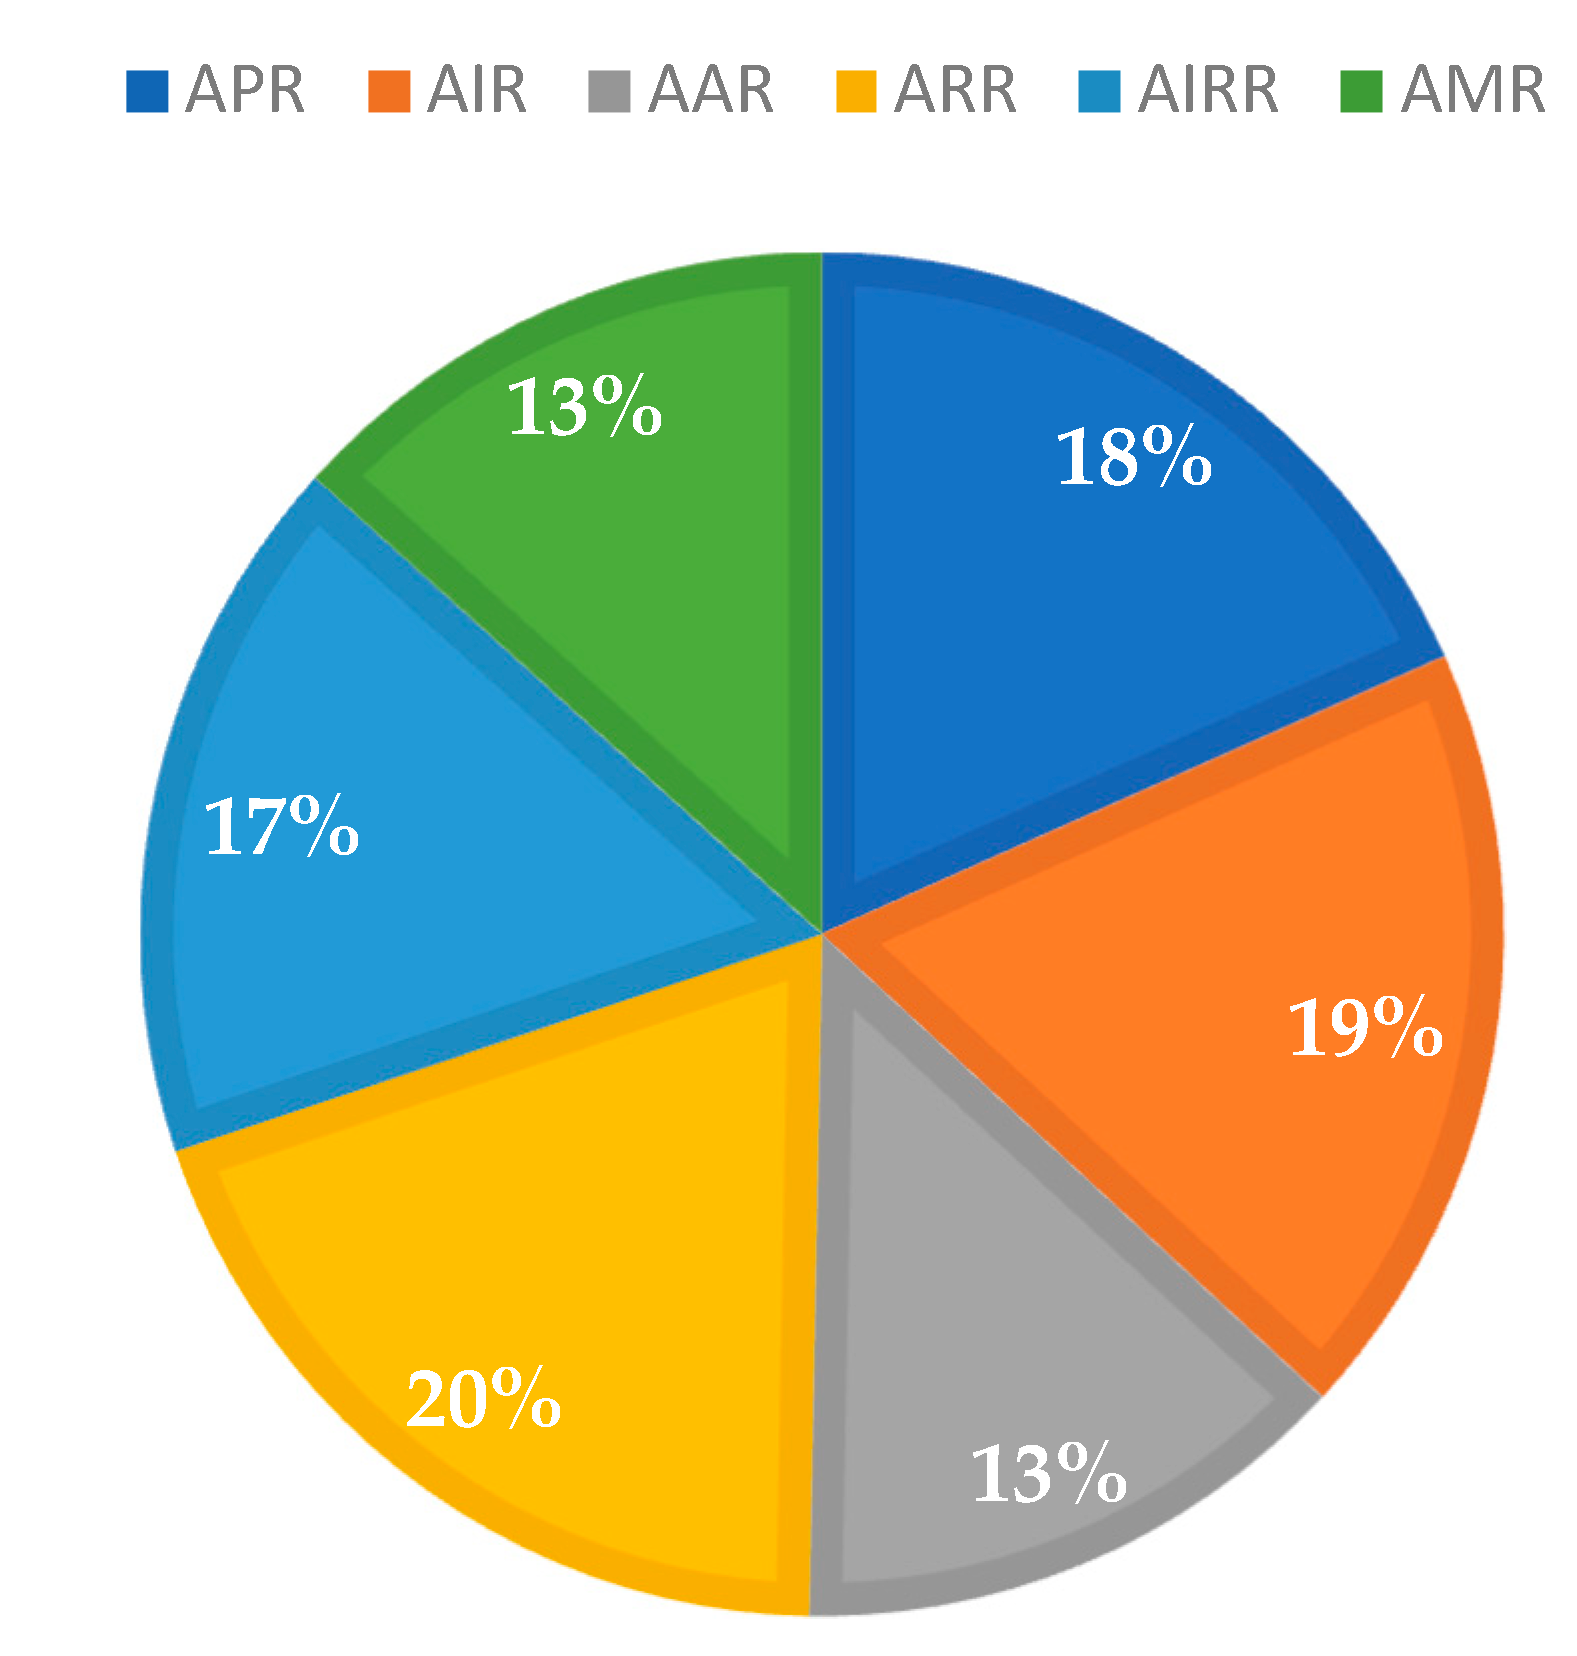
The results of the pairwise comparison matrices were utilized to form the unweighted super matrix as shown in Table 11. The value of zero in that matrix was entered for the elements with no dependency. Accordingly, the weighted and limited super matrices were attained and the relative importance weight of each attribute was obtained as shown in Figure 6. As shown in that figure, the ability to plan risk responses was the most important attribute with the overall weight of 20%. However, the least important attributes were identified as the ability to analyze risk as well as the ability to monitor risk with the overall weight of 13%. The remaining attributes including the ability to plan risk, the ability to identify risk and the ability to implement risk responses have almost the same importance with the overall weights of 17%, 19% and 18% respectively. These weights were multiplied to their corresponding degree of implementation score calculated based on Equations (1–5) and the overall expected value of the risk maturity level of the industrial partner’s organization was calculated as shown in Table 12.
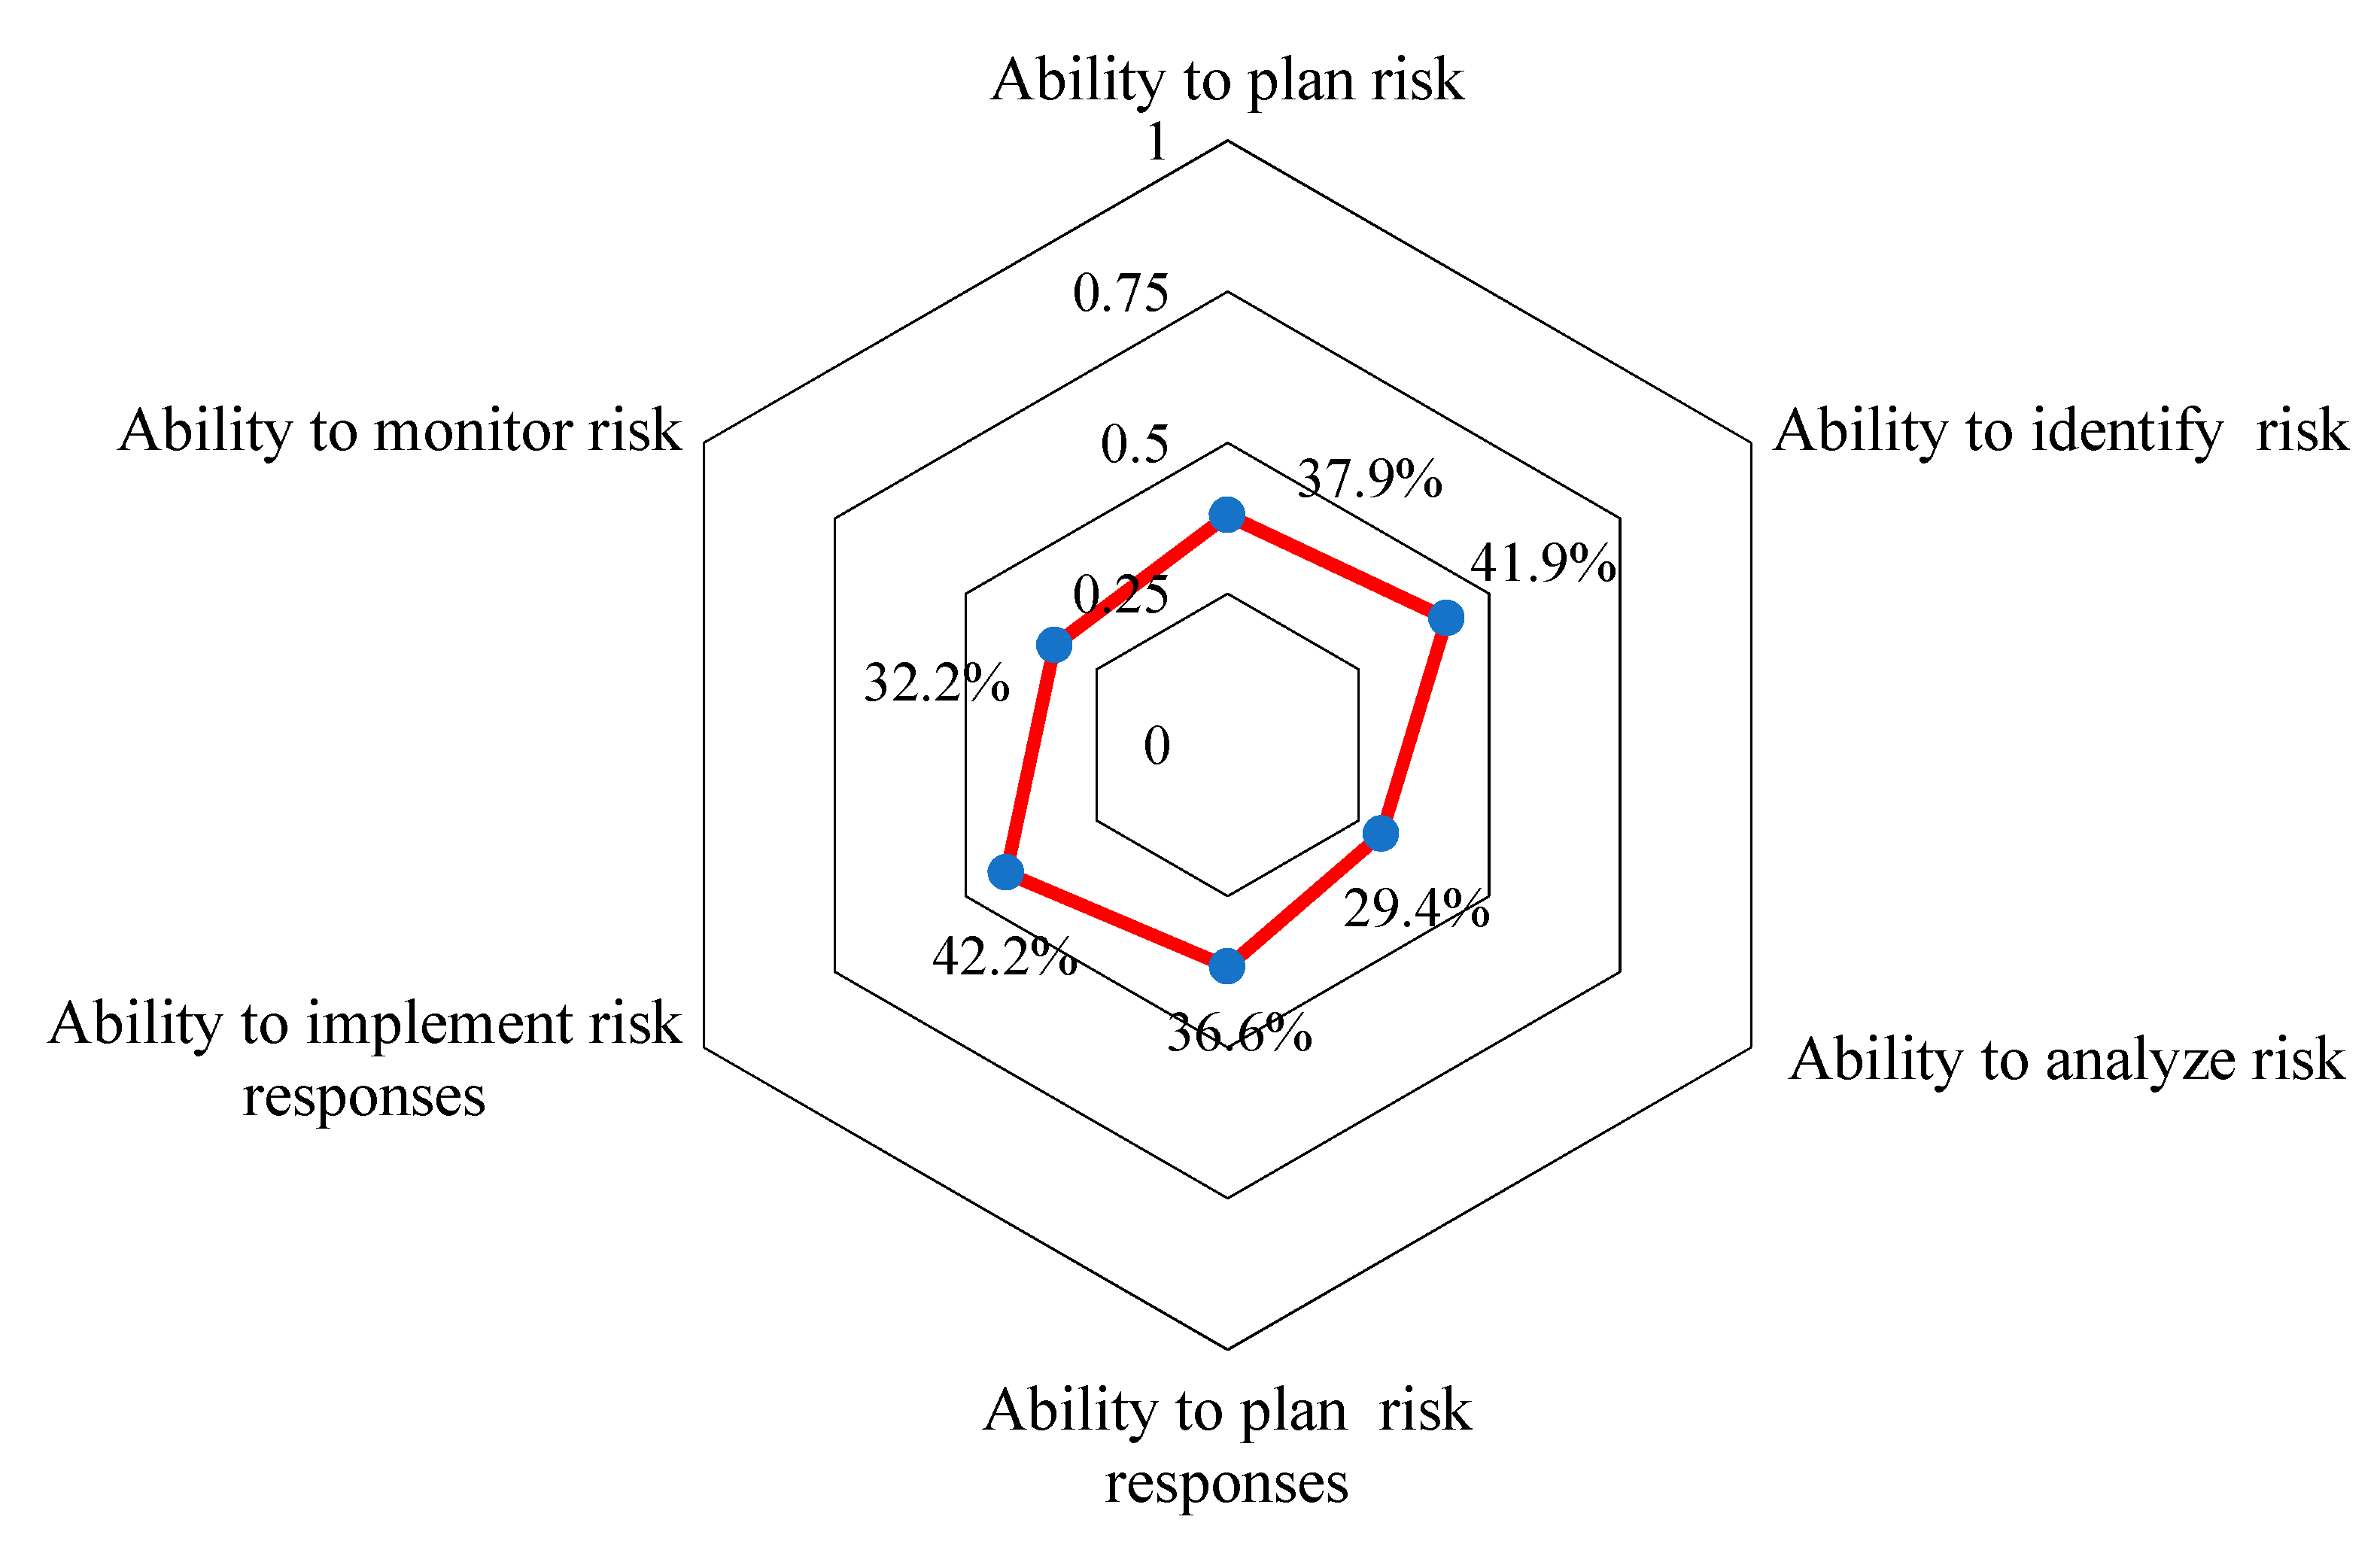
The organization risk maturity score fell into the regions of low and medium as shown in Figure 3. As that figure shows, the low has a higher membership value than the medium when the X value is 0.372. Thus, the risk maturity level of the industrial partner is low. The maturity study revealed areas that needed further improvement. For example, it was found that the risk performance of the industrial partner on risk analysis was lower than other areas with the degree of implementation equal to 29.4% as shown in Figure 7, indicating a call for more improvements in this area.
The model validation was conducted through using the feedback received from the individuals who participated in this study. A call for a meeting was made by the Assistant Director of the Innovation Department, inviting the individuals shown in Table 8 to review the final results. The comments received confirmed the applicability and validity of the developed model. It revealed that the risk maturity level of the industrial partner was at low level and its ability to analyze risk was the lowest attribute.
5. Conclusions
This paper presented a novel decision support model for evaluating the risk management maturity level of construction organizations. The developed model can assist construction organizations to have a clear view of their capabilities and weaknesses in risk management processes and help these organizations in having a better understanding of the areas that need improvements.
Unlike the existing risk maturity models reported in the literature, the developed model considered different relative weights for the responses provided by different individuals. It accounted for the authority level of the participants and their level of involvement in the risk management processes. This unique aspect of the developed model allows construction organizations to assign a higher weight to the responses provided by individuals who are at portfolio or program levels of the organization and have an adequate knowledge of risk management which in turn leads to a more accurate and reliable evaluation of the risk maturity level of the organization. Moreover, the developed model is capable of accounting for the interdependency between the risk maturity attributes and for the subjectivity and imprecision in the responses of the participants involved in the development of the model.
The developed model is limited to the use of trapezoidal membership function in representing the subjectivity associated with the individual responses. The model validation was also limited to the use of one case example. A sensitivity analysis needs to be conducted in future work in order to investigate the impact of the organization risk maturity level on managing risk.
Author Contributions
Conceptualization, M.A.R. and O.M.; methodology, M.A.R. and O.M.; software, M.A.R.; validation, M.A.R. and O.M.; formal analysis, O.M.; investigation, M.A.R. and O.M.; resources, M.A.R. and O.M.; data curation, M.A.R. and O.M.; writing—original draft preparation, M.A.R.; writing—review, restructuring, organization and editing, O.M.; visualization, M.A.R.; supervision, O.M.; project administration, M.A.R.; funding acquisition, O.M. All authors have read and agreed to the published version of the manuscript.
Funding
This work was supported by the Mitacs under Grant IT14277.
Acknowledgments
The authors would like to acknowledge the support provided by the members of the industrial partner in responding to the questionnaire.
Conflicts of Interest
The authors declare no conflict of interest.
References
- Salah, A. Fuzzy Set-Based Risk Management for Construction Projects. Ph.D. Thesis, Concordia University, Montreal, QC, Canada, 2015. [Google Scholar]
- PMI. A Guide to the Project Management Body of Knowledge (PMBOK Guide), 6th ed.; Project Management Institute: Newtown Square, PA, USA, 2017. [Google Scholar]
- PMI. Practice Standard for Project Risk Management; Project Management Institute: Newtown Square, PA, USA, 2009. [Google Scholar]
- ISO 31000. Risk Management–Guidelines; International Organization for Standardization: Geneva, Switzerland, 2018. [Google Scholar]
- AACE International. Required Skills and Knowledge of Decision and Risk Management; Association for the Advancement of Cost Engineering: Morgantown, WV, USA, 2013. [Google Scholar]
- IRM. A Risk Management Standard; The Institute of Risk Management: London, UK; The Association of Insurance and Risk Managers (AIRMIC): London, UK; ALARM The National Forum for Risk Management in the Public Sector: Devon, UK, 2002. [Google Scholar]
- Jia, G.; Ni, X.; Chen, Z.; Hong, B.; Chen, Y.; Yang, F.; Lin, C. Measuring the maturity of risk management in large-scale construction projects. Autom. Constr. 2013, 34, 56–66. [Google Scholar] [CrossRef]
- Hoseini, E.; Hertogh, M.; Bosch-Rekveldt, M. Developing a generic risk maturity model (GRMM) for evaluating risk management in construction projects. J. Risk Res. 2019, 1–20. [Google Scholar] [CrossRef] [Green Version]
- Zou, P.X.; Chen, Y.; Chan, T.Y. Understanding and improving your risk management capability: Assessment model for construction organizations. J. Constr. Eng. Manag. 2010, 136, 854–863. [Google Scholar] [CrossRef]
- Zhao, X.; Hwang, B.G.; Low, S.P. Developing fuzzy enterprise risk management maturity model for construction firms. J. Constr. Eng. Manag. 2013, 139, 1179–1189. [Google Scholar] [CrossRef]
- Zhao, X.; Hwang, B.G.; Low, S.P. Investigating enterprise risk management maturity in construction firms. J. Constr. Eng. Manag. 2014, 140, 05014006. [Google Scholar] [CrossRef]
- Alashwal, A.M.; Abdul-Rahman, H.; Asef, A. Influence of organizational learning and firm size on risk management maturity. J. Constr. Eng. Manag. 2017, 33, 04017034. [Google Scholar] [CrossRef]
- PMI. Organizational Project Management Maturity Model (OPM3); Project Management Institute: Newtown Square, PA, USA, 2008. [Google Scholar]
- Wibowo, A.; Taufik, J. Developing a self-assessment model of risk management maturity for client organizations of public construction projects: Indonesian context. Procedia Eng. 2017, 171, 274–281. [Google Scholar] [CrossRef]
- Jugdev, K.; Thomas, J. From operational process to strategic asset: The evolution of project management’s value in organizations. In Proceedings of the Project Management Institute 33rd Annual Symposium and Conference, San Antonio, TX, USA, 7–8 October 2002. [Google Scholar]
- Popic, Z.; Moselhi, O. Project Delivery Systems Selection for Capital Projects Using the Analytical Hierarchy Process and the Analytical Network Process. In Proceedings of the Construction Research Congress 2014: Construction in a Global Network, Atlanta, GA, USA, 19–21 May 2014; pp. 1339–1348. [Google Scholar]
- Super Decisions Tutorials. Tutorial 04: Changing from AHP to ANP. Super Decisions. Available online: https://superdecisions.com/tutorials/index.php?section=v28_tut04 (accessed on 20 March 2020).
- Saaty, T.L. Decision making—The analytic hierarchy and network processes (AHP/ANP). J. Syst. Sci. Syst. Eng. 2004, 13, 1–35. [Google Scholar] [CrossRef]
- Saaty, T.L.; Özdemir, M.S.; Saaty, T.L. The Encyclicon: A Dictionary of Decisions with Dependence and Feedback Based on the Analytic Network Process; RWS Publications: Pittsburgh, PA, USA, 2005; Volume 292. [Google Scholar]
- Islam, M.S.; Nepal, M.P.; Skitmore, M.; Attarzadeh, M. Current research trends and application areas of fuzzy and hybrid methods to the risk assessment of construction projects. Adv. Eng. Inf. 2017, 33, 112–131. [Google Scholar] [CrossRef]
- Hatefi, S.M.; Tamošaitienė, J. An integrated fuzzy DEMATEL-fuzzy ANP model for evaluating construction projects by considering interrelationships among risk factors. J. Civil Eng. Manag. 2019, 25, 114–131. [Google Scholar] [CrossRef]
- Moselhi, O.; Roghabadi, M.A. Risk quantification using fuzzy-based Monte Carlo simulation. J. Inf. Technol. Constr. 2020, 25, 87–98. [Google Scholar] [CrossRef]
- Xia, B.; Chan, A.P.; Yeung, J.F. Developing a fuzzy multicriteria decision-making model for selecting design-build operational variations. J. Constr. Eng. Manag. 2011, 137, 1176–1184. [Google Scholar] [CrossRef] [Green Version]
- Cox, E. The Fuzzy Systems Handbook; AP Professional: Boston, MA, USA, 1998. [Google Scholar]
- Amaya, A.J.R.; Lengerke, O.; Cosenza, C.A.N.; Dutra, M.S.; Tavera, M.J. Comparison of defuzzification methods: Automatic control of temperature and flow in heat exchanger. In Automation Control Theory and Practice; Rodic, A.D., Ed.; Books on Demand: Norderstedt, Germany, 2009; pp. 77–88. [Google Scholar]
- Salah, A. Fuzzy Set-Based Contingency Estimating and Management. Master’s Thesis, Concordia University, Montreal, QC, Canada, 2012. [Google Scholar]
Figure 1.
Framework of the developed model.

Figure 2.
Analytic network process (ANP) model structure.

Figure 3.
ANP entry-matrices: (a) the network supermatrix, (b) the network sub-matrix [19].
Figure 3.
ANP entry-matrices: (a) the network supermatrix, (b) the network sub-matrix [19].

Figure 4.
Membership functions of linguistic values [10].
Figure 4.
Membership functions of linguistic values [10].

Figure 5.
The individuals’ response weights per each attribute.

Figure 6.
Attributes’ importance.

Figure 7.
Degree of implementation for each attribute.


Table 1.
General risk management processes.
| Risk Management Processes | Professional Organization | |||
|---|---|---|---|---|
| [2] | [4] | [5] | [6] | |
| Communication and consultation | - | ✓ | - | - |
| Scope, context and criteria | - | ✓ | - | - |
| Plan risk management | ✓ | - | ✓ | - |
| Organization’s strategic objectives | - | - | - | ✓ |
| Risk assessment (identification, analysis, evaluation) | - | ✓ | ✓ | ✓ |
| Identify risks | ✓ | - | - | - |
| Perform qualitative risk analysis | ✓ | - | - | - |
| Perform quantitative risk analysis | ✓ | - | - | - |
| Risk Reporting | - | - | - | ✓ |
| Decision | - | - | - | ✓ |
| Risk treatment | - | ✓ | ✓ | ✓ |
| Plan risk responses | ✓ | - | - | - |
| Implement risk responses | ✓ | - | - | - |
| Recording and reporting | - | ✓ | - | - |
| Residual risk reporting | - | - | - | ✓ |
| Monitor risks | ✓ | - | ✓ | ✓ |
| Monitoring and review | - | ✓ | - | - |
Note: “✓”: Considered,”-”: not considered.
Table 2.
A summary of the risk maturity models for construction organizations.
| Source | Aspects | ||
|---|---|---|---|
| Modeling Interdependency | Capturing Uncertainty | Considering Individuals’ Weight | |
| [7] | ✓ | - | - |
| [8,9] | - | - | - |
| [10,11] | - | ✓ | - |
| [12,14] | - | - | - |
Note: “✓”: Considered,”-”: not considered.
Table 3.
Risk management aspects [13].
Table 3.
Risk management aspects [13].
| Aspects | Attributes |
|---|---|
| Standardization | Development and application of standardized risk management process, Objective setting, Risk management planning. |
| Measurement | Risk identification, Risk analysis, Risk response. |
| Control | Risk management ownership, Iterative and dynamic enterprise risk management (ERM) process steps, Formalized key risk indicators, Integration of risk management into business processes, Risk monitoring, Risk review, Management capability in relation to risk, Risk management report, Project set risk management. |
| Continuous improvement | Risk management planning, Policy and strategy, Organization structure support, Commitment of the board and senior management, Risk appetite and tolerance, Risk-aware culture, Risk communication, Common risk language, Leveraging risks as opportunities, improvement of ERM framework, Organizational risk culture, Training programs, Top-management commitment, Personnel knowledge, Sufficient resources, Stakeholder management. |
Table 4.
Description of the questions.
| Attributes | Aspects | Questions |
|---|---|---|
| Ability to plan risk (APR) | Standardization | Q1: Does the organization describe the concept of risk maturity and its benefits? Q2: Does the organization define risk in terms of opportunities and threats? Q3: Does the organization describe the concepts of risk breakdown structure and the use of it in risk planning? Q4: Does the organization have a dedicated group for risk management with defined roles, responsibilities? Q5: Does the organization use standard documented procedures (i.e., A Guide to the Project Management Body of Knowledge (PMBOK Guide), International Organization for Standardization (ISO) 31000) for risk management processes? |
| Continuous improvement | Q6: Does the organization consider external risks from outside the company and internal risks from within the company? Q7: Do the organization teams use company-wide procedures, guidelines and methods for project risk planning? Q8: Does the organization regularly review the risk management guidelines and methods to ensure their effectiveness? Q9: Does the organization have a risk-aware culture communicated to staff at all levels in the organization? Q10: Are resources continuously invested in improving the risk management tools, techniques, and professional skills of the organization? | |
| Ability to identify risk (AIR) | Measurement | Q1: Does the organization use the practices of brainstorming, checklists, root cause analysis, for risk identification? Q2: Does the organization apply the concepts of risk register? Q3: Does the organization compare actual risks experienced against those initially identified and update its risk identification method? Q4: Does the organization define generic factors that give rise to risk? Q5: Does the organization define risk factors that depend on the project delivery method and its type of contract? |
| Ability to analyse risk (AAR) | Measurement | Q1: Does the organization apply the recommended practices (e.g., PMBOK, ISO standards) for risk analysis? Q2: Does the organization apply a Monte Carlo simulation for contingency estimation? Q3: Does the organization model the uncertainty and subjectivity of input data which is used in risk analysis? Q4: Does the organization use qualitative and/or quantitative risk analysis tools? Q5: Does the organization consider correlation among cost items in contingency estimation? |
| Ability to plan risk responses (ARR) | Measurement | Q1: Does the organization evaluate and select the best alternative from several risk response strategies using data analysis techniques? Q2: Does organization describe and prioritize risk treatment strategies for threats and for opportunities? Q3: Does the organization devise a set of company-based and a set of project-based risk response strategies? Q4: Does the organization update risk response strategies on a regular basis? Q5: Does the organization evaluate the effectiveness of the selected risk response strategies? |
| Ability to implement risk responses (AIRR) | Control | Q1: Does the organization assess residual risks? Q2: Do organization team members take risk ownerships during project implementation? Q3: Are responsibilities for managing risks distributed and carried out by all team members? Q4: Do risk owners have sufficient authority to oversee risk-related action? Q5: Do the organization staff fully understand the authority and responsibility of risk owners at all levels of the company? |
| Ability to monitor risk (AMR) | Control | Q1: Does the organization have standard project risk monitoring procedures and methods? Q2: Does the organization have standard procedures and methods for forecasting the performance of implemented risk responses? Q3: Does the organization check actual progress against risk treatment plan and do the necessary updating during the execution phase? Q4: Does the organization regularly update the standard monitoring methods? Q5: Does the organization use automated tools to track a risk performance index? |
Table 5.
Individuals’ profiles.
| Source | Individuals’ Profiles | ||||||
|---|---|---|---|---|---|---|---|
| Risk Manager | Cost Manager | Contract/Bid Manager | Construction Manager | Developer Manager | Project Manager | Project Director | |
| [8] | ✓ | ✓ | ✓ | - | - | ✓ | ✓ |
| [9] | ✓ | ✓ | - | ✓ | ✓ | ✓ | ✓ |
| [10] | ✓ | - | ✓ | ✓ | - | ✓ | - |
| [11] | - | - | - | - | - | ✓ | ✓ |
| [12] | ✓ | - | - | - | - | ✓ | ✓ |
| [14] | - | - | - | - | - | - | - |
Note: “✓”: Considered,”-”: not considered.
Table 6.
Individuals expected to be involved in measuring the risk maturity in construction organizations.
Table 6.
Individuals expected to be involved in measuring the risk maturity in construction organizations.
| Domain | Individuals | Attributes | |||||
|---|---|---|---|---|---|---|---|
| APR | AIR | AAR | ARR | AIRR | AMR | ||
| Portfolio | Development manager | ✓ | ✓ | - | ✓ | - | - |
| Program | Project director | ✓ | ✓ | ✓ | ✓ | - | ✓ |
| Risk manager | ✓ | ✓ | ✓ | ✓ | - | ✓ | |
| Tender manager | ✓ | ✓ | - | - | - | - | |
| Cost manager | ✓ | ✓ | ✓ | - | - | - | |
| Project | Project manager | - | ✓ | ✓ | - | ✓ | ✓ |
| Construction manager | - | ✓ | ✓ | - | ✓ | ✓ | |
Note: “✓”: Considered,”-”: not considered.
Table 7.
Qualified individuals in the industrial partner organization.
| Source | Authority Level | Profile | Individual Involvement Level per Attribute | |||||
|---|---|---|---|---|---|---|---|---|
| APR | AIR | AAR | ARR | AIRR | AMR | |||
| Industrial partner | Portfolio | Executive vice president | ✓ | ✓ | - | ✓ | - | - |
| Vice president | ✓ | ✓ | - | ✓ | - | ✓ | ||
| Stakeholders | ✓ | ✓ | - | ✓ | - | - | ||
| Program | Construction project director | ✓ | ✓ | ✓ | ✓ | ✓ | ✓ | |
| Pre-construction project director | ✓ | ✓ | ✓ | ✓ | - | - | ||
| Bid manager | ✓ | ✓ | - | - | - | - | ||
| Insurance manager | - | ✓ | ✓ | - | - | ✓ | ||
| Real estate manager | - | ✓ | - | - | - | - | ||
| Financial risk analyzer | - | ✓ | ✓ | - | - | ✓ | ||
| Project planer | - | ✓ | - | - | - | ✓ | ||
| Project | Project manager | - | ✓ | ✓ | ✓ | ✓ | ✓ | |
| Project coordinator | - | ✓ | - | - | - | - | ||
| Super intendant manager | - | ✓ | - | ✓ | - | ✓ | ||
| Pre-construction manager | - | ✓ | ✓ | - | - | - | ||
Note: “✓”: Involved,”-”: not involved.
Table 8.
Respondents’ profiles.
| ID | Profile | Years of Experience |
|---|---|---|
| VP | Vice president alternative (projects and infrastructure) | 32 |
| PD1 | Project director | 10 |
| PD2 | Regional director | 13 |
| PD3 | Director - preconstruction and methods | 17 |
| PD4 | Director - project support | 16 |
| PD5 | Project director | 15 |
| PM1 | Project manager | 05 |
| PM2 | Senior project manager | 14 |
| PM3 | Senior project manager | 13 |
| PPM1 | Pre-construction manager | 15 |
| PPM2 | Pre-construction manager | 13 |
| PPM3 | Pre-construction manager | 15 |
| BC | Bid coordinator | 10 |
| RA | Risk analyst—financial risk analyzer | 09 |
Table 9.
Ability to plan the risk sub-decision factors pairwise comparison.
| Factors | VP | PD1 | PD2 | PD3 | PD4 | PD5 | PM1 | PM2 | PM3 | PPM1 | PPM2 | PPM3 | BC | RA |
|---|---|---|---|---|---|---|---|---|---|---|---|---|---|---|
| VP | 1 | 1 | 1 | 1 | 1 | 1 | 6 | 6 | 6 | 6 | 6 | 6 | 1 | 6 |
| PD1 | 1 | 1 | 1 | 1 | 1 | 1 | 6 | 6 | 6 | 6 | 6 | 6 | 1 | 6 |
| PD2 | 1 | 1 | 1 | 1 | 1 | 1 | 6 | 6 | 6 | 6 | 6 | 6 | 1 | 6 |
| PD3 | 1 | 1 | 1 | 1 | 1 | 1 | 6 | 6 | 6 | 6 | 6 | 6 | 1 | 6 |
| PD4 | 1 | 1 | 1 | 1 | 1 | 1 | 6 | 6 | 6 | 6 | 6 | 6 | 1 | 6 |
| PD5 | 1 | 1 | 1 | 1 | 1 | 1 | 6 | 6 | 6 | 6 | 6 | 6 | 1 | 6 |
| PM1 | 1/6 | 1/6 | 1/6 | 1/6 | 1/6 | 1/6 | 1 | 1 | 1 | 1 | 1 | 1 | 1/6 | 1 |
| PM2 | 1/6 | 1/6 | 1/6 | 1/6 | 1/6 | 1/6 | 1 | 1 | 1 | 1 | 1 | 1 | 1/6 | 1 |
| PM3 | 1/6 | 1/6 | 1/6 | 1/6 | 1/6 | 1/6 | 1 | 1 | 1 | 1 | 1 | 1 | 1/6 | 1 |
| PPM1 | 1/6 | 1/6 | 1/6 | 1/6 | 1/6 | 1/6 | 1 | 1 | 1 | 1 | 1 | 1 | 1/6 | 1 |
| PPM2 | 1/6 | 1/6 | 1/6 | 1/6 | 1/6 | 1/6 | 1 | 1 | 1 | 1 | 1 | 1 | 1/6 | 1 |
| PPM3 | 1/6 | 1/6 | 1/6 | 1/6 | 1/6 | 1/6 | 1 | 1 | 1 | 1 | 1 | 1 | 1/6 | 1 |
| BC | 1 | 1 | 1 | 1 | 1 | 1 | 6 | 6 | 6 | 6 | 6 | 6 | 1 | 6 |
| RA | 1/6 | 1/6 | 1/6 | 1/6 | 1/6 | 1/6 | 1 | 1 | 1 | 1 | 1 | 1 | 1 | 1 |
Table 10.
Key decision factors pairwise comparison concerning the VP’s opinion.
| Factors | APR | AIR | AAR | ARR | AIRR | AMR |
|---|---|---|---|---|---|---|
| APR | 1 | 1/2 | 1 | 1/2 | 1/2 | 1 |
| AIR | 2 | 1 | 2 | 1 | 1 | 2 |
| AAR | 1 | 1/2 | 1 | 1/2 | 1/2 | 1 |
| ARR | 2 | 1 | 2 | 1 | 1 | 2 |
| AIRR | 2 | 1 | 2 | 1 | 1 | 2 |
| AMR | 1 | 1/2 | 1 | 1/2 | 1 | 1 |
Table 11.
Unweighted super matrix.
| Factors | APR | AIR | AAR | ARR | AIRR | AMR | VP | PD1 | PD2 | PD3 | PD4 | PD5 | PM1 | PM2 | PM3 | PPM1 | PPM2 | PPM3 | BC | RA |
|---|---|---|---|---|---|---|---|---|---|---|---|---|---|---|---|---|---|---|---|---|
| APR | 0 | 0 | 0 | 0 | 0 | 0 | 0.111 | 0.096 | 0.111 | 0.363 | 0.307 | 0.154 | 0.153 | 0.166 | 0.200 | 0.166 | 0.166 | 0.210 | 0.166 | 0.143 |
| AIR | 0 | 0 | 0 | 0 | 0 | 0 | 0.222 | 0.096 | 0.222 | 0.182 | 0.154 | 0.154 | 0.307 | 0.166 | 0.200 | 0.166 | 0.166 | 0.0105 | 0.166 | 0.285 |
| AAR | 0 | 0 | 0 | 0 | 0 | 0 | 0.111 | 0.051 | 0.111 | 0.182 | 0.077 | 0.154 | 0.077 | 0.166 | 0.200 | 0.166 | 0.166 | 0.052 | 0.166 | 0.285 |
| ARR | 0 | 0 | 0 | 0 | 0 | 0 | 0.222 | 0.369 | 0.222 | 0.091 | 0.154 | 0.307 | 0.153 | 0.166 | 0.100 | 0.166 | 0.166 | 0.210 | 0.166 | 0.143 |
| AIRR | 0 | 0 | 0 | 0 | 0 | 0 | 0.222 | 0.193 | 0.222 | 0.091 | 0.154 | 0.154 | 0.153 | 0.166 | 0.200 | 0.166 | 0.166 | 0.210 | 0.166 | 0.071 |
| AMR | 0 | 0 | 0 | 0 | 0 | 0 | 0.111 | 0.193 | 0.111 | 0.091 | 0.154 | 0.077 | 0.153 | 0.166 | 0.100 | 0.166 | 0.166 | 0.210 | 0.166 | 0.071 |
| VP | 0.122 | 0.071 | 0.039 | 0.100 | 0.058 | 0.093 | 0 | 0 | 0 | 0 | 0 | 0 | 0 | 0 | 0 | 0 | 0 | 0 | 0 | 0 |
| PD1 | 0.122 | 0.071 | 0.078 | 0.100 | 0.104 | 0.093 | 0 | 0 | 0 | 0 | 0 | 0 | 0 | 0 | 0 | 0 | 0 | 0 | 0 | 0 |
| PD2 | 0.122 | 0.071 | 0.078 | 0.100 | 0.104 | 0.093 | 0 | 0 | 0 | 0 | 0 | 0 | 0 | 0 | 0 | 0 | 0 | 0 | 0 | 0 |
| PD3 | 0.122 | 0.071 | 0.078 | 0.100 | 0.104 | 0.093 | 0 | 0 | 0 | 0 | 0 | 0 | 0 | 0 | 0 | 0 | 0 | 0 | 0 | 0 |
| PD4 | 0.122 | 0.071 | 0.078 | 0.100 | 0.104 | 0.093 | 0 | 0 | 0 | 0 | 0 | 0 | 0 | 0 | 0 | 0 | 0 | 0 | 0 | 0 |
| PD5 | 0.122 | 0.071 | 0.078 | 0.100 | 0.104 | 0.093 | 0 | 0 | 0 | 0 | 0 | 0 | 0 | 0 | 0 | 0 | 0 | 0 | 0 | 0 |
| PM1 | 0.020 | 0.071 | 0.078 | 0.100 | 0.104 | 0.093 | 0 | 0 | 0 | 0 | 0 | 0 | 0 | 0 | 0 | 0 | 0 | 0 | 0 | 0 |
| PM2 | 0.020 | 0.071 | 0.078 | 0.100 | 0.104 | 0.093 | 0 | 0 | 0 | 0 | 0 | 0 | 0 | 0 | 0 | 0 | 0 | 0 | 0 | 0 |
| PM3 | 0.020 | 0.071 | 0.078 | 0.100 | 0.104 | 0.093 | 0 | 0 | 0 | 0 | 0 | 0 | 0 | 0 | 0 | 0 | 0 | 0 | 0 | 0 |
| PPM1 | 0.020 | 0.071 | 0.078 | 0.016 | 0.024 | 0.015 | 0 | 0 | 0 | 0 | 0 | 0 | 0 | 0 | 0 | 0 | 0 | 0 | 0 | 0 |
| PPM2 | 0.020 | 0.071 | 0.078 | 0.016 | 0.024 | 0.015 | 0 | 0 | 0 | 0 | 0 | 0 | 0 | 0 | 0 | 0 | 0 | 0 | 0 | 0 |
| PPM3 | 0.020 | 0.071 | 0.078 | 0.016 | 0.024 | 0.015 | 0 | 0 | 0 | 0 | 0 | 0 | 0 | 0 | 0 | 0 | 0 | 0 | 0 | 0 |
| BC | 0.122 | 0.071 | 0.019 | 0.027 | 0.020 | 0.025 | 0 | 0 | 0 | 0 | 0 | 0 | 0 | 0 | 0 | 0 | 0 | 0 | 0 | 0 |
| RA | 0.020 | 0.071 | 0.078 | 0.016 | 0.017 | 0.093 | 0 | 0 | 0 | 0 | 0 | 0 | 0 | 0 | 0 | 0 | 0 | 0 | 0 | 0 |
Table 12.
Risk maturity score of industrial partner’s organization.
| Attributes | Attributes’ Importance | Degree of Implementation | Attributes’ Maturity Score | ||
|---|---|---|---|---|---|
| Weights (ANP) | Rank | Fuzzy Number | Crisp Number | ||
| APR | 18.33 | 3 | (0.075, 0.408, 0.655) | 0.379 | 6.95 |
| AID | 18.55 | 2 | (0.107, 0.453, 0.696) | 0.419 | 7.77 |
| AAR | 13.42 | 5 | (0.071, 0.282, 0.528) | 0.294 | 3.94 |
| ARR | 19.54 | 1 | (0.064, 0.396, 0.639) | 0.366 | 7.15 |
| AIRR | 16.83 | 4 | (0.092, 0.471, 0.703) | 0.422 | 7.10 |
| AMR | 13.33 | 6 | (0.05, 0.335, 0.582) | 0.322 | 4.29 |
| Industrial partner risk maturity score | 37.2 | ||||
© 2020 by the authors. Licensee MDPI, Basel, Switzerland. This article is an open access article distributed under the terms and conditions of the Creative Commons Attribution (CC BY) license (http://creativecommons.org/licenses/by/4.0/).
Share and Cite
MDPI and ACS Style
Roghabadi, M.A.; Moselhi, O. A Fuzzy-Based Decision Support Model for Risk Maturity Evaluation of Construction Organizations. Algorithms 2020, 13, 115. https://0-doi-org.brum.beds.ac.uk/10.3390/a13050115
AMA Style
Roghabadi MA, Moselhi O. A Fuzzy-Based Decision Support Model for Risk Maturity Evaluation of Construction Organizations. Algorithms. 2020; 13(5):115. https://0-doi-org.brum.beds.ac.uk/10.3390/a13050115
Chicago/Turabian StyleRoghabadi, Mohammadjavad Arabpour, and Osama Moselhi. 2020. "A Fuzzy-Based Decision Support Model for Risk Maturity Evaluation of Construction Organizations" Algorithms 13, no. 5: 115. https://0-doi-org.brum.beds.ac.uk/10.3390/a13050115
Note that from the first issue of 2016, this journal uses article numbers instead of page numbers. See further details here.