Image Resolution Enhancement of Highly Compressively Sensed CT/PET Signals

Faculty of Electronics and Telecommunications, Poznan University of Technology, 60-965 Poznan, Poland
Algorithms 2020, 13(5), 129; https://0-doi-org.brum.beds.ac.uk/10.3390/a13050129
Submission received: 29 April 2020
/
Revised: 15 May 2020
/
Accepted: 16 May 2020
/
Published: 21 May 2020
Abstract
:One of the most challenging aspects of medical modalities such as Computed Tomography (CT) as well hybrid techniques such as CT/PET (Computed Tomography/Positron emission tomography) and PET/MRI is finding a balance between examination time, radiation dose, and image quality. The need for a dense sampling grid is associated with two major factors: image resolution enhancement, which leads to a strengthening of human perception, and image features interpretation. All these aspects make an unsupervised image processing much easier. The presented algorithm employs super-resolution-reconstruction with high accuracy motion fields’ estimation at its core for Computed Tomography/Positron Emission Tomography (CT/PET) images enhancement. The suggested method starts with processing compressively sensed input signals. This paper shows that it is possible to achieve higher image resolution while keeping the same radiation dose. The purpose of this paper is to propose a highly effective CT/PET image reconstruction strategy, allowing for simultaneous resolution enhancing and scanning time minimisation. The algorithm aims to overcome two major obstacles—image resolution limitation and algorithm reconstruction time efficiency-by combining a highly-sparse Ridgelet analysis based sampling pattern as well as PET signal sensing with super-resolution (SR) image enhancement. Due to the diverse nature of Computed Tomography, the applied Ridgelet analysis arguing its usability turned out to be efficient in reducing acquisition times in regard to maintaining satisfying scan quality. This paper presents a super-resolution image enhancement algorithm designed for handling highly sensitively compressed hybrid CT/PET scanners raw data. The presented technique allows for improving image resolution while reducing motion artefacts and keeping scanning times at pretty low levels.
1. Introduction
Positron emission tomography-computed tomography (better known as PET-CT or PET/CT) is a nuclear medicine procedure which fuses a positron emission tomography (PET) modality with an X-ray based computed tomography (CT), to obtain sequential images from both devices during the same time period, which are then merged into a dual diagnostic image. Therefore, functional imaging acquired by PET, which illustrates the spatial distribution of metabolic or biochemical activity in the body can be more accurately aligned or correlated with anatomic imaging achieved by CT scanning [1,2]. The 2D and 3D image reconstruction may be rendered as a function of a joint algorithm. PET-CT has modernised medical modalities in many aspects, by adding accuracy of anatomic localisation to functional imaging, which was not available for the PET imaging. For example, many medical imaging techniques in cancer treatment, surgery planning systems, radiation treatment for cancer have been under the influence of PET-CT availability has been increasingly abandoning conventional PET devices and replacing them by PET-CT devices. The idea of combining PET with CT was proposed in the early 1990s by David Townsend and Ronald Nutt. Furthermore, to inherent image alignment, the expected profit from a PET/CT hardware fusion was to use the CT images to utilise the PET attenuation correction factors [1,2,3]. The very first prototype PET/CT turned out to be functional in 1998, proposed by CTI PET Systems in Knoxville, TN, USA and clinically valued at the University of Pittsburgh. The project delivered a single-slice spiral CT and a rotating ECAT ART PET (a continuously rotating PET camera) procedure [2]. Other hybrid scanners have been increasing their importance [4,5,6]. The spatial resolution, as well as its clarity, is a critical requirement in a number of healthcare environments, including MRI, CT, and PET where studies suffer from a lack of diagnostic data due to unusably distorted images. Medical imaging modalities are widely characterised by low spatial resolution, contrast weakness, visual noise scattering, and blurring caused by the complexity of body internal tissues, which all can cause difficulties in making a correct medical diagnosis. Several different improvements are here described and claimed to be useful for improving image quality while keeping scanning times at indeed low levels. The proposed algorithm reduces artefacts caused by highly undersampled data, even in the presence of motion distortions. The presented algorithm extends the well known Iterative Back Projection technique in several ways. It nests the Bayesian MAP estimate of the noise level, globally deformable motion analysis as well as blur kernel recognition and discrete optimisation at its core [7]. In order to be able to ensure that the presented algorithm delivers great results, it combines efficient Adaptive Tomography Reconstruction with Super-Resolution reconstruction. It yields an improved CT/PET images quality as well as improved time complexity. Moreover, enhanced high-frequency components sampling improves edge representation. The method could be directly implemented to CT/PET scanners without any hardware tweaks or changes. Thus, it is clearly shown that the developed technique can provide enhanced and sharper outputs. From obvious reasons, the sharper tissue boundaries lead to higher chances to make a proper clinical diagnosis. This modality has financial aspects that need to be considered. Therefore, whether the higher acquisition costs for CT/PET will be balanced in the long-term still needs to be confirmed. The goal of this paper was to show the potential of combined techniques for enhancing CT/PET images while maintaining short acquisition times. In accordance with high public expectations, the presented algorithm can enhance image resolution without any hardware adjustments. Besides the resolution trade-offs, this method is able to reduce motion artefacts. Data from preliminary trials can also be valuable in providing background information useful in reducing examination time. However, the motion estimation algorithm can significantly eliminate diagnostic images’ artefacts thus maximising the chance of correct diagnosis. Numerous medical imaging procedures have been struggling with one of their most prominent drawbacks, i.e., long examination times. Many algorithms for quickening of the MRI data collection have been subjects of interest for many researchers [4,7,8]. One of the possible scenarios of what could be developed is the change of phase encoding intervals in k-space filling [9,10,11,12]. Unfortunately, this aspect usually leads to weakened image quality. Favourably, it can be overcome by applying the proposed k-space sampling pattern [8]. Single-shot echo planar imaging (SS-EPI) turned out to be one of the most frequently developed sampling schemes in DWI (Diffusion Weighted Imaging) area. However, despite its undisputed importance, some features have remained a point of confusion and reasoned subject of discourse.
The presented methodology has been confronted with several state-of-art super-resolution enhancement algorithms such as Enhanced Deep Residual Networks for Single Image Super-Resolution [13], Image super-resolution using very deep residual channel attention Networks [14], as well as Residual dense network for image super-resolution exploiting the deep convolutional neural networks [15]. In order to make the comparison more reliable, the goal was to train the networks to map Low-Resolution (LR) CT and PET scans to ‘ground-truth’ subimages’ domains.
These methods relied on residual learning procedures and their improvements. They can be further adapted to take advantage of using a modified optimisation relying on removing unnecessary modules in conventional residual networks. The main idea of that algorithm is to use dynamic upsampling filters and to derive a residual image. It simplifies the motion estimation procedures by avoiding explicit motion compensation procedures. Furthermore, increasing the size of the model was recommended. This adjustment stabilises the learning step. Despite their importance in the medical image processing field, these techniques are not suitable for such highly challenging environments because of the need for reliable training sets. Moreover, with these kinds of methods, precision depends on the accuracy of image registration. Because of this, numerous Super-Resolution frameworks exploit optical flow-based procedures. It should be mentioned that public expectations regarding the medical modalities are much higher than in the case of conventional video/image enhancement. The method adapted in this paper is a severally verified globally optimal deformable registration based super-resolution algorithm [16].
One of its main constraints is spatial resolution which produces difficulties in depicting minute body structures. In the area of Computed tomography (CT), a serious concern is to reduce the radiation dose without significantly degrading the diagnostic image quality. Compressed sensing (CS) allows for the radiation dose reduction by reconstructing scans from a limited number of projections. In the technique shown in this paper, the main goal is to enhance the CT/PET hybrid scanner’s image resolution as well as its quality in terms of edge delineation, keeping acquisition time at a low level, see Figure 1 and Figure 2. In this work, the author suggests a new the CT/PET area associated technique, which blends super-resolution [7,8] and motion correction with a robust sampling trajectory pattern. The experimental results are promising and revealed the method’s true value. The main goal was to enhance image resolution as well as its quality in terms of edge delineation while keeping acquisition time at a pretty low level.
2. CT/PET Joint Sparsity
Usually, despite quite dissimilar physical features utilised in the PET and CT, the reconstruction procedure involves their projections side-by-side. It means that the scans are being restored in isolated methods, but both can utilise the same image features and motion trajectory. However, the reconstruction procedure may be simplified due to inherent objects’ similarities and important common information being shared between them. This feature could be applied in combination with other extracted structures to make motion artefacts smaller. Instead of separated reconstruction steps, the joint sparsity method combines two sparsely sampled data sets allowing these structural similarities to increase the image resolution and minimise the motion artefacts. The proposed algorithm solves the following constrained cost function. In this equation, xCT and xPET promote their data sets’ sparsity by exploiting the Compressed Sensing. The joint sparsity is the most influential subject in the use of structural information between PET and CT scans, and it can be expressed in the following way:
where and are 3D image volumes, and is a sparsifying transform.
In this way, the regularisation performed at each voxel could be expressed as follows:
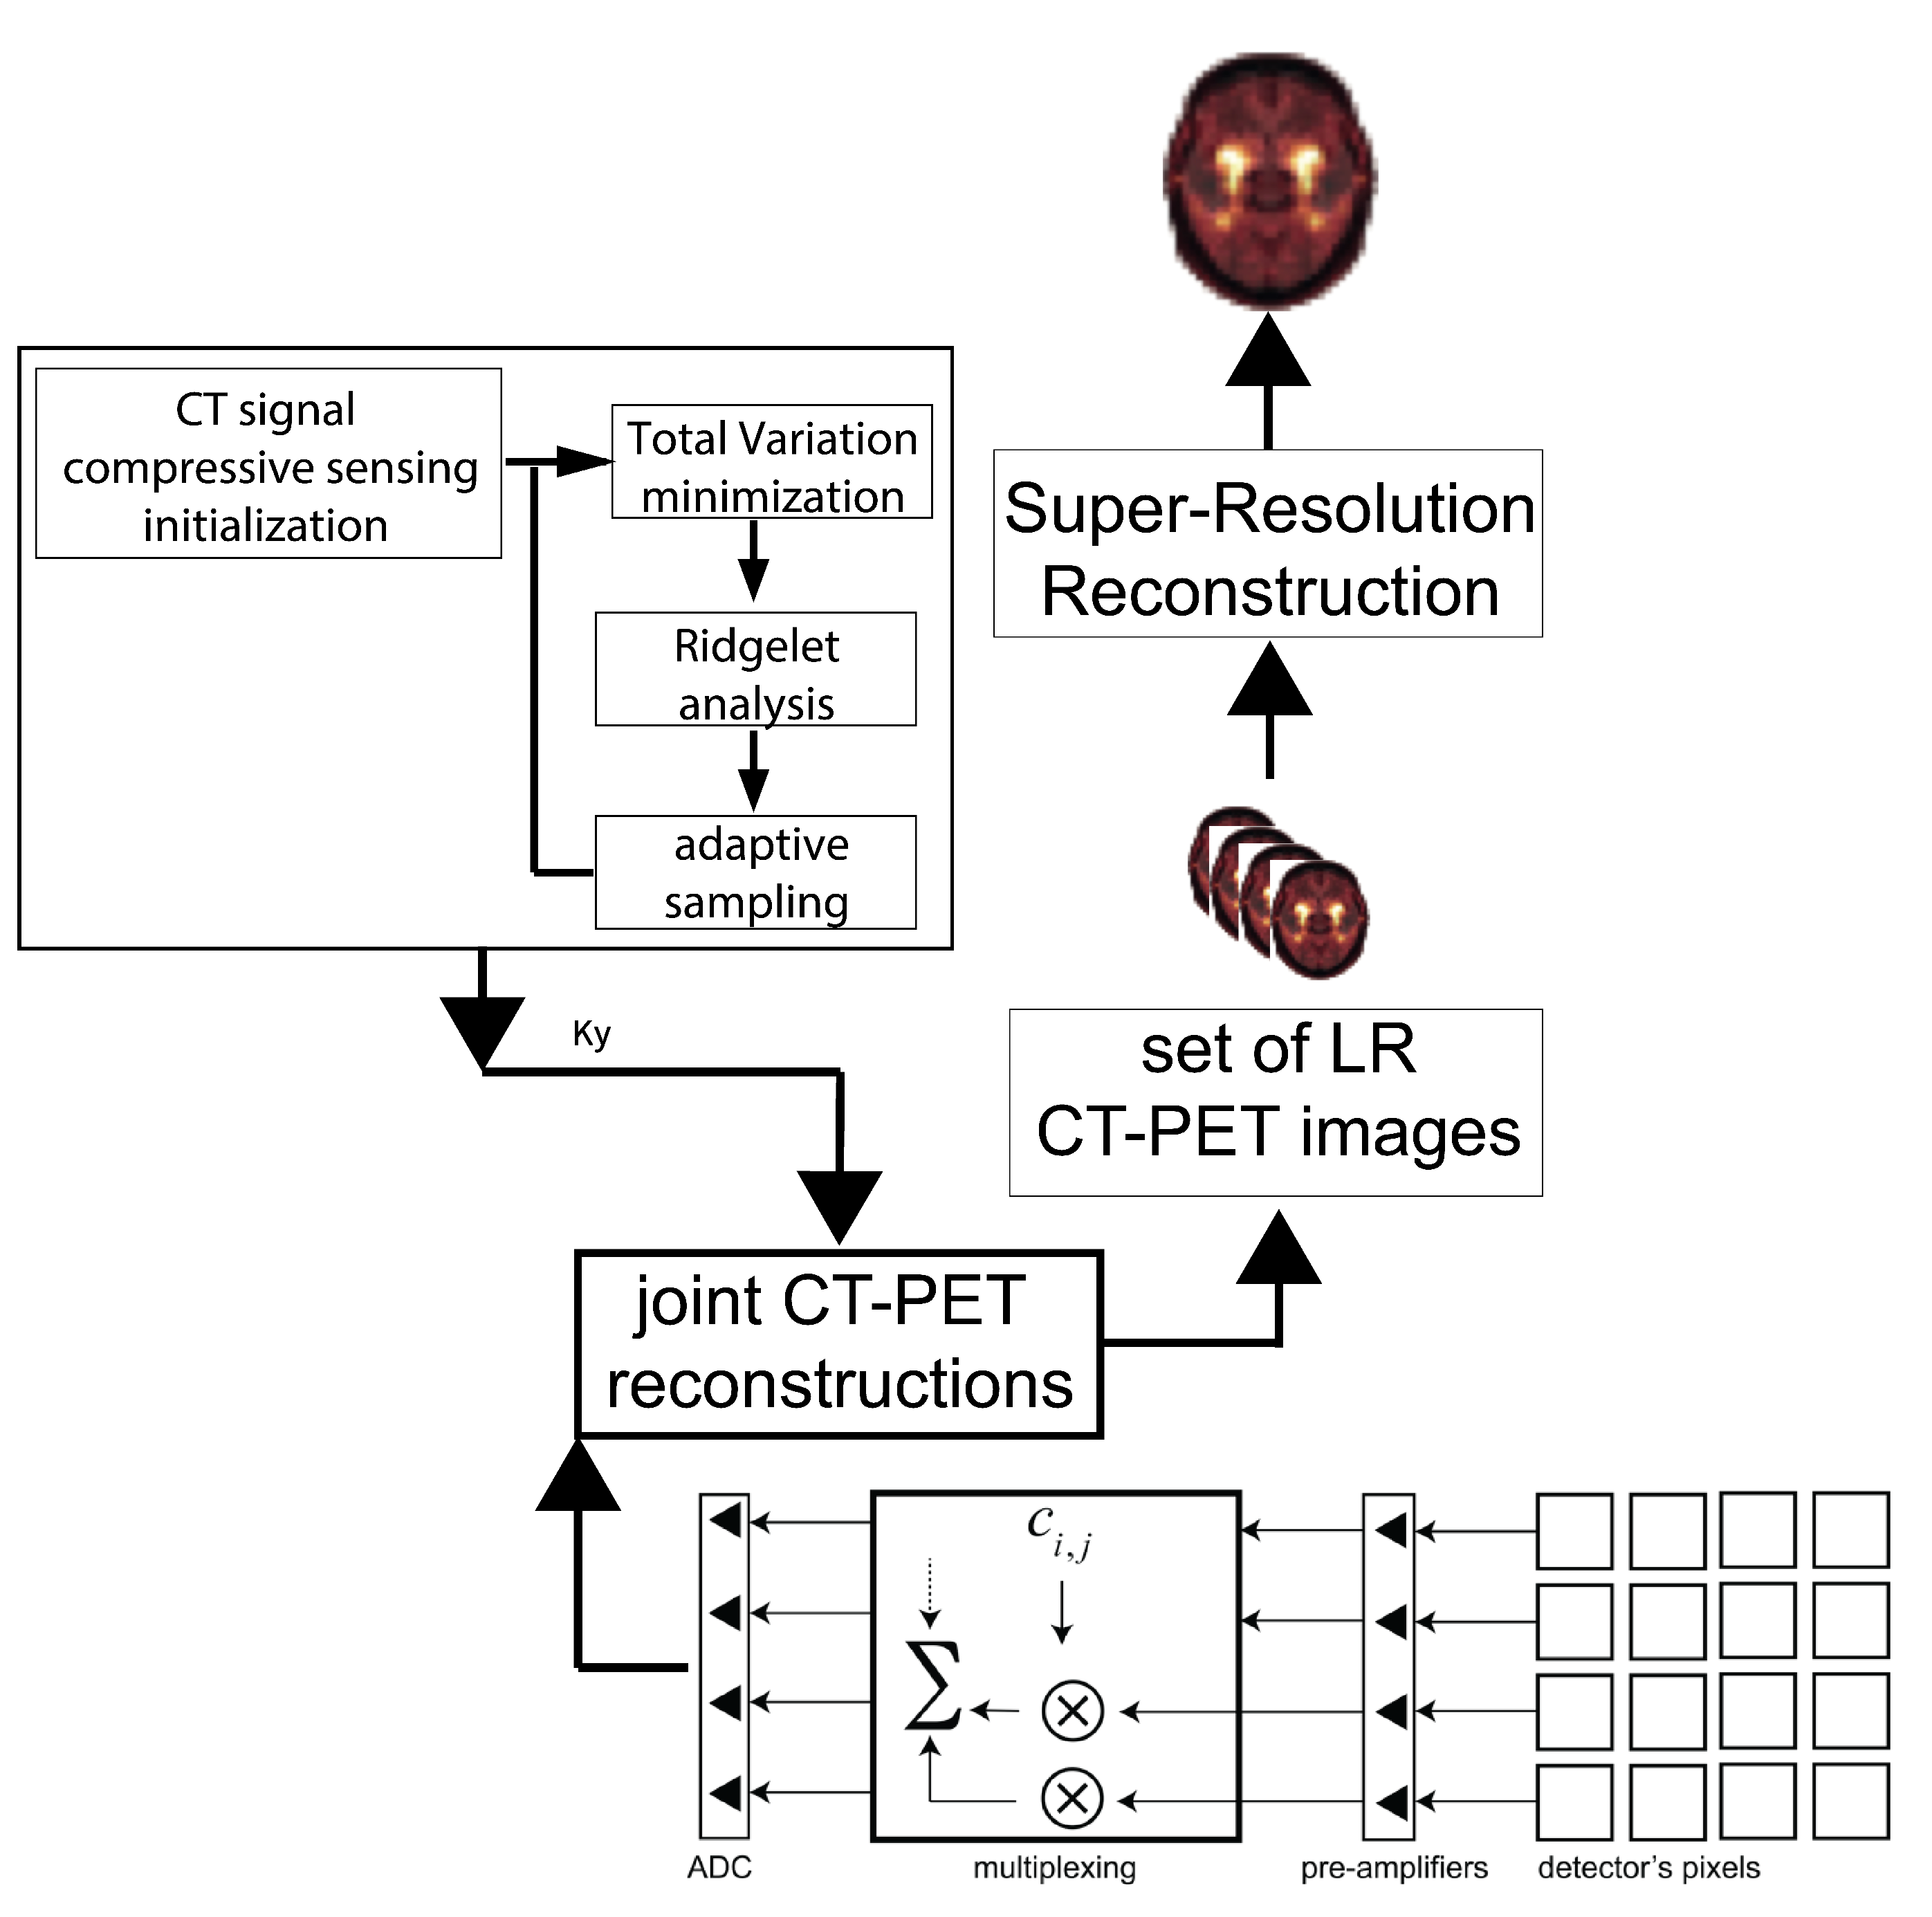
The regularisation parameters are employed to avoid using non-coherent CT and PET images’ features overlapping. The method proposed in this paper utilises joint sparsity, i.e., in CT’s and PET’s domains, see Figure 1.
3. Computed Tomography Imaging Speeding Up
Optimisation of Computed Tomography based on finding a balance between exposure times and image quality has considerably developed and provides for faster and more accurate algorithms. This issue is getting more attention due to its being important in increasing the risk of death caused by cancer [17,18,19]. The most effective way to protect from radiation is to omit redundant examinations steps. Nowadays, numerous researchers attempt to improve CT image quality by applying various techniques, such as Iterative Reconstruction and Model Based Iterative Reconstruction. Unfortunately, the issue of radiation doses still goes largely unaddressed. The author in [7] presents an adaptive acquisition model, which turns out to be proficient in reducing dosage levels. This procedure does not need any hardware modifications because it employs so-called two-step adaptive acquisition techniques [20,21]. The idea of this algorithm is given below. It starts with projecting the object using the lowest possible dosage levels. In this way, the CT image reconstruction algorithm initial guess is calculated. The next step is to determine image features’ delineation. In this step, the further line projections are incorporated sequentially. Finally, the method refines key image features location until the convergence is reached. The convergence criterion is to obtain sufficient image quality in the fewest possible projections. This algorithm takes advantage of using Ridgelets based model, which is useful in classifying image edges in the multiscale modelling analysis [22]. The adapted CT image reconstruction algorithm objective is to derive the solution from the adaptive Ridgelet approximation. In this work, the projection lines number are minimised while the angles are kept untouched. The Adaptive Tomography Acquisition (ATA) [23] algorithm tends to adaptably take the samples of the line projections associated with the object edges. At the start the image is not reconstructed and the algorithm tries to reconstruct it. The Ridgelet transform (RT) has constrained directional features. It only works for image lines singularities. The essence of RT is to convert line singularities into point singularities using the projection slice theorem performed on the Radon transform. The finite ridgelet transform (FRIT) consists of the two following operations: 1. Deriving the Discrete Radon Transform, 2. Calculating a wavelet transform. The Finite Radon transform (FRAT) is done in two stages: 1. Deriving the 2D Fast Fourier transform (FFT) of the image and (applying 1D inverse Fourier Transform (iFFT) on Radon projection 2. Applying 1D wavelet transform to its output. The ATA exploits the Ridgelet model. This method updating the Ridgelet coefficients tries to obtain the only line projections that are associated with edge singularities and determined by the level of multiscale image decomposition, see Figure 1.
4. Compressively Sensed CT/PET Signals
The shared objective of the main technique is to compress all the information coming from the submodalities. In this work, the scientist guarantees that PET’s data volume could be compressed [3]. Radioactive substances that produce positrons are being multiplexed as often as possible to diminish the readout channels’ numbers. Their output signals could be consolidated into a super-resolution PET image. This structure part goes for consolidating the super-resolution and compressive sensing in CT/PET hybrid scanners. The underlying detector turned out to have a sparse representation. Due to this feature, sparse-sense could be utilised for developing new multiplexing patterns. One key aspect of CS is generating relevant sensing matrices. Some various random procedures of generating random matrices satisfying the restricted isometry property may be applied. The method of formulating sensing matrices is a maximum likelihood framework. It has been proven [3] that the method of generating sensed matrices prompt to lower reconstruction error in a mean square sense than any other. The algorithm presented in this paper operates using a highly reduced number of channels leading to discretised domains of space and time, respectively. In this way, collecting PET input data are interpreted as compressively sensed PET signals. Every single readout could be interpreted as a linearly weighted sum of the photodetector pixels with weights expressed as (see Figure 1). The sensor number is reduced in accordance with 4:1 subsampling factors. Using MR-PET joint sparsity as well as its common product features, the MR data sets based motion model parameters; we may apply them to improve the PET image. Technically, the same super-resolution procedure is used, see Figure 2.
5. The Super-Resolution Algorithm vs. Image Registration Issues
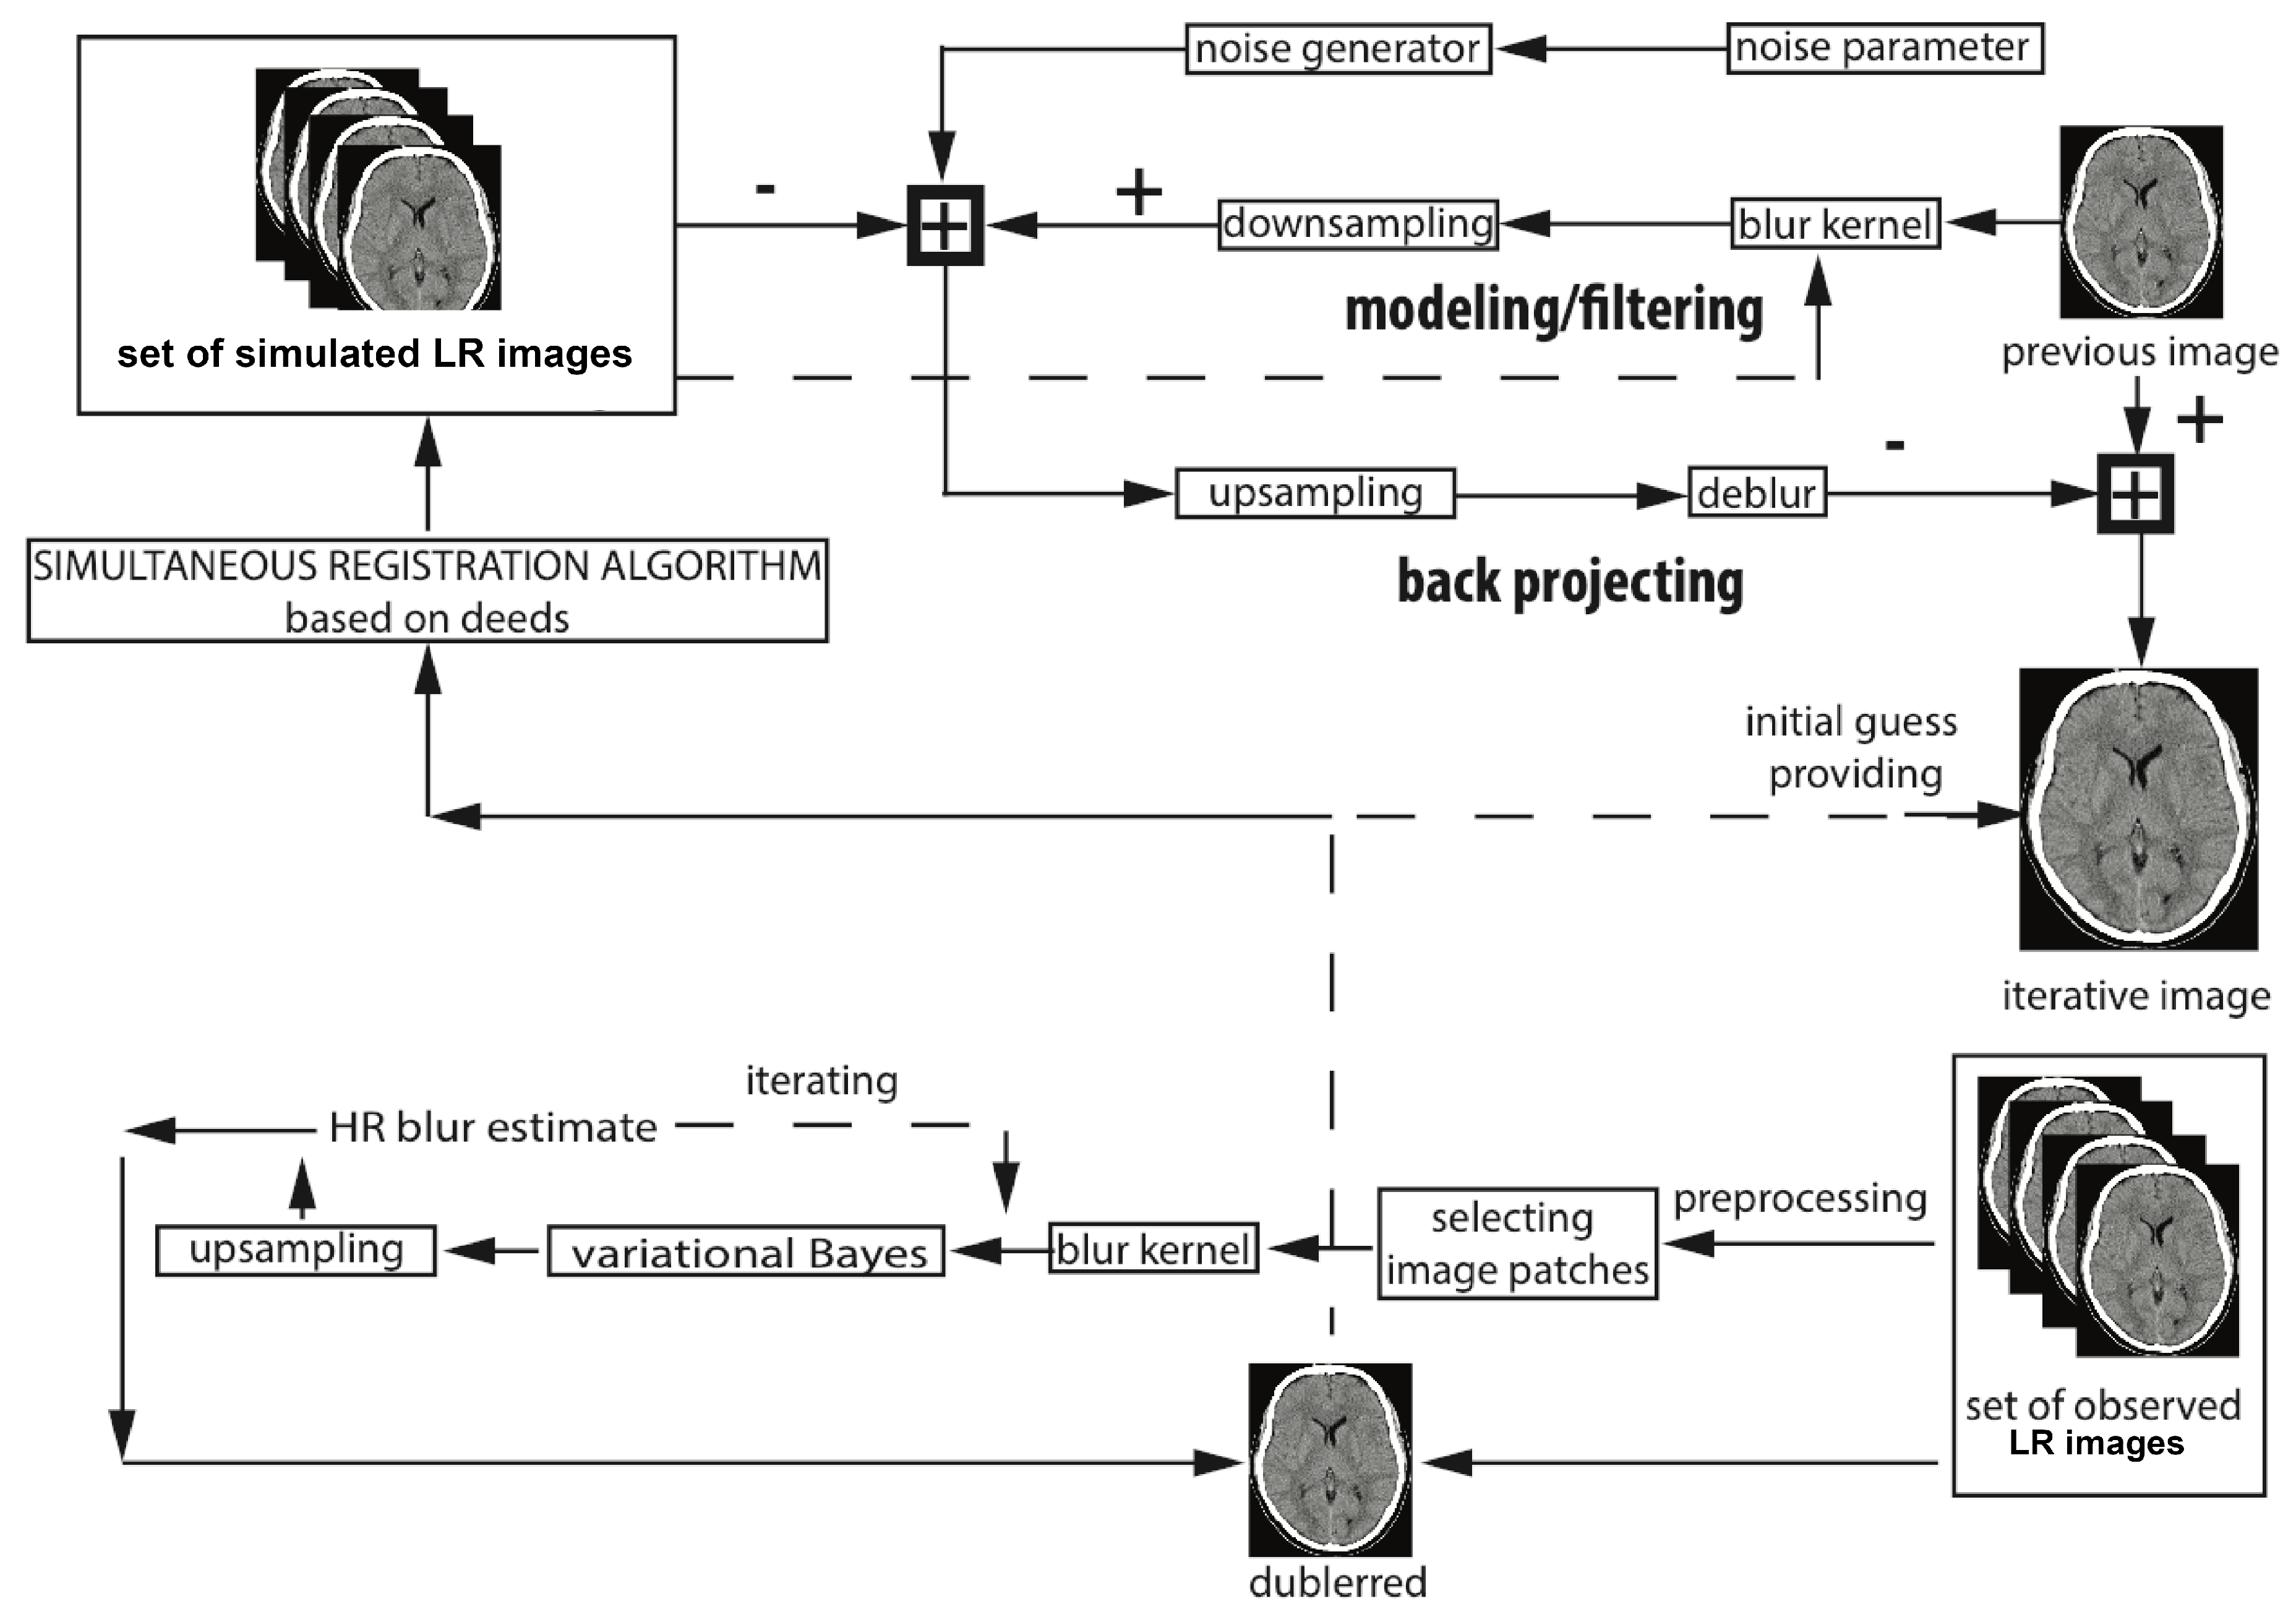
High accuracy and deformable image registration are key factors in the very challenging medical imaging field. The non-rigid registration algorithms prone to solving a highly non-convex optimisation problem with millions of degrees of freedom. Mathematically, in its domain, this issue is considered typically categorised to be a problem of continuous optimisation—being expressed as a non-convex cost function, which is inclined to get stuck at to local minimums, which leads to mImage Super-Resolution registration issues [7,8]. Moreover, to make matters worse, the area of medical imaging is associated with one of the most challenging application fields for motion artefacts reduction [16]. Moreover, the deformable motion estimation is already nested at the core of the presented iterative super-resolution algorithm. Furthermore, the technique takes into account the blur kernel and noise estimate, see Figure 2. The application of this algorithm provides much lower registration errors while compared to the other procedures even if large motion trajectory distortions occur. The goal of the algorithm is to minimise the cost function consisting of the High-Resolution (HR) input image , deformable image registration parameters , noise level as well blur kernel B [16]. The algorithm starts with taking one image from a set of LR observations as its reference input. The image registration, which is presented in this paper, is performed on a whole set of CT as well as PET low-resolution observations:
Note that the represents the simulated reference initial guess related to n-th set of compressively sensed CT/PET images, is the -th acquired LR image with regard to degradation parameters, is HR estimate, ∇ is the gradient operator, is the n-th HR image estimate, and g denote the down-sampling, blur kernel, motion parameters, additional degradation operator individually. To allow a gradient optimisation to be doable, L1 norms are supposed to be replaced with their differentiable approximations.
Input: set of Low-resolution input CT/PET.
- high-resolution estimate.
- repeat until convergence
- Estimate noise parameters
- Calculate deformable image registration parameters and realign an image grid using them
- Estimate blur kernel operator
- Improve the High-Resolution estimate
- Repeat steps a-d until convergence, see Figure 2
Output: high-resolution CT/PET image.
The algorithm minimises the cost function consisting of the High-Resolution CT/PET input image GH, motion vectors fwig, noise level qi as well blur kernel B. The flowchart starts with considering one image from a set of Low-Resolution observations as its reference input.
6. Evaluation
The proposed algorithm outputs were compared with four state-of-the-art algorithms: Non-Rigid Multi-Modal 3D Medical Image Registration Based on Foveated Modality Independent Neighbourhood Descriptor, Enhanced Deep Residual Networks for Single Image Super-Resolution, Residual dense network for image super-resolution, and Image super-resolution using very deep residual channel attention networks. L1-loss function has been exploited to train the networks of the deep residual nets. Neural net depth is of key element in neural network architectures, but deeper networks are not easy to learn. The residual learning framework simplifies the learning of these kinds of nets, and enables them to be significantly deeper providing enhanced performance in both visual and non-visual tasks. These residual nets are much deeper than their plain counterparts, yet they need a similar number of weighting parameters. To ensure clinical usability of these algorithms, the author has run the networks and extended them to training based on imperfect target images derived from a higher-resolution clinical scanner, thereby utilising the SR framework to define a mapping from an LR scanner’s image domain to an HR scanner’s image domain. The goal of the trials was to evaluate the performance of the compressively sensed super-resolution image reconstruction compared to the native (the unmodified prototype) and naive (the ones that behave in a very simple way) algorithms. The efficiency of the motion estimation (see Table 11), super-resolution (see Tables 4, 7, 9 and the usage of the compressed sensing technology (see Tables 1–3, 5, 8 and 10) is evaluated in terms of image quality and PSNR values. In all the tables, the worst and the best results have been highlighted. The separate aim of the study was to emphasise the reliability of results obtained by processing realistic digital phantoms. Analysing the relevancy of the models such as XCAT phantom considers both the flexibility of numerical phantoms and the truthful nature of voxelized phantoms. The term ‘XCAT phantom’ refers to the 4D extended cardiac-torso phantom for multimodality imaging research [24].
7. Results
In the experimental studies, several CT, PET, and CT/PET in vivo and phantom images have been processed using different reconstruction algorithms. The term ’phantom’ refers to a specially designed object that is scanned or imaged in the field of medical modalities to evaluate, analyse, and tune the performance of various imaging devices.
The employed realistic phantom produces slices/images exploiting some breathing surface illustrating possible inhalation and exhalation-based disfigurements. Moreover, these models can cover any arbitrary motion tumours’ motion trajectories. The internal organs’ motion parameters are imposed by quadratic polynomials. The second parts of the experimental studies were conducted on noisy, blurred, motion artefacts affected Shepp–Logan and Zubal phantoms. In the experiment, various number of projection lines and Fourier coefficient were tested. The in-plane motion performed on the phantoms during the acquisition process was a simulated affine motion model. Additionally, some elements of images have also been warped according to random values defined inside. Additionally, to illustrate possible internal organ tissue blur, their motion artefacts were modelled using simulated locally affine transformations. Then, the low-resolution images have been blurred using a Gaussian blur kernel. In comparison, different reconstruction methods under different circumstances were analysed. Figure 3, Figure 4, Figure 5, Figure 6, Figure 7, Figure 8 and Figure 9 clearly proved the superiority of the super-resolution image reconstruction. The fusion of the Adaptive Tomography Acquisition with SRR allowed improved image quality while maintaining reasonable acquisition times. It is worth underlining that applying Adaptive Tomography Acquisition (ATA) leads to data acquisition acceleration when compared to the different methods. To analyse the presented super-resolution algorithm, various types of images were examined. The first sets of images were standard test images. The high-resolution images have been artificially degraded by predetermined factors. In this way, the resulting LR set of images contains local geometric deformations. Later, framed images, prepared this way, were blurred, noised, and decimated. All the trials were performed in MathWorks Matlab (Natick, MA, USA). The expectations related to the method’s performance are high, mostly due to its potential advantages, i.e., obtaining high contrast while keeping a great resolution. This work deals with combining CT/PET with compressed sensing and super-resolution. It can be clearly seen that the obtained improvements have led to much better sharpness, edge interpretations, and contrast. The compressively sensed Super-Resolution images have achieved the PSNR. The statistical studies were conducted using a t-student test to verify the hypothesis that there was no significant difference in ratings for image quality between super-resolution using sparse input and fully sampled ground truth images. The proposed method’s output images that had been chosen more often turned out to have significantly higher image quality metric values (assessed and confirmed by a radiologist), and better delineation of anatomic structures’ details than the images obtained using competitive image enhancement algorithms. The disparities in PSNRs were also assessed utilising an exact Bowker symmetry test.
The accomplishments of motion correction were estimated by calculating the difference between images with motion and the referencing images (without a motion distortion added) for each subject. The consequence of shifts between data obtained with and without artificially added motion was also estimated using paired t-tests. All the conducted statistical tests exposed that the improvement is statistically significant. It is clearly detailed (see Table 1, Table 2, Table 3, Table 4, Table 5, Table 6, Table 7, Table 8, Table 9 and Table 10) that the compression ratios highly affect the PSNR values. Note that the motion correction algorithm affected the achieved metrics’ values. The algorithm has been tested with the use of CT/PET output data sets. Thus, two unique sets were obtained. The first with all the channels active (as the reference) and one with eight equidistant detectors shut down (subsampled, 12% of the channels have been removed from the datasets). The subsampled sinogram has been divided into two unique segments, each with sparse representation in their orthogonal domains. An iterative procedure was then used to reconstruct the PS sinogram using a hybrid algorithm utilising the conjugate gradient method solving the set of equations and blocked relaxations. In addition, the TV (total variation) is minimised for the first component to turn it into a more advantageous piecewise smooth model. Finally, the two parts were included to accomplish the sinogram, which was utilised to facet the native PS sinogram. This methodology can conceivably be utilised to create PET scans with precise quantitation while decreasing the number of readout channels. The examination has been directed for two unique kinds of information. The objective of the preliminaries was to assess the performance of the compressively sensed SR image reconstruction algorithm in direct battle against the native and naïve algorithms. The further goal was to assess MR sampling scheme worthiness. In this experiment in vivo, as well as phantom, inputs have been analysed. Figure 3, Figure 4, Figure 5, Figure 6, Figure 7, Figure 8 and Figure 9 expose obtained simulation results. The highest PSNR and the lowest MAE (Mean Absolute Error) values have confirmed the robustness of the presented algorithm, see Table 1, Table 2, Table 3, Table 4, Table 6, Table 7 and Table 9. In turn, Table 5, Table 8 and Table 10 have shown that, using only 50 percent of the samples, pretty high PSNR values have been achieved. For all the registration algorithms listed in Table 11, the statistical analysis was evaluated using the mean and the standard deviation (std). The Target to Registration Errors (TRE) values and the p-values for the t-test with the significance level = 0.05 have been calculated, see Table 11. It has been shown that all the p-values are less than 0.002, which means that there is a significant difference between the globally optimal deformable registration method and its competitors.
8. Discussion
In this paper, the algorithm for improving CT/PET hybrid scanner’s image resolution keeping acquisition time at as low a level as possible is presented. The obtained results show an improved spatial resolution and quality, see Figure 3, Figure 4, Figure 5, Figure 6, Figure 7, Figure 8 and Figure 9. The procedure applied to lesions that are considered to be potentially malignant or pre-malignant unveil a higher ability to detect them due to the improved resolution and readability. Designing and developing of CT/PET scanners is still an open issue and has been recognised as the grand challenge of the next few years. In this work, it has been proven that the proposed super-resolution algorithm based on modifications made to a well-known Iterative Back Projection scheme produces highly accurate results. The extensive studies confirmed that the algorithm might be applied even if very challenging medical modalities are the subject of interest. This paper also shows the successful application of a super-resolution algorithm to enhance the resolution of CT as well as PET images. The technology employs several state-of-the-art methodologies, such as a discrete dense displacement sampling, a Bayesian probabilistic model shaping the blur kernel, image priors as well as noise estimates. The constructed solution is nearly insensitive to in-plane motion artefacts being able to successfully overcome noise and blurs kernel odds. Thus, it is clearly shown that the developed procedure can provide enhanced and sharper images while keeping radiation levels at the lowest possible levels. It is clearly detailed (see Table 1, Table 2, Table 3, Table 4, Table 5, Table 6, Table 7, Table 8, Table 9 and Table 10) that the compression ratios highly affect the PSNR and Mean Absolute Error (MAE) values. Moreover, the presented methodology argued its value in making artefacts caused by undersampled data much lower, even under the influence of motion blur. This paper reveals a very promising application of super-resolution of highly sensitively compressed CT/PET signals.
It is clearly exposed (see Table 1, Table 2, Table 3, Table 4, Table 5, Table 6, Table 7, Table 8, Table 9 and Table 10) that the Compressed Sensing quality ratios highly affect the PSNR and MAE values. The average PSNR is calculated between the numerous methods outputs and the ground truth images. Each simulation scenario was repeated 100 times in order to generate statistically meaningful quality measures. Note that satisfying results were obtained at a compression ratio equal to 50%, i.e., further decreasing the total number of input samples improves the PSNR slightly (see Table 5, Table 8, Table 10 and Figure 3, Figure 4, Figure 5, Figure 6, Figure 7, Figure 8 and Figure 9). Data from preliminary trials can also be valuable in providing background information useful in reducing examinations times. However, although the motion estimation algorithm can significantly eliminate diagnostic images’ artefacts, which maximise the chance of a correct diagnosis. Qualitative assessment of the neuroimages and chest scans of 10 different patients showed the advantages of the applied algorithm. In the trials, the PET and the CT data of 10 oncological patients were simultaneously obtained on an integrated CT/PET scanner. The phantom studies were conducted using 20 simulated patient brain PET data volumes with corresponding CT scans. For quantitative measurement, the PSNR of each reconstruction procedure was also calculated. The (18) F]fludeoxyglucose ([(18) F]FDG) as a tracer was employed. In this experiment in vivo, as well as phantom, inputs have been analysed. Fully sampled CT/PET raw data were often used as the ground truth reference, and were either obtained, or already were available in the case of CT/PET reconstruction procedures.
Funding
This research received no external funding.
Conflicts of Interest
The author declares no conflict of interest. In the past five years, I have not received reimbursements, fees, funding, or any salaries from any organisation that may in any way gain or lose financially from the publication of this manuscript. I do not hold any stocks or shares in an organisation that may in any way gain or lose financially from the publication of this manuscript. I do not hold and I am not currently applying for any patents relating to the content of the manuscript. I do not have any other financial competing interests.
References
- Kinahan, P.E.; Townsend, D.W.; Beyer, T.; Sashin, D. Attenuation correction for a combined 3D PET/CT scanner. Med. Phys. 1998, 25, 2046–2053. [Google Scholar] [CrossRef] [PubMed]
- Beyer, T.; Townsend, D.W.; Brun, T.; Kinahan, P.E.; Charron, M.; Roddy, R.; Jerin, J.; Young, J.; Byars, L.; Nutt, R. A Combined PET/CT scanner for clinical oncology. J. Nucl. Med. 2000, 41, 1369–1379. [Google Scholar] [PubMed]
- Townsend, D.W.; Wensveen, M.; Byars, L.G.; Geissbuhler, A.; Tochon-Danguy, H.J.; Christin, A.; Defrise, M.; Bailey, D.L.; Grootoonk, S.; Donath, A.; et al. A rotating PET scanner using BGO block detectors: Design, performance and applications. J. Nucl. Med. 1993, 34, 1367–1376. [Google Scholar] [PubMed]
- Knoll, F.; Koesters, T.; Otazo, R.; Block, T.; Feng, L.; Vunckx, K.; Faul, D.; Nuyts, J.; Boada, F.; Sodickson, D.K. Joint reconstruction of simulwtaneously acquired MR-PET data with multi sensor compressed sensing based on a joint sparsity constraint. Ejnmmi Phys. 2014, 1, A26. [Google Scholar] [CrossRef] [PubMed] [Green Version]
- Antoch, G.; Bockisch, A. Combined PET/MRI: A new dimension in whole-body oncology imaging. EJNMI 2008, 36, 113–120. [Google Scholar] [CrossRef] [PubMed]
- Fueger, B.J.; Czernin, J.; Hildebrandt, I.; Tran, C.; Halpern, B.S.; Stout, D.; Phelps, M.E.; Weber, W.A. Impact of animal handling on the results of 18F-FDG PET studies in mice. J. Nucl. Med. 2006, 47, 999–1006. [Google Scholar] [PubMed]
- Malczewski, K. Super-Resolution with compressively sensed MR/PET signals at its input. Inform. Med. Unlocked 2020, 18, 1–20. [Google Scholar] [CrossRef]
- Malczewski, K. Rapid Diffusion Weighted Imaging with Enhanced Resolution. Appl. Magn. Reson. 2020, 51, 221–239. [Google Scholar] [CrossRef]
- McGibney, G.; Smith, M.R.; Nichols, S.T.; Crawley, A. Quantitative evaluation of several partial Fourier reconstruction algorithms used in MRI. MRM 1993, 30, 51–59. [Google Scholar] [CrossRef] [PubMed]
- Cheryauka, A.B.; Lee, J.N.; Samsonov, A.A.; Defrise, M.; Gullberg, G.T. MRI diffusion tensor reconstruction with PROPELLER data acquisition. Magn. Reson. Imaging 2004, 22, 39–148. [Google Scholar] [CrossRef]
- Cuppen, J.; van Est, A. Reducing MR imaging time by one-sided reconstruction. MRI 1987, 5, 526–527. [Google Scholar] [CrossRef]
- Griswold, M.A.; Jakob, P.M.; Heidemann, R.M.; Nittka, M.; Jellus, V.; Wang, J.; Kiefer, B.; Haase, A. Generalized autocalibrating partially parallel acquisitions (GRAPPA). Magn. Reson. Med. 2002, 47, 1202–1210. [Google Scholar] [CrossRef] [PubMed] [Green Version]
- Lim, B.; Son, S.; Kim, H.; Nah, S.; Mu Lee, K. Enhanced deep residual networks for single image super-resolution. In Proceedings of the 2017 IEEE Conference on Computer Vision and Pattern Recognition Workshops, CVPR Workshops 2017, Honolulu, HI, USA, 21–26 July 2017; pp. 1132–1140. [Google Scholar]
- Zhang, Y.; Li, K.; Li, K.; Wang, L.; Zhong, B.; Fu, Y. Image super-resolution using very deep residual channel attention networks. In Proceedings of the 15th European Conference, Munich, Germany, 8–14 September 2018; pp. 294–310. [Google Scholar]
- Zhang, Y.; Tian, Y.; Kong, Y.; Zhong, B.; Fu, Y. Residual dense network for image super-resolution. In Proceedings of the 2018 IEEE Conference on Computer Vision and Pattern Recognition, CVPR 2018, Salt Lake City, UT, USA, 18–22 June 2018; pp. 2472–2481. [Google Scholar]
- Heinrich, M.P.; Jenkinson, M.; Brady, M.; Schnabel, J. Globally optimal deformable registration on a minimum spanning tree using dense displacement sampling. In Proceedings of the Medical Image Computing and Computer-Assisted Intervention—MICCAI 2012, Nice, France, 1–5 October 2012; pp. 115–122. [Google Scholar]
- Brenner, D.; Ellison, C.; Hall, E.; Berdon, W. Estimatedrisks of radiation-induced fatal cancer from Pediatric CT. Am. J. Roentgenol. 2001, 176, 289–296. [Google Scholar] [CrossRef] [Green Version]
- Nelson, R. Thousands of New Cancers Predicted Due to Increased Use of CT. Available online: https://www.medscape.com/viewarticle/714025 (accessed on 20 April 2020).
- Shuryak, I.; Sachs, R.; Brenner, D. Cancer Risks after Radiation Exposure in Middle Age. J. Natl. Cancer Inst. 2010, 102, 1606–1609. [Google Scholar] [CrossRef] [PubMed]
- Kolditz, D.; Kyriakou, Y.; Kalender, W. Volume-of interest (VOI) imaging in C-arm flat-detector CT for high image quality at reduced dose. Med. Phys. 2010, 37, 2719–2730. [Google Scholar] [CrossRef] [PubMed]
- Moore, J.; Barret, H.; Furenlid, L. Adaptive CT for highresolution, controlled-dose, region-of-interest imaging. IEEE Nucl. Sci. Symp. Conf. 2009, 2009, 4154–4157. [Google Scholar]
- Candes, E. Ridgelets: Theory and Applications. Ph.D. Thesis, Stanford University, Stanford, CA, USA, 1998. [Google Scholar]
- Barkan, O.; Weill, J.; Averbuch, A.; Dekel, S. Adaptive Compressed Tomography Sensing. In Proceedings of the IEEE Conference on Computer Vision and Pattern Recognition 2013, Washington, DC, USA, 23–28 June 2013; pp. 2195–2202. [Google Scholar]
- Panta, R.K.; Segars, P.; Yin, F.F.; Cai, J. Establishing a framework to implement 4D XCAT Phantom for 4D radiotherapy research. J. Can. Res. Ther. 2012, 8, 565–570. [Google Scholar]
- Yang, F.; Ding, M.; Zhang, X. Non-Rigid Multi-Modal 3D Medical Image Registration Based on Foveated Modality Independent Neighborhood Descriptor. Sensors 2019, 19, 4675. [Google Scholar] [CrossRef] [PubMed] [Green Version]
Figure 1.
The CT/PET inputs utilising their joint sparsity.

Figure 2.
The proposed CT/PET image enhancement algorithm.

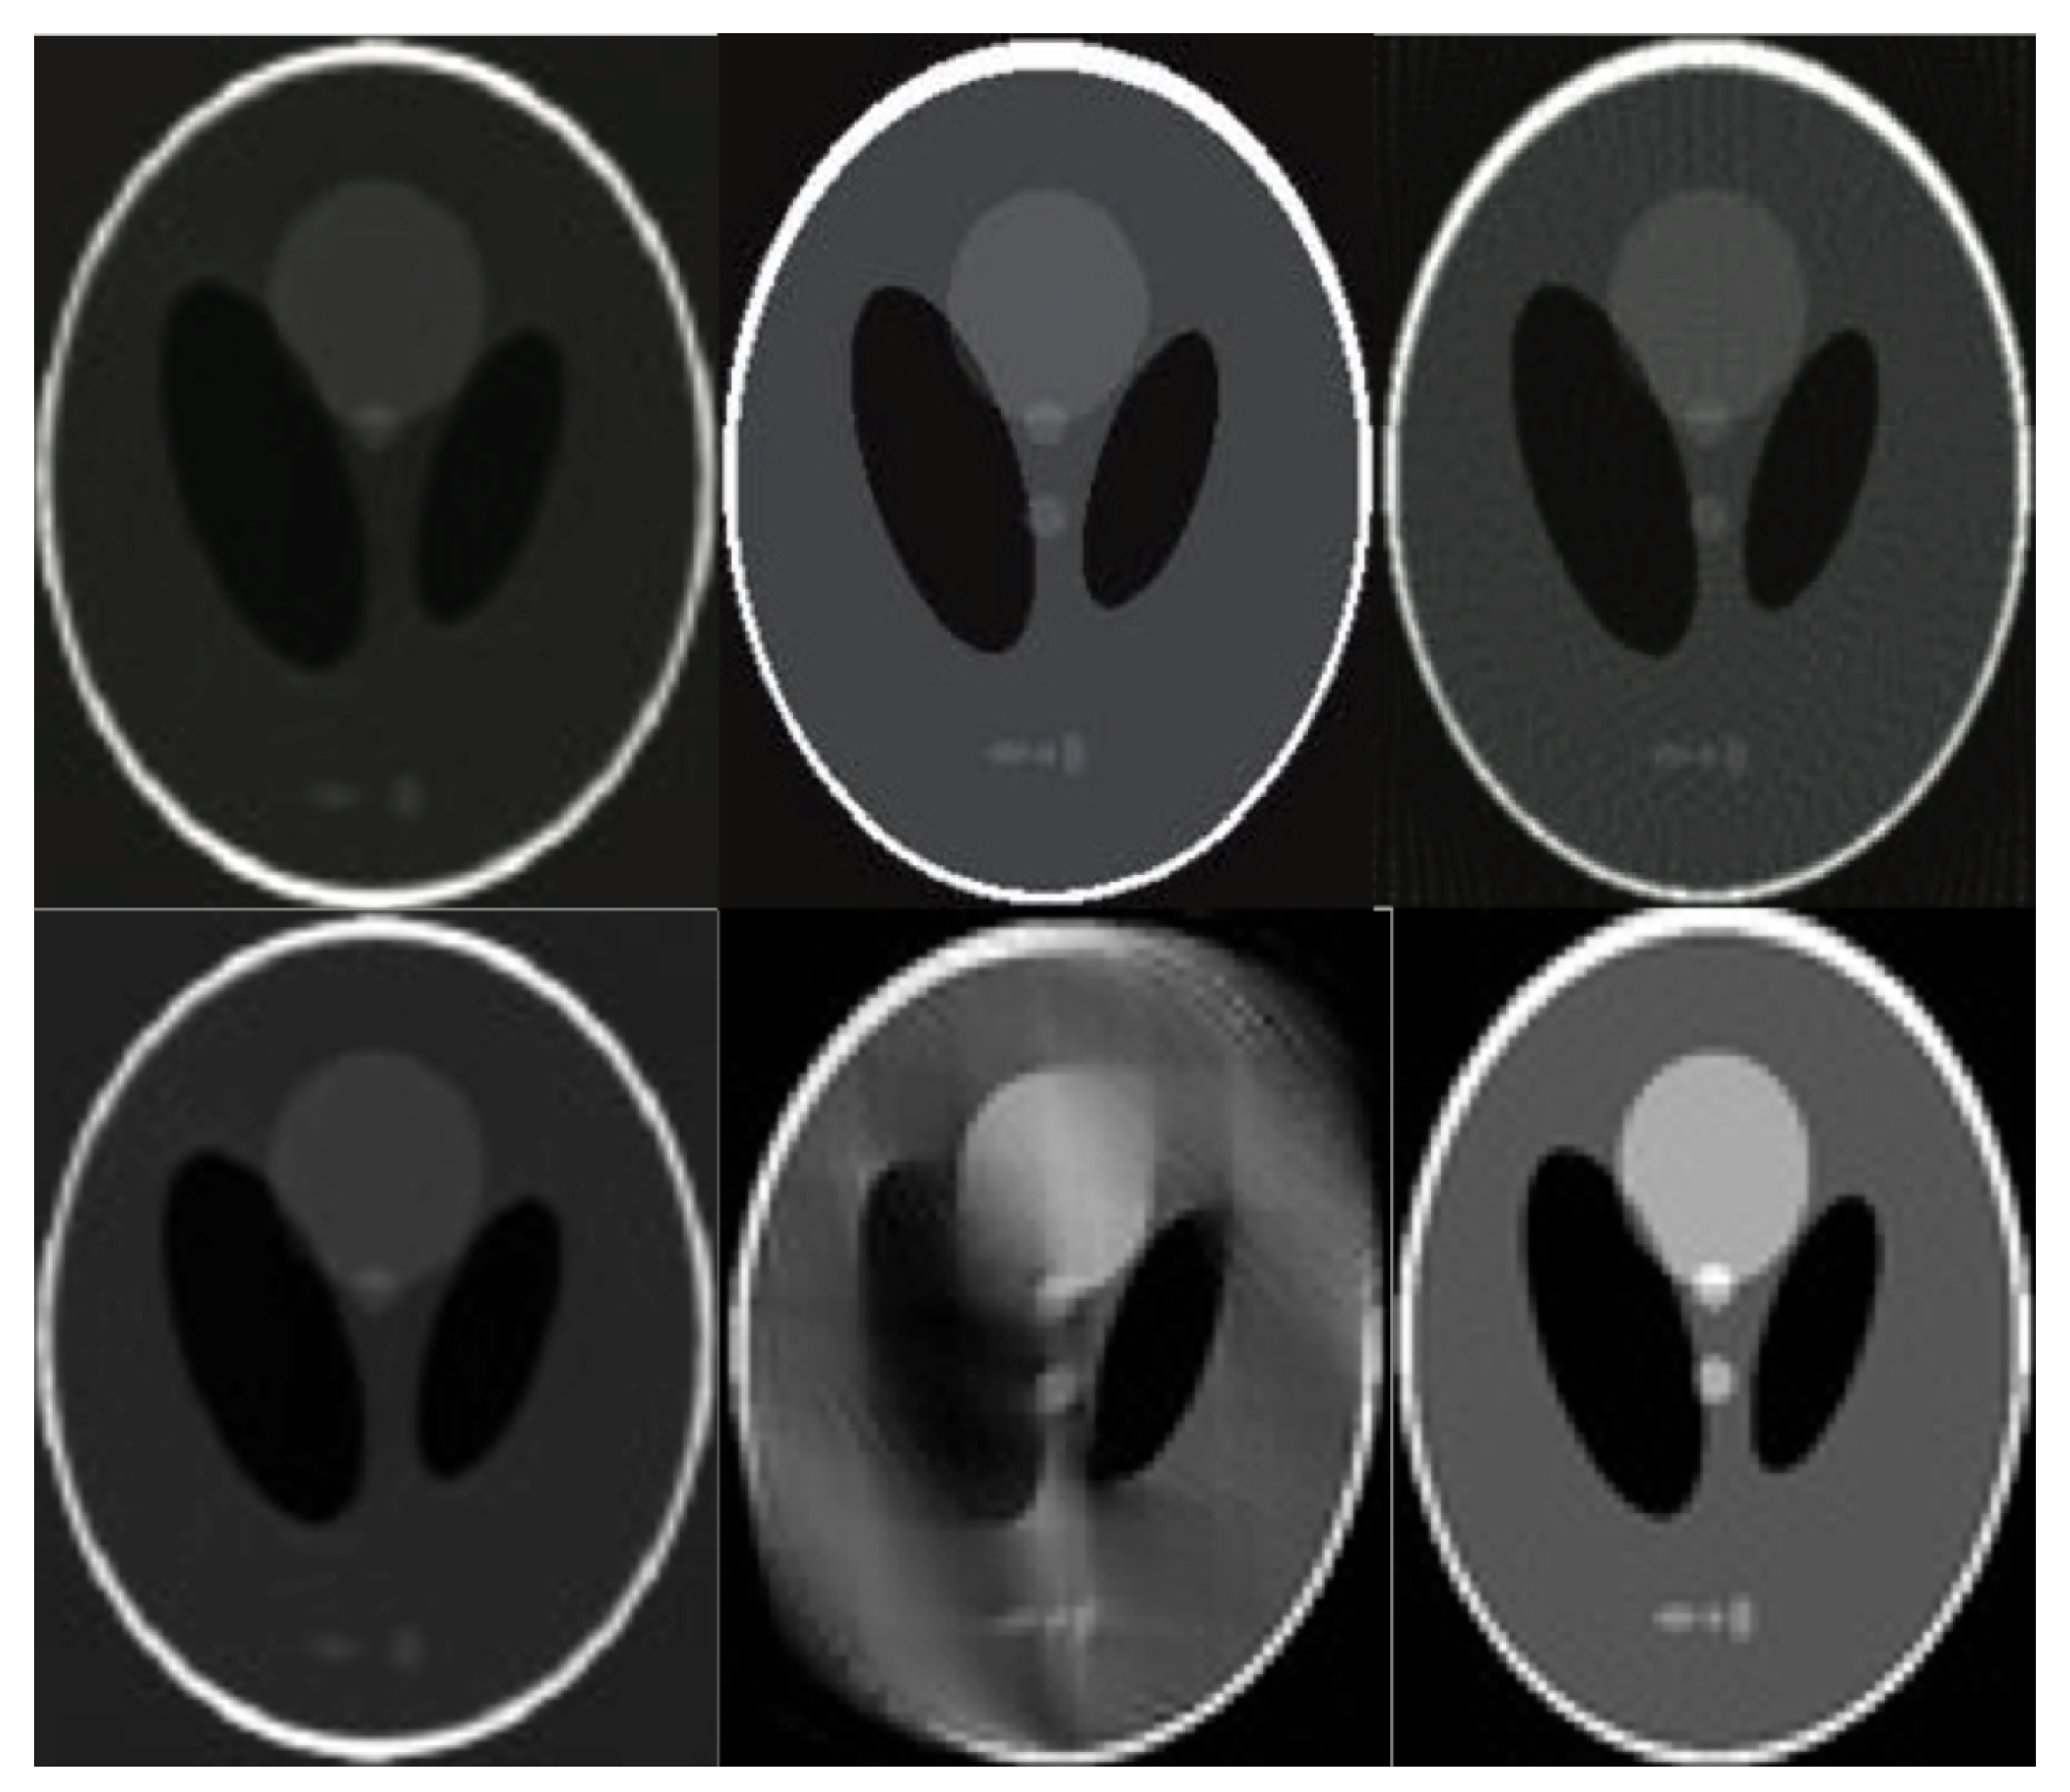
Figure 3.
The Shepp–Logan phantom images based experiment results for the cases exposed in Table 1 rows numbers: 1, 2, 3. The bottom row refers to: Table 1 rows numbers: 4, 5, 6.

Figure 4.
The Zubal phantom images based experiment results for the cases exposed in Table 2 rows numbers: 1, 2, 3. The bottom row refers to: Table 2 rows numbers: 4, 5, 6.

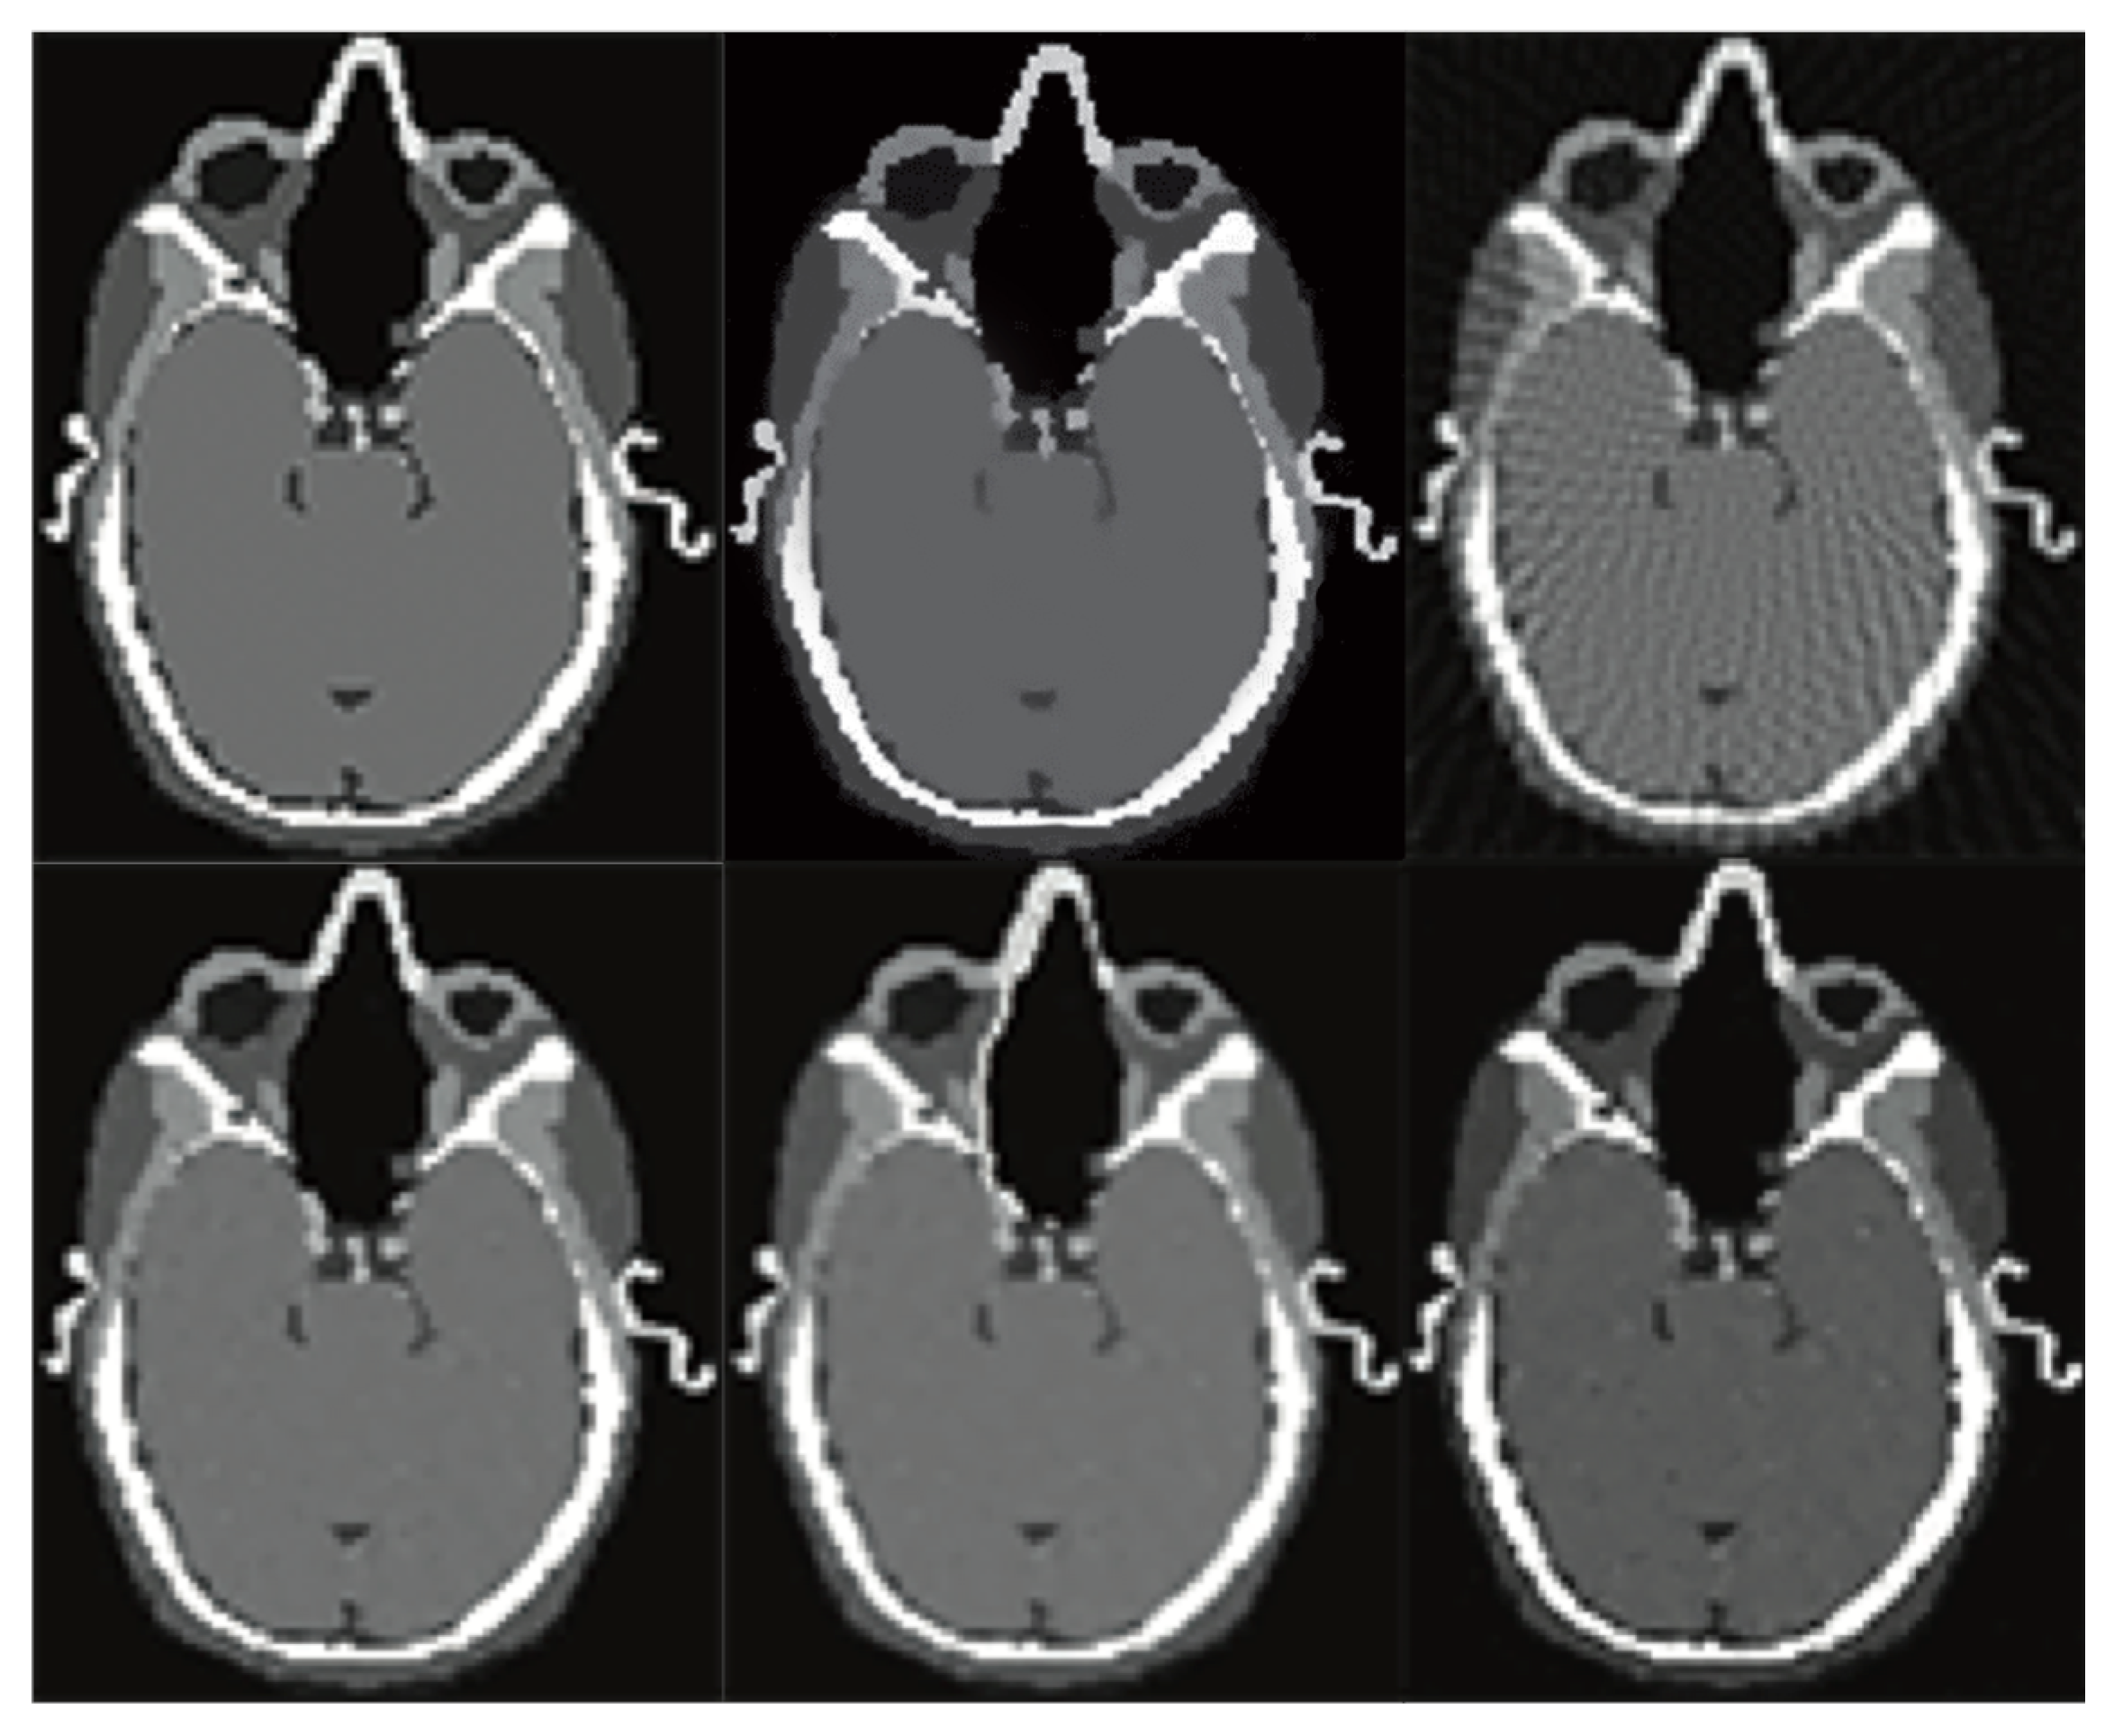
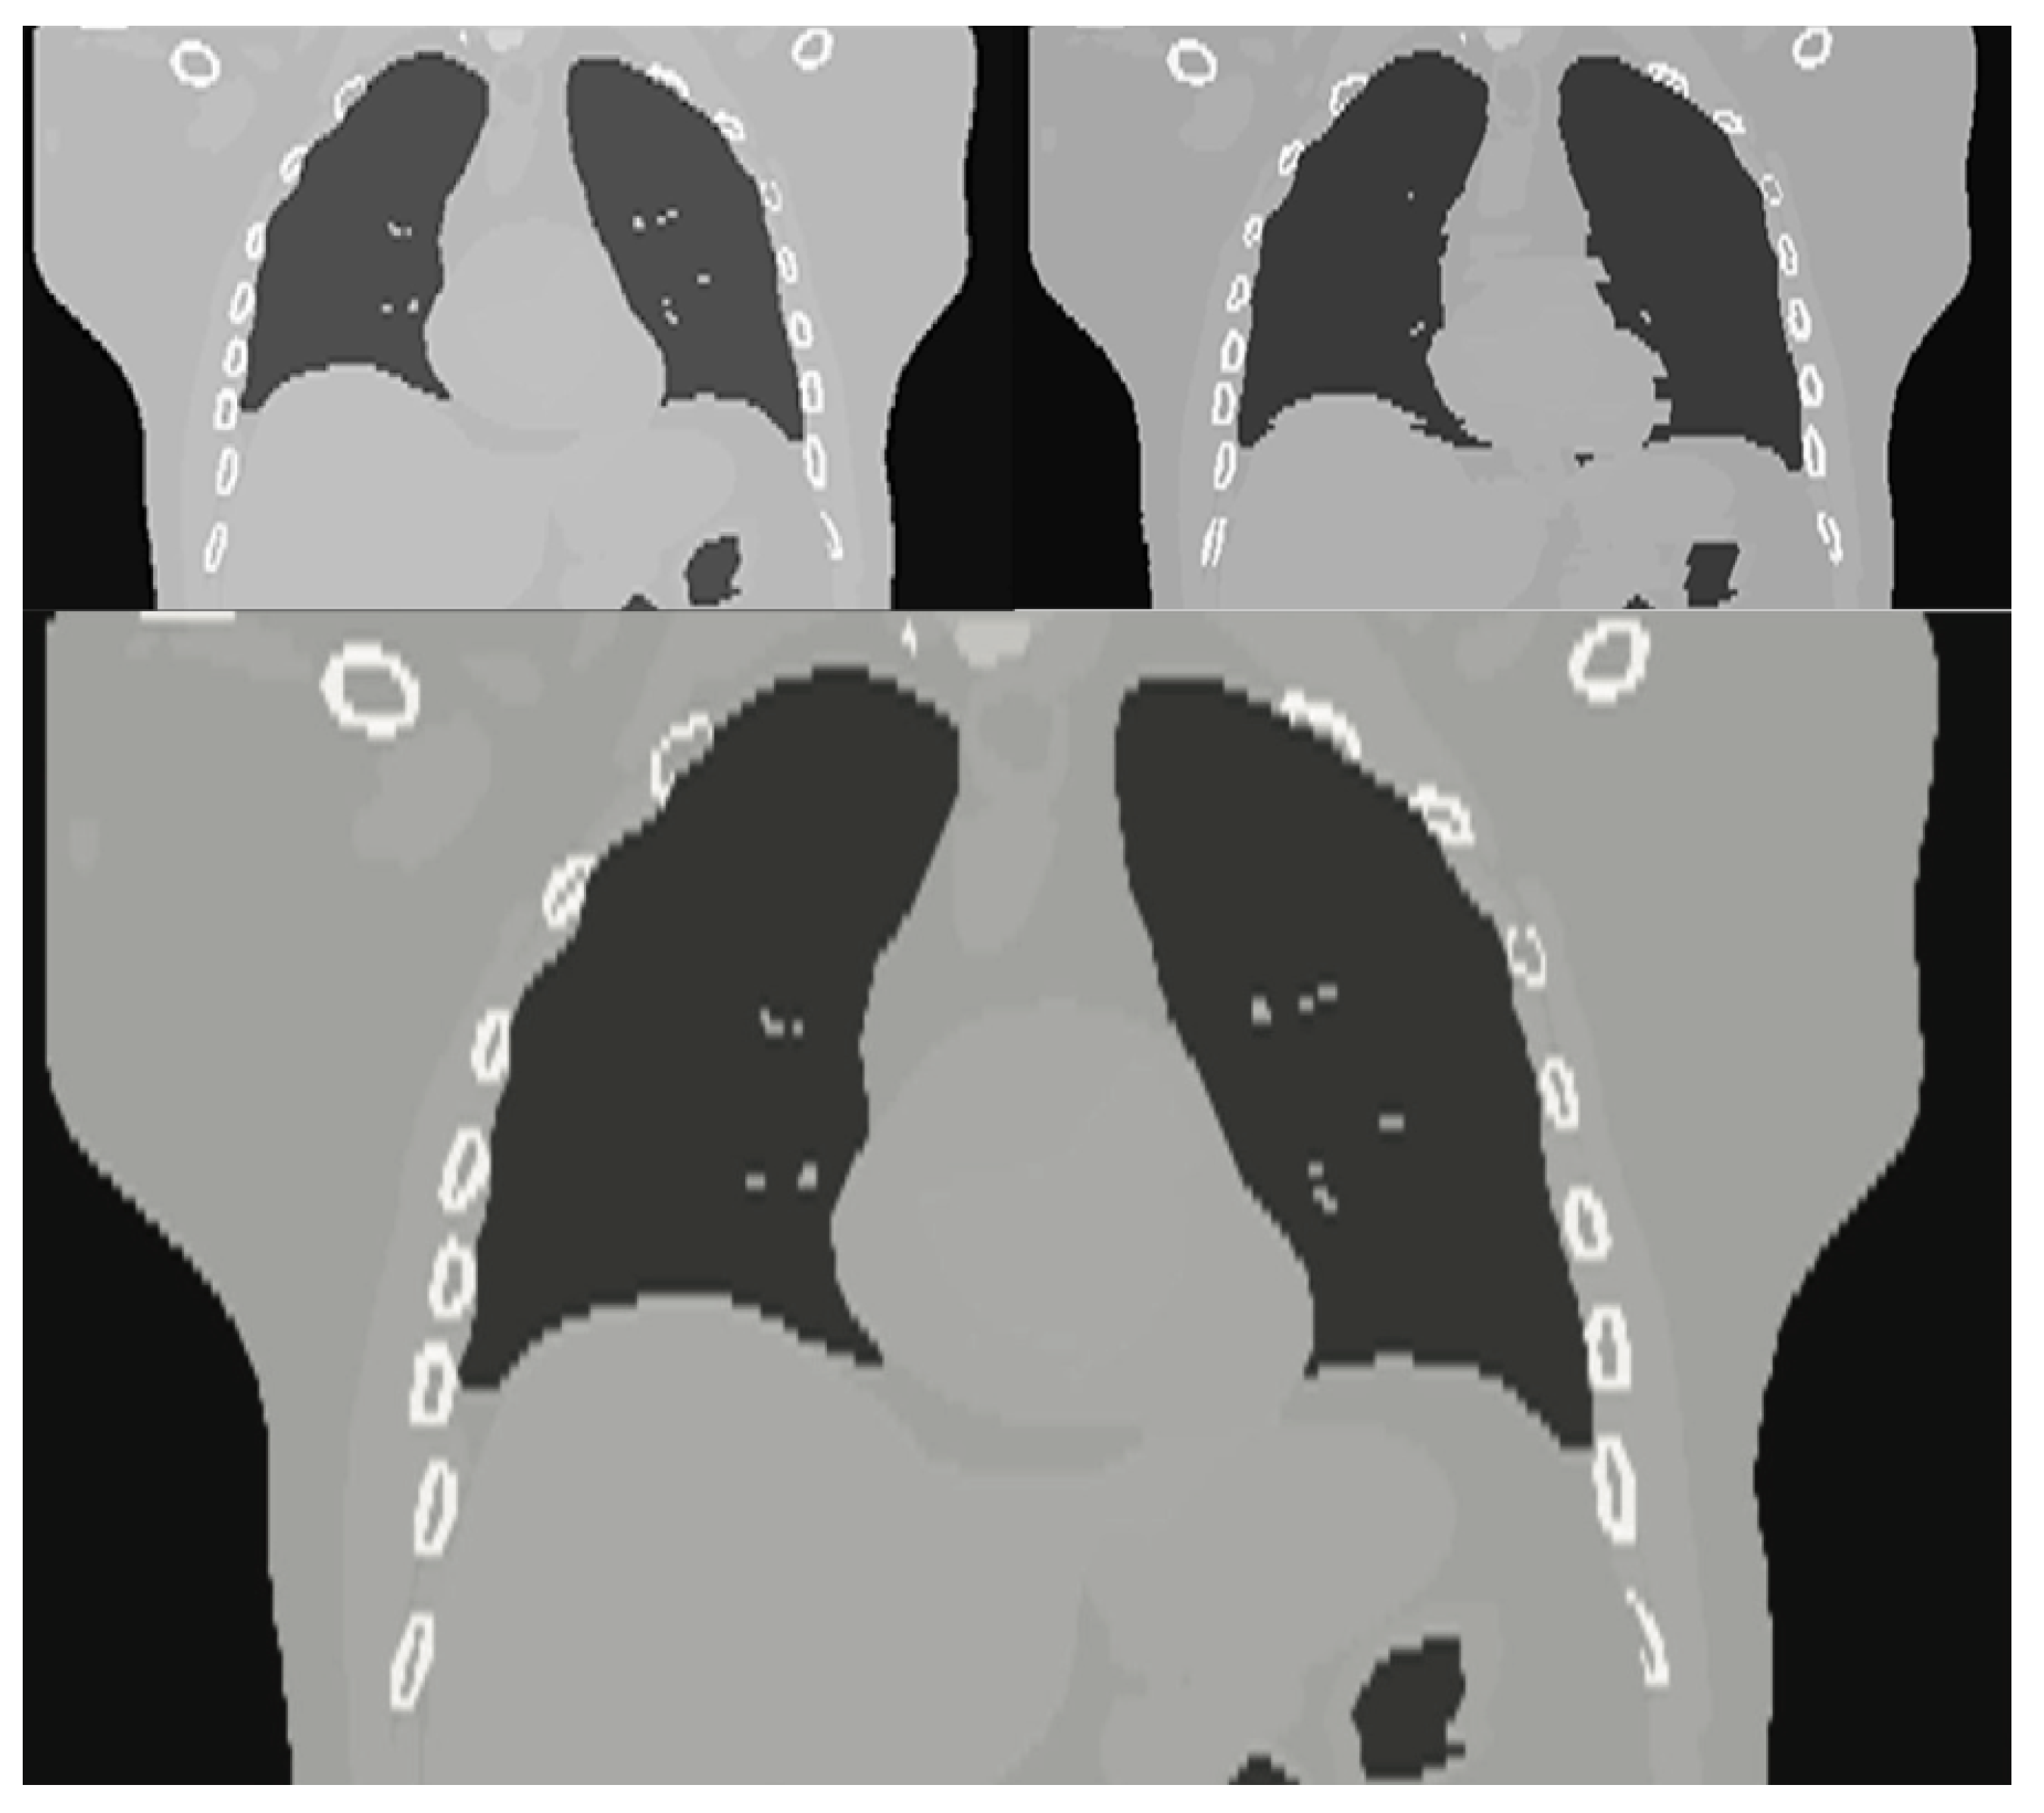
Figure 5.
The XCAT phantom images based experiment results. The upper row: two CT scans with simulated motion artefacts. The bottom row shows the super-resolution CT scan.
Figure 5.
The XCAT phantom images based experiment results. The upper row: two CT scans with simulated motion artefacts. The bottom row shows the super-resolution CT scan.

Figure 6.
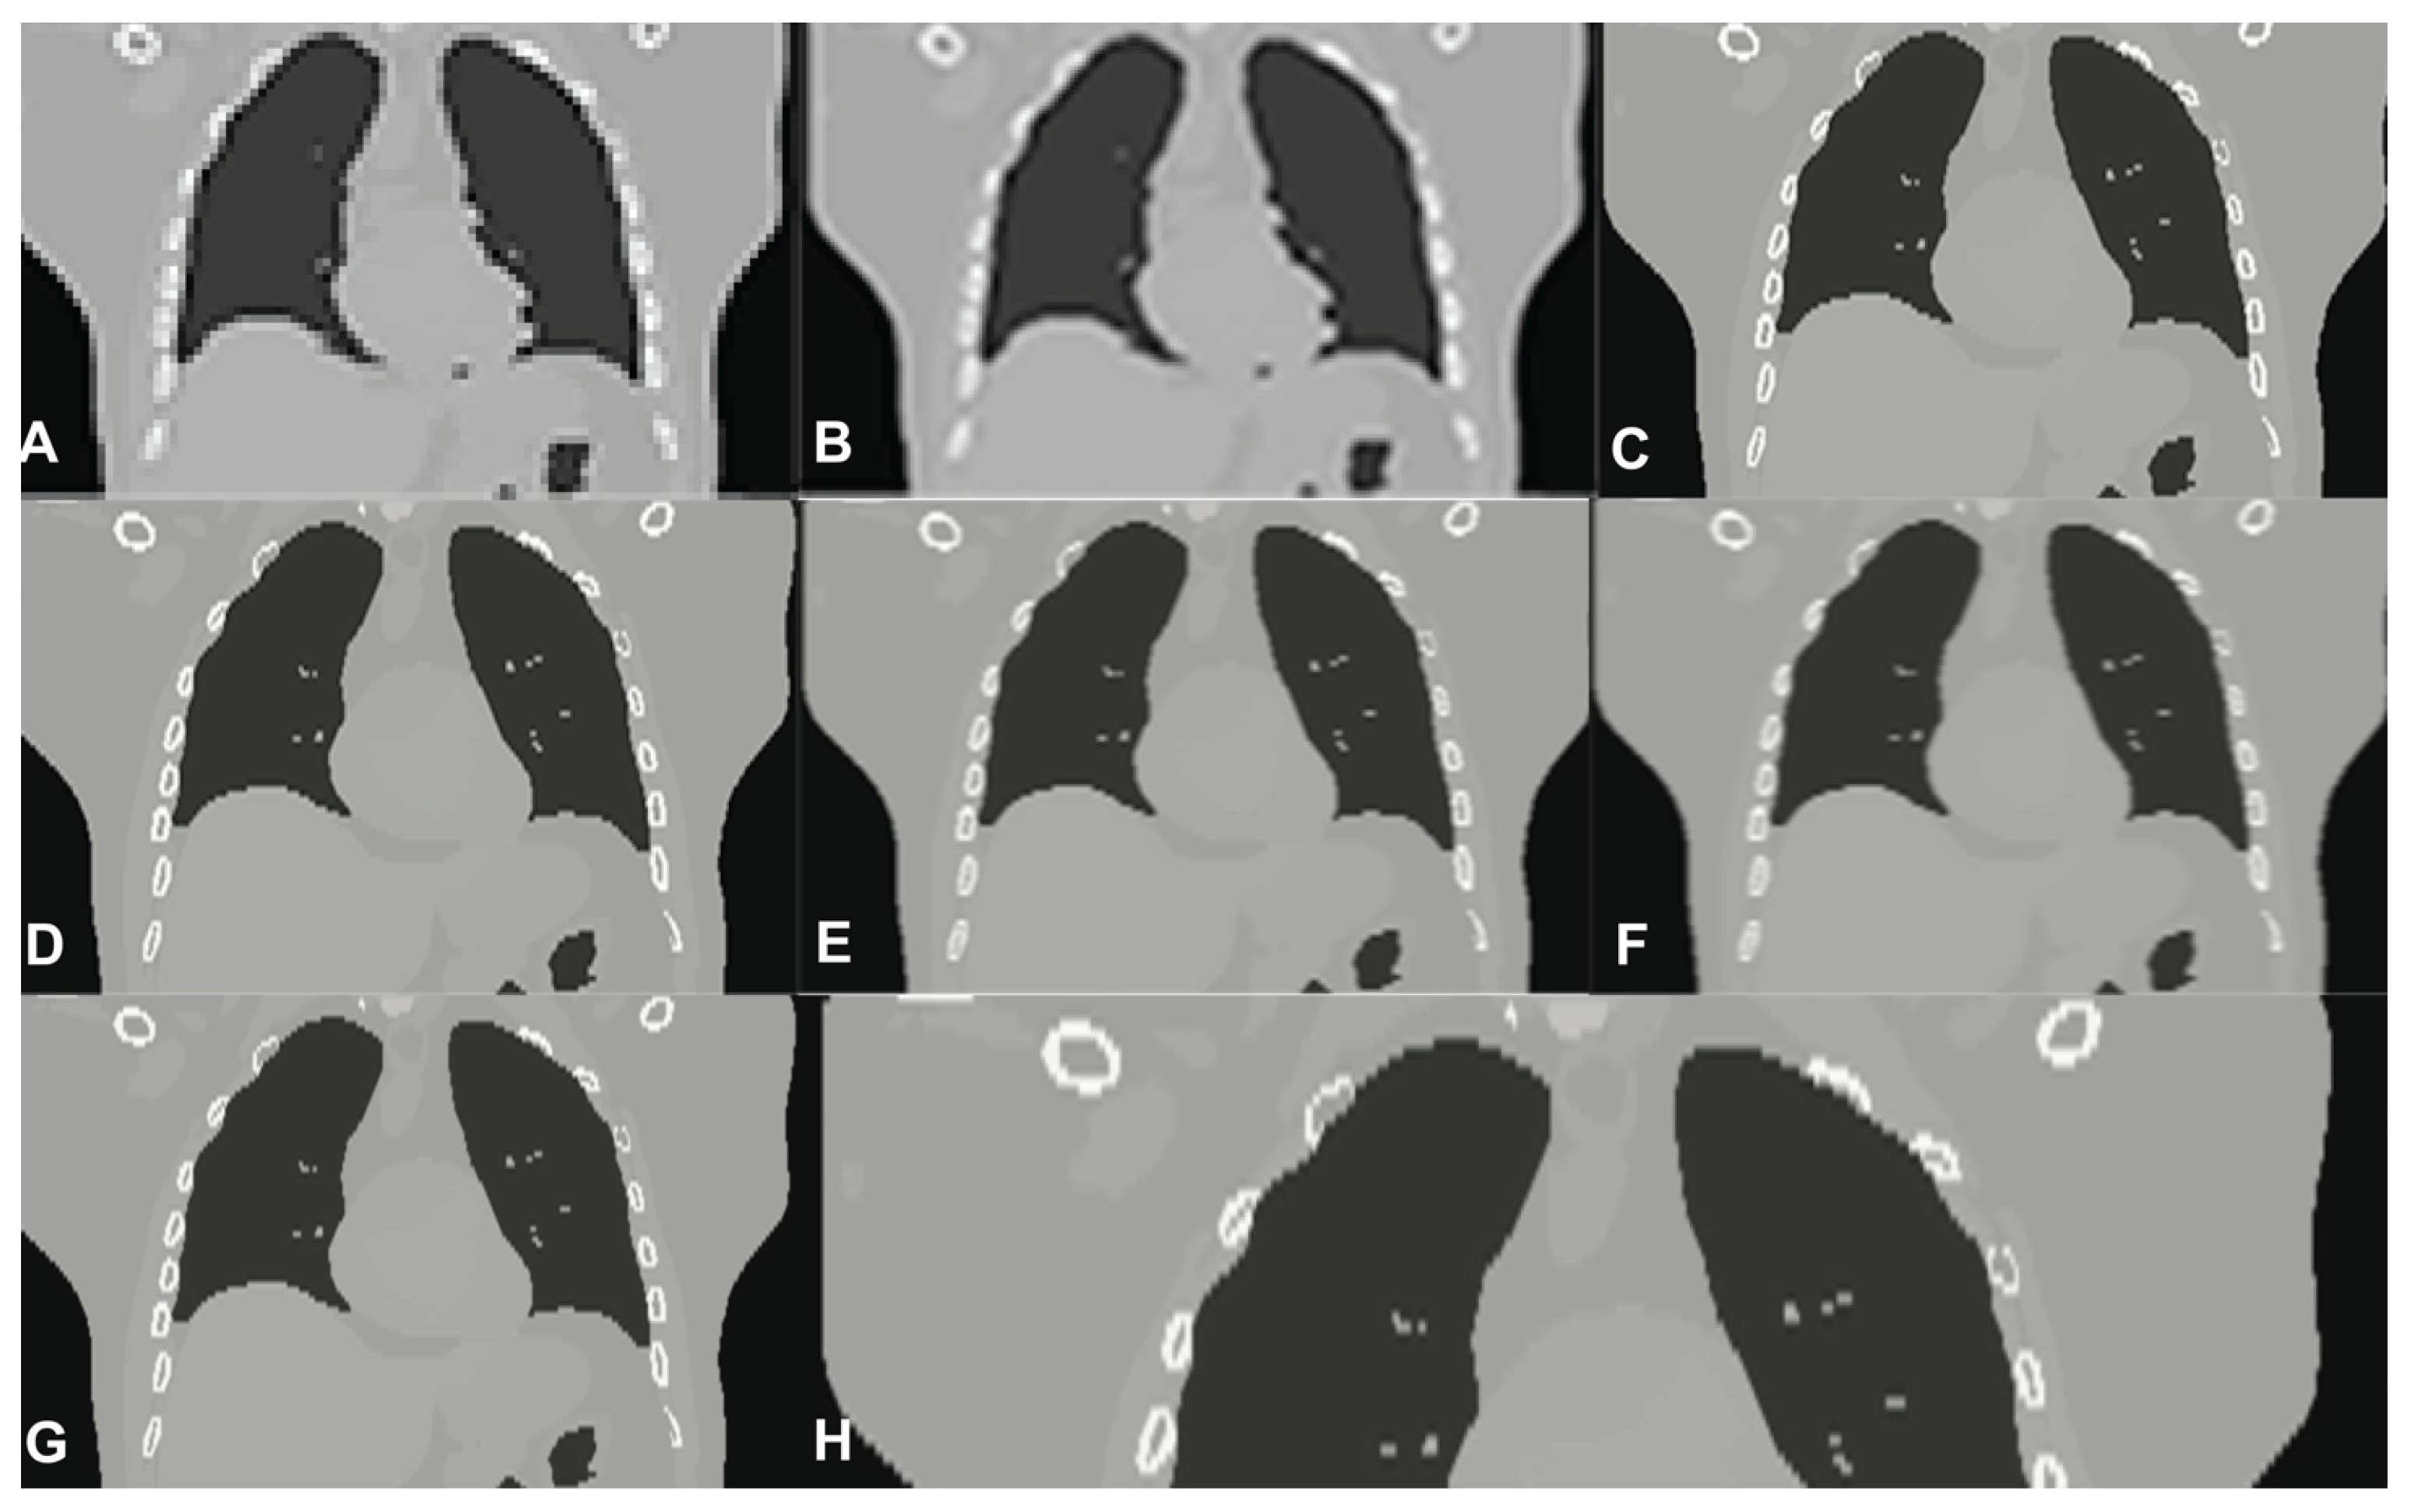
CT low-resolution vs. Super-Resolution Images. (A) LR input; (B) B-spline Cubic interpolation; (C) Non-Rigid Multi-Modal 3D Medical Image Registration Based on Foveated Modality Independent Neighbourhood Descriptor [25]; (D) Enhanced deep residual networks for single Image Super-Resolution [13]; (E) Image SR using very deep residual channel attention networks [14]; (F) Residual dense network for image SR [15]; (G,H) the presented algorithm (the right one exposes details). (The tests were performed using 4096 Projection lines/Coefficients and the ATA reconstruction algorithm).
Figure 6.
CT low-resolution vs. Super-Resolution Images. (A) LR input; (B) B-spline Cubic interpolation; (C) Non-Rigid Multi-Modal 3D Medical Image Registration Based on Foveated Modality Independent Neighbourhood Descriptor [25]; (D) Enhanced deep residual networks for single Image Super-Resolution [13]; (E) Image SR using very deep residual channel attention networks [14]; (F) Residual dense network for image SR [15]; (G,H) the presented algorithm (the right one exposes details). (The tests were performed using 4096 Projection lines/Coefficients and the ATA reconstruction algorithm).

Figure 7.
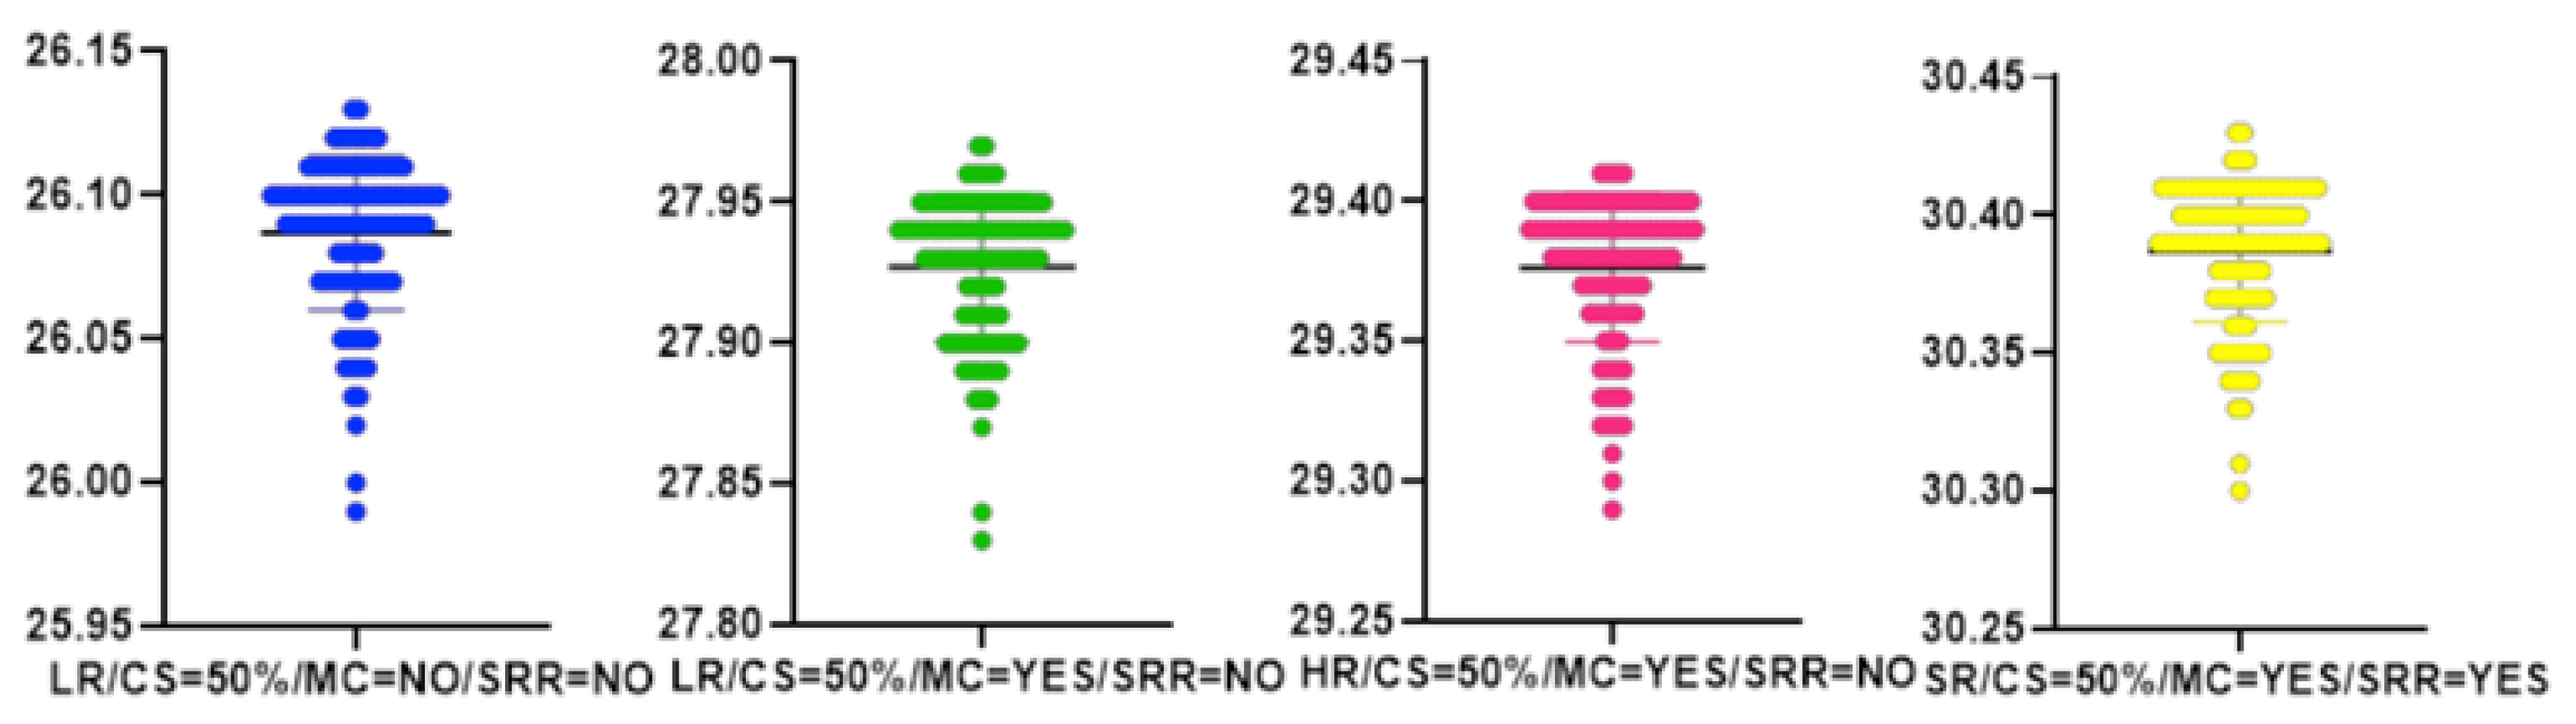
The performance of the presented algorithm for the data from Table 6. All the y-axes of the bee swarm plots represent PSNR values [dB].
Figure 7.
The performance of the presented algorithm for the data from Table 6. All the y-axes of the bee swarm plots represent PSNR values [dB].

Figure 8.
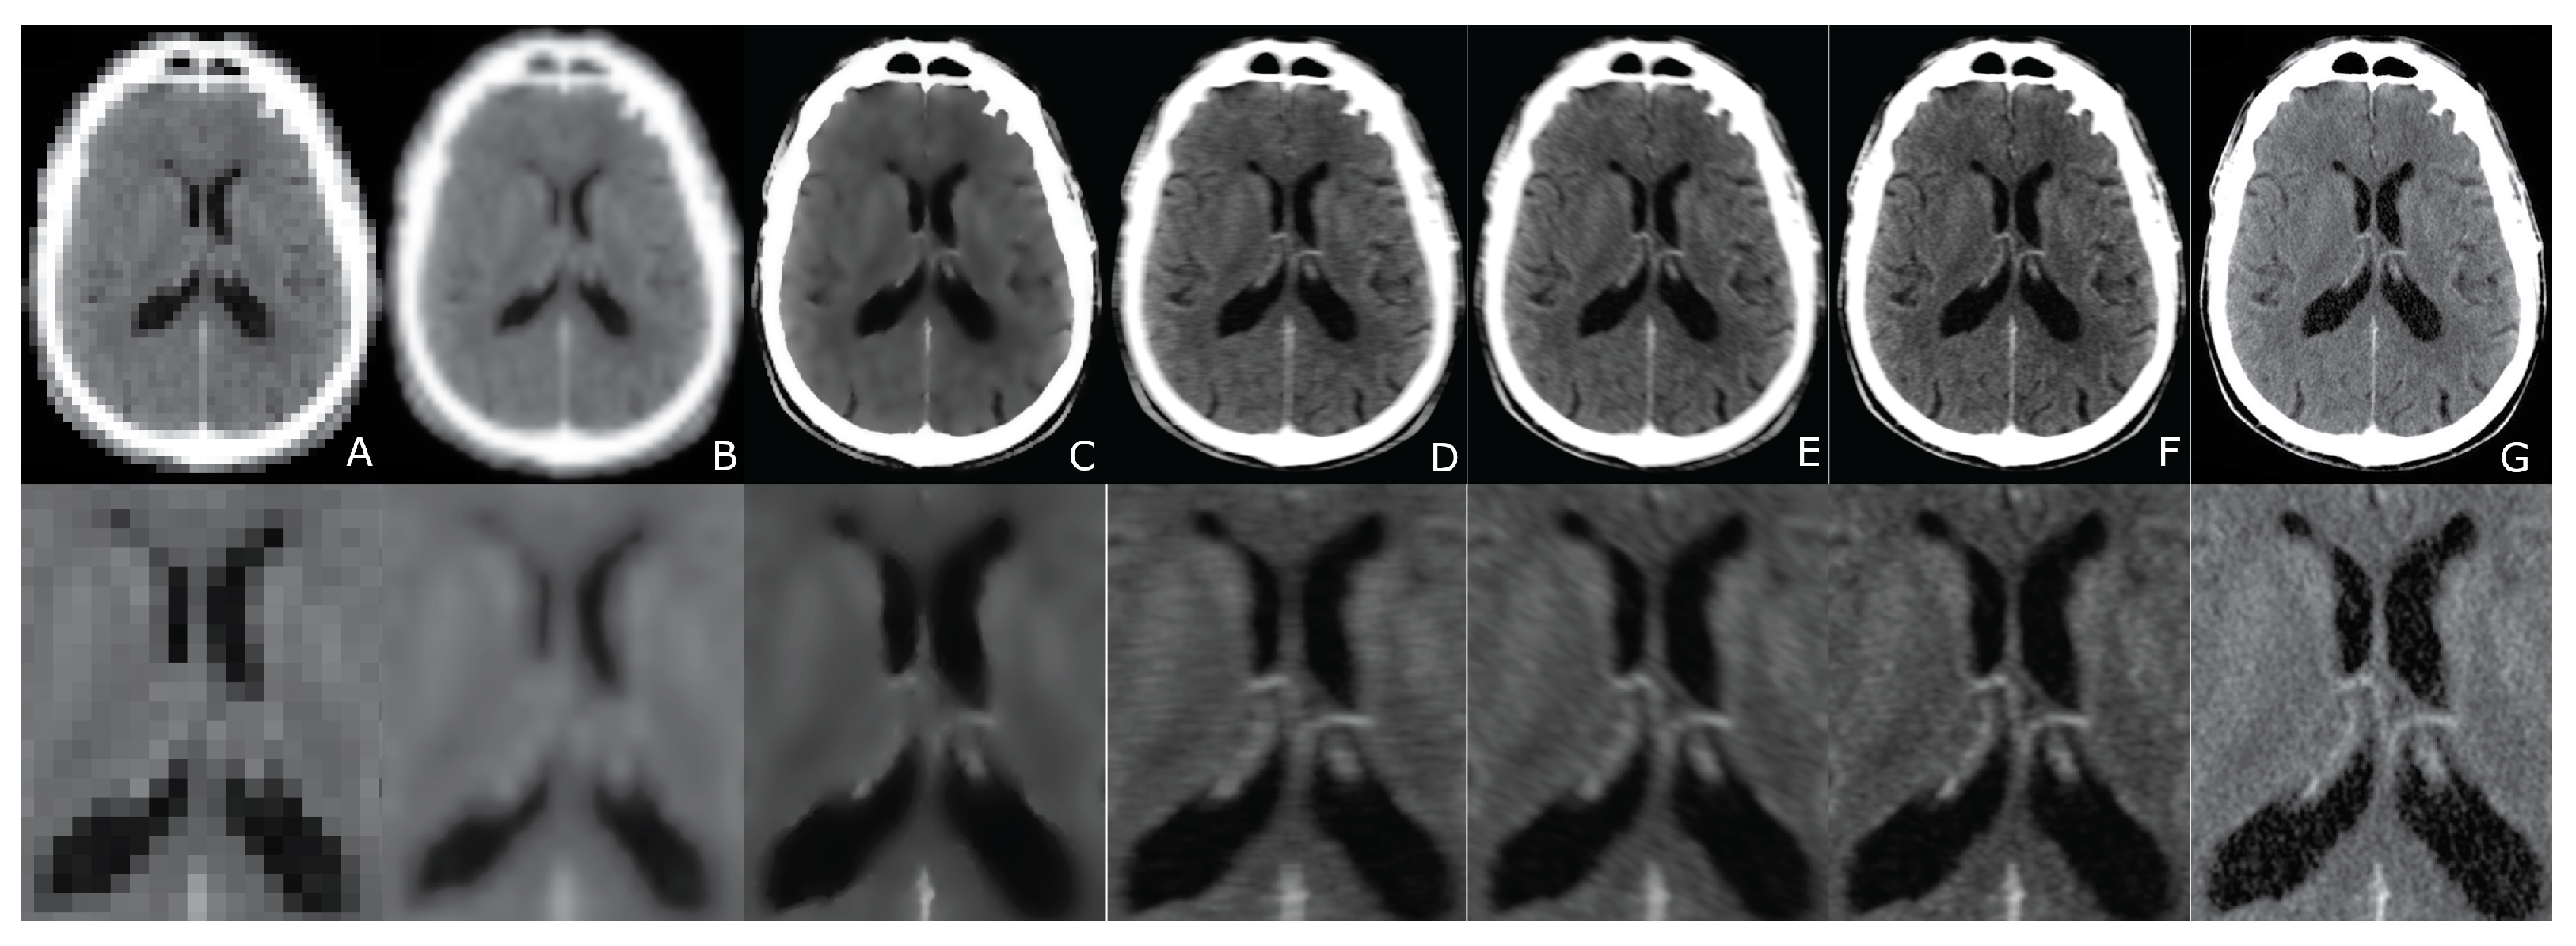
The performance of various super image reconstruction algorithms CT-in vivo trials input images. From left to right: (A) LR input; (B) B-spline Cubic interpolation; (C) Non-Rigid Multi-Modal 3D Medical Image Registration Based on Foveated Modality Independent Neighbourhood Descriptor [25]; (D) Enhanced deep residual networks for single Image Super-Resolution [13]; (E) Image super-resolution using very deep residual channel attention networks [14]; (F) Residual dense network for Image Super-Resolution [15]; (G) the presented algorithm.
Figure 8.
The performance of various super image reconstruction algorithms CT-in vivo trials input images. From left to right: (A) LR input; (B) B-spline Cubic interpolation; (C) Non-Rigid Multi-Modal 3D Medical Image Registration Based on Foveated Modality Independent Neighbourhood Descriptor [25]; (D) Enhanced deep residual networks for single Image Super-Resolution [13]; (E) Image super-resolution using very deep residual channel attention networks [14]; (F) Residual dense network for Image Super-Resolution [15]; (G) the presented algorithm.

Figure 9.
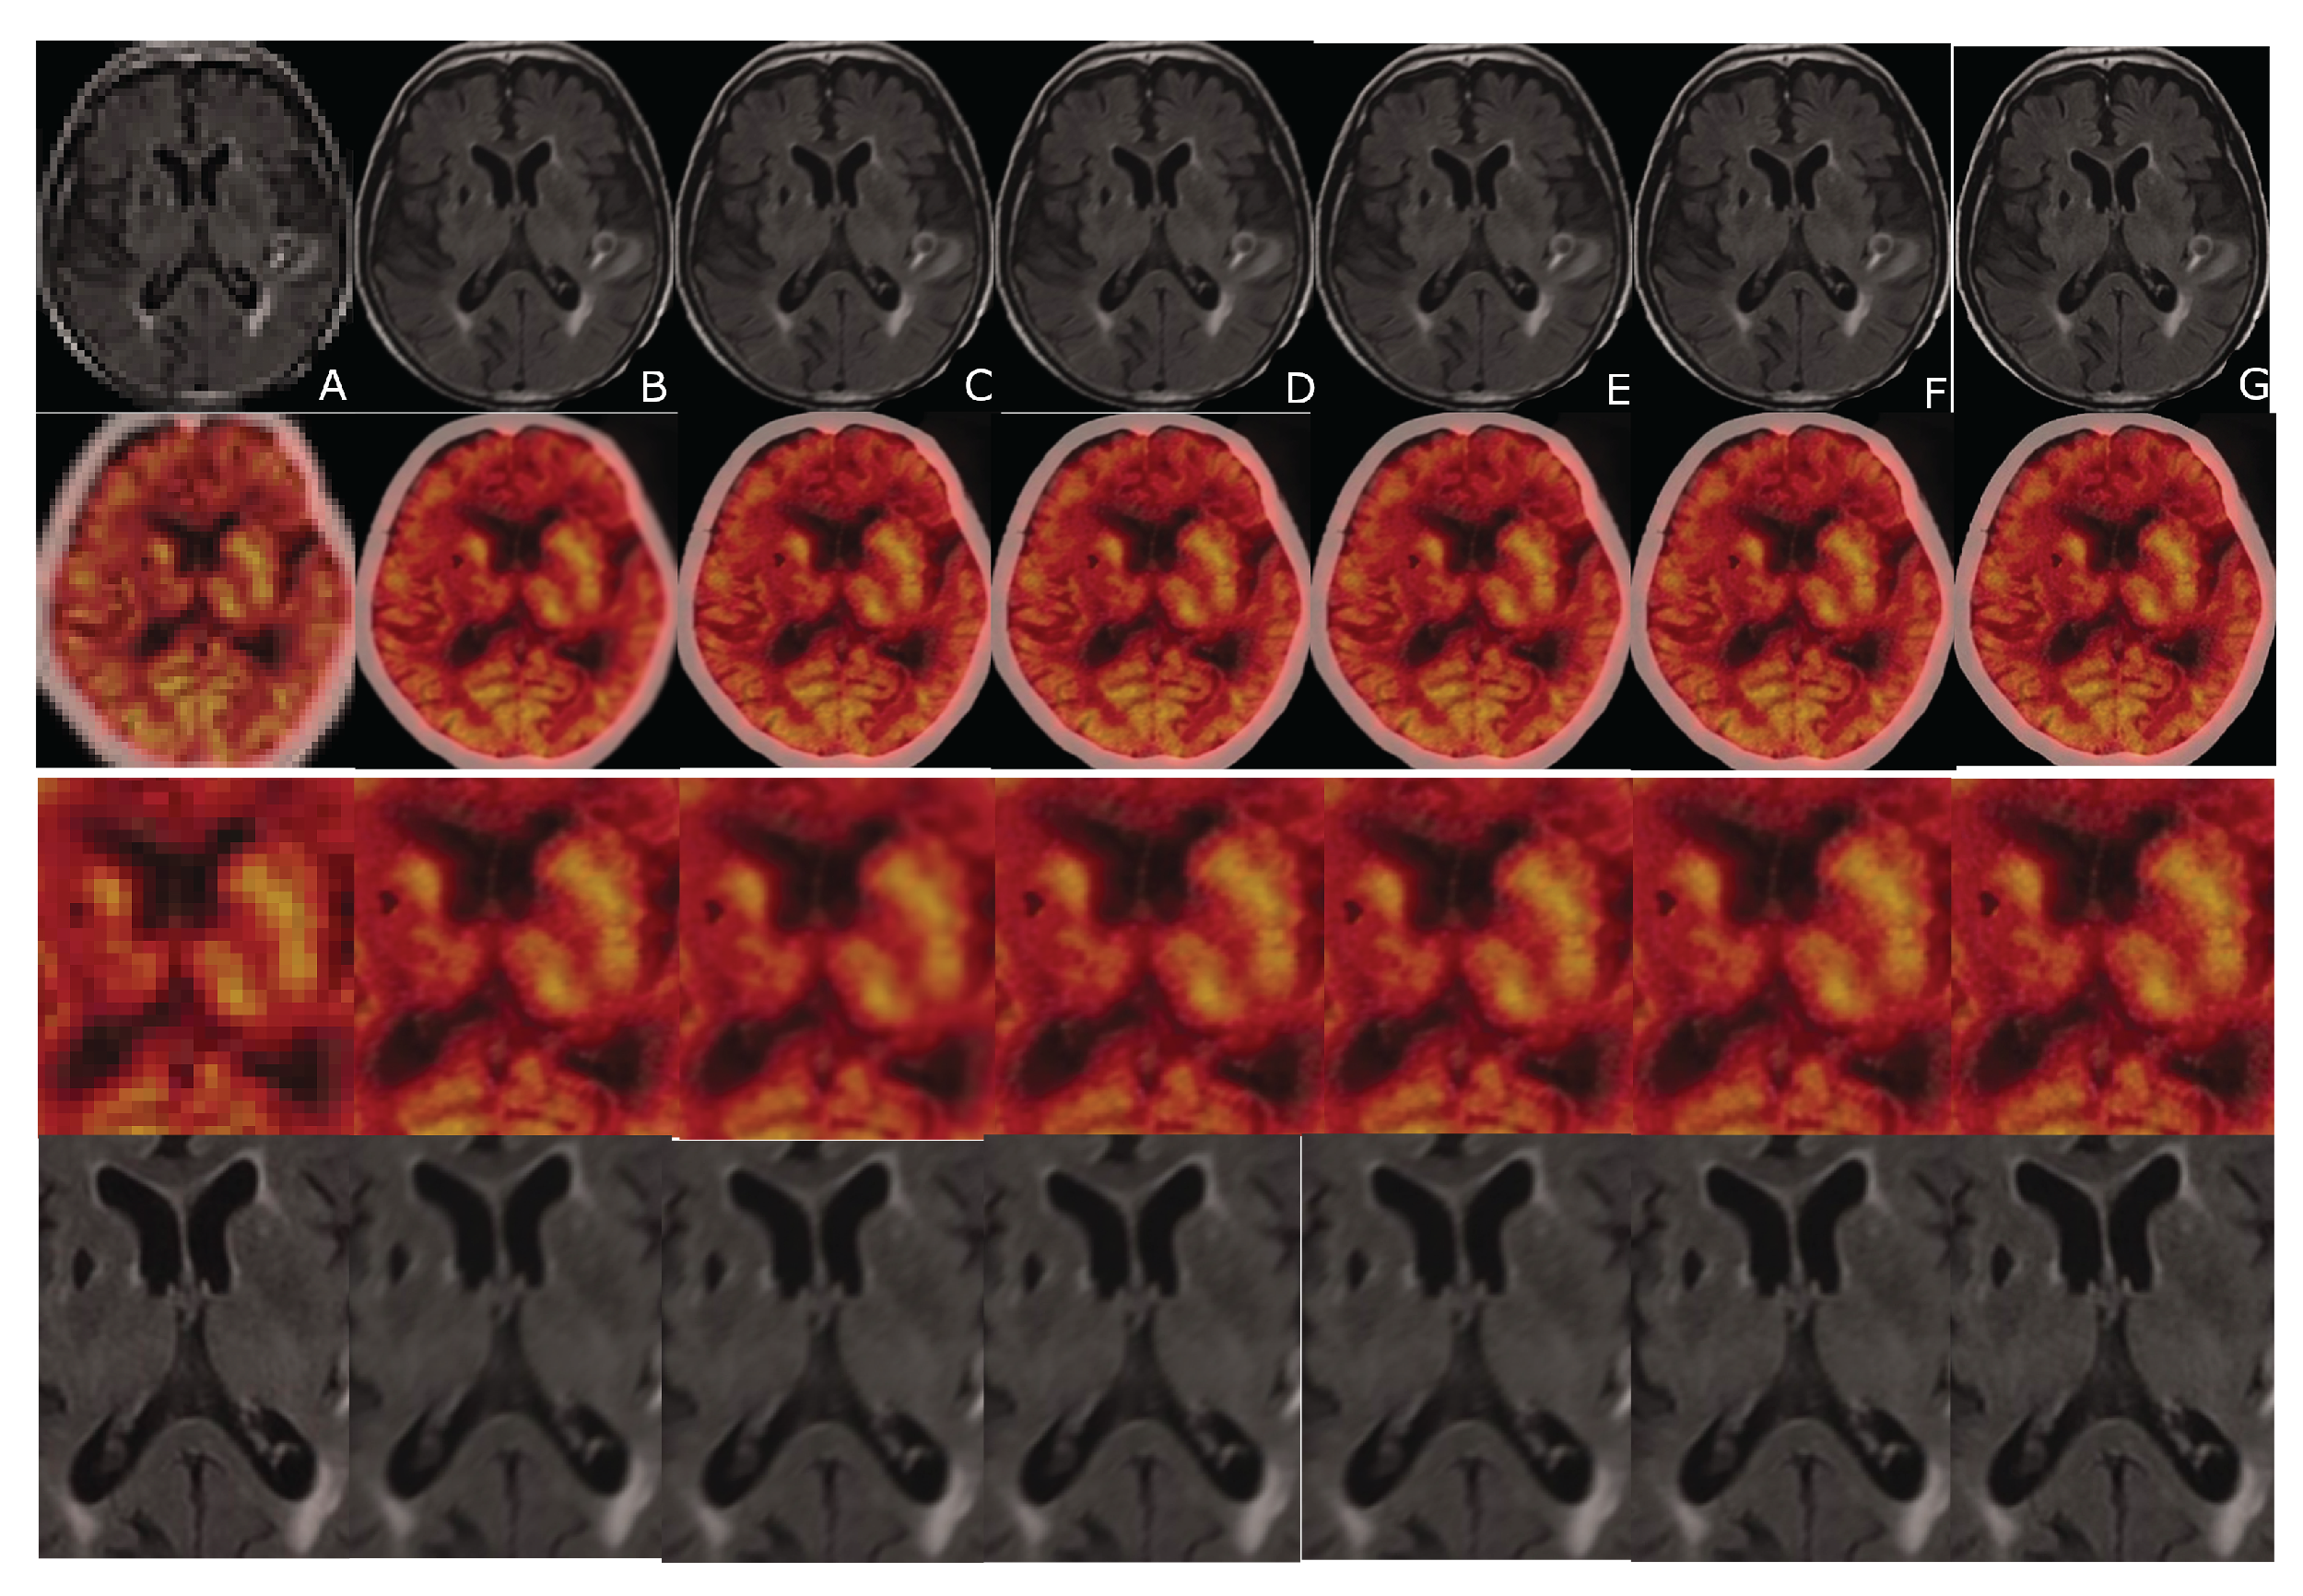
An example of CT and FDG-PET data sets. From left to right: (A) LR input; (B) B-spline Cubic interpolation; (C) Non-Rigid Multi-Modal 3D Medical Image Registration Based on Foveated Modality Independent Neighbourhood Descriptor [25]; (D) Enhanced deep residual networks for single Image Super-Resolution [13]; (E) Image super-resolution using very deep residual channel attention networks [14]; (F) Residual dense network for Image Super-Resolution [15]; (G) the presented algorithm. The 3rd and the 4th row: the cropped and zoomed scans.
Figure 9.
An example of CT and FDG-PET data sets. From left to right: (A) LR input; (B) B-spline Cubic interpolation; (C) Non-Rigid Multi-Modal 3D Medical Image Registration Based on Foveated Modality Independent Neighbourhood Descriptor [25]; (D) Enhanced deep residual networks for single Image Super-Resolution [13]; (E) Image super-resolution using very deep residual channel attention networks [14]; (F) Residual dense network for Image Super-Resolution [15]; (G) the presented algorithm. The 3rd and the 4th row: the cropped and zoomed scans.


Table 1.
The performance of different reconstruction algorithms for Shepp–Logan phantom.
| Reconstruction Algorithm | Projection Lines [Coeff. No.] | MC | SRR | PSNR [dB] | MAE | N | SD | t(100) | p |
|---|---|---|---|---|---|---|---|---|---|
| ATA | 4096 | YES | NO | 29.96 | 14.22 | 100 | 0.03 | 0.383 | 0.551 |
| ATA | 4096 | YES | YES | 32.92 | 12.01 | 100 | 0.02 | −0.731 | 0.101 |
| FBP | 12,288 | YES | NO | 21.38 | 17.55 | 100 | 0.02 | −1.131 | 0.232 |
| NAUF | 4096 | YES | NO | 28.09 | 16.44 | 100 | 0.03 | −1.031 | 0.191 |
| ATA | 4096 | NO | NO | 27.36 | 17.01 | 100 | 0.03 | −1.231 | 0.231 |
| NAES | 2048 | YES | NO | 27.18 | 16.55 | 100 | 0.03 | −1.332 | 0.186 |
Table 2.
The performance of different reconstruction algorithms for Zubal phantom.
| Reconstruction Algorithm | Projection Lines [Coeff. No.] | MC | SRR | PSNR [dB] | MAE | N | SD | t(100) | p |
|---|---|---|---|---|---|---|---|---|---|
| ATA | 4096 | YES | NO | 29.96 | 14.22 | 100 | 0.03 | 0.383 | 0.551 |
| ATA | 4096 | YES | YES | 32.92 | 12.01 | 100 | 0.02 | −0.731 | 0.101 |
| FBP | 12,288 | YES | NO | 21.38 | 17.55 | 100 | 0.02 | −1.131 | 0.232 |
| NAUF | 4096 | YES | NO | 28.09 | 16.44 | 100 | 0.03 | −1.031 | 0.191 |
| ATA | 4096 | NO | NO | 27.36 | 17.01 | 100 | 0.03 | −1.231 | 0.231 |
| NAES | 2048 | YES | NO | 27.18 | 16.55 | 100 | 0.03 | −1.332 | 0.186 |
Table 3.
The performance of different reconstruction algorithms for XCAT phantom.
| Reconstruction Algorithm | Projection Lines [Coeff. No.] | MC | SRR | PSNR [dB] | MAE | N | SD | t(100) | p |
|---|---|---|---|---|---|---|---|---|---|
| ATA | 4096 | YES | NO | 32.16 | 14.25 | 100 | 0.04 | 0.024 | 0.500 |
| ATA | 4096 | YES | YES | 38.22 | 12.51 | 100 | 0.02 | −0.611 | 0.110 |
| FBP | 12,288 | YES | NO | 24.44 | 13.66 | 100 | 0.02 | −1.115 | 0.184 |
| NAUF | 4096 | YES | NO | 31.12 | 16.88 | 100 | 0.03 | −1.022 | 0.199 |
| ATA | 4096 | NO | NO | 32.18 | 16.61 | 100 | 0.03 | −1.251 | 0.263 |
| NAES | 2048 | YES | NO | 25.42 | 14.92 | 100 | 0.03 | −1.387 | 0.136 |
Table 4.
Statistical parameters of the model performance metrics for Figure 6.
Table 4.
Statistical parameters of the model performance metrics for Figure 6.
| Reconstruction Algorithm | PSNR [dB] | MAE | N | M | SD | t(99) | p |
|---|---|---|---|---|---|---|---|
| LR input | 26.07 | 19.41 | 100 | 26.07 | 0.04 | 0.387 | 0.592 |
| B-spline Cubic interpolation | 26.31 | 18.42 | 100 | 26.31 | 0.02 | −0.721 | 0.361 |
| Non-Rigid Multi-Modal 3D Medical Image Registration Based on Foveated Modality Independent Neighbourhood Descriptor | 31.01 | 16.31 | 100 | 31.01 | 0.02 | −1.031 | 0.312 |
| Enhanced deep residual networks for single image super-resolution | 28.44 | 15.22 | 100 | 28.44 | 0.03 | −1.001 | 0.201 |
| Image super-resolution using very deep residual chanel attention networks | 30.21 | 14.66 | 100 | 30.21 | 0.03 | −1.071 | 0.232 |
| Residual dense network for image super-resolution | 31.44 | 14.30 | 100 | 31.44 | 0.03 | −1.112 | 0.206 |
| The presented algorithm | 33.39 | 12.02 | 100 | 33.39 | 0.03 | −1.211 | 0.129 |
Table 5.
The performance of the algorithm for the data from the Figure 6 at different Compressed Sensing quality ratios *.
Table 5.
The performance of the algorithm for the data from the Figure 6 at different Compressed Sensing quality ratios *.
| Compressed Sensing Quality * [%] | PSNR [dB] | MAE | N | M | SD | t(99) | p |
|---|---|---|---|---|---|---|---|
| 20 | 18.76 | 21.43 | 100 | 18.76 | 0.03 | −1.490 | 0.139 |
| 40 | 25.62 | 20.01 | 100 | 25.62 | 0.03 | −1.440 | 0.153 |
| 50 | 33.39 | 18.40 | 100 | 33.39 | 0.03 | −1.211 | 0.129 |
| 80 | 31.16 | 17.02 | 100 | 31.16 | 0.03 | −1.692 | 0.094 |
| 100 | 35.19 | 13.01 | 100 | 35.19 | 0.03 | −1.692 | 0.094 |
* Compressed Sensing quality ratio refers to the remaining number of the input samples in comparison with fully sampled scans, i.e., 60 means that 40% of the fully sampled scan samples was removed.
Table 6.
The performance of different reconstruction algorithms for in-vivo brain image (Figure 6) (MC—motion correction, HR—upscaling using Non-Rigid Multi-Modal 3D Medical Image Registration Based Foveated Modality Independent Neighbourhood Descriptor).
Table 6.
The performance of different reconstruction algorithms for in-vivo brain image (Figure 6) (MC—motion correction, HR—upscaling using Non-Rigid Multi-Modal 3D Medical Image Registration Based Foveated Modality Independent Neighbourhood Descriptor).
| Input | CS [%] | MC | SRR | PSNR [dB] | MAE | N | M | SD | t(99) | p |
|---|---|---|---|---|---|---|---|---|---|---|
| LR | 50 | NO | NO | 26.09 | 19.22 | 100 | 26.09 | 0.03 | −1.252 | 0.213 |
| LR | 50 | YES | NO | 27.93 | 18.43 | 100 | 27.93 | 0.03 | −1.075 | 0.285 |
| HR | 50 | YES | NO | 29.38 | 16.59 | 100 | 29.38 | 0.03 | −1.226 | 0.223 |
| SR | 50 | YES | YES | 33.19 | 14.21 | 100 | 33.19 | 0.03 | −1.692 | 0.129 |
Table 7.
Statistical parameters of the model performance metrics for in vivo trials, see Figure 8.
Table 7.
Statistical parameters of the model performance metrics for in vivo trials, see Figure 8.
| Reconstruction Algorithm | PSNR [dB] | MAE | N | M | SD | t(99) | p |
|---|---|---|---|---|---|---|---|
| LR input | 26.01 | 19.35 | 100 | 26.01 | 0.04 | 0.387 | 0.591 |
| B-spline Cubic interpolation | 26.09 | 18.438 | 100 | 26.09 | 0.02 | −0.721 | 0.331 |
| Non-Rigid Multi-Modal 3D Medical Image Registration Based on Foveated Modality Independent Neighborhood Descriptor | 31.01 | 14.23 | 100 | 31.01 | 0.02 | −1.031 | 0.331 |
| Enhanced deep residual networks for single image super-resolution | 29.47 | 14.99 | 100 | 29.47 | 0.03 | −1.001 | 0.266 |
| Image super-resolution using very deep residual chanel attention networks | 28.55 | 14.81 | 100 | 28.55 | 0.03 | −1.071 | 0.219 |
| Residual dense network for image super-resolution | 29.01 | 14.31 | 100 | 29.01 | 0.03 | −1.102 | 0.194 |
| The presented algorithm | 35.42 | 11.01 | 100 | 35.42 | 0.03 | −1.201 | 0.109 |
Table 8.
The performance of the presented algorithm for the data from the Figure 8 at different Compressed Sensing quality ratios.
Table 8.
The performance of the presented algorithm for the data from the Figure 8 at different Compressed Sensing quality ratios.
| Compressed Sensing Quality * [%] | PSNR [dB] | MAE | N | M | SD | t(99) | p |
|---|---|---|---|---|---|---|---|
| 20 | 19.31 | 20.01 | 100 | 19.31 | 0.03 | −1.510 | 0.101 |
| 40 | 21.77 | 19.34 | 100 | 21.77 | 0.02 | −1.014 | 0.321 |
| 50 | 35.42 | 11.01 | 100 | 35.42 | 0.03 | −1.201 | 0.109 |
| 80 | 36.01 | 14.05 | 100 | 36.01 | 0.03 | −1.211 | 0.103 |
| 100 | 36.69 | 13.09 | 100 | 36.69 | 0.03 | −1.310 | 0.109 |
* Compressed Sensing quality ratio refers to the remaining number of the input samples in comparison with fully sampled scans, i.e., 60 means that 40% of the fully sampled scan samples was removed.
Table 9.
Statistical parameters of the model performance metrics for Figure 9.
Table 9.
Statistical parameters of the model performance metrics for Figure 9.
| Reconstruction Algorithm | PSNR [dB] | MAE | N | M | SD | t(99) | p |
|---|---|---|---|---|---|---|---|
| LR input | 21.11 | 20.33 | 100 | 21.11 | 0.03 | −1.282 | 0.193 |
| B-spline Cubic interpolation | 24.26 | 18.41 | 100 | 24.26 | 0.03 | −1.451 | 0.142 |
| Non-Rigid Multi-Modal 3D Medical Image Registration Based on Foveated Modality Independent Neighborhood Descriptor | 33.22 | 16.83 | 100 | 33.22 | 0.03 | −1.373 | 0.173 |
| Enhanced deep residual networks for single image super-resolution | 31.03 | 15.71 | 100 | 30.33 | 0.03 | −1.281 | 0.214 |
| Image super-resolution using very deep residual chanel attention networks | 32.21 | 14.62 | 100 | 32.21 | 0.03 | −1.282 | 0.216 |
| Residual dense network for image super-resolution | 32.44 | 14.60 | 100 | 32.44 | 0.03 | −1.311 | 0.213 |
| The presented algorithm | 34.59 | 13.37 | 100 | 34.59 | 0.03 | −1.284 | 0.102 |
Table 10.
The performance of the presented algorithm for the data from Figure 9 at different Compressed Sensing quality ratios.
Table 10.
The performance of the presented algorithm for the data from Figure 9 at different Compressed Sensing quality ratios.
| Compressed Sensing Quality * [%] | PSNR [dB] | MAE | N | M | SD | t(99) | p |
|---|---|---|---|---|---|---|---|
| 20 | 19.40 | 21.03 | 100 | 19.40 | 0.03 | −1.502 | 0.131 |
| 40 | 22.89 | 19.44 | 100 | 22.89 | 0.02 | −1.016 | 0.323 |
| 50 | 34.59 | 13.37 | 100 | 34.59 | 0.03 | −1.284 | 0.102 |
| 80 | 36.21 | 15.58 | 100 | 36.21 | 0.03 | −1.415 | 0.123 |
| 100 | 37.63 | 13.21 | 100 | 37.63 | 0.03 | −1.420 | 0.103 |
* Compressed Sensing quality ratio refers to the remaining number of the input samples in comparison with fully sampled scans, i.e., 60 means that 40% of the fully sampled scan samples was removed.
Table 11.
The stats of several motion estimation procedures have been compared with the applied one.
Table 11.
The stats of several motion estimation procedures have been compared with the applied one.
| Registration Algorithm | TRE [Voxels ] | ||
|---|---|---|---|
| Mean | Std | p-Value | |
| No registration applied | 4.8 | 2.7 | <0.002 |
| Entropy images based SSD | 2.5 | 0.7 | <0.002 |
| Non-rigid multi modal medical image registration by combining L-BFGS-B with cat swarm optimisation | 2.2 | 0.3 | <0.002 |
| Modality independent neighborhood descriptor | 1.8 | 0.1 | <0.002 |
| Globally optimal deformable registration | 1.6 | 0.1 | <0.002 |
© 2020 by the author. Licensee MDPI, Basel, Switzerland. This article is an open access article distributed under the terms and conditions of the Creative Commons Attribution (CC BY) license (http://creativecommons.org/licenses/by/4.0/).
Share and Cite
MDPI and ACS Style
Malczewski, K. Image Resolution Enhancement of Highly Compressively Sensed CT/PET Signals. Algorithms 2020, 13, 129. https://0-doi-org.brum.beds.ac.uk/10.3390/a13050129
AMA Style
Malczewski K. Image Resolution Enhancement of Highly Compressively Sensed CT/PET Signals. Algorithms. 2020; 13(5):129. https://0-doi-org.brum.beds.ac.uk/10.3390/a13050129
Chicago/Turabian StyleMalczewski, Krzysztof. 2020. "Image Resolution Enhancement of Highly Compressively Sensed CT/PET Signals" Algorithms 13, no. 5: 129. https://0-doi-org.brum.beds.ac.uk/10.3390/a13050129
Note that from the first issue of 2016, this journal uses article numbers instead of page numbers. See further details here.