The RONO (Rank-Order-Normalization) Procedure for Power-Spectrum Analysis of Datasets with Non-Normal Distributions


1
Center for Space Science and Astrophysics and Kavli Institute for Particle Astrophysics and Cosmology, Stanford University, Stanford, CA 94305-4060, USA
2
Research Office for Complex Physical and Biological Systems, 8006 Zurich, Switzerland
3
Biomedical Optics Research Laboratory, Department of Neonatology, University Hospital Zurich, University of Zurich, 8091 Zurich, Switzerland
*
Author to whom correspondence should be addressed.
Algorithms 2020, 13(7), 157; https://0-doi-org.brum.beds.ac.uk/10.3390/a13070157
Submission received: 3 June 2020
/
Revised: 22 June 2020
/
Accepted: 27 June 2020
/
Published: 30 June 2020
Abstract
:Standard (Lomb-Scargle, likelihood, etc.) procedures for power-spectrum analysis provide convenient estimates of the significance of any peak in a power spectrum, based—typically—on the assumption that the measurements being analyzed have a normal (i.e., Gaussian) distribution. However, the measurement sequence provided by a real experiment or a real observational program may not meet this requirement. The RONO (rank-order normalization) procedure generates a proxy distribution that retains the rank-order of the original measurements but has a strictly normal distribution. The proxy distribution may then be analyzed by standard power-spectrum analysis. We show by an example that the resulting power spectrum may prove to be quite close to the power spectrum obtained from the original data by a standard procedure, even if the distribution of the original measurements is far from normal. Such a comparison would tend to validate the original analysis.
1. Introduction
The investigation of time series often involves a search for oscillations. This is usually carried out by analyses such as the Lomb-Scargle procedure [1,2]. Alternatively, one may use a likelihood procedure that yields the same power as the Lomb-Scargle procedure but yields, in addition, amplitude and phase estimates [3,4]. These procedures have the convenient property that, on the assumption that the data are derived from random measurements that have a normal (i.e., Gaussian) distribution, the probability of finding a power S or more at a given frequency is given by
However, in practice a laboratory experiment or observational sequence may generate data that do not conform to the normality requirement. One then has the following options:
- (i)
- Analyze the procedure that generates the data and find or derive a valid procedure for assessing the significance of an oscillation generated by such a procedure; or
- (ii)
- Ignore the normality requirement and apply Equation (1) as if the normality requirement were valid.
Option (i) can be difficult and time-consuming and is probably rarely adopted in practice. Option (ii) is simple and convenient, but has the unfortunate consequence that the validity of the result is uncertain. For these reasons, we here suggest a third option.
If one can convert a given dataset into a “proxy” dataset that has a normal distribution, then one may apply the Lomb-Scargle or a similar procedure to the proxy dataset, and one would then be entitled to use Equation (1) for assessing the significance of any oscillation in the proxy dataset.
This raises the question: what procedure can be used to convert a given dataset into a proxy form that (a) has a normal distribution, and (b) somehow retains information in the original dataset that is significant for time-series analysis, so that an oscillation in the original dataset will lead to a corresponding oscillation in the proxy dataset?
We suggest that what we refer to as the RONO (for rank-order normalization) operation is a practical candidate for such a procedure.
2. The RONO Operation
Consider a sequence of measurements, , n = 1, …, N, which we denote by , taken at times , n = 1, …, N, which we denote by . We arrange the sequence of measurements in ascending order, and denote the re-arranged measurement sequence by
where R denotes the re-ordering operation.
We denote by f the error function, defined so that it increases from 0 to 1 as the independent variable increases from to :
We now define by
where
We now reverse the ordering procedure to obtain
Then the sequence has the same rank-order as , but has a strictly normal distribution.
3. Example and Discussion
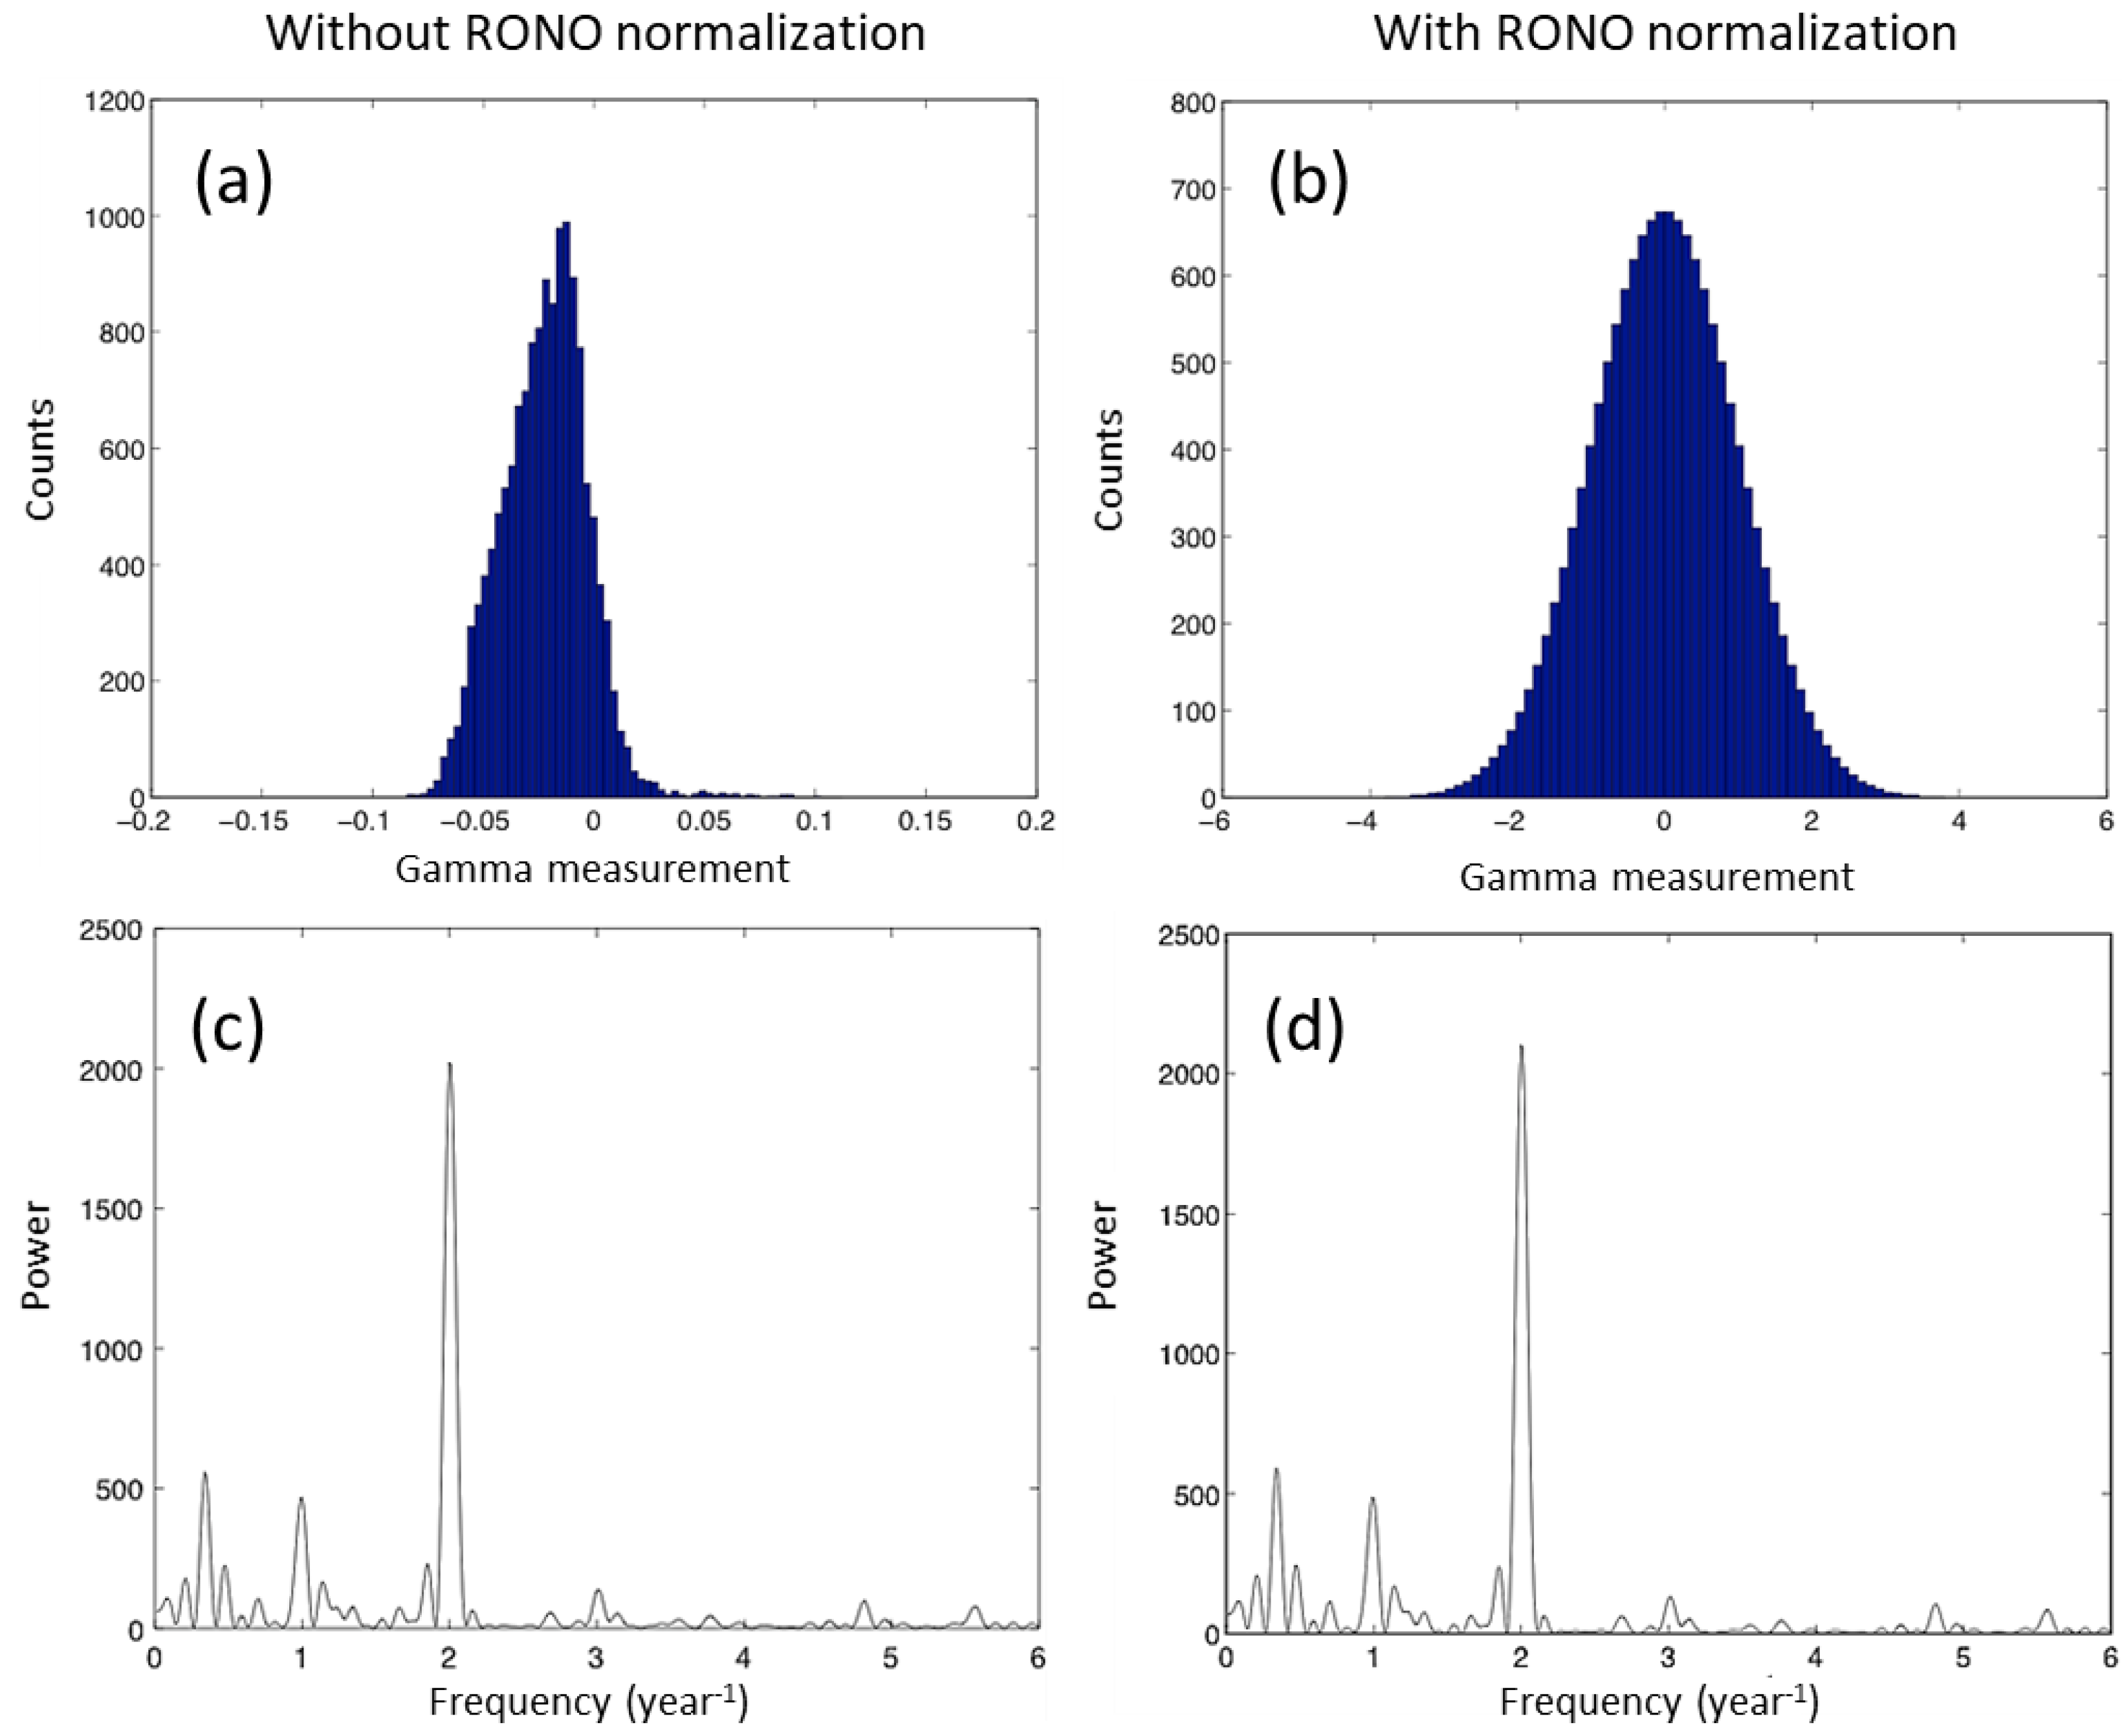
We consider, as an example of a dataset for which the distribution is far from normal, a sequence of 85,284 radon decay measurements acquired at the Geological Survey of Israel (GSI) [5,6]. The measurements, registered by universal time, were acquired at 1-hour intervals between day 86 of 2007 and day 312 of 2016, for local hour of day in the range 10 pm to 2 am [6]. The distribution of measurements, shown as a histogram in Figure 1a, is obviously far from normal.
A power spectrum was computed by the following likelihood procedure [4]:
where is the standard deviation of the measurements,
and, for each frequency, the complex amplitude A is adjusted to maximize the power S. This choice can be made by noting that the complex amplitude that maximizes S is the amplitude that is unchanged by arbitrary small perturbations in the complex power, so that we can determine the appropriate complex amplitude by the operation
This likelihood procedure yields exactly the same power as would be derived from the Lomb-Scargle procedure but it also yields—from the complex amplitude A—the amplitude and phase for each frequency. The power spectrum computed in this way is shown in Figure 1c.
The distribution of measurements, normalized according to the RONO procedure, is shown in Figure 1b. It is indeed precisely normal.
The power spectrum formed from the normalized measurements, shown in Figure 1d, is visually indistinguishable from Figure 1c. Table 1 lists the top 20 peaks in the power spectrum formed from the original dataset and the top 20 peaks in the power spectrum formed from the RONO-normalized dataset. We see that the frequencies are exactly the same and the powers differ by only a few percent.
This result suggests that a typical power-spectrum analysis may be less sensitive to departures from normality of the dataset than one might expect.
Further development of the RONO procedure could be to implement this approach as a data-preprocessing step for time-frequency analysis methods (e.g., wavelet analysis, Stockwell-transform) or for correlation analysis methods (e.g., wavelet coherence, linear and non-linear correlation analysis).
Author Contributions
Conceptualization, software, visualization, writing—original draft preparation, writing—review and editing; P.S.; visualization, writing—review and editing, F.S. All authors have read and agreed to the published version of the manuscript.
Funding
This research received no external funding.
Acknowledgments
PS is indebted to Jeffrey Scargle and Guenther Walther for many helpful conversations concerning time series analysis.
Conflicts of Interest
The authors declare no conflict of interest.
References
- Lomb, N.R. Least-squares frequency analysis of unequally spaced data. Astrophys. Space Sci. 1976, 39, 447–462. [Google Scholar] [CrossRef]
- Scargle, J.D. Studies in astronomical time series analysis. II—Statistical aspects of spectral analysis of unevenly spaced data. Astrophys. J. 1982, 263, 835–853. [Google Scholar] [CrossRef]
- Caldwell, D.O.; Sturrock, P.A. Evidence for solar neutrino flux variability and its implications. Astropart. Phys. 2005, 23, 543–556. [Google Scholar] [CrossRef] [Green Version]
- Sturrock, P.A. Time-series analysis of Super-Kamiokande measurements of the solar neutrino flux. Astrophys. J. 2003, 594, 1102–1107. [Google Scholar] [CrossRef] [Green Version]
- Steinitz, G.; Piatibratova, O.; Kotlarsky, P. Possible effect of solar tides on radon signals. J. Environ. Radioact. 2011, 102, 749–765. [Google Scholar] [PubMed]
- Sturrock, P.A.; Steinitz, G.; Fischbach, E. Analysis of gamma radiation from a radon source. II: Indications of influences of both solar and cosmic neutrinos on beta decays. Astropart. Phys. 2018, 100, 1–12. [Google Scholar] [CrossRef]
Figure 1.
(a,b) Histograms of midnight Geological Survey of Israel (GSI) gamma measurements without (a) and with (b) rank-order normalization (RONO) normalization. (c,d) Power spectrum formed from the 4-h band of measurements centered on midnight for the frequency band 0–6 year−1 based on raw data (c) and on RONO-normalized data (d).


Table 1.
The frequency and power of the top 20 peaks in power spectra formed from GSI night-time data for the frequency range 0–6 year−1, as computed from the raw (i.e., un-normalized) data and from the RONO-normalized data.
Table 1.
The frequency and power of the top 20 peaks in power spectra formed from GSI night-time data for the frequency range 0–6 year−1, as computed from the raw (i.e., un-normalized) data and from the RONO-normalized data.
| Frequency (year−1) Based on Raw Data | Frequency (year−1) Based on RONO-Normalized Data | Power Based on Raw Data | Power Based on RONO-Normalized Data |
|---|---|---|---|
| 0.09 | 0.09 | 107.00 | 116.22 |
| 0.21 | 0.21 | 178.84 | 209.20 |
| 0.34 | 0.34 | 557.90 | 590.98 |
| 0.47 | 0.48 | 223.05 | 243.42 |
| 0.59 | 0.59 | 44.82 | 45.52 |
| 0.70 | 0.70 | 105.21 | 114.16 |
| 1.00 | 1.00 | 467.52 | 486.10 |
| 1.14 | 1.14 | 166.00 | 170.08 |
| 1.23 | 1.23 | 74.19 | 79.69 |
| 1.34 | 1.34 | 76.62 | 75.78 |
| 1.66 | 1.66 | 73.76 | 63.83 |
| 1.85 | 1.85 | 230.60 | 239.99 |
| 2.00 | 2.00 | 2019.66 | 2101.73 |
| 2.16 | 2.16 | 63.70 | 63.50 |
| 2.68 | 2.68 | 56.15 | 62.45 |
| 3.01 | 3.01 | 139.04 | 132.21 |
| 3.14 | 3.14 | 52.87 | 52.70 |
| 3.77 | 3.77 | 44.92 | 46.34 |
| 4.81 | 4.81 | 97.37 | 105.07 |
| 5.57 | 5.57 | 78.37 | 84.98 |
© 2020 by the authors. Licensee MDPI, Basel, Switzerland. This article is an open access article distributed under the terms and conditions of the Creative Commons Attribution (CC BY) license (http://creativecommons.org/licenses/by/4.0/).
Share and Cite
MDPI and ACS Style
Sturrock, P.; Scholkmann, F. The RONO (Rank-Order-Normalization) Procedure for Power-Spectrum Analysis of Datasets with Non-Normal Distributions. Algorithms 2020, 13, 157. https://0-doi-org.brum.beds.ac.uk/10.3390/a13070157
AMA Style
Sturrock P, Scholkmann F. The RONO (Rank-Order-Normalization) Procedure for Power-Spectrum Analysis of Datasets with Non-Normal Distributions. Algorithms. 2020; 13(7):157. https://0-doi-org.brum.beds.ac.uk/10.3390/a13070157
Chicago/Turabian StyleSturrock, Peter, and Felix Scholkmann. 2020. "The RONO (Rank-Order-Normalization) Procedure for Power-Spectrum Analysis of Datasets with Non-Normal Distributions" Algorithms 13, no. 7: 157. https://0-doi-org.brum.beds.ac.uk/10.3390/a13070157
Note that from the first issue of 2016, this journal uses article numbers instead of page numbers. See further details here.