
Image Representation Using Stacked Colour Histogram

1
School of Information and Software Engineering, University of Electronic Science and Technology of China, Chengdu 610054, China
2
Department of Computer Science and Informatics, University of Energy and Natural Resource, Sunyani 00233, Ghana
*
Authors to whom correspondence should be addressed.
Algorithms 2021, 14(8), 228; https://0-doi-org.brum.beds.ac.uk/10.3390/a14080228
Submission received: 27 June 2021
/
Revised: 20 July 2021
/
Accepted: 26 July 2021
/
Published: 30 July 2021
Abstract
:Image representation plays a vital role in the realisation of Content-Based Image Retrieval (CBIR) system. The representation is performed because pixel-by-pixel matching for image retrieval is impracticable as a result of the rigid nature of such an approach. In CBIR therefore, colour, shape and texture and other visual features are used to represent images for effective retrieval task. Among these visual features, the colour and texture are pretty remarkable in defining the content of the image. However, combining these features does not necessarily guarantee better retrieval accuracy due to image transformations such rotation, scaling, and translation that an image would have gone through. More so, concerns about feature vector representation taking ample memory space affect the running time of the retrieval task. To address these problems, we propose a new colour scheme called Stack Colour Histogram (SCH) which inherently extracts colour and neighbourhood information into a descriptor for indexing images. SCH performs recurrent mean filtering of the image to be indexed. The recurrent blurring in this proposed method works by repeatedly filtering (transforming) the image. The output of a transformation serves as the input for the next transformation, and in each case a histogram is generated. The histograms are summed up bin-by-bin and the resulted vector used to index the image. The image blurring process uses pixel’s neighbourhood information, making the proposed SCH exhibit the inherent textural information of the image that has been indexed. The SCH was extensively tested on the Coil100, Outext, Batik and Corel10K datasets. The Coil100, Outext, and Batik datasets are generally used to assess image texture descriptors, while Corel10K is used for heterogeneous descriptors. The experimental results show that our proposed descriptor significantly improves retrieval and classification rate when compared with (CMTH, MTH, TCM, CTM and NRFUCTM) which are the start-of-the-art descriptors for images with textural features.
1. Introduction
The success of the Content-Based Image Retrieval (CBIR) system hinges mainly on the efficacy of the descriptors used to represent images. Colour, shape and texture are widely used image descriptors [1]. Most CBIR methods depend to a large extent on the colour and texture of the image. Colour Histogram is the easiest method to use to represent the colour features for a CBIR task [2,3]. A comprehensive survey on colour histogram image retrieval is given in [4,5,6,7,8,9,10]. The most significant advantages of the colour histogram are the simplicity [10], fast computation [11] and robustness to rotations and transformations on the image [12]. However, it cannot handle spatial information of colours [13] in an image and therefore texture features extraction techniques are widely used to essentially extract this information from an image [14,15].
Texture descriptors are significant for bridging the semantic gaps in CBIR. Local binary patterns-based descriptors (LBP) [16,17], Gray-Level Co-occurrence Matrix (GLCM) [18], Gabor filter [14,18] and Hidden Markov random field [19] are widely used to extract texture information for the indexing of images. Texture descriptors have not always yielded optimal results; hence, combining them with other descriptors for effective CBIR is common practice. Combining colour and texture in a single descriptor is common even though shapes, colours, edge orientation and texture combination can also be found. Using the combination may employ either the fusion of feature vectors into one feature vector or the feature extraction approach having the inherent nature of extracting two or more features into a single image representation vector. The authors of [20] fused colour feature information and pixel orientation into an image representation vector, while [20,21,22,23,24,25] integrated both the colour and texture information in a single descriptor using textons. Textons are structural elements used to capture the run lengths in an image at a particular orientation. Textons generally produce good results. However, the structure of textons is somehow rigid, which sometimes leads to poor performance when the orientation of the images changes [26]. The changes also make the texton feature extractions produce different feature maps or vectors for the same image. Again, feature extraction approaches such as the bag-of-words, edge histograms, and GLCM incorporating neighbourhood or spatial information to extract feature information may be complicated to implement or too rigid at some point.
This paper proposes a new feature extraction technique that extracts colour and neighbourhood information into a descriptor for indexing images. The presented scheme sums several histograms generated from the transformation of images.
The contributions of this work are summarised as follows: (a) The proposed SCH method for an image representation vector can effectively deal with texture and colour heterogeneous images; (b) In the SCH method, the inherent colour extraction and neighbourhood information based on recurrent transformations provide more discrimination of colour and texture features; (c) The novel descriptor improves the image recognition rate with minimal memory space and retrieval time.
2. Related Works
Several approaches to image representation using colour and texture exist. In this section, five exceptionally related works that are relevant to the work are reviewed. Recent works are Texton Co-occurrence Matrix (TCM) [23], Multi-Texton Histogram (MTH) [27], Colour Difference Histogram (CDH) [24], Complete Texton Matrix (CTM) [28] and Complete Multi Texton Histogram [29] which are largely used to index images with more textural properties.
2.1. Texton Co-Occurrence Matrix (TCM)
Liu and Yang [23] developed TCM to measure texture in a given image. They developed a spatial correlation of pixels as a statistical function of textons to define features of an image. The outcome has shown that TCM provides more description of colour, texture and shape. However, TCM has been recommended for texture only, making it inappropriate for depicting a heterogeneous image dataset. More importantly, simplifying the TCM co-occurrence matrix into third-order moments will result in the loss of useful information.
2.2. Multi-Texton Histogram (MTH)
Minarno et al. [27] extended concept on the original work of TCM [23]. They put forward an enhanced version called Multi-Texton Histogram (MTH) [27]. The MTH represents heterogeneous images, unlike TCM, which extracts textural information only. MTH leverages the co-occurrence matrix and colour histogram strength as it contains information about the spatial relationship of colours and orientations of texture. In MTH, two adjacent pixels with the same colour should be in the same direction and vice versa. However, such assumptions are not always applicable. This assumption leads to other types of textons being disregarded in the image.
2.3. Colour Difference Histogram
Liu and Yang [24] proposed an image representation method called the colour difference histogram (CDH) for retrieving images. The CDH approach is an improved multi-texton histogram (MTH). The most significant improvement of the CDH is the perception of uniform colour differences in feature representation analogous to human colour perception. The paper achieves feature representation by combining colour, colour difference, orientation and spatial distribution in an image. The scheme used a vector size of 108 for image retrieval. A vector size of 108 means that the index requires relatively high memory space as compared with approaches that use sizes such as 48 and 64.
2.4. Complete Texton Matrix (CTM)
Kumari et al. [28] proposed a complete feature representation of heterogeneous images based on textons. The proposed CTM is derived from TCM and MTH. The paper used 11 textons to increase the information representation in the image, unlike the four textons used in TCM. The principle of CTM is fundamental. The image first quantises the original texture into 256 colours and calculates the gradient of RGB colour. Then, the statistical information of eleven derived textons on a 2 × 2 grid in a non-overlapped fashion are calculated to more accurately describe the image features. CTM does not include gradient or edge orientation information but is limited only to the texton co-occurrence matrix. This restriction results in weak representations at some points.
2.5. Complete Multi-Texton Histogram (CMTM)
Based on the works of [23,27,28], Khaldi et al. [29] proposed Complete Multi-Texton Histogram (CMTH). The CMTH method combined four texton-based features, namely MTH, TCM, CTM and NRFUCTM. Consequently, the combination resulted in Complete Multi Texton Histogram (CMTH) [29]. This scheme uses eleven textons to analyse the correlation between neighbouring textons, colour, and edge orientations. The movement of each texton on the image is time-consuming. In addition, many valuable texture patterns are unobserved due to the rigid structure of the textons [26].
3. Stacked Colour Histogram (SCH)
Spatial information is critical when extracting features for indexing images for retrieval tasks. This component is generally missing in feature extraction techniques such as the Conventional Colour Histogram (CCH), though this approach turns out to have the characteristics of being invariant to scale, rotation, and translations in mages. Colour Correlogram (CC), Colour Coherence Vector (CCV), Joint Histogram, Colour Moment (CM), Conventional Colour Histogram (CCH), Local Colour Histogram (LCH), Dominant Colour Descriptor (DCD), Colour Difference Histograms (CDH) are approaches that turn the spatial information into feature vectors used for representing images. The quest to integrate spatial information into a feature vector leads to two main challenges, which this work seeks to address:
- The feature vector used to represent images sometimes takes up too much space, which affects the retrieval speed.
- The approach used for the extraction may be rigid, which sometimes leads to poor performance when the orientation of images changes.
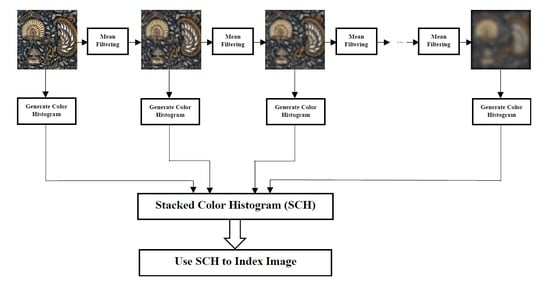
SCH is a summation of several histograms that are generated from the transformation of an image. In this work, mean filtering is used to transform images iteratively. The filtering, which employs a window size of n × n, is performed N times. In each instance of the filtering process, the output of the previous filtering is used as input to that of the current filtering processes. Histogram are generated from filtered images, and later added together to estimate the SCH. The filtering process proposed here uses neighbourhood information and therefore the estimated histogram contains information about the nature of pixels’ distribution in images.
The steps below present in detail the steps required to perform the recurrent filtering as well as the estimation of the histogram at each instant.
- 1I ← Read an image
- 1H ← Histogram of Image (1I)
- 2I ← Mean Filter (1I)
- 2H ← Histogram of Image (2I)
- 3I ← Mean Filter (2I)
- 3H ← Histogram of Image (3I)
- 4I ← Mean Filter (3I)
- 4H ← Histogram of Image (4I)
- .
- .
- .
- NI. ← Mean Filter (N-1I)
- NH ← Histogram of Image (NI.)
The steps generate N histograms. If all the histograms are stored in a matrix H, with the number of bins in the histograms as number of columns and the number of histograms as the number of rows on the matrix, the SCH will be a vector defined as V = (V1, V2, V3, …, Vm). The respective Vi can be computed using Equation (1).
where
- H: A matrix containing all the histograms.
- V: Vector
- n: Number of Histograms (Number of rows on the matrix H)
- m: Number of Histogram bins (Number of columns on the Matrix H)
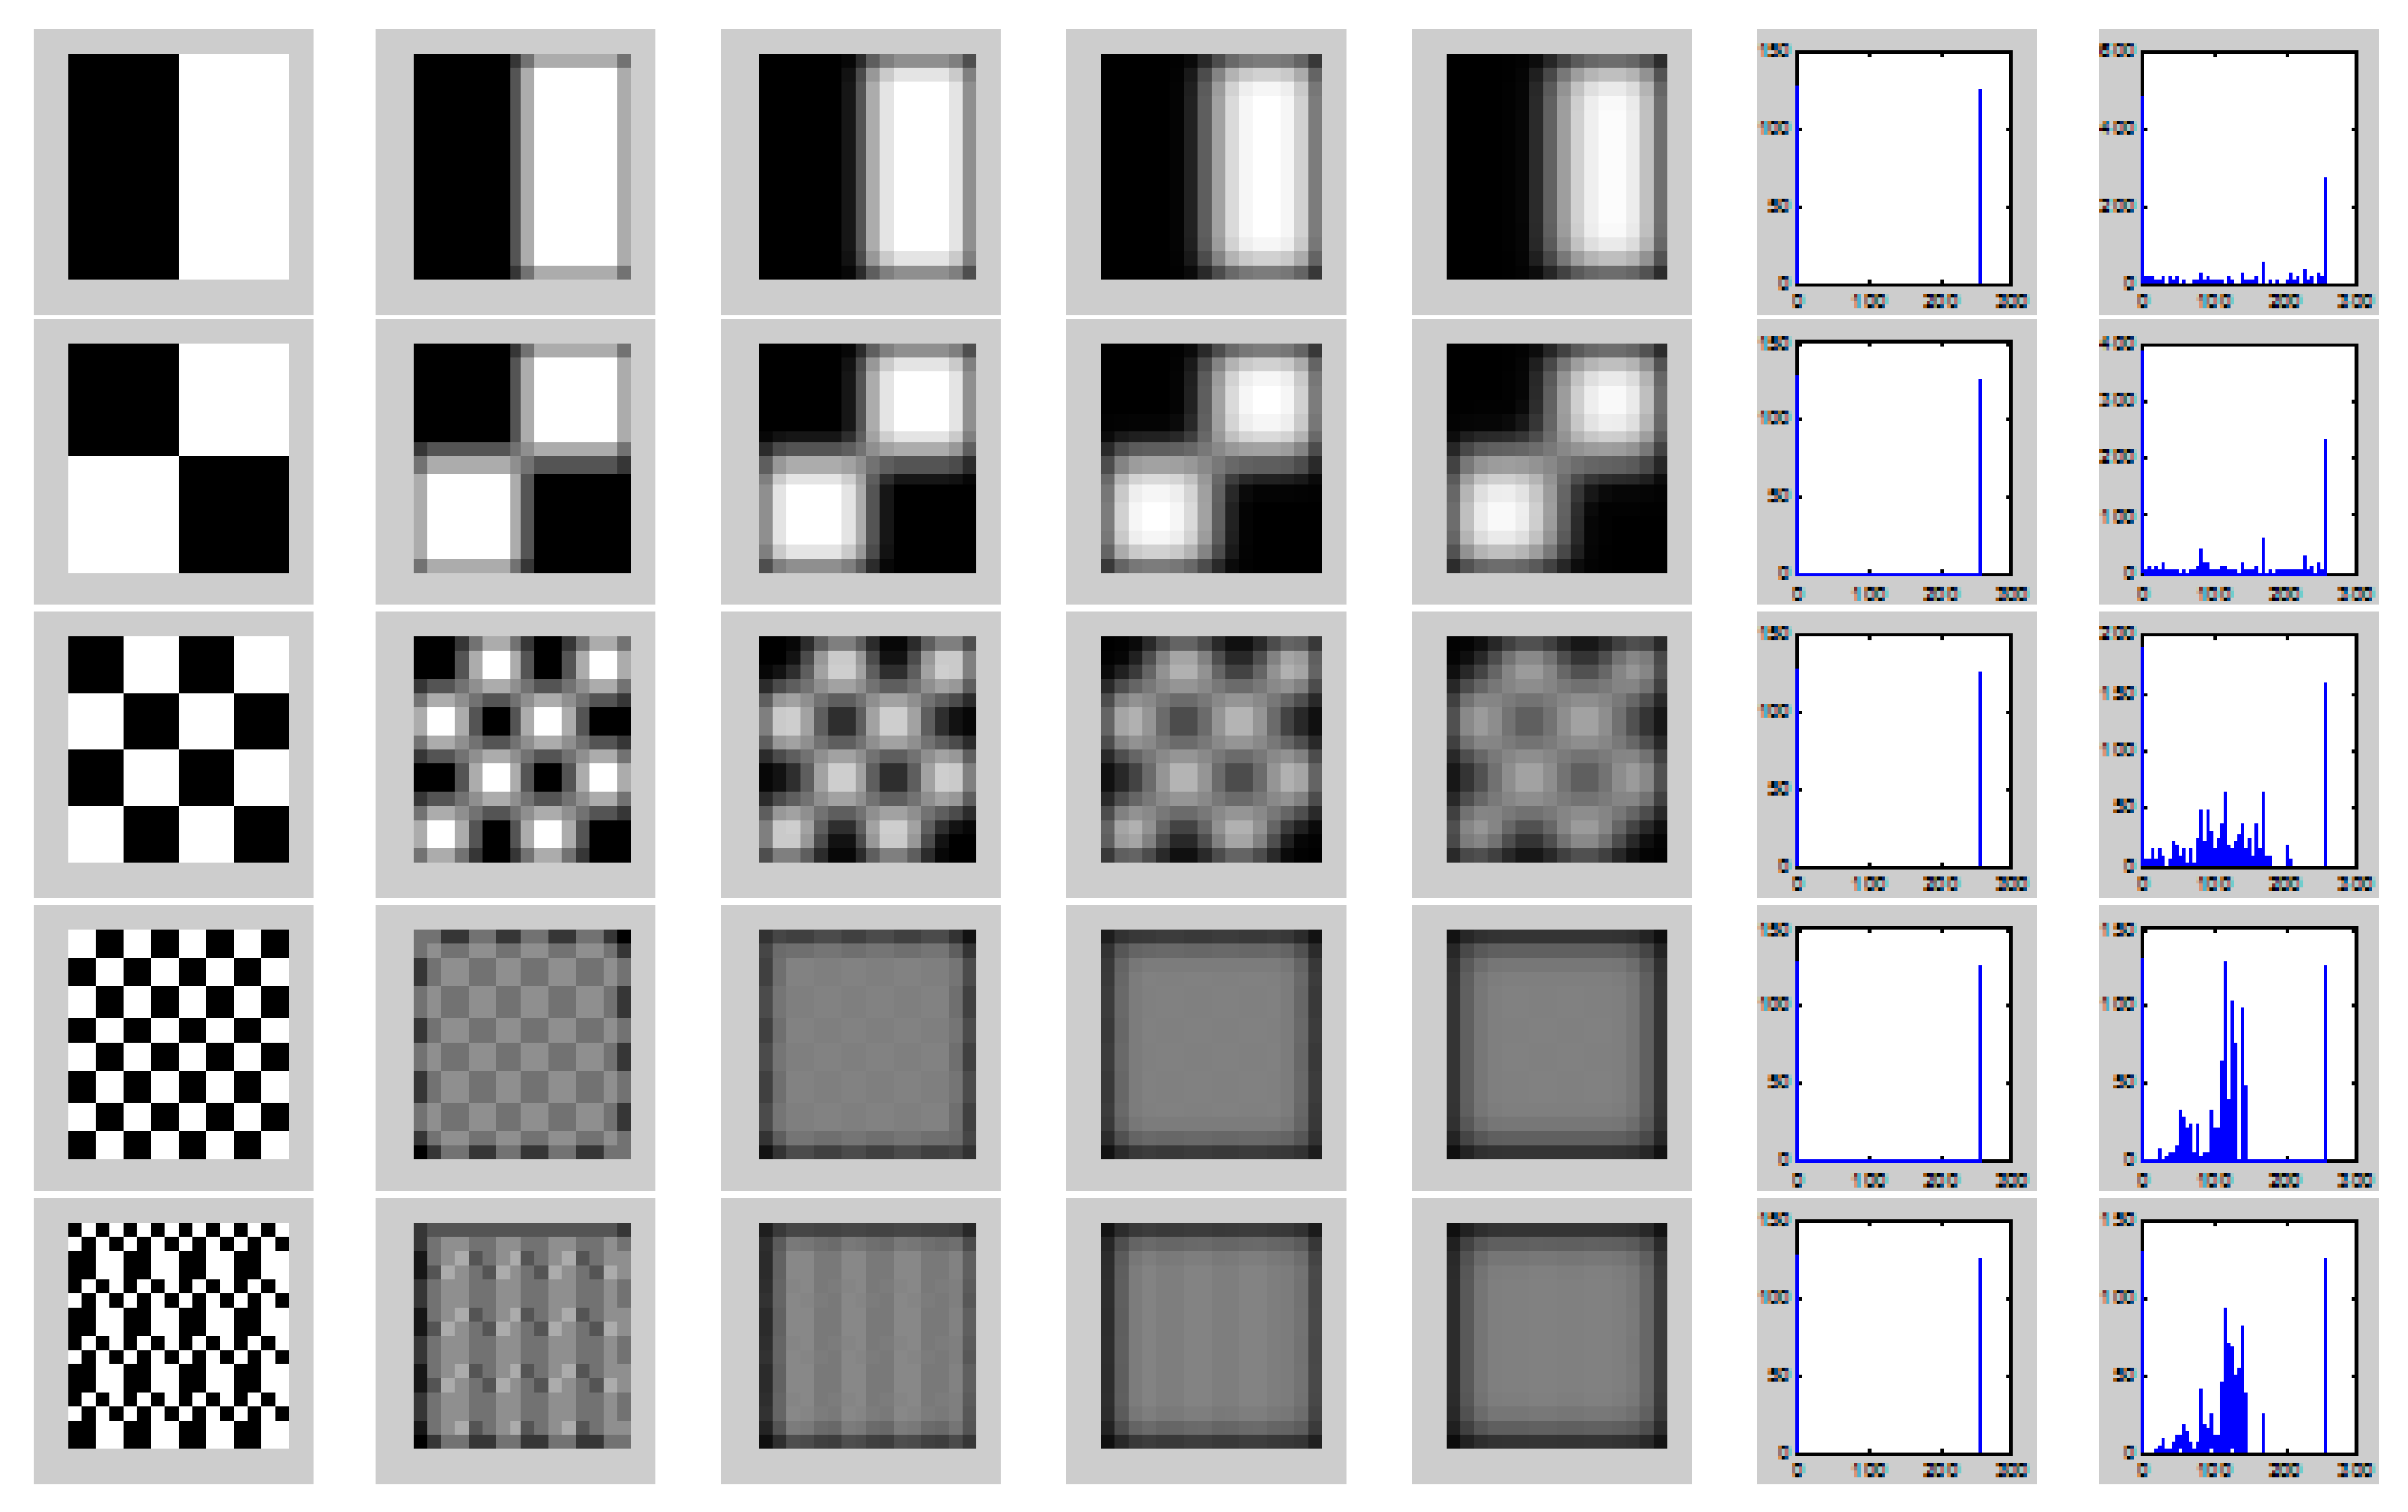
Images are represented using the SCH in the database. The recurrent filtering transform images into new ones in which images with fewer edges are not transformed significantly. This means that images with large homogeneous sections are not transformed significantly, thereby having a local histogram that is similar to or the same as the original image. Images with the same histogram before the transformation will have different subsequent histograms if the distribution of pixels does not exhibit homogeneous characteristics. Therefore, the shape of the SCH for images with a similar spatial distribution of pixel values will be similar. Figure 1 presents five different images with the same histogram. The last column of Figure 1 presents the SCH of the respective images. All the images exhibit different SCH shapes, which can help to uniquely represent these images.
| Algorithm 1. Stacked Colour Histogram Algorithm |
| 1. I ← Read an image |
| 2. sH (J) // Histogram with J bins. Initialize with Zeros. |
| 3 count ← N // N is the number of times the filtering of image is to be done. |
| 4. while (count > 1) |
| 5. H(J) ← Extract histogram of image I |
| 6. sH(binIndex) = sH(binIndex) + H(binIndex) |
| 7. while (binIndex > 1) |
| 8. sH(binIndex) = sH(binIndex) + H(binIndex) |
| 9. binIndex = binIndex − 1 |
| 10. I← Mean Filter (I) and assign to I. //Perform mean filtering of the image in variable I |
| 11. count = count – 1 |
| 12. Store sH as Index for the read image. |
4. Experimental Evaluation
In this section, we demonstrate the performance of the SCH method using four datasets (Batik, Coil100, Outext, and Corel10K). The Batik, Coil100 and Outext datasets are used to evaluate SCH in differentiating texture images. The Corel10K dataset is used to evaluate the heterogeneous image recognition capabilities of the proposed method.
Below is a concise description of datasets.
- −
- Batik [30] dataset contains 300 images in total. There are 50 classes and each class contains six images. The images are of 128x128 pixels sizes in JPEG format.
- −
- Coil100 [31] dataset contains 7200 colour images categorised into 100 classes. There are 72 images of each object in different poses in each class.
- −
- Outext [32] dataset contains 11,484 total images. The image database is categorised into 29 classes.
- −
- Corel10K [33] dataset contains 10,000 images in total. There are 100 classes and each class contains 100 images. The images are sized 128 × 192 pixels in JPEG format.
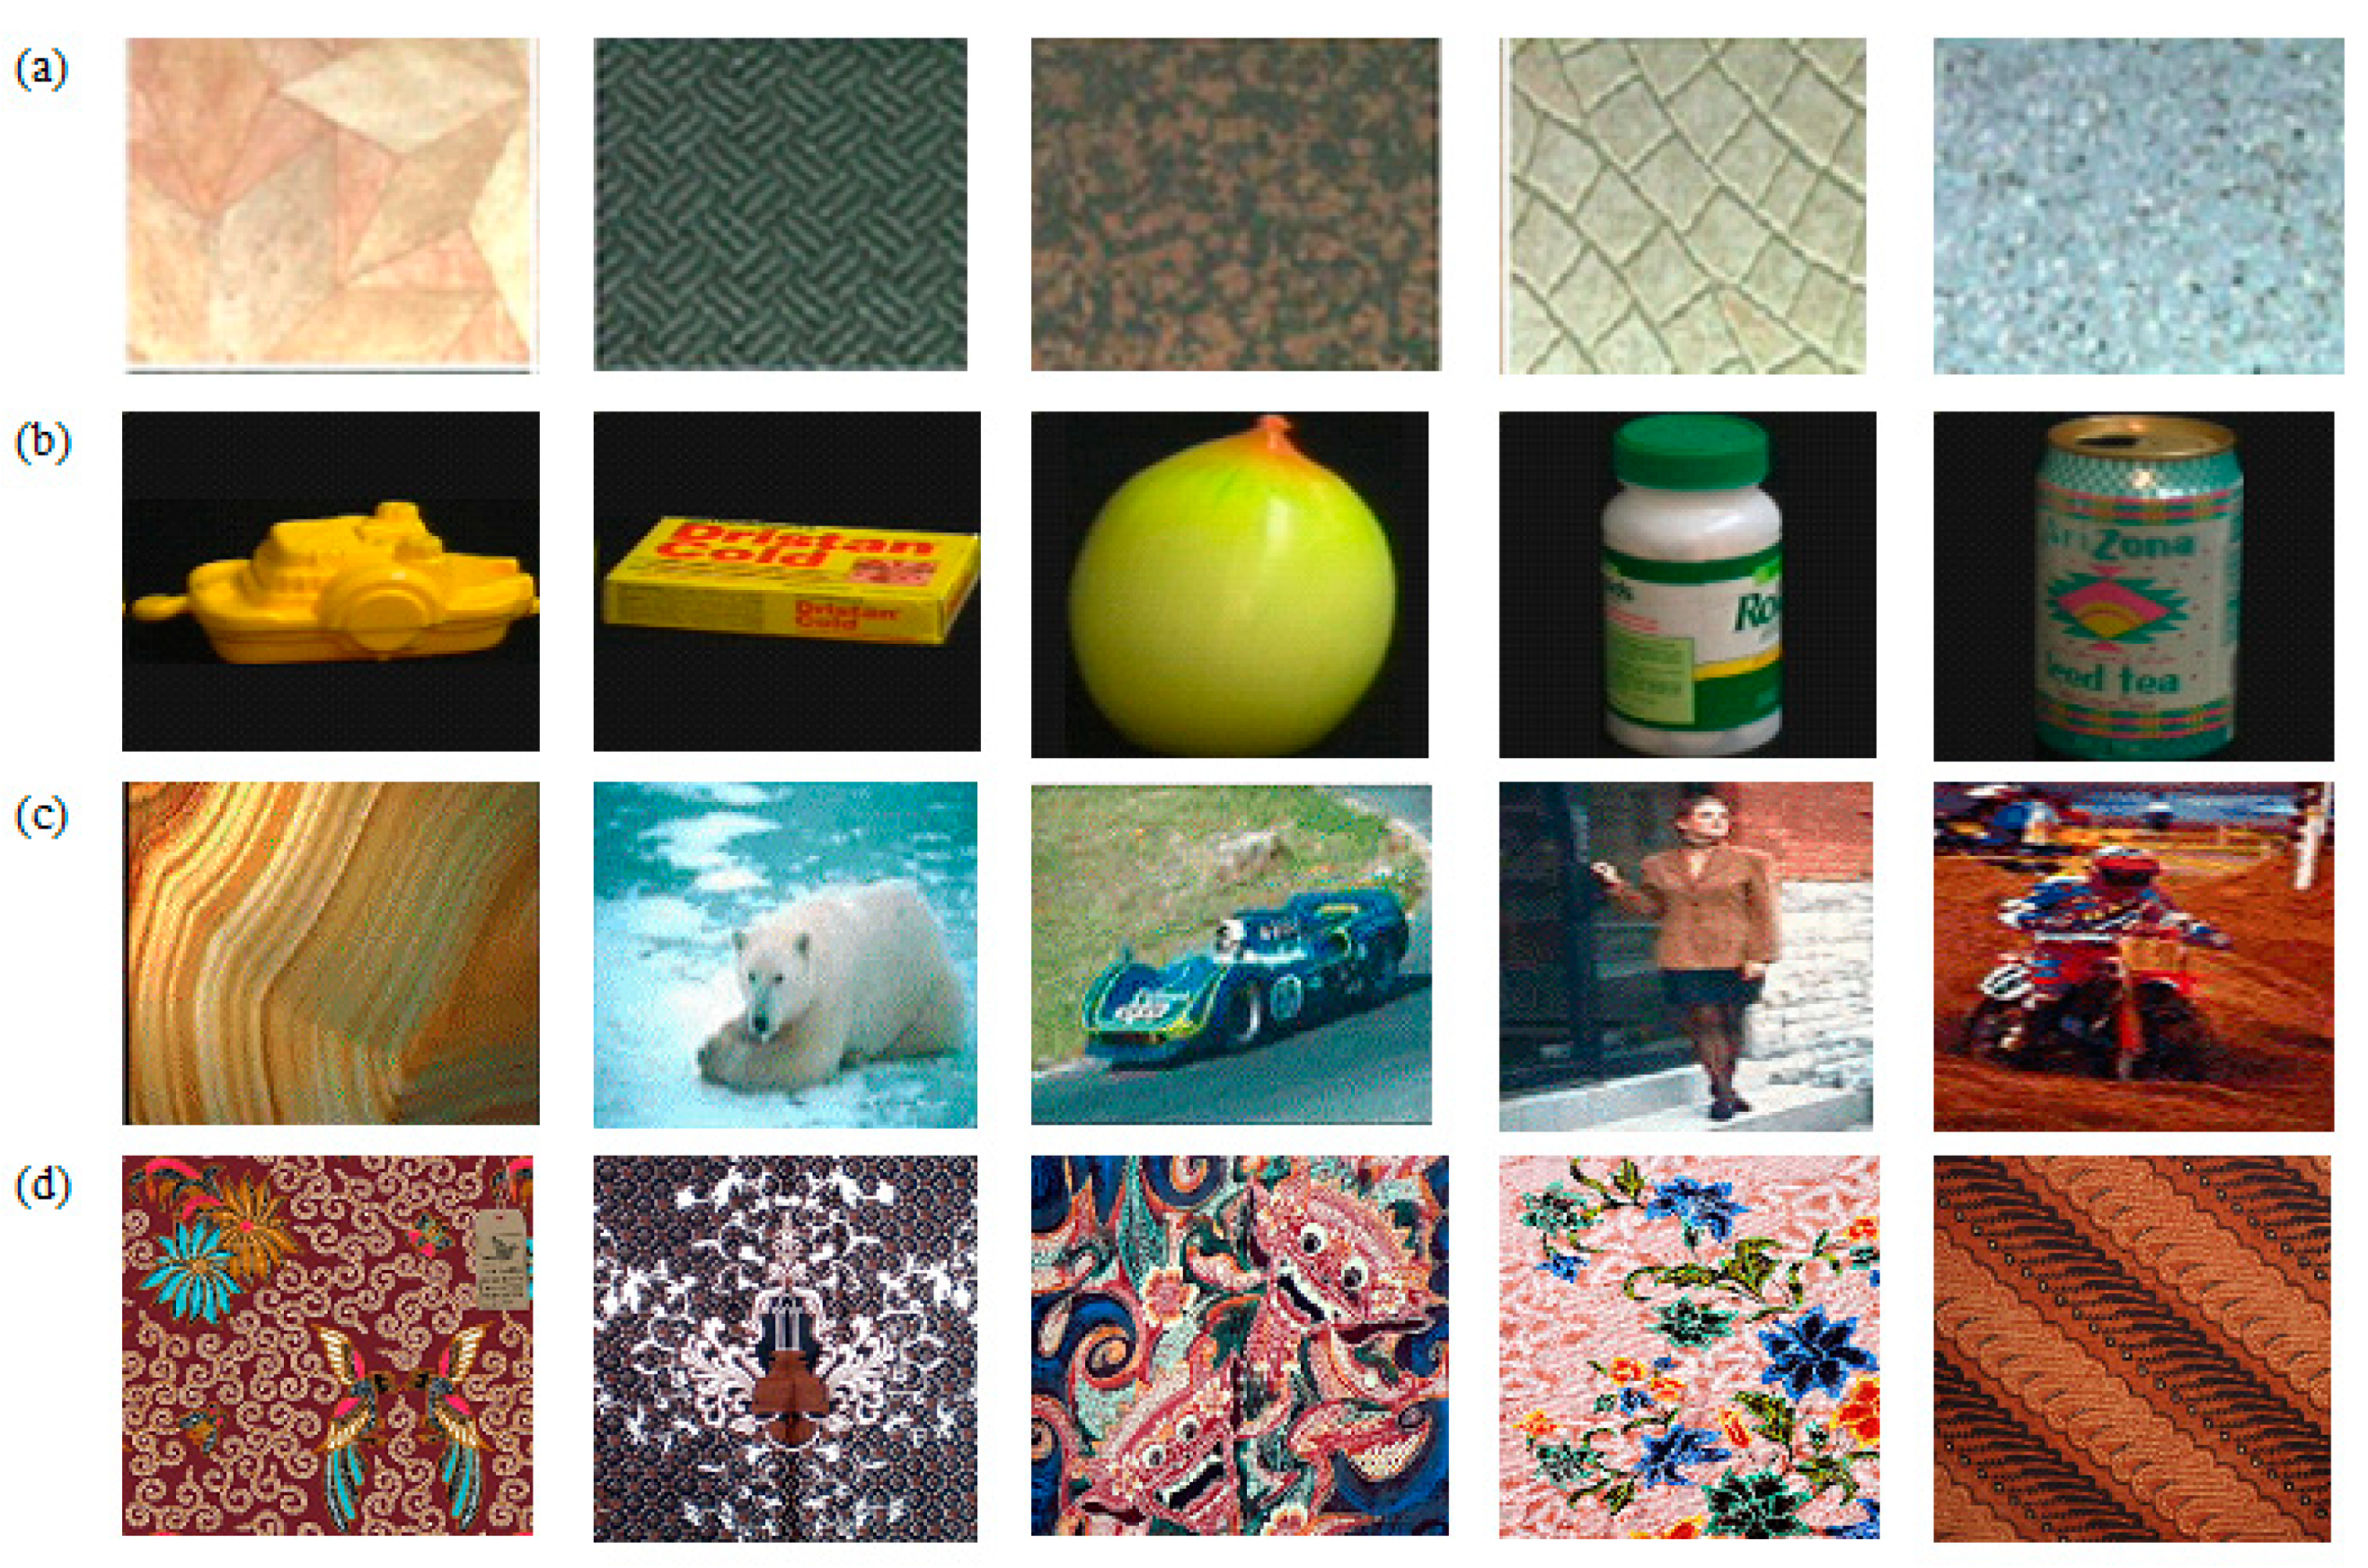
Sample images from each dataset are illustrated in Figure 2.
The initial experiment evaluated the accuracy of window sizes and recurrent transformations using different classifiers and different dataset features. Window sizes of 3 × 3, 5 × 5, 7 × 7, 9 × 9 and 11 × 11 and the numbers of recurrent transformations of 5, 10, 15, 20 and 25 were used for extracting features for this experiment [34].
4.1. Machine Learning Approach for Evaluation
K-fold cross-validation was performed to avert the over-fitting of the data during the process of training. The different classifiers with K-fold cross-validation (k = 5) were used to evaluate the performance on multiple and different features of datasets. Using Principal Component Analysis (PCA), we reduced the feature sizes to speed up computation, setting the threshold to 95%.
Five different classifiers, namely Discriminant Analysis Classifier (DAC), Support Vector Machine (SVM), Naive Bayes (NB), Decision Tree (DT) and KNN (k-Nearest Neighbours) were used to classify images from each dataset. The classification accuracy metric is used to measure the performance of classifiers. Equation (2) indicates the mathematical expression for classification accuracy.
4.2. Image Retrieval
In this section, the proposed descriptor is evaluated in a classical CBIR task. Precision and recall metrics are used to evaluate the proposed descriptor’s performance in the CBIR task. Equations (3) and (4) present the formulae for the precision and recall metrics, respectively.
We first present the results of the machine learning approach used for the experiment.
Table 1 provides accurate results of the DCA classifier on all datasets. The window size 11 × 11 with the recurrent transformation of 5 provided the highest accuracy of 91% for Coil100. All window sizes with the recurrent transformation of 5 gave 36% accuracy as highest for Corel10K. The window sizes 7 × 7 and 9 × 9 with the recurrent transformation of 5 produced 67% accuracy for the Outext dataset. The mean accuracy of 87.64%, 32.72%, and 64.24% was recorded for Coil100, Corel10K and Outext datasets, respectively.
Table 2 displays the accuracy results of the SVM classifier on all datasets. The window size 11 × 11 with the recurrent transformations of 15, 20 and 25 yielded the highest accuracy of 97% for Coil100. The window size 11 × 11 with the recurrent transformation of 5 produced an accuracy of 43% as the highest for Corel10K. The window sizes 3 × 3, 5 × 5 and 7 × 7 with the recurrent transformations of 15, 20 and 25 produced 78% accuracy for the Outext dataset. Mean accuracies of 95.16%, 40.96%, and 77.08% were recorded for the Coil100, Corel10K and Outext datasets, respectively.
Table 3 presents accuracies obtained by applying the NB classifier on all datasets. Most 9 × 9 and 11 × 11 window sizes with the recurrent transformations of 15, 20 and 25 produced the highest accuracy of 92% for Coil100. The window sizes 5 × 5 and 11 × 11 with the recurrent transformations of 15 and 25 produced an accuracy of 36% as the highest for Corel10K. The window size 3 × 3 with the recurrent transformations of 15 and 20 produced 64%, whereas window size 5 × 5 with the recurrent transformation of 5 produced the same accuracy for the Outext dataset. The mean accuracies for Coil100, Corel10K, and Outext were 89.96%, 34.28%, and 61.08%, respectively.
Table 4 shows the accuracy outcomes by applying the DT classifier on all datasets. The window size 11 × 11 with the recurrent transformations of 15 and 25 produced the highest accuracy of 92% for Coil100. The window sizes 5 × 5 and 11 × 11 with the recurrent transformations of 15 and 25 produced an accuracy of 24% as the highest for Corel10K. The window size 5 × 5 with the recurrent transformations of 20 and 25 produced 79% accuracy for the Outext dataset. Mean accuracies of 88.96%, 22.96%, and 76.32% were recorded for the Coil100, Corel10K, and Outext datasets.
From Table 1, Table 2, Table 3 and Table 4, generally window size 11 × 11 with the recurrent transformations of 15, 20 and 25 produced good results for the four different classifiers. Khaldi et al. [29] in their work “Image representation using complete multi-texton histogram”, compared their results with the state-of-the art texture feature extraction techniques for indexing images or representing images. The Texton Co-occurrence Matrix (TCM), Multi-Texton Histogram (MTH), Complete Texton Matrix (CTM), Complete Multi-Texton Histogram (CMTH), and Noise Resistant Fundamental Units of Complete Texton Matrix (NRFUCTM) were compared in the paper.
Table 5 presents the results of accuracy obtained by Khaldi et al. The result compared for four different classifiers, namely Discriminant Analysis Classifier (DAC), Support Vector Machine (SVM), Naive Bayes (NB) and Decision Tree (DT) for well-established texton-based feature extraction techniques. The texton-based features presented by Khaldi et al. had worse performance in representing heterogeneous images. Our proposed SCH outperform the textons (i.e., CMTH yields 31.76% with Corel10K. However, our method SCH outperform with 32.72% for DAC).
Additionally, our method SCH remarkably represents textures and shows high performances in classifying Outext (i.e., SCH yields 64.24%, which far outperforms CMTH with 42.34% for DAC).
We conducted another evaluation using the KNN classifier on all datasets. The mean accuracies when k = 1, 96%, 31.80%, 77.63% were recorded for Coil100, Corel10K, and Outext datasets, respectively. When k = 3, 95%, 31.35%, 77.33% were recorded for Coil100, Corel10K, and Outext datasets, respectively. When the value of k = 5, 94%, 34.03%, 76.04% were recorded for Coil100, Corel10K, and Outext datasets, respectively. Lastly, using k = 9 recorded 94%, 31.93%, 77.19% for Coil100, Corel10K, and Outext datasets, respectively. Table 6 clearly shows the obtained mean accuracies of the KNN classifier, with different values of k, on all datasets.
The results obtained were compared with texton-based features in [29]. The accuracy results of our SCH method denote better performance in representing heterogeneous images. Our method performs relatively well for texture images. Table 7 clearly shows the results of SCH together with that of the textons implemented by Khaldi et al. using different values of k (KNN’s parameter).
We Present the Results of the IMAGE Retrieval Below
The SCH is primarily proposed for indexing images for CBIR or QBIC. We evaluated proposed descriptor in a conventional CBIR task.
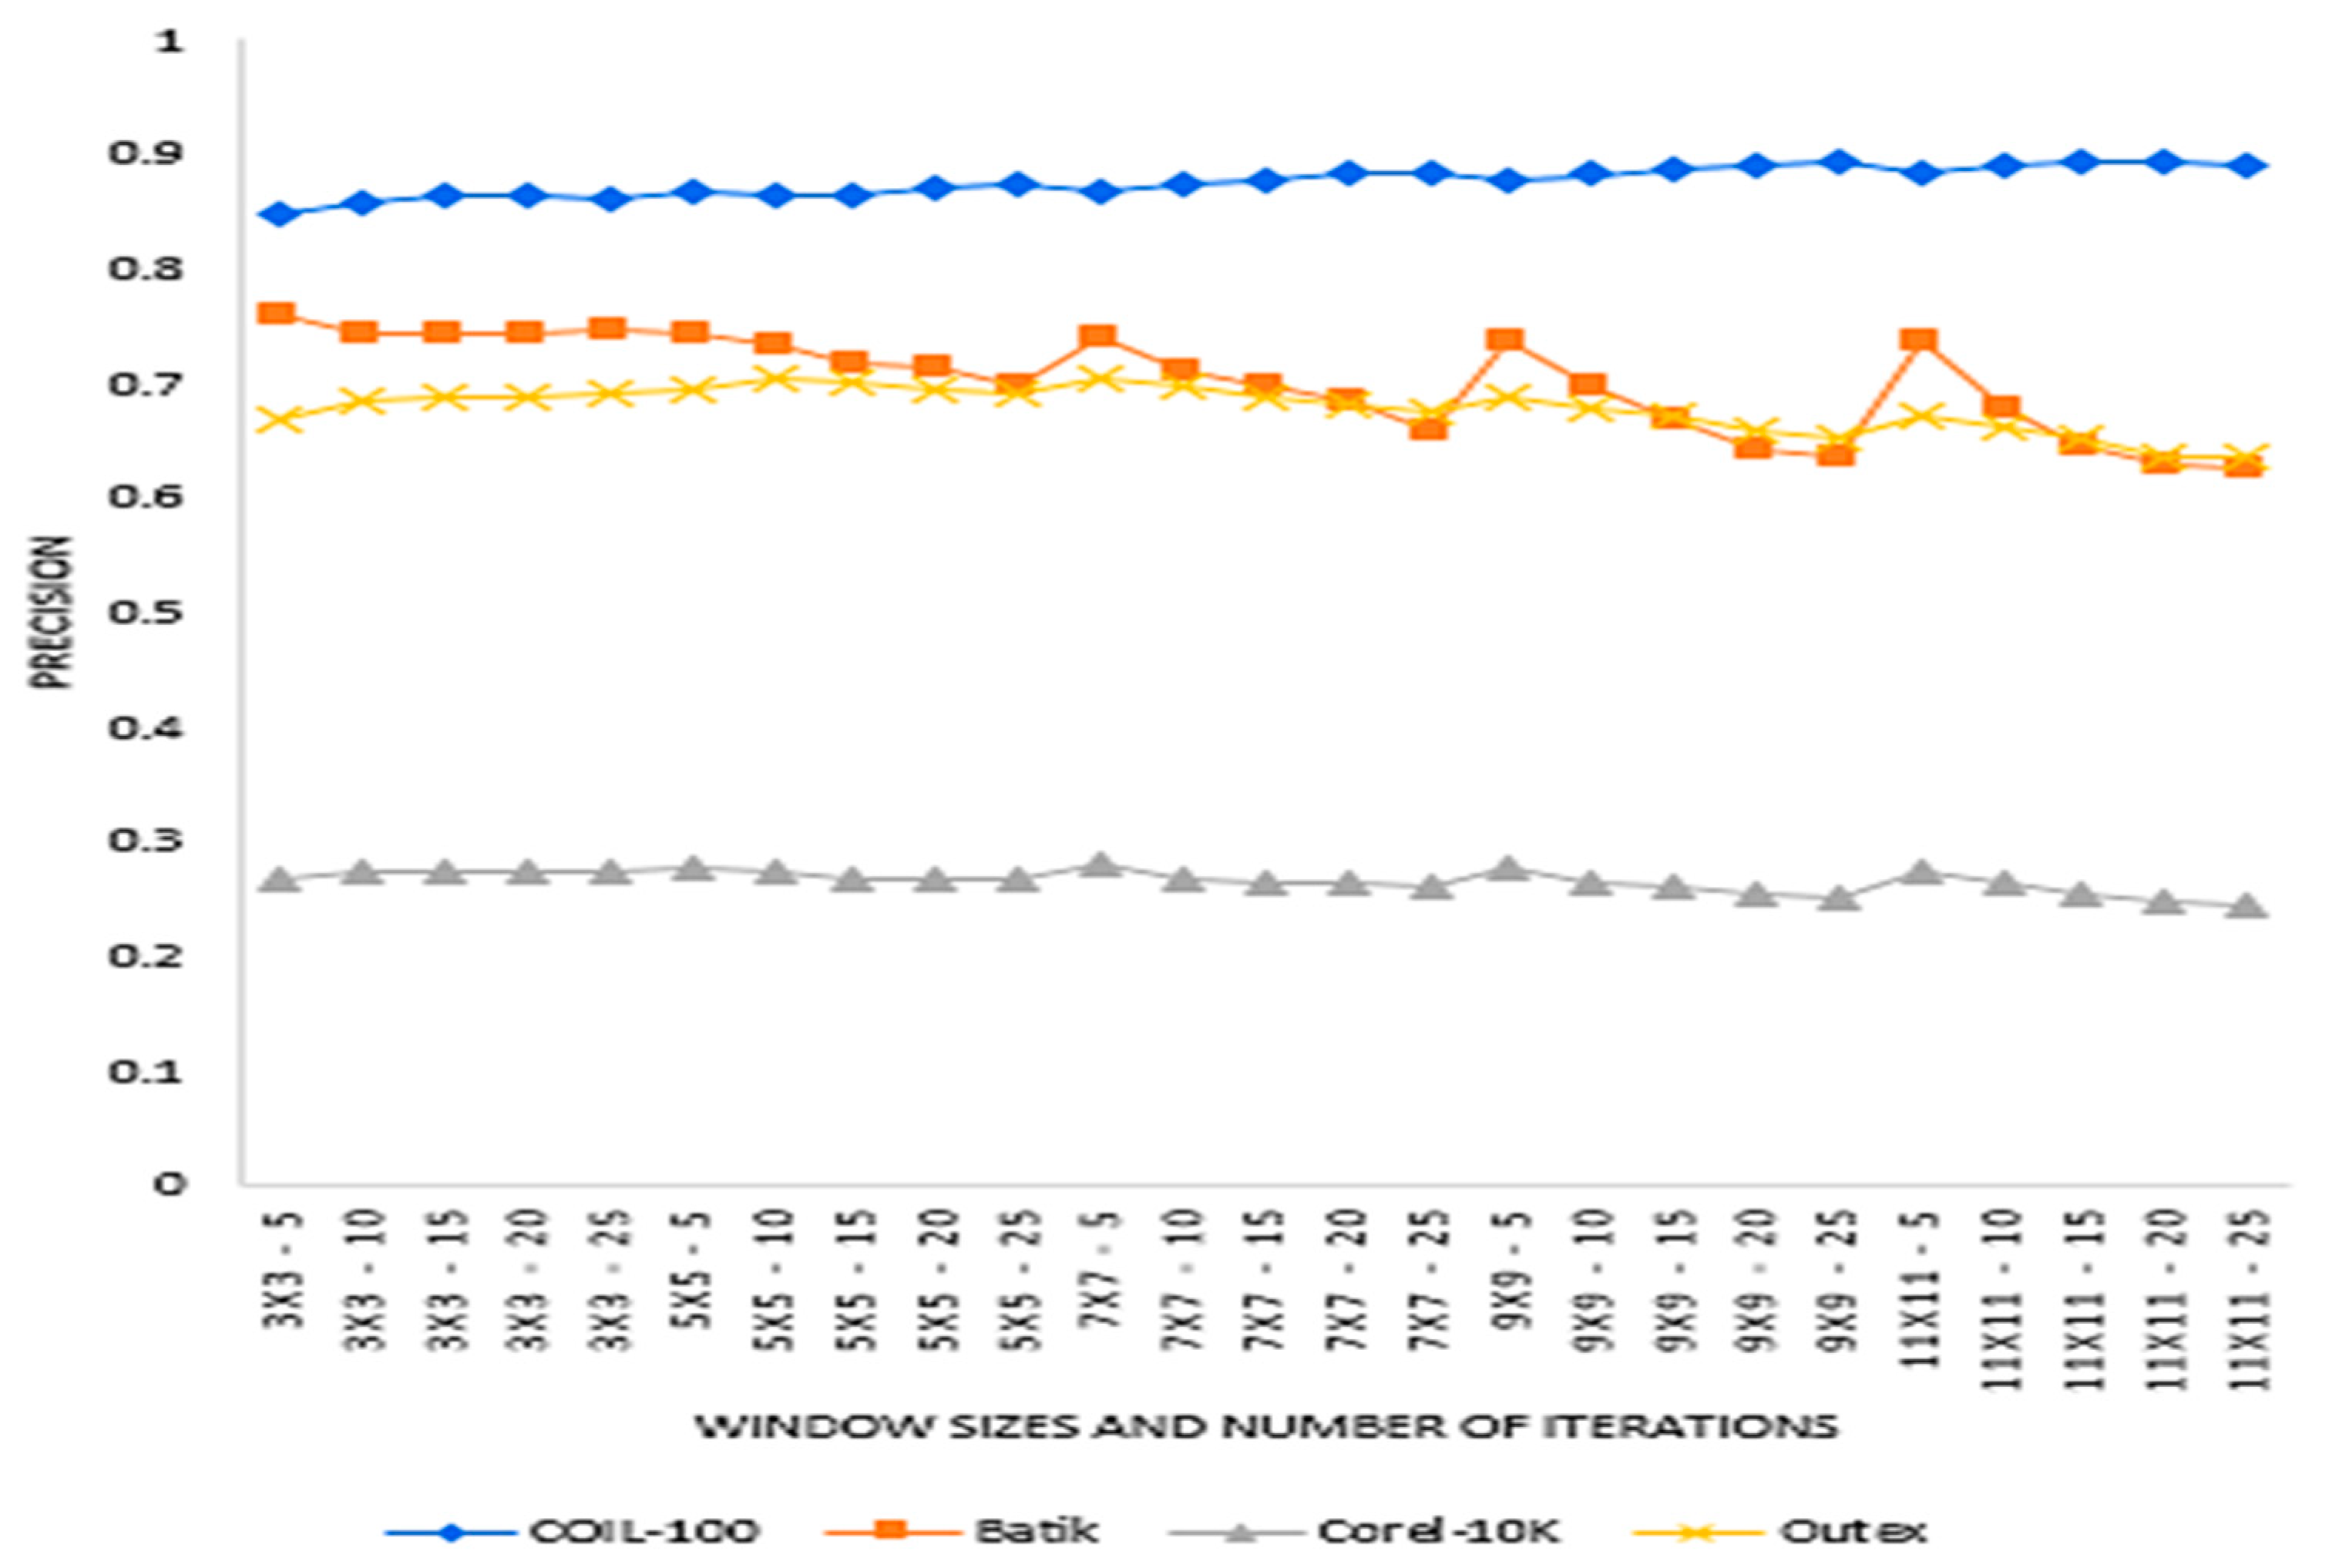
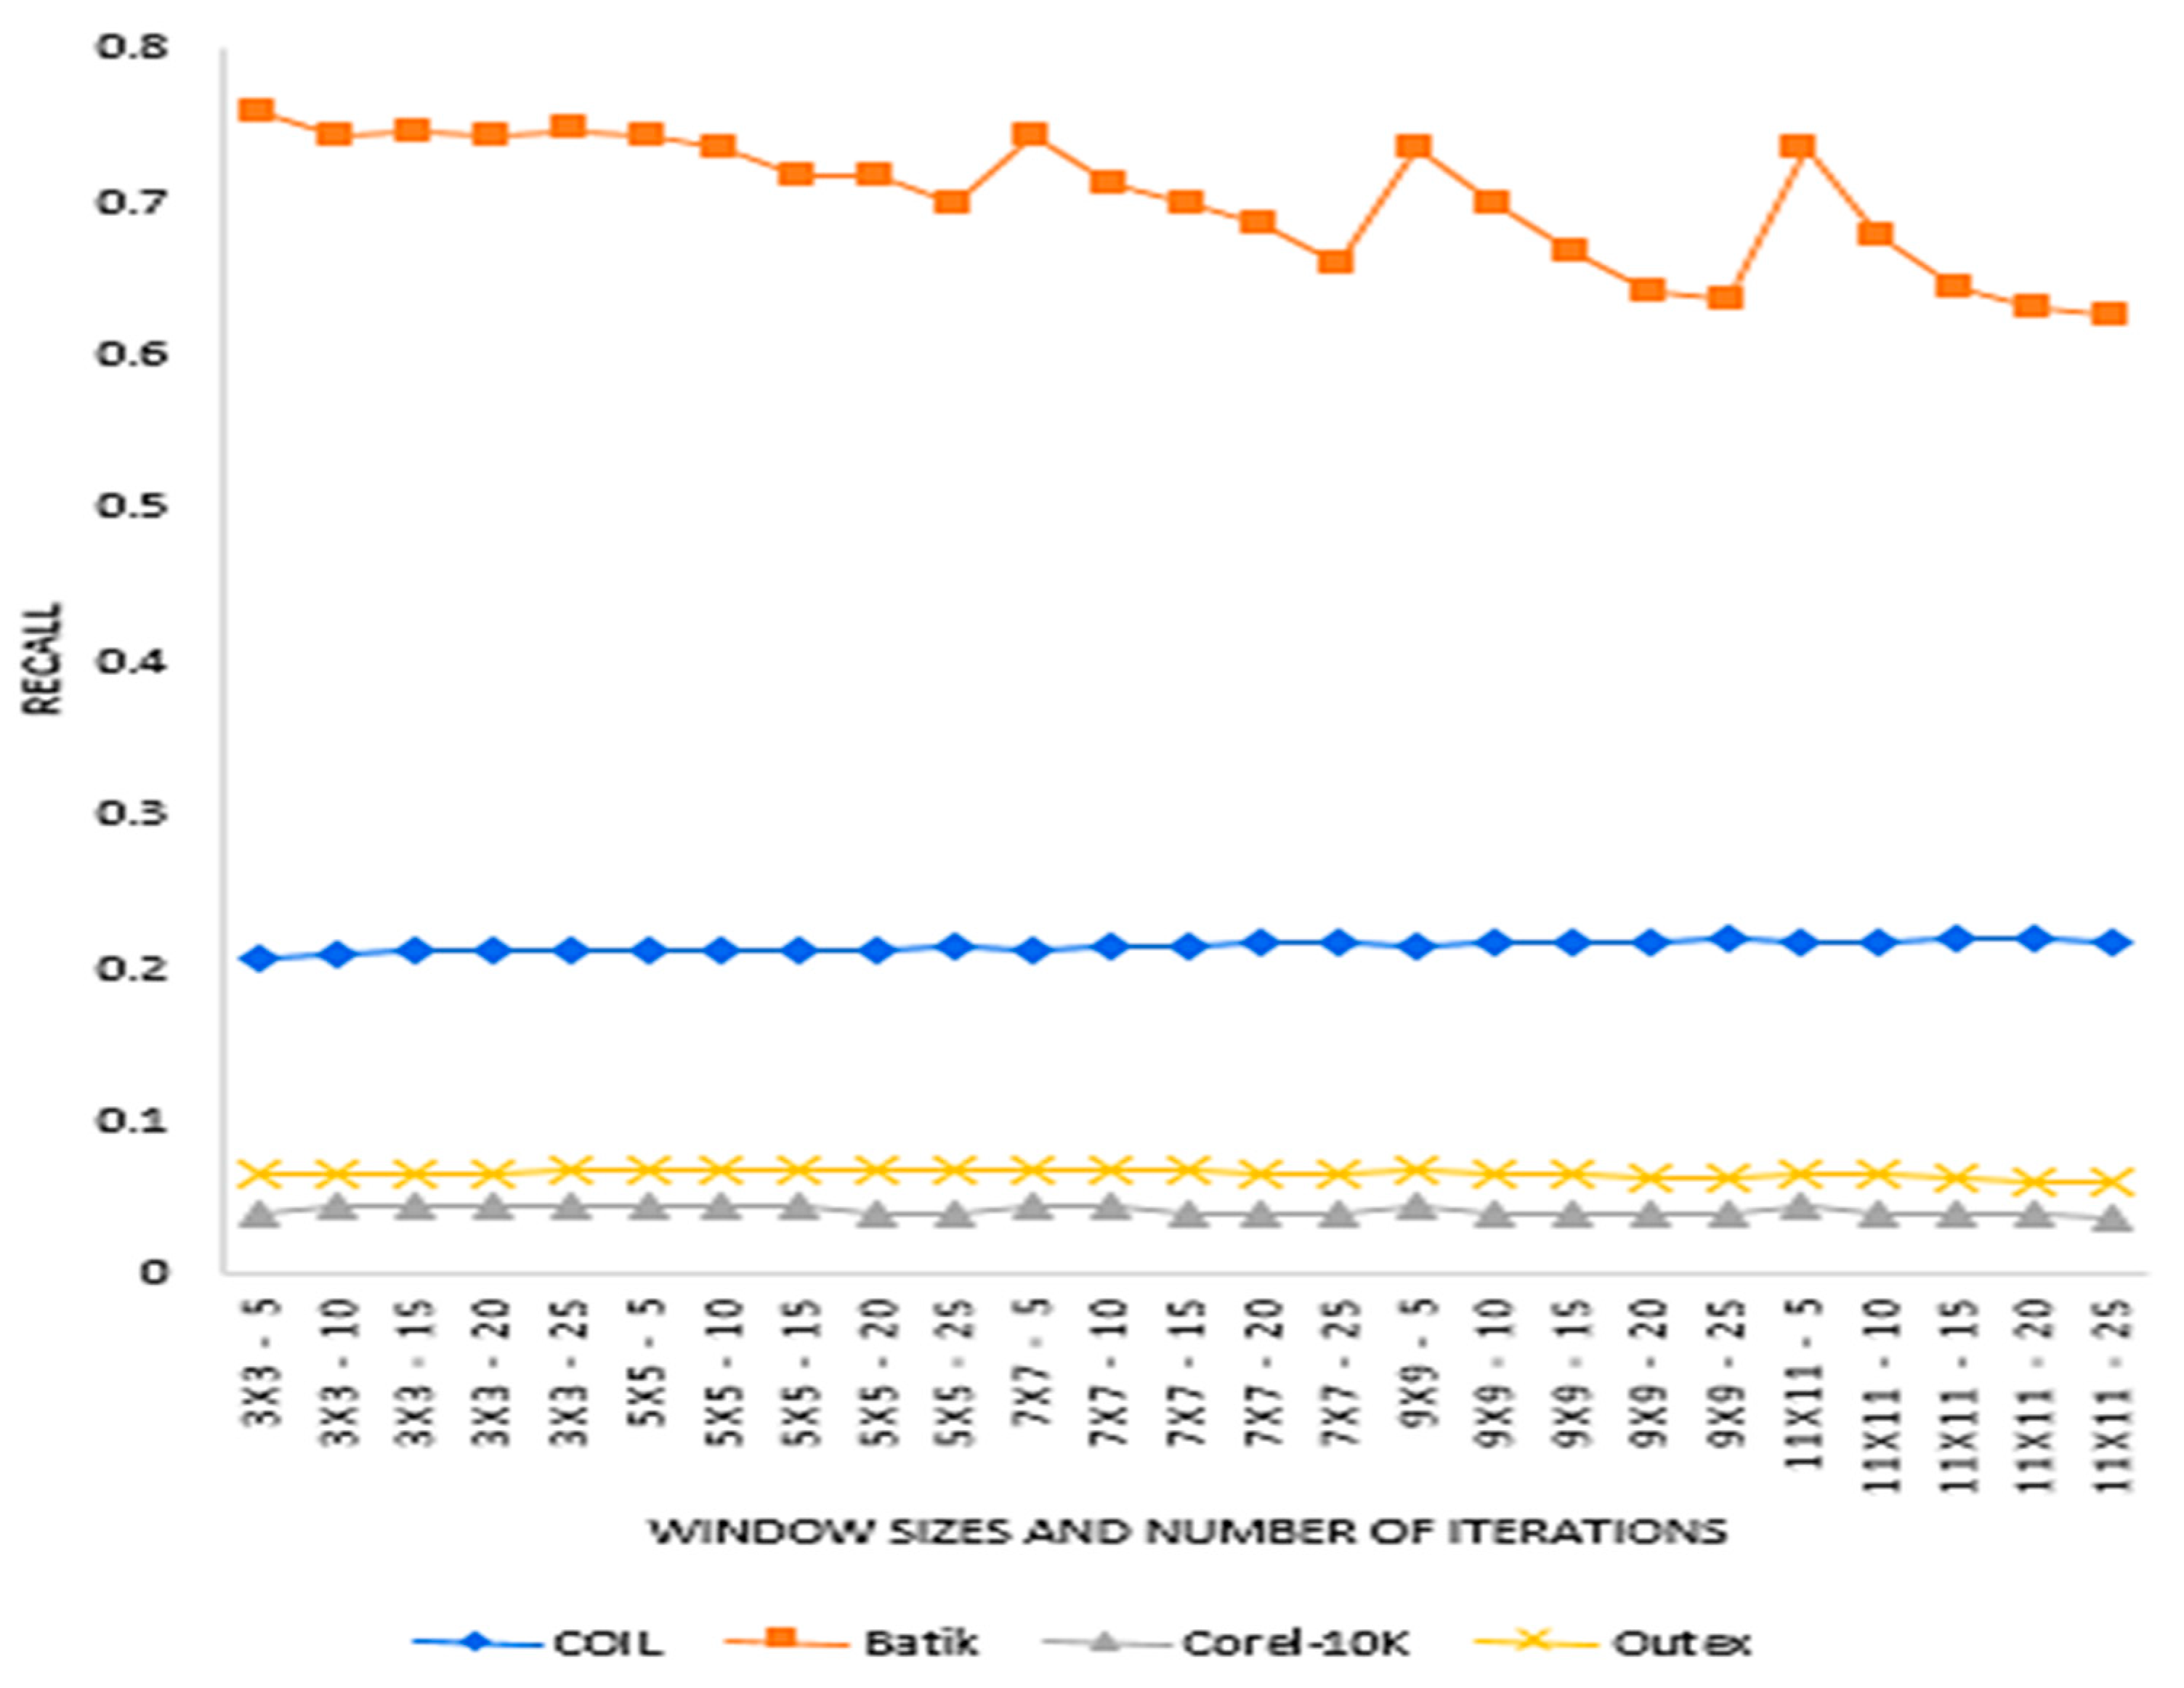
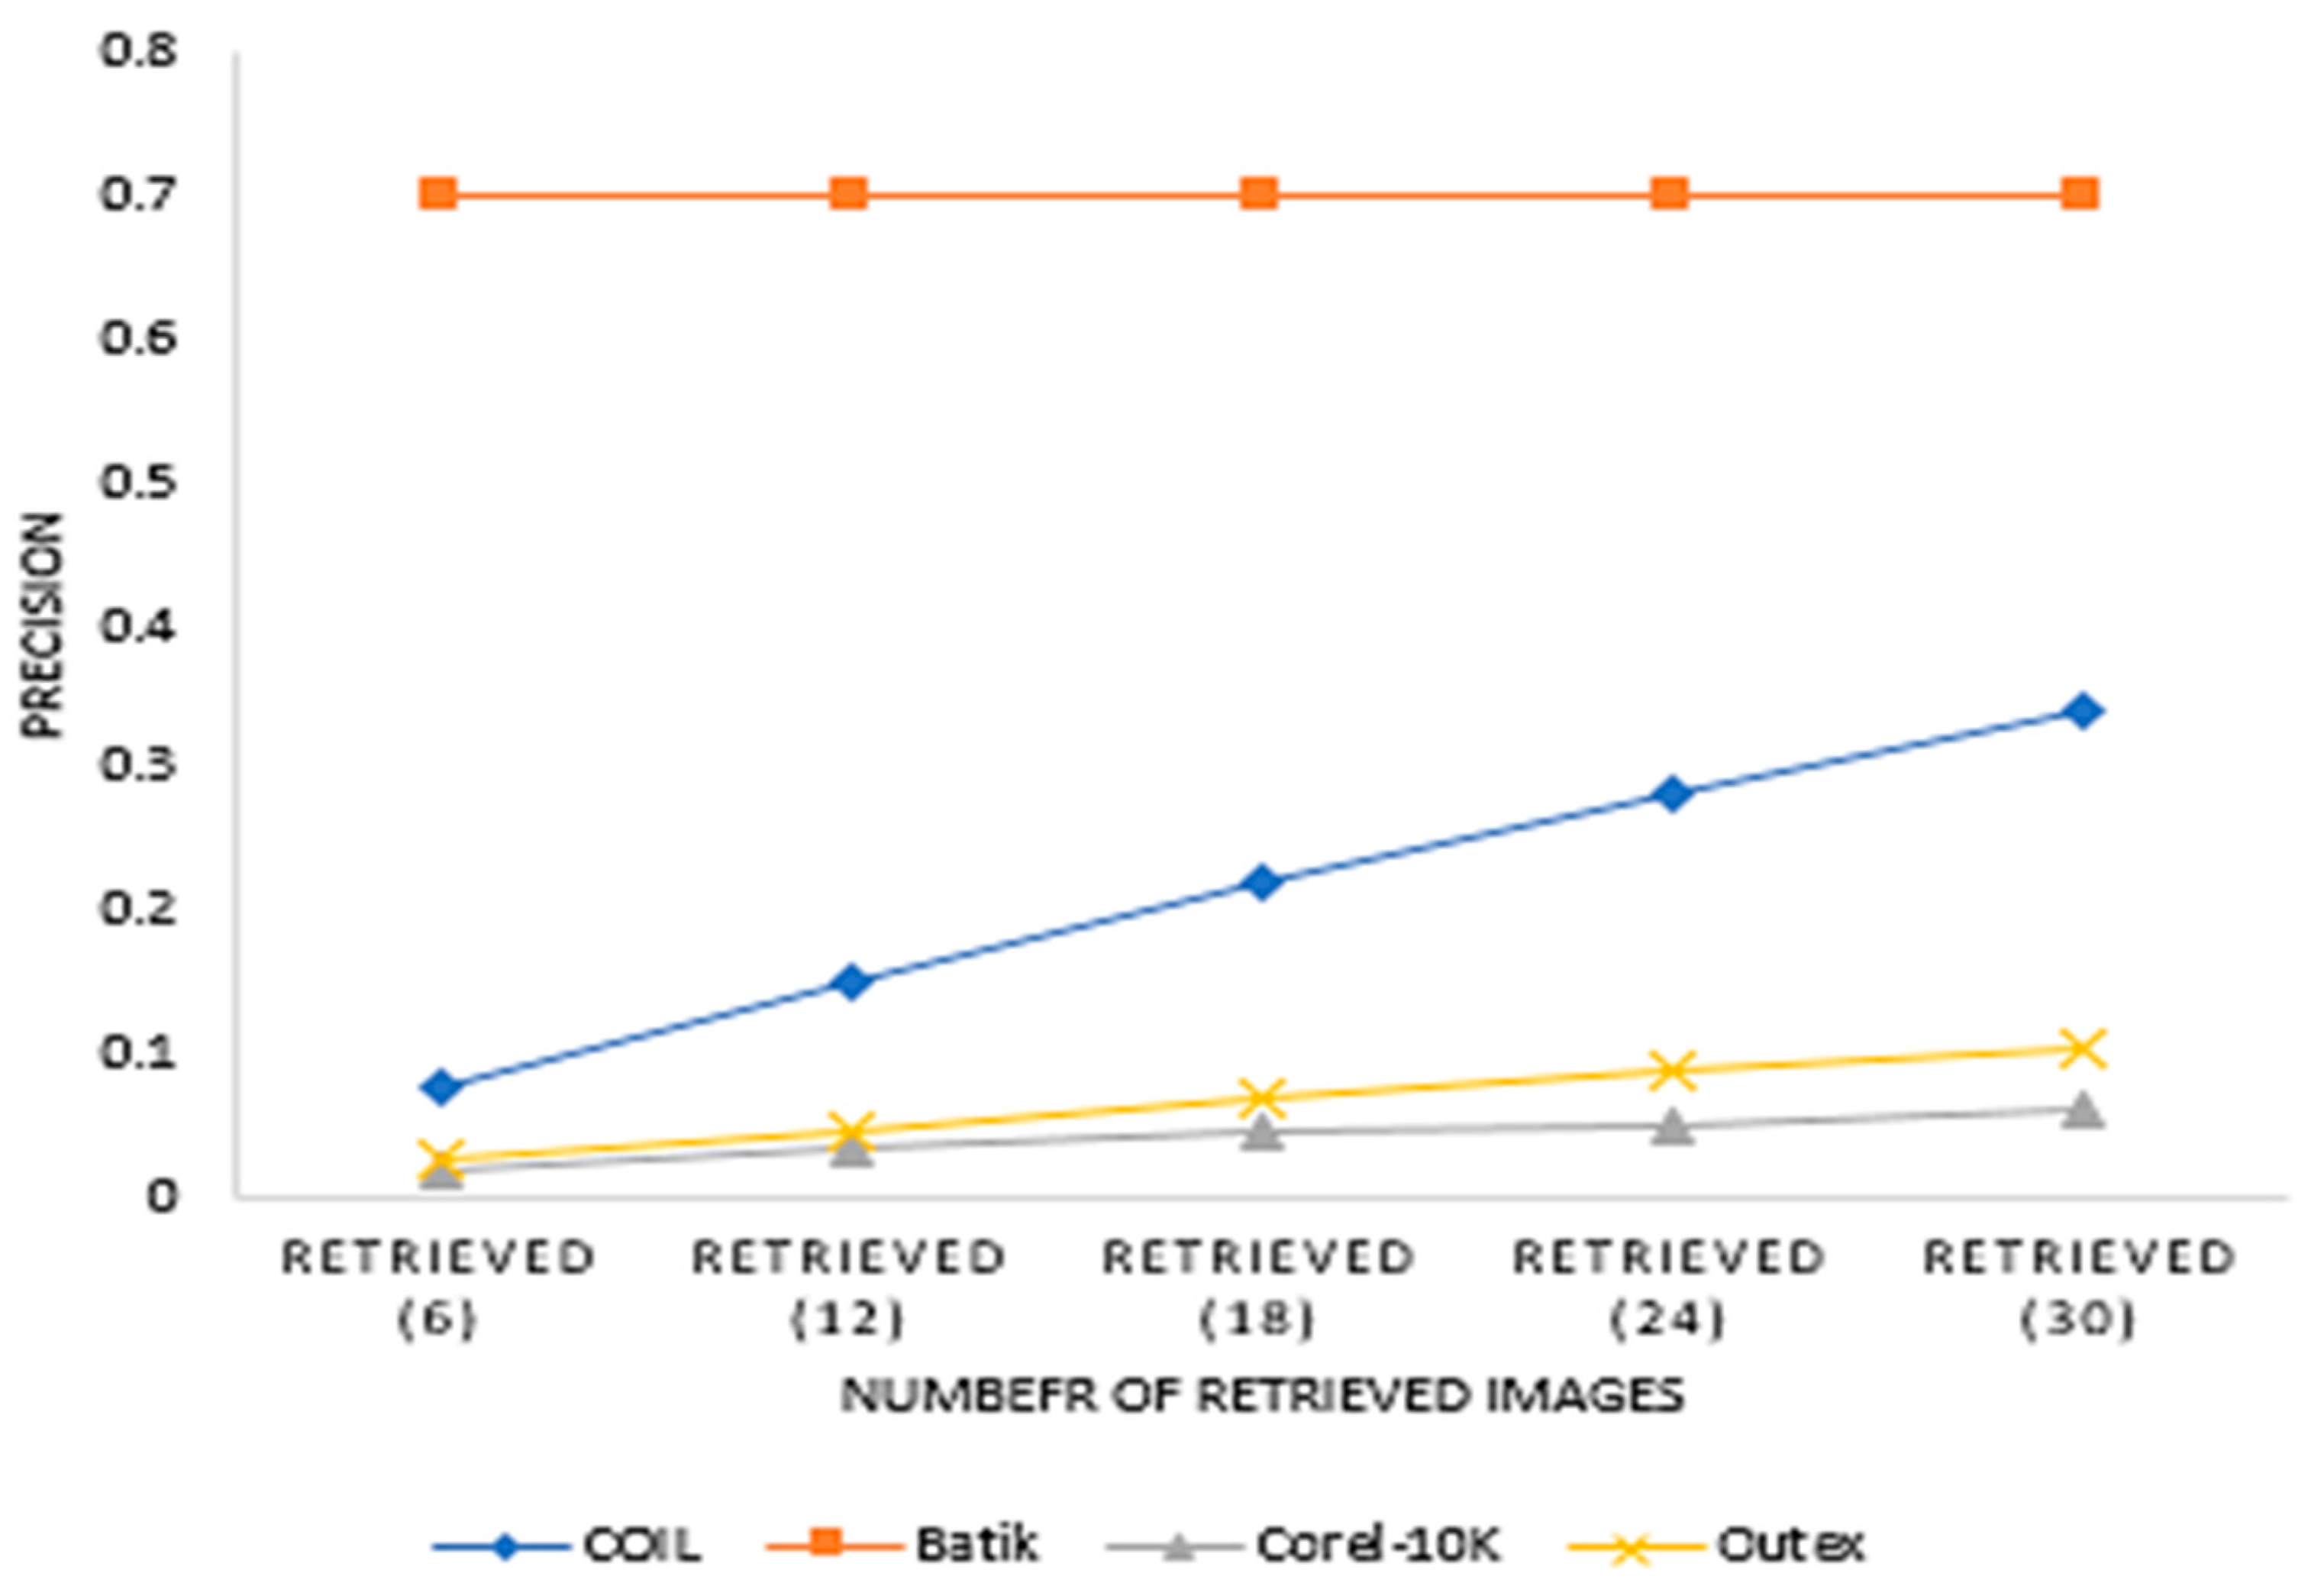
The experiment evaluated the effect of window sizes and the number of recurrent transformations on precision and recall on the identified dataset. Window sizes of 3 × 3, 5 × 5, 7 × 7, 9 × 9 and 11 × 11, and several recurrent transformations of 5, 10, 15, 20 and 25 were used for extracting features for this experiment. Again, the number of retrieved images from each dataset was 6, 12, 18, 24 and 30. Figure 3, Figure 4, Figure 5 and Figure 6 present the precision and recall performances of the proposed descriptor on Corel-10K, Outext, COIL100 and Batik datasets.
Figure 3 presents the average precision values of five window sizes and the five retrieved values (6, 12, 18, 24 and 30). The experiment determined which window size and the number of recurrent transformation will be adequate for SCH.
From Figure 4, we can see that different datasets recorded different precision patterns. COIL-100 precision values increased with increasing window size. However, Batik, Corel-10K and Outext did not record such a pattern, especially a Batik depicting alternating precision with increasing window size.
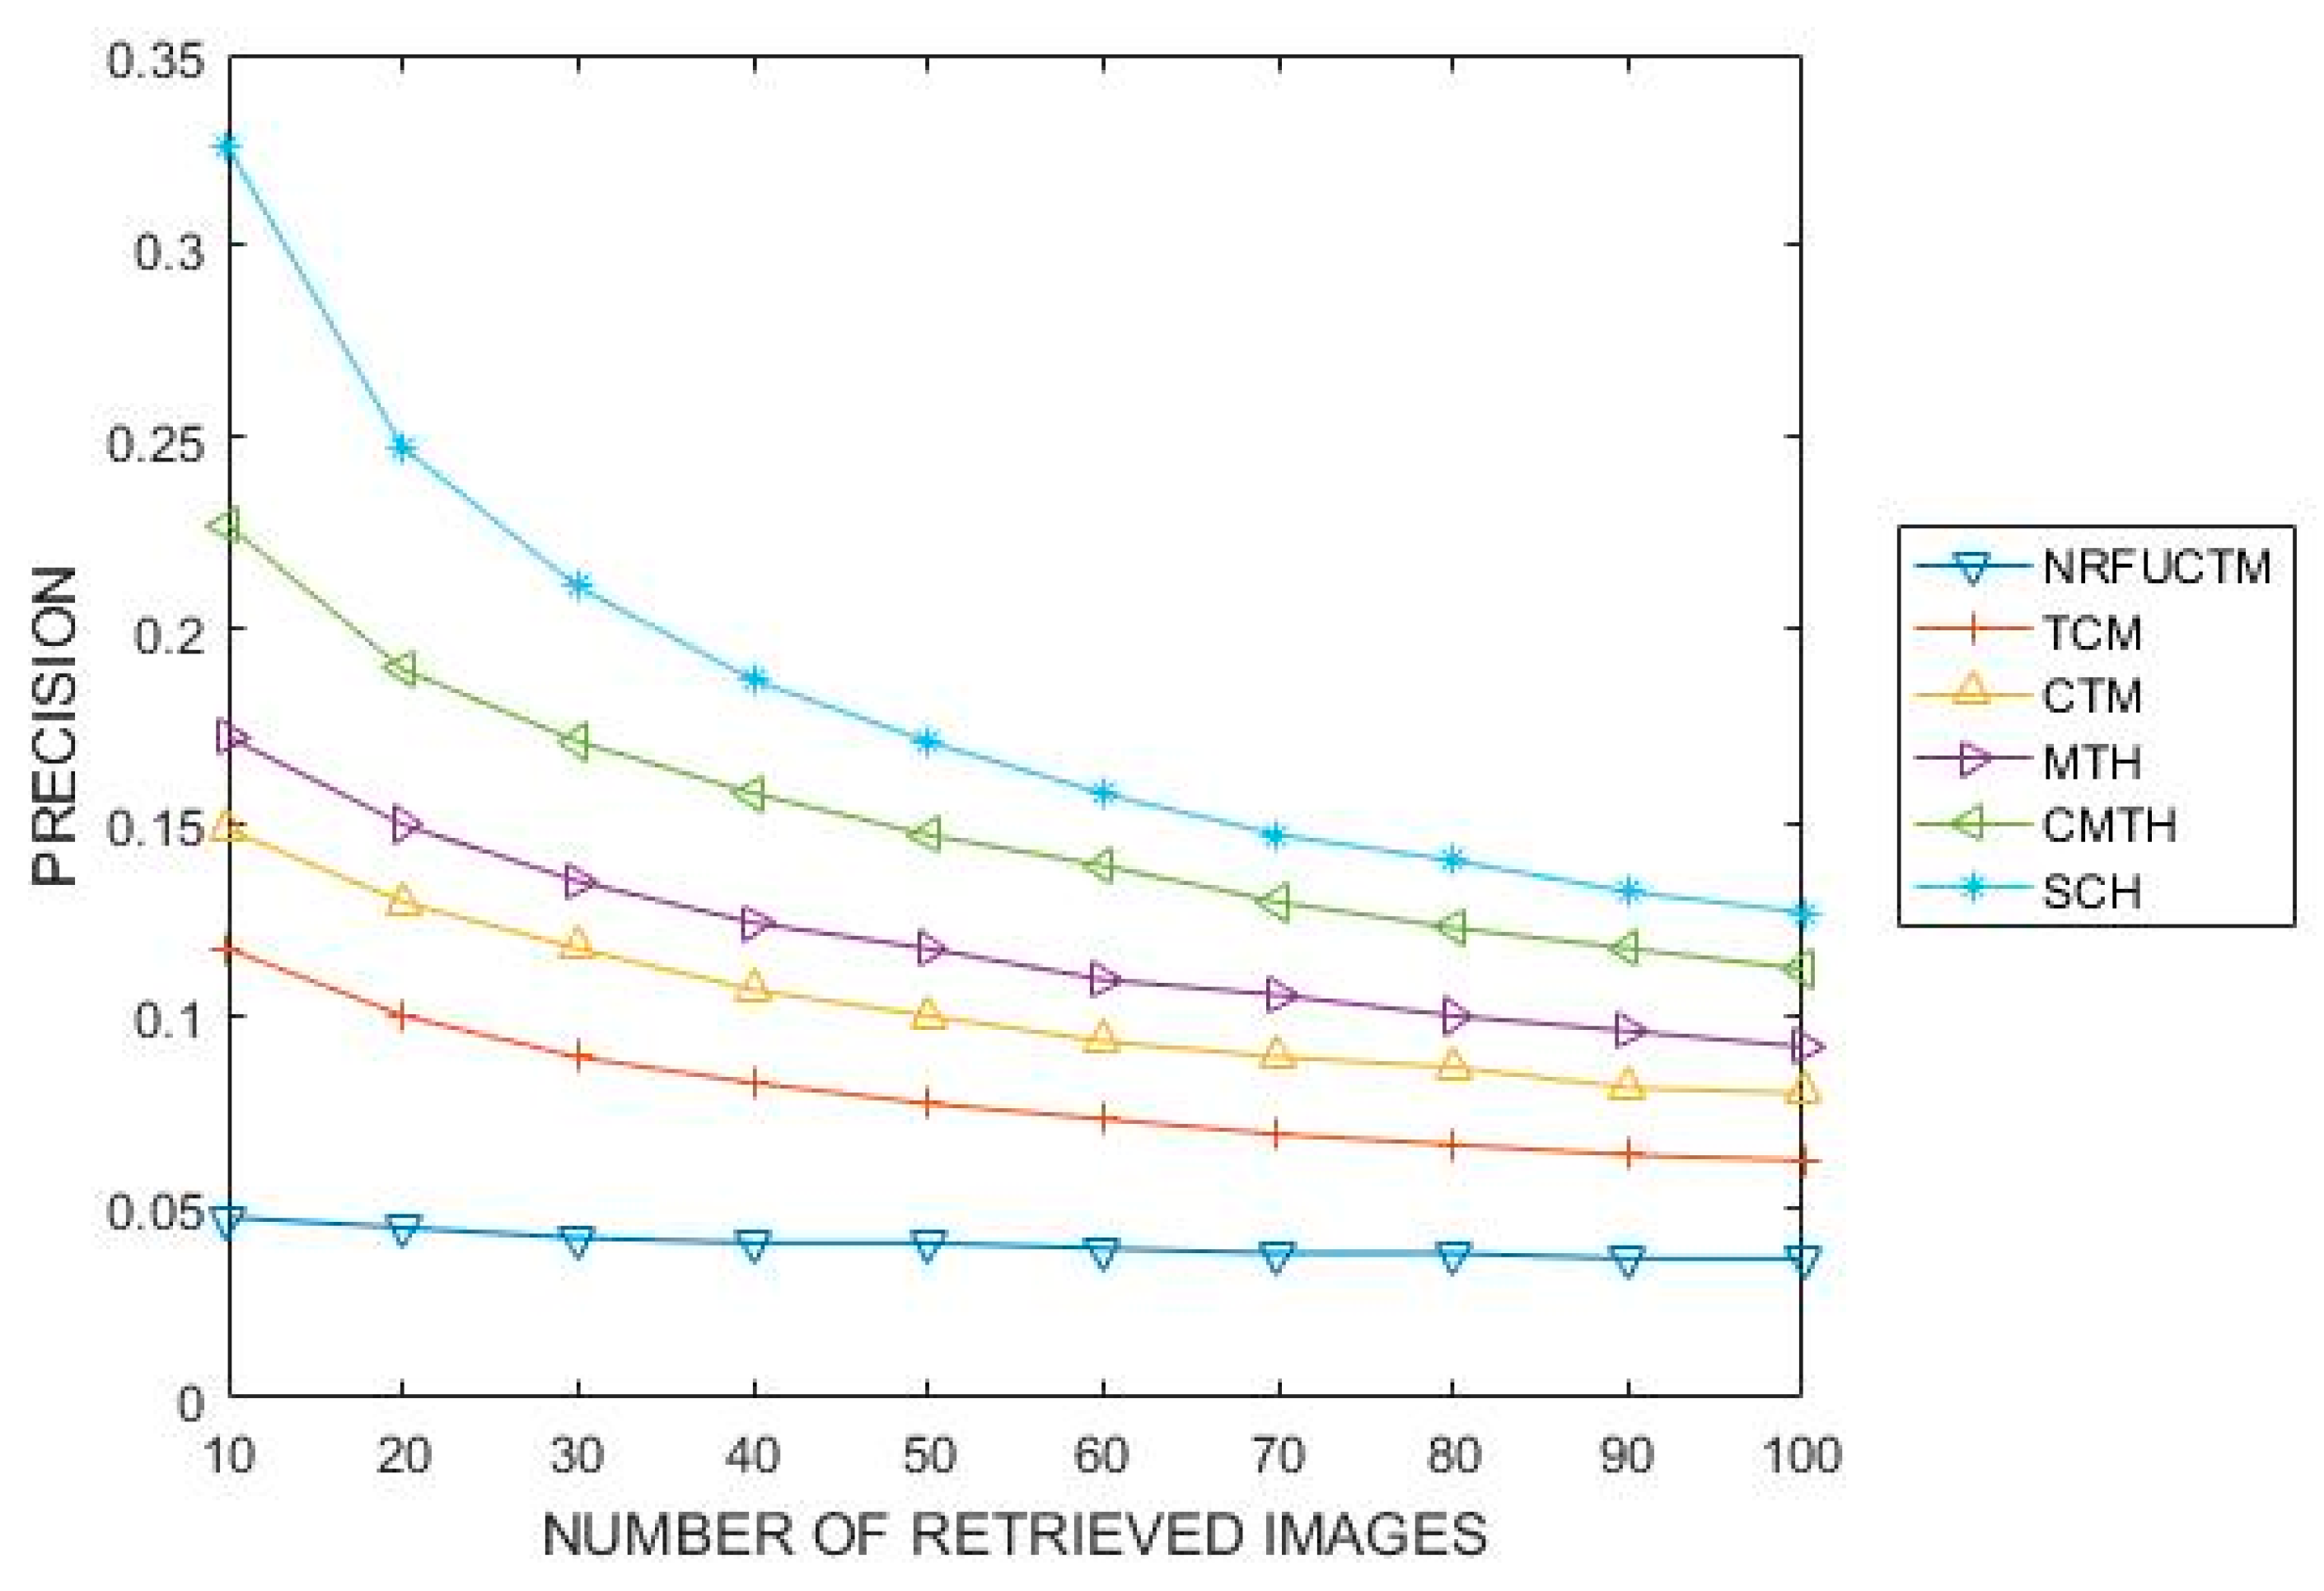
Figure 7 presents the results of SCH together with that of the Textons implemented by Khaldi et al. [29] on Corel-10K. Both experiments used retrieval values of 10 to 100 with a step of 10. The proposed SCH outperformed TCM, MTH, CTM, NRFUCTM, and CMTH.
The results for our experiment on the retrieval efficiency of SCH is compared with that of the textons approach as proposed by Khaldi et al. [29] for extracting textural features in an image. Textons were selected largely because the literature has demonstrated that they are very effective for extracting textural information from images [27,35] and hence can be used as benchmark for evaluating similar feature extraction schemes. From Figure 7, we can see that SCH outperformed all the texton approaches that have been used to index the Corel 10K. The obtained result is a result of the transformational (rotational, scaling, translation and deformation) invariant nature SCH.
5. Conclusions
This paper presents a simple and effective descriptor that represents colour and texture images in a given database. The proposed descriptor utilises colour and neighbourhood information for indexing images. The indexing scheme used a vector dimension of 64 and, therefore, is very effective for image retrieval. The descriptor demonstrates a highly robust feature set used to represent the colour and texture of the image. The final experiments were carried out over four public database sets. Three image databases, mainly from Batik, Coil100 and Outext, were used to evaluate the texture representation capability of our proposed descriptor. Corel10K was used to evaluate its ability in heterogeneous image representation. The experimental results show that our proposed method has strong discrimination power of texture and colour features and outperforms well-established texton-based features.
Author Contributions
Funding acquisition and Supervision, H.L. and X.L.; Methodology, Software, Investigation, E.M.M. and O.A.; Writing—original draft preparation, E.M.M.; Writing—review and editing, H.L., O.A. and X.L. All authors have read and agreed to the published version of the manuscript.
Funding
This research was funded by the Project of Sichuan Provincial Health and Family Planning Commission, Intelligent Identification and Rule Mining of DRGs Based on Tumor Big Data, Grant No: 2018SZ0399.
Institutional Review Board Statement
Not applicable.
Informed Consent Statement
Not applicable.
Data Availability Statement
Not applicable.
Conflicts of Interest
The authors declare no conflict of interest.
References
- Alsmadi, M.K. Content-based image retrieval using colour, shape and texture descriptors and features. Arab. J. Sci. Eng. 2020, 45, 3317–3330. [Google Scholar] [CrossRef]
- Swain, M.J.; Ballard, D.H. Color indexing. Int. J. Comput. Vis. 1991, 7, 11–32. [Google Scholar] [CrossRef]
- Nazir, A.; Ashraf, R.; Hamdani, T.; Ali, N. Content-based image retrieval system by using HSV color histogram, discrete wavelet transform and edge histogram descriptor. In Proceedings of the 2018 International Conference on Computing, Mathematics and Engineering Technologies (iCoMET), Sukkur, Pakistan, 3–4 March 2018; pp. 1–6. [Google Scholar]
- Gupta, S.; Roy, P.P.; Dogra, D.P.; Kim, B.G. Retrieval of color and texture images using local directional peak valley binary pattern. Pattern Anal. Appl. 2020, 23, 1569–1585. [Google Scholar] [CrossRef]
- Alyannezhadi, M.M.; Qazanfari, H.; Ajam, A.; Amiri, Z. Content-based Image Retrieval Considering Color Difference Histogram of Image Texture and Edge Orientation. Int. J. Eng. 2020, 33, 949–958. [Google Scholar]
- Suhasini, P.S.; Krishna, K.S.R.; Krishna, I.M. Content-based image retrieval based on different global and local color histogram methods: A survey. J. Inst. Eng. (India) Ser. B 2017, 98, 129–135. [Google Scholar] [CrossRef]
- Chen, W.T.; Liu, W.C.; Chen, M.S. Adaptive colour feature extraction based on image colour distributions. IEEE Trans. Image Process. 2010, 19, 2005–2016. [Google Scholar] [CrossRef]
- Anandh, A.; Mala, K.; Suganya, S. Content-based image retrieval system based on semantic information using colour, texture and shape features. In Proceedings of the 2016 International Conference on Computing Technologies and Intelligent Data Engineering (ICCTIDE'16), Kovilpatti, India, 7–9 January 2016; pp. 1–8. [Google Scholar]
- Chakravarti, R.; Meng, X. A study of colour histogram-based image retrieval. In Proceedings of the 2009 Sixth International Conference on Information Technology: New Generations, Las Vegas, NV, USA, 27–29 April 2009; pp. 1323–1328. [Google Scholar]
- Mensah, M.E.; Li, X.; Lei, H.; Obed, A.; Bombie, N.C. Improving Performance of Colour-Histogram-Based CBIR Using Bin Matching for Similarity Measure. In Proceedings of the International Conference on Artificial Intelligence and Security, Hohhot, China, 17–20 July 2020; Springer: Cham, Switzerland, 2020; pp. 586–596. [Google Scholar]
- Yue, J.; Li, Z.; Liu, L.; Fu, Z. Content-based image retrieval using colour and texture fused features. Math. Comput. Model. 2011, 54, 1121–1127. [Google Scholar] [CrossRef]
- Zhao, J.; Xie, G.A. modified fuzzy colour histogram using vision perception variation of pixels at a different location. Multimed. Tools Appl. 2014, 75, 1261–1284. [Google Scholar] [CrossRef]
- Gagaudakis, G.; Rosin, P.L. Incorporating shape into histograms for CBIR. Pattern Recognit. 2002, 35, 81–91. [Google Scholar] [CrossRef]
- Manjunath, B.S.; Ma, W.Y. Texture features for browsing and retrieval of image data. IEEE Trans. Pattern Anal. Mach. Intell. 1996, 18, 837–842. [Google Scholar] [CrossRef] [Green Version]
- Porter, R.; Canagarajah, N. Robust rotation invariant texture classification. In Proceedings of the 1997 IEEE International Conference on Acoustics, Speech, and Signal Processing, Munich, Germany, 21–24 April 1997; Volume I–V. [Google Scholar]
- Ojala, T.M.; Pietikainen, T.M. Multiresolution gray-scale and rotation invariant texture classification with local binary patterns. IEEE Trans. Pattern Anal. Mach. Intell. 2002, 24, 971–987. [Google Scholar] [CrossRef]
- Marula, S.; Maheshwari, R.P.; Balasubramanian, R. Local tetra pattern: A new feature descriptor for content-based image retrieval. IEEE Trans. Image Process. 2012, 21, 2874–2886. [Google Scholar] [CrossRef] [PubMed]
- Robert, M.; Haralick, K.; Shanmugam, I.D. Textural features for image classification. IEEE Trans. Syst. Man Cybern. 1973, 3, 610–621. [Google Scholar] [CrossRef] [Green Version]
- Cohen, F.S.; Fan, Z.G.; Patel, M.A. Classification of rotated and scaled textured images using Gaussian Markov random field models. IEEE Trans. Pattern Anal. Mach. Intell. 1991, 13, 192–202. [Google Scholar] [CrossRef]
- Liu, G.; Zhang, L.; Hou, Y.; Li, Z.-Y.; Yang, J.-Y. Image retrieval based on multi-texton histogram. Pattern Recognit. 2010, 43, 2380–2389. [Google Scholar] [CrossRef]
- Liu, G.-H.; Li, Z.-Y.; Zhang, L.; Xu, Y. Image retrieval based on micro-structure descriptor. Pattern Recognit. 2011, 44, 2123–2133. [Google Scholar] [CrossRef] [Green Version]
- Liu, G.-H.; Zhang, L.; Li, Z.-Y. Content-based image retrieval using computational visual attention model. Pattern Recognit. 2015, 48, 2554–2566. [Google Scholar] [CrossRef]
- Liu, G.H.; Yang, J.Y. Image retrieval based on the texton co-occurrence matrix. Pattern Recogn. 2008, 41, 3521–3527. [Google Scholar] [CrossRef]
- Liu, G.H.; Yang, J.Y. Content-based image retrieval using colour difference histogram. Pattern Recognit. 2013, 46, 188–198. [Google Scholar] [CrossRef]
- Xingyuan, W.; Zongyu, W. A novel method for image retrieval based on structure elements descriptor. J. Vis. Commun. Image Represent. 2013, 24, 63–74. [Google Scholar]
- Tyagi, V. Content-Based Image Retrieval Using a Short Run Length Descriptor. In Content-Based Image Retrieval; Springer: Singapore, 2017; pp. 241–256. [Google Scholar]
- Minarno, A.E.; Munarko, Y.; Kurniawardhani, A.; Bimantoro, F. Classification of Texture Using Multi Texton Histogram and Probabilistic Neural Network. In IOP Conference Series: Materials Science and Engineering; IOP Publishing: Bristol, UK, 2016; Volume 105, p. 012022. [Google Scholar]
- Kumari, Y.S.; Kumar, V.V.; Satyanarayana, C. Texture classification using complete texton matrix. Int. J. Image Graph. Signal Process. 2017, 9, 60. [Google Scholar] [CrossRef] [Green Version]
- Khaldi, B.; Aiadi, O.; Lamine, K.M. Image representation using complete multi-texton histogram. Multimed. Tools Appl. 2020, 79, 8267–8285. [Google Scholar] [CrossRef]
- Minarno, A.E.; Munarko, Y.; Bimantoro, F.; Kurniawardhani, A.; Suciati, N. Batik image retrieval based on enhanced micro-structure descriptor. In Proceedings of the 2014 Asia-Pacific Conference on Computer-Aided System Engineering (APCASE), South Kuta, Indonesia, 10–12 February 2014; pp. 65–70. [Google Scholar]
- Mori, G.; Belongie, S.; Malik, J. Shape contexts enable efficient retrieval of similar shapes. In Proceedings of the 2001 IEEE Computer Society Conference on Computer Vision and Pattern Recognition. CVPR 2001, Kauai, HI, USA, 8–14 December 2001; Volume 1. [Google Scholar]
- Khaldi, B.; Aiadi, O.; Kherfi, M.L. Combining colour and grey-level co-occurrence matrix features: A comparative study. IET Image Process. 2019, 13, 1401–1410. [Google Scholar] [CrossRef]
- Bala, A.; Kaur, T. Local texton XOR patterns: A new feature descriptor for content-based image retrieval. Eng. Sci. Technol. Int. J. 2016, 19, 101–112. [Google Scholar] [CrossRef] [Green Version]
- Appiah, O.; Martey, E.M.; Quayson, E. Effect of Window’s Shape on Median Filtering. In Proceedings of the 2019 IEEE AFRICON, Accra, Ghana, 25–27 September 2019; pp. 1–8. [Google Scholar]
- Raza, A.; Nawaz, T.; Dawood, H.; Dawood, H. Square texton histogram features for image retrieval. Multimed. Tools Appl. 2019, 78, 2719–2746. [Google Scholar] [CrossRef]
Figure 1.
Different images with histograms and SCH shapes.

Figure 2.
Sample images from each dataset. (a) Outex, (b) Corel10K, (c) Coil100 and (d) Batik.

Figure 3.
Average precision for various window sizes and the number of transformations for the four datasets.
Figure 3.
Average precision for various window sizes and the number of transformations for the four datasets.

Figure 4.
Average recall for various window sizes and the number of transformations for the four datasets.
Figure 4.
Average recall for various window sizes and the number of transformations for the four datasets.

Figure 5.
Average precision for various retrieved values for the four datasets.

Figure 6.
Average precision for various retrieved values for the four datasets.

Figure 7.
Performance of SCH compared with textons on Corel-10K.


Table 1.
Accuracy outputs for various window sizes and transformations for the three datasets using DC.
Table 1.
Accuracy outputs for various window sizes and transformations for the three datasets using DC.
| Window Size − Recurrent Number | Coil100 | Corel10K | Outext |
|---|---|---|---|
| 3 × 3 − 5 | 0.85 | 0.34 | 0.64 |
| 3 × 3 − 10 | 0.85 | 0.34 | 0.64 |
| 3 × 3 − 15 | 0.85 | 0.35 | 0.65 |
| 3 × 3 − 20 | 0.85 | 0.34 | 0.65 |
| 3 × 3 − 25 | 0.85 | 0.34 | 0.65 |
| 5 × 5 − 5 | 0.88 | 0.36 | 0.66 |
| 5 × 5 − 10 | 0.87 | 0.34 | 0.65 |
| 5 × 5 − 15 | 0.86 | 0.33 | 0.64 |
| 5 × 5 − 20 | 0.86 | 0.33 | 0.64 |
| 5 × 5 − 25 | 0.87 | 0.33 | 0.63 |
| 7 × 7 − 5 | 0.87 | 0.36 | 0.67 |
| 7 × 7 − 10 | 0.87 | 0.33 | 0.67 |
| 7 × 7 − 15 | 0.88 | 0.32 | 0.65 |
| 7 × 7 − 20 | 0.88 | 0.31 | 0.63 |
| 7 × 7 − 25 | 0.88 | 0.3 | 0.62 |
| 9 × 9 − 5 | 0.89 | 0.36 | 0.67 |
| 9 × 9 − 10 | 0.89 | 0.33 | 0.66 |
| 9 × 9 − 15 | 0.89 | 0.31 | 0.65 |
| 9 × 9 − 20 | 0.89 | 0.3 | 0.64 |
| 9 × 9 − 25 | 0.89 | 0.29 | 0.61 |
| 11 × 11 − 5 | 0.91 | 0.36 | 0.66 |
| 11 × 11 − 10 | 0.9 | 0.33 | 0.66 |
| 11 × 11 − 15 | 0.9 | 0.3 | 0.64 |
| 11 × 11 − 20 | 0.89 | 0.3 | 0.59 |
| 11 × 11 − 25 | 0.89 | 0.28 | 0.59 |
Table 2.
Accuracy outputs for various window sizes and transformations for the three datasets using SVM.
Table 2.
Accuracy outputs for various window sizes and transformations for the three datasets using SVM.
| Window Size − Recurrent Number | Coil100 | Corel10K | Outex |
|---|---|---|---|
| 3 × 3 − 5 | 0.92 | 0.41 | 0.75 |
| 3 × 3 − 10 | 0.94 | 0.4 | 0.77 |
| 3 × 3 − 15 | 0.94 | 0.4 | 0.78 |
| 3 × 3 − 20 | 0.94 | 0.41 | 0.78 |
| 3 × 3 − 25 | 0.94 | 0.4 | 0.78 |
| 5 × 5 − 5 | 0.94 | 0.41 | 0.78 |
| 5 × 5 − 10 | 0.94 | 0.42 | 0.77 |
| 5 × 5 − 15 | 0.94 | 0.42 | 0.78 |
| 5 × 5 − 20 | 0.94 | 0.4 | 0.78 |
| 5 × 5 − 25 | 0.95 | 0.4 | 0.78 |
| 7 × 7 − 5 | 0.94 | 0.42 | 0.77 |
| 7 × 7 − 10 | 0.95 | 0.41 | 0.77 |
| 7 × 7 − 15 | 0.96 | 0.41 | 0.77 |
| 7 × 7 − 20 | 0.96 | 0.41 | 0.78 |
| 7 × 7 − 25 | 0.96 | 0.4 | 0.78 |
| 9 × 9 − 5 | 0.95 | 0.42 | 0.77 |
| 9 × 9 − 10 | 0.96 | 0.42 | 0.77 |
| 9 × 9 − 15 | 0.96 | 0.41 | 0.77 |
| 9 × 9 − 20 | 0.96 | 0.41 | 0.77 |
| 9 × 9 − 25 | 0.97 | 0.4 | 0.76 |
| 11 × 11 − 5 | 0.96 | 0.43 | 0.77 |
| 11 × 11 − 10 | 0.96 | 0.42 | 0.77 |
| 11 × 11 − 15 | 0.97 | 0.41 | 0.77 |
| 11 × 11 − 20 | 0.97 | 0.4 | 0.75 |
| 11 × 11 − 25 | 0.97 | 0.4 | 0.75 |
Table 3.
Accuracy results for various window sizes and transformations for the three datasets using NB.
Table 3.
Accuracy results for various window sizes and transformations for the three datasets using NB.
| Window Size − Recurrent Number | Coil100 | Corel10K | Outex |
|---|---|---|---|
| 3 × 3 − 5 | 0.87 | 0.33 | 0.61 |
| 3 × 3 − 10 | 0.88 | 0.34 | 0.63 |
| 3 × 3 − 15 | 0.89 | 0.33 | 0.64 |
| 3 × 3 − 20 | 0.88 | 0.34 | 0.64 |
| 3 × 3 − 25 | 0.88 | 0.34 | 0.63 |
| 5 × 5 − 5 | 0.89 | 0.35 | 0.64 |
| 5 × 5 − 10 | 0.89 | 0.35 | 0.63 |
| 5 × 5 − 15 | 0.88 | 0.36 | 0.61 |
| 5 × 5 − 20 | 0.88 | 0.35 | 0.61 |
| 5 × 5 − 25 | 0.88 | 0.36 | 0.6 |
| 7 × 7 − 5 | 0.89 | 0.35 | 0.63 |
| 7 × 7 − 10 | 0.89 | 0.34 | 0.62 |
| 7 × 7 − 15 | 0.9 | 0.33 | 0.61 |
| 7 × 7 − 20 | 0.91 | 0.33 | 0.6 |
| 7 × 7 − 25 | 0.92 | 0.35 | 0.59 |
| 9 × 9 − 5 | 0.9 | 0.36 | 0.62 |
| 9 × 9 − 10 | 0.91 | 0.33 | 0.62 |
| 9 × 9 − 15 | 0.92 | 0.34 | 0.61 |
| 9 × 9 − 20 | 0.92 | 0.35 | 0.6 |
| 9 × 9 − 25 | 0.92 | 0.35 | 0.58 |
| 11 × 11 − 5 | 0.91 | 0.34 | 0.61 |
| 11 × 11 − 10 | 0.92 | 0.31 | 0.61 |
| 11 × 11 − 15 | 0.92 | 0.36 | 0.59 |
| 11 × 11 − 20 | 0.92 | 0.32 | 0.57 |
| 11 × 11 − 25 | 0.92 | 0.36 | 0.57 |
Table 4.
Presents accuracies for the various window sizes and transformations for the three datasets using DT.
Table 4.
Presents accuracies for the various window sizes and transformations for the three datasets using DT.
| Window Size − Recurrent Number | Coil100 | Corel10K | Outex |
|---|---|---|---|
| 3 × 3 − 5 | 0.85 | 0.23 | 0.72 |
| 3 × 3 − 10 | 0.86 | 0.22 | 0.73 |
| 3 × 3 − 15 | 0.86 | 0.23 | 0.77 |
| 3 × 3 − 20 | 0.87 | 0.22 | 0.76 |
| 3 × 3 − 25 | 0.88 | 0.23 | 0.76 |
| 5 × 5 − 5 | 0.87 | 0.23 | 0.75 |
| 5 × 5 − 10 | 0.89 | 0.23 | 0.77 |
| 5 × 5 − 15 | 0.88 | 0.23 | 0.78 |
| 5 × 5 − 20 | 0.89 | 0.22 | 0.79 |
| 5 × 5 − 25 | 0.89 | 0.23 | 0.79 |
| 7 × 7 − 5 | 0.88 | 0.23 | 0.75 |
| 7 × 7 − 10 | 0.9 | 0.23 | 0.77 |
| 7 × 7 − 15 | 0.89 | 0.23 | 0.77 |
| 7 × 7 − 20 | 0.89 | 0.23 | 0.77 |
| 7 × 7 − 25 | 0.9 | 0.22 | 0.78 |
| 9 × 9 − 5 | 0.89 | 0.22 | 0.75 |
| 9 × 9 − 10 | 0.9 | 0.23 | 0.77 |
| 9 × 9 − 15 | 0.89 | 0.24 | 0.77 |
| 9 × 9 − 20 | 0.91 | 0.23 | 0.77 |
| 9 × 9 − 25 | 0.91 | 0.24 | 0.77 |
| 11 × 11 − 5 | 0.89 | 0.23 | 0.75 |
| 11 × 11 − 10 | 0.91 | 0.23 | 0.76 |
| 11 × 11 − 15 | 0.92 | 0.24 | 0.76 |
| 11 × 11 − 20 | 0.9 | 0.23 | 0.76 |
| 11 × 11 − 25 | 0.92 | 0.24 | 0.76 |
Table 5.
Results obtained by classifying images from each dataset using DAC, SVM, NB and DT.
| Outext | Corel10K | ||
|---|---|---|---|
| TCM | 41.96 % ± 2.5% | 16.71% ± 0.1% | |
| MTH | 33.85 % ± 2.4% | 23.68% ± 0.1% | |
| CTM | 33.65 % ± 1.8% | 21.22% ± 0.2% | |
| NRFU | 39.83 % ± 2.5% | 5.38% ± 0.0% | |
| CMTH | 42.34 % ± 2.6% | 31.76% ± 0.1% | |
| DAC | SCH | 64.24%± 2.5% | 32.72%± 0.1% |
| TCM | 42.95 % ± 3.0% | 20.58 % ± 0.1% | |
| MTH | 45.31 % ± 2.6% | 33.02 % ± 0.1% | |
| CTM | 27.43 % ± 1.3% | 21.15 % ± 0.2% | |
| NRFU | 31.51 % ± 1.9% | 11.69 % ± 0.1% | |
| CMTH | 51.01 % ± 1.6% | 40.61 % ± 0.2% | |
| SVM | SCH | 77.08% ± 0.1% | 40.96% ± 0.2% |
| TCM | 37.24 % ± 1.7% | 23.62 % ± 0.2% | |
| MTH | 25.54 % ± 1.1% | 24.68 % ± 0.2% | |
| CTM | 34.97 % ± 1.5% | 23.06 % ± 0.2% | |
| NRFU | 41.01 % ± 1.5% | 22.71 % ± 0.2% | |
| CMTH | 38.71 % ± 1.5% | 34.22 % ± 0.2% | |
| NB | SCH | 61.08% ± 0.1% | 34.28% ± 0.2% |
| TCM | 64.63 % ± 2.5 | 18.33 % ± 0.1% | |
| MTH | 47.70 % ± 2.3% | 17.23 % ± 0.1% | |
| CTM | 67.38 % ± 2.7% | 19.69 % ± 0.1% | |
| NRFU | 60.81 % ± 2.6% | 15.96 % ± 0.1% | |
| CMTH | 64.45 % ± 2.8% | 22.94 % ± 0.1% | |
| DT | SCH | 76.32 % ± 0.1% | 22.96% ± 0.1% |
Table 6.
Mean accuracy for KNN classifier with different values of k on three datasets.
| k-Value | Coil100 | Corel10K | Outext |
|---|---|---|---|
| k = 1 | 0.96 | 0.31 | 0.77 |
| k = 3 | 0.95 | 0.31 | 0.77 |
| k = 5 | 0.94 | 0.34 | 0.76 |
| k = 9 | 0.94 | 0.31 | 0.77 |
Table 7.
Results of SCH together with texton-based features using different values of k (KNN’s parameter).
Table 7.
Results of SCH together with texton-based features using different values of k (KNN’s parameter).
| Outext | Corel10K | ||
|---|---|---|---|
| TCM | 72.49% ± 2.8% | 16.71% ± 0.1% | |
| MTH | 51.92% ± 2.3% | 23.68% ± 0.1% | |
| CTM | 72.31% ± 2.8% | 21.22% ± 0.2% | |
| NRFU | 36.72% ± 1.7% | 5.38% ± 0.0% | |
| CMTH | 78.40% ± 3.0% | 31.76%± 0.1% | |
| k = 1 | SCH | 77.63%± 3.0% | 31.80%± 0.2% |
| TCM | 76.42% ± 3.0% | 16.29 % ± 0.1% | |
| MTH | 52.30% ± 2.4% | 22.68 % ± 0.2% | |
| CTM | 70.18% ± 2.8% | 20.02 % ± 0.2% | |
| NRFU | 36.89% ± 1.8% | 5.26 % ± 0.0% | |
| CMTH | 76.42% ± 3.0% | 30.89 %± 0.2% | |
| k = 3 | SCH | 77.33%± 3.0% | 31.35%± 0.2% |
| TCM | 68.41 % ± 2.7% | 17.51 % ± 0.1% | |
| MTH | 52.68 % ± 2.5% | 25.16 % ± 0.2% | |
| CTM | 68.93 % ± 2.9% | 20.97 % ± 0.2% | |
| NRFU | 39.49 % ± 2.1% | 6.00 % ± 0.08% | |
| CMTH | 74.83 % ± 3.0% | 33.16 % ± 0.2% | |
| k = 5 | SCH | 76.04%± 3.0% | 34.03% ± 0.2% |
| TCM | 72.49% ± 2.8% | 16.71% ± 0.1% | |
| MTH | 51.92% ± 2.3% | 23.68% ± 0.1% | |
| CTM | 72.31% ± 2.8% | 21.22% ± 0.2% | |
| NRFU | 36.72% ± 1.7% | 5.38% ± 0.0% | |
| CMTH | 78.40% ± 3.0% | 31.76% ± 0.1% | |
| k = 9 | SCH | 77.19%± 3.0% | 31.93% ± 0.2% |
Publisher’s Note: MDPI stays neutral with regard to jurisdictional claims in published maps and institutional affiliations. |
© 2021 by the authors. Licensee MDPI, Basel, Switzerland. This article is an open access article distributed under the terms and conditions of the Creative Commons Attribution (CC BY) license (https://creativecommons.org/licenses/by/4.0/).
Share and Cite
MDPI and ACS Style
Martey, E.M.; Lei, H.; Li, X.; Appiah, O. Image Representation Using Stacked Colour Histogram. Algorithms 2021, 14, 228. https://0-doi-org.brum.beds.ac.uk/10.3390/a14080228
AMA Style
Martey EM, Lei H, Li X, Appiah O. Image Representation Using Stacked Colour Histogram. Algorithms. 2021; 14(8):228. https://0-doi-org.brum.beds.ac.uk/10.3390/a14080228
Chicago/Turabian StyleMartey, Ezekiel Mensah, Hang Lei, Xiaoyu Li, and Obed Appiah. 2021. "Image Representation Using Stacked Colour Histogram" Algorithms 14, no. 8: 228. https://0-doi-org.brum.beds.ac.uk/10.3390/a14080228
Note that from the first issue of 2016, this journal uses article numbers instead of page numbers. See further details here.