
Risk Assessment Algorithm for Power Transformer Fleets Based on Condition and Strategic Importance


1
Institute of Electric Power of the National, Universidad Nacional de San Juan, San Juan 5400, Argentina
2
Department of Electrical Engineering, Universidad Nacional de Colombia, Bogotá 11132, Colombia
*
Author to whom correspondence should be addressed.
Algorithms 2021, 14(11), 319; https://0-doi-org.brum.beds.ac.uk/10.3390/a14110319
Submission received: 30 September 2021
/
Revised: 28 October 2021
/
Accepted: 29 October 2021
/
Published: 31 October 2021
Abstract
:In every electric power system, power transformers (PT) play a critical role. Under ideal circumstances, PT should receive the utmost care to maintain the highest operative condition during their lifetime. Through the years, different approaches have been developed to assess the condition and the inherent risk during the operation of PT. However, most proposed methodologies tend to analyze PT as individuals and not as a fleet. A fleet assessment helps the asset manager make sound decisions regarding the maintenance scheduling for groups of PT with similar conditions. This paper proposes a new methodology to assess the risk of PT fleets, considering the technical condition and the strategic importance of the units. First, the state of the units was evaluated using a health index (HI) with a fuzzy logic algorithm. Then, the strategic importance of each unit was assessed using a weighting technique to obtain the importance index (II). Finally, the analyzed units with similar HI and II were arranged into a set of clusters using the k-means clustering technique. A fleet of 19 PTs was used to validate the proposed method. The obtained results are also provided to demonstrate the viability and feasibility of the assessment model.
1. Introduction
At present, as a result of the constant grown of societies, the physical assets on electric power systems suffer a continuous demand for high system reliability, power quality and cost benefits. Under these circumstances, physical assets should be maintained in optimal condition. PT constitutes a vital component in the electric power system [1]. Due to the high replacement and maintenance cost, as well as catastrophic failure consequences, a proper assessment of the condition of the units should be done [2].
An asset manager needs to justify all the maintenance or replacement decisions. To achieve this goal, it is necessary to count on reliable information about the condition and the importance of the unit in the context of the whole system. A set of diagnostic analyses can be carried out to understand the physical condition of the PT [3,4,5]. As for the strategic importance of the unit, it is necessary to know technical and operative characteristics, such as loading, geographic location, or the existence of critical loads. Once this information has been obtained, the acquired data need to be processed in a way that enables the asset manager to draw conclusions about the state of the unit. Different methodologies have been developed to assess the condition of PT, mostly known as health indices (HI) [6,7,8], and when the importance of the unit or the consequences of failure is also taken into account, the assessment methodology is known as risk index (RI). The RI is a measure that integrates several pieces of information regarding condition, probability of failure and the importance of the transformer in a power system [9]. The main goal of the RI outcome is to serve as an indicator of the need of acting either in maintenance or inspection, especially when the company has adopted a scheme of reliability-based maintenance (RBM) and/or condition-based maintenance (CBM) [10].
In the literature, there are many methodologies to assess the risk of PTs [11,12,13,14]. What differentiates one from the other is the technique used to process the data and the entry criteria. While most of the experts consider the HI to evaluate the risk, some authors also consider the consequences of failure [15], the probability of shutdown [16], the technical condition [17] or the strategic importance of the PT [18].
It should be noted that the RI is an indicator that enables an influential prioritization/ranking of the assets to support maintenance and replacement decisions [19,20]. However, when dealing with a set of transformers, more than a ranking, an asset manager needs to categorize the units in groups with similar characteristics to apply maintenance actions. Most of the current methodologies to assess the risk in PT analyze one unit at a time or use a ranking system. This paper proposes a practical application to determine the RI in fleets of PT and then categorize the units in groups of similar RI using the k-means clustering technique. This, in order to be a support tool for improving the efficiency of PT maintenance. The contributions of this work can be listed as:
- An up-to-date approach to determine the degree of polymerization (DP) of the insulating paper and the HI.
- A standardized procedure to assess the strategic importance of the PT.
- A new method to categorize the risk in PT fleets employing a clustering technique
The following sections introduce a description of the methodology developed to calculate the HI, the strategic importance of the asset or II, and the RI. Next, a fleet of 19 PTs is analyzed to validate the proposed method. Finally, the results, discussions and conclusions are presented.
2. Materials and Methods: Risk Assessment Algorithm
2.1. Health Index Calculation
The health index (HI) is an indicator that quantifies and provides an undemanding understanding of the general condition of a PT. Most of the methodologies developed to calculate the HI employ weighting techniques [21,22]. However, in recent years new methods based on Markov chains [23], fuzzy logic systems [24] and artificial neural networks [25] have been developed.
Some authors [26,27,28], take into account the uncertainty, vagueness, or impreciseness of the available information. Derived from this approach, they consider the fuzzy inference systems (FIS) to be the most appropriate method to calculate the HI. The use of the FIS methodology requires the fuzzification of all the input data, which is often given in numerical values. The fuzzification process involves the conversion of those numerical values into linguistic functions which is accomplished with the modeling of membership functions.
The proposed method has its roots in the works in Ref. [29] and Ref. [9]. The original methodology uses six entry criteria to calculate the final value: breakdown voltage, moisture content (humidity), acidity, power factor, furan content and dissolved gas analysis (DGA). The furan content analysis is carried out to assess the degree of degradation of the winding’s insulating paper. However, recent studies have proven that the furan content may be inaccurate to properly evaluate the state of the insulating paper [30,31,32]. Taking into account the facts stated above, this paper proposes the replacement of the furan content criterion for the DP one. The degree of polymerization (DP) value is usually estimated from the proportion of 2-FAL found in the furan content analysis., Chendong’s Equation (1) is one of the most widely accepted methods to calculate the DP value.
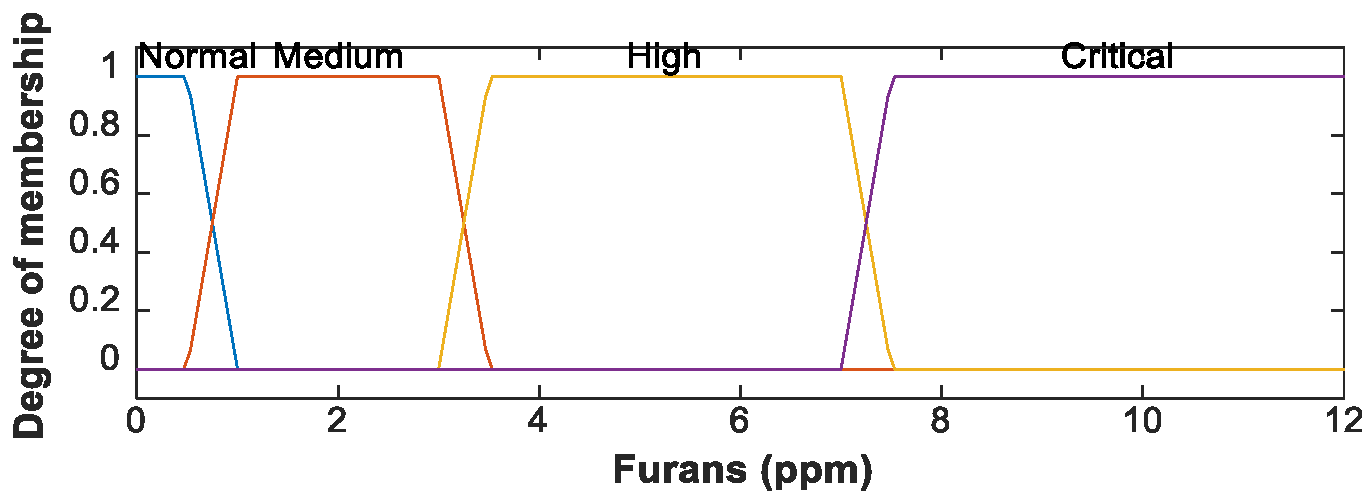
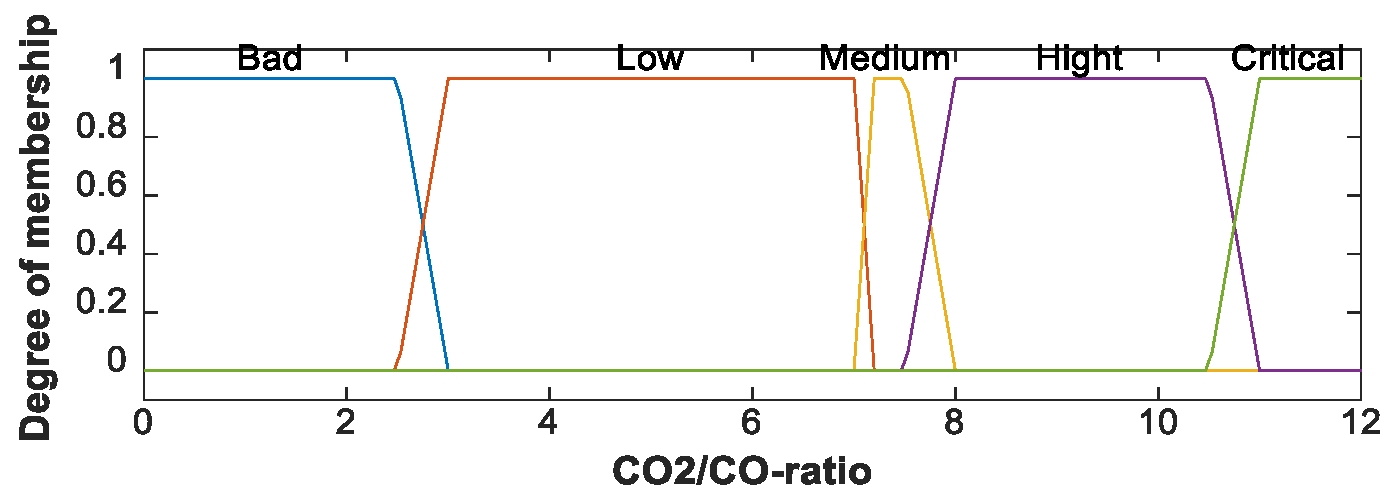
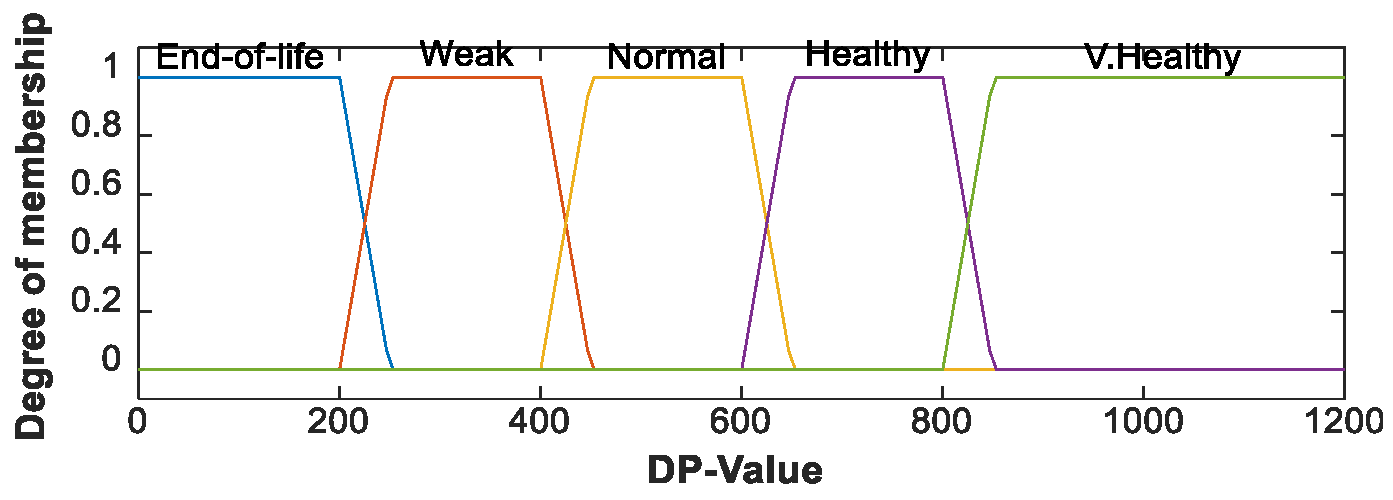
Established equations for the DP only evaluate the 2-FAL content to calculate its estimates. The imprecise outcomes from considering only the 2-FAL content were suggested in researches conducted by [33,34,35]. Moreover, they highlight the importance of the CO2/CO ratio to estimate the real degree of degradation of the insulating paper. This work implements a FIS approach to calculate the DP value, and entry parameters for this system are the furan content and the CO2/CO ratio. The membership functions of the entry criteria and the output of the FIS process are presented in Figure 1, Figure 2 and Figure 3.
According to the authors of [4], for the CO2/CO ratio, the respective values of CO2 and CO should exceed 5000 μL/L (ppm) and 500 μL/L (ppm) in order to improve the certainty factor. Additionally, a normal CO2/CO ratio should be around 7. Abu-Elanien et al. [29] state that a DP value higher than 700 represents an insulating paper with its mechanical properties closer to 100%.
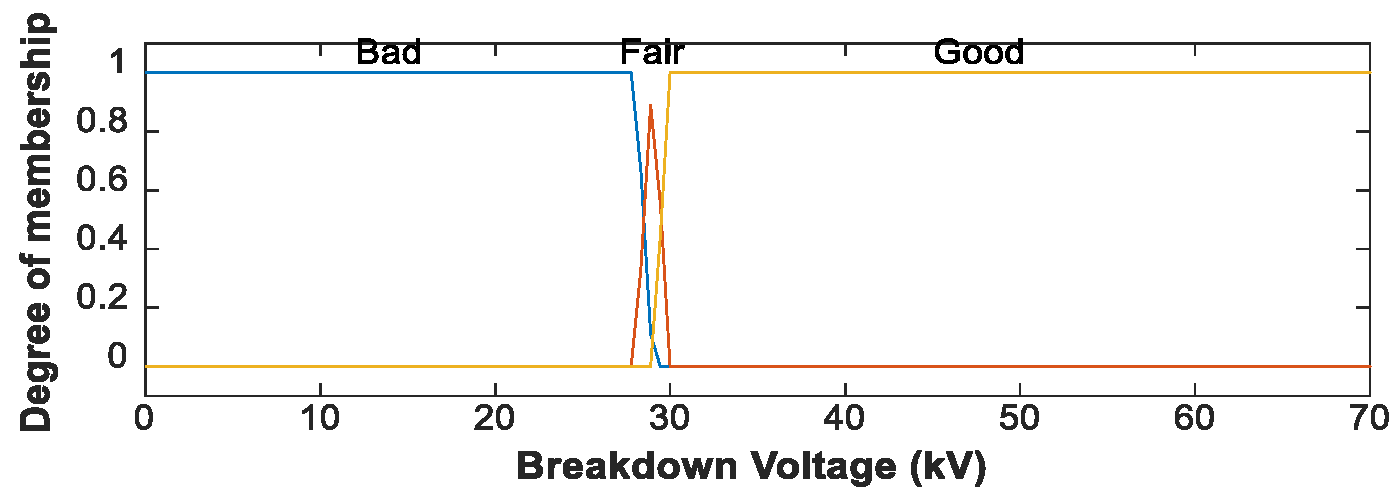
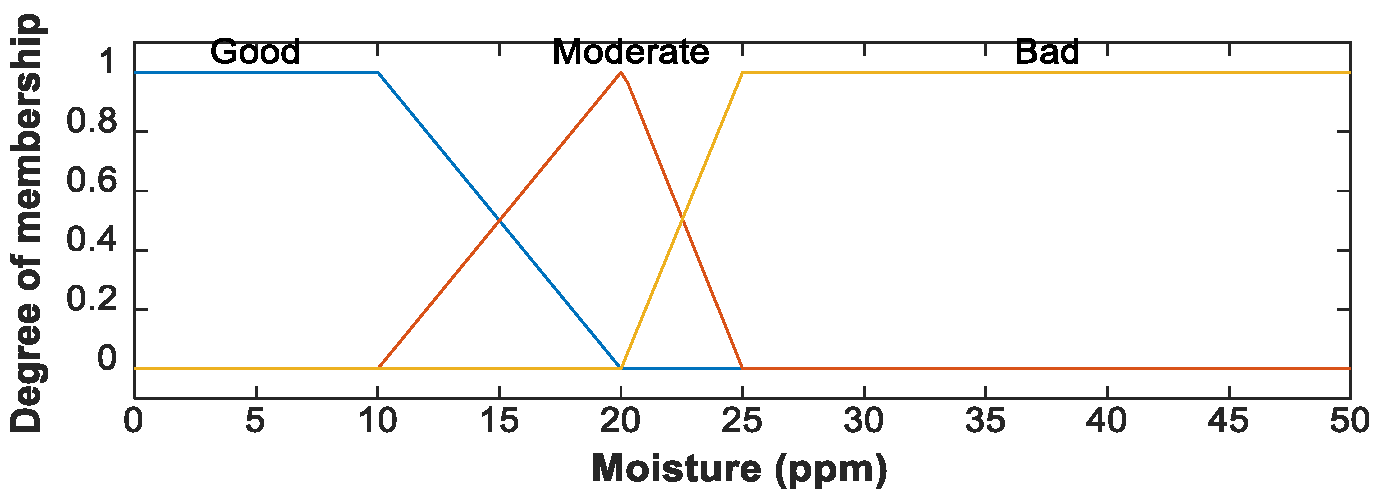
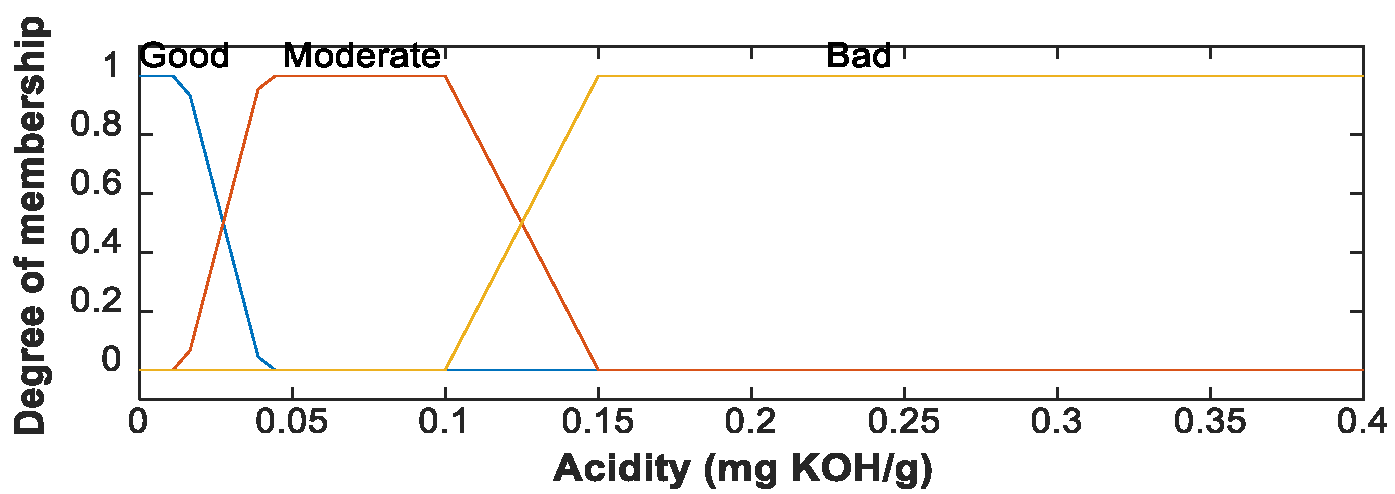
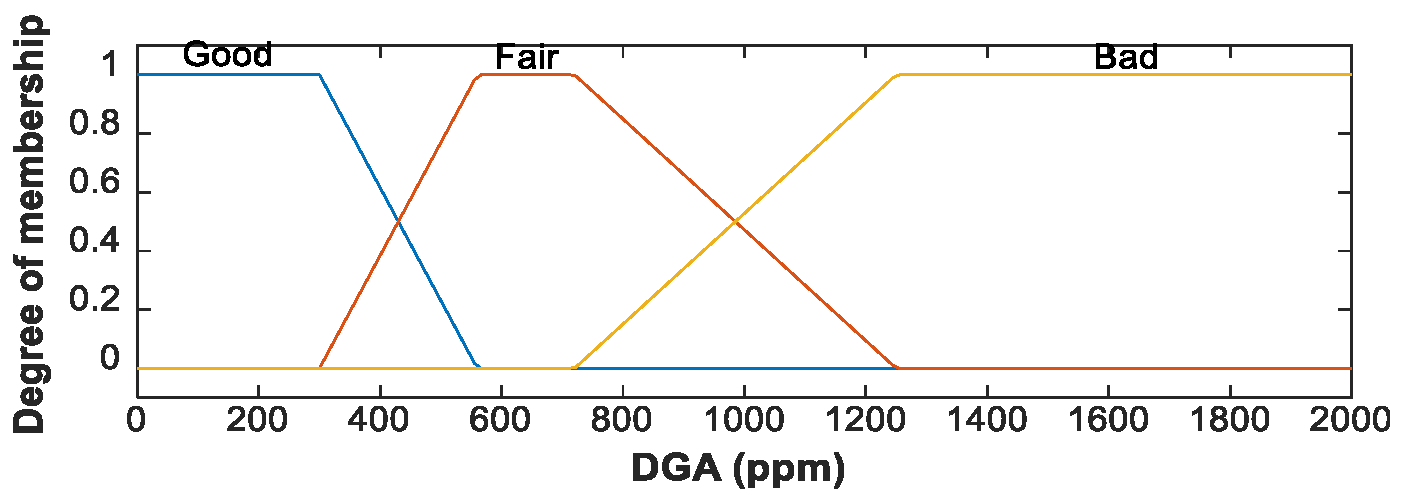
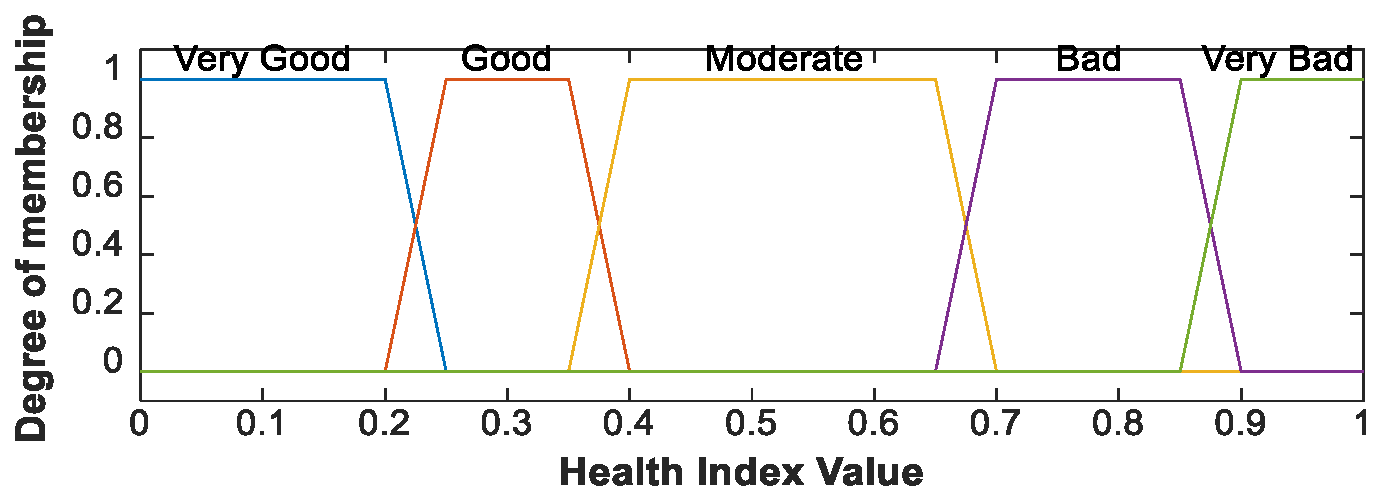
The set of membership functions for the breakdown voltage, moisture content, acidity, power factor, DGA and the final HI value, were taken from Ref. [9] and are shown in Figure 4, Figure 5, Figure 6, Figure 7, Figure 8 and Figure 9.
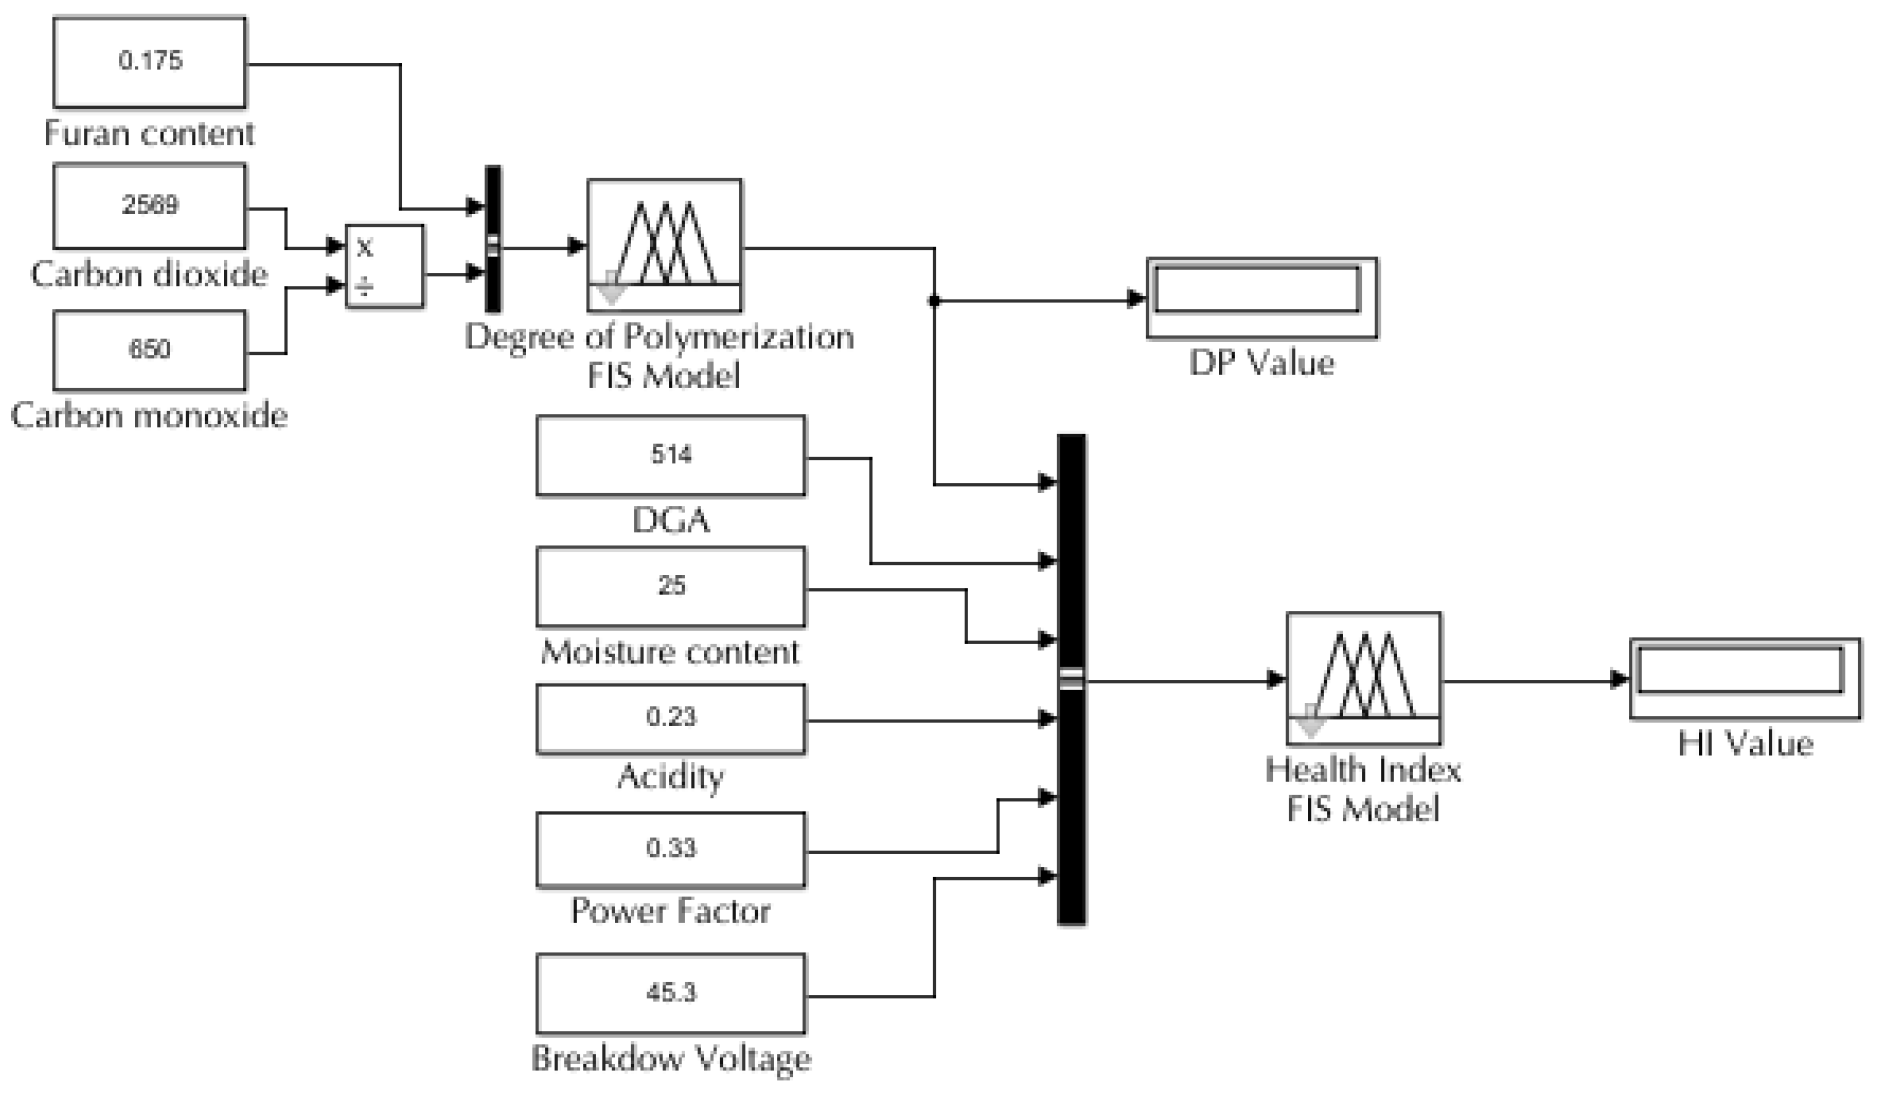
Using the Mamdani FIS methodology the linguistic entry values are integrated with the linguistic output using fuzzy inference rules. For the DP value, the methodology developed a set of 20 inference rules. Meanwhile, for the final HI value, a group of 80 rules was implemented. Once the output membership function is obtained, a defuzzification process takes place to convert the linguistic result into a numerical value. One can observe the complete HI fuzzy model in Figure 10.
2.2. Importance Index Estimation
The importance index (II) of a PT indicates the strategic relevance of the asset within the reliability context of the electrical power distribution system. It considers the unit’s technical parameters, the operational environment, and the penalties imposed by regulatory entities. For this work, there are a set of 11 criteria to determine the II; each criterion can take an integer value between 1 and 3. The final value for the II can be inferred using Equation (2).
where II indicates the importance index of the PT, Sii is the score assigned to each criterion, Smaxii represents the maximum possible value, in this case, a value of three, and Wii is the respective weight of each entry parameter. As stated before, those criteria can only take integer values between 1 and 3. For this reason, a normalizing process was carried out to obtain an II value between zero and one. For that purpose, Equation (3) was used.
where IImax and IImin represent the maximum and minimum values that II can take, for this work, those values are one and one-third. Values close to zero indicate the low strategic importance of the PT, whereas values close to one denote a high relevance of the asset. The 11 criteria chosen for this method and their respective weights are presented in Table 1.
The N-1 criterion indicates the ability of the system to handle a sudden disconnection of the PT and supply the demanded load. The critical loads’ criterion refers to essential loads such as hospitals, airports and continuous production factories, powered by the evaluated trans-formation unit. Mean load is the estimated average power provided by the transformer in the last 30 days, while the unavailability penalty criterion will depend on the regulations of each country. For this work, the measure is based on Argentina’s energy regulator provisions.
2.3. Risk Assessment
Once the HI and II have been calculated, the risk of the unit can be found. Traditionally, the risk index (RI) is obtained by multiplying the HI and the II, then, a list or ranking is generated to determine which assessed units should be prioritized. However, under the context of fleet analysis, an asset manager goal’s is to arrange the units in groups with similar conditions to implement suitable maintenance strategies. To achieve this goal, risk matrices whose axes are the HI and the II will be used. The k-means clustering technique is applied to establish the groups or clusters of PT.
K-means is considered one of the simplest unsupervised learning algorithms that solve the well-known clustering problem [36]. The procedure follows a simple and easy way to classify a given data set through a certain number of clusters (assume k-clusters) fixed a priori. This algorithm has as a goal the minimization of an objective function known as the mean square error (MSE) and it is given by (4).
where is the Euclidean distance between xi and vj, cj corresponds to the number of data points in the cluster ith and c is the number of centroids.
In this paper, three groups or clusters will be designated to assess the risk of units with similar HI and II as a means to define proper maintenance schemes. Cluster 1 indicates the PT with the lower risk meanwhile Cluster 3 encloses the units that should be prioritized.
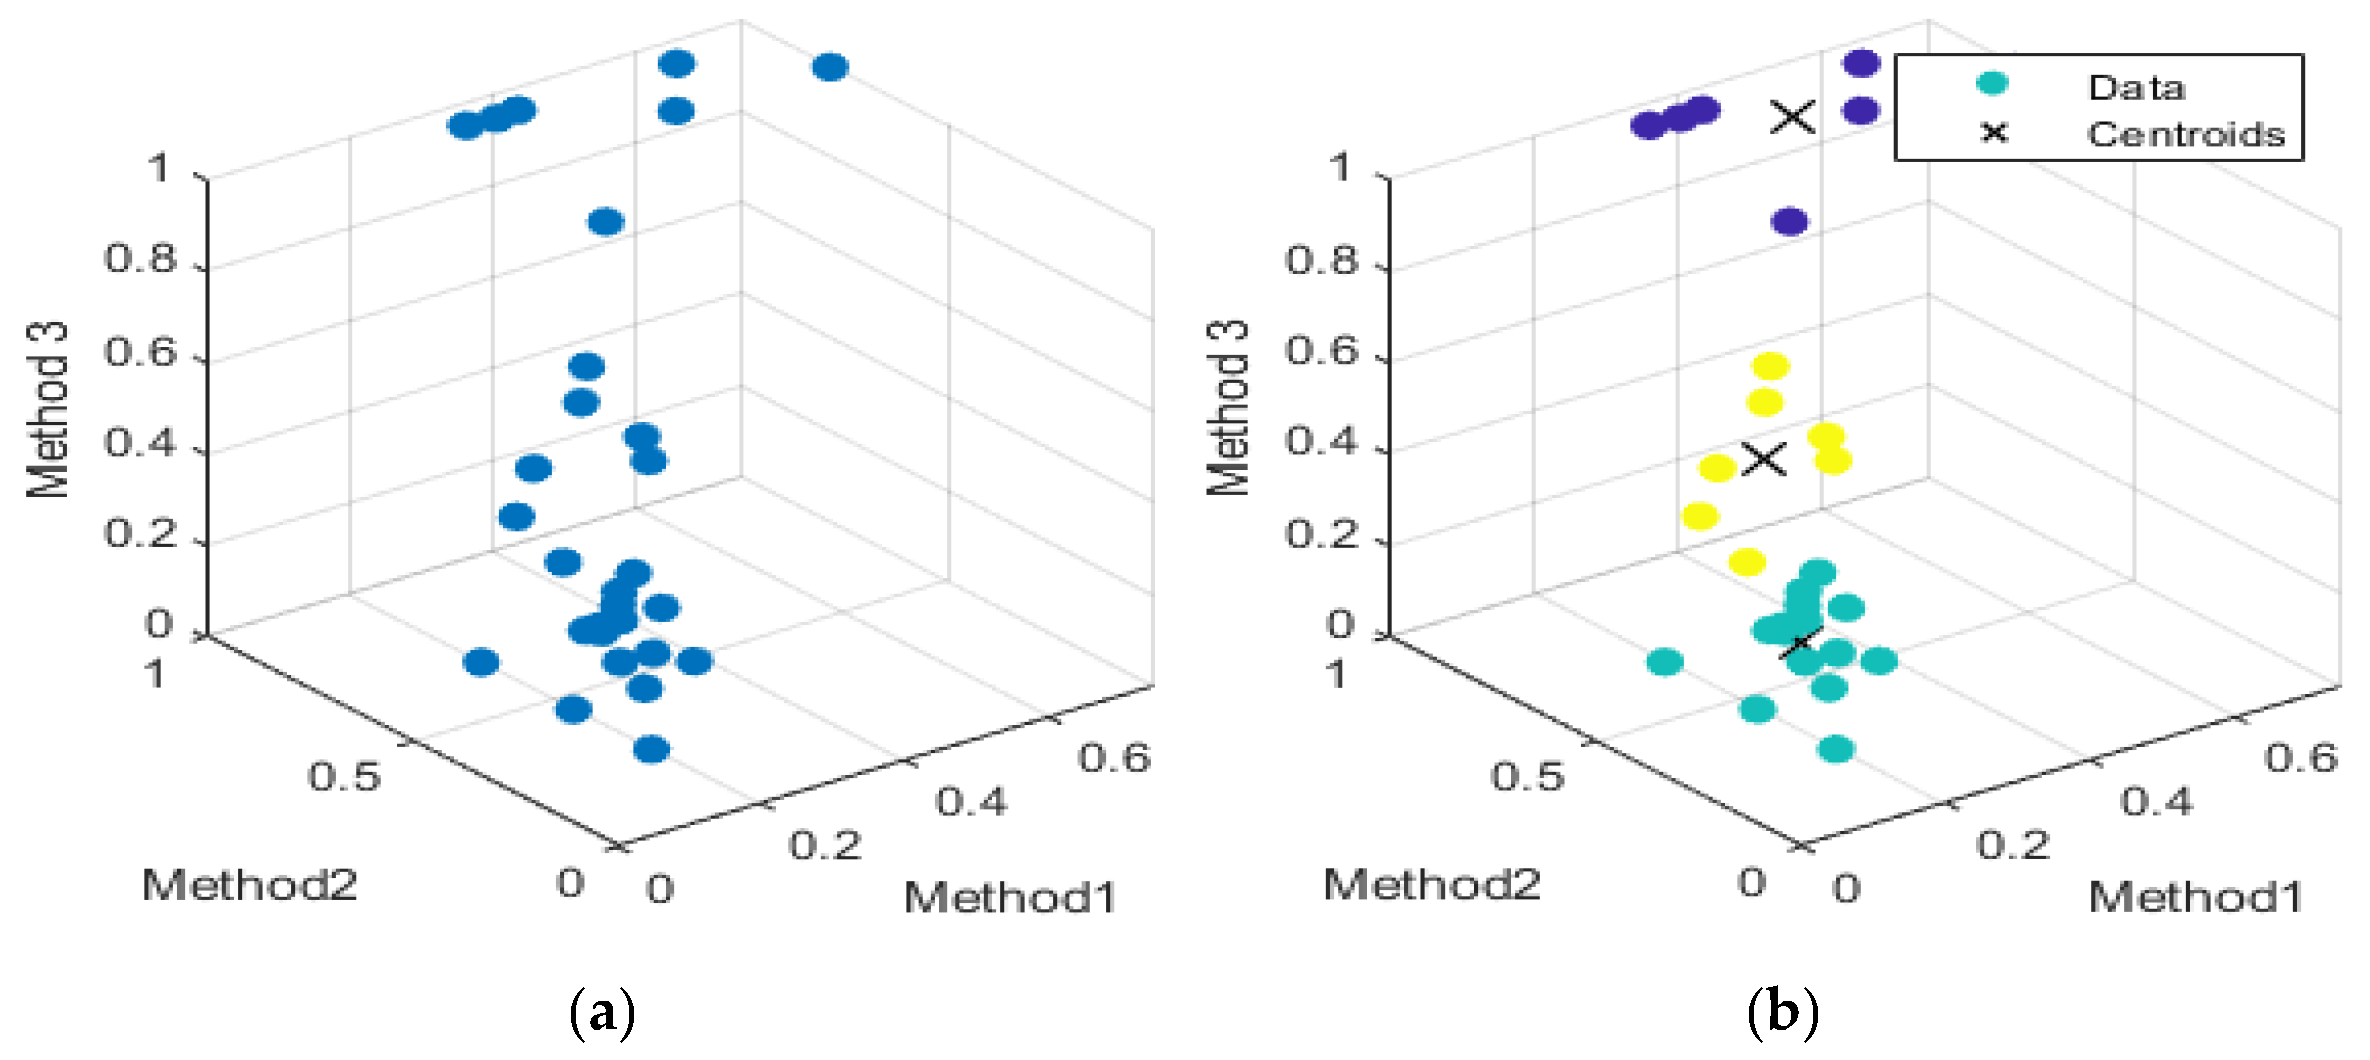
Figure 11a,b presents a data set example before and after the k-means clustering technique is applied.
3. Case Study, Results and Discussion
Researchers tested the proposed methodology presented in the previous sections in a PT fleet composed of 19 units. Table 2 summarizes the main results of the diagnostic tests, meanwhile, Table 3 presents the operative features of the whole fleet.
Once the results for the HI and the II were obtained, the risk was assessed with the k-means technique, and, as a means of comparison; the RI and DP values were also calculated employing the HI*II approach and Chendong’s equation.
The corresponding scores calculated as per values of transformer parameters for the DP value, HI, II, cluster membership and the RI using the HI*II approach are shown in Table 4.
In accordance with Teymouri and Vahidi, who in their work [35] indicated that a good DP estimator should fall within ±20% of the measured DP value or the calculated DP employing Chendong’s equation, it can be noted that the proposed method agrees with this condition. There are four exceptions, units 3, 7, 18 and 19; whose DP values differ more than ±20 percent compared with Chendong’s estimates. For units 3 and 19, their values are greater than Chendong’s method; that can be explained by the low furan content and the good CO2/CO ratio of the PT. Meanwhile, for units 7 and 18 whose values are lower than Chendong’s, their respective CO2/CO ratios are 1.35 and 12.49. According to [4] CO2/CO ratios lower than 3 may be an indication of a fault in the insulating paper, while CO2/CO ratios higher than 10 may indicate accelerated thermal degradation at low temperature. The proposed method for the DP includes these considerations in its algorithm, thus the differences with Chendong’s equation are justified. It also serves as an indicator of the importance of the CO2/CO relationship in determining the real state of the insulating paper. The proposed methodology ensures a more comprehensive estimate of the condition of the insulating paper. However, it was noted a certain degree of inelasticity in the results. This can be attributable to the nature of the trapezoidal fuzzy membership functions (TFMF), where they maintain the same value unless the input value moves to an interception zone between membership functions or another function at all.
For the technical condition of the PT, those units 3, 17, 18 and 19 were the units with the most satisfactory HI results. Similarly, the units with the worst condition were PTs number 7, 8, 10 and 16. For the rest of the assessed fleet, the HI values vary from 0.35 to 0.8 indicating an intermediate condition. Furthermore, most of the transformers with high HI values present very low DP estimations. This is in agreement with [37] who states that once a unit has reached DP values lower than 250, it is considered that it has entered the end-of-life stage.
The II assessment results for the PT fleet show a certain degree of uniformity in the final results, with II values between 0.3 and 0.7. It can be noted that unit 10 which presents a high HI value has a relatively low strategic importance. Meanwhile, unit 18, which has the best technical condition in the fleet, also presents a higher II than unit 10. This can be explained by the independence in the calculation of indices, as well as the location and operative voltage of the units. PT number 10 has a voltage of 132/33 kV and operates in a rural environment. In contrast, PT number 18 works in a more demanding urban setting and has an operative voltage of 220/132 kV. Therefore, the critical condition of the asset in the system is higher. Units 4 and 13 have the highest II value operating at extra-high voltages (EHV) of 500/132 kV.
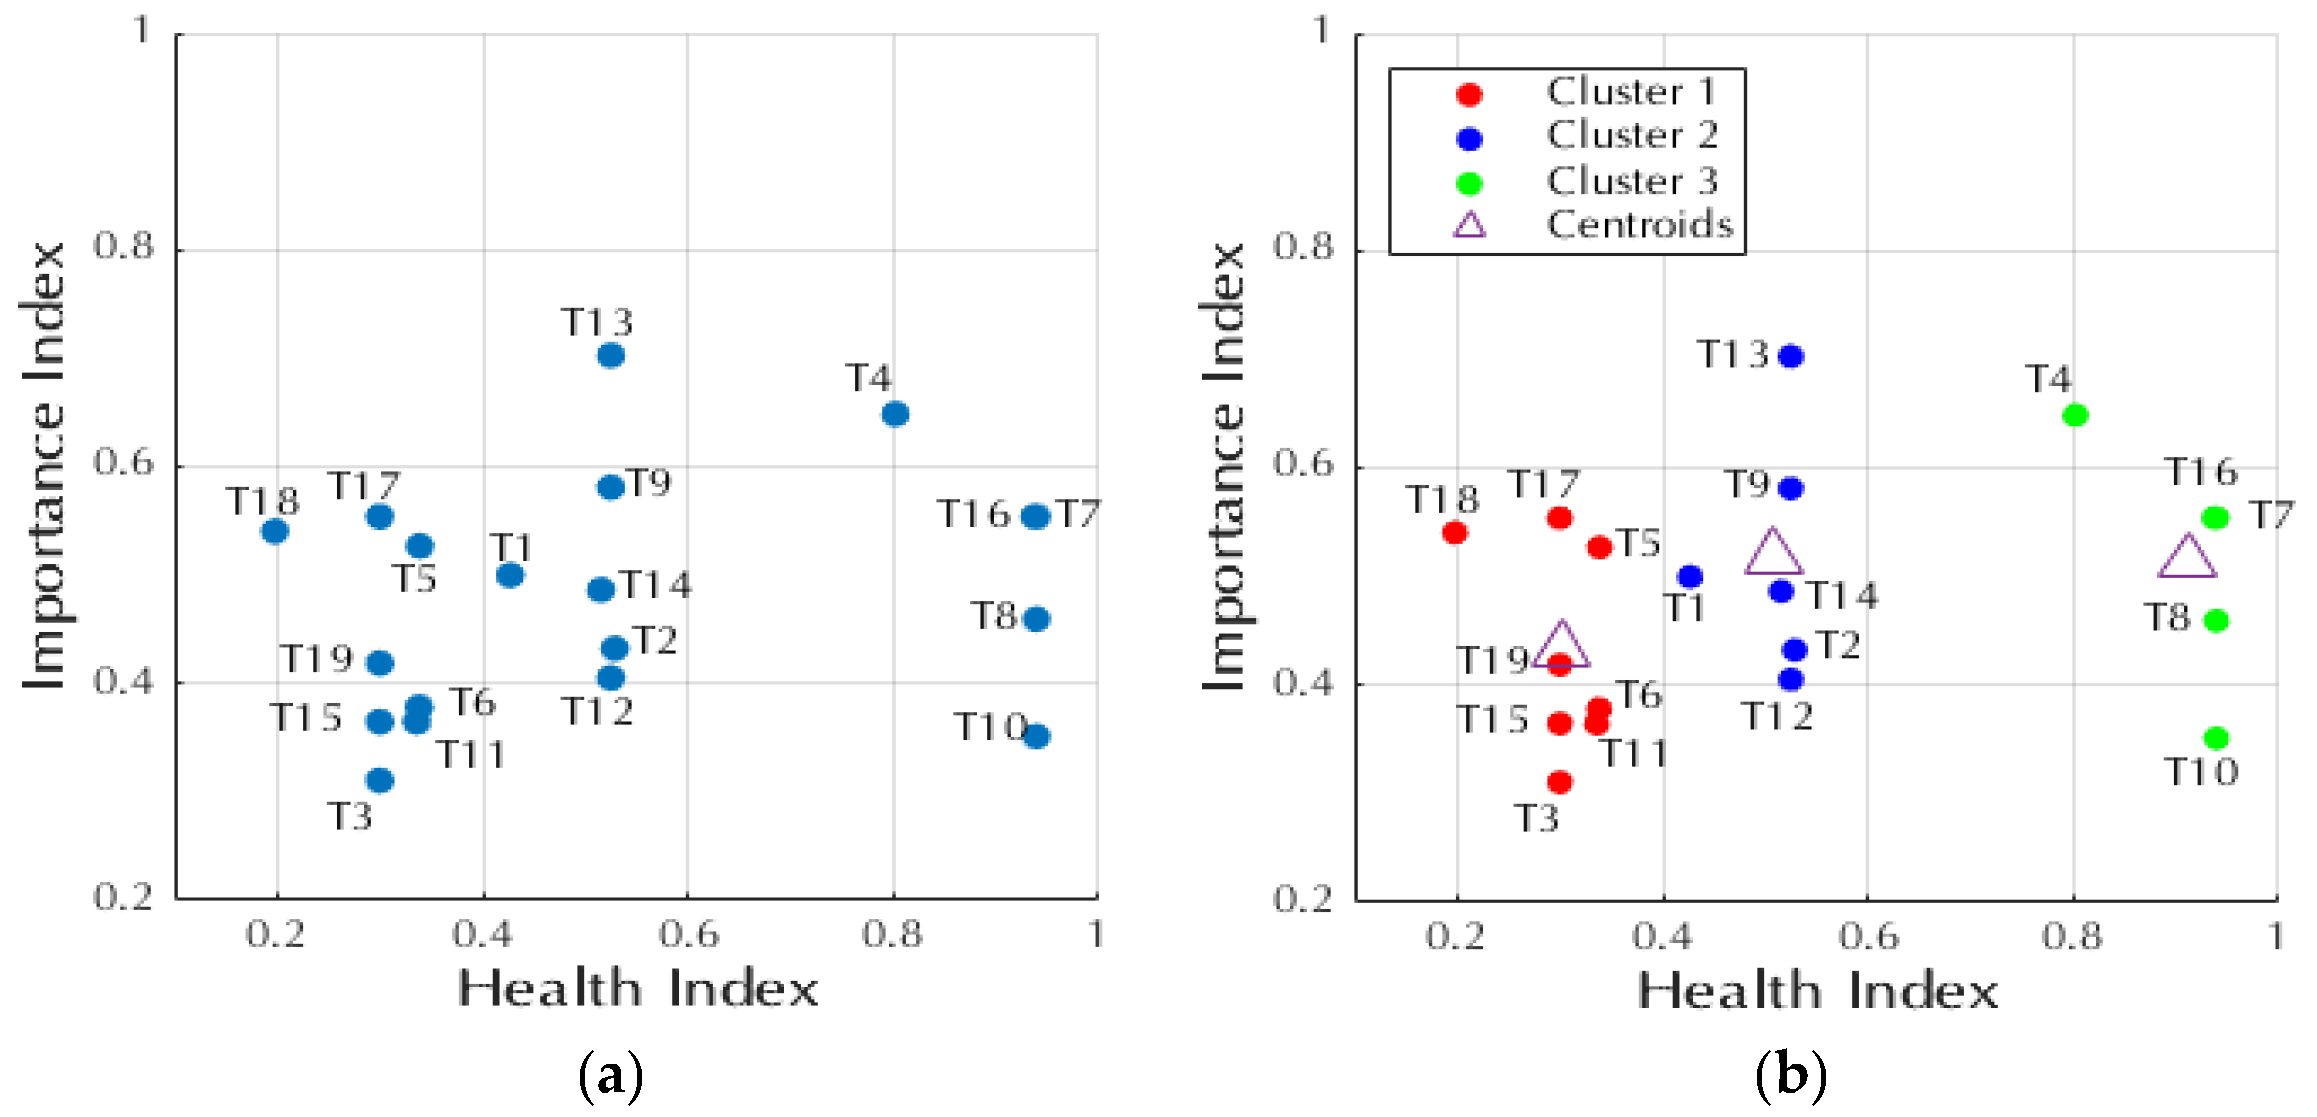
The risk of the fleet can be assessed with the HI and II calculated. As stated before, three groups or clusters were defined using the k-means clustering technique. Out of the 19 units, 8 were placed in cluster number one, 6 in cluster number two and the remaining 5 PT in cluster number three. The units in the risk matrix are presented in Figure 12a, while the cluster arrangements are displayed in Figure 12b.
The placement of the units on the risk matrix in Figure 12a allows a better understanding of the HI and II when combined. Also, it can be discerned how a high percentage of the units are concentrated in the lower left quadrant. An objective categorization of the units in groups using traditional methods might be challenging. Therefore, to solve this obstacle the proposed k-means technique is applied.
Figure 12b shows that the k-means technique defined three clusters, in which the PT belonging to cluster number three was the easiest to disaggregate from the rest of the units. Furthermore, cluster three represents the units with the highest risk. Hence the units where the most thorough and immediate maintenance measures will be needed.
As for clusters number one and two, the units were closer to each other and the manual allocation could be difficult. However, with the k-means technique as a non-supervised ML method, the allocation of units in a particular cluster is done automatically by comparing Euclidean distances and the minimization of the MSE. This allocation of units is mainly observed in units 1 and 5 which were close to both centroids number one and number two. Nevertheless, unit 5 was allocated in cluster number one and unit 1 was allocated in cluster number two.
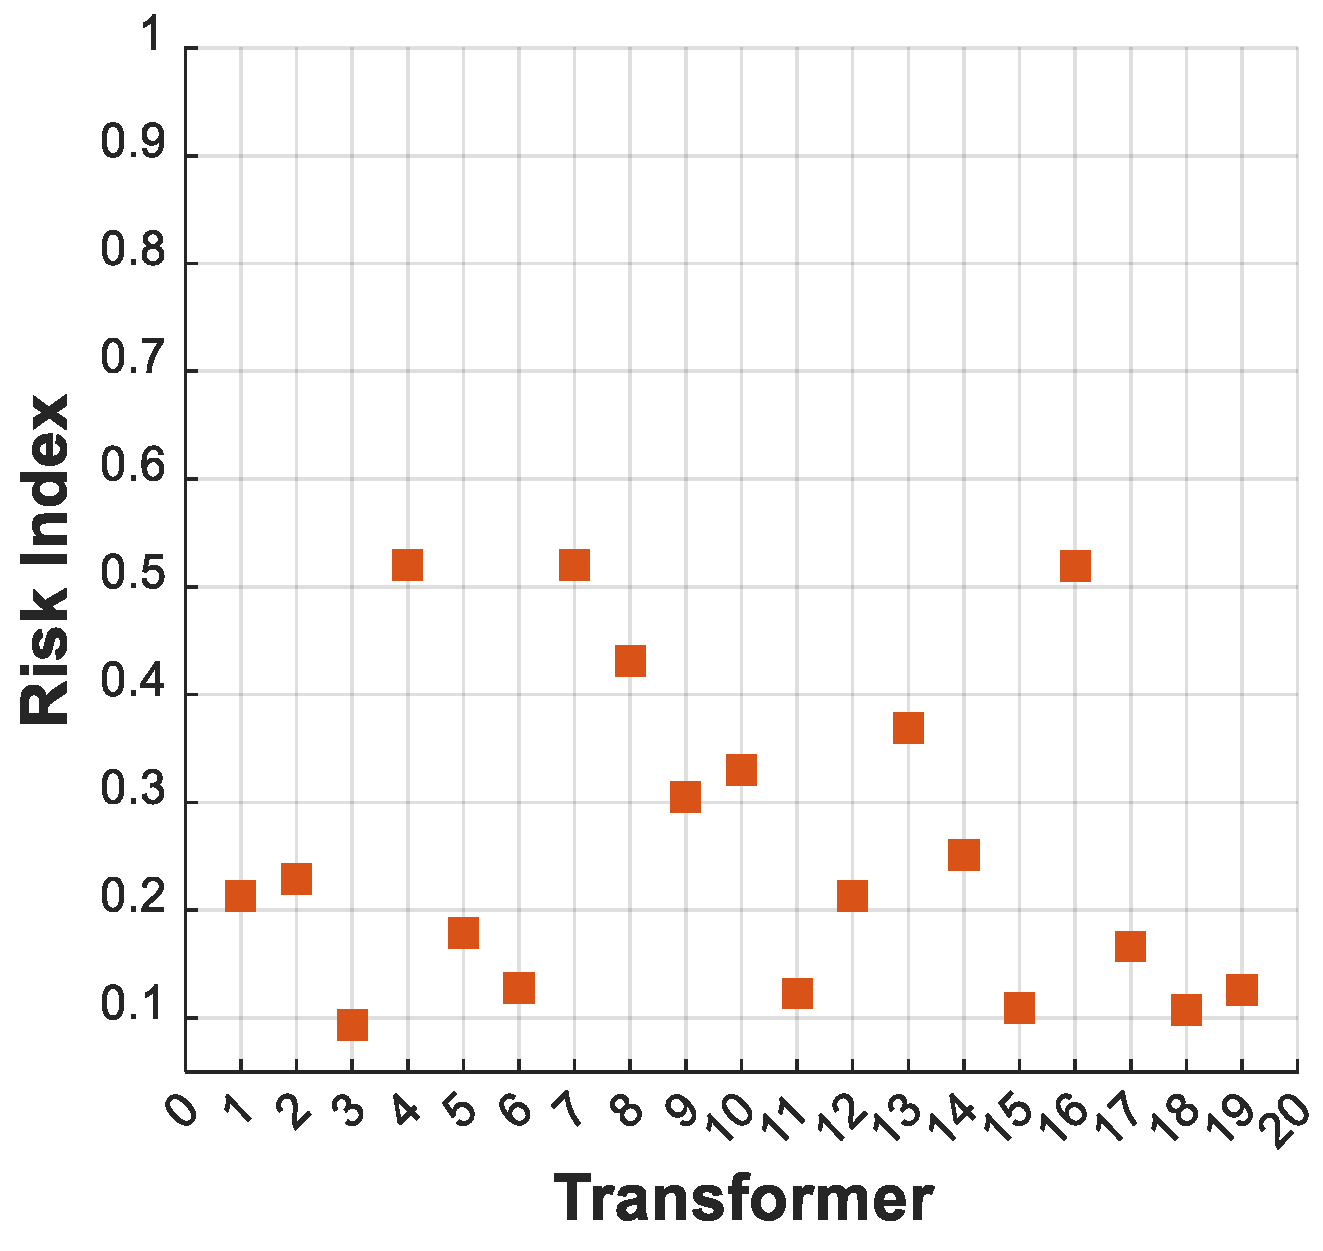
The RI using the HI*II approach was plotted in Figure 13. The units with higher risk were PT 4, 7, 8 and 16. The method failed to categorize PT 10 as a unit with high risk, moreover, the classification of the remaining units becomes fuzzy and subjective.
The main advantage of the proposed methodology is its capacity to categorize the PT according to their condition into groups. This is particularly useful when dealing with large fleets of PT. In case an individual assessment is required, the use of the traditional RI calculation technique is advised. In view of these findings, it can be assumed that the proposed method has the capabilities of estimating the risk in PT fleets that can be embraced by utility expects for asset management.
4. Conclusions
This paper proposes a new approach to assess the risk in power transformer fleets. This approach examines the technical condition and the strategic importance of the units to create clusters of PTs with similar risks. The researchers have tested a fleet of 19 units to validate the proposed method, and the results showed the method’s viability.
Additionally, a new fuzzy-based approach was developed to improve the accuracy and consistency of the transformer insulation estimation. It considers the furan content and the CO2/CO ratio, which several studies have proven to play a critical role in correctly assessing the DP in the insulating paper. The results showed an accurate assessment of the condition of the insulation paper. Although the fuzzy-based approach exhibited a certain degree of inelasticity, this can be reduced by using a higher number of membership functions by criterion or by replacing the trapezoidal with triangular or Gaussian distribution functions.
The technical condition was estimated using a fuzzy-based HI proposed in the literature with the DP calculation method. The strategic importance was measured with a weighting technique and taking into consideration critical operative aspects of the units, such as location, voltage, rated power, the existence of critical loads and security levels.
Finally, the assessed units were plotted in the risk matrix and classified into clusters using the k-means clustering technique. This novel approach proved superior to the classical RI calculation to support asset managers in the maintenance decision-making process. Given the ability of the k-means technique to categorize the units, not as individuals but as groups. From which it is possible to make joint maintenance decisions. A reasonable risk assessment tool can facilitate PT reliability, enhance its residual life span, and also be a preventive indicator of the need for replacement.
As a continuation of this research, the authors recommend that future investigations should be aimed at the development of an asset management algorithm that combines the risk assessment method proposed in this work and other references, using data fusion techniques. In addition, risk assessment techniques should be combined with analysis and decision-making methodologies, for example, to define maintenance strategies based on the found TP clusters.
Author Contributions
Conceptualization, D.A.Z.; Methodology, D.A.Z. and A.A.R.; Software, D.A.Z.; Formal analysis, D.A.Z.; Writing—Original Draft, D.A.Z.; Supervision A.A.R. and S.R; Writing—Review and Editing, Supervision A.A.R. and S.R.R.; Investigation, D.A.Z. and A.A.R.; Visualization, S.R.R. All authors have read and agreed to the published version of the manuscript.
Funding
This research received no external funding.
Institutional Review Board Statement
Not applicable.
Informed Consent Statement
Not applicable.
Data Availability Statement
Not applicable.
Conflicts of Interest
The authors declare no conflict of interest.
References
- Rønneberg, T. Cost-Benefit Analysis of Maintenance Measures for Power Transformers. Master’s Thesis, Norwegian University of Science and Technology’s, Trondheim, Norway, 2017. [Google Scholar]
- Guy, P.; Sparling, B. Transformer asset life extension—When, why and how to apply continuous condition monitoring systems. In Proceedings of the 2019 IEEE PES GTD Grand International Conference and Exposition Asia (GTD Asia), Bangkok, Thailand, 20–23 March 2019; pp. 779–784. [Google Scholar] [CrossRef]
- IEC 60422, I.E.C. IEC 60422: Mineral Insulating Oils in Electrical Equipment—Supervision and Maintenance Guidance, 4th ed.; International Electrotechnical Commission (IEC): Geneva, Switzerland, 2013; ISBN 2831886376. [Google Scholar]
- IEEE Std C57.104TM-2019. IEEE Guide for the Interpretation; IEEE SA Standards Board, Ed.; IEEE Power and Energy Society: Piscataway, NJ, USA, 2019; Volume 2019, ISBN 9781504459730. [Google Scholar]
- IEEE Std C57.152-2013, I.P. and E. IEEE Guide for Diagnostic Field Testing of Fluid-Filled Power Transformers, Regulators and Reactors; IEEE: Manhattan, NY, USA, 2013; Volume 2013, ISBN 9780738183695. [Google Scholar]
- Jian, W.; Wenbing, Z.; Chao, G.; Demeng, B.; Kuihua, W. The new developed health index for power transformer condition assessment. In Proceedings of the 2020 5th Asia Conference on Power and Electrical Engineering (ACPEE), Chengdu, China, 4–7 June 2020; pp. 1880–1884. [Google Scholar] [CrossRef]
- Li, E.W.; Song, B. Transformer Health status evaluation model based on multi-feature factors. In Proceedings of the 2014 International Conference on Power System Technology, Chengdu, China, 2–22 October 2014. [Google Scholar]
- Tamma, W.R.; Prasojo, R.A.; Suwarno, S. Assessment of High voltage power transformer aging condition based on health index value considering its apparent and actual age. In Proceedings of the 2020 12th International Conference on Information Technology and Electrical Engineering, Yogyakarta, Indonesia, 6–8 October 2020; pp. 292–296. [Google Scholar] [CrossRef]
- Cerón, A.F.; Echeverry, D.F.; Aponte, G.; Romero, A.A. Índice de salud para transformadores de potencia inmersos en aceite mineral con voltajes entre 69kV y 230kV usando lógica difusa. Inf. Tecnol. 2015, 26, 107–116. [Google Scholar] [CrossRef] [Green Version]
- Schneider, J.; Gaul, A.; Neumann, C.; Hogräfer, J.; Wellßow, W.; Schwan, M.; Schnettler, A. Asset management techniques. Int. J. Electr. Power Energy Syst. 2006, 28, 643–654. [Google Scholar] [CrossRef] [Green Version]
- Eyuboglu, O.H.; Dindar, B.; Gul, O. Risk assessment by using failure modes and effects analysis (fmea) based on power transformer aging for maintenance and replacement decision. In Proceedings of the 2020 2nd Global Power, Energy and Communication Conference, Izmar, Turkey, 20–23 October 2020; pp. 251–255. [Google Scholar] [CrossRef]
- Schulmerich, M.; Leporcher, Y.-M.; Eu, C.-H. Applied asset and risk management. In Management for Professionals; Springer: Berlin/Heidelberg, Germany, 2015. [Google Scholar]
- Sun, Y.Y.; Wang, X.; Zheng, Y.H.; Li, L.X.; Xu, Q.S. Application of FTA and improved FAHP in power transformer risk assessment. Adv. Mater. Res. 2014, 860–863, 2157–2160. [Google Scholar] [CrossRef]
- Vasquez, W.A.; Jayaweera, D. Risk-based approach for power transformer replacement considering temperature, apparent age and expected capacity. IET Gener. Transm. Distrib. 2020, 14, 4898–4907. [Google Scholar] [CrossRef]
- Bustamante, K.C.; Borja, W.P.; Miranda, B.B.; Zhunio, L.A.; Medina, R.D. Power Transformers risk index assessment in the ecuadorian context. In Proceedings of the 2016 IEEE International Conference on Automatica, Curico, Chile, 19–21 October 2016; pp. 1–6. [Google Scholar] [CrossRef]
- Lin, D.; Xu, Y.Y.; Liang, Y.; Li, Y.; Liu, N.; Zhang, G.J. A risk assessment method of transformer considering the economy and reliability of power network. In Proceedings of the 2017 1st International Conference on Electrical Materials and Power Equipment, Xi’an, China, 14–17 May 2017; pp. 594–597. [Google Scholar] [CrossRef]
- Schmitz, W.I.; Feil, D.L.P.; Canha, L.N.; Abaide, A.R.; Marchesan, T.B.; Carraro, R. Operational vulnerability indicator for prioritization and replacement of power transformers in substation. Int. J. Electr. Power Energy Syst. 2018, 102, 60–70. [Google Scholar] [CrossRef]
- Suwanasri, T.Y.; Suwanasri, C.; Phadungthin, R. Risk assessment based on condition and importance criteria for power transformer in thailand transmission network. IEEJ Trans. Electr. Electron. Eng. 2015, 10, 18–27. [Google Scholar] [CrossRef]
- Jürgensen, J.H.; Godin, A.S.; Hilber, P. Health index as condition estimator for power system equipment: A critical discussion and case study. CIRED—Open Access Proc. J. 2017, 2017, 202–205. [Google Scholar] [CrossRef] [Green Version]
- Hughes, D.T. The use of health indices to determine end of life and estimate remnant life for distribution assets. In Proceedings of the 17th International Conference on Electricity Distribution, Barcelona, Spain, 12–15 May 2003; pp. 12–15. [Google Scholar]
- Jahromi, A.; Piercy, R.; Cress, S.; Service, J.; Fan, W. An approach to power transformer asset management using health index. IEEE Electr. Insul. Mag. 2009, 25, 20–34. [Google Scholar] [CrossRef]
- Naderian, A.; Cress, S.; Piercy, R.; Wang, F.; Service, J. An approach to determine the health index of power transformers. In Proceedings of the Conference Record of the 2008 IEEE International Symposium on Electrical Insulation, Vancouver, BC, Canada, 9–12 June 2008; pp. 192–196. [Google Scholar] [CrossRef]
- Yahaya, M.S.; Azis, N.; Abidin Ab Kadir, M.Z.; Jasni, J.; Hairi, M.H.; Talib, M.A. Estimation of transformers health index based on the markov chain. Energies 2017, 10, 1824. [Google Scholar] [CrossRef] [Green Version]
- Mharakurwa, E.T.; Goboza, R. Multiparameter-based fuzzy logic health index assessment for oil-immersed power transformers. Adv. Fuzzy Syst. 2019, 2019, 7–15. [Google Scholar] [CrossRef] [Green Version]
- Islam, M.M.; Lee, G.; Hettiwatte, S.N. Application of a general regression neural network for health index calculation of power transformers. Int. J. Electr. Power Energy Syst. 2017, 93, 308–315. [Google Scholar] [CrossRef]
- Idrees, M.; Riaz, M.T.; Waleed, A.; Paracha, Z.J.; Raza, H.A.; Khan, M.A.; Hashmi, W.S. Fuzzy logic based calculation and analysis of health index for power transformer installed in grid stations. In Proceedings of the 2019 international symposium on recent advances in electrical engineering, Islamabad, Pakistan, 28–29 August 2019; Volume 4, pp. 1–6. [Google Scholar] [CrossRef]
- Patil, A.J.; Singh, A.; Jarial, R.K. A novel fuzzy based technique for transformer health index computation. In Proceedings of the 2019 International Conference on Advances in Computing, Communication and Control, Cochin, India, 6–8 November 2019. [Google Scholar] [CrossRef]
- Ranga, C.; Chandel, A.K.; Chandel, R. Expert system for condition monitoring of power transformer using fuzzy logic. J. Renew. Sustain. Energy 2017, 9, 044901. [Google Scholar] [CrossRef]
- Abu-Elanien, A.E.B.; Salama, M.M.A.; Ibrahim, M. Calculation of a health index for oil-immersed transformers rated under 69 kv using fuzzy logic. IEEE Trans. Power Deliv. 2012, 27, 2029–2036. [Google Scholar] [CrossRef]
- Nezami, M.M.; Wani, S.A.; Khan, S.A.; Khera, N.; Khan, M.A. Fuzzy approach for residual life assessment of paper insulation. In Proceedings of the 2017 3rd International Conference on Condition Assessment Techniques in Electrical Systems, Rupnagar, India, 16–18 November 2017; pp. 26–30. [Google Scholar] [CrossRef]
- Sutan Chairul, I.; Ab Ghani, S.; Ahmad Khiar, M.S.; Md Thayoob, Y.H.; Yang Ghazali, Y.Z. Kraft paper insulation’s life assessment and effects of oxygen and moisture to paper insulation’s deterioration rate. In Proceedings of the 2012 IEEE International Conference on Power and Energy, Kota Kinabalu, Malaysia, 2–5 December 2012; pp. 728–731. [Google Scholar] [CrossRef]
- Tang, X.; Su, Z.; Chen, P.; He, C. Study on the influence of oil replacement on furfural content in transformer oil and insulation aging assessment. Available online: https://0-iopscience-iop-org.brum.beds.ac.uk/article/10.1088/1757-899X/782/2/022087/meta. (accessed on 30 September 2021).
- Banovic, M.; Ramachandran, P.; Rego, N.; Justiz, P. Significance of CO2/CO ratio in dissolved gas analysis. Transform. Mag. 2015, 2, 2–6. [Google Scholar]
- Cox, R. The history and significance of the carbon oxide ratio. In Proceedings of the 2019 IEEE 20th International Conference on Dielectric Liquids (ICDL), Rome, Italy, 23–27 June 2019; pp. 1–4. [Google Scholar] [CrossRef]
- Teymouri, A.; Vahidi, B. CO2/CO concentration ratio: A complementary method for determining the degree of polymerization of power transformer paper insulation. IEEE Electr. Insul. Mag. 2017, 33, 24–30. [Google Scholar] [CrossRef]
- Smith, J. Data Clustering Algorithms—k-Means Clustering Algorithm. Available online: https://sites.google.com/site/dataclusteringalgorithms/k-means-clustering-algorithm (accessed on 9 August 2021).
- Medina, R.D. Desarrollo de indicadores para el análisis de riesgo en parques de transformadores de potencia dentro de un contexto de gestión de activos físicos. Fac. Ing. 2017, 2017, 247. [Google Scholar]
Figure 1.
Membership functions for furan content.

Figure 2.
Membership functions for CO2/CO ratio.

Figure 3.
Membership functions for output DP value.

Figure 4.
Membership functions for Breakdown voltage.

Figure 5.
Membership functions for moisture content.

Figure 6.
Membership functions for acidity.

Figure 7.
Membership functions for power factor.

Figure 8.
Membership functions for DGA.

Figure 9.
Membership functions for the final HI.

Figure 10.
Health index fuzzy model.

Figure 11.
(a) Data set example without clustering technique applied.; (b) Data set example organized employing k-means clustering technique.
Figure 11.
(a) Data set example without clustering technique applied.; (b) Data set example organized employing k-means clustering technique.

Figure 12.
(a) Transformers fleet in the risk matrix.; (b) Transformers fleet in the risk matrix with k-means clustering technique applied.
Figure 12.
(a) Transformers fleet in the risk matrix.; (b) Transformers fleet in the risk matrix with k-means clustering technique applied.

Figure 13.
Risk Index of each unit employing the HI*II approach.


Table 1.
Criteria and score for the II.
| Criteria | Score | Weight | ||
|---|---|---|---|---|
| Low (1) | Medium (2) | High (3) | ||
| Manufacturer | Well Known | Known | Unknown | 1 |
| Type/Application | Mobile | Standby | In-service | 3 |
| Load Factor | <0.6 | 0.6–1.0 | >1.0 | 4 |
| Voltage (kV) | 132/33 or 132/13,2 | 220/132 | 500/220 | 4 |
| N-1 Criterion | Yes | N/A | No | 5 |
| Location | Rural | Urban | Industrial | 3 |
| Critical Loads | None | A Few | Several | 3 |
| Rated Power (MW) | <30 | 30–50 | >50 | 3 |
| Mean Load (MW) | <10 | 10–30 | >30 | 4 |
| Security Level 1. Alarm system 2. Oil Pitch 3. Distance between transformers more than 11 m or no transformers nearby 4. Fire extinguisher available 5 = None | 1&2&3&4 | 1, 2, 3, 4, 1&2, 1&3, 1&4, 2&3, 2&4, 3&4, 1&2&3, 1&2&4, 1&3&4, 2&3&4 | 5 | 3 |
| Unavailability penalty | 20 to 30 times | 50 times | 60 times | 4 |
Table 2.
Transformers fleet diagnostic test results.
| Health Index Criteria | ||||||||
|---|---|---|---|---|---|---|---|---|
| PT | Moisture (ppm) | Acidity (ppm) | Breakdown Voltage (kV) | Power Factor | DGA (ppm) | CO2 (ppm) | CO (ppm) | Furan (ppm) |
| 1 | 22 | 0.07 | 52 | 0.14 | 671 | 700 | 5495 | 0.25 |
| 2 | 23 | 0.13 | 44 | 0.264 | 1053 | 189 | 2011 | 1.37 |
| 3 | 16.5 | 0.058 | 61 | 0.174 | 142.15 | 697 | 3685 | 0.49 |
| 4 | 28 | 0.18 | 40 | 0.266 | 822 | 8197 | 22789 | 4.5 |
| 5 | 19 | 0.15 | 38 | 0.185 | 360 | 582 | 4567 | 1.1 |
| 6 | 26 | 0.09 | 48 | 0.249 | 359 | 892 | 7038 | 0.1 |
| 7 | 23.2 | 0.251 | 51.7 | 0.458 | 1690 | 1843 | 2492 | 5.76 |
| 8 | 33 | 0.19 | 35 | 0.593 | 2637 | 1582 | 12371 | 3.9 |
| 9 | 9 | 0.08 | 49 | 0.1 | 2608 | 669 | 6764 | 0.83 |
| 10 | 42 | 0.22 | 46 | 0.221 | 2093 | 299 | 2348 | 4.48 |
| 11 | 6 | 0.13 | 64 | 0.566 | 328 | 297 | 2323 | 0.22 |
| 12 | 11 | 0.05 | 70 | 0.113 | 1409 | 162 | 1139 | 0.16 |
| 13 | 9 | 0.04 | 71 | 0.068 | 1642 | 242 | 1883 | 0.03 |
| 14 | 6 | 0.03 | 66 | 0.207 | 1083 | 356 | 3347 | 0.09 |
| 15 | 10 | 0.03 | 55 | 0.15 | 37 | 902 | 7135 | 0.1 |
| 16 | 32 | 0.25 | 55 | 0.328 | 1309 | 1695 | 13345 | 5.1 |
| 17 | 19.46 | 0.139 | 33 | 0.9 | 103 | 964 | 4002 | 0.033 |
| 18 | 12.4 | 0.025 | 44.4 | 0 | 49 | 102 | 1274 | 0.036 |
| 19 | 13.6 | 0.085 | 30 | 0.2 | 66 | 542 | 2346 | 0.066 |
Table 3.
Transformers fleet operative features.
| Importance Index Criteria | ||||||||||
|---|---|---|---|---|---|---|---|---|---|---|
| Manufacturer | Type/ Application | Load Factor | Voltage | N-1 Criterion | Location | Critical Loads | Rated Power (MVA) | Mean Load (MVA) | Security Level | Unavailability Penalty |
| Known | In-service | 0.922 | 132/33 | Yes | Urban | Several | 85 | 59 | 1&4 | 20 to 30 times |
| Well-Known | In-service | 0.283 | 132/33 | Yes | Urban | Several | 85 | 73 | 2&3 | 20 to 30 times |
| Well-Known | In-service | 0.828 | 132/13.2 | Yes | Rural | Several | 20 | 16 | 1&2 | 20 to 30 times |
| Well-Known | In-service | 0.539 | 500/220 | No | Rural | Several | 50 | 25 | 2&3 | 60 times |
| Unknown | In-service | 1.183 | 132/13.2 | Yes | Urban | A few | 70 | 63 | 2 | 20 to 30 times |
| Well-Known | In-service | 0.371 | 132/33 | Yes | Industrial | Several | 45 | 18 | 1&4 | 20 to 30 times |
| Unknown | Standby | 0.000 | 500/220 | Yes | Urban | None | 55 | 39 | 1 | 60 times |
| Known | In-service | 0.585 | 220/132 | Yes | Rural | A few | 85 | 24 | 5 | 50 times |
| Known | In-service | 0.784 | 132/33 | No | Industrial | Several | 65 | 24 | 1&2&3&4 | 20 to 30 times |
| Well-Known | In-service | 0.361 | 132/33 | Yes | Rural | A few | 75 | 43 | 1&2&3 | 20 to 30 times |
| Known | Mobile | 0.269 | 132/13.2 | Yes | Urban | A few | 75 | 74 | 5 | 20 to 30 times |
| Known | In-service | 0.306 | 220/132 | N/A | Urban | None | 25 | 24 | 4 | 50 times |
| Well-Known | In-service | 0.657 | 500/220 | Yes | Industrial | A few | 100 | 87 | 4 | 60 times |
| Known | In-service | 0.268 | 132/13.2 | Yes | Industrial | Several | 85 | 32 | 3&4 | 20 to 30 times |
| Known | In-service | 0.236 | 132/33 | Yes | Urban | None | 65 | 31 | 3 | 20 to 30 times |
| Known | In-service | 0.844 | 220/132 | Yes | Urban | Several | 75 | 19 | 3 | 50 times |
| Well-Known | In-service | 0.648 | 132/13.2 | N/A | Urban | Several | 100 | 84 | 3 | 20 to 30 times |
| Well-Known | In-service | 0.294 | 220/132 | Yes | Industrial | A few | 75 | 36 | 1&2&3 | 50 times |
| Known | In-service | 0.350 | 220/132 | Yes | Rural | Several | 50 | 22 | 1&2&3 | 50 times |
Table 4.
Transformers fleet assessment results.
| PT | DP | Chendong’s DP | HI | II | Cluster | RI = HI*II |
|---|---|---|---|---|---|---|
| 1 | 705.077 | 603.446 | 0.4269 | 0.5000 | 2 | 0.21346 |
| 2 | 466.627 | 392.366 | 0.5288 | 0.4324 | 2 | 0.22867 |
| 3 | 1015.149 | 519.944 | 0.2830 | 0.3108 | 1 | 0.09324 |
| 4 | 228.619 | 244.796 | 0.8021 | 0.6486 | 3 | 0.52025 |
| 5 | 502.092 | 419.602 | 0.3389 | 0.5270 | 1 | 0.17863 |
| 6 | 725.149 | 717.143 | 0.3383 | 0.3784 | 1 | 0.12800 |
| 7 | 109.921 | 214.165 | 0.9392 | 0.5541 | 3 | 0.52038 |
| 8 | 262.539 | 262.553 | 0.9392 | 0.4595 | 3 | 0.43152 |
| 9 | 514.341 | 454.549 | 0.5250 | 0.5811 | 2 | 0.30507 |
| 10 | 234.680 | 245.349 | 0.9392 | 0.3514 | 3 | 0.32999 |
| 11 | 725.197 | 619.308 | 0.3360 | 0.3649 | 1 | 0.12260 |
| 12 | 725.077 | 658.823 | 0.5250 | 0.4054 | 2 | 0.21284 |
| 13 | 992.940 | 866.537 | 0.5250 | 0.7027 | 2 | 0.36892 |
| 14 | 725.077 | 730.216 | 0.5154 | 0.4865 | 2 | 0.25075 |
| 15 | 725.151 | 717.143 | 0.3200 | 0.3649 | 1 | 0.10946 |
| 16 | 217.397 | 229.266 | 0.9372 | 0.5541 | 3 | 0.51924 |
| 17 | 1015.149 | 854.710 | 0.2500 | 0.5541 | 1 | 0.16622 |
| 18 | 525.065 | 843.914 | 0.1979 | 0.5405 | 1 | 0.10699 |
| 19 | 1015.149 | 768.702 | 0.3000 | 0.4189 | 1 | 0.12568 |
Publisher’s Note: MDPI stays neutral with regard to jurisdictional claims in published maps and institutional affiliations. |
© 2021 by the authors. Licensee MDPI, Basel, Switzerland. This article is an open access article distributed under the terms and conditions of the Creative Commons Attribution (CC BY) license (https://creativecommons.org/licenses/by/4.0/).
Share and Cite
MDPI and ACS Style
Zaldivar, D.A.; Romero, A.A.; Rivera, S.R. Risk Assessment Algorithm for Power Transformer Fleets Based on Condition and Strategic Importance. Algorithms 2021, 14, 319. https://0-doi-org.brum.beds.ac.uk/10.3390/a14110319
AMA Style
Zaldivar DA, Romero AA, Rivera SR. Risk Assessment Algorithm for Power Transformer Fleets Based on Condition and Strategic Importance. Algorithms. 2021; 14(11):319. https://0-doi-org.brum.beds.ac.uk/10.3390/a14110319
Chicago/Turabian StyleZaldivar, Diego A., Andres A. Romero, and Sergio R. Rivera. 2021. "Risk Assessment Algorithm for Power Transformer Fleets Based on Condition and Strategic Importance" Algorithms 14, no. 11: 319. https://0-doi-org.brum.beds.ac.uk/10.3390/a14110319
Note that from the first issue of 2016, this journal uses article numbers instead of page numbers. See further details here.