Handclap for Acoustic Measurements: Optimal Application and Limitations


1
Institute of Computational Mechanics and Optimization (Co.Mec.O), School of Production Engineering and Management, Technical University of Crete, 73100 Chania, Greece
2
Department of Music Technology and Acoustics, Hellenic Mediterranean University, 74100 Rethymno, Greece
*
Author to whom correspondence should be addressed.
Acoustics 2020, 2(2), 224-245; https://0-doi-org.brum.beds.ac.uk/10.3390/acoustics2020015
Submission received: 25 March 2020
/
Revised: 4 April 2020
/
Accepted: 7 April 2020
/
Published: 26 April 2020
(This article belongs to the Collection Historical Acoustics)
Abstract
:Handclap is a convenient and useful acoustic source. This study aimed to explore its optimal application and limitations for acoustic measurements as well for other possible utilizations. For this purpose, the following steps were performed: investigation of the optimal hand configuration for acoustic measurements and measurements at different microphone source distances and at different spaces and positions. All measurements were performed with a handclap and a dodecahedron speaker for comparison. The results indicate that the optimal hand configuration (among 11) is with the hands cupped and held at an angle due to the superior low frequency spectrum. This configuration produced usable acoustic parameter measurements in the low frequency range in common room background levels unlike other configurations. The reverberation time was measured across different spaces and positions with a deviation less than three and just a noticeable difference of the signal-to-noise ratio within or near the ISO 3382-1 limits for each corresponding octave band. Other acoustic parameters (i.e., early decay time, clarity) were measured with greater deviations for reasons discussed in the text. Finally, practical steps for measurements with a handclap as an acoustic source are suggested.
1. Introduction
A source that is concentrated at a point and produces an omnidirectional sound field is called a simple source or a monopole source [1]. The conceptually simplest sound source with finite extension is the spherical source, often referred to as “pulsating” or “breathing sphere” [2]. A sound source with omnidirectional characteristics, a reminder of a monopole, is required in many acoustic measurements. A list and description of these measurements can be found in Reference [3].
The most common practical implementation of a pulsating sphere producing an omnidirectional field used for acoustic measurements is a dodecahedron speaker. The omnidirectional directivity is approached by placing 12 electrodynamic loudspeakers (direct radiator type) in a regular 12 face polyhedron. However, other polyhedron loudspeakers can also be usedd which in some cases can be viewed as equally omnidirectional [4]. Commercially available dodecahedron speakers are manufactured and tested in order to meet the ISO 3382-1 [5] sound source requirements which are the most referred for acoustic measurements. Similar but less stringent requirements (for maximum deviation of directivity) are described in ISO 16283-1 [6] and ISO 10140-5 [7]. The requirements of ISO 3382-1 are:
- The sound source shall be as close to omnidirectional as possible. A maximum deviation of directivity of source in decibels for excitation with octave bands of pink noise and measured in free field is expected (a table of maximum deviation per frequency is featured in ISO 3382-1);
- The sound source shall produce a sound pressure level sufficient to provide decay curves with the required minimum dynamic range, without contamination by background noise. In the case of measurements of impulse responses using pseudo-random sequences (e.g., maximum-length sequence [8]), the required sound pressure level might be quite low because a strong improvement of the signal-to-noise ratio by means of synchronous averaging is possible. In the case of measurements which do not use a synchronous averaging (or other) technique to augment the decay range, a source level will be required that gives at least 45 dB above the background level in the corresponding frequency band (also an alternative source level above the background level is provided in ISO 3382-1 which is discussed in the Methods, Section 2).
Dodecahedron speakers, since they cannot emit sufficient acoustic power if an impulsive signal is applied directly, utilize alternative excitation signals. The most common ones are maximum-length sequence (MLS) [8] and exponential sine sweep (ESS) [9], which are described in Annex A and B of ISO 18233 [10], respectively. Optimum signal-to-noise ratios can be found in Stan et al. [11], while comparison of the two methods can be found in Reference [12]. The appropriate choice of excitation signal for acoustic measurements can be dependent on the background noise [13].
Despite the widespread use of dodecahedron speakers, there exist certain drawbacks associated with them. Namely, we can mention deviation from omnidirectionality and low frequency performance [3]. There are also drawbacks due to the fact of practical reasons. Especially, their high cost makes them probably the most expensive equipment in an acoustic measurement setup. Their heavy weight combined with their large volume makes transportation difficult, e.g., transfer to airports. There are also cases where their use is required in places where there is no electricity supply. An external generator or an appropriate dodecahedron speaker with an internal generator can be used which further increases the cost.
Beside dodecahedron speakers, there are alternative sound sources that can be used for acoustic measurements such as balloons [14], gunshots [15], firecrackers [16], inverse horn designs [17], wooden clappers [18], rotation of a directional speakers [19], ultrasound piezoelectric transducers [20], and ring radiators [21]. A detailed review of all the source alternatives to a dodecahedron speaker can be found in Reference [3].
Handclap is one of the sound sources which is useful, convenient, and easily available. It is a common practice for acousticians to use clapping to excite a space in order to assess its acoustic characteristics. It can be used to detect unwanted acoustic phenomena such as echoes and flutter-echoes [22]. In a questionnaire [23] designed to collect data from industrial, research, and academic communities, handclap was ranked sixth among sound sources/test signals (excitation system) that the participants have used in the past for the measurement of acoustic characteristics of rooms or indoor spaces (the first five results were in preference order: pink noise, balloon, sine sweep, starter pistol, and MLS signal).
Sound generation and the underlying physics of a handclap were examined in a study by Fletcher et al. [24]. In particular, the effect of the hand profile was investigated which may be either nearly complementary between the two hands, giving a nominally flat impact, or else domed so that there is a significant enclosed volume. It was shown that a shock wave is generated for configurations of the hands that produce a loud sharp sound. The addition of a Helmholtz-type resonance is involved in the case of domed impacts. A study by Hargather et al. [25] also noted the presence of shock waves in some handclap sounds and examined them by Schlieren photography. In a study by Repp [26], eight different clapping modes according to hand configuration were identified. The author states that additional variations may derive from such factors as hand curvature, stiffness, fleshiness of the palms, tightness of the fingers, precision, and striking force. Repp’s taxonomy of handclaps was utilized for classification in a study to infer hand configuration [27]. A relevant study by Peltola et al. [28] presents an analysis for synthesizing hand clapping sounds.
Sound generation of a handclap creates distinctive acoustic characteristics. Collected relevant publications presenting topics, such as omnidirectionality and adequate sound power, required from ISO 3382-1 as well as repeatability, frequency response, and accuracy in measurement of acoustic parameters can be found in Reference [3].
Omnidirectionality of the handclap was studied by Griesinger [29] revealing directional characteristics. Measurements in different directions showed differences more than 15 dB in certain frequency ranges, well above the maximum deviation allowed by requirements of ISO 3382-1 [5]. Omnidirectionality ensures uniform space excitation necessary for correct acoustic measurements since the directivity of the source influences the measurement of impulse responses and acoustic parameters of spaces [30,31].
Concerning sound pressure levels, a study by Rizzi et al. [32] measured the levels of acoustic sources and found the handclap to be one with the lowest. In another study by Seetharaman and Tarzia [33], the handclap averaged 26.4 dB above the background level (in a concert hall with typical background noise levels) with a standard deviation of 4.4 dB across measurements. As stated before in ISO 3382-1 requirements, the source level must be at least 45 dB above the background level in the corresponding frequency band in order to obtain satisfactory results in acoustic measurements.
Relating to frequency response, the handclap can be generated in different ways which results in different frequency responses. In frequency responses of the eight different clapping modes that were presented in a study by Repp [26], it can be seen in all of them that a roll off is evident below 500 Hz. The same was reported in a similar study [32] and is in accordance with Griensiger [29] which states “handclaps suffer from poor low frequency content”. In the study by Fletcher [24], measurements of the sound of nominally flat and cupped natural handclaps were made in an anechoic environment. The author states that “a flat clap produces broad-band sound that typically extends to about 10 kHz while the spectrum of a domed clap usually has a subsidiary maximum somewhere below 1 kHz and then declines with frequency more rapidly than does the flat clap”.
Concerning repeatability, the handclap may have one of the lowest among acoustic sources. The reason being that the slightest variation of hand configuration may alter the generated impulse and spectral characteristics [26]. Also, there is a considerable variability in spectral shapes of handclaps across individuals. In the same study [26], the amplitude standard deviations ranged from 0.7 to 5.2 dB across subjects. However, it was also found that it is possible to improve the repeatability of a handclap if it is produced by the same individual utilizing the exact same hand configuration every time. Source repeatability ensures that the same sound field is produced from the sound source for each measurement and, hence, similar impulse response and acoustic parameters are measured.
Regarding measurements of acoustic parameters, few studies were found in the literature where the handclap was used as an acoustic source [32,33,34,35]. Unfortunately, a limitation for all the aforementioned studies was that a smartphone was used as a sound recorder. Reverberation time (T) measurements in a study by Seetharamn and Tarzia [33] showed that results for frequencies below 250 Hz were unreliable, while for the high frequency range results, they were consistent with small deviations. However, the measurements have to be considered with caution, since they were compared with measurements made with a balloon source. Another study by Huang [34] measured acoustic parameters, T and Centre Time (Ts), in the Bayreuth Festspielhaus. Acoustic parameters were compared with results that were found in the literature, and deviations were found that were attributed to reasons such as low sound-to-noise ratios (SNRs) and the performance of micro-electromechanical systems (MEMS) microphones found in smartphones. Another study by Brown and Evans [35] compared sound pressure levels and T measured with a smartphone and a sound level meter, with various sources such as handclap, slamming of a thick book, and pink noise (interrupted pink noise for T measurements). However, the study was not conducted to evaluate the effectiveness of the clap as an acoustic source but of the smartphone as a measuring device. No detailed results were provided, but differences were still observed between the handclap and the source utilizing interrupted pink noise measured with a sound level meter. Measurements with a handclap were also performed by Halmrast [36], utilizing an “in-ear” microphone, mainly to access how an individual perceives the reverberation of its own clapping.
Finally, handclap can also be used for other applications such as clap based electrical appliance control [37,38], speech dereverberation [39,40,41], acoustic environment identification using unsupervised learning [42], and for sonic interactions with a computer [43,44]. Handclap can also be used to form a language as a common means of communication between humans and robots [45], to estimate the performance of acoustic absorbers [46], and as a source for a localization technique using a mobile phone [47].
The novelty of this study, in relation to earlier publications, can be considered to consist of the following points:
- To the best of our knowledge, this is the first study that suggests the optimal hand configuration (among 11) for acoustic measurements. Previous studies have either identified the hand configurations (e.g., [26]) or performed measurements without considering the optimal hand configuration [32,33,34,35];
- Another contribution of this study is that it suggests the expected measurement accuracy utilizing a handclap as a sound source for some of the most common acoustic parameters (i.e., reverberation time, early decay time, clarity);
- No known empirical research has focused on comparing measurements performed with a handclap as a sound source and measurements performed with a dodecahedron speaker following the recommendations of ISO 3382-1;
- Three new hand configurations were suggested and measured;
- Practical steps for measurements with a handclap as an acoustic source are suggested.
This paper has been organized in the following way: Section 2 is concerned with the methodology employed for this study, while Section 3 presents the findings of the research. Section 4 concerns the discussion and analyzes the data, addresses the research questions, identifies areas for further research, and proposes practical steps for measurements with a handclap as an acoustic source. Finally, the conclusion is provided in Section 5 and provides a brief summary and contextualizes the research.
2. Methods
The methods section is divided into the subsections “Measurements with a Handclap”, “Measurements with a Dodecahedron Speaker”, and “Acoustic Parameters-Compensation Method”. The first and main subsection describes all the necessary measurements performed in order to evaluate the handclap as an acoustic source. “Measurements with a Dodecahedron Speaker” is a short subsection which describes typical measurements according to ISO 3382-1 that were performed for comparison reasons. The final subsection includes a description of the acoustic parameters and a discussion about the compensation method that was used.
2.1. Measurements with A Handclap as A Sound Source
The measurements that were performed to investigate optimal application and limitations of the handclap as an acoustic source for the estimation of acoustic parameters are the following:
- Measurements to investigate optimal hand configuration;
- Measurements at different source–receiver distances;
- Measurements in different spaces.
2.1.1. Measurements to Investigate Optimal Hand Configuration
One of the major aims of this research was to investigate the optimal hand configuration of the handclap for the best possible excitation of a space. In previous studies by Repp [26] and Fletcher et al. [24], different hand configurations were examined. Especially in the study by Repp [26], the different sounds of a handclap were categorized in eight clapping modes according to hand configuration. A description and a figure for each configuration can be found in Reference [26].
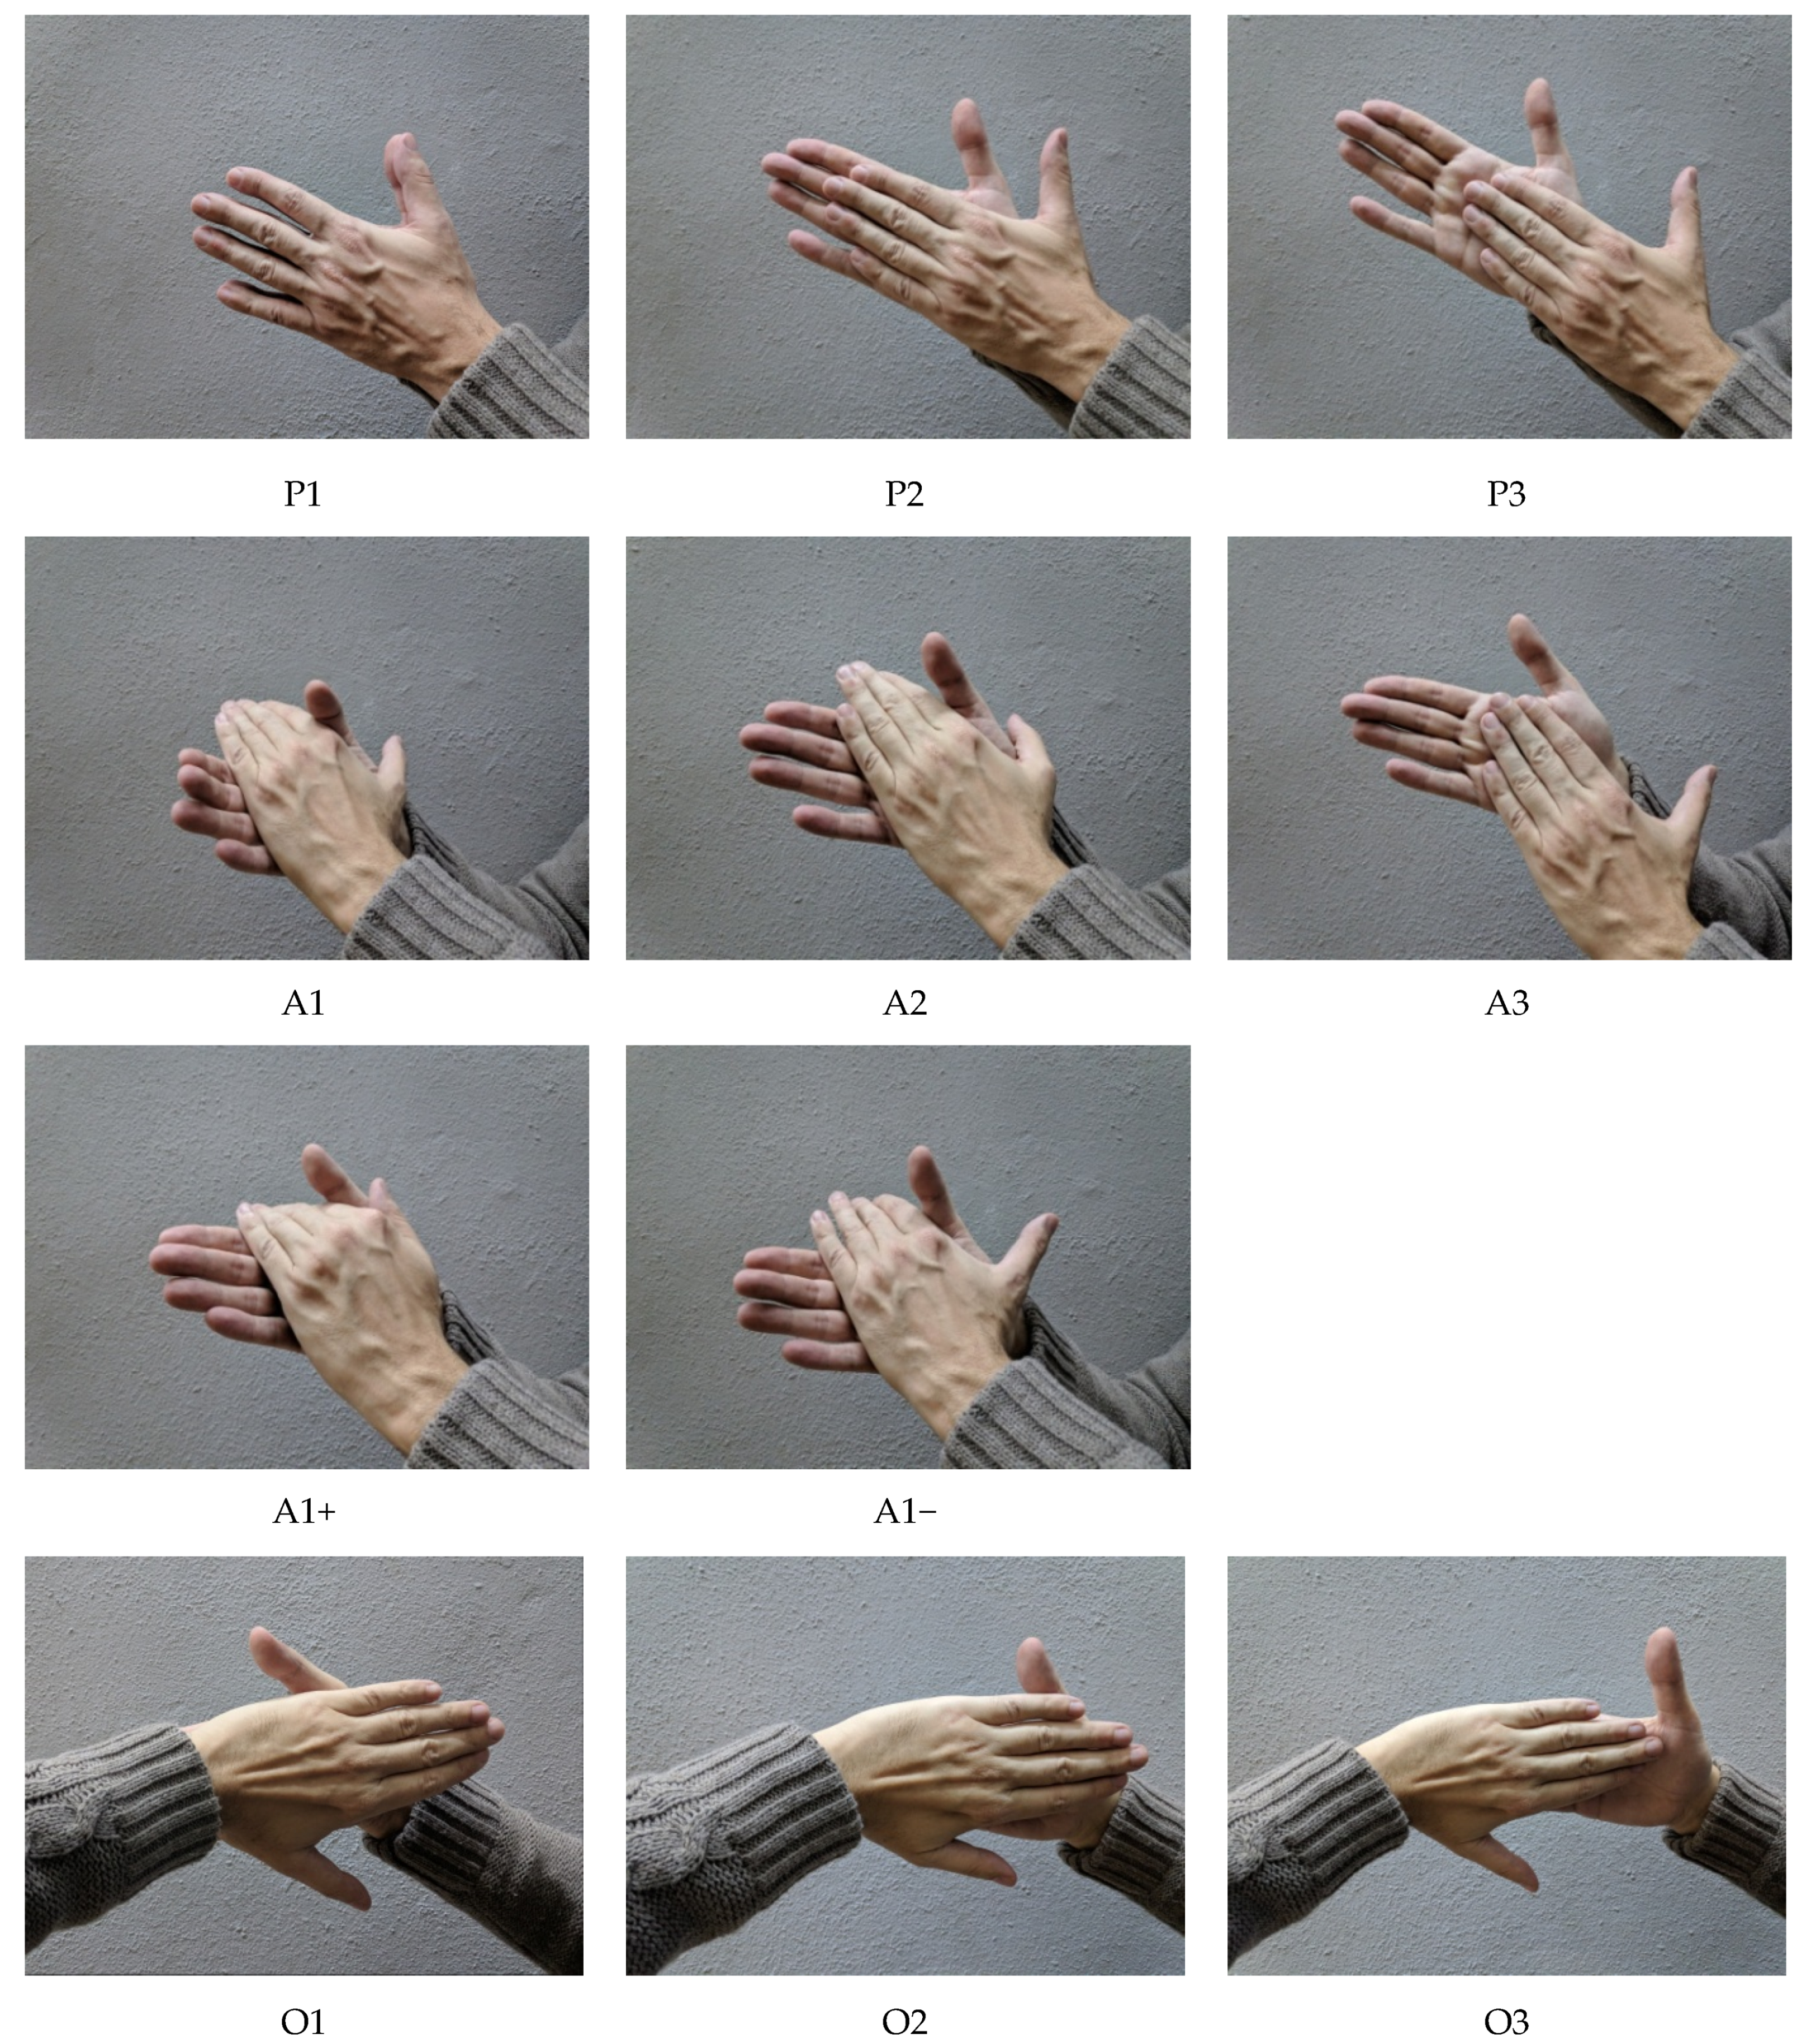
For this study, eleven hand configurations (Figure 1) were evaluated (P1, P2, P3, A1, A2, A3, A1+, A1−, O1, O2, O3). The nomenclature used by Repp was kept (letters P, A, and O correspond to the words parallel, aligned, and opposite). Modes Pl–P3 kept the hands parallel and flat but changed their vertical alignment from palm-to-palm (P1) to fingers-to-palm (P3) with P2 halfway between these extremes (i.e., with the right hand lowered by approximately 4 cm). Modes A1–A3 varied the alignment in a similar way but with the hands held at an angle (modes P1 and A1 differ in that the fingers of the two hands strike each other in P1 but not in A1. Modes P3 and A3 are more similar to each other). Repp in his study proposed additional variations of the A1 configuration.
He stated, “since the hands automatically tended to be more relaxed (slightly cupped) in the A modes than in the P modes, two versions of A1 were added, with the hands either very cupped (A1+) or flat (A1-)”. Three more hand configurations were suggested by the authors of this research. Modes O1–O3 kept the hands opposite but changed their vertical alignment from palm-to-palm (O1) to fingers to palm (O3) with O2 halfway between these extremes.
In order to evaluate the hand configurations, twenty-four subjects (18 male, 6 female, project identification code: Protocol number 11/16.04.2020; 24 April 2020, Committee on Ethics and Deontology of Research (C.E.D.R), Technical University of Crete), students from the Hellenic Mediterranean University Department of Music Technology and Acoustics (Rethymno, Greece) with a mean age of 21 (SD: 2.5) participated in two sets of acoustic measurements (January 2020). Measurements were performed in a similar fashion as the study by Repp [26]. An important difference was that the subjects performed the handclaps upright to simulate how the actual handclaps would be performed in normal acoustic measurement (in the study by Repp the subjects were seated). For the measurements, subjects performed the handclaps, one at a time, with their hands approximately 60 cm from a sound level meter, 01dB-Steel SdB02 (01 dB-Stell, Limonest, France), similar to the study by Repp [26].
For the first set of measurements, subjects were asked to perform a handclap as they would in measurement conditions. The purpose of these measurements was to observe the natural hand configuration of the subjects.
For the second set of measurements, subjects were asked to perform handclaps for each hand configuration. For the measurements, instructions for the hand configurations were given. The subjects were requested to create a maximum sound pressure level in a controlled manner for each hand configuration. For the measurements, sound pressure levels (SPLs), octave band SPLs, and frequency responses were recorded.
2.1.2. Measurements at Different Source–Receiver Distances
The purpose of these measurements was initially to observe and evaluate the effect of source–receiver distance which in turn was expected to affect the signal-to-noise ratios in acoustic measurements. As presented in the introduction, ISO 3382-1 sound source recommendations state that “the sound source shall produce a sound pressure level sufficient to provide decay curves with the required minimum dynamic range, without contamination by background noise”. It is reasonable to assume that at shorter source–receiver distances, the signal-to-noise ratio will be higher.
Measurements at different source–receiver distances were performed in an amphitheater at the Hellenic Mediterranean University, Department of Music Technology and Acoustics with a volume of 1088 m3 (Figure 2A). Handclaps were performed by a trained individual in order to achieve the best repeatability possible [26]. As stated in the introduction concerning repeatability, the handclap may have one of the lowest among acoustic sources. However, it is possible to improve the repeatability if it is produced by the same individual utilizing the exact same hand configuration every time [26]. The height of the microphone above the floor was 1.2 m according to recommendations of ISO 3382-1, corresponding to the ear height of average listeners in typical chairs. The individual who performed the handclaps was facing the microphone at every measurement. The height of the handclap was 1.3 m, the natural height of the position of the handclap of the individual who performed at the measurement sessions. For this set of measurements, different hand configurations proposed from the previous subsection were evaluated (more on this in Section 2.1.1, Section 3.1, and Section 4.1).
It should also be noted that there are recommendation about the minimum source–receiver distance in ISO 3382-1 [5] and especially in ISO 3382-2 [48] that were followed for this research. It is stated that [5] “no microphone-position shall be too close to any source-position in order to avoid too strong influence from the direct sound”. The minimum distance, dmin, in meters, can be calculated from Equation (1) [48]:
is the volume, in cubic meters; is the speed of sound, in meters per second; is an estimate of the expected T, in seconds.
2.1.3. Measurements at Different Spaces
In this part of the research, acoustic measurements were performed at different spaces. The purpose of these measurements was to evaluate the accuracy of the handclap as an acoustic source for measurements at different spaces and with different background noise levels.
Measurements were performed in three spaces of the Hellenic Mediterranean University, Department of Music Technology and Acoustics with volumes of 1088, 176 and 146 m3 (Figure 2B–D, respectively). The first space was the one that was used for measurements at different source–receiver distances in a previous part of this research. The hand configuration that was used for this set of measurements was the one that was identified as optimum in different sections of the study (Section 3.1 and Section 4.1). For each case, impulse response measurements were performed as specified in the source and receiver positions depicted in Figure 2B–D.
2.2. Measurements with A Dodecahedron Speaker
Measurements performed also with a dodecahedron speaker for comparison reasons according to ISO 3382-1 [5]. The source positions of the dodecahedron speaker were the same as the handclap source positions that were used in previous part of the research (measurements at different source–receiver positions, measurements at different spaces) depicted in Figure 2.
A dodecahedron loudspeaker, 01 dB-Stell, Type DO12 (01 dB-Stell, Limonest, France) was used. The ESS signal [9] was utilized for impulse response measurements. The particular excitation signal was preferred because of the low background noise [12,13]. The sampling frequency for the measurements was 44.1 kHz. An appropriate sequence length and time constant for the ESS signal was chosen according to the expected T. Three iterations were performed for each of the measurement positions. Averaging was used for better a signal-to-noise ratio and to reduce the temperature fluctuation effect. Temperature fluctuation effects were small and averaged out. The height of the dodecahedron in each measurement was 1.3 m, similar to the height of the handclap position in the measurements (instead of the 1.5 m height that is proposed by ISO 3382-1). All of the measurement positions of the omnidirectional microphone (Earthworks M30, Type 4190, Earthworks, Milford, CT, USA) with a flat frequency response was used. The same microphone was used also for all the measurements with a handclap as a sound source.
2.3. Acoustic Parameters-Compensation Method
Reverberation time (T), early decay time (EDT), and clarity (C80) were the acoustic parameters that were compared with a handclap and a dodecahedron as acoustic sources. These parameters were selected, as they are representative of the acoustics of space T which is related to the physical properties of the space; while as stated in ISO 3382-1, EDT is a quantity related to perceived reverberance, and C80 is one of the quantities related to perceived clarity of sound.
T is defined as “the duration required for the space-averaged sound energy density in an enclosure to decrease by 60 dB after the source emission has stopped” [5]. It is evaluated from the slope of the logarithmic impulse response–decay curves which is determined from the slope of the best-fit linear regression line [5]. Decay curves are a graphical representation of the decay of the sound pressure level in a room as a function of time after the sound source has stopped.
Two methods of measuring T and decay curves are described in the ISO 3382-1: the interrupted noise method and the integrated impulse response method. The latter will be applied for this research for the measurement of T (as well as for EDT and C80). The decay curve for each octave band will be calculated by a backward integration of the squared impulse response.
Measurements of T can also be performed for a smaller dynamic range than 60 dB. As it is stated in ISO 3382-1 [5]:
“T can be evaluated based on a smaller dynamic range than 60 dB and extrapolated to a decay time of 60 dB. It is then labeled accordingly. Thus, if T is derived from the time at which the decay curve first reaches 5 dB and 25 dB below the initial level, it is labeled T20. If decay values of 5 dB to 35 dB below the initial level are used, it is labeled T30.”
It also stated that [5] “if only T20 is to be measured, it is sufficient to create a level at least 35 dB above the background level in each frequency band. If T30 is to be measured, it is necessary to create a level at least 45 dB above the background level in each frequency band”. Also, other forms of T with even smaller dynamic ranges can be found in the literature (e.g., T15 [34]). However, it has to be noted that the larger the available section of the decay curve used to extrapolate Tx to T60 (x < 60), the more Tx approaches T60 [49]. In the context of this work, due to the low sound pressure levels generated by handclaps, especially in the low frequency range, T20 will be measured and compared.
Early decay time is defined as the time interval required for the sound energy level to decay 10 dB after the excitation has stopped [42], and it is evaluated from the slope of the impulse response–decay curves (as the conventional T). The slope of the decay curve is determined from the slope of the best-fit linear regression line of the initial 10 dB (between 0 dB and −10 dB) of the decay. To enable direct comparison with the T, the result is multiplied by a factor of 6. For an ideal exponential decay in a diffuse field, the expected value of the EDT equals T. EDT correlates better with the human perception of reverberation of a room than the T [50], hence it gives a better subjective evaluation.
Clarity (C80), or “early to late index”, is defined as the logarithmic ratio of the impulse response’s energy before time te and its energy after te [51] (Equation (2)). The value te = 80 ms is better suited for music, while te = 50 ms is used to express the clarity of speech.
is the early-to-late index (C80 is usually “clarity”); is the early time limit of either 50 ms or 80 ms; is the instantaneous sound pressure of the impulse response measured at the measurement point.
High values of C80 indicate a large amount of the early energy which corresponds to a subjective sensation of clarity. On the contrary, a low clarity values indicate an unclear, excessively reverberant sound. Subjectively, acceptable values for C80 is –3dB or higher [52].
Background stationary noise is inevitable in every measurement, as it affects the decay range of the impulse response–decay curves. The effect of the background noise on the evaluation of room acoustic parameters has been studied by Hak et al. [49]. Five methods which compensate for the effect of background stationary noise were evaluated in a study by Guski and Vorlander [53]. It was found that the performance of each method differs significantly.
For this study, the “subtraction of noise” method proposed by Chu [54] were utilized, as it was found to be among the best methods [53]. For this method, the noise level is estimated and subtracted from the impulse response before backward integration of the squared impulse response. The effectiveness of the method (as well as other methods) in various measurements of different acoustic parameters can be found in References [53] and [55].
3. Results
The results are presented in accordance with the subsections in the methodology. Those are:
- Measurements to Investigate Optimum Hand Configuration
- Measurements at Different Source–Receiver Distances
- Measurements at Different Spaces
3.1. Measurements to Investigate Optimum Hand Configuration
The results for the measurements for the eleven hand configurations are presented in Table 1. Arithmetic mean of the SPL for the 24 subjects for each hand configuration along with the standard deviation (SD), the maximum SPL, and the percentage of the natural configuration are shown. In Figure 3 (left), a comparison of the SPL and the percentage of the natural configuration (right) for the measured hand configurations are presented.
3.2. Measurements at Different Source–Receiver Distances
Measurements were performed to observe the effect of different source–receiver distances in the evaluation of acoustic parameters. It is reasonable to assume that at shorter source–receiver distances, the signal-to-noise ratio will be higher. The purpose of these measurements was to estimate a recommended source–receiver distance for which acoustic measurements can be performed with the best possible accuracy.
Measurements were performed in an amphitheater of the Hellenic Mediterranean University, Department of Music Technology and Acoustics at source–receiver distances of 4 to 12 m with the distance increasing by 1 m in each measurement (Figure 2A, Table A1). The minimum recommended source–receiver distance (dmin) for the amphitheater according to Equation (2) is approximately 3.56 m.
Measurements were also performed at shorter distances than dmin. Inconsistencies in the results were observed, especially for the measurements with a dodecahedron speaker, so no comparison for those results are presented. A possible explanation is probably due to the fact that the measurements were performed in the near field of the source [56]. The acoustic field of a source is divided into the near field and the far field. The near field can also be divided in the hydrodynamic near field which extends approximately 1/4 of an acoustic wavelength from the source and the geometric near field which extends several source dimensions from the source. The subject is beyond the scope of this research, but the reader can refer to Reference [56] for a detailed explanation. Also, in the near field, an ordinary loudspeaker cannot be considered to be a point source [57].
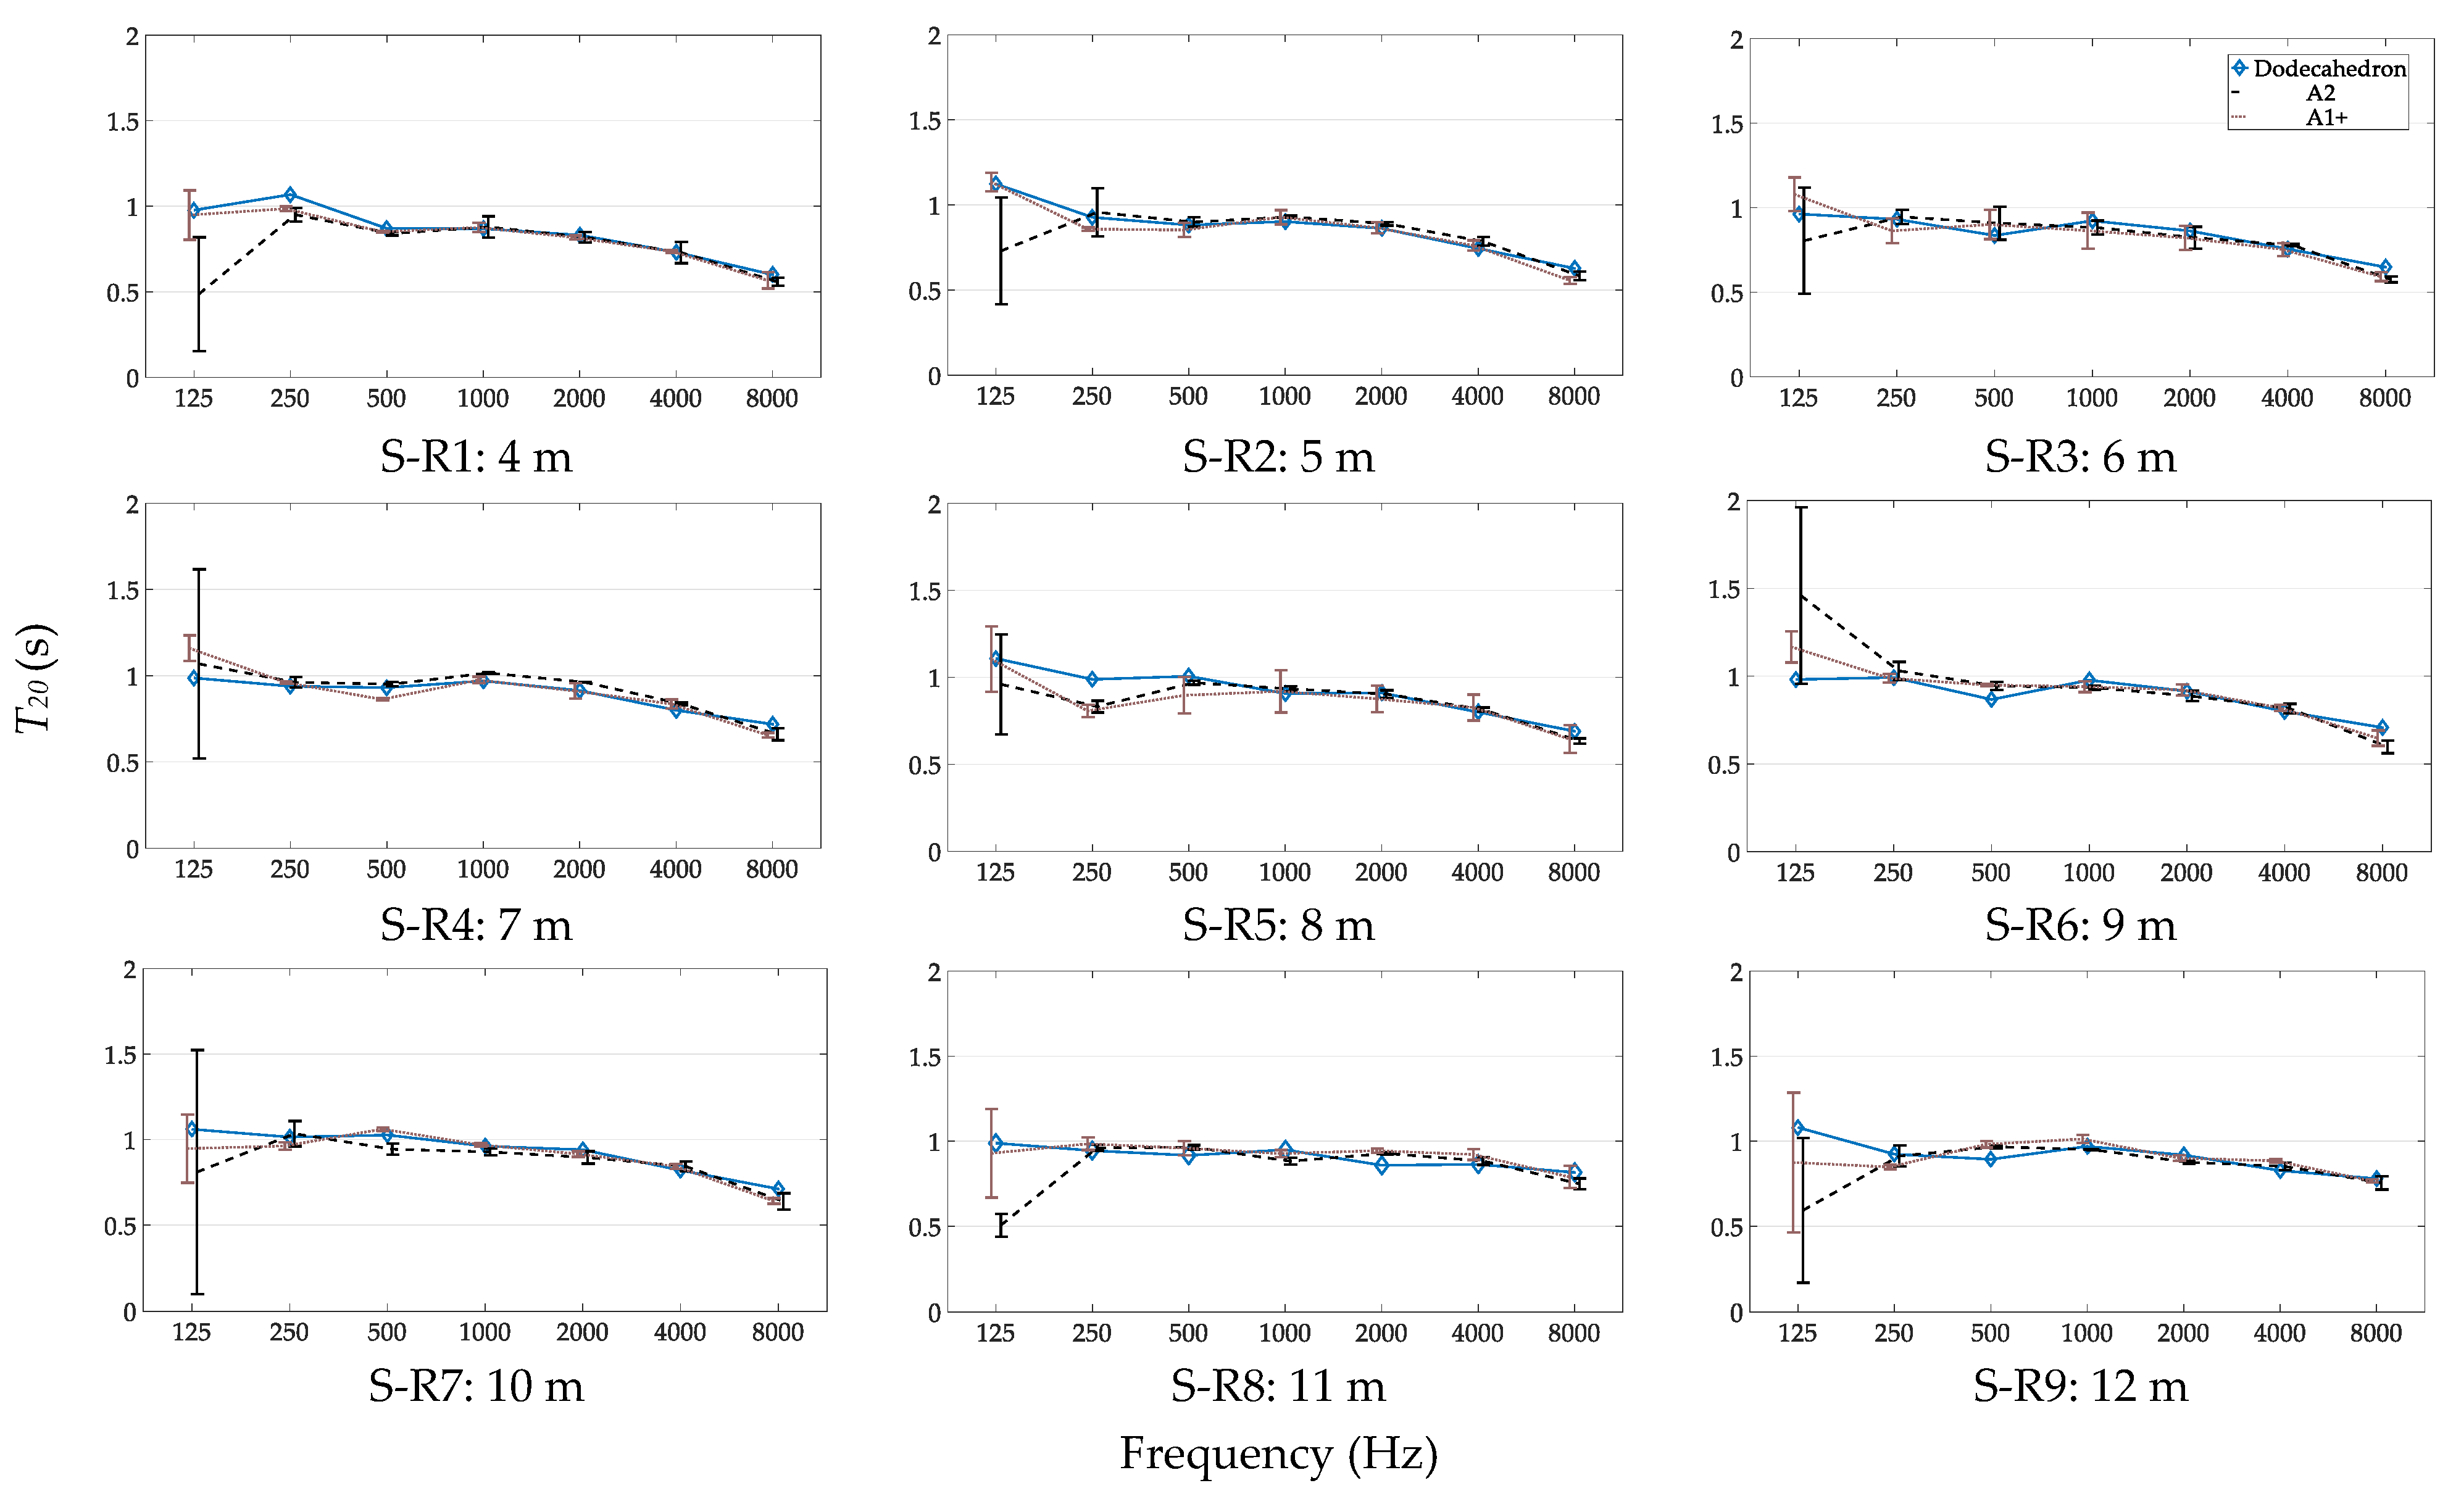
All the measurements for different source–receiver distances were performed with hand configurations A2 and A1+ that were found to be the optimum for acoustic measurements in the previous section (more on this on Section 4.1). A comparison of the acoustic parameters T20, EDT, C80 measured with a handclap and a dodecahedron speaker is presented in the following subsections.
3.2.1. T20 for Different Source–Receiver Distances
Measurement of T has been the focus of earlier studies [32,33,34,35] as presented in the introduction. Since the handclap as an acoustic source will be used mainly as a survey method, satisfactory measurement of T is important. In Figure 5, T20 results for measurements performed with a dodecahedron speaker and with two different hand configurations at nine different source–receiver distances are presented.
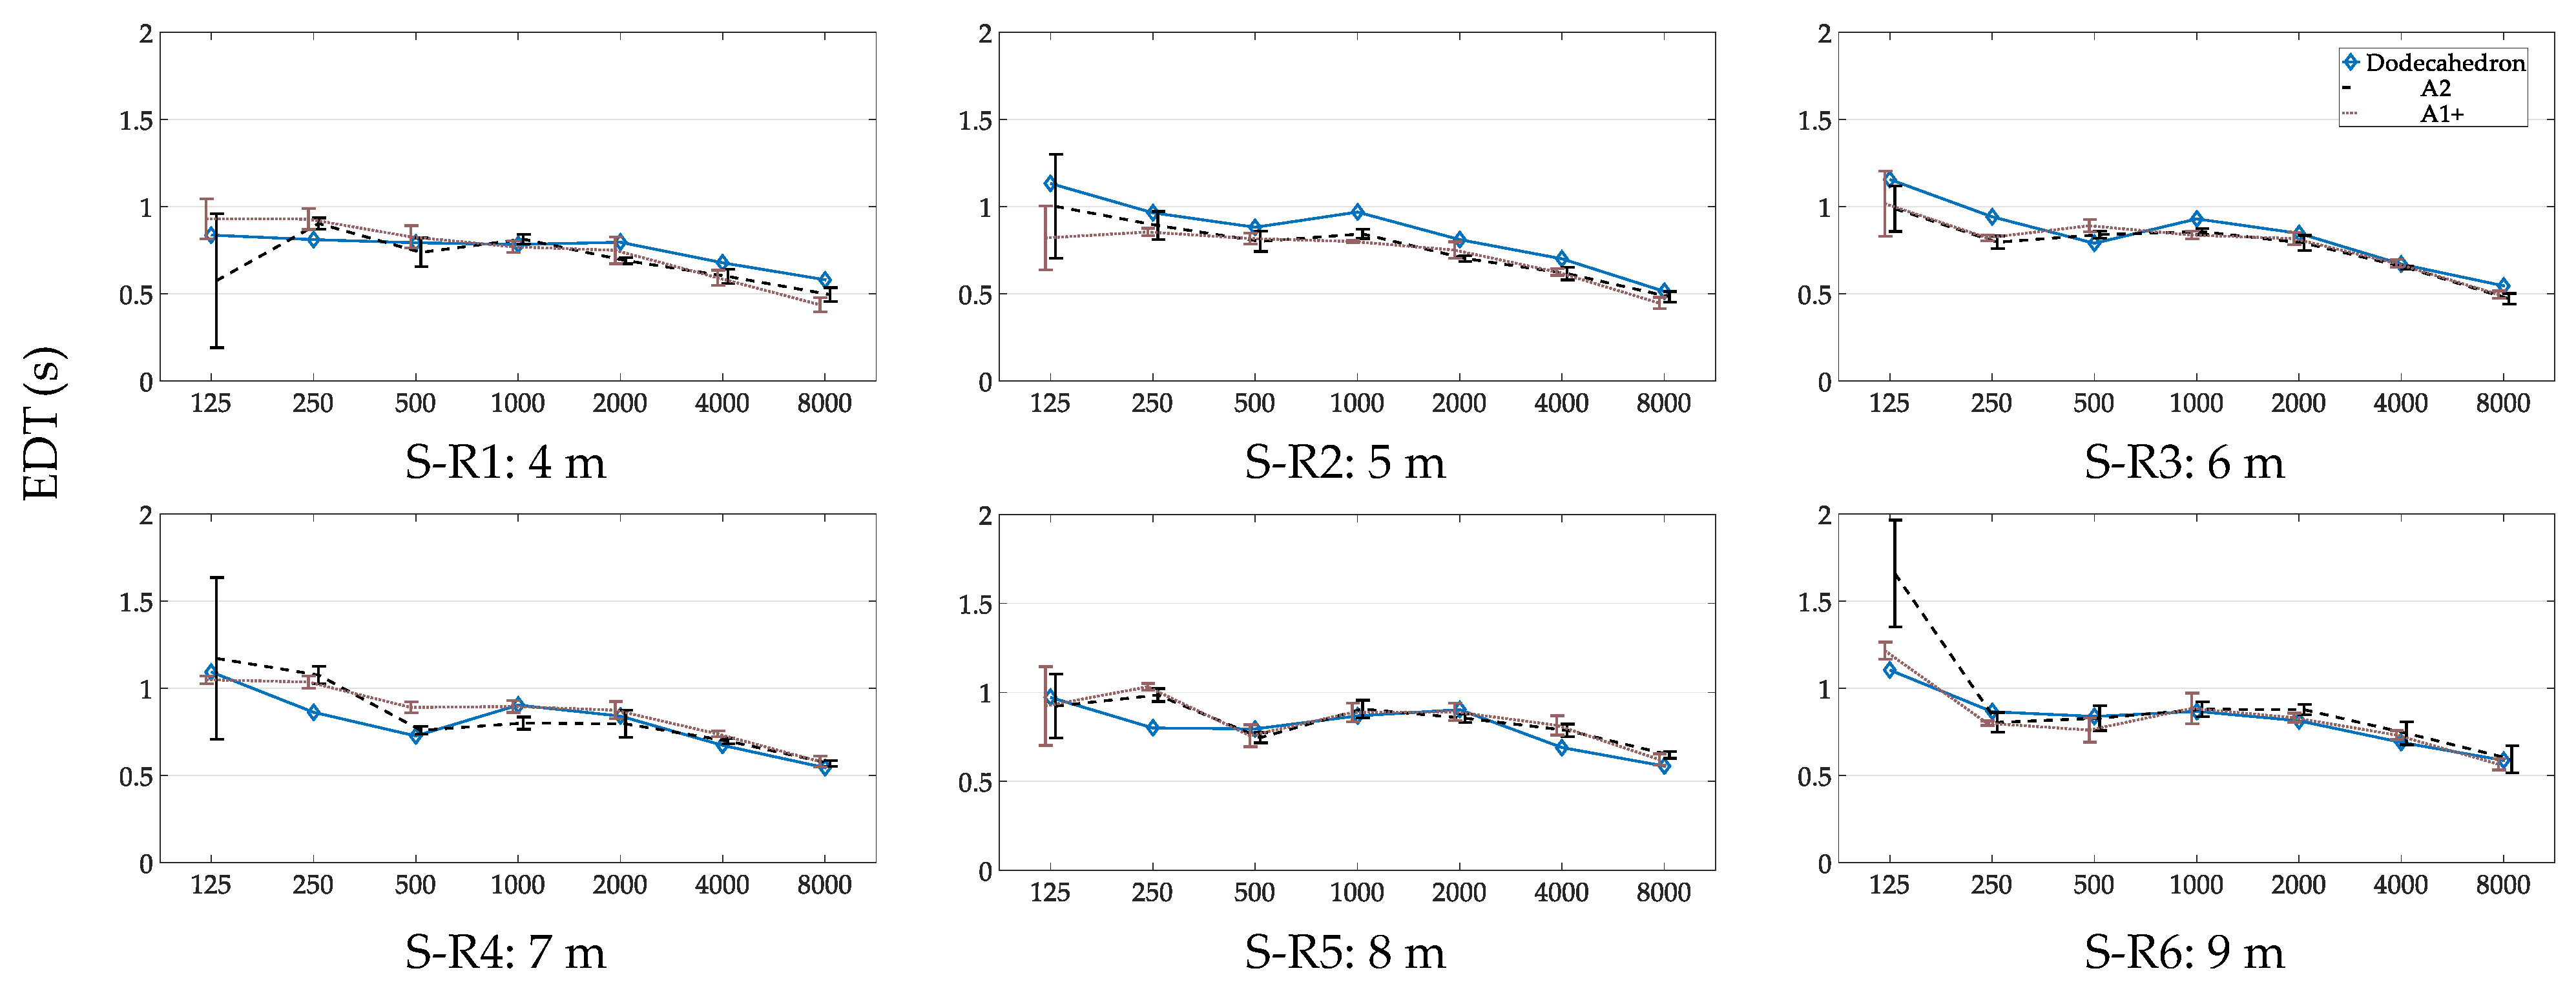
3.2.2. EDT for Different Source–Receiver Distances
Similar to the previous subsection, EDT results for measurements performed with a dodecahedron speaker and with two different hand configurations at nine different source–receiver distances are presented in Figure 6.
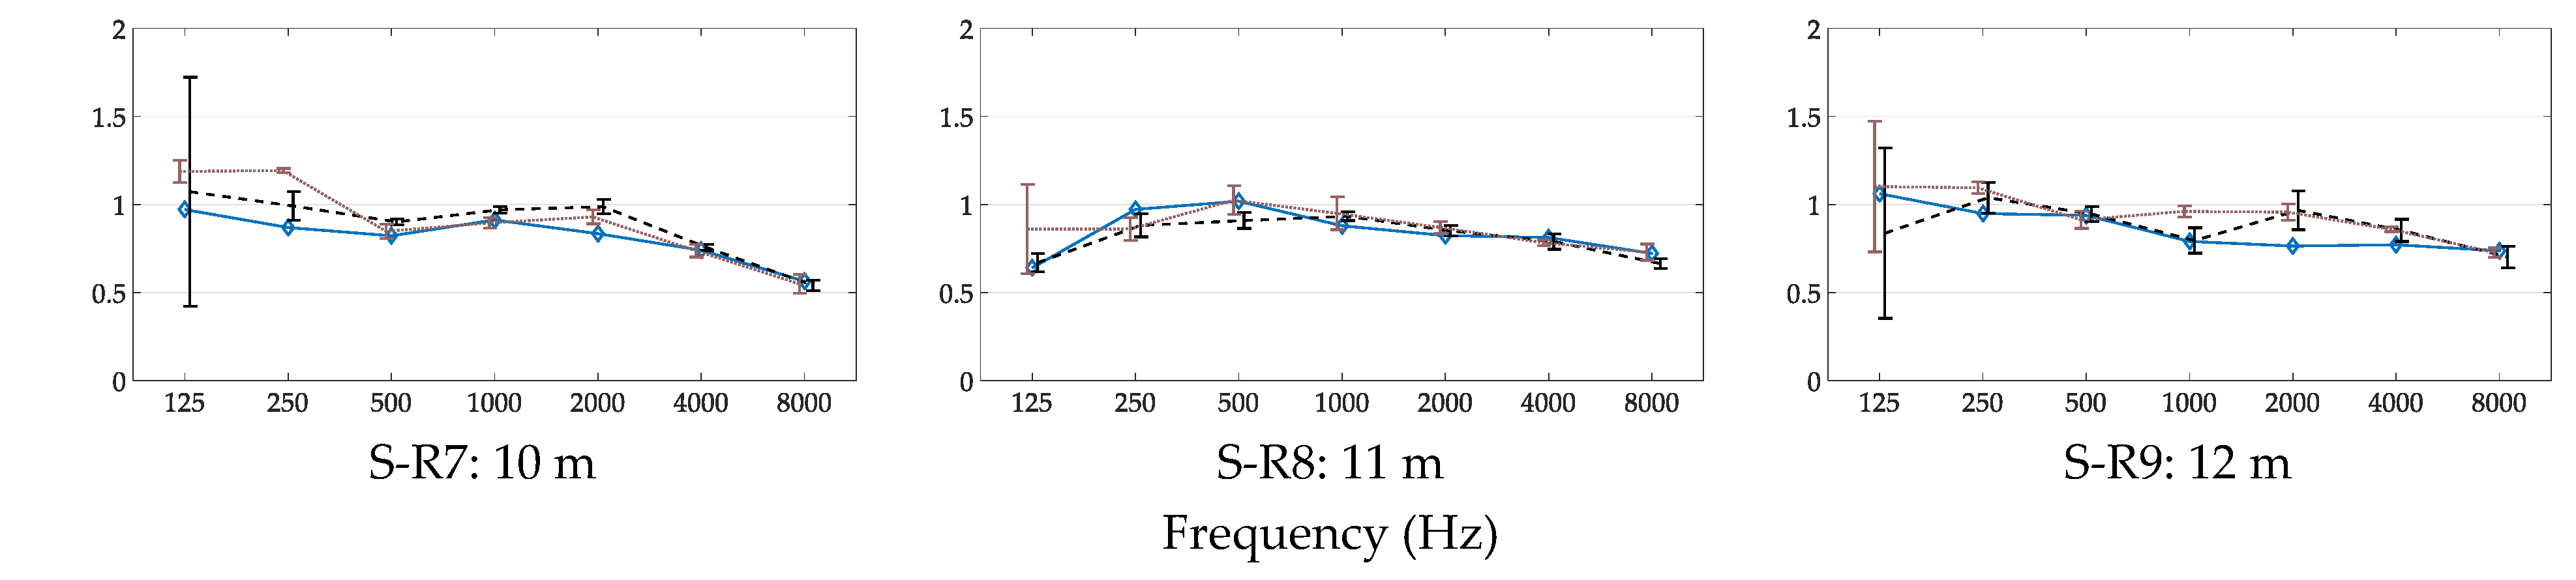
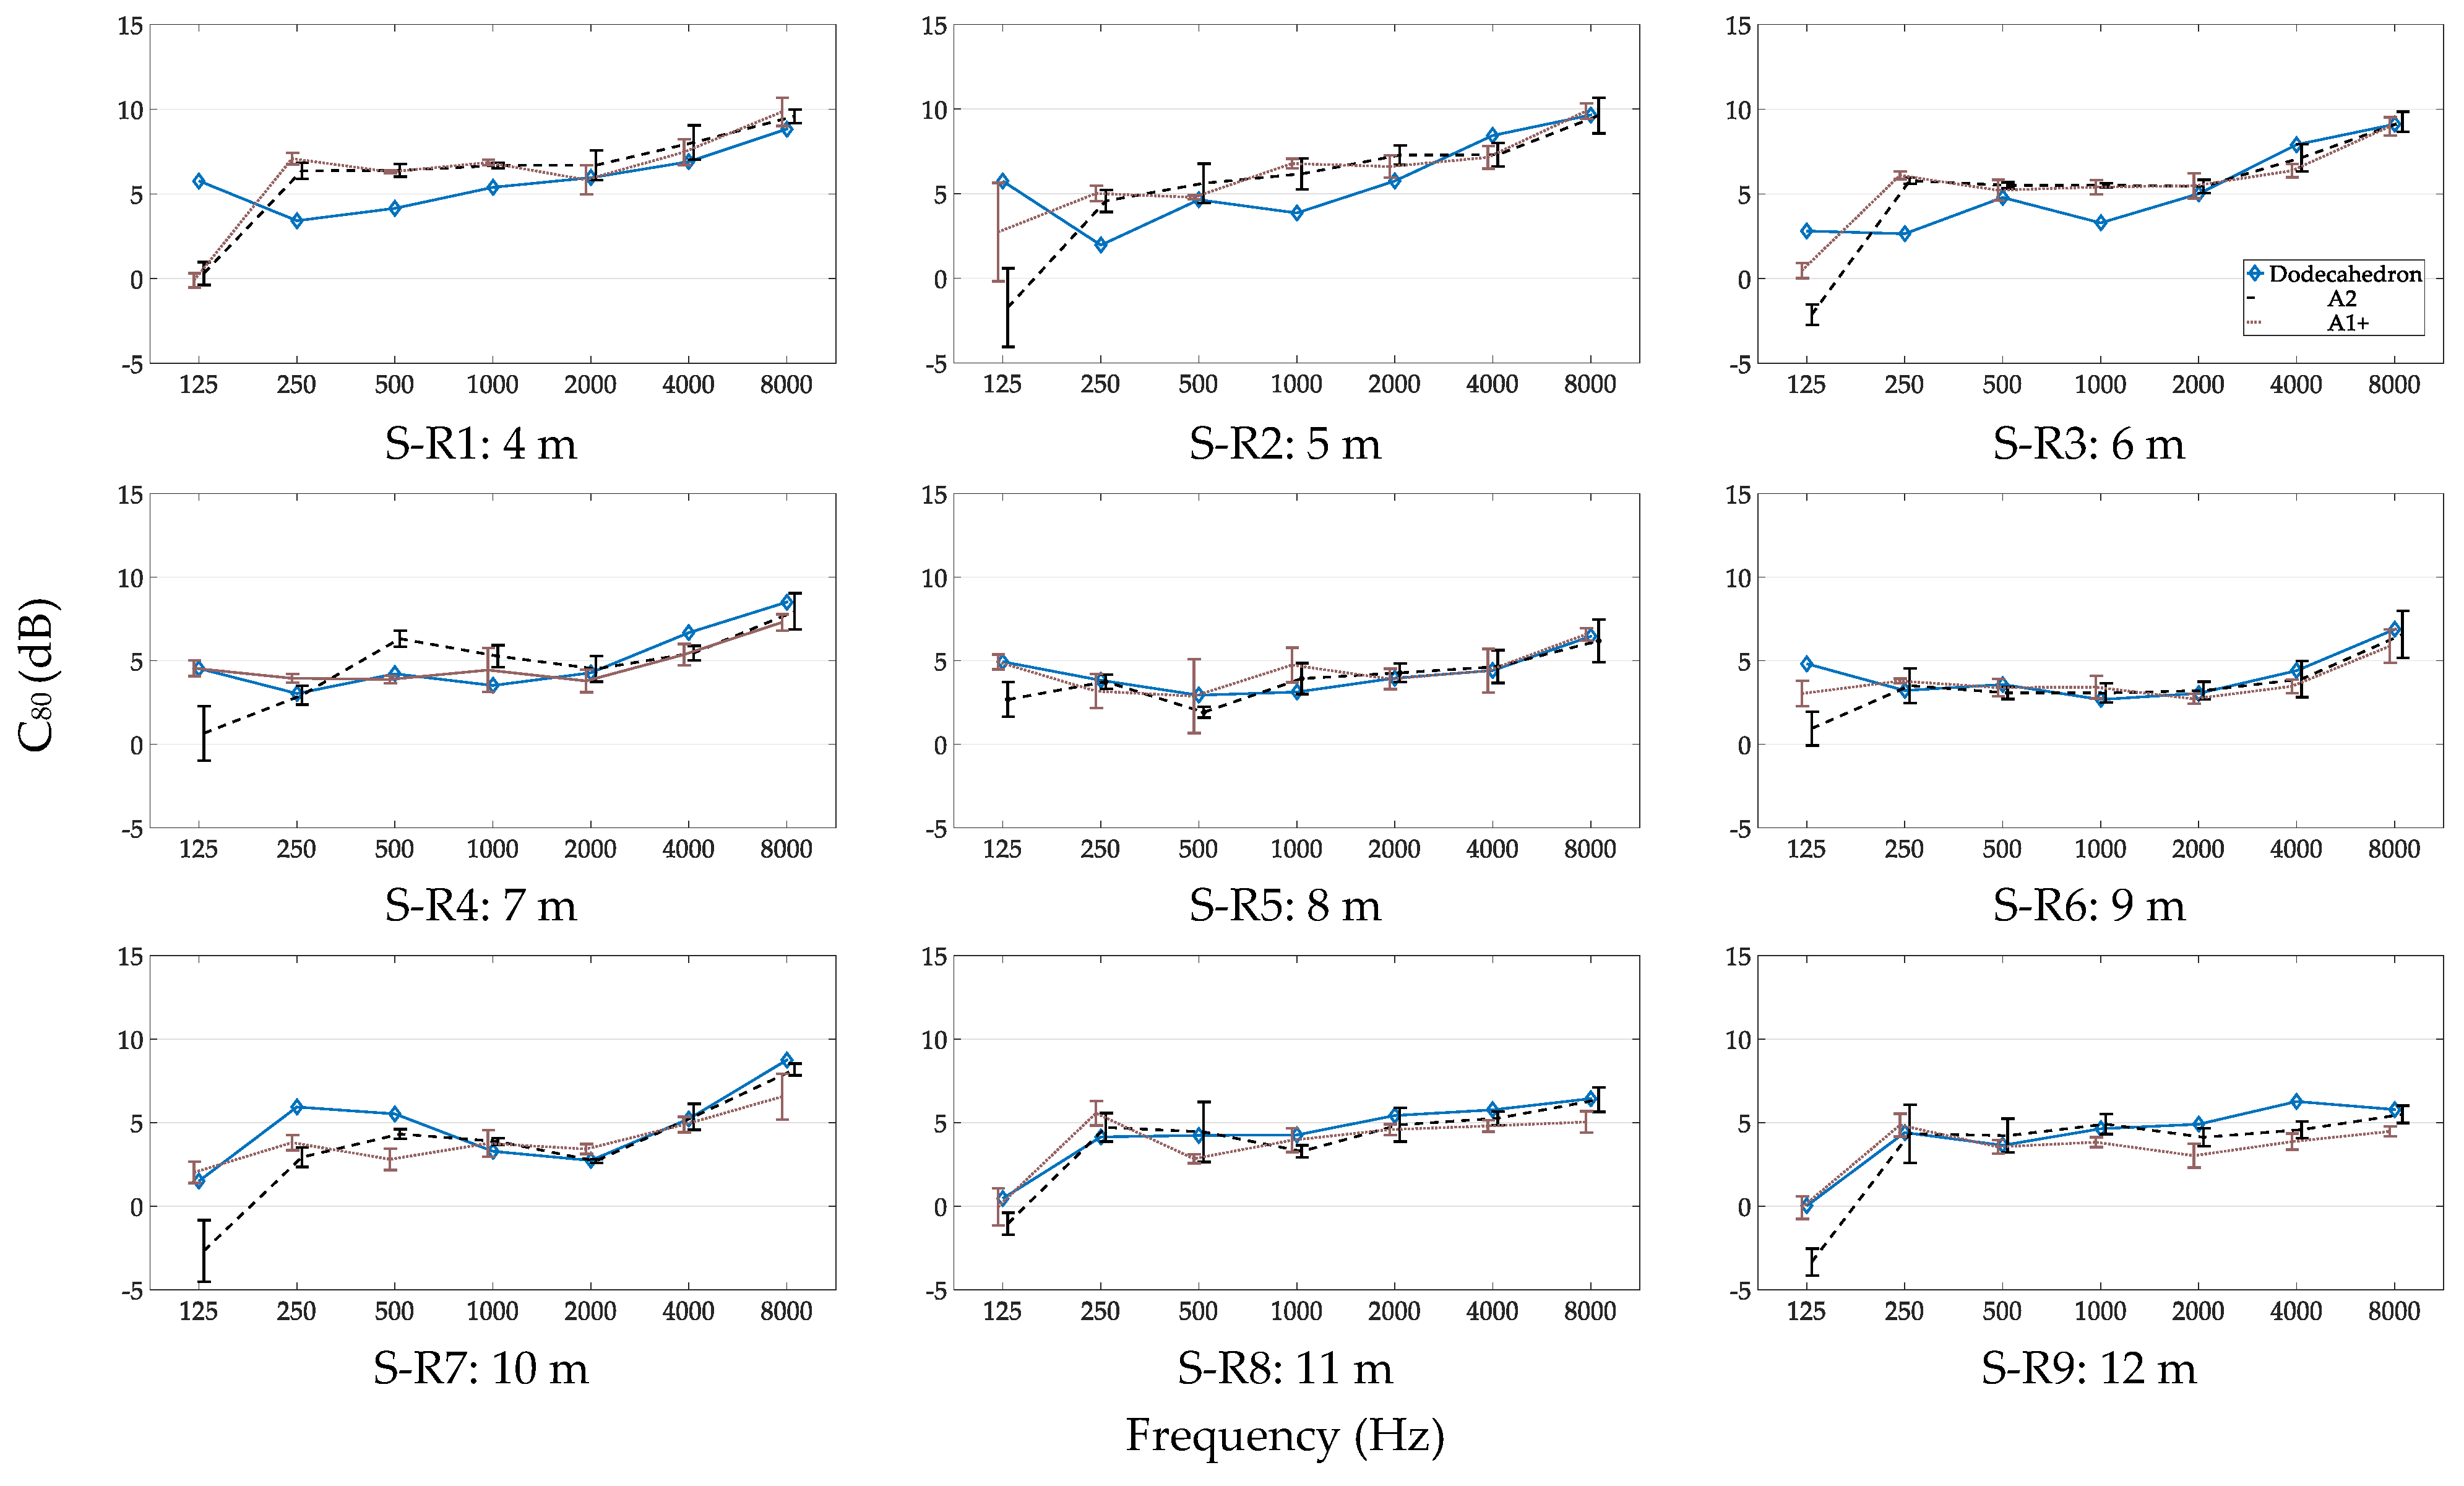
3.2.3. C80 for Different Source–Receiver Distances
Finally, C80 results for measurements performed with a dodecahedron speaker and with two different hand configurations at nine different source–receiver distances are presented in Figure 7.
3.3. Measurements at Different Spaces
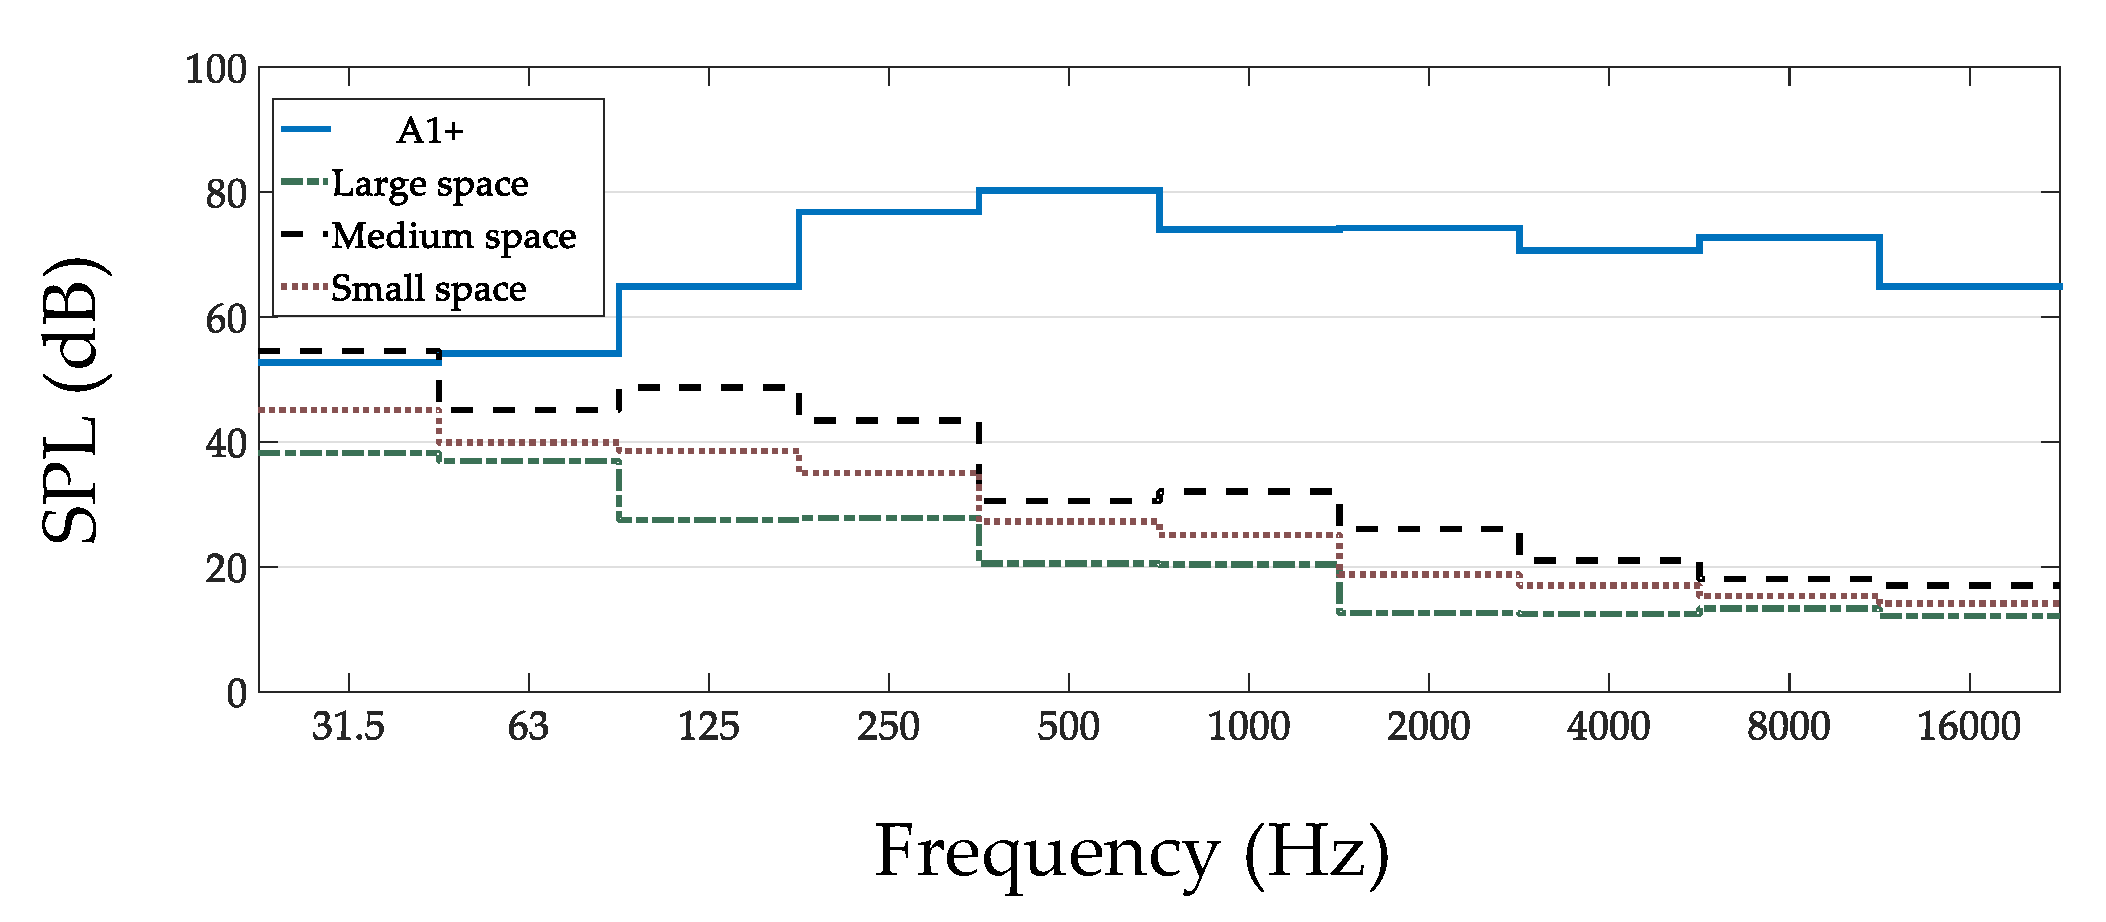
Measurements were performed at three different spaces and for three different source–receiver positions (Figure 2B–D, Table A2) to evaluate the accuracy of the handclap as an acoustic source for measurements at different spaces and also to observe the effect of different levels of background noise. Background noise levels for the three spaces along with handclap configurations noise levels are presented in Figure 8.
All the measurements for this section were performed with hand configuration A1+ that was found to be the optimum for acoustic measurements in the previous section. Appropriate source–microphone distances were selected according to the results from the previous section of the research (more on the selection of the hand configurations and optimum distances in Section 4.1).
A comparison of the acoustic parameters T20, EDT, C80, measured with a handclap and a dodecahedron speaker for the three spaces, is presented in the following subsections.
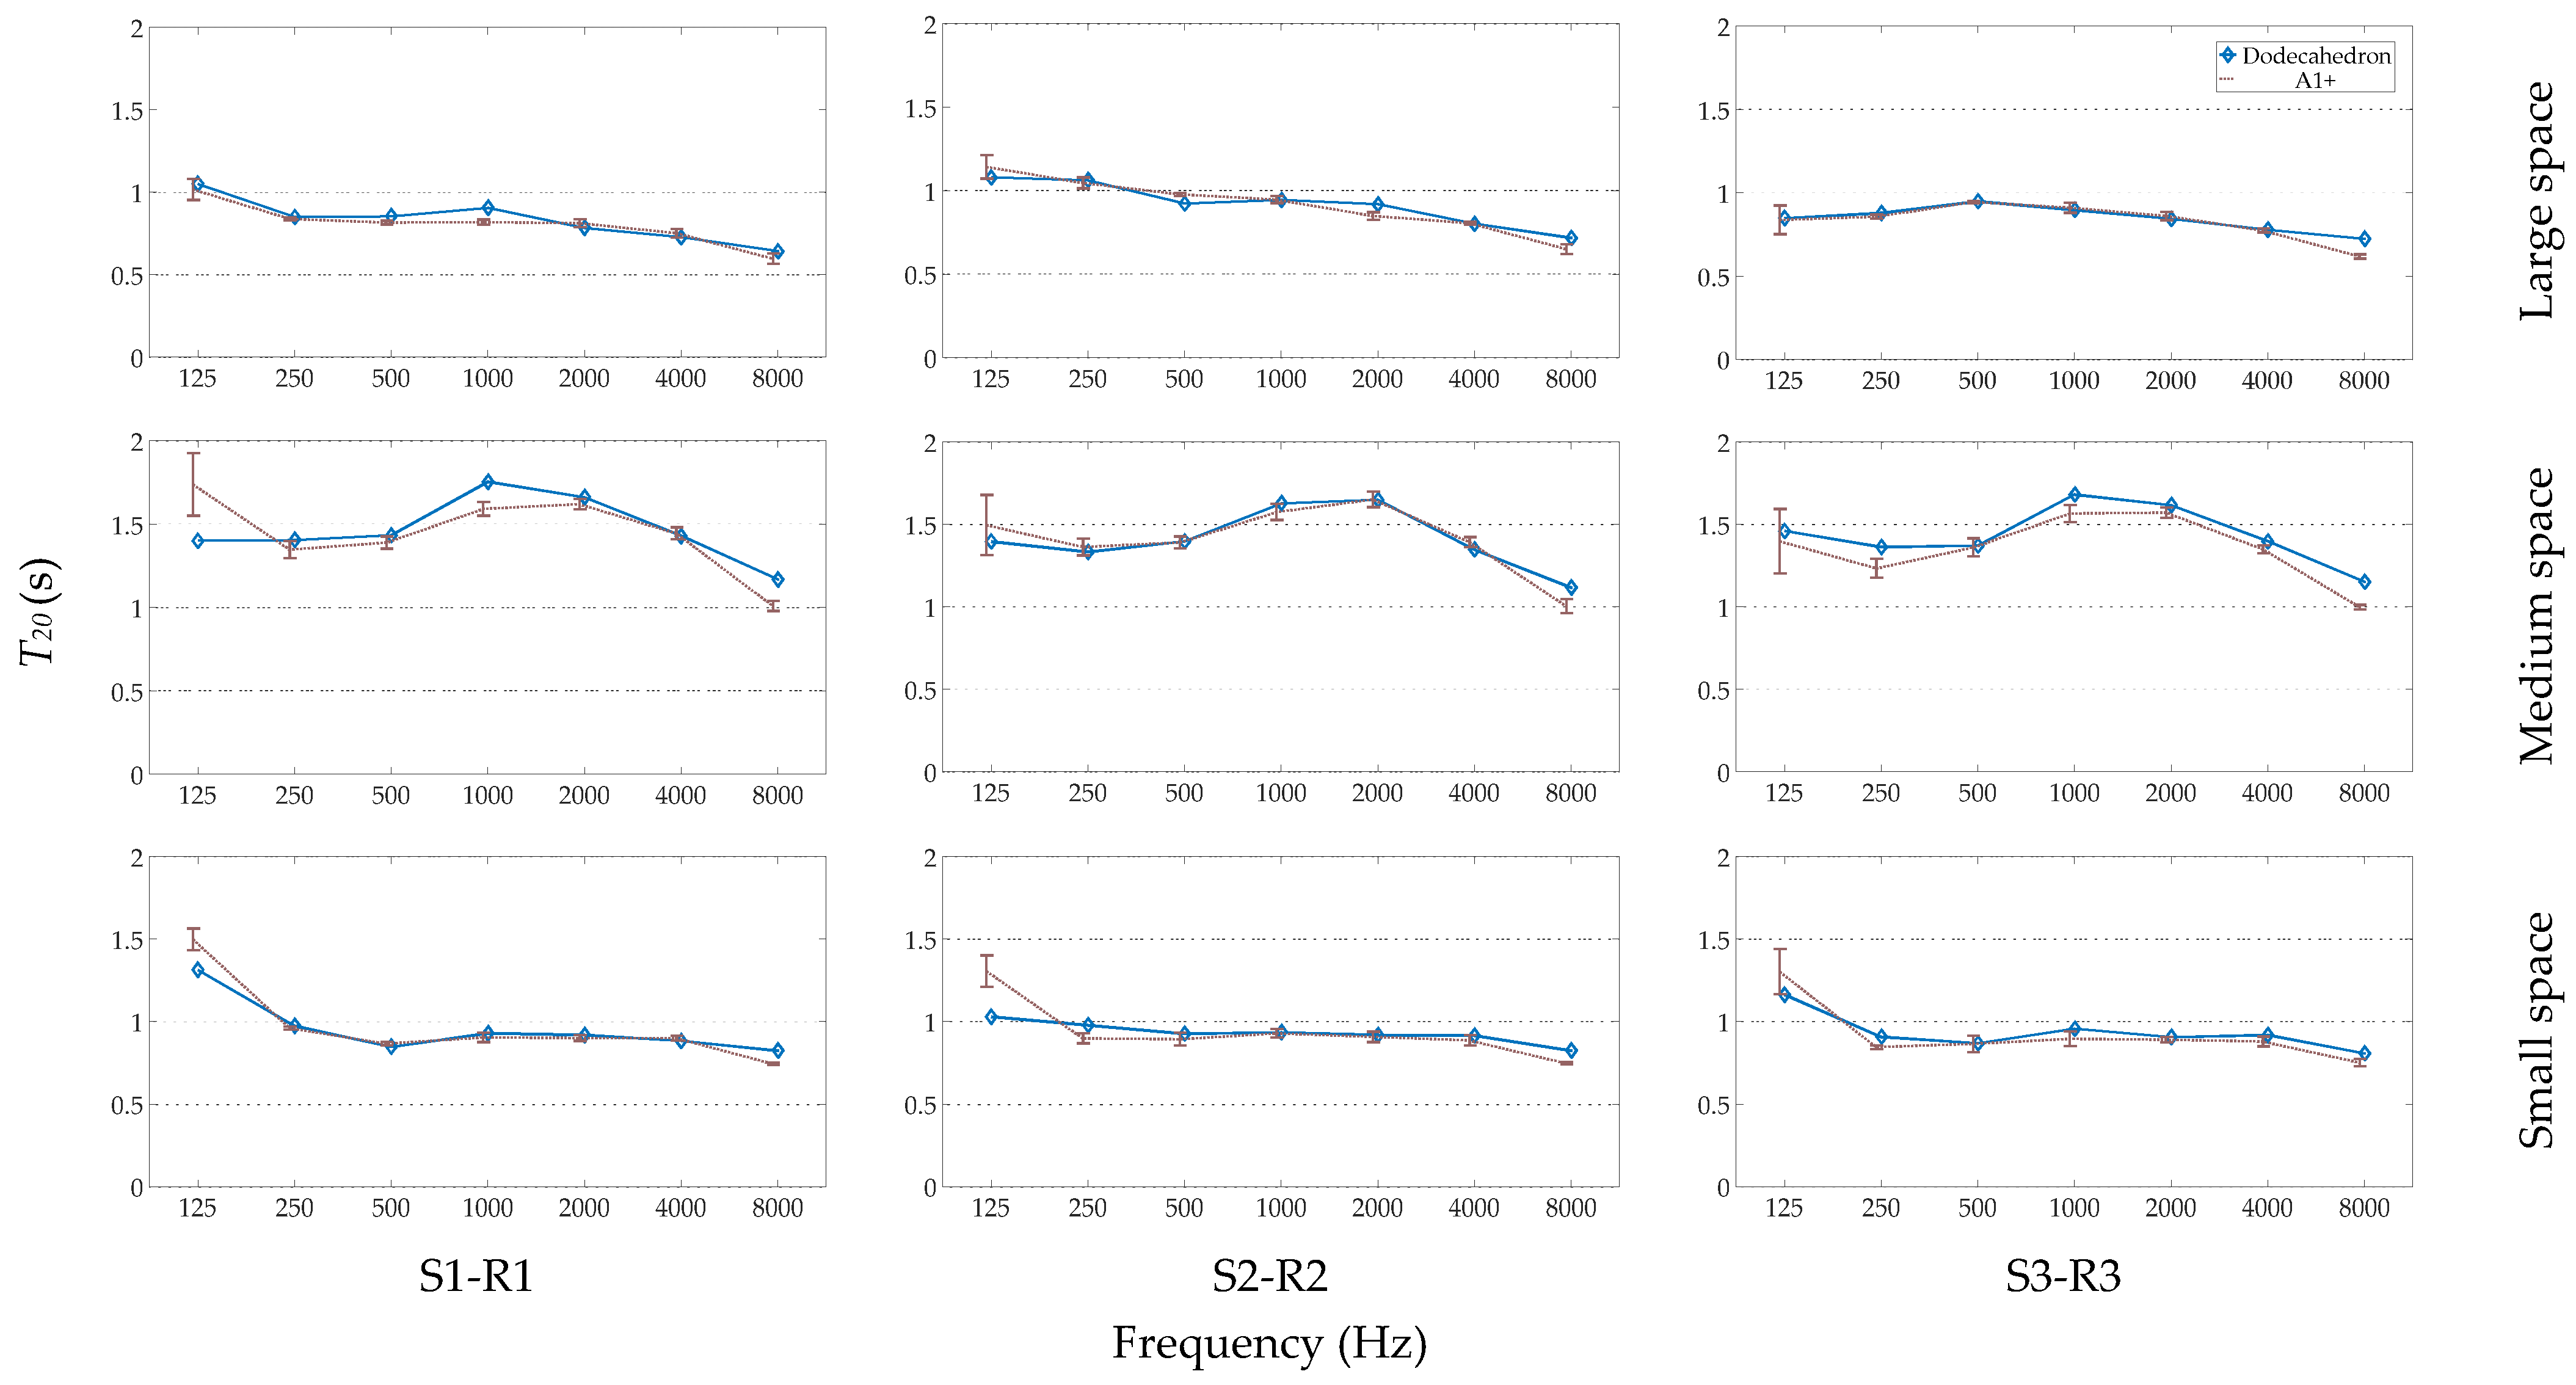
3.3.1. T20 for Different Spaces
In Figure 9, T20 results for measurements performed with a dodecahedron speaker and hand configuration A1+ for three different spaces are presented.
3.3.2. EDT for Different Spaces
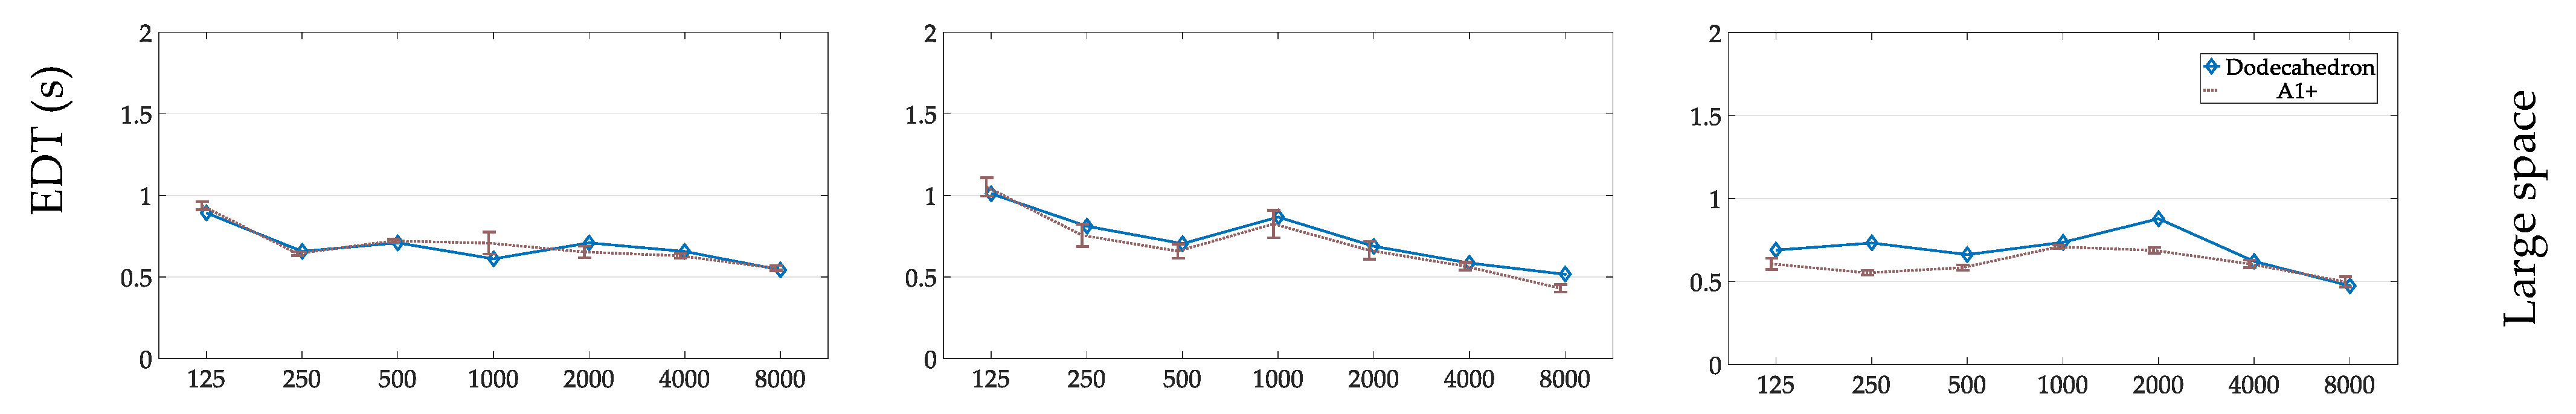
Similar to the previous subsection, EDT results for measurements performed with a dodecahedron speaker and with hand configuration A1+ for three different spaces are presented in Figure 10.
3.3.3. C80 for Different Spaces
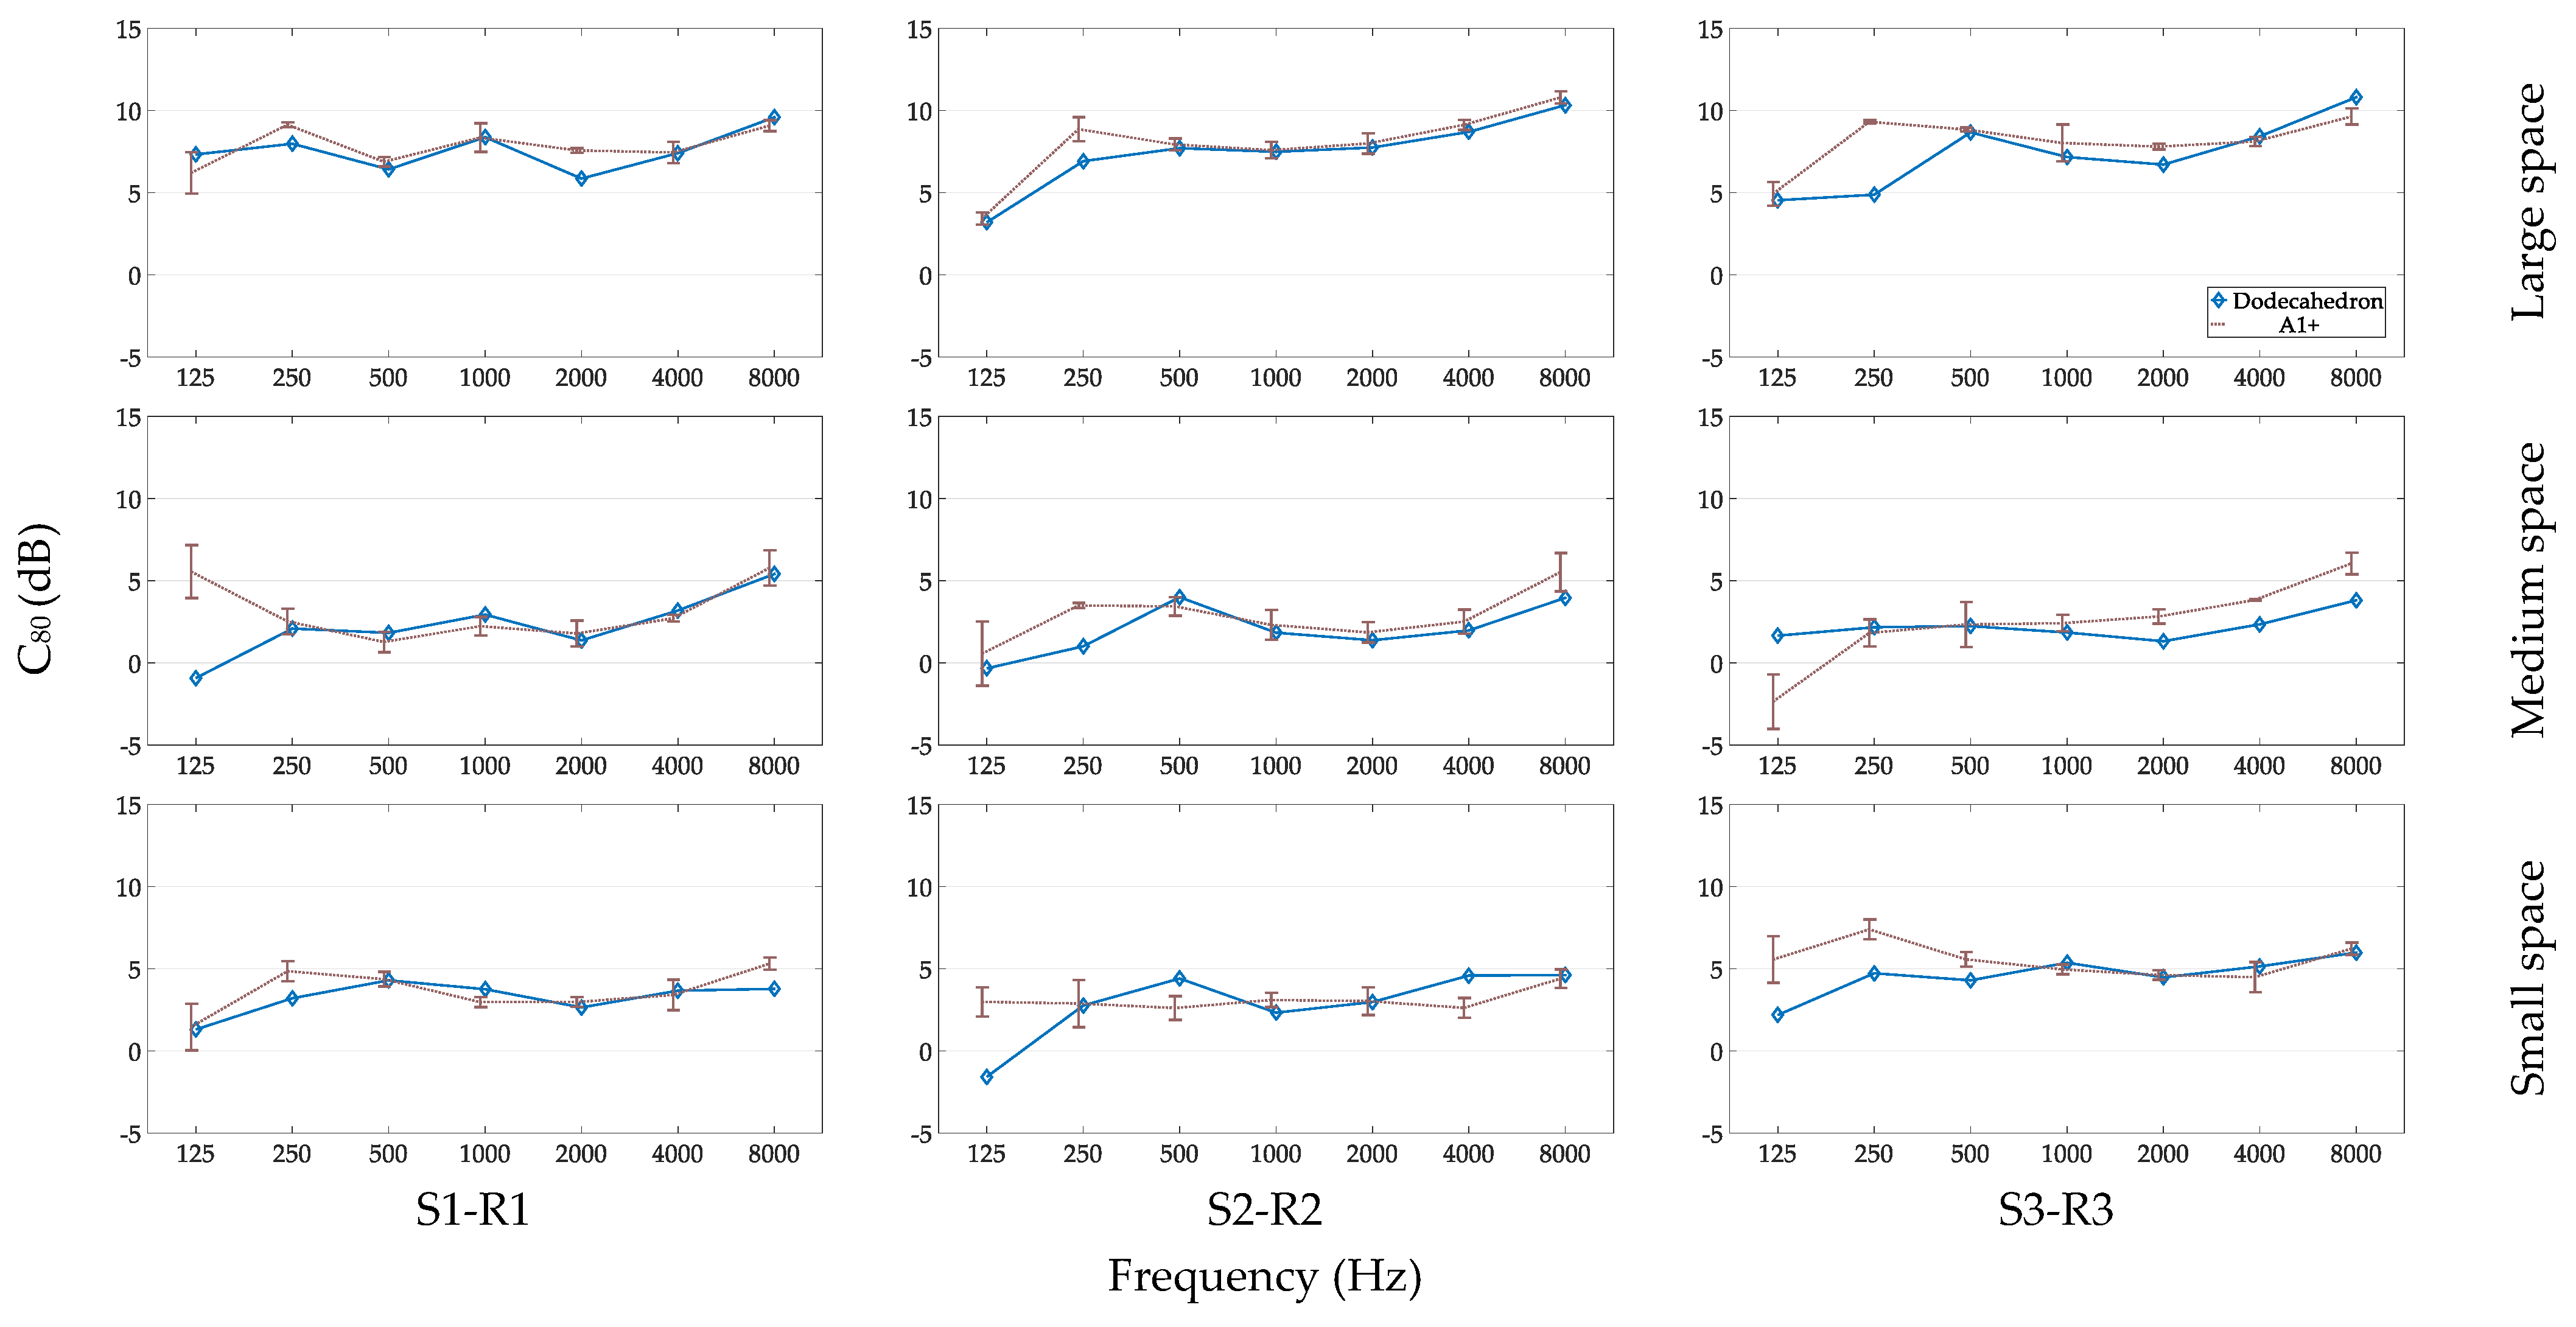
Finally, C80 results for measurements performed with a dodecahedron speaker and with hand configuration A1+ for three different spaces are presented in Figure 11.
4. Discussion
The discussion is presented in accordance with the results and methods in previous sections. Topics of the discussion are:
- Suggested Hand Configuration for Acoustic Measurements
- Measurement of T with a Handclap
- Measurement of EDT with a Handclap
- Measurement of C80 with a Handclap
- Suggested Steps for Measurements with a Handclap as an Acoustic Source
4.1. Suggested Hand Configuration for Acoustic Measurements
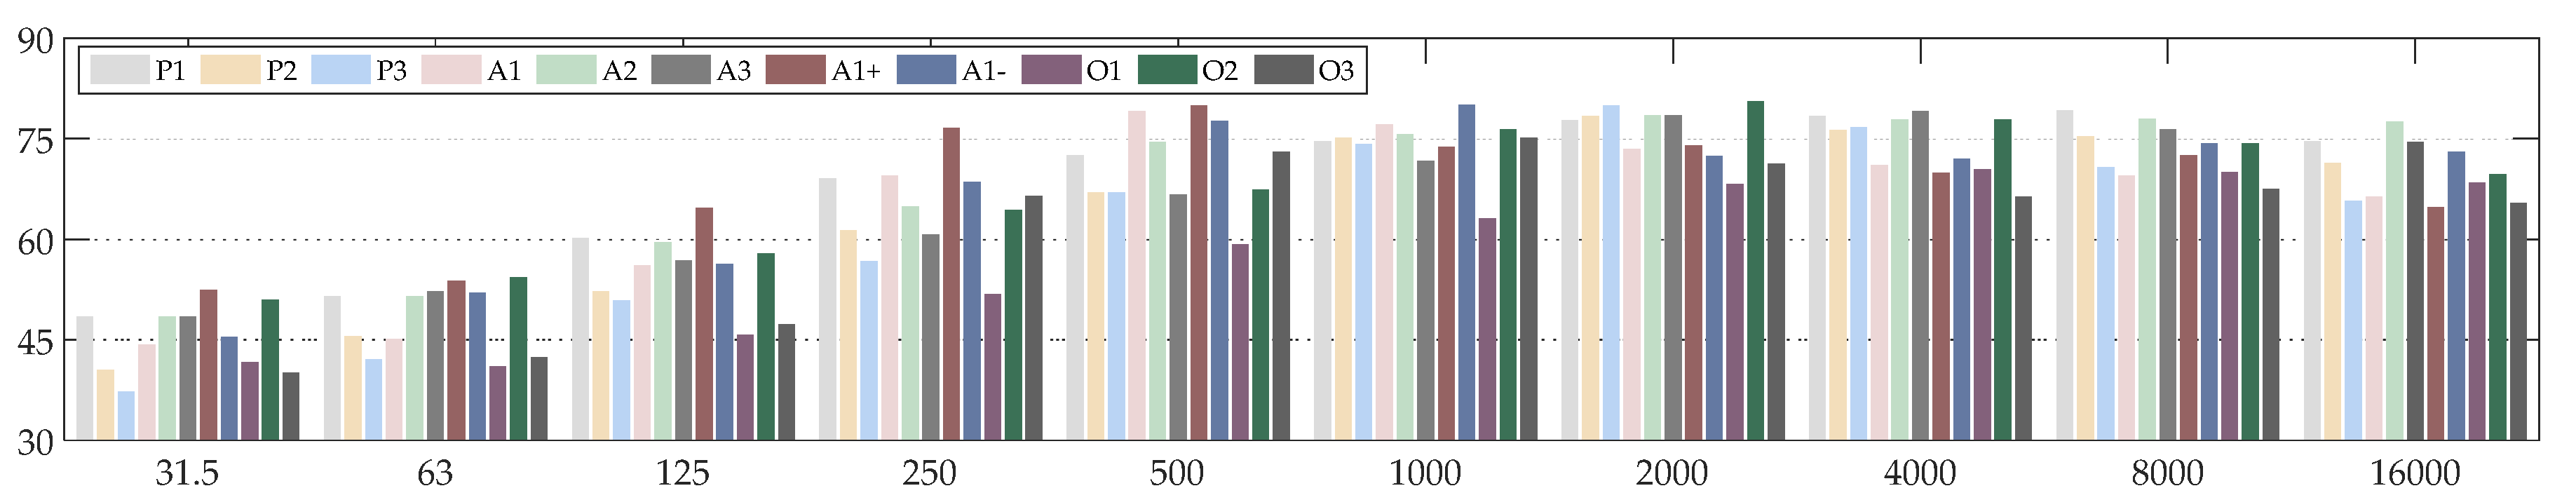
Since the main purpose of this study was to utilize the handclap in the best way possible, the first step was to suggest the optimal hand configuration among the eleven presented (Figure 1). The signal-to-noise ratio is of great importance in acoustic measurements; hence, the first candidate was A2 which was found to have the highest SPL (Table 1). Hand configuration A1+ was the second candidate with the highest SPL levels in low frequency octave bands (Figure 3 and Figure 4, mainly 125 and 250 Hz). As it was stated before, the addition of a Helmholtz-type resonance, which is involved in the case of domed impacts, such as hand configuration A1+ [24], is the reason for this characteristic.
The two hand configurations (i.e., A2 and A1+) were both tested for comparison reasons in Section 3.2. Measurements for T20, EDT, and C80 (Figure 5, Figure 6 and Figure 7, respectively) revealed that hand configuration A1+ provided better results with smaller deviation and SD than A2, compared to measurements with a dodecahedron speaker (especially in the low frequency range).
We believe that the superiority of hand configuration A1+ for acoustic measurements will apply to other spaces besides those applied in this study. The octave band background noise levels and the distribution of those levels in the spectrum measured in this study (Figure 8) are typical of those found indoors in various environments (e.g., library, office, church [58]). It can be seen (Figure 8) that the smallest signal-to-noise ratio was among the low frequency octave bands. The same will possibly apply to other spaces, since the octave band noise distribution will be similar [58].
The same issue was identified in a study by Seetharman and Tarzia [33], where measurements with a handclap did not produce reliable results in the low frequency range. T results were presented only up to 250 Hz in their study, since as the authors stated, “at low frequencies the clap lacked sufficient energy to compute a reasonable reverberation time”. The same can be seen in the study by Huang [34], where the results for T are presented only from 250 Hz octave band and above. Also, the results for the 250 Hz octave band had the largest deviation compared to values found in the literature.
Therefore, it seems reasonable to assume that the hand configuration that would provide the best possible signal-to-noise levels for most frequency bands in typical spaces would be preferable for acoustic measurements. This study suggests that for measurements with typical background noise levels, hand configuration A1+ is the one that will yield the best results.
4.2. Measurement of T with A Handclap
Since the handclap in practice will be utilized mainly for surveying acoustic measurements, the best possible estimation of T is one of the main purposes of this research. As stated earlier in the methods (Section 2.3), due to the low sound pressure levels generated by handclaps, especially in the low frequency range, T20 was the proposed form of T to be estimated which is also presented in ISO 3382-1 [5]. The following discussion applies to the measurement of T20 for the A1+ hand configuration which was suggested for acoustic measurements in the previous subsection. Also, in the following paragraphs, the subjects of suggested measurement of source–receiver distance and expected accuracy are discussed.
Measurements at an increasing source–receiver distance (Figure 5) revealed that the mean absolute error of T20 also increases, especially for the 125 Hz octave band, where the signal-to-noise level is small. In Figure 12, the mean absolute error among octave bands of T20 among measurements with a dodecahedron speaker and a handclap as a sound source for different source–receiver distances is presented. The difference is expected to be greater in larger source–receiver distances (for measurements in larger spaces). However, this remains to be verified in future work. Therefore, for estimation of T20, source–receiver distances near the minimum distance according to Equation (1) are suggested.
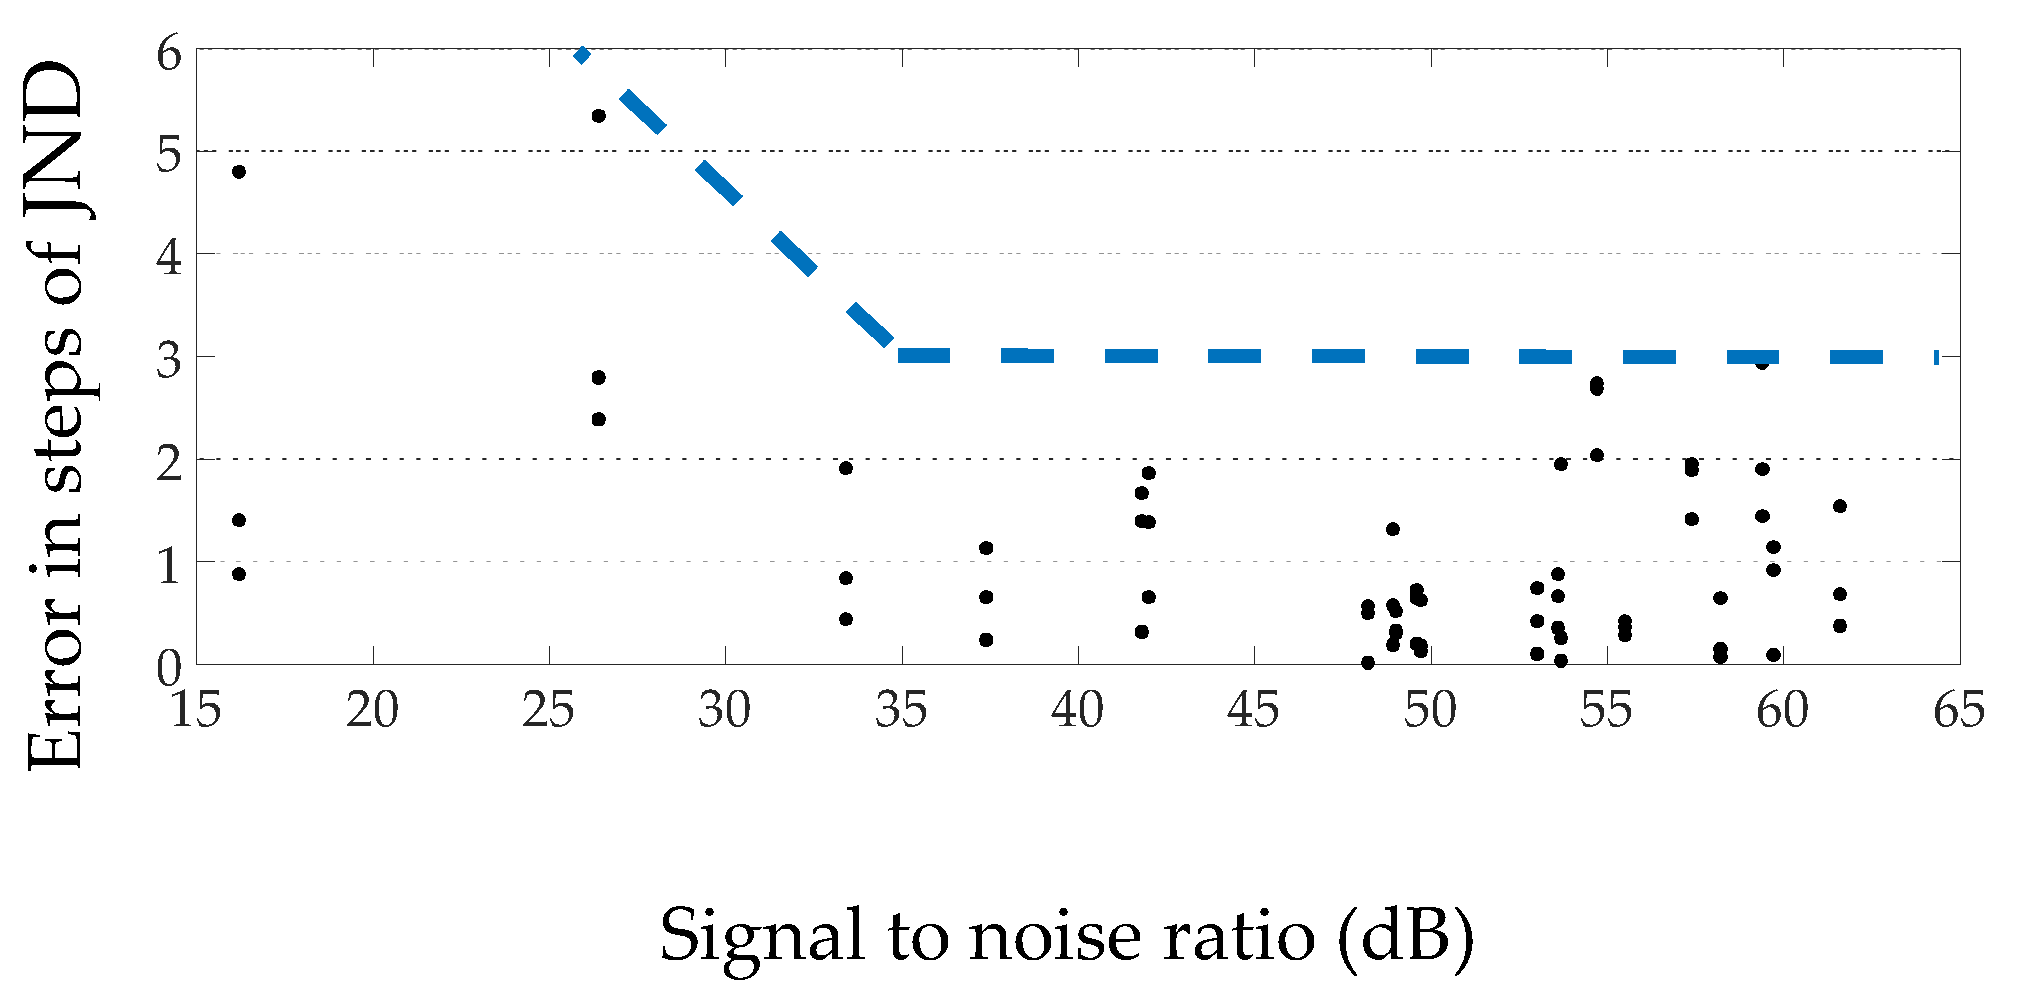
The influence of the signal-to-noise ratio for measurements with a handclap was investigated by analyzing the T20 measurements at different spaces. From the obtained impulse responses, T20 was calculated for the octave bands from 125 Hz through 8 kHz resulting in 63 calculated values for the three spaces and the three positions for each space. Figure 13 shows the measured T20 parameter value errors in steps of the just noticeable difference (JND) as a function of the signal-to-noise ratio for different octave bands (Figure 8). The value of JND (5%) was selected according to ISO 3382-1 [5]. Results indicate that for SNRs larger than 35 dB, all the values of JND are smaller than three.
It has to be noted that above 35 dB, all the values of JND are smaller than two, except three values which correspond to measurements for the 8 KHz octave band (large space: S3–R3, medium space: S1–R1, S3–R3). In general, it can be seen in measurements of T20 (Figure 5 and Figure 9) that for the 8 KHz octave band, all the results from the measurements with a handclap (for both hand configurations) had a lower value compared to measurements with a dodecahedron speaker. This result seems to be systemic and will be addressed in a future publication. A possible explanation could be due to the source directivity. San Martin and Arena [30] studied the uncertainties caused by source directivity in room-acoustic investigations and found that small differences especially in the high frequency range cause variations in the expected measurements. A deviation greater than half the JND of the parameter was found at 80% of receivers for the 8 KHz octave band.
In conclusion, for T measurements using the handclap as an acoustic source, T20 measurements are recommended due to the low signal level of the handclap, especially in the low frequency range compared with background noise levels in usual environments [58]. Also, measurements of T20 near dmin (Equation (1)) are suggested. Results of this research indicate that for SNRs larger than 35 dB, the values of JND are smaller than three.
4.3. Measurement of EDT with a Handclap
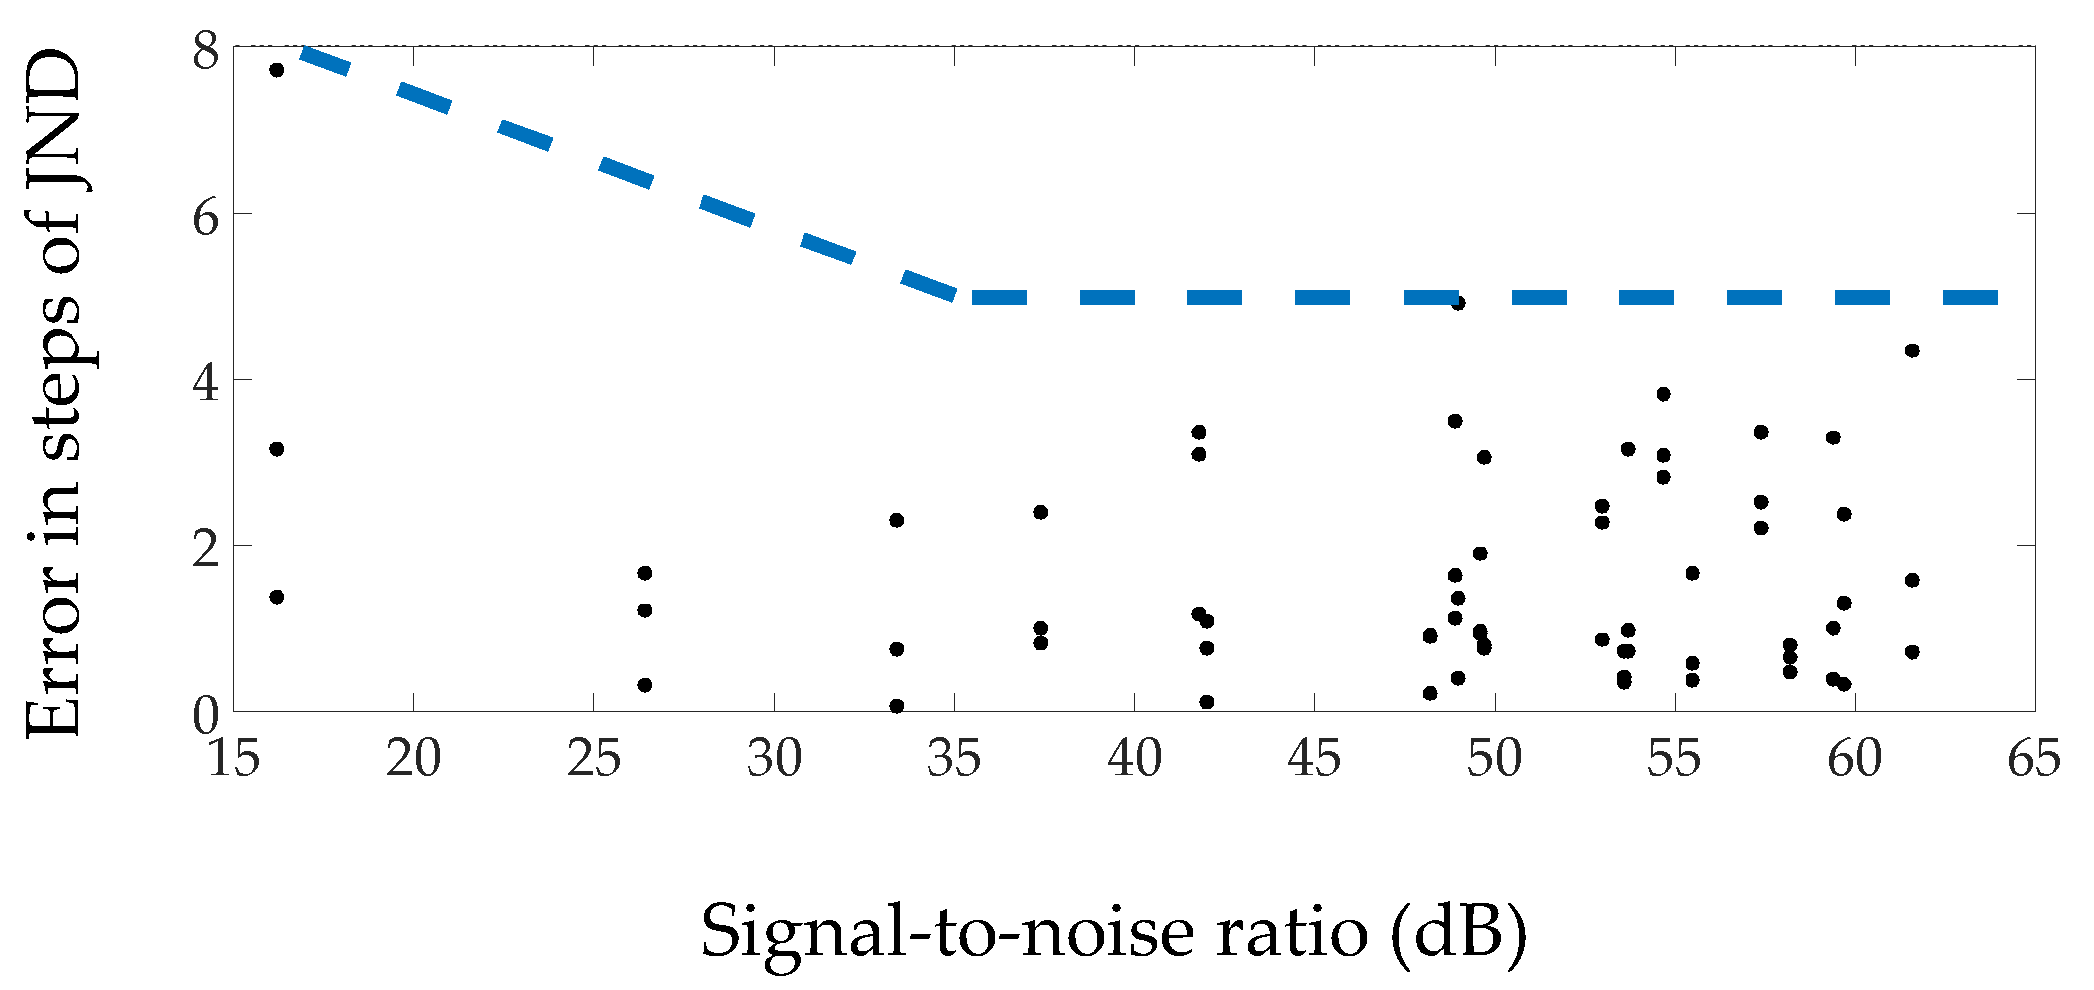
Similar to T20, the influence of the signal-to-noise ratio for the calculation of EDT with a handclap was investigated by analyzing measurements at the different spaces. From the obtained impulse responses, EDT was calculated for the octave bands from 125 Hz through 8 kHz, resulting in 63 calculated values for the three spaces and the three positions. Figure 14 shows the measured EDT parameter value errors in steps of JND as a function of the signal-to-noise ratio for different octave bands (Figure 8). The value of JND (5%) was selected according to ISO 3382-1 [5]. The results indicate that for SNRs larger than 35 dB, all the values of JND are smaller than five.
Evaluating the results, it can be seen that the error in measurements of EDT (evaluated by the JNDs) is greater than the measurements of T20. A possible explanation could be due to the directionality of the handclap and the effect that it has in the measurements of acoustic parameters. As stated in the introduction, omnidirectionality of the handclap was studied by Griesinger [29] revealing directional characteristics. The effect that the directionality of the source has on the measurements of EDT can be found in some studies [59,60]. The influence of the directionality of the source was performed in a study by Wang and Vingead [59] revealing that reverberation time (T30) changed very little across source types and orientations, while both EDT and C80 changed significantly. The same conclusion was found in another study [60], where the parameters dealing with early sound, such as EDT and C80, were more sensitive than the parameters dealing with late sound such as T20. These studies do not contradict the results reported in the previous subsection concerning the effect of directionality on the measurement of T for the 8 KHz octave band [30], since they present results only up to the 4 KHz octave band.
4.4. Measurement of C80 with a Handclap
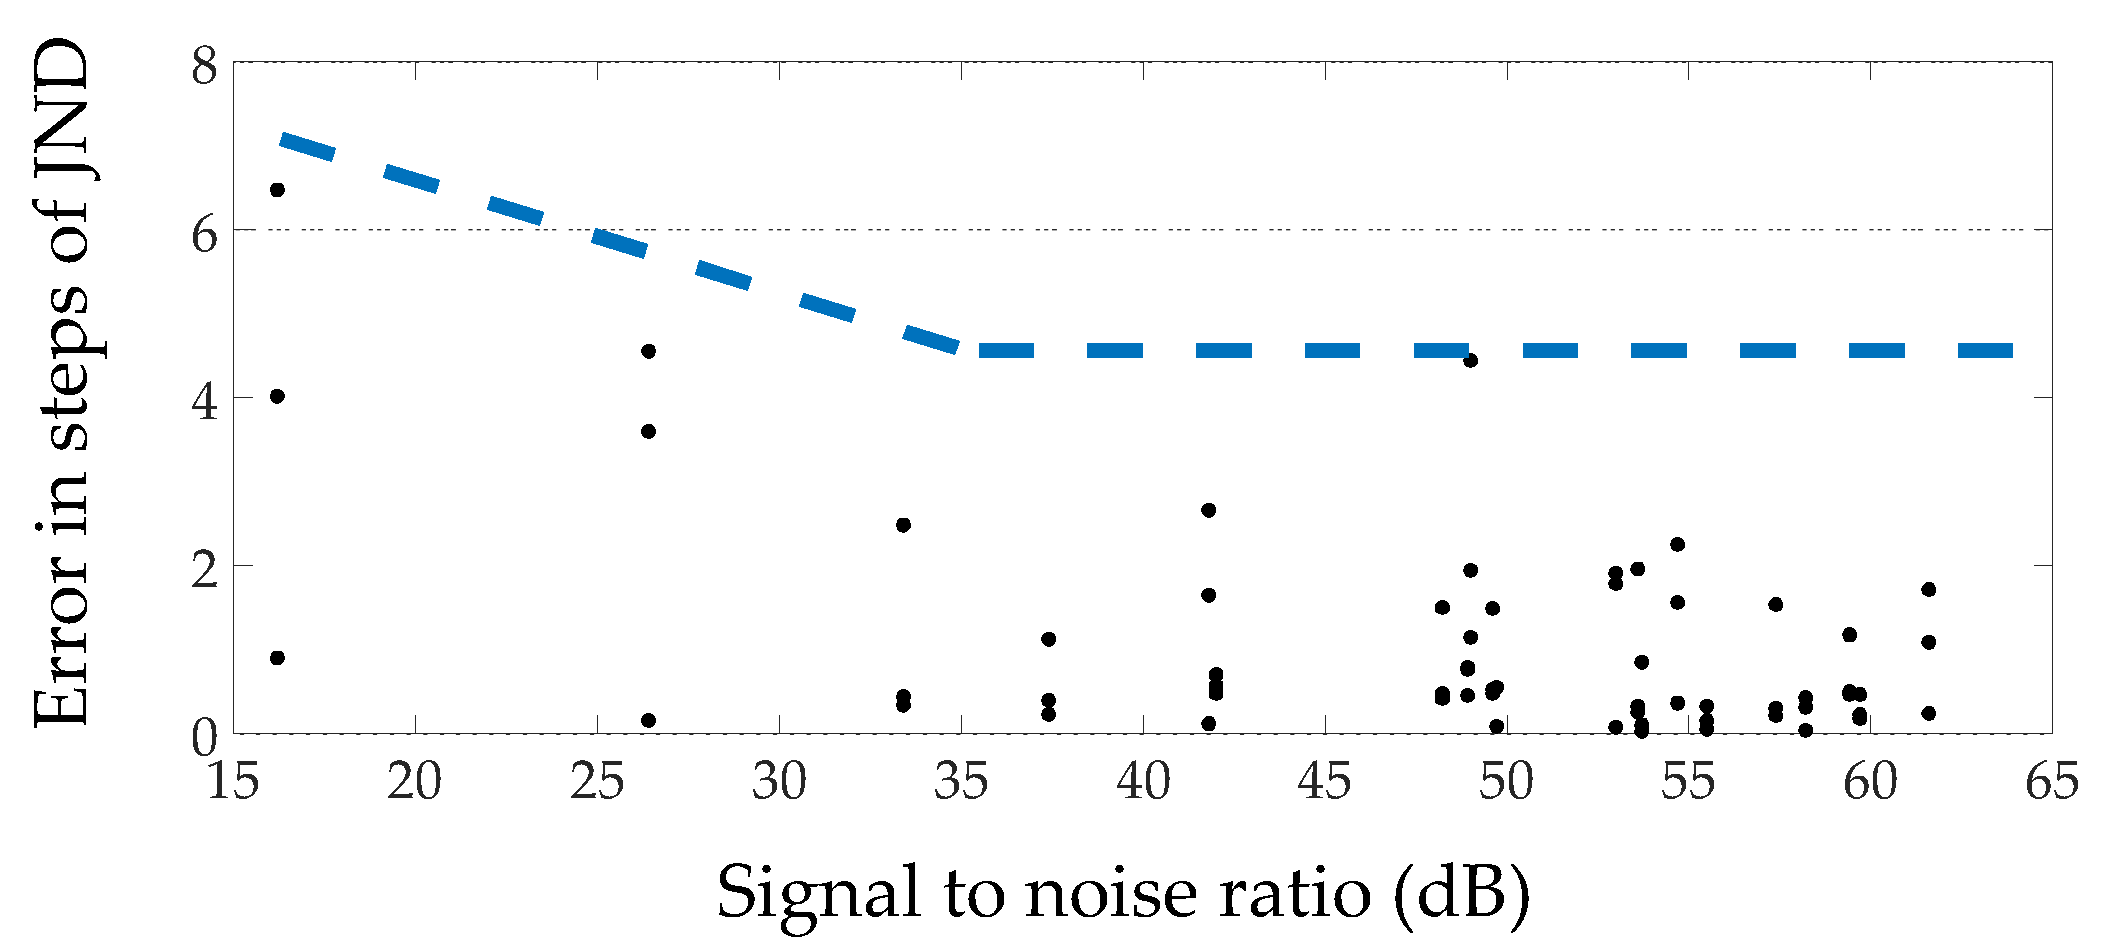
Similar to the previous subsection for the measurements of T20 and EDT, the influence of the signal-to-noise ratio for the calculation of C80 with a handclap was investigated by analyzing measurements in different spaces. C80 was calculated for the octave bands from 125 Hz through 8 kHz, resulting in 63 values for the three spaces and the three positions. Figure 15 presents the measured C80 parameter value errors in steps of JND as a function of the signal-to-noise ratio for different octave bands (Figure 8). The value of JND (1 dB) was selected according to ISO 3382-1 [5]. The results indicate that for SNRs values larger than 35 dB, all the values of JND are smaller than 4.5.
Evaluating the results, it can be seen that the error in measurements of C80 was greater than the error of T20 but similar to that of EDT. Again, a possible explanation could be due to the directionality of the handclap and the effect that it has in the measurements of acoustic parameters. Previous mentioned studies [59,60] reveal that the effect of directionality was very profound in the calculation of C80.
Another factor affecting measurement of C80 is the scattering effect of the person who performs the handclap. In a study by Guski and Vorländer [61], a special measurement scenario was designed to investigate the effect of human-size scattering objects. Measurements of C80 showed a large influence of the scattering object, while the effect for T was negligible.
4.5. Suggested Steps for Measurements with A Handclap as An Acoustic Source
In order to present a practical methodology that can be followed for acoustic measurements with a handclap as a sound source, the following steps are recommended by the authors:
- Utilization of hand configuration A1+ for acoustic measurements (Figure 1). This study has shown that this hand configuration will provide the best possible signal-to-noise levels for most frequency bands in typical spaces and will yield the best results (more on this on Section 4.1);
- Training of hand configuration A1+ to optimize results is recommended. Training of measurements with a handclap has shown to result in better repeatability of the measurements [26];
- Source–receiver distance in measurements should be near minimum distance, dmin, (Equation (2)) suggested by the ISO 3382-2 [48]. At shorter source–receiver distance, the signal-to-noise ratio is higher, therefore better measurements can be achieved (more on this on Section 4.2);
- If available, background noise levels should be measured in order to evaluate the accuracy of the results according to the signal-to-noise ratio. The results indicating probable measurement accuracy according to the signal-to-background noise level provided in this paper (more on this on Section 4.2, Section 4.3, Section 4.4);
- Measurements for the same source–receiver positions should be performed at least four times and averaged;
- A compensation method for the background noise should be applied in the processing of measurements; Background noise affects the decay range of the impulse response decay curves and the evaluation of the acoustic parameters (more on this on Section 2.3). Available software for acoustics measurements that provides compensation methods can be found in Reference [62].
- If possible, measurements with a mobile phone should be avoided. Measurements of T with a handclap and different cellphones as sound recorders were found to provide different results [34], while in another study, differences of T were within +/−0.2 s compared to measurements with a sound level meter [35]. Measurements with a cellphone have been studied mainly for the measurements of SPL [63]. Differences were found across operating systems (iOS and Android), across different versions of the operating system as well as applications (apps) for those systems. Difference in measurements can be attributed to factors such as small dynamic range, internal filters applied in the low frequency range as well as input gain control applied by (some of) the operating systems. In conclusion, measurements with a mobile phone depend on many factors and the expected accuracy is not easy to predict. However external microphones can be used for better results [64].
5. Conclusions
This study provided one of the first comprehensive assessments of the handclap as a source for acoustic measurements. The findings of this study indicate the optimal hand configuration (A1+), a suggested source–receiver distance for acoustic measurements (near dmin), and also the expected deviation of T20, EDT, and C80 compared to measurements with a dodecahedron speaker in steps of JND as a function of the signal-to-noise ratio. Also, practical steps for measurements with a handclap as an acoustic source are suggested.
We believe that our findings could be useful for a better utilization of a handclap as a source for acoustic measurements as well as for a better understanding of its inherent limitations. Our research may also be useful for other scientific fields that exploit the sound of a handclap for a multitude of reasons.
With regard to the research methods, some limitations need to be acknowledged. The study was applied in a limited number of spaces. Therefore, in terms of directions for further work, the methodology applied could be investigated in a larger number of rooms in order to test the generalizability of the findings. We hope that our research will serve as a basis for future studies on further utilization of the handclap as a useful and convenient acoustic source.
Author Contributions
N.M.P. analyzed the data and wrote the manuscript; G.E.S. provided suggestions and guidance for the work and reviewed and edited the manuscript. All authors have read and agreed to the published version of the manuscript.
Funding
This research received no external funding.
Acknowledgments
We gratefully acknowledge the help provided by Konstantinos Lafazanis during various stages of this research. Thanks are also due to the students that participated in the measurement sessions from the Hellenic Mediterranean University, Department of Music Technology and Acoustics.
Conflicts of Interest
The authors declare no conflict of interest.
Abbreviations
The following abbreviations are used in this manuscript:
| A# | Aligned (hand configuration) |
| C80 | Clarity |
| EDT | Early Decay Time |
| ESS | Exponential Sine Sweep |
| ISO | International Organization for Standardization |
| JND | Just Noticeable Difference |
| MEMS | Micro-Electromechanical Systems |
| MLS | Maximum Length Sequence |
| O# | Opposite (hand configuration) |
| P# | Parallel (hand configuration) |
| SD | Standard Deviation |
| SNR | Sound-to-Noise Ratio |
| SPLs | Sound Pressure Levels |
| T | Reverberation Time |
| T20 | Reverberation Time (based on a 20 dB dynamic range) |
| T30 | Reverberation Time (based on a 30 dB dynamic range) |
| Ts | Centre Time |
Appendix A

Table A1.
Source and receiver positions for measurements at different source–receiver distances corresponding to Figure 2A.
Table A1.
Source and receiver positions for measurements at different source–receiver distances corresponding to Figure 2A.
| Source Position | Receiver Positions | ||||
|---|---|---|---|---|---|
| S(4.58, 4.63, 1.30) | R1(4.58, 8.62, 1.53) | R2(4.58, 9.62, 1.66) | R3(4.58, 10.61, 1.80) | R4(4.58, 11.60, 1.94) | R5(4.58, 12.59, 2.09) |
| R6(4.58, 13.58, 2.24) | R7(4.58, 14.57, 2.38) | R8(4.58, 15.56, 2.53) | R9(4.58, 16.55, 2.68) | ||
Table A2.
Source and receiver positions for measurements at different spaces (i.e., large, medium, small) corresponding to Figure 2B–D, respectively.
Table A2.
Source and receiver positions for measurements at different spaces (i.e., large, medium, small) corresponding to Figure 2B–D, respectively.
| Large Space | Medium Space | Small Space | |||
|---|---|---|---|---|---|
| S1(3.36, 3.64, 1.30) | R1(3.57, 7.71, 1.42) | S1(2.55, 2.20, 1.30) | R1(2.03, 3.78, 1.20) | S1(1.40, 3.15, 1.30) | R1(2.16, 5.76, 1.20) |
| S2(5.92, 1.82, 2.20) | R2(5.78, 5.77, 1.20) | S2(4.70, 1.55, 1.30) | R2(3.85, 3.98, 1.20) | S2(3.15, 2.53, 1.30) | R2(3.57, 4.98, 1.20) |
| S3(8.80, 3.30, 1.30) | R3(9.24, 7.27, 1.36) | S3(5.62, 1.17, 1.30) | R3(6.57, 3.02, 1.20) | S3(4.20, 1.40, 1.30) | R3(4.31, 3.35, 1.20) |
References
- Crocker, M.J. Encyclopedia of Acoustics; John Wiley: Hoboken, NJ, USA, 1997; p. 107. [Google Scholar]
- Kuttruff, H. Acoustics, an Introduction; Taylor and Francis: New York, NY, USA, 2007; p. 84. [Google Scholar]
- Papadakis, N.M.; Stavroulakis, G.E. Review of Acoustic Sources Alternatives to a Dodecahedron Speaker. Appl. Sci. 2019, 9, 3705. [Google Scholar] [CrossRef] [Green Version]
- Leishman, T.W.; Rollins, S.; Smith, H.M. An experimental evaluation of regular polyhedron loudspeakers as omnidirectional sources of sound. J. Acoust. Soc. Am. 2006, 120, 1411–1422. [Google Scholar] [CrossRef] [Green Version]
- ISO. ISO 3382-1: 2009. In Measurement of Room Acoustic Parameters—Part 1: Performance Spaces; ISO: Geneva, Switzerland, 2009. [Google Scholar]
- ISO. ISO 16283-1:2014. In Acoustics—Field Measurement of Sound Insulation in Buildings and of Building Elements—Part 1: Airborne Sound Insulation; ISO: Geneva, Switzerland, 2014. [Google Scholar]
- ISO. 10140-5. Acoustics—Laboratory Measurement of Sound Insulation of Building Elements—Part 5: Requirements for Test Facilities and Equipment; ISO: Geneva, Switzerland, 2014. [Google Scholar]
- Schroeder, M.R. Integrated impulse method measuring sound decay without using impulses. J. Acoust. Soc. Am. 1979, 66, 497–500. [Google Scholar] [CrossRef]
- Farina, A. Simultaneous measurement of impulse response and distortion with a swept-sine technique. In Proceedings of Audio Engineering Society Convention 108; Audio Engineering Society: Paris, France, 2000. [Google Scholar]
- ISO. ISO 18233-2006 Acoustics—Application of New Measurement Methods in Building and Room Acoustics; ISO: Geneva, Switzerland, 2006. [Google Scholar]
- Stan, G.-B.; Embrechts, J.-J.; Archambeau, D. Comparison of different impulse response measurement techniques. J. Audio Eng. Soc. 2002, 50, 249–262. [Google Scholar]
- Guidorzi, P.; Barbaresi, L.; D’Orazio, D.; Garai, M. Impulse responses measured with MLS or Swept-Sine signals applied to architectural acoustics: An in-depth analysis of the two methods and some case studies of measurements inside theaters. Energy Procedia 2015, 78, 1611–1616. [Google Scholar] [CrossRef] [Green Version]
- Antoniadou, S.; Papadakis, N.M.; Stavroulakis, G.E. Measuring Acoustic Parameters with ESS and MLS: Effect of Artificially Varying Background Noises. In Proceedings of the Euronoise 2018, Heraclion, Greece, 27–31 May 2018. [Google Scholar]
- Pätynen, J.; Katz, B.F.; Lokki, T. Investigations on the balloon as an impulse source. J. Acoust. Soc. Am. 2011, 129, EL27–EL33. [Google Scholar] [CrossRef]
- Lamothe, M.R.; Bradley, J. Acoustical characteristics of guns as impulse sources. Can. Acoust. 1985, 13, 16–24. [Google Scholar]
- Arana, M.; Vela, A.; San Martin, L. Calculating the impulse response in rooms using pseudo-impulsive acoustic sources. Acta Acust. United Acust. 2003, 89, 377–380. [Google Scholar]
- Polack, J.-D.; Christensen, L.S.; Juhl, P.M. An innovative design for omnidirectional sound sources. Acta Acust. United Acust. 2001, 87, 505–512. [Google Scholar]
- Sumarac-Pavlovic, D.; Mijic, M.; Kurtovic, H. A simple impulse sound source for measurements in room acoustics. Appl. Acoust. 2008, 69, 378–383. [Google Scholar] [CrossRef]
- Papadakis, N.M.; Stavroulakis, G.E. Low Cost Omnidirectional Sound Source Utilizing a Common Directional Loudspeaker for Impulse Response Measurements. Appl. Sci. 2018, 8, 1703. [Google Scholar] [CrossRef] [Green Version]
- Sayin, U.; Artís, P.; Guasch, O. Realization of an omnidirectional source of sound using parametric loudspeakers. J. Acoust. Soc. Am. 2013, 134, 1899–1907. [Google Scholar] [CrossRef] [PubMed]
- Kruse, R.; Häußler, A.; van de Par, S. An omnidirectional loudspeaker based on a ring-radiator. Appl. Acoust. 2013, 74, 1374–1377. [Google Scholar] [CrossRef]
- San Martín, R.; Arana, M.; Machín, J.; Arregui, A. Impulse source versus dodecahedral loudspeaker for measuring parameters derived from the impulse response in room acoustics. J. Acoust. Soc. Am. 2013, 134, 275–284. [Google Scholar] [CrossRef] [PubMed]
- Gomez-Agustina, L.; Barnard, J. Practical and technical suitability perceptions of sound sources and test signals used in room acoustic testing. In INTER-NOISE and NOISE-CON Congress and Conference Proceedings; Institute of Noise Control Engineering: Madrid, Spain, 2019. [Google Scholar]
- Fletcher, N.H. Shock waves and the sound of a hand-clap–a simple model. Acoust. Aust. 2013, 41, 165–168. [Google Scholar]
- Hargather, M.J.; Settles, G.S.; Madalis, M.J. Schlieren imaging of loud sounds and weak shock waves in air near the limit of visibility. Shock Waves 2010, 20, 9–17. [Google Scholar] [CrossRef]
- Repp, B.H. The sound of two hands clapping: An exploratory study. J. Acoust. Soc. Am. 1987, 81, 1100–1109. [Google Scholar] [CrossRef] [Green Version]
- Jylhä, A.; Erkut, C. Inferring the Hand Configuration from Hand Clapping Sounds. In Proceedings of the 11th International Conference Digital Audio Effects Workshop (DAFx’08), Espoo, Finland, 1–4 September 2008; pp. 301–304. [Google Scholar]
- Peltola, L.; Erkut, C.; Cook, P.R.; Valimaki, V. Synthesis of hand clapping sounds. IEEE Trans. Audio Speech Lang. Process. 2007, 15, 1021–1029. [Google Scholar] [CrossRef]
- Griesinger, D. Beyond MLS-Occupied hall measurement with FFT techniques. In Proceedings of Audio Engineering Society Convention 101; Audio Engineering Society: New York, NY, USA, 1996. [Google Scholar]
- San Martín, R.; Arana, M. Uncertainties caused by source directivity in room-acoustic investigations. J. Acoust. Soc. Am. 2008, 123, EL133–EL138. [Google Scholar] [CrossRef] [Green Version]
- Knüttel, T.; Witew, I.B.; Vorländer, M. Influence of “omnidirectional” loudspeaker directivity on measured room impulse responses. J. Acoust. Soc. Am. 2013, 134, 3654–3662. [Google Scholar] [CrossRef]
- Rizzi, L.; Ghelfi, G.; Campanini, S.; Rosati, A. Rapid Room Acoustics Parameters Measurements with Smartphones. In Proceedings of the ISCV22, Florence, Italy, 12–16 July 2019. [Google Scholar]
- Seetharaman, P.; Tarzia, S.P. The hand clap as an impulse source for measuring room acoustics. In Proceedings of Audio Engineering Society Convention 132; Audio Engineering Society: New York, NY, USA, 2012. [Google Scholar]
- Huang, K. Impulse response of the Bayreuth Festspielhaus. arXiv 2017, arXiv:1703.07080. [Google Scholar]
- Brown, R.; Evans, L. Acoustics and the Smartphone. In Proceedings of the ACOUSTICS 2011, Gold Coast, Australia, 2–4 November 2011. [Google Scholar]
- Halmrast, T. When source is also receiver. Build. Acoust. 2013, 20, 403–421. [Google Scholar] [CrossRef]
- Shukla, A.; Patil, P.; Nanaware, K.; Salve, S. Clap Pattern Based Electrical Appliance Control. IJSRD 2017, 5, 902–905. [Google Scholar]
- Olokede, S.S. Design of a clap activated switch. Leonardo J. Sci. 2008, 7, 44–58. [Google Scholar]
- Kilis, N.; Mitianoudis, N. A Novel Scheme for Single-Channel Speech Dereverberation. Acoustics 2019, 1, 711–725. [Google Scholar] [CrossRef] [Green Version]
- Zäh, U.; Riedhammer, K.; Bocklet, T.; Nöth, E. Clap Your Hands! Calibrating Spectral Subtraction for Dereverberation. In Proceedings of the 2010 IEEE International Conference on Acoustics, Speech and Signal Processing, Dallas, TX, USA, 14–19 March 2010; pp. 4226–4229. [Google Scholar]
- Tsilfidis, A.; Georganti, E.; Kokkinis, E.K.; Mourjopoulos, J. Speech Dereverberation Based on a Recorded Handclap. In Proceedings of the 2011 17th International Conference on Digital Signal Processing (DSP), Corfu, Greece, 6–8 July 2011; pp. 1–6. [Google Scholar]
- Malik, H.; Mahmood, H. Acoustic environment identification using unsupervised learning. Secur. Inform. 2014, 3, 11. [Google Scholar] [CrossRef] [Green Version]
- Jylhä, A.; Erkut, C. Sonic interactions with hand clap sounds. Proc. Audio Most. 2008, 2008, 93–100. [Google Scholar]
- Jylhä, A.; Erkut, C. A hand clap interface for sonic interaction with the computer. In Proceedings of CHI’09 Extended Abstracts on Human Factors in Computing Systems; Association for Computing Machinery: New York, NY, USA, 2009; pp. 3175–3180. [Google Scholar]
- Hanahara, K.; Tada, Y.; Muroi, T. Human-robot communication by means of hand-clapping (preliminary experiment with hand-clapping language). In Proceedings of the 2007 IEEE International Conference on Systems, Man and Cybernetics, Montreal, QC, Canada, 7–10 October 2007; pp. 2995–3000. [Google Scholar]
- Almahdi, R.; Diharjo, K.; Hidayat, R.L.G.; Suharty, N.S. In situ test: Acoustic performance of eco-absorber panel based albizia wood and sugar palm fiber on meeting room in UNS Inn Hotel. In Proceedings of IOP Conference Series: Materials Science and Engineering; IOP Publishing: Bristol, UK, 2018; p. 012033. [Google Scholar]
- Lee, Y.; Cha, H. A Light-weight and Scalable Localization Technique Using Mobile Acoustic Source. In Proceedings of the Sixth IEEE International Conference on Computer and Information Technology (CIT’06), Seoul, Korea, 20–22 September 2006; p. 235. [Google Scholar]
- ISO. ISO 3382-2: 2008. In Measurement of Room Acoustic Parameters—Part 2: Reverberation Time in Ordinary Rooms; ISO: Geneva, Switzerland, 2009. [Google Scholar]
- Hak, C.; Wenmaekers, R.; Van Luxemburg, L. Measuring room impulse responses: Impact of the decay range on derived room acoustic parameters. Acta Acust. United Acust. 2012, 98, 907–915. [Google Scholar] [CrossRef] [Green Version]
- Rossing, T.D. Springer Handbook of Acoustics; Springer: Berlin, Germany, 2007; p. 323. [Google Scholar]
- Reichardt, W.; Alim, O.A.; Schmidt, W. Abhängigkeit der Grenzen zwischen brauchbarer und unbrauchbarer Durchsichtigkeit von der Art des Musikmotives, der Nachhallzeit und der Nachhalleinsatzzeit. Appl. Acoust. 1974, 7, 243–264. [Google Scholar] [CrossRef]
- Kuttruff, H. Room Acoustics; CRC Press: Boca Raton, FL, USA, 2016; p. 169. [Google Scholar]
- Guski, M.; Vorländer, M. Comparison of noise compensation methods for room acoustic impulse response evaluations. Acta Acust. United Acust. 2014, 100, 320–327. [Google Scholar] [CrossRef]
- Chu, W.T. Comparison of reverberation measurements using Schroeder’s impulse method and decay-curve averaging method. J. Acoust. Soc. Am. 1978, 63, 1444–1450. [Google Scholar] [CrossRef] [Green Version]
- Guski, M. Influences of External Error Sources on Measurements of Room Acoustic Parameters; Logos Verlag Berlin GmbH: Berlin, Germany, 2015; Volume 24. [Google Scholar]
- Bies, D.A.; Scharton, T. Relation between Near Field and Far Field Acoustic Measurements; National Aeronautics and Space Administration (NASA), Ames Research Center: Mountain View, CA, USA, 1974. [Google Scholar]
- Hosoe, S.; Nishino, T.; Itou, K.; Takeda, K. Measurement of head-related transfer functions in the proximal region. In Proceedings of Forum Acusticum; European Acoustics Association: Budapest, Hungary, 2005; pp. 2539–2542. [Google Scholar]
- Weisser, A.; Buchholz, J.M. Conversational speech levels and signal-to-noise ratios in realistic acoustic conditions. J. Acoust. Soc. Am. 2019, 145, 349–360. [Google Scholar] [CrossRef] [PubMed]
- Wang, L.M.; Vigeant, M.C. Evaluations of output from room acoustic computer modeling and auralization due to different sound source directionalities. Appl. Acoust. 2008, 69, 1281–1293. [Google Scholar] [CrossRef]
- Wenmaekers, R.; Hak, C.; Hornikx, M.; Kohlrausch, A. Sensitivity of stage acoustic parameters to source and receiver directivity: Measurements on three stages and in two orchestra pits. Appl. Acoust. 2017, 123, 20–28. [Google Scholar] [CrossRef]
- Vorländer, M.; Guski, M. Suggestions for Revision of ISO 3382. In Proceedings of the DAGA 2016, 42nd Annual Conference on Acoustics, Aachen, Germany, 14–17 March 2016. [Google Scholar]
- Dietrich, P.; Guski, M.; Pollow, M.; Masiero, B.; Müller-Trapet, M.; Scharrer, R.; Vorländer, M. ITA-toolbox-An open source MATLAB toolbox for acousticians. Fortschr. Akust. DAGA 2012, 12, 151–152. [Google Scholar]
- Kardous, C.A.; Shaw, P.B. Evaluation of smartphone sound measurement applications. J. Acoust. Soc. Am. 2014, 135, EL186–EL192. [Google Scholar] [CrossRef] [PubMed] [Green Version]
- Kardous, C.A.; Shaw, P.B. Evaluation of smartphone sound measurement applications (apps) using external microphones—A follow-up study. J. Acoust. Soc. Am. 2016, 140, EL327–EL333. [Google Scholar] [CrossRef] [Green Version]
Figure 1.
Different hand configurations that were used during the measurements (P: parallel hand configurations, A: aligned hand configurations, O: opposite hand configurations).
Figure 1.
Different hand configurations that were used during the measurements (P: parallel hand configurations, A: aligned hand configurations, O: opposite hand configurations).

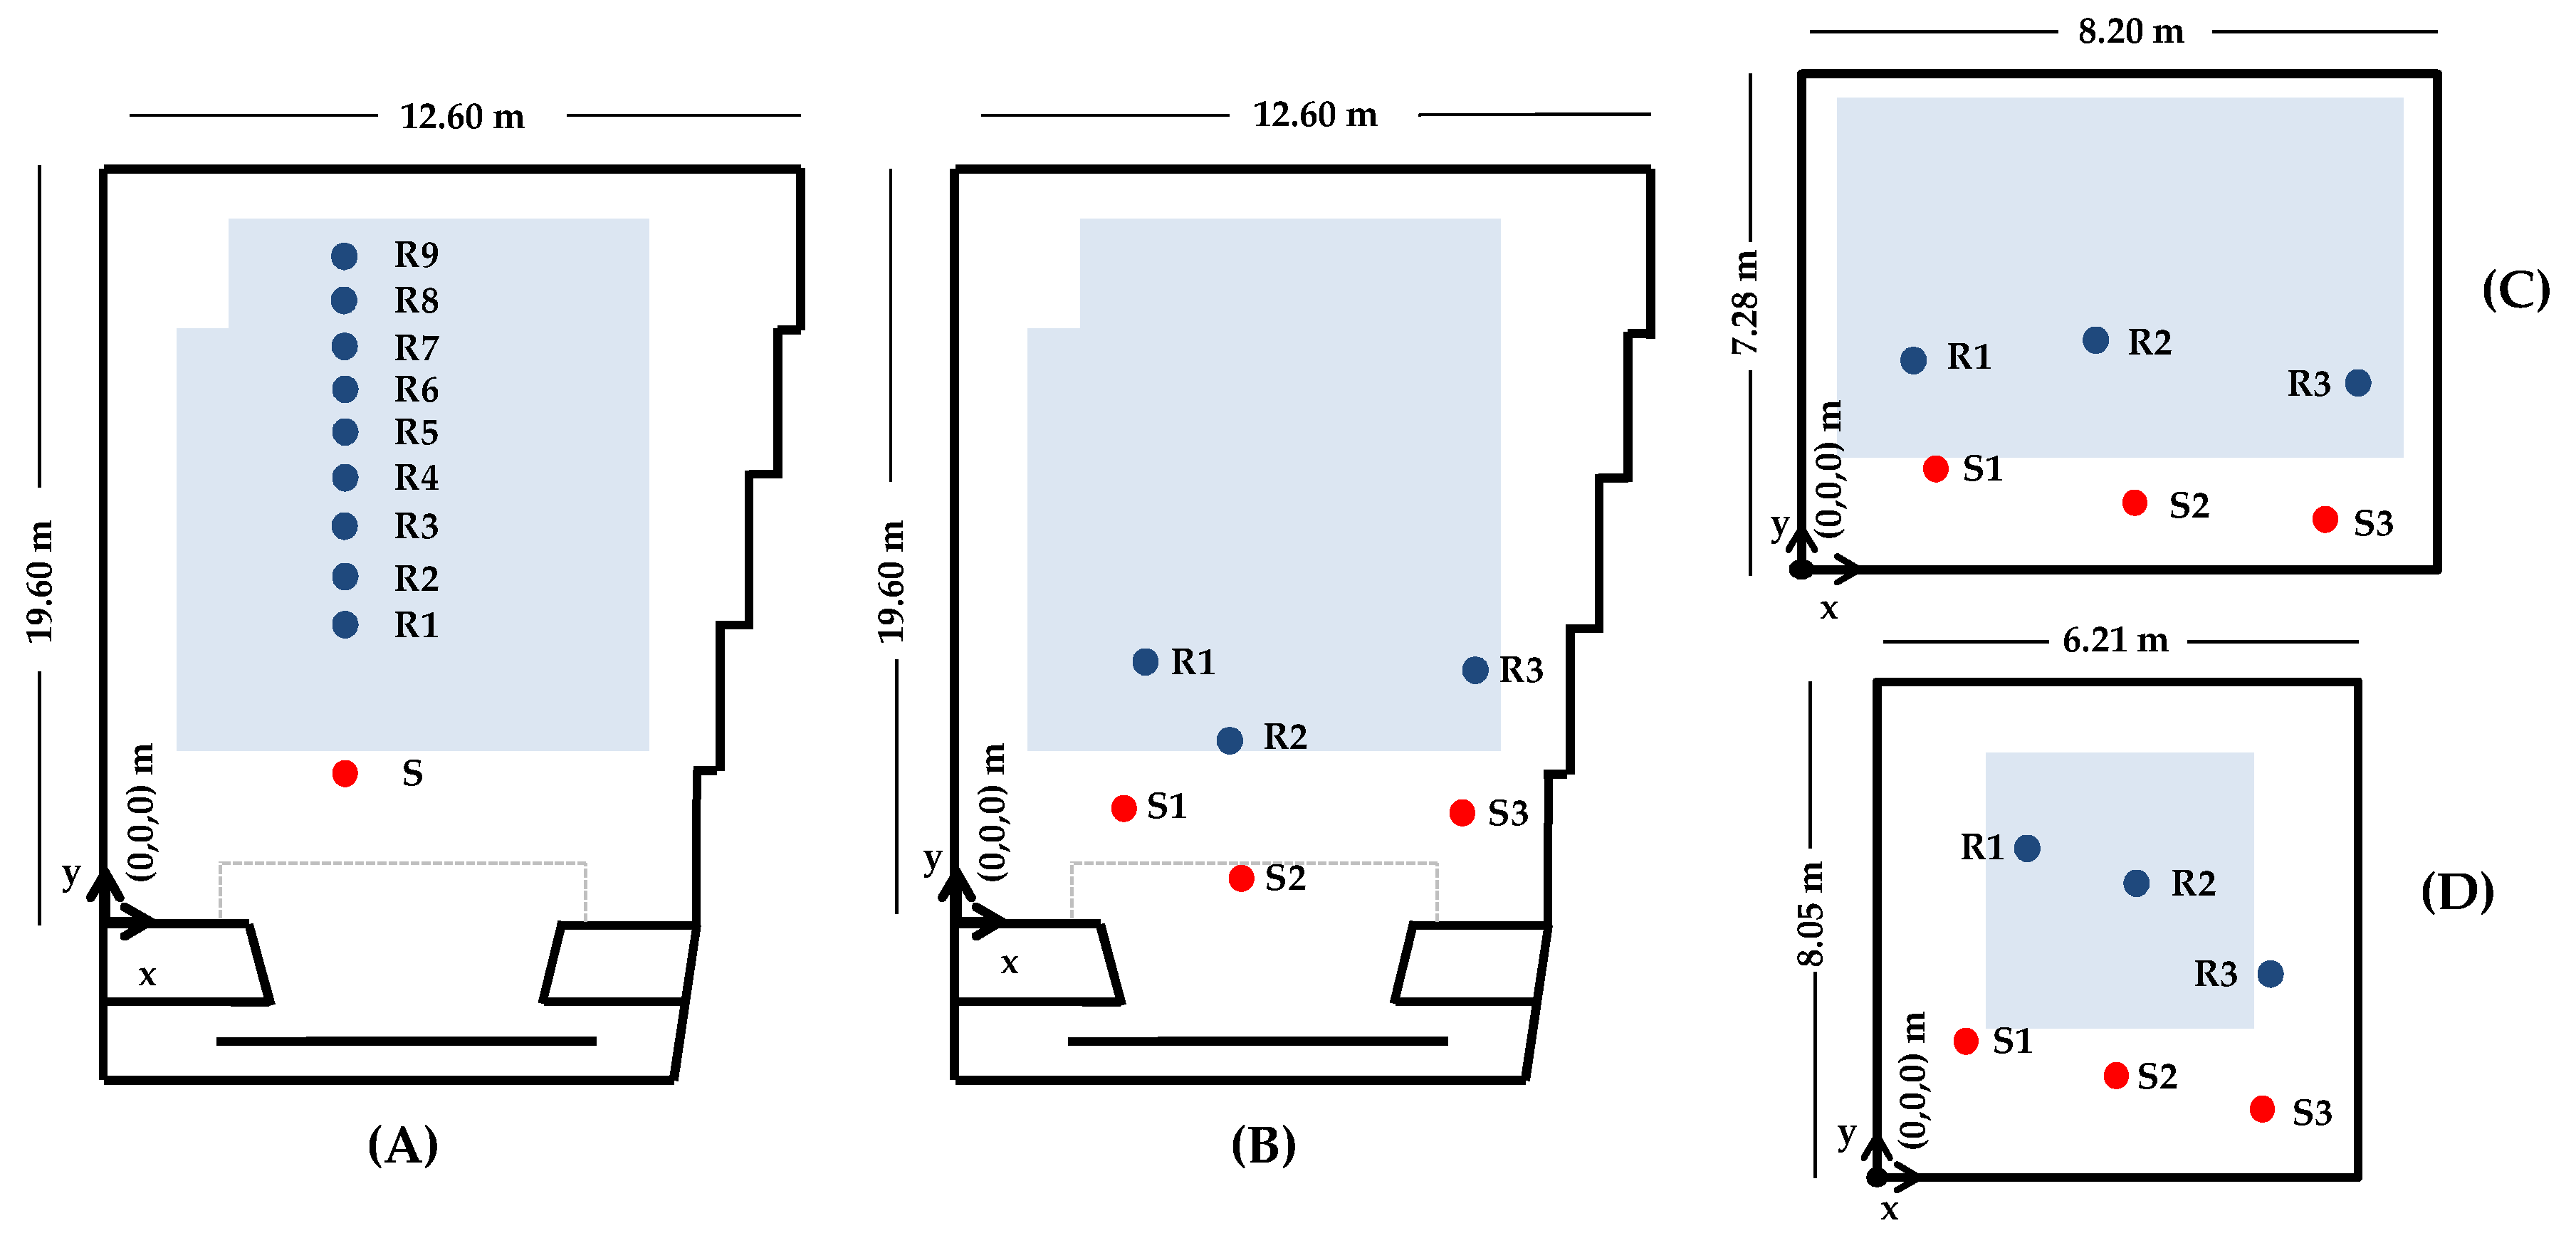
Figure 2.
(A) presents source (S: red circles) and receiver (R: blue circles) positions for measurements at different source–receiver distances. (B–D) present source and receiver positions for measurements in the large, medium and small space respectively (exact source and receiver positions are provided in Table A1 and Table A2 in Appendix A).

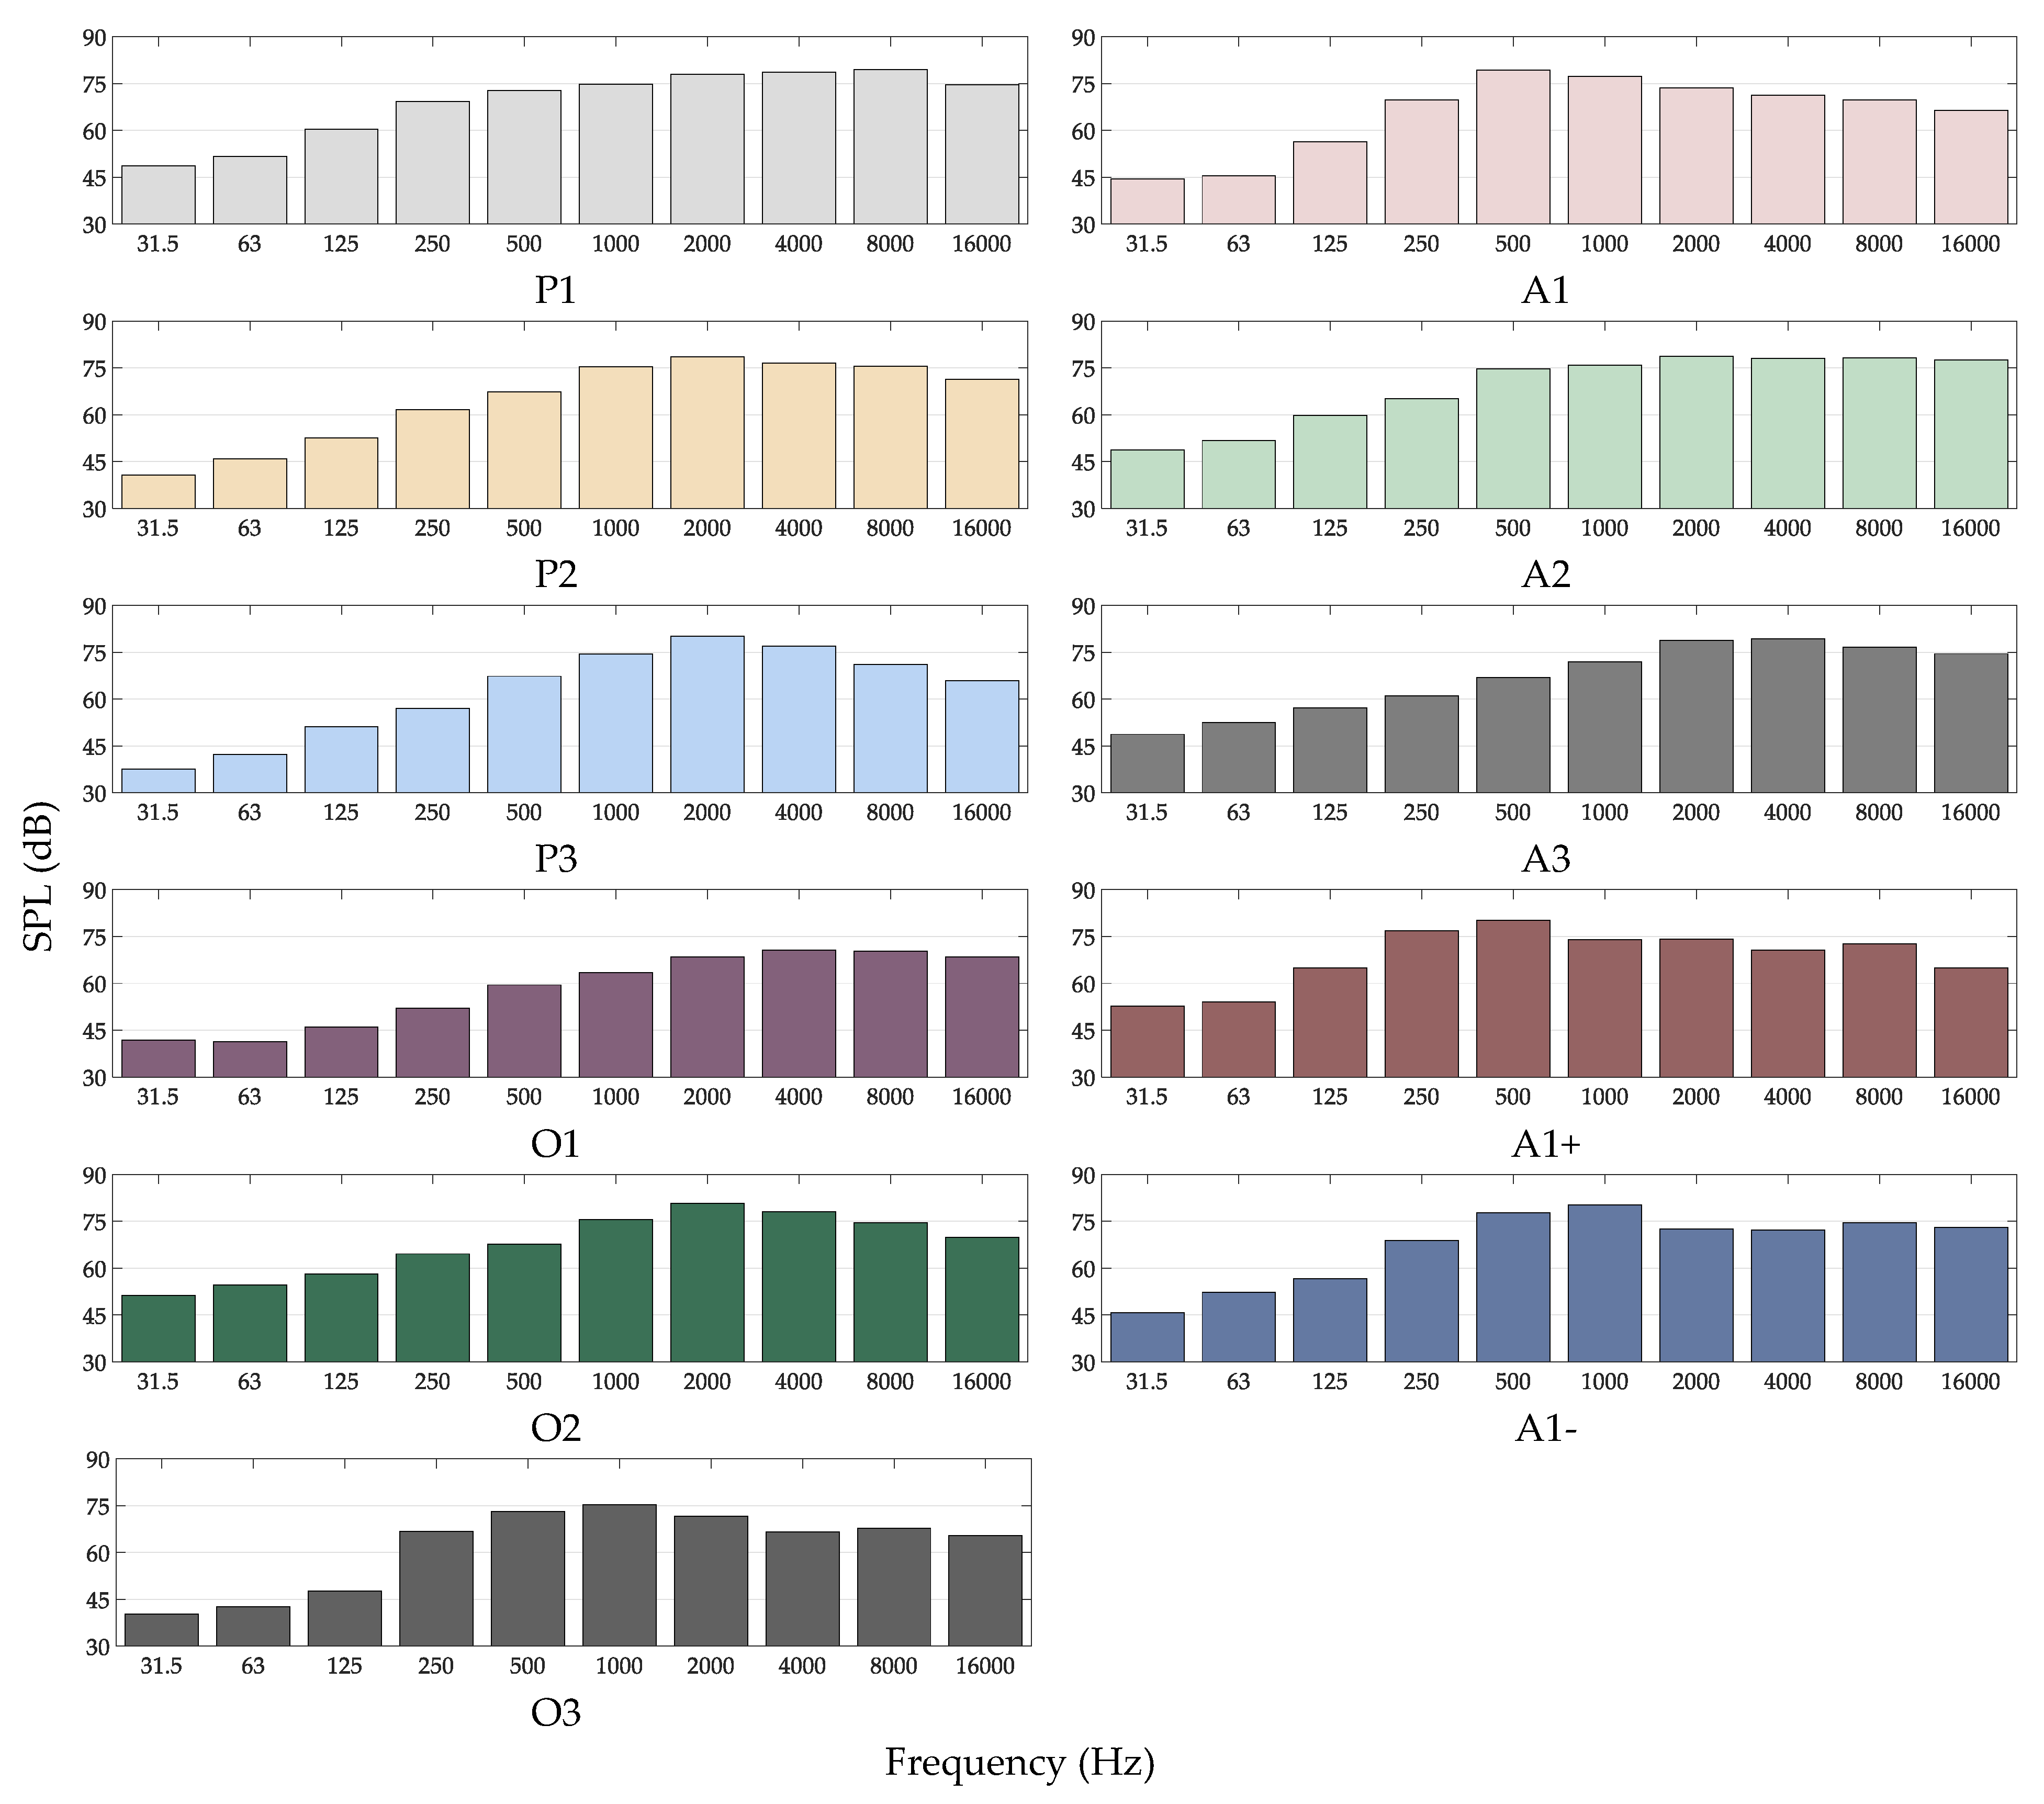
Figure 3.
Octave frequency bands for the eleven hand configurations. Subfigures present the octave frequency band for each hand configuration denoted by the abbreviation for each configuration.
Figure 3.
Octave frequency bands for the eleven hand configurations. Subfigures present the octave frequency band for each hand configuration denoted by the abbreviation for each configuration.

Figure 4.
Comparison of the octave frequency bands for the eleven hand configurations.

Figure 5.
T20 measurements at different source–receiver (S–R) distances. Error bars represent measured standard deviation.
Figure 5.
T20 measurements at different source–receiver (S–R) distances. Error bars represent measured standard deviation.

Figure 6.
Early decay time measurements at different source–receiver (S-R) distances. Error bars represent measured standard deviation.
Figure 6.
Early decay time measurements at different source–receiver (S-R) distances. Error bars represent measured standard deviation.


Figure 7.
C80 measurements at different source–receiver (S–R) distances. Error bars represent measured standard deviation.
Figure 7.
C80 measurements at different source–receiver (S–R) distances. Error bars represent measured standard deviation.

Figure 8.
SPL for A1+ hand configuration and background noise for the three spaces.

Figure 9.
T20 measurements at three positions for three different spaces (i.e., large, medium, small). Error bars represent measured standard deviation.
Figure 9.
T20 measurements at three positions for three different spaces (i.e., large, medium, small). Error bars represent measured standard deviation.

Figure 10.
EDT measurements at three positions for three different spaces (i.e., large, medium, small). Error bars represent measured standard deviation.
Figure 10.
EDT measurements at three positions for three different spaces (i.e., large, medium, small). Error bars represent measured standard deviation.


Figure 11.
C80 measurements at three positions for three different spaces (i.e., large, medium, small). Error bars represent measured standard deviation.
Figure 11.
C80 measurements at three positions for three different spaces (i.e., large, medium, small). Error bars represent measured standard deviation.

Figure 12.
Mean absolute error among octave bands of T20 among measurements with a dodecahedron speaker and a handclap as a sound source for different source–receiver distances.
Figure 12.
Mean absolute error among octave bands of T20 among measurements with a dodecahedron speaker and a handclap as a sound source for different source–receiver distances.

Figure 13.
T20 parameter value errors measured with a handclap (compared to measurements with a dodecahedron) in steps of Just Noticeable Difference (JND) as a function of the signal-to-noise ratio for different octave bands. The dashed line represents a threshold below which all JND values were measured.

Figure 14.
EDT parameter value errors measured with a handclap (compared to measurements with a dodecahedron) in steps of JND as a function of the signal-to-noise ratio for different octave bands. The dashed line represents a threshold below which all JND values were measured.
Figure 14.
EDT parameter value errors measured with a handclap (compared to measurements with a dodecahedron) in steps of JND as a function of the signal-to-noise ratio for different octave bands. The dashed line represents a threshold below which all JND values were measured.

Figure 15.
C80 parameter value errors measured with a handclap (compared to measurements with a dodecahedron) in steps of JND as a function of the signal-to-noise ratio for different octave bands. The dashed line represents a threshold below which all JND values were measured.
Figure 15.
C80 parameter value errors measured with a handclap (compared to measurements with a dodecahedron) in steps of JND as a function of the signal-to-noise ratio for different octave bands. The dashed line represents a threshold below which all JND values were measured.

Table 1.
Mean Sound Pressure Level (SPL), standard deviation, and maximum SPL for the measured hand configurations.
Table 1.
Mean Sound Pressure Level (SPL), standard deviation, and maximum SPL for the measured hand configurations.
| Hand Configuration | P1 | P2 | P3 | A1 | A2 | A3 | A1+ | A1− | O1 | O2 | O3 |
|---|---|---|---|---|---|---|---|---|---|---|---|
| SPL (dB) | 84.2 | 83.2 | 83.0 | 83.0 | 85.2 | 84.1 | 83.8 | 84.1 | 76.0 | 84.3 | 79.5 |
| Standard Deviation (dB) | 5.61 | 7.48 | 6.43 | 5.90 | 6.28 | 7.05 | 4.47 | 5.55 | 5.69 | 7.39 | 4.49 |
| Maximum SPL (dB) | 95.4 | 97.0 | 95.8 | 97.0 | 96.3 | 95.5 | 89.8 | 91.8 | 86.8 | 95.3 | 86.1 |
| Natural Configuration (%) | 4.54 | 18.2 | 0.00 | 9.00 | 63.6 | 0.00 | 4.54 | 0.00 | 0.00 | 0.00 | 0.00 |
© 2020 by the authors. Licensee MDPI, Basel, Switzerland. This article is an open access article distributed under the terms and conditions of the Creative Commons Attribution (CC BY) license (http://creativecommons.org/licenses/by/4.0/).
Share and Cite
MDPI and ACS Style
Papadakis, N.M.; Stavroulakis, G.E. Handclap for Acoustic Measurements: Optimal Application and Limitations. Acoustics 2020, 2, 224-245. https://0-doi-org.brum.beds.ac.uk/10.3390/acoustics2020015
AMA Style
Papadakis NM, Stavroulakis GE. Handclap for Acoustic Measurements: Optimal Application and Limitations. Acoustics. 2020; 2(2):224-245. https://0-doi-org.brum.beds.ac.uk/10.3390/acoustics2020015
Chicago/Turabian StylePapadakis, Nikolaos M., and Georgios E. Stavroulakis. 2020. "Handclap for Acoustic Measurements: Optimal Application and Limitations" Acoustics 2, no. 2: 224-245. https://0-doi-org.brum.beds.ac.uk/10.3390/acoustics2020015