1. Introduction
Acoustic recording of bats is a widely used monitoring tool for assessing occupancy and relative activity of bat communities. Acoustic surveys have become increasingly important with the advent of white-nose syndrome (WNS) and the expansion of wind energy in North America that are significant mortality factors, because the capture of rare bats has become time-intensive and cost-prohibitive [
1]. Ultrasonic acoustic lures also are an emerging technology that shows promise to attract bats during mist-net surveys in part to overcome decreases in catch-per-unit effort from WNS [
2,
3,
4,
5]. The degree of microhabitat complexity, or “clutter”, which typically consists of the boles of trees and attached foliage in the recording or broadcasting environment, presents a challenge for both technologies and represents the most important ecological constraint for foraging bats [
6,
7,
8]. Clutter can absorb or reflect ultrasonic signals, alter recorded parameters, create echoes, or block all or a portion of the signal [
9,
10,
11,
12,
13]. These factors could result in poor acoustic survey results with an unacceptable level of false positives or false negatives that may bias survey findings and misrepresent bat abundance and their habitat associations [
14]. Similarly, clutter also could distort or block acoustic signals being broadcast from a lure device, rendering it ineffective as an aid to facilitate bat capture [
15]. The ability to account for clutter in occupancy and relative activity modeling and acoustic lure deployment studies is particularly critical in the post-WNS landscape where populations of impacted bat species are at unprecedented lows to the level that traditional mist-net capture techniques perform poorly [
7].
Bat detectors generally are placed in open, uncluttered areas such as fields, forest canopy gap openings, stream corridors, and unimproved roads to record search phase echolocation pulses that exhibit the most interspecific variation and the least amount of intraspecific variation [
11,
16,
17,
18]. This maximizes echolocation classification accuracy with automatic identification programs because many program classifiers are built using voucher calls recorded from hand releases, flight cage recordings, and zip line restraint of bats in open, uncluttered areas [
1,
19]. Typically, commercially available automatic identification programs have not intentionally incorporated clutter-recorded calls into their classifiers [
1,
16]. Although extensive research into clutter’s impacts on acoustic recording and identification of bats is lacking, preliminary results have indicated positive results from including clutter calls in reference libraries [
11]. Broders et al. [
11] built call libraries from northern long-eared bat (
Myotis septentrionalis) and little brown bat (
Myotis lucifugus) hand-releases recorded in one of three clutter categories and then used these to identify test calls using a neural network approach. They found that there was a high degree of interspecific and intraspecific variation in call parameters between the three clutter conditions, and that using a clutter-derived call library to train the neural network improved species classification accuracy when provided calls also recorded in cluttered conditions. Similarly, Findlay and Barclay [
8] found that using calls recorded in more cluttered conditions improved identification accuracy for
Myotis species as many are adapted to foraging in high-clutter forest habitats [
20]. Avoiding forest habitats may significantly bias acoustic surveys by underrepresenting clutter-adapted bat species, such as the federally threatened northern long-eared bat and the federally endangered Indiana bat (
Myotis sodalis), thereby misrepresenting habitat associations [
21,
22].
Currently, there is no standard for quantifying and reporting clutter relative to bat acoustic surveys in forested environments [
6]. A common theme among acoustic studies is the difficulty of controlling experimental conditions and repeatability. Broders et al. [
11] suggested a need for additional testing in flight cages for more precise manipulation of experimental conditions and to record over a continuous range of clutter conditions. Acoustic studies aimed at investigating detector placement in relation to clutter, omnidirectional versus directional microphones, bat sonar beam characteristics, and detector waterproofing have largely been conducted in field rather than controlled laboratory conditions with live bats [
15,
23,
24,
25,
26,
27,
28]. In field studies, clutter has been assessed by a variety of habitat metrics including forest canopy closure and height [
20,
29], distance to vegetation from the detector [
11], live tree basal area [
30], and clutter volume indices and qualitative clutter categories assigned by an observer [
6]. Emerging technology such as three-dimensional light detection and ranging (LiDAR) maps of forest structure also shows promise for studying clutter effects on forest-dwelling bats, but these are data-intensive and not readily available for all settings [
31]. Regardless, O’Keefe et al. [
6] found that single measures were most useful for quantifying fine-scale forest clutter: basal area, stem density, and mean crown volume, suggesting these commonly assessed forestry measurements provide a repeatable way to quantify the surrounding stand conditions that can be understood by researchers, biologists, foresters, and other natural resource personnel. For these reasons and because many bat acoustic surveys that are tied to management actions typically take place in forested environments, we used basal area and stem density in this study.
Analysis of echolocation recordings in controlled settings using playback of synthesized calls to empirically test clutter as encountered in field studies has also been limited. Broders et al. [
11] noted the difficulty of recording bats flying only in a particular clutter category (i.e., medium versus high) while conducting experiments with hand-released bats. Darras et al. [
26] used an ultrasonic chirper (a device that emits bursts of ultrasonic sound) at various distances and heights within 50 m × 50 m forest plots to investigate variability in detection space and observed that measures of basal area and stem density of trees with a diameter at breast height (DBH) greater than 10 cm were poor predictors of detection space. Large variation in sound transmission occurred between plots due to site-specific differences in plant composition, leaf morphology, and topography. While microclimate differences on acoustics throughout the day are thought to be small, it is possible that different atmospheric conditions between the plots could have further compounded the plot variability [
32]. Adams et al. [
24] investigated the implications of bat detector selection for recording bats by broadcasting synthesized ultrasound signals at different frequencies and recording the signals on bat detectors placed at varying distances and angles in relation to the broadcast source in an open field. Detection was most influenced by frequency of the broadcast signal and the distance; however, recording angle was also an important factor. To improve the repeatability and eliminate possible environmental interference, Sprong et al. [
25] used an interior hallway and open park with an ultrasonic chirper to assess the effect of waterproofing on three bat detectors by measuring mean pulse quality (amplitude in decibels) at different distances and angles. They did not find any difference between tests conducted in the hallway versus in the park; however, they did not test for atmospheric differences and substantial environmental noise among trials. Moreover, the hallway may have created significant reverberation from the walls that cannot be controlled for unless the walls were lined with acoustic foam as in an anechoic chamber. They did note that distance from the sound source was an important factor impacting pulse quality due to rapid attenuation of ultrasound in air, and angle was important due to differences in the directionality of the microphones [
25]. The quality of a received bat call could be sufficiently altered depending on the distance and angle to be misidentified or not identified at all. Research using soundproof anechoic chambers with live bats has occurred, allowing mostly controlled data collection on the echolocation beam characteristics of big brown bats (
Eptesicus fuscus) [
33] and the reactions of bats to broadcast-echo ambiguity in cluttered flight conditions [
34]. An anechoic chamber is a room lined with acoustic foam designed to eliminate external noise and internal reverberation. The movement of live bats relative to receivers in both studies and in relation to simulated clutter in the case of Hiryu et al. [
34] are difficult to measure and impossible to repeat. Therefore, the effects of clutter would be difficult to measure from their study designs. The direct effects of differing clutter levels remain to be tested in a controlled and fully repeatable manner.
Because so much bat acoustical monitoring occurs in forested settings with varying degrees of clutter and problems with field studies on clutter have been compounded by repeatability and environmental bias, work under carefully controlled conditions, such as an anechoic chamber with a controllable artificial sound source, is needed to better quantify the effects of clutter on echolocation call recording to inform these efforts. To address this, we conducted a study of how receiver angle, varying levels of artificial basal areas and stem density (metrics readily measured in field settings; O’Keefe et al. [
6]), and their interaction affect a synthesized high-frequency echolocation call of the eastern red bat (
Lasiurus borealis), a common forest-foraging bat in North America, in an anechoic chamber. Our primary goal was to develop a standardized and repeatable methodology for assessing clutter and to provide guidance for accounting for clutter effects in field studies to improve acoustic survey results. We predicted that, as basal area and stem density increased, signal quality generally would be reduced and recorded data would deviate from our synthesized call. Secondly, we predicted that signal quality would also vary depending upon the recording angle.
2. Materials and Methods
We conducted our clutter effects on synthesized bat echolocation signal reception experiments in a full anechoic chamber located in the Durham Hall Vibrations and Acoustics Laboratory within the Department of Mechanical Engineering at Virginia Polytechnic Institute and State University, Blacksburg, VA over several days in September 2016. The chamber is a 4 m wide, 5 m long and 3 m high room paneled with acoustic foam on the walls, floor, and ceiling that absorbs sound and prevents reverberation. The chamber has a double-door system to acoustically isolate it from the outside. As such, this allowed our playback experiment to occur without any extraneous environmental sound or echoes from surfaces not associated with clutter.
To model varying levels of environmental clutter in terms of number of stems and the volume (basal area) and various combinations thereof that simulated the boles of trees, we arranged various sizes of wooden dowels (1.3 and 2.5 cm diameter) and rectangular wooden fence posts with rounded off corners (approximately 7.0 cm × 10.2 cm cross-section) each 122 cm in height mounted on a 107 cm × 121.9 cm pallet wood base between our acoustic emitter and our acoustic receivers (
Table 1). We drilled 1.3 cm holes in the first, fourth, and seventh slats to place dowels on the pallet. On the second, fifth, and eighth slats, we drilled 2.5 cm holes and attached fence posts to simulate larger tree boles using hanger bolts. The largest simulated “tree” was made from attaching multiple posts together in a rounded shape. We placed the pallet with various combinations of dowels and fence posts in the center of the chamber with a 177.8 cm radius semi-circular array of Wildlife Acoustics SM2BAT+ units with SMX-U1 microphones (Wildlife Acoustics, Maynard, MA, USA; any use of trade, firm, or product names is for descriptive purposes only and does not imply endorsement by the US Government) set to record in full-spectrum mode facing inward toward the center of the pallet (
Figure 1). Using this arrangement, we had a total of 17 different experimental conditions including a control with a basal area = 0 and no stem density. We calculated basal areas as a measure of the cross-sectional area (cm
2) of all the dowels and/or fence posts included in each of the 17 arrangements and converted to m
2/ha to better relate to ecological and forestry field reporting.
To generate bat echolocation calls, we used a custom sonar sensor “SonicBeagle” that we designed and built and which is capable of emitting frequency-modulated ultrasonic signals using an electrostatic transducer and built-in processor [
35]. We placed each detector and the SonicBeagle on 50.8 cm tall stands facing inward toward the middle of the pallet. Both the stands and pallet below the attachment of the dowels and the fence post were covered with acoustic foam to limit echoes and sound distortion to the dowel-and-post array. We placed the emitting sensor at the first acoustic recorder station (0°), with the remaining detectors being set at 45°, 90°, 135°, and 180° relative to the first recorder station (
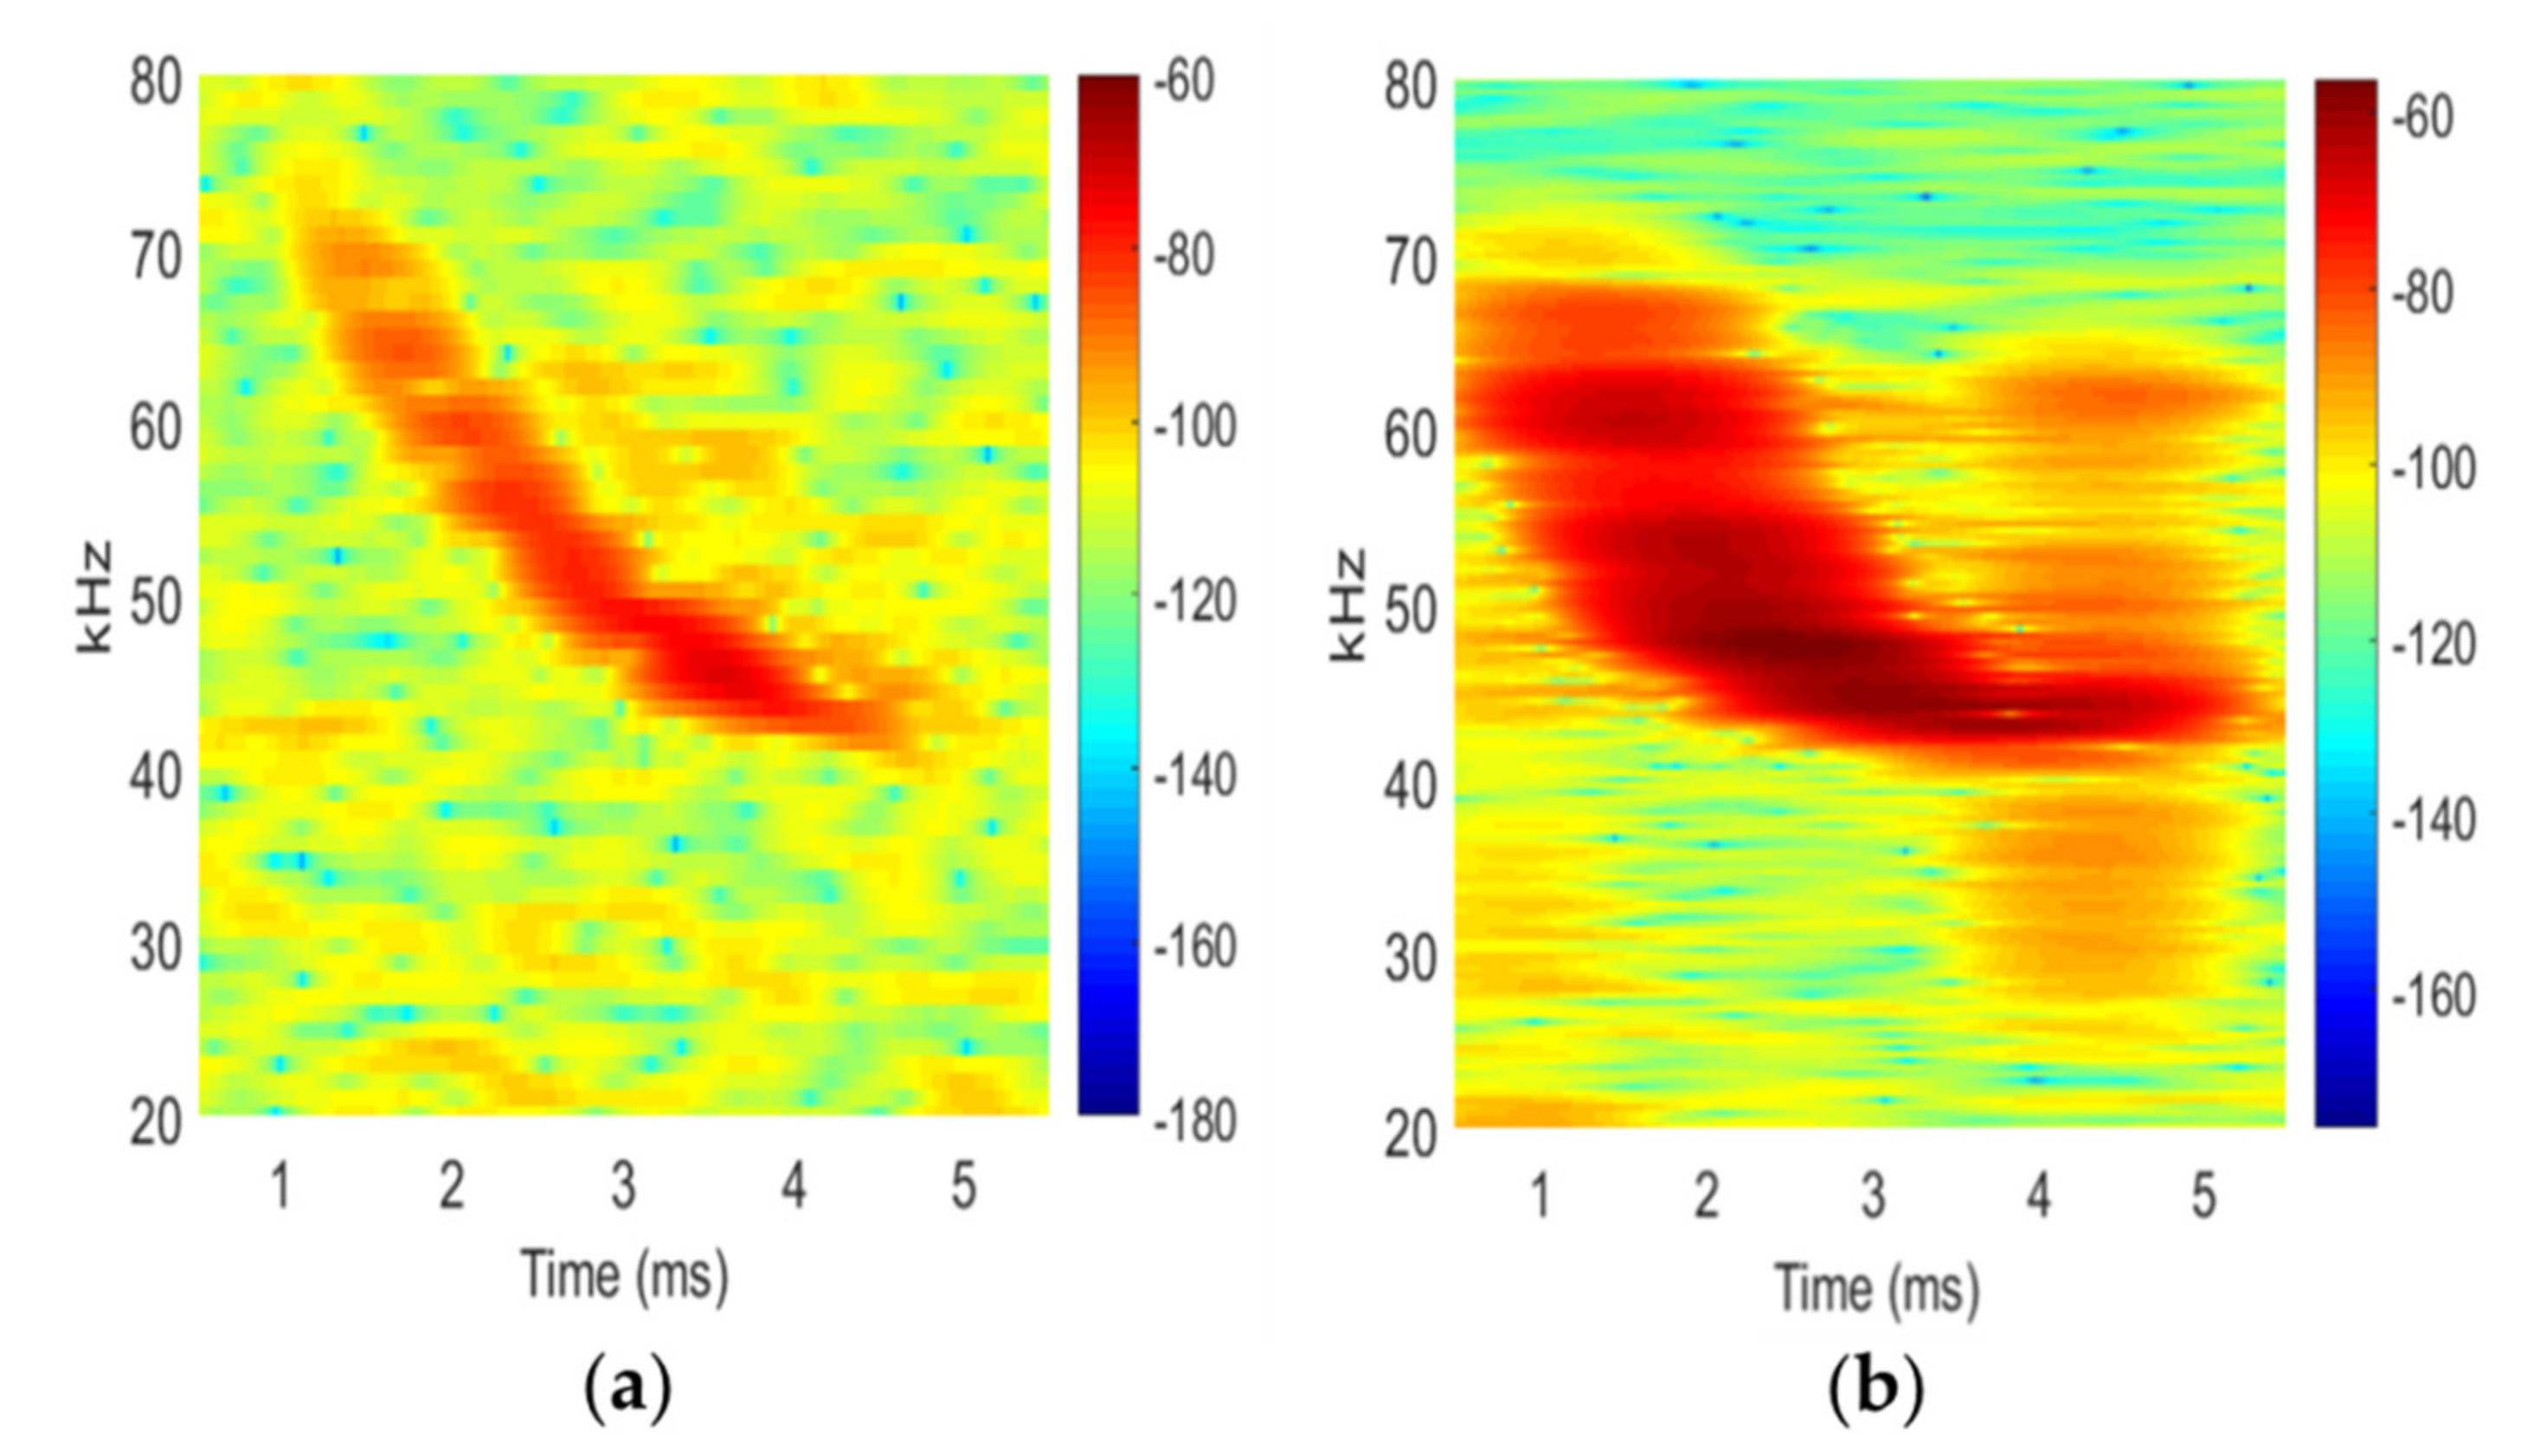
Figure 1). We programmed our emitter to generate a synthetic pulse with the same time–frequency relationship of a recorded red bat call (
Figure 2). To develop the synthetic pulse, we performed a time–frequency analysis on a high-quality known-identity full-spectrum eastern red bat call and extracted the frequency of the maximum power at each time step. This information was used to calculate the appropriate clock cycle applied to the emitter to mimic the time-frequency characteristics of the original call. We had to perform these steps because the SonicBeagle was not capable of directly playing the wav file format of the recorded call. We also chose to use a synthetic call to help eliminate background noise and enhance the pulse. The synthetic pulse was broadcasted from the SonicBeagle for four repetitions at each experimental clutter condition (
Table 1). We set detectors to record continuously during the experiment including all repetitions and experimental conditions. We used Matlab software (Mathworks Inc., Natick, MA, USA) to automatically detect and extract each experimental condition (a set of four pulses) and each individual pulse. Each pulse was cropped to a time window large enough to contain the primary pulse and resulting echoes from data collected by the recorders. The start point of each window was determined by finding the time when each pulse’s amplitude was above 30% of its maximum amplitude. The spectrogram was calculated by taking a fast Fourier transform with 1024 points in the frequency domain, over a moving Hann window of 1024 points with 1022 points of overlap between the windows [
36].
Figures S1–S5 (see Supplementary Materials) show the spectrograms of the primary and echo signals received by the bat detectors for one repetition of each experimental condition at each angle.
We concatenated five copies of the four pulse repetitions into a single file (20 pulses per file) for each clutter condition at each angle to simulate a call sequence (many pulses) that a wild bat would emit while echolocating. Acoustic identification software accuracy improves with more pulses (>3) in a call sequence; thus, this provided a better simulation of field-collected data used to assign an echolocation call file to species. We then used Kaleidoscope Pro Version 4.2.0 (Wildlife Acoustics, Maynard, MA, USA) to extract a standard suite of bat call parameters from each of those files to compare the synthetic call to the recorded calls. These measurements included maximum frequency (Fmax), minimum frequency (Fmin), and mean frequency (Fmean) of the echolocation pulses [
37]. Kaleidoscope Pro is a widely used US Fish and Wildlife Service Approved acoustic identification program for analyzing bat echolocation call files in North America [
1,
38]. Additionally, we also used this software to assess the presence of echo pulses and the number of calls correctly identified as an eastern red bat for each series of clutter and angle conditions. We used a series of generalized linear models in SAS statistical software (PROC GENMOD, SAS Inc., Cary, NC, USA) to model percentage deviation of recorded bat call parameters from the synthetic call, to assess the number of echo calls produced, and to assess the percentage of calls correctly classified as an eastern red bat for each trial relative to recorder angle, basal area, and stem density. We assessed angle as a class variable with 0°, as the reference condition whereas basal area and stem density were considered continuous variables. Using predicted responses generated from our models, we then created a series of contour graphs (Sigma Plot 10.0, San Jose, CA, USA) to visualize the relationships of angle, basal area, and stem density with recorded pulses from the emitter and we compared angle using post hoc least-square means separation tests. In this application, the contour graphs display the effect and the directionality of interaction, if occurring, for the two treatment variables (basal area and stem density) on the response variable (percent deviation in Fmax, Fmin, Fmean, correct classification, and probability of receiving an echo pulse) to be visualized. Straight contour lines typically indicate little to no interaction, whereas curved contours can indicate an interaction if the significance level has been satisfied. We accepted statistical significance at α = 0.05.
3. Results
The parameters of the simulated SonicBeagle pulse, when entered into Kaleidoscope Pro and identified as an eastern red bat using a zero-crossing analysis (Maximum Likelihood Estimate (MLE) value was ≤0.05), had a duration of 2.24 ms, a maximum frequency (Fmax) of 60.18 kHz, a minimum frequency (Fmin) of 41.67 kHz, and a mean frequency (Fmean) of 48.19 kHz. We note that the synthetic pulse appears slightly different than the original recorded pulse (
Figure 2). This is due to the frequency sweep of the original bat pulse being smoother than the synthetic pulse produced by the SonicBeagle. To extract the frequency contingent of the sound, a Fourier transform was performed over small portions of the original bat pulse, the dominant frequency of that portion was extracted and then replaced with a constant frequency signal with the same dominant frequency. In other words, in steps versus the smooth downward sweep of the original bat call; thus, for the synthetic pulse, each frequency lasts longer than the bat pulse causing the synthetic call to appear stretched in the horizontal direction. However, the average line of both signals (the zero-crossing line) is the same and Kaleidosope Pro successfully identified the broadcast pulse under the control conditions as an eastern red bat. While automated identification software is not perfect, we saw that, in uncluttered conditions, the software correctly identified the pulses as an eastern red bat and any changes were due to our treatment effects. Overall, recording angle was the largest and most significant contributor to the variation in percentage deviation of call parameters, presence of recorded echo pulses, and correct classification of eastern red bat pulses, whereas effects from basal area and stem density largely were equivocal (
Table 2,
Table 3,
Table 4,
Table 5 and
Table 6). Percentage deviation is based on comparing the measured call parameters from each experimental condition to the measured parameters of our control condition (detector set at angle 0° with no clutter).
For Fmax, significant percentage deviation (
p < 0.05) from the synthetic call was less than the reference angle 0° at angle 45°, but greater than the reference angle 0° at angles 90°, 135°, and 180°. Increases in stem density increased the percentage deviation on Fmax (
Table 2) with this trend occurring for all five tested angles (
Figure 3); however, the effect size was small. Basal area was not a significant factor relative to percentage deviation on Fmax (
Table 2). Although the interaction of stem density and basal area for the percentage deviation in Fmax only approached significance (
Table 2), a slight interactive pattern was evident whereby the percentage deviation in Fmax decreased as basal area increased at higher stem densities.
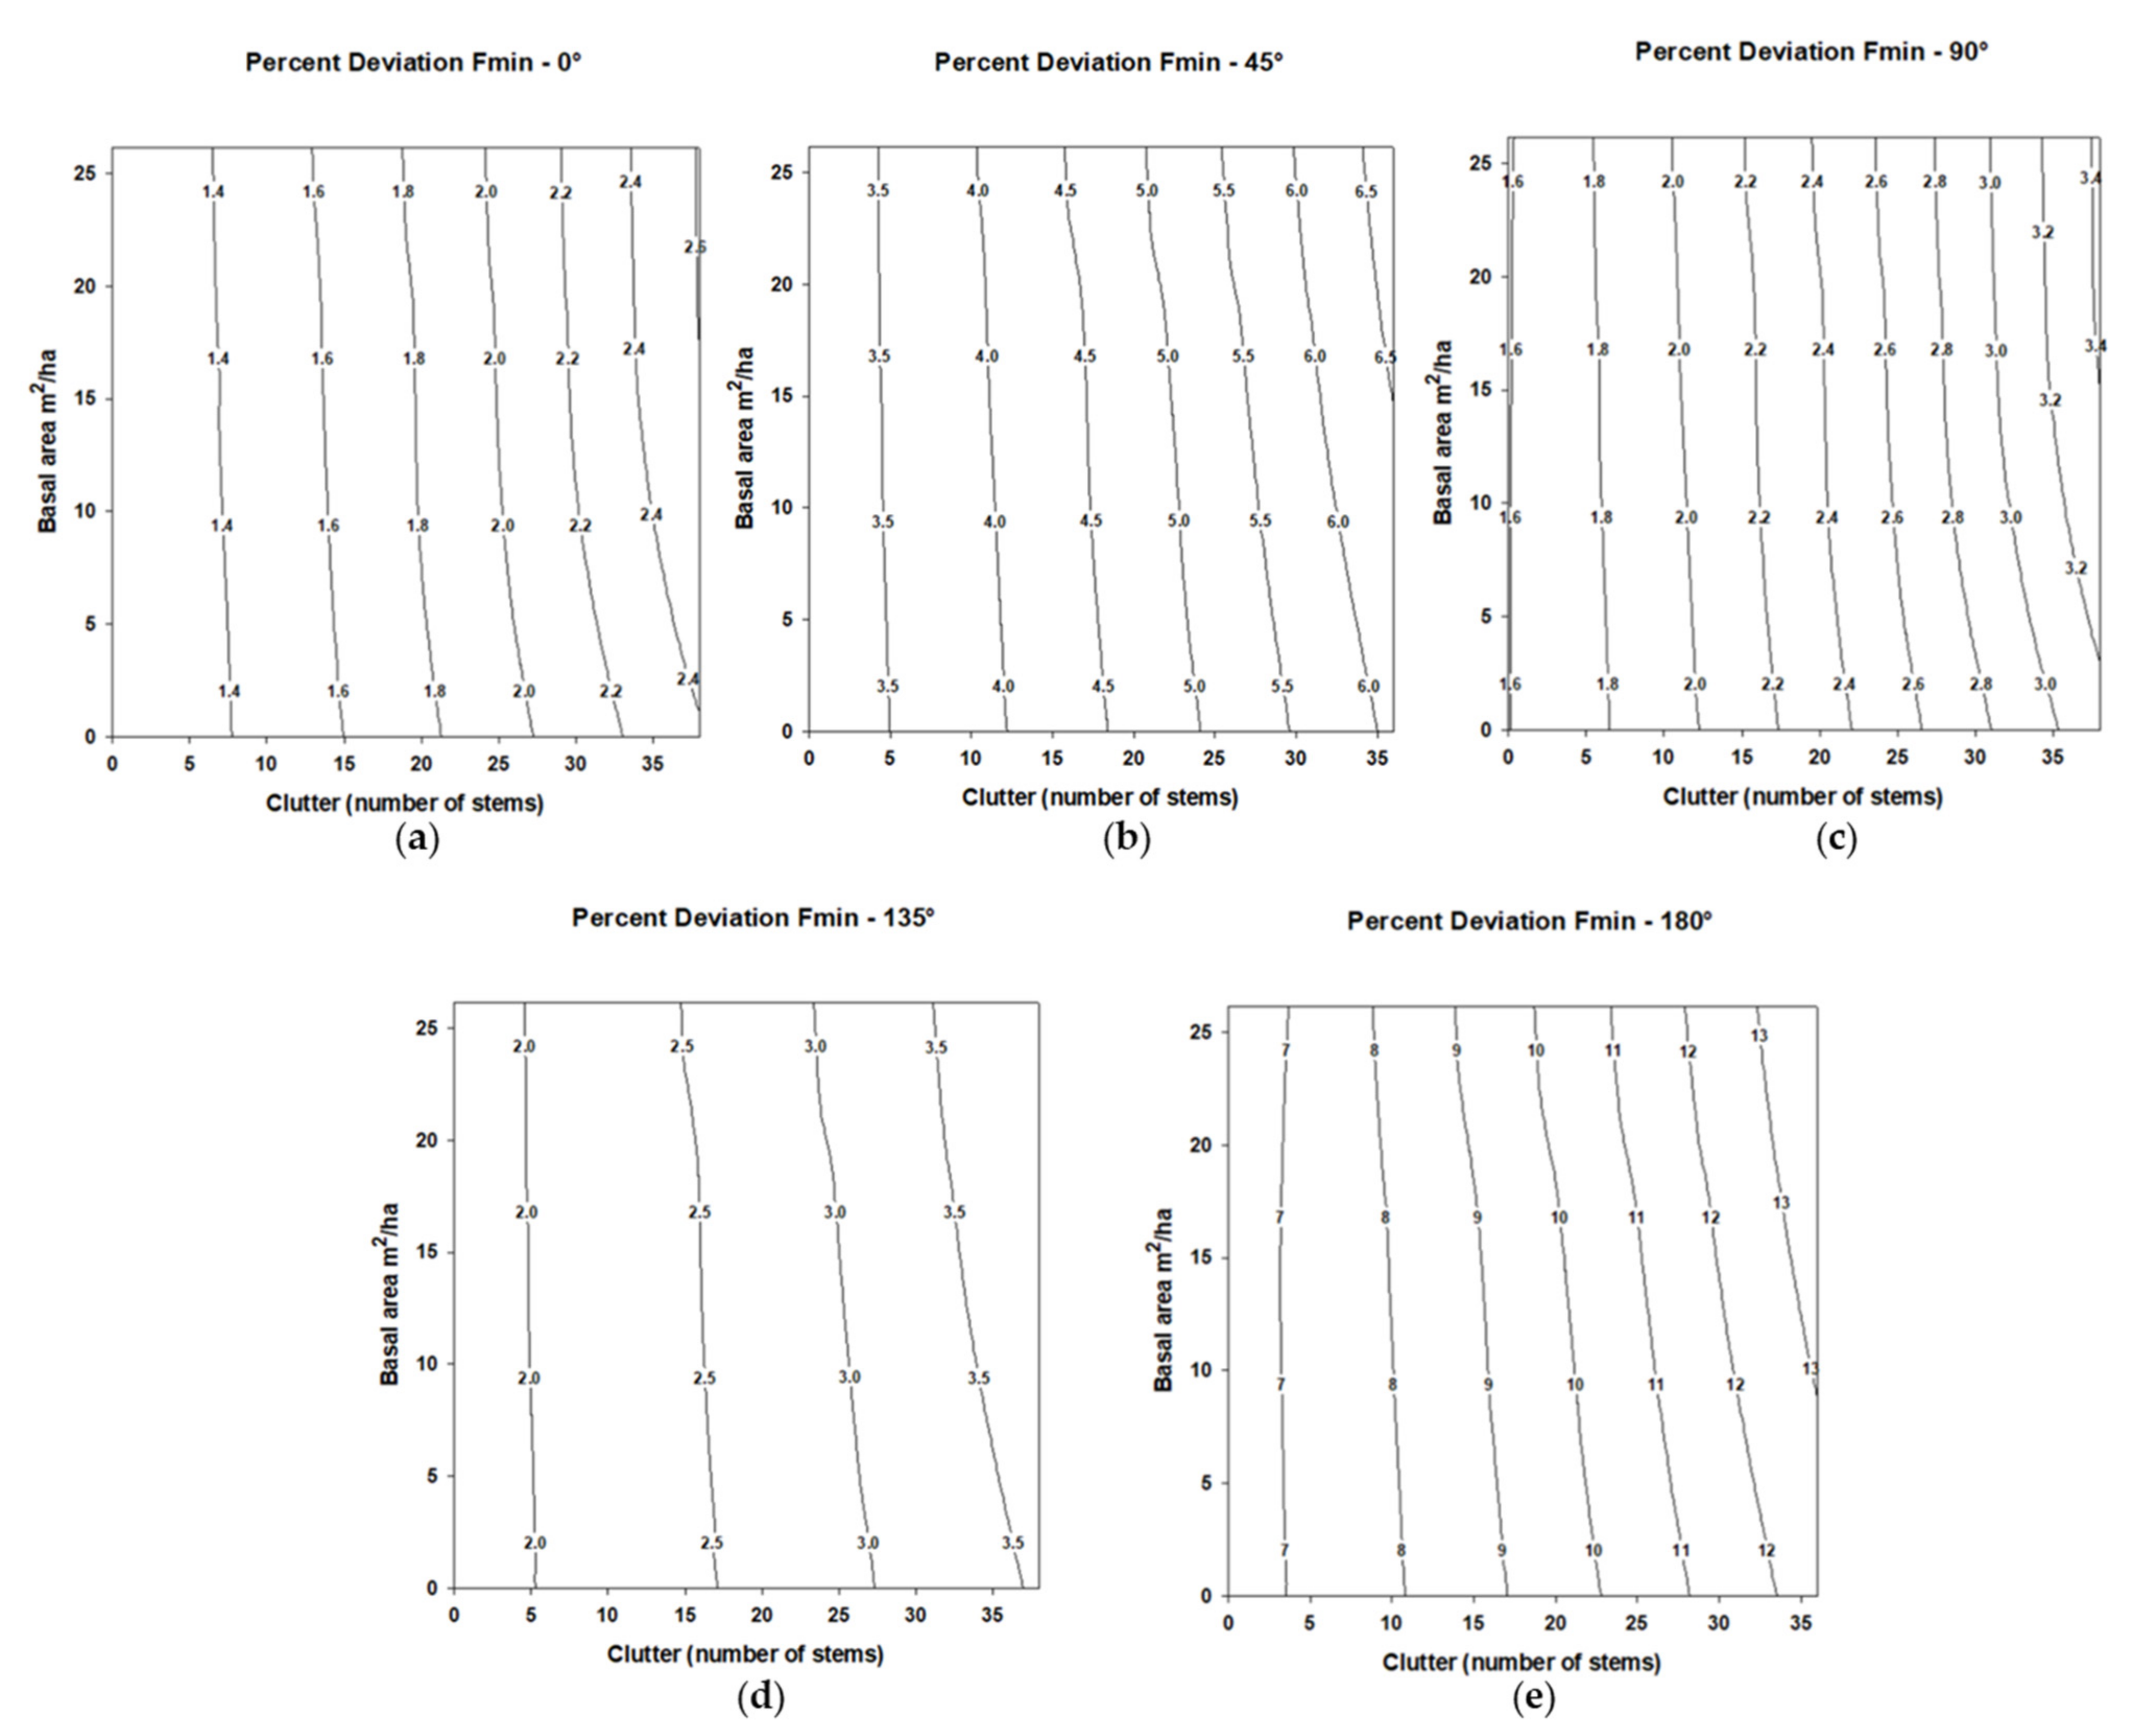
For Fmin, significant percentage deviation (
p < 0.05) from the synthetic call was greater at angles 45° and 180° than the reference angle 0°. Stem density approached significance (
Table 3), and a trend was evident whereby stem density increased the percentage deviation on Fmin for all five tested angles (
Figure 4); however, the effect size was small. Basal area was not a significant factor relative to percentage deviation on Fmin (
Table 3). The percentage deviation in Fmin interaction of stem density and basal area was not significant and no trends were evident.
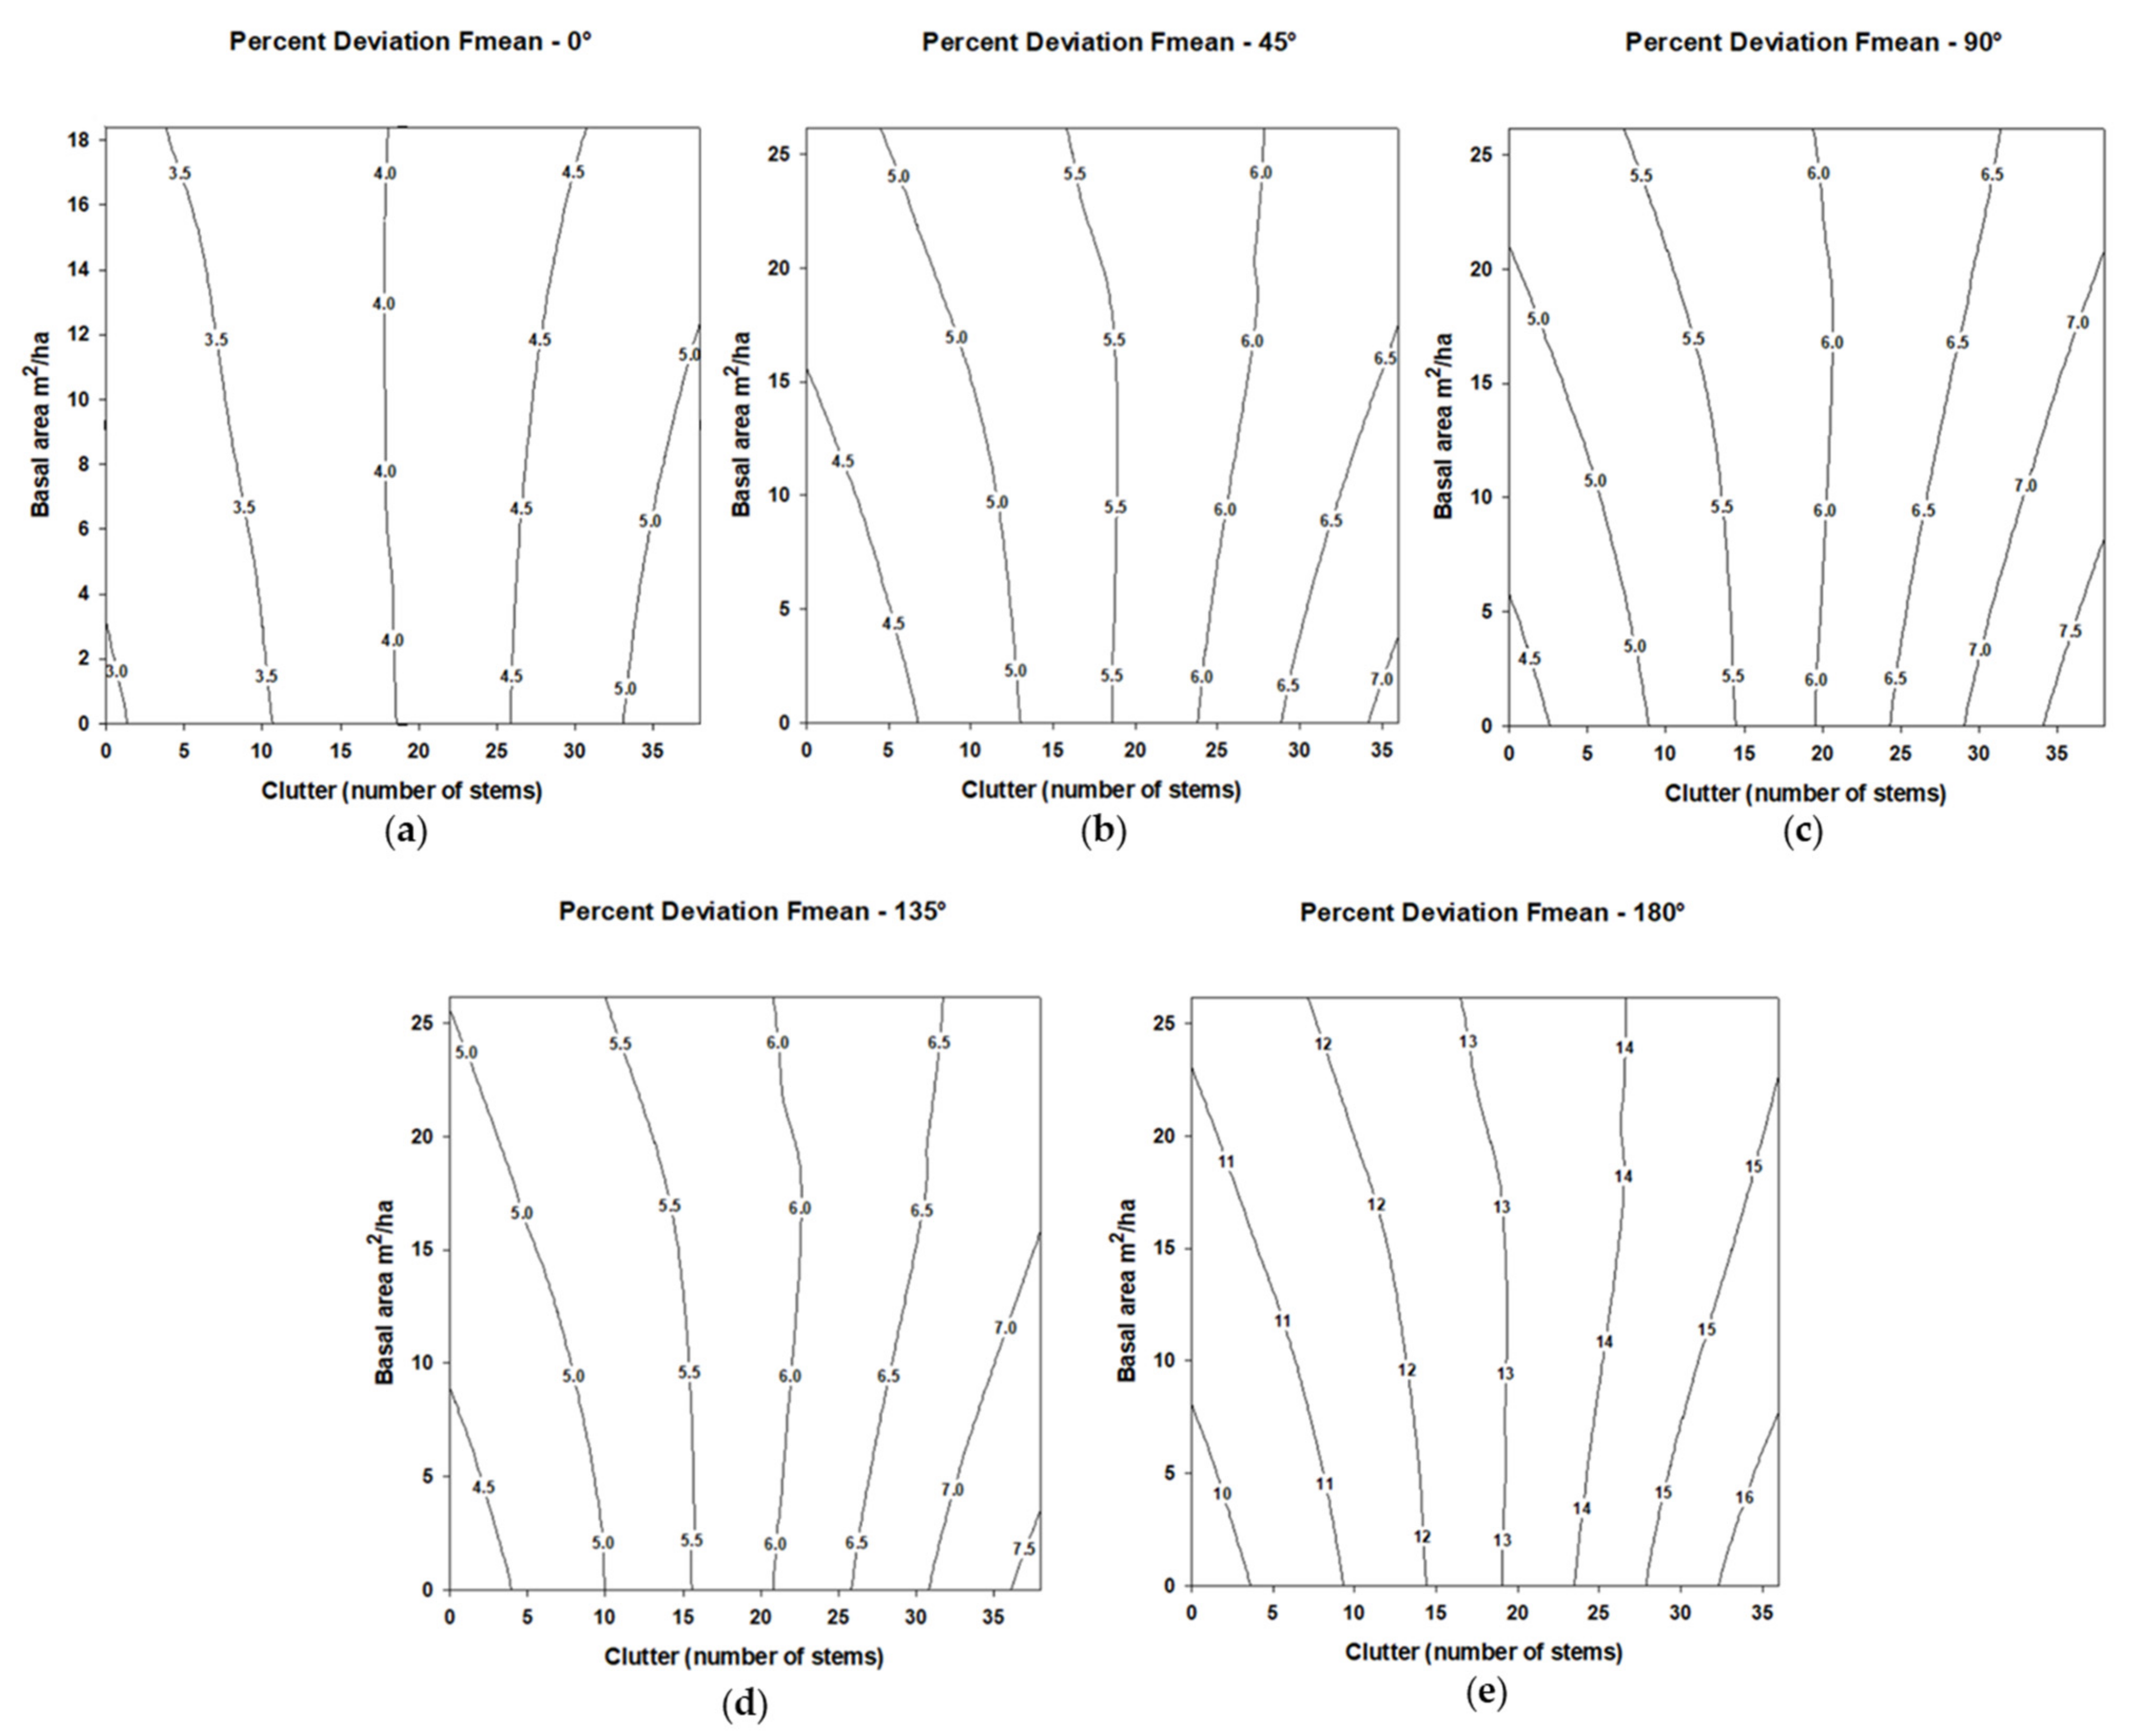
For Fmean, significant percentage deviation (
p < 0.05) from the synthetic call was greater at angles 45°, 90°, 135°, and 180° than the reference angle 0°. Increases in stem density increased the percentage deviation on Fmean (
Table 4) with this trend occurring for all five tested angles (
Figure 5). Basal area was not a significant factor relative to percentage deviation on Fmean (
Table 4). The percentage deviation in Fmean interaction of stem density and basal area was not significant, and no trends were evident.
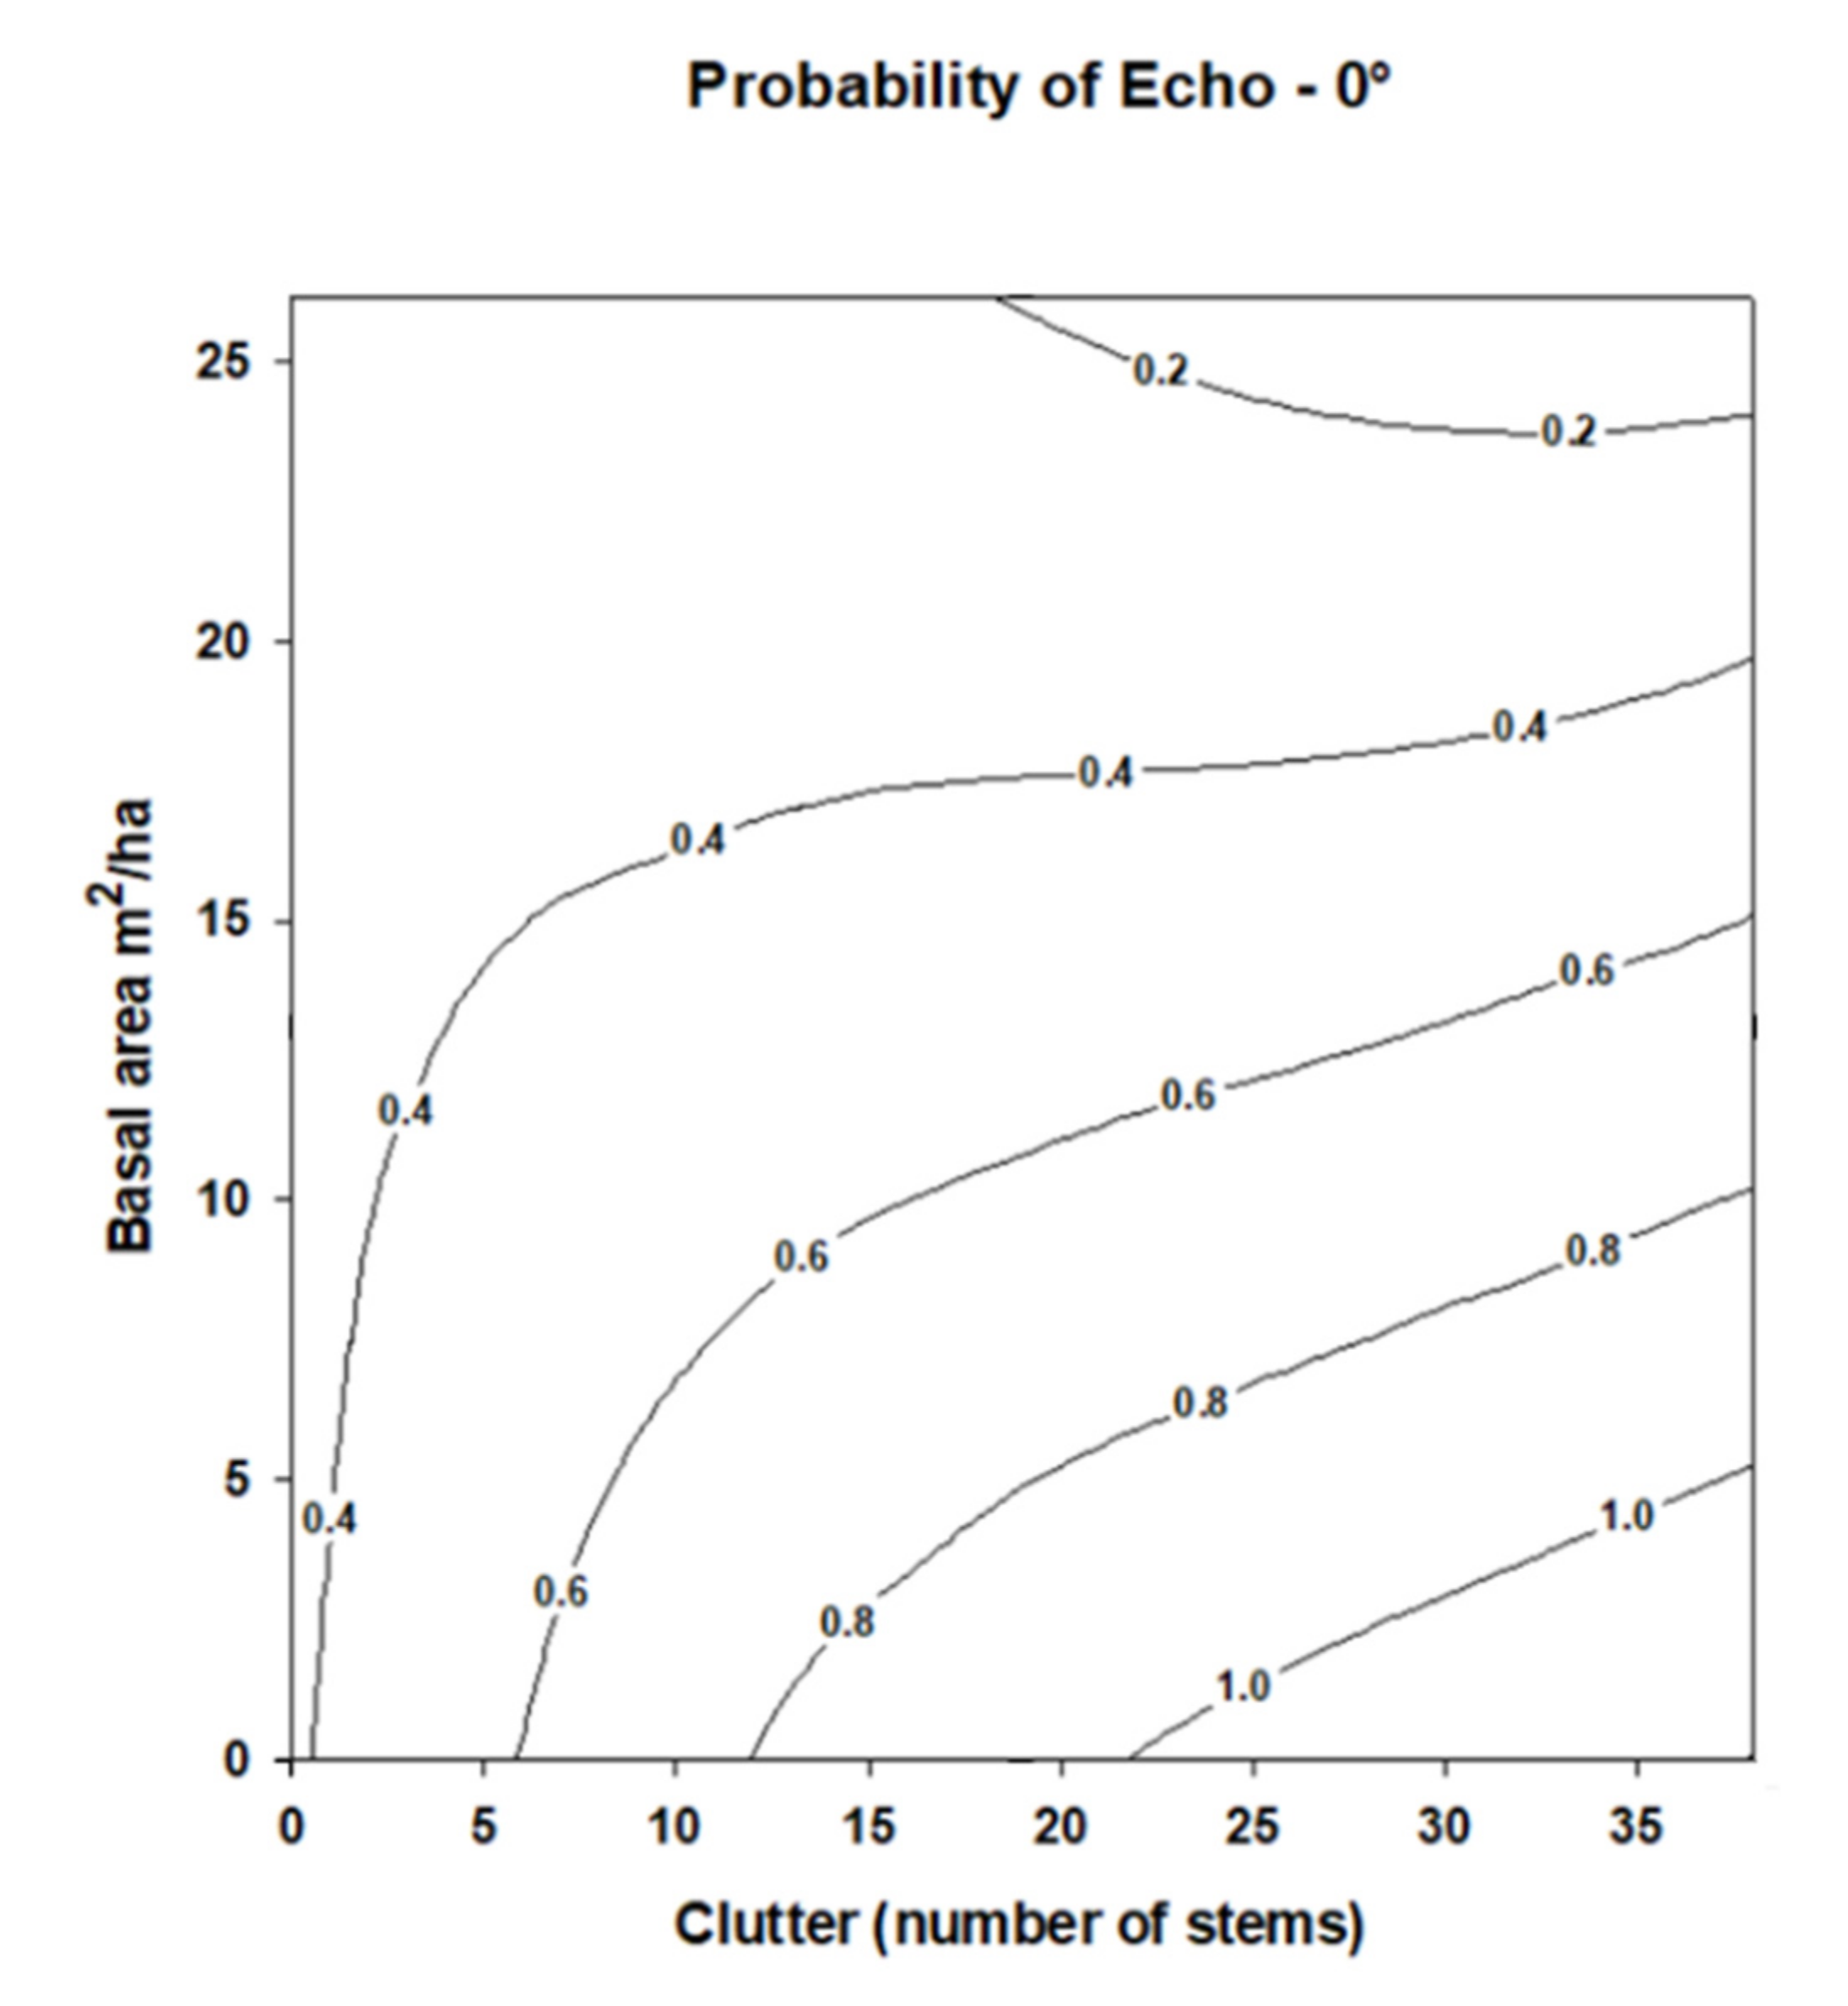
The probability of recording an echo pulse did not differ among angles from the reference angle 0° (
Table 5), and all angles except angle 0° showed a 0% probability of recording an echo across all experimental conditions (
Figure 6). Stem density and basal area showed no significant effect on the probability of receiving an echo pulse (
Table 5,
Figure 6). Similarly, the interaction of stem density and basal area effect on recording an echo was not significant (
Table 5), although a slight interactive pattern was visible on the contour graph for angle 0° (
Figure 6). At angle 0°, the probability of receiving an echo pulse at higher stem densities appeared to increase slightly as basal area increases. One to two echo pulses were received at angle 0° at higher levels of clutter, whereas no echoes were ever received at the other angles.
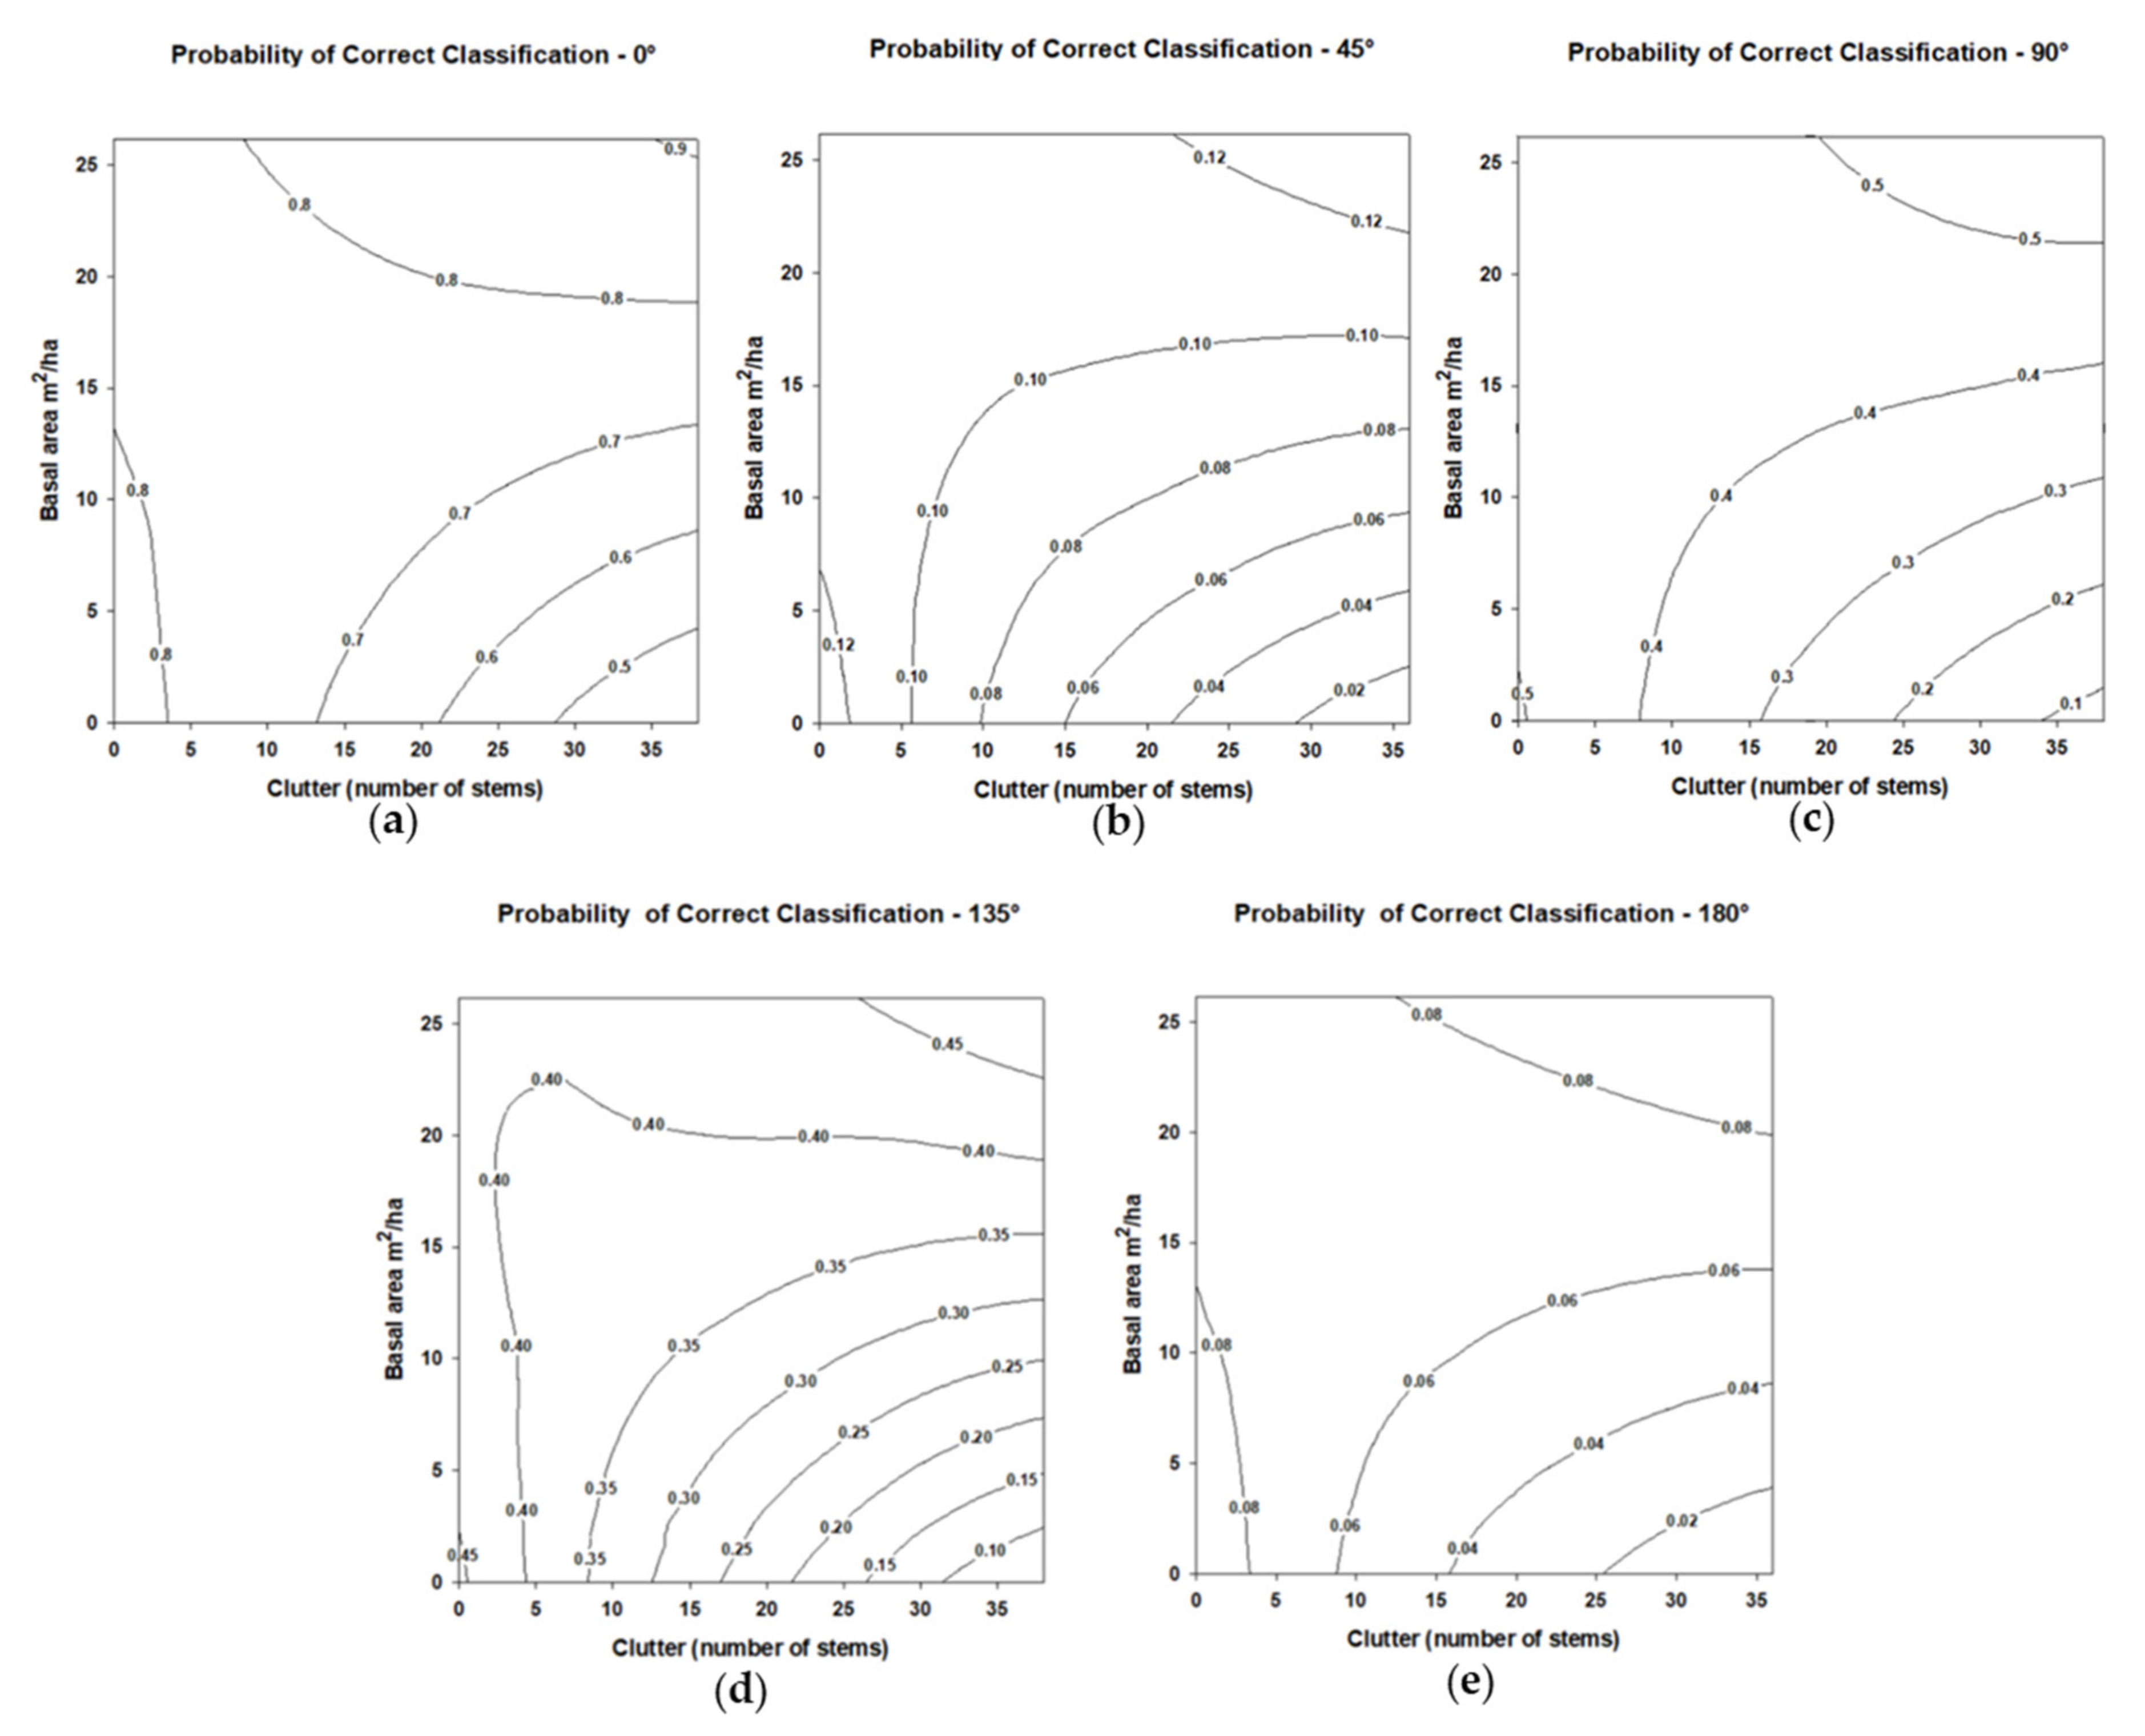
The probability of Kaleidoscope Pro correctly classifying the broadcasted synthetic eastern red bat call significantly differed from angle 0° at angles 45°, 90°, 135°, and 180° across experimental conditions (
Table 6). Angles 45°, 90°, 135°, and 180° all had a negative effect on the probability of correctly classifying the synthetic bat call across experimental conditions (
Figure 7); however, model fit was poor for angles 45° and 180°. Stem density had no significant effect on the probability of correct classification (
Table 6), although the probability of a correct classification appeared to increase as stem density increased for angle 0°, likely due to an increased chance of a high-quality echo pulse being recorded. Basal area also showed no significant effect on the probability of correct classification (
Table 6). The interaction of stem density and basal area did not significantly affect the probability of correct classification (
Table 6).
4. Discussion
Through the use of the anechoic chamber, we assessed the effect of receiver angle and measures of clutter condition on the recording and classification of an echolocation signal using a standardized synthetic echolocation pulse without the uncertainty associated with field studies. Although our results were aligned with our prediction and previous studies that detector angle would play an important role in echolocation call quality received [
24,
25], our findings that stem density and basal area did not influence outcomes as much were contrary to our expectations based on previously reported field studies [
6,
11,
20,
39]. The overall poor classification probabilities, the fact that all of the angles significantly differed from angle 0°, and the marginal significance of the two clutter metrics imply that proximity and angle of the emitter to the receiver might be the more important factors for recording high-quality, identifiable echolocation calls. These findings are similar to the results of others who found that attenuation and geometric spreading had significant effects on the quality of received echolocation signals [
12,
25]. The high-frequency and generally lower-amplitude echolocation calls emitted by bats flying through clutter impose severe range limitations due to the rapid attenuation and geometric spreading of the signal through air even under ideal temperatures and humidity [
9,
10,
40]. Increasing humidity further increases attenuation of echolocation signals [
9,
10].
Nevertheless, stem count does appear to contribute to deviations in call quality somewhat but its effect in our testing was overshadowed by the rapid attenuation of the high-frequency signal. More so than increasing basal area, more stems between the signal origin and signal receiver meant that more of the synthetic call was blocked, reflected, or distorted from the original signal. Although our results would suggest that clutter effects are not as apparent as receiver angle and proximity to the source signal, research does indicate that forest structural characteristics do effect echolocation. Structural habitat metrics of vegetation have been linked to bat detection, altering call parameters, and correct identification [
6,
8,
11,
20,
39]. Increased canopy cover and mature forest habitat as compared to more open areas have shown a negative correlation with bat call identification [
20,
39]. There likely is an interactive effect of clutter and frequency of the emitted call resulting in different detection in field settings. Patriquin et al. [
23] found that a lower-frequency signal (25 kHz) was affected more by clutter and differing forest types than a higher-frequency signal (40 kHz). Despite the evident overall reduction in call quality and differing detectability imposed by clutter, an increase in certain types, sizes, and shapes of clutter may actually result in an increase in identifiable echoes depending on the angle of the receiver relative to the position of the bat. Schnitzler and Kalko [
9] observed that the sound pressure level of returning echoes varies depending on the size and shape of objects, whereby larger objects generally returned stronger echoes. Although not significant in our analyses, we observed similar results in the form of a slight interactive trend where increased basal area (larger stems) at high stem densities (stem count) increased the probability of correctly classifying our synthetic call as an eastern red bat. It is possible that there are field settings where a bat passing by a bat detector and clutter or other acoustically reflective surfaces (e.g., cave entrance, emergent rock or human structure), if large and dense enough, could paradoxically improve automatic identification program accuracy by generating recordable pulses over a minimum pulse threshold, assuming little diminution in pulse quality.
The detector set at angle 0° received the primary signal emitted from the SonicBeagle across experimental conditions unencumbered by clutter. Angles 45° and 180° showed poor probabilities of correctly identifying the eastern red bat call across the experimental conditions. In our study, we attributed this to the fact that our emitter was somewhat directional (based on preliminary tests); thus, overall poor classification at 45° is plausible assuming signal bounce from clutter is less likely to occur at such an oblique angle. Therefore, for this angle, increasing the stem count either further degraded the signal or produced no identifiable echoes owing to the angle of sound reflection. In addition, there is a higher chance of interference between the primary sound received from the emitter and the echo received from the clutter when the microphone is located away from the emitter. This interference further decreases the quality of the recorded sound and results in poor identification. Out of the three call characteristics reported (Fmax, Fmin, and Fmean), maximum frequency appeared to be most affected by stem count with the highest reported percentage deviations, whereas Fmin was less affected (
Figure 3,
Figure 4 and
Figure 5). The lower percentage deviation of Fmin may be due to the lower frequencies not attenuating as rapidly and being able to penetrate clutter better than high frequencies in our experiment (although see Patriquin et al. [
23]). The slower attenuation of low frequencies may partially explain why angle 90° was not significantly different than the control conditions at angle 0° for Fmin, although it is possible that 90° was also a good angle for echo reflectance. Whereas Fmax and Fmin provide insights into how high and low frequencies perform relative to varying clutter, the mean frequency gives an indication of the overall performance. Both clutter and angle were significant factors affecting Fmean with the percentage deviation increasing as stem count increased. The 180° detector experienced the highest percentage deviation between low and high stem counts for Fmean. In this case, higher levels of clutter scattered and degraded the rapidly attenuating signal as it traveled through the simulated forest before reaching 180°.
Echo pulses were not common in our experiment at all angles. However, the detector at 0° received some echoes. With this detector being located next to the signal source, it presumably did not receive an echo unless there was sufficient clutter for signal reflectance. This finding provided additional evidence that a certain degree of clutter may be acceptable because the larger reflective surface area may produce high-quality, identifiable echoes for automated software [
9]. Although there are tradeoffs to bat detector placement in clutter, these may be mitigated by placement in or near a certain degree or type of clutter that acts as a reflector. The oblique angles did not benefit from echoes reflecting off the clutter. Nevertheless, although acceptable for occupancy analyses (i.e., presence/absence),) increased echoes could bias activity metrics if activity is based on the number of pulses within a bat pass (single call file); hence, some caution should be exercised when activity metrics are compared between areas with different clutter levels as noted by others [
6,
7,
13,
41,
42].
The development of acoustic lure technology to assist with mist-net surveys faces many challenges such as the rapid attenuation and geometric spreading of ultrasound [
9,
10], limitations inherent to the equipment such as uneven frequency response of speakers across the ultrasound spectrum [
43,
44], a poor understanding of bat social calls [
44,
45,
46,
47], and possibly ethical considerations of broadcasting artificial calls causing bats to alter their behavior [
2]. One factor to consider when developing acoustic lure technology, congruent with our study, is how clutter impacts the effective range of the technology. Research has been conducted investigating the effective sampling area of bat detectors [
26]; however, to date, no research has directly investigated the effective range of ultrasonic bat lures in either controlled or field settings [
44]. According to the results of our work, rapid attenuation and angle from the lure source to the receiver clearly is a primary limitation particularly at higher frequencies. Depending on the target species, the frequency of the calls being broadcast through a lure device, and the clutter level and composition, it may be necessary to adjust the amplitude (loudness) of a lure device, although how increasing the amplitude affects bat behavior (i.e., going from an attractant to a deterrent) has not been well established [
45,
48]. For example, high-amplitude calls could potentially interfere with the echolocation of bats as they approach a lure device and, thus, deter them from closer approach [
45,
49,
50,
51,
52,
53]. From our work, angle clearly is an important factor that may limit the effectiveness of a lure device. The off-axis performance of our signal source, as well as the microphones, was poor and was further degraded with increased clutter. In the case of our study, the directionality may have actually been beneficial in ensuring that we were only assessing clutter effects on deflection. If a fully omnidirectional device was used, the echolocation signal may have bypassed the dowel array. In field use, however, lure devices with an omnidirectional speaker or a diffuser, multiple directional speakers, or multiple lure devices may be important to penetrate clutter, increase range, and create a useful attraction area or effect. It is conceivable that, while the patterns we observed in our study are directly transferable to lure use, the magnitude of reduction in signal quality may not be [
54,
55,
56,
57,
58]. Going forward, understanding the effective attraction distance and how clutter may impact a bat’s perception of broadcast calls will be necessary as lure technology continues to develop.
5. Conclusions
Ultimately, this experiment shows that proximity due to rapid attenuation of ultrasound signals and recording angle potentially are the main limiting factors affecting ultrasonic recording or transmission in a cluttered environment. Stem count also appears to play a role in signal reception more so than basal area. In open, low-clutter conditions, attenuation is the primary limitation and echoes generally are not received. Moderate clutter, particularly if the clutter objects are larger (e.g., a mature stand of trees), could improve the likelihood of creating high-quality identifiable echoes, whereas high clutter with many objects, such as a dense aggregation of sapling trees in a regenerating forest post harvest, blocks and scatters echolocation signals, resulting in poor-quality calls and lower identification certainty. Although recording quality and lure effective range is probably going to be relatively poor in a cluttered environment as compared to recording or broadcasting in open areas, researchers often are constrained to survey in cluttered habitat for clutter-adapted foraging species. Additional comprehensive and repeatable experiments conducted under controlled conditions, such as our study, may help better identify the biases associated with surveying in clutter. As such, our study serves as a proof of concept and can facilitate additional work on testing a larger variety of clutter objects and conditions, as well as different temperature and humidity conditions. A wider variety of bat species calls across the ultrasonic spectrum should be tested with a variety of ultrasonic playback devices, including calls collected from open and cluttered settings. A calibrated and synchronized array of microphones could be used for future work to speed up data acquisition and organization. Developing better ways to measure, report, and include clutter information in automatic identification programs and testing lure devices are much needed particularly in the post-WNS landscape of North America. Although researchers and managers are limited to being able to control receiver angle only broadly, i.e., placement along defined corridors and flyways, we believe more work to experimentally test the effects of clutter under controlled conditions is warranted. We suggest as well that researchers report as fully as possible the clutter metrics encountered during acoustic surveys. Lastly, based on results from our work, the input of more echolocation calls gathered in cluttered environments would help improve identification algorithms of automated software used to identify bats.
Some WNS-affected species are becoming too rare on the landscape to effectively study with mist-net surveys [
1,
22,
59,
60]. Seasonal activity patterns to inform wind energy pre-siting are also only able to be effectively studied through acoustics due to the time intensiveness and low capture rates of certain species associated with mist-net surveys. Future research goals stemming from this work could use deviation values and other information gained from controlled clutter experiments to develop correction factors that would enable biologists to mathematically adjust call parameters to improve detection and/or classification. Reporting of detection and transmission space taking clutter and climatic/weather variables into account for further developing detection covariates would be beneficial. Furthermore, investigating clutter effects on the echolocation calls of other species should be encouraged as we only tested a single species. The anechoic chamber with an artificial “forest” and playback device provides an initial basis to continue and expand on these areas of research unencumbered by the noise and repeatability issues encountered during field studies.


 ,
, 


