
Adaptive Cruise Control System Evaluation According to Human Driving Behavior Characteristics


1
School of Automotive Studies, Tongji University, Shanghai 201804, China
2
State Key Laboratory of Vehicle NVH and Safety Technology, Chongqing 401122, China
3
School of Automobile, Chang’an University, Xi’an 710064, China
*
Author to whom correspondence should be addressed.
Actuators 2021, 10(5), 90; https://0-doi-org.brum.beds.ac.uk/10.3390/act10050090
Submission received: 10 April 2021
/
Accepted: 23 April 2021
/
Published: 27 April 2021
(This article belongs to the Special Issue Actuators for Intelligent Electric Vehicles)
Abstract
:With the rapid and wide implementation of adaptive cruise control system (ACC), the testing and evaluation method becomes an important question. Based on the human driver behavior characteristics extracted from naturalistic driving studies (NDS), this paper proposed the testing and evaluation method for ACC systems, which considers safety and human-like at the same time. Firstly, usage scenarios of ACC systems are defined and test scenarios are extracted and categorized as safety test scenarios and human-like test scenarios according to the collision likelihood. Then, the characteristic of human driving behavior is analyzed in terms of time to collision and acceleration distribution extracted from NDS. According to the dynamic parameters distribution probability, the driving behavior is divided into safe, critical, and dangerous behavior regarding safety and aggressive and normal behavior regarding human-like according to different quantiles. Then, the baselines for evaluation are designed and the weights of different scenarios are determined according to exposure frequency, resulting in a comprehensive evaluation method. Finally, an ACC system is tested in the selected test scenarios and evaluated with the proposed method. The tested vehicle finally got a safety score of 0.9496 (full score: 1) and a human-like score as fail. The results revealed the tested vehicle has a remarkably different driving pattern to human drivers, which may lead to uncomfortable ride experience and user-distrust of the system.
1. Introduction
Advanced Driver Assistance Systems (ADAS) are drawing increasing attention due to their potential in enhancing traffic safety, reducing driving workload and improving traffic efficiency. With wide studies on the control strategies of ADAS like adaptive cruise control system (ACC) [1,2], lane-keeping system (LKS) [3], automated emergency braking system (AEB) [4], etc., the functionalities of such systems are well studied and qualified. It follows that improving the anthropomorphism should also be incorporated into the development of these systems [5]. A human-like driving behavior pattern could enhance riding comfort and user trust and therefore improve user acceptance and increase usage frequency [6,7,8]. In the meantime, the surrounding drivers could better understand the vehicles adapting human-like driving patterns and make a natural interaction in the human-robot mixed traffic environment [9,10]. With the development of human-like ADAS, there raises the need for a testing and evaluation method considering human-like behavior.
Considering the motion state of the leading vehicle and the host vehicle, and the human driver’s commands, an adaptive cruise control (ACC) system automatically controls the longitudinal motion of the host vehicle and provides the driver with driving risk tips to reduce the driving task strength and guarantee driving safety [11,12,13]. At present, ACC systems are widely used. In 2018, about of all car models were equipped with ACC systems as the standard configuration in America [14].
As a mature function already on the market, there are several testing standards or regulations for ACC systems come from organizations such as ISO [11], SAE [13], GB [12], FMCSA [15] and so on. ISO 15622 and GB/T 20608 share three similar basic testing procedures: target acquisition range test, target discrimination test, and curve capability test, involving three test scenarios. Besides, the scenario for the deceleration ability test of the system is supplemented in SAE J2399. All these related standards focus on the test of functionality, that is, whether the functions such as longitudinal ranging and speed controlling could be realized.
On the other hand, studies on ACC systems or ADAS testing and evaluation methods mainly focus on the safety issue. Li et al. [16] evaluated impacts of ACC parameters on reducing collision risks on congested freeways. Qiu et al. [17] proposed a model for assessing the probability of accidents of ADAS systems, i.e., from the safety perspective. Focusing on collision avoidance, Stark et al. [18] carried out a simulation to estimate the performance of the state-of-art ADAS.
Although these standards and studies on testing and evaluation methods of ACC systems have produced great achievements on assessment of the system, none of them take the human-like behavior into consideration. Therefore, in this paper, we proposed a testing and evaluation method for ACC systems involving both safety and human-like performance. This method has the following two advantages: 1. this ready-to-use method provides testing scenarios generated from real driving data to ensure consistency to the real implementation environment; 2. the result is quantitatively evaluated from both the safety and human-like perspectives. This work offers an improvement for existing testing and evaluation methods in terms of a more real and efficient testing scenario set and more a comprehensive evaluation index, which is of great significance for further improvement of ACC systems.
The rest of the paper is arranged as follows: in Section 2 the real usage scenarios of ACC systems are defined based on the naturalistic driving study (NDS) and test scenarios are extracted according to the collision likelihood. In Section 3, the driving behavior characteristics of human drivers are obtained from NDS by statistical analysis. Evaluation indexes for both safety and human-like are designed separately in Section 4. Finally, an ACC system is tested and evaluated in Section 5 with the proposed method, following with the conclusion as ending in Section 6.
2. Testing Scenarios Extraction
In order to evaluate the safety and human-like of ACC systems, it is necessary to clarify the operating domains of ACC systems and then extract test scenarios accordingly. In this section, the operating domain is firstly defined according to the function design of ACC systems and then classified into usage scenarios according to the vehicle’s motion state. Then, the test scenarios were classified into safety and human-like testing based on collision likelihood. Finally, a set of testing scenarios is generated and summarized in a table.
2.1. Usage Scenarios Definition
An ACC system performs longitudinal motion control of the vehicle according to the motion state of the host vehicle and the leading vehicle and the command from drivers. Under the premise of meeting the functional requirements, ACC systems can accurately track the following target among multiple leading vehicles and accurately measure the distance between them [12]. The system input is the motion state of the leading vehicle and the host vehicle and the command from drivers, and the output is the longitudinal motion control of the host vehicle. Therefore, the implementation scenario of ACC systems can be simplified to a two-vehicle scenario consisting of only the host vehicle and the vehicle in front (if any). What needs to be emphasized is that ACC systems only control the longitudinal movement of the host vehicle, making the movement of the vehicle limited to a single lane. In summary, the operating domain of ACC systems can be defined as a car-following (or free cruise if there is no leading vehicle) scenario in a single lane, which is referred to as a car following scenario in the following text.
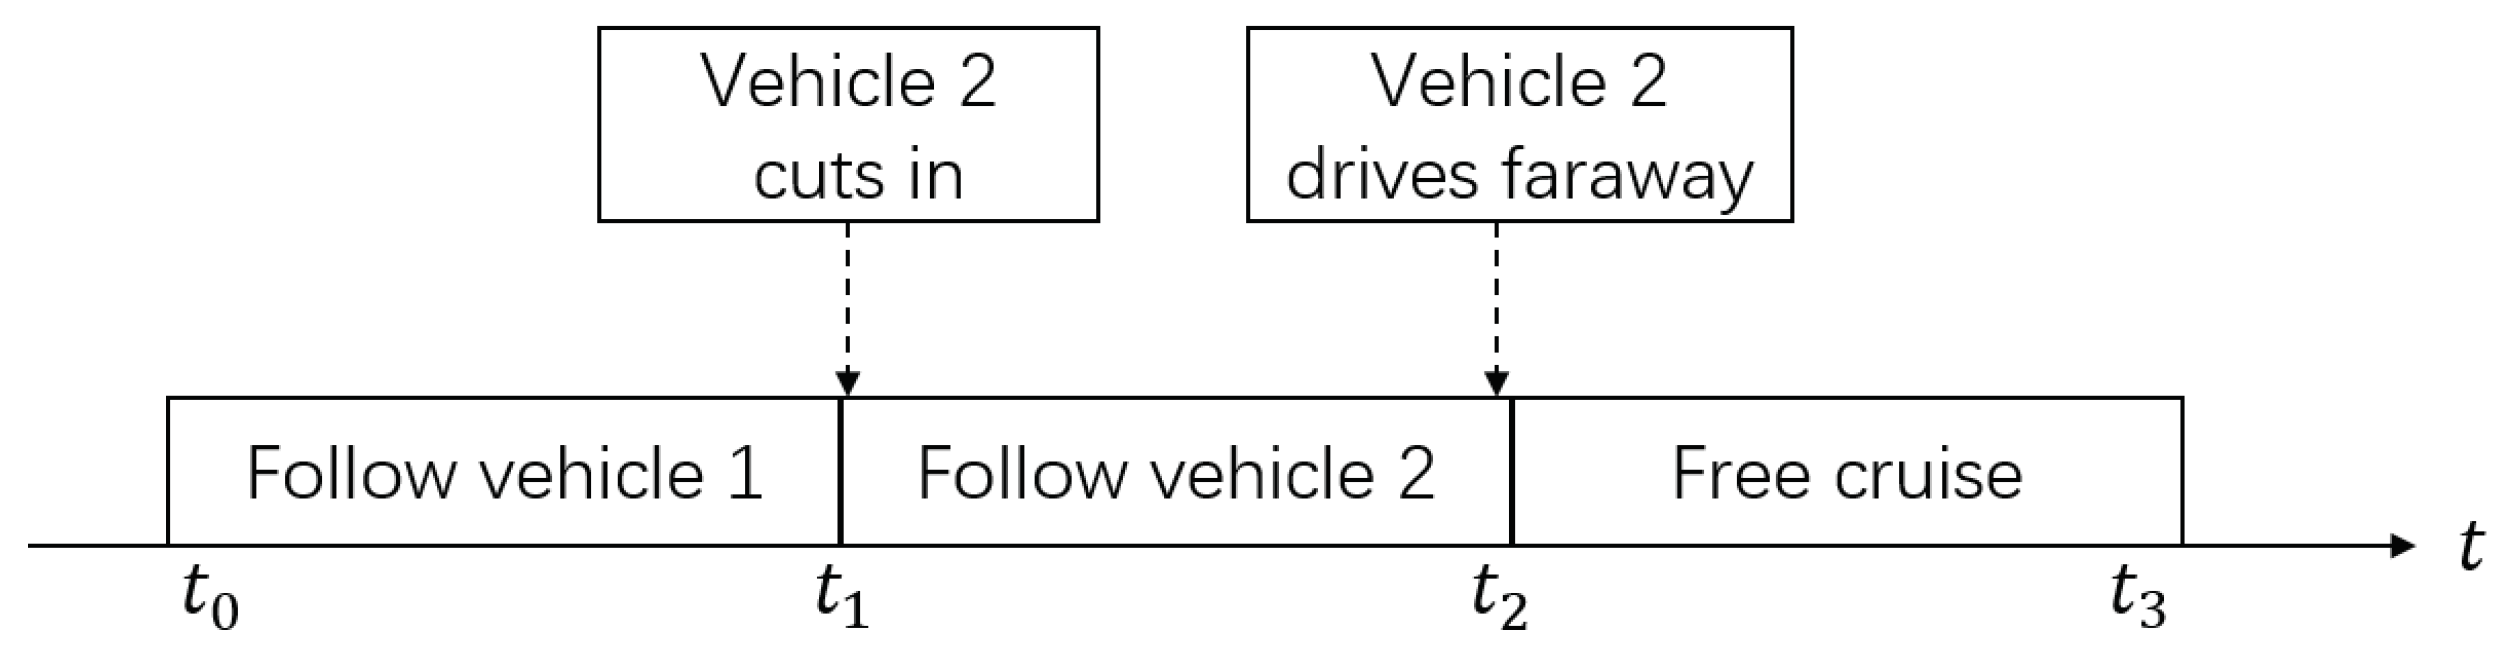
During a car following process, the host vehicle keeps in a single lane while the leading car may change lanes, drive far away, etc., resulting in a scenario transition. In order to describe this scenario transition, the car-following process is decomposed into stable driving states (S) and events (A). A stable driving state S refers to the car-following process during which the leading vehicle target does not change. The stable driving state can be further classified into two types according to the presence of the leading target: (1) the host vehicle follows a fixed leading target in the lane (car following), denoted as , (2) the host vehicle travels in the lane with the prescribed speed without any leading target (free cruise), denoted as . An event A refers to the process that the movement of other traffic participants causes a change of the stable driving state of the host vehicle, including the appearance, disappearance, and change of the leading target. With an event, the host vehicle changes from one stable driving state to another stable driving state. The events that may occur during the car-following process include: cut-in , cut-out , vehicle-approaching , vehicle-distancing , etc.
Take the car following process in Figure 1 as an example. At , the host vehicle changes lanes into a new lane and the following process starts: firstly, the host vehicle follows the leading vehicle 1, which is a stable driving state . Then at time , event occurs, i.e., a new vehicle 2 drives into the front of the host vehicle and works as the new leading vehicle. The host vehicle enters the second stable driving state . At , the leading vehicle travels far beyond the ACC system recognition range. Since there is no leading target in front of the host vehicle, it enters the cruise control state , and so on. The process can be described as: …
In a stable driving state, the following target and driving lane are fixed. Therefore, an ACC system is only required with the basic function, i.e., keeping a reasonable following range to the leading vehicle. However, when an event occurs, the changing following target and following state will put forward higher requirements on the performance of ACC systems. In existing standards (GB/T 20608 and ISO 15622), the three basic performance test scenarios, i.e., target acquisition range test, target discrimination test, and curve capability test, are all in processes, making the testing scenarios less challenging than real operation scenarios. To comprehensively evaluate the system performance, the process and the various events should also be included in the testing scenario set.
2.2. Testing Scenarios
2.2.1. Human-Like Testing Scenario
Human-like indicates that the driving behavior of the vehicle controlled by ACC systems should be similar to that of a human driver, avoiding abnormal driving behaviors which may affect the surrounding traffic flow or the ride comfort. Human-like testing scenarios consist of and due to the following two reason: 1. the short occurrence of events making and processes occupy most of the driving distance and driving time during the car following process. Therefore, the behavior of the vehicle during and impacts the comfort experience of the driver for a longer time than events. 2. In and processes, the scenarios are safe and then the driver focuses on driving experiences rather than the safety issue, making the human-like question significant.
2.2.2. Safety Testing Scenario
The most common danger happens in a car following process is a rear-end event caused by a too-small follow-up distance. To find proper scenarios for safety testing, events are analyzed to confirm the collision likelihood. When the leading vehicle cuts in or the leading vehicle approaching the leading vehicle due to the speed difference, the following distance will reduce gradually or even suddenly. The host vehicle needs to brake to ensure safety, so and are included in safety testing scenarios. When the leading vehicle cuts out or drives far-away , the following distance increases, which does not involve any safety issues. Hence and are excluded in the safety testing scenarios. Stop-and-go scenario refers to the car following process in which the leading vehicle decelerates to a full stop and then accelerates again. This process is common in traffic jams. At this time, timely and sufficient brake control is required to ensure a safe distance. The stop-and-go scenario is included in the testing scenario and recorded as .
The testing scenarios above only offer brief descriptions of the behaviors of the two vehicles during testing. In Table 1 scenarios are further detailed with the speed settings of vehicles.
3. Human Driving Characteristic
The behavior characteristics of human drivers are the baseline for quantitative evaluation. Therefore, firstly, naturalistic driving data and critical driving data are used to analyze the real human driving pattern. Then the boundary among safe, critical, and dangerous driving behavior domains and among normal, aggressive, and critical driving behavior domains are extracted for safe and critical evaluation respectively. Finally, the scenario frequency parameters are integrated, and this chapter obtains an evaluation method that can be used for comprehensive quantitative evaluation of the system.
3.1. Human Driving Data
3.1.1. Naturalistic Driving Data
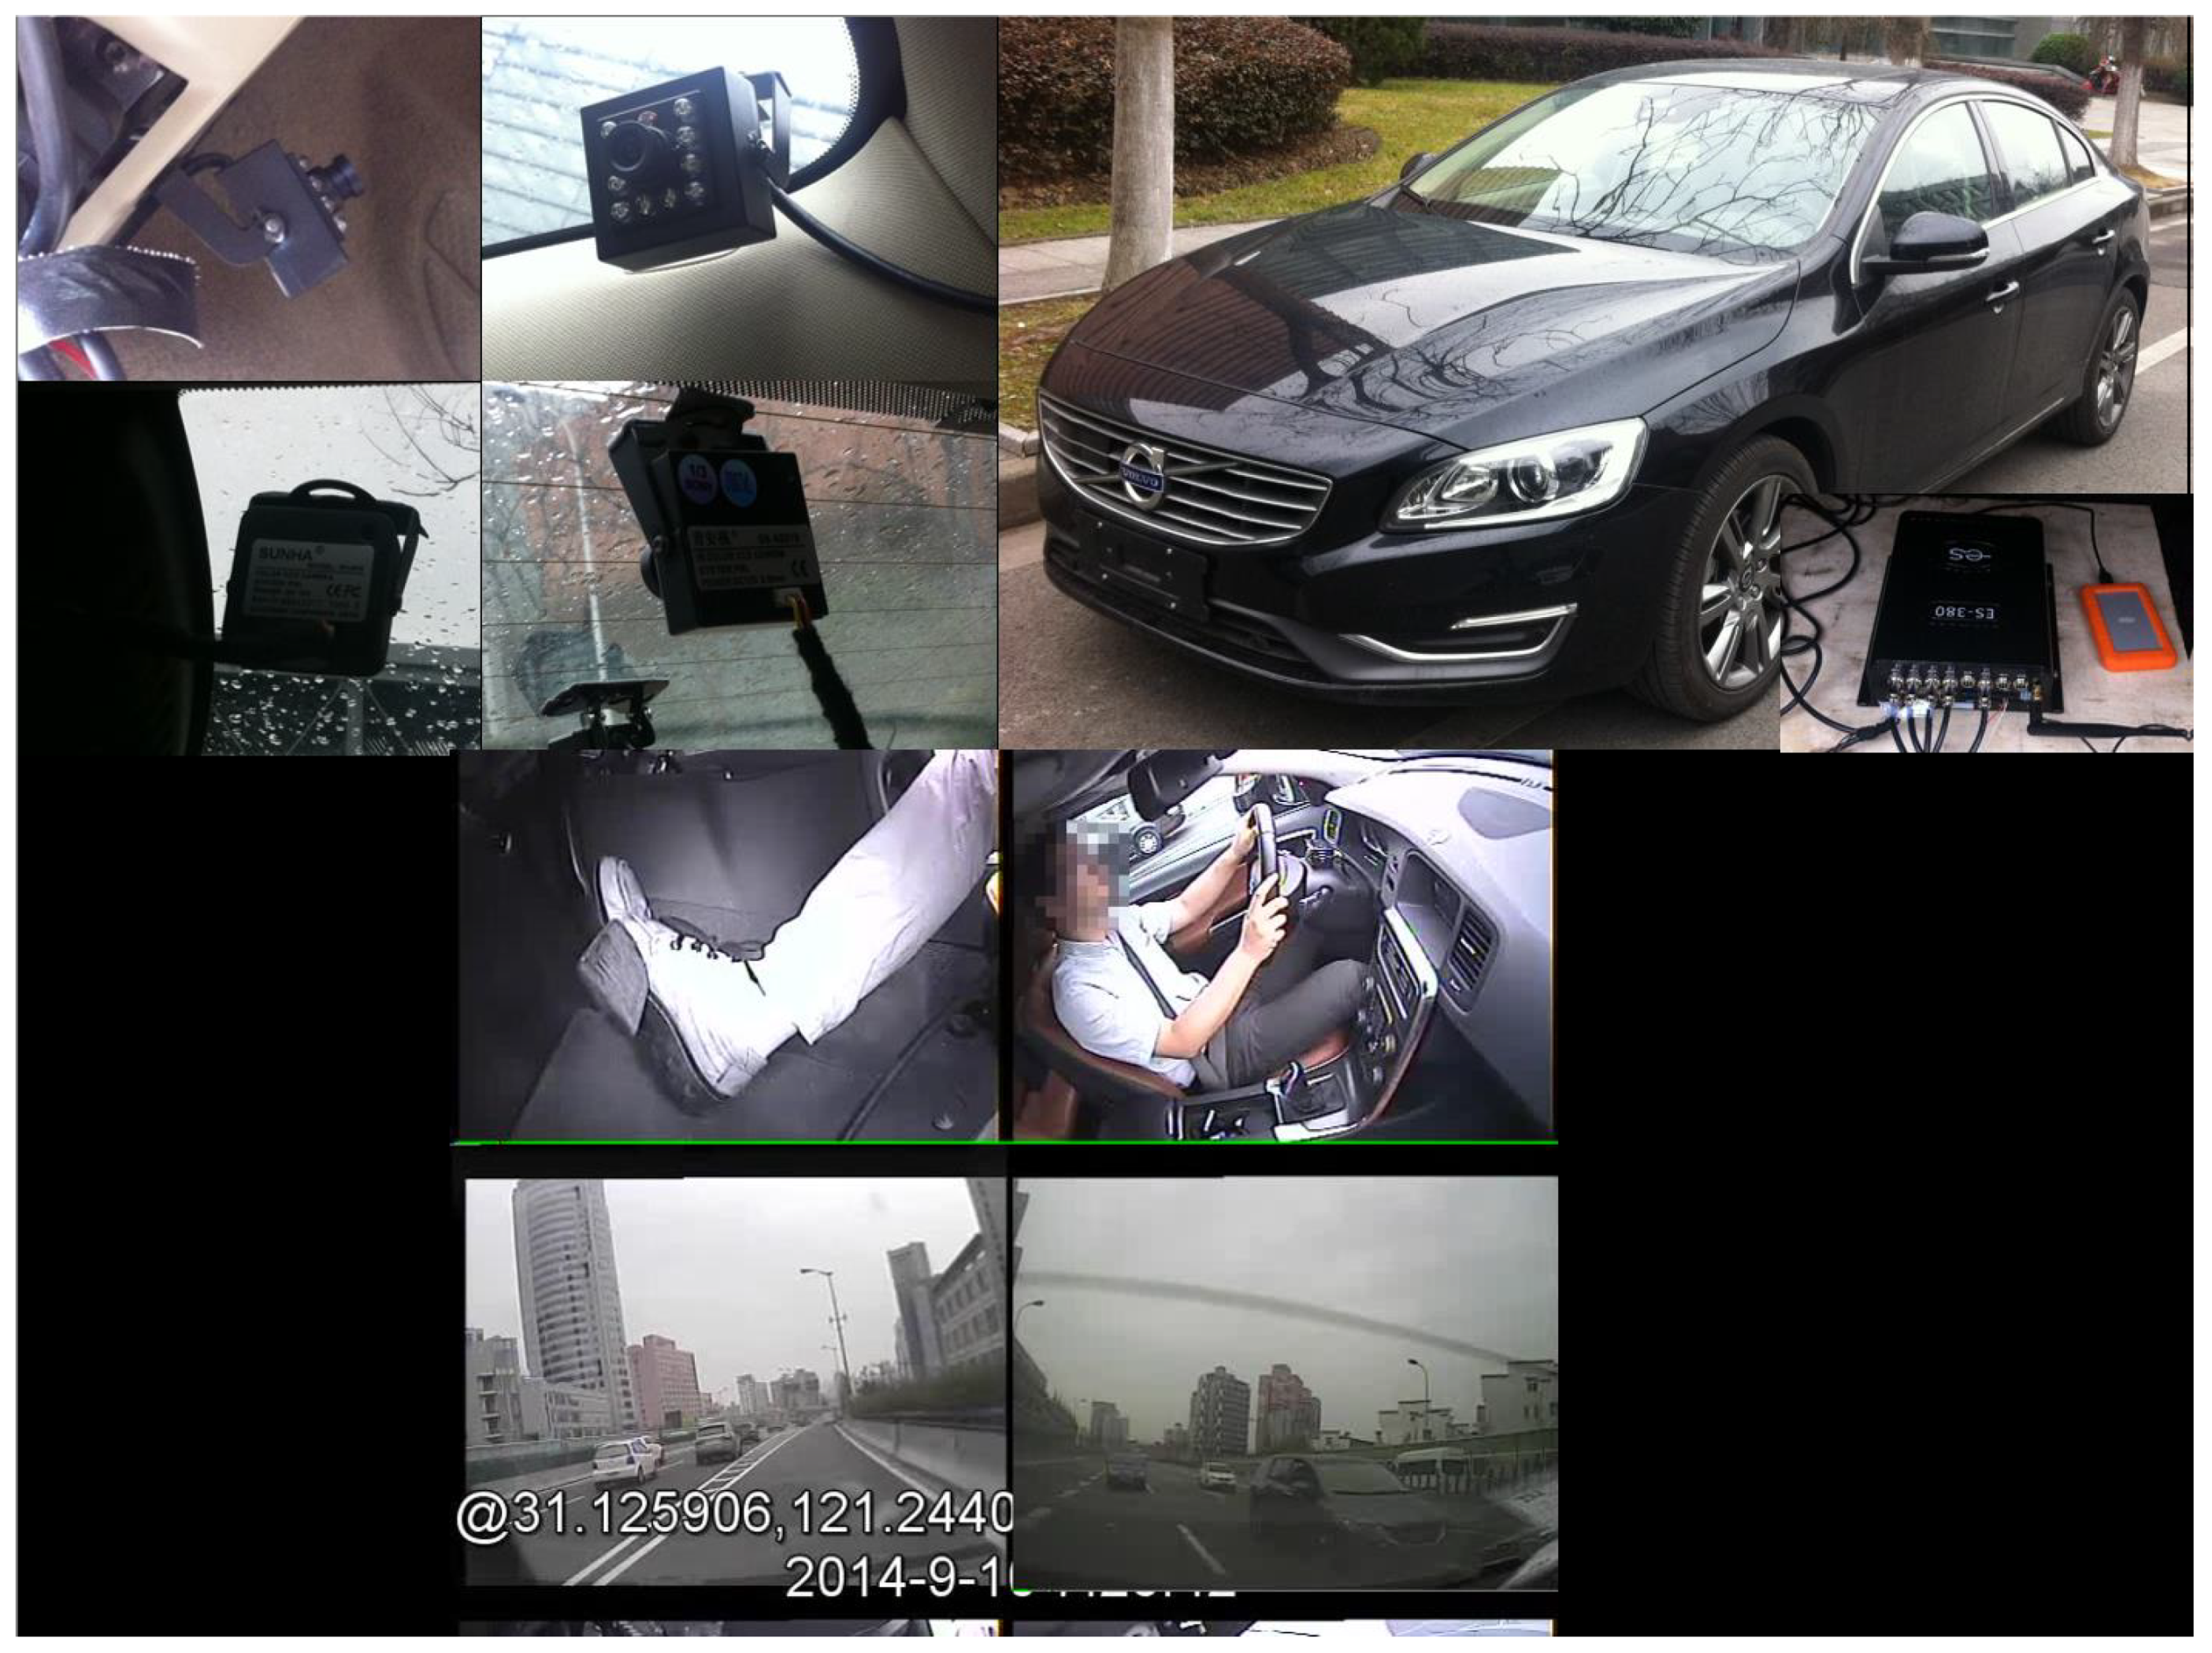
The naturalistic driving study refers to the driving data collection with the usage of unobtrusive observation methods. Since driver behaviors are collected from real traffic environment without disturbing the driver, the naturalistic driving study can collect massive amounts of traffic environment data, driving behavior data, and vehicle dynamical data, which can reflect the real driving needs and driving characteristic of human drivers [19,20]. Therefore, NDS is suitable as the resource date for vehicle development, testing, and verification. At present, various NDS projects were carried out all over the world, including the 100-Car Naturalistic Driving Study project [19] and the SHRP2 project [20] in the United States, the PROLOGUE project in Europe [21] and so on. The data used in this paper comes from a large-scale naturalistic driving study carried out in Shanghai, China. This project lasted for 18 months with 8 vehicles and 32 drivers. Each driver drove a vehicle for six months. The experiment vehicle is equipped with 4 cameras, which record the road environment in front of the vehicle with 2 different viewing angles, the driver’s hand and pedal operations separately as shown in Figure 2. The vehicle’s motion was also collected from the CAN-bus and an accelerometer. A total of 7402 were collected, which lasts for 3594 h and travels 129,935 km.
3.1.2. Critical Driving Data—‘500-Cases’
In NDS, critical or dangerous scenarios are very limited due to the extremely low frequency of danger. Most scenarios are safe and therefore only reflect human driving behavior under safe scenarios. Since the driving characteristic in critical scenarios varies a lot from that in safe scenarios, it is necessary to obtain critical driving data as a supplement. Therefore, the data set ‘500-Cases’ is introduced. The ‘500-Cases’ is generated from a critical scenarios collecting project carried out in Shanghai. Dashcams were installed on taxis, police cars, and some private cars to collect the critical scenarios with longitudinal deceleration greater than 0.4 g or lateral acceleration greater than 0.4 g. The cam will record the driving states 15 s before and 5 s after the time that the trigger value is reached. The sampling frequency is 2 Hz for speed and 30 Hz for acceleration and the frequency of video information is 30 Hz. A total of 4000 cases were collected during the 4 years test. Finally, a total of about 500 critical scenarios and 8 collisions were obtained and formed the 500-Cases data set.
3.2. Driving Behavior Characteristic
3.2.1. Joint Distribution of Speed-
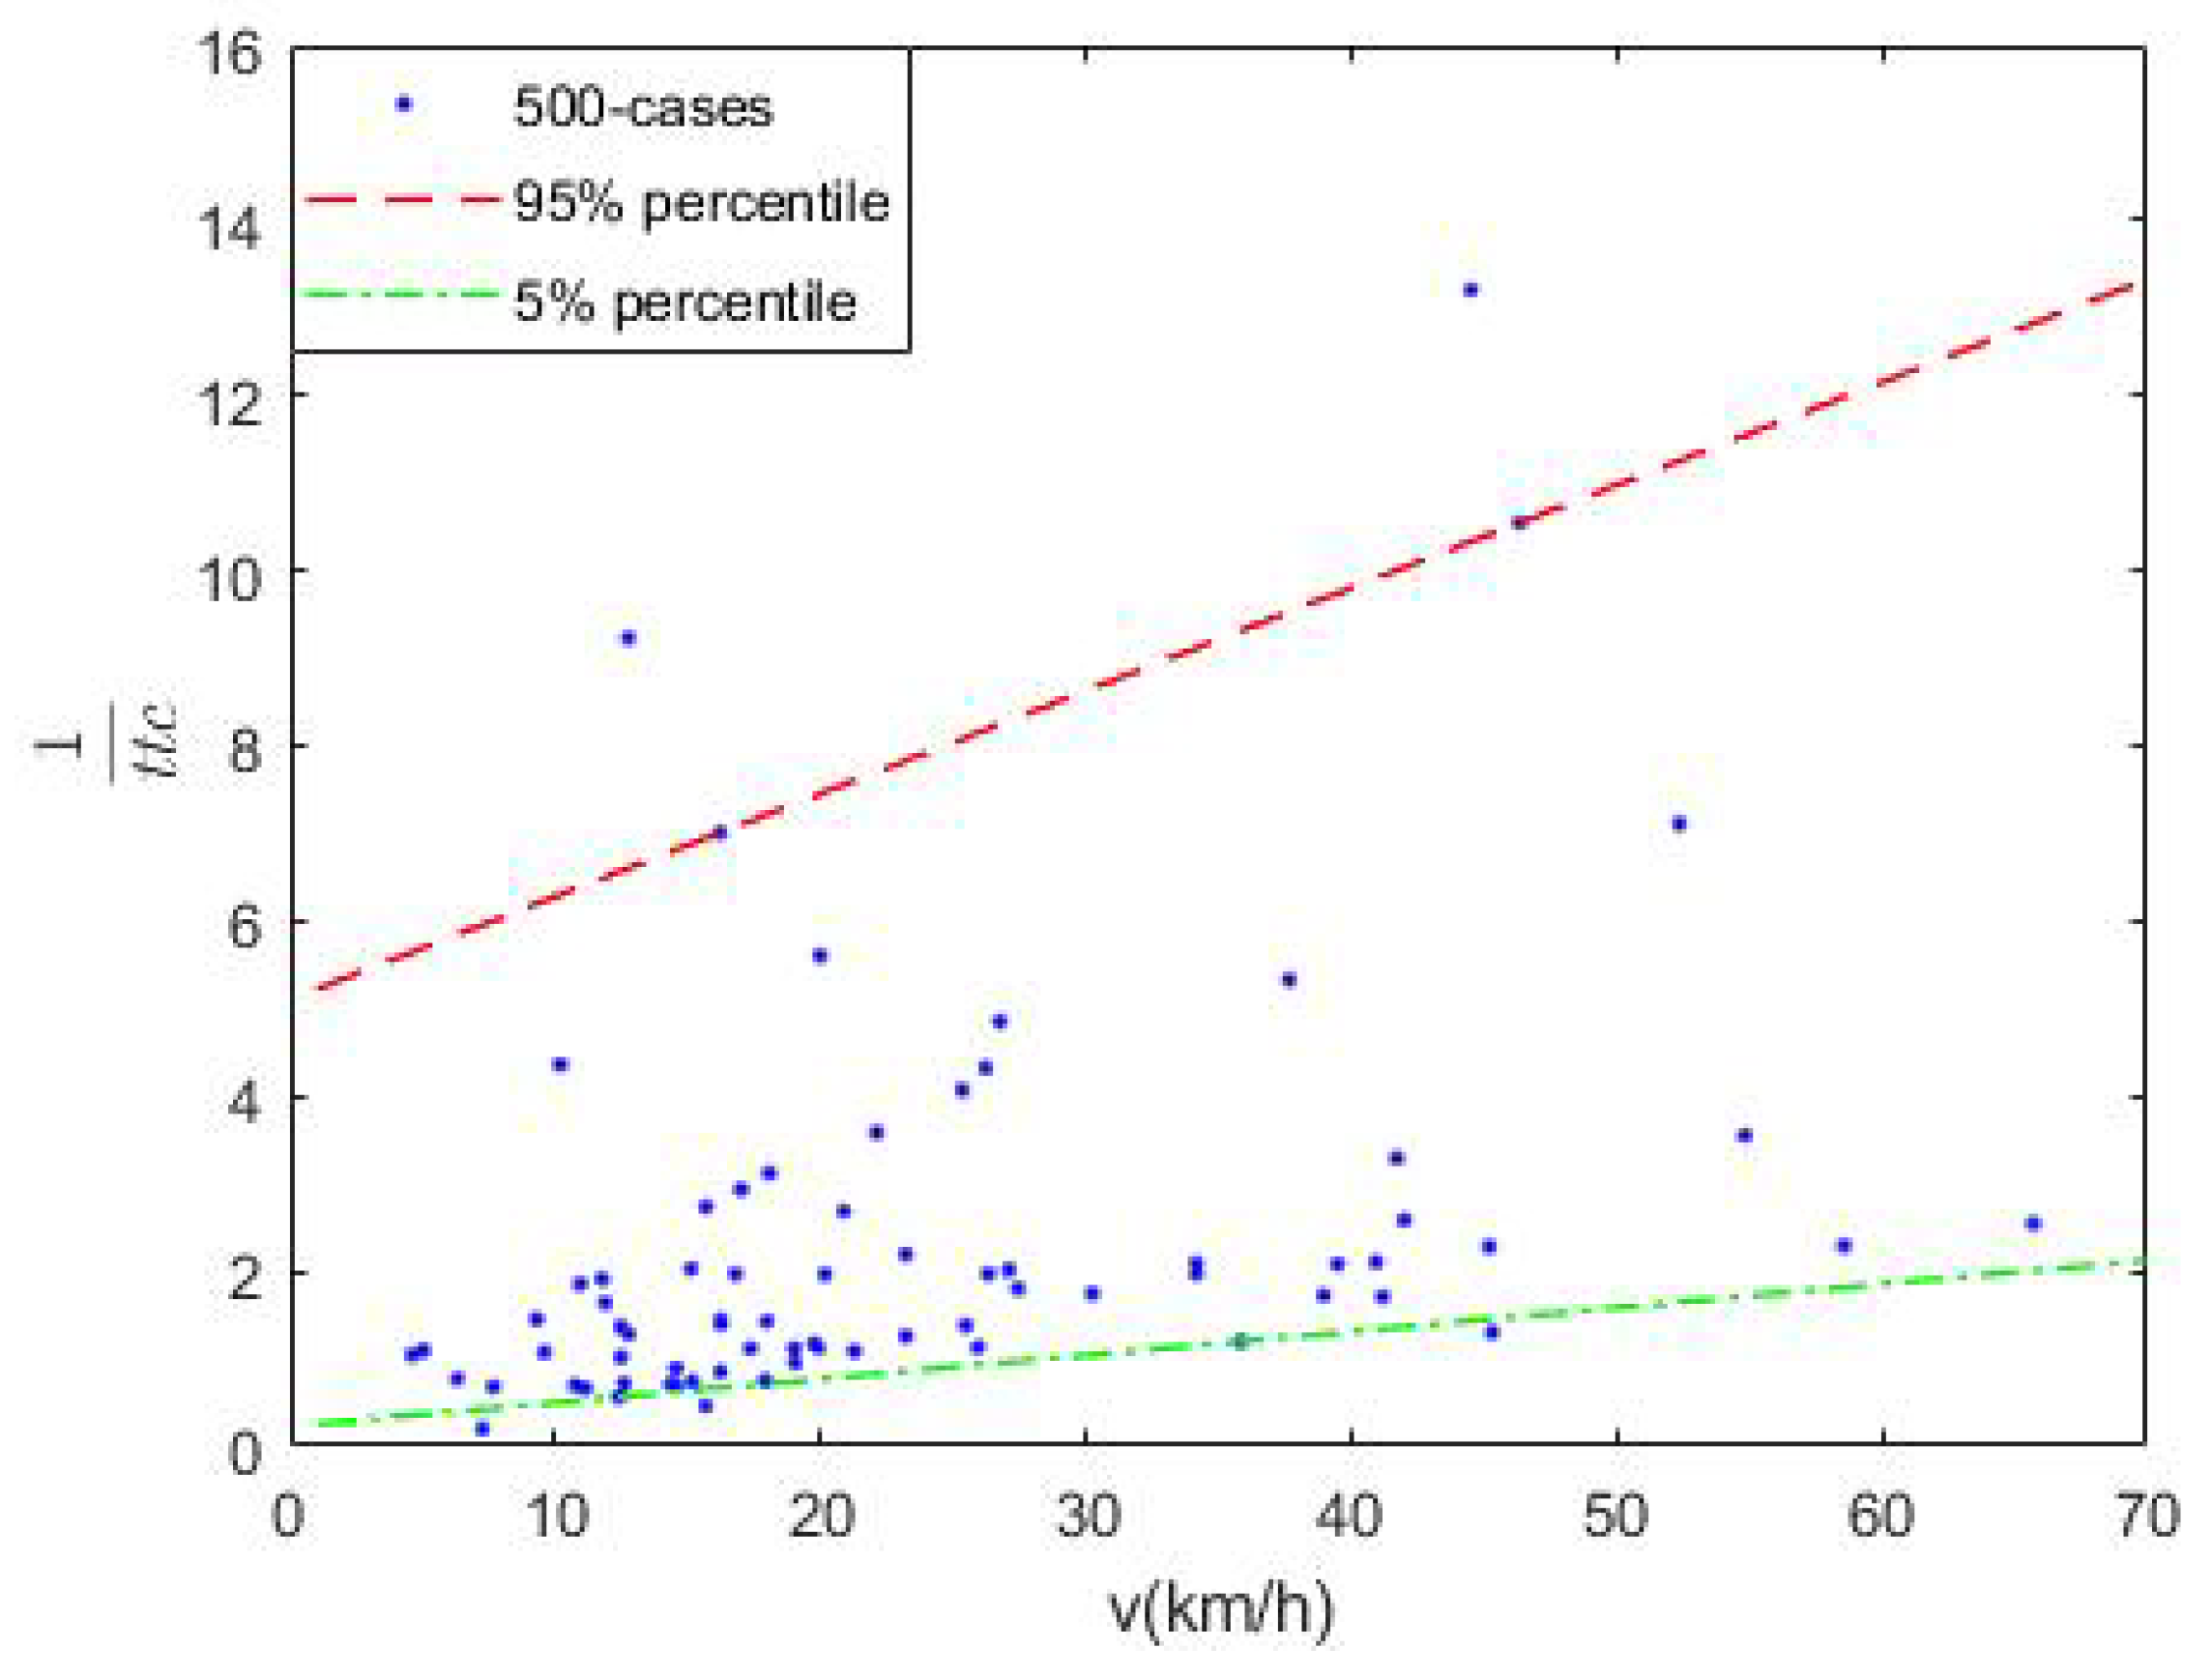
Time to collision is a parameter commonly used to describe the degree of criticality of a car-following scenario. It was first proposed by Hayward as the time that two vehicles will collide if both of them maintain the current motion state, which is equal to the relative distance between the two vehicles divided by the relative speed [22]. In general, the larger the TTC is, the lower the risk level is. Usually, TTC is distributed in (0,+). However, when the speed of the two vehicles are similar, the value of TTC is very large, which brings inconvenience to the calculation and visualization of TTC distribution. Therefore, the value of at the braking time is introduced as the objective risk-level indicator.
Figure 3 shows the joint distribution of speed and of 78 dangerous car-following scenarios from ‘500-Cases’. After the regression coefficient test, the significance level , i.e., there is a significant regression relationship between at the start of braking and the speed of the vehicle. The linear fitting equation is: . Therefore, the influence of speed should be considered when is used to divide the safe, critical, and dangerous driving behavior domain. As shown as the green line in Figure 3, the 5% percentile of works as the boundary between the safe and the critical driving behavior domains. The linear quantile-regression equation is: . As shown as the red line in Figure 3, the 95% percentile of works as the boundary between the critical and dangerous driving behavior domains. The linear quantile regression equation is: .
3.2.2. Joint Distribution of Velocity-Acceleration
Acceleration can directly reflect the driver’s intention to control the vehicle. Therefore, the acceleration distribution obtained from NDS indicates the probability distribution of the driver’s operation in the scenario. So, the system acceleration falls in the interval of higher probability indicates that it is similar to the human driver’s operation, and the opposite means that the operation is poorly human-like. Acceleration can be therefore used as a characterization of the human-like of system. Besides, the magnitude of acceleration also indicates the driver’s understanding of the current scenario state from safety perspective. For example, in a dangerous situation, the driver often applies a large deceleration to avoid collisions. Therefore, a very large deceleration tends to characterize the driver’s subjective understanding of the current scenario as a high level of danger. Therefore, acceleration can be used as a subjective safety characterization of the system. In the following, NDS are used to obtain the joint-distribution of speed and acceleration of human drivers and critical, aggressive, and normal driving behavior domains are divided.
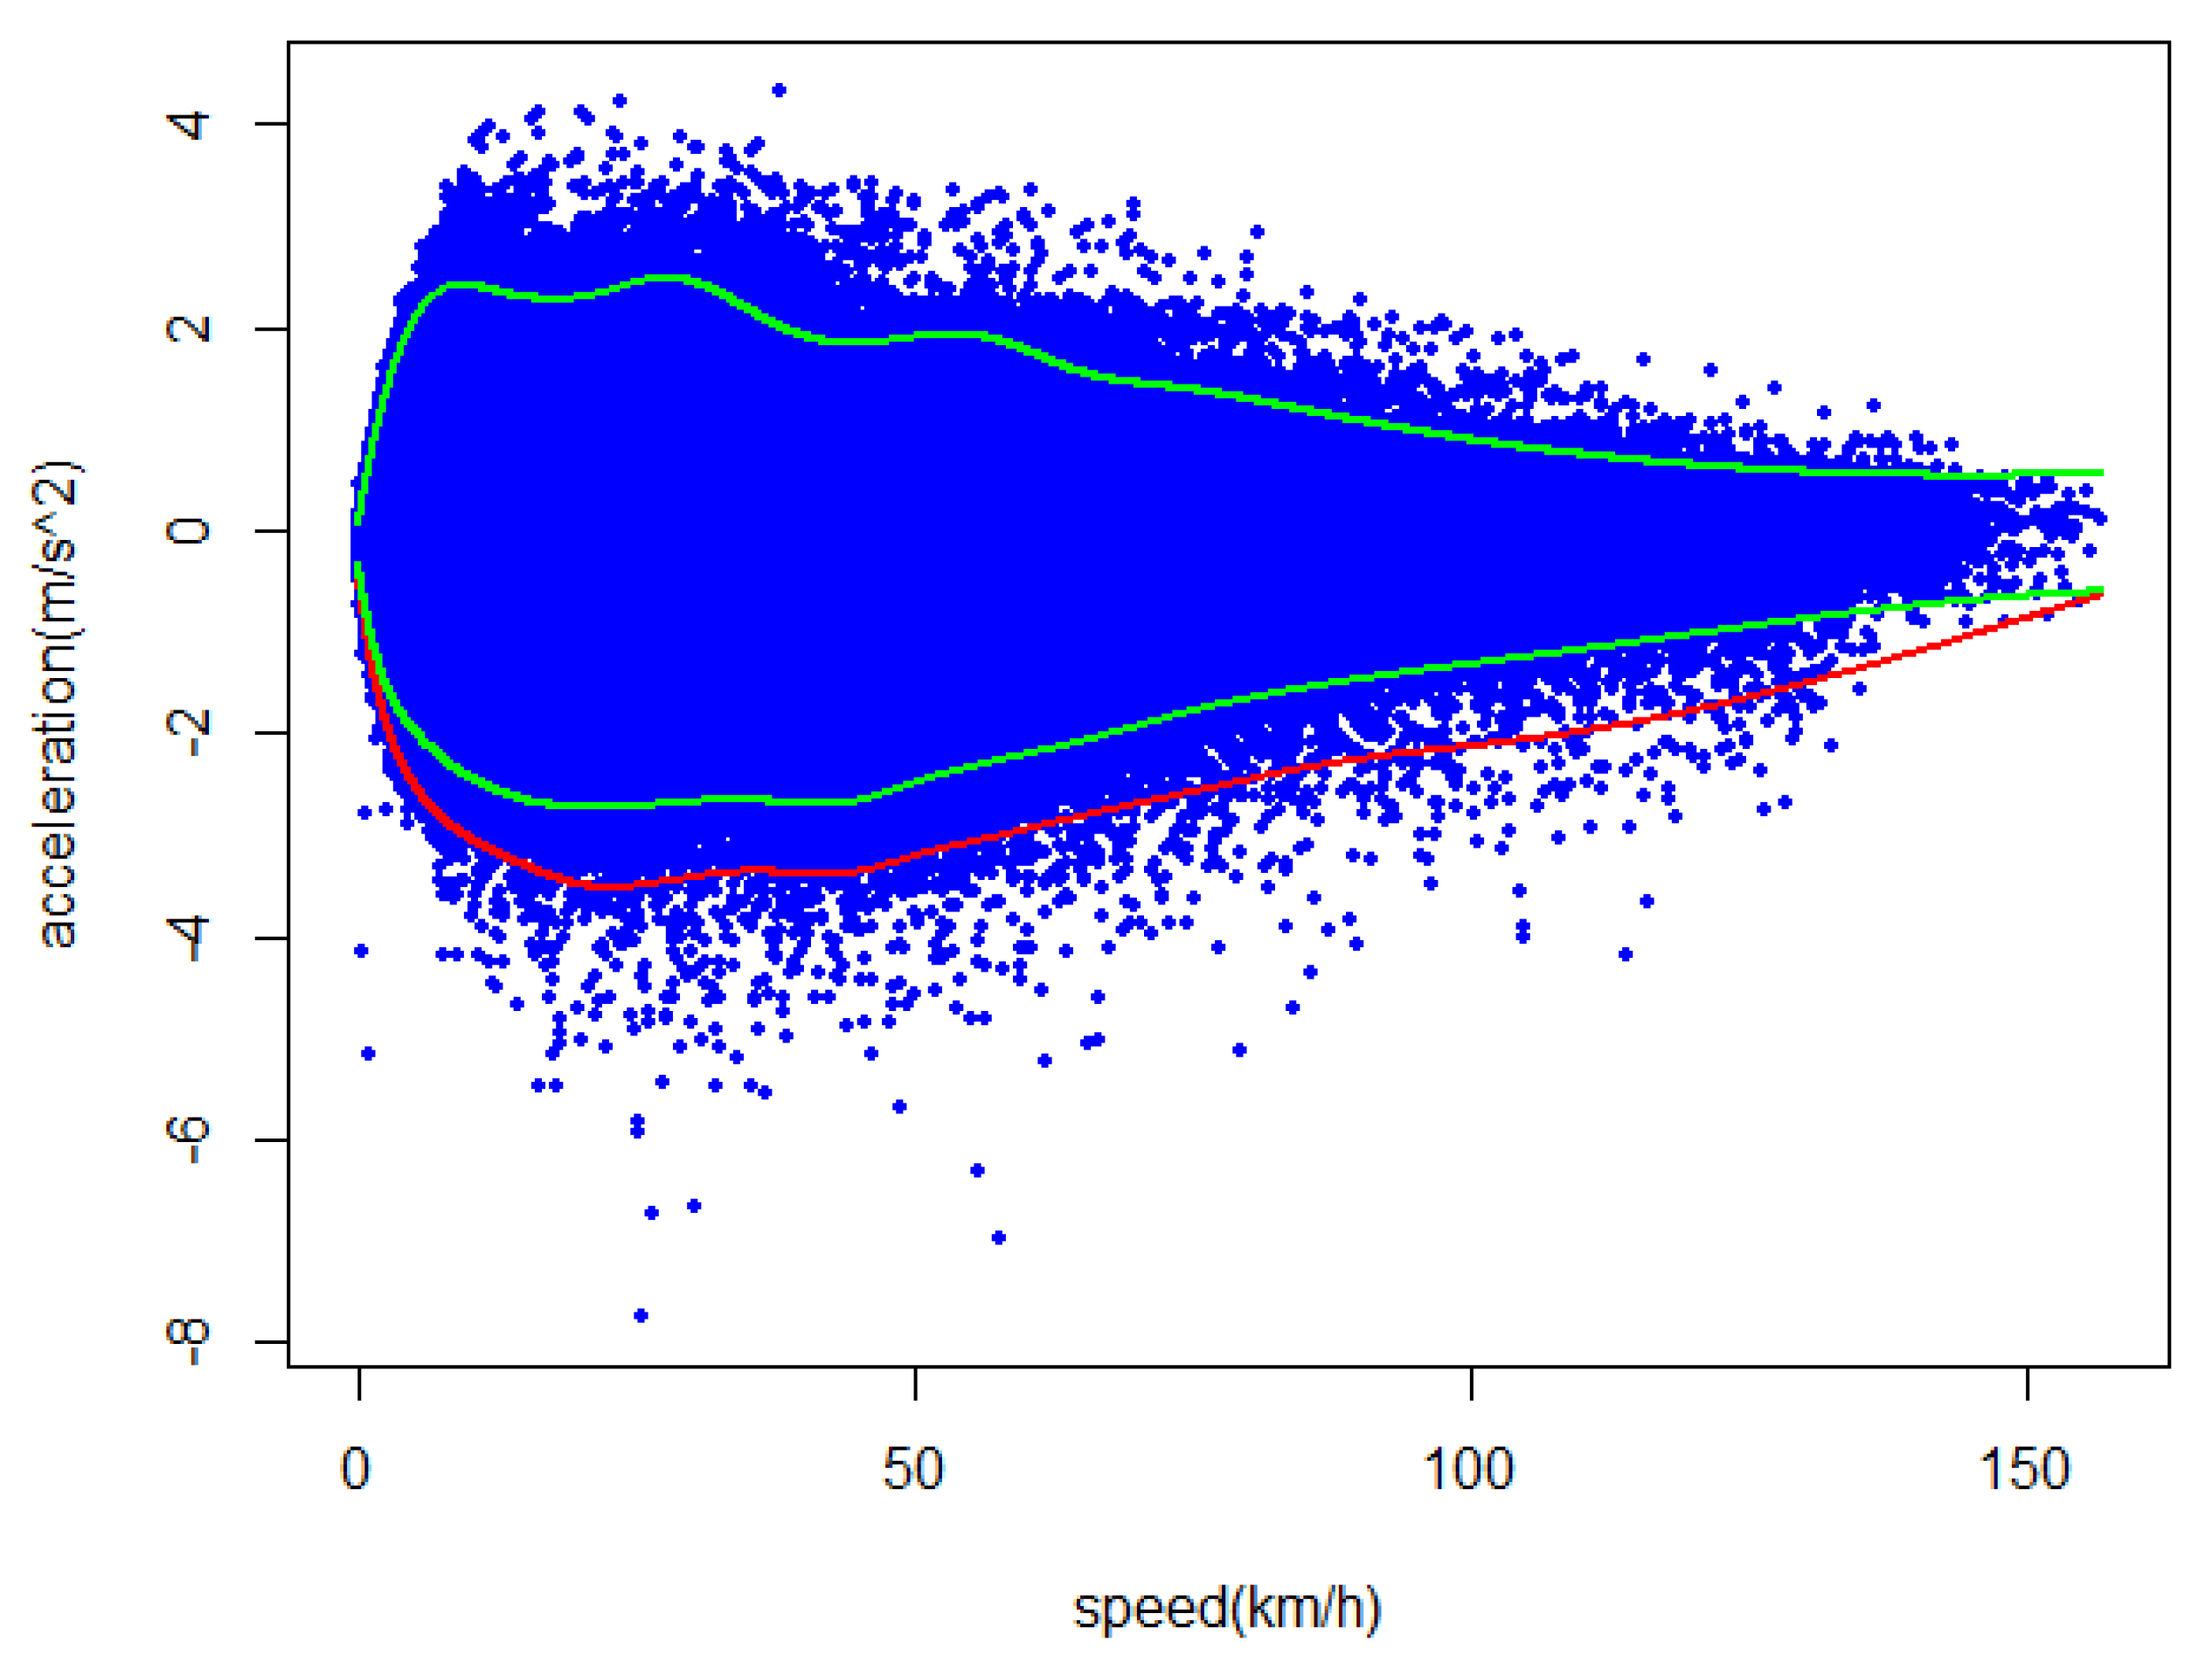
From NDS, 1000 journeys were randomly selected. The longitudinal velocity (km/h, hereafter referred to as velocity) and longitudinal acceleration (m/s2, hereafter referred to as acceleration) are rolling averaged with the time window of 1s. The joint velocity-acceleration distribution is shown in Figure 4. As the speed increases, the range of acceleration expands and then narrows, indicating that the driver’s acceleration and deceleration behavior becomes more violent in the low and medium speed intervals (0–15 m/s2) and becomes more cautious in the high speed interval. The driver’s control of acceleration is clearly related to the speed.
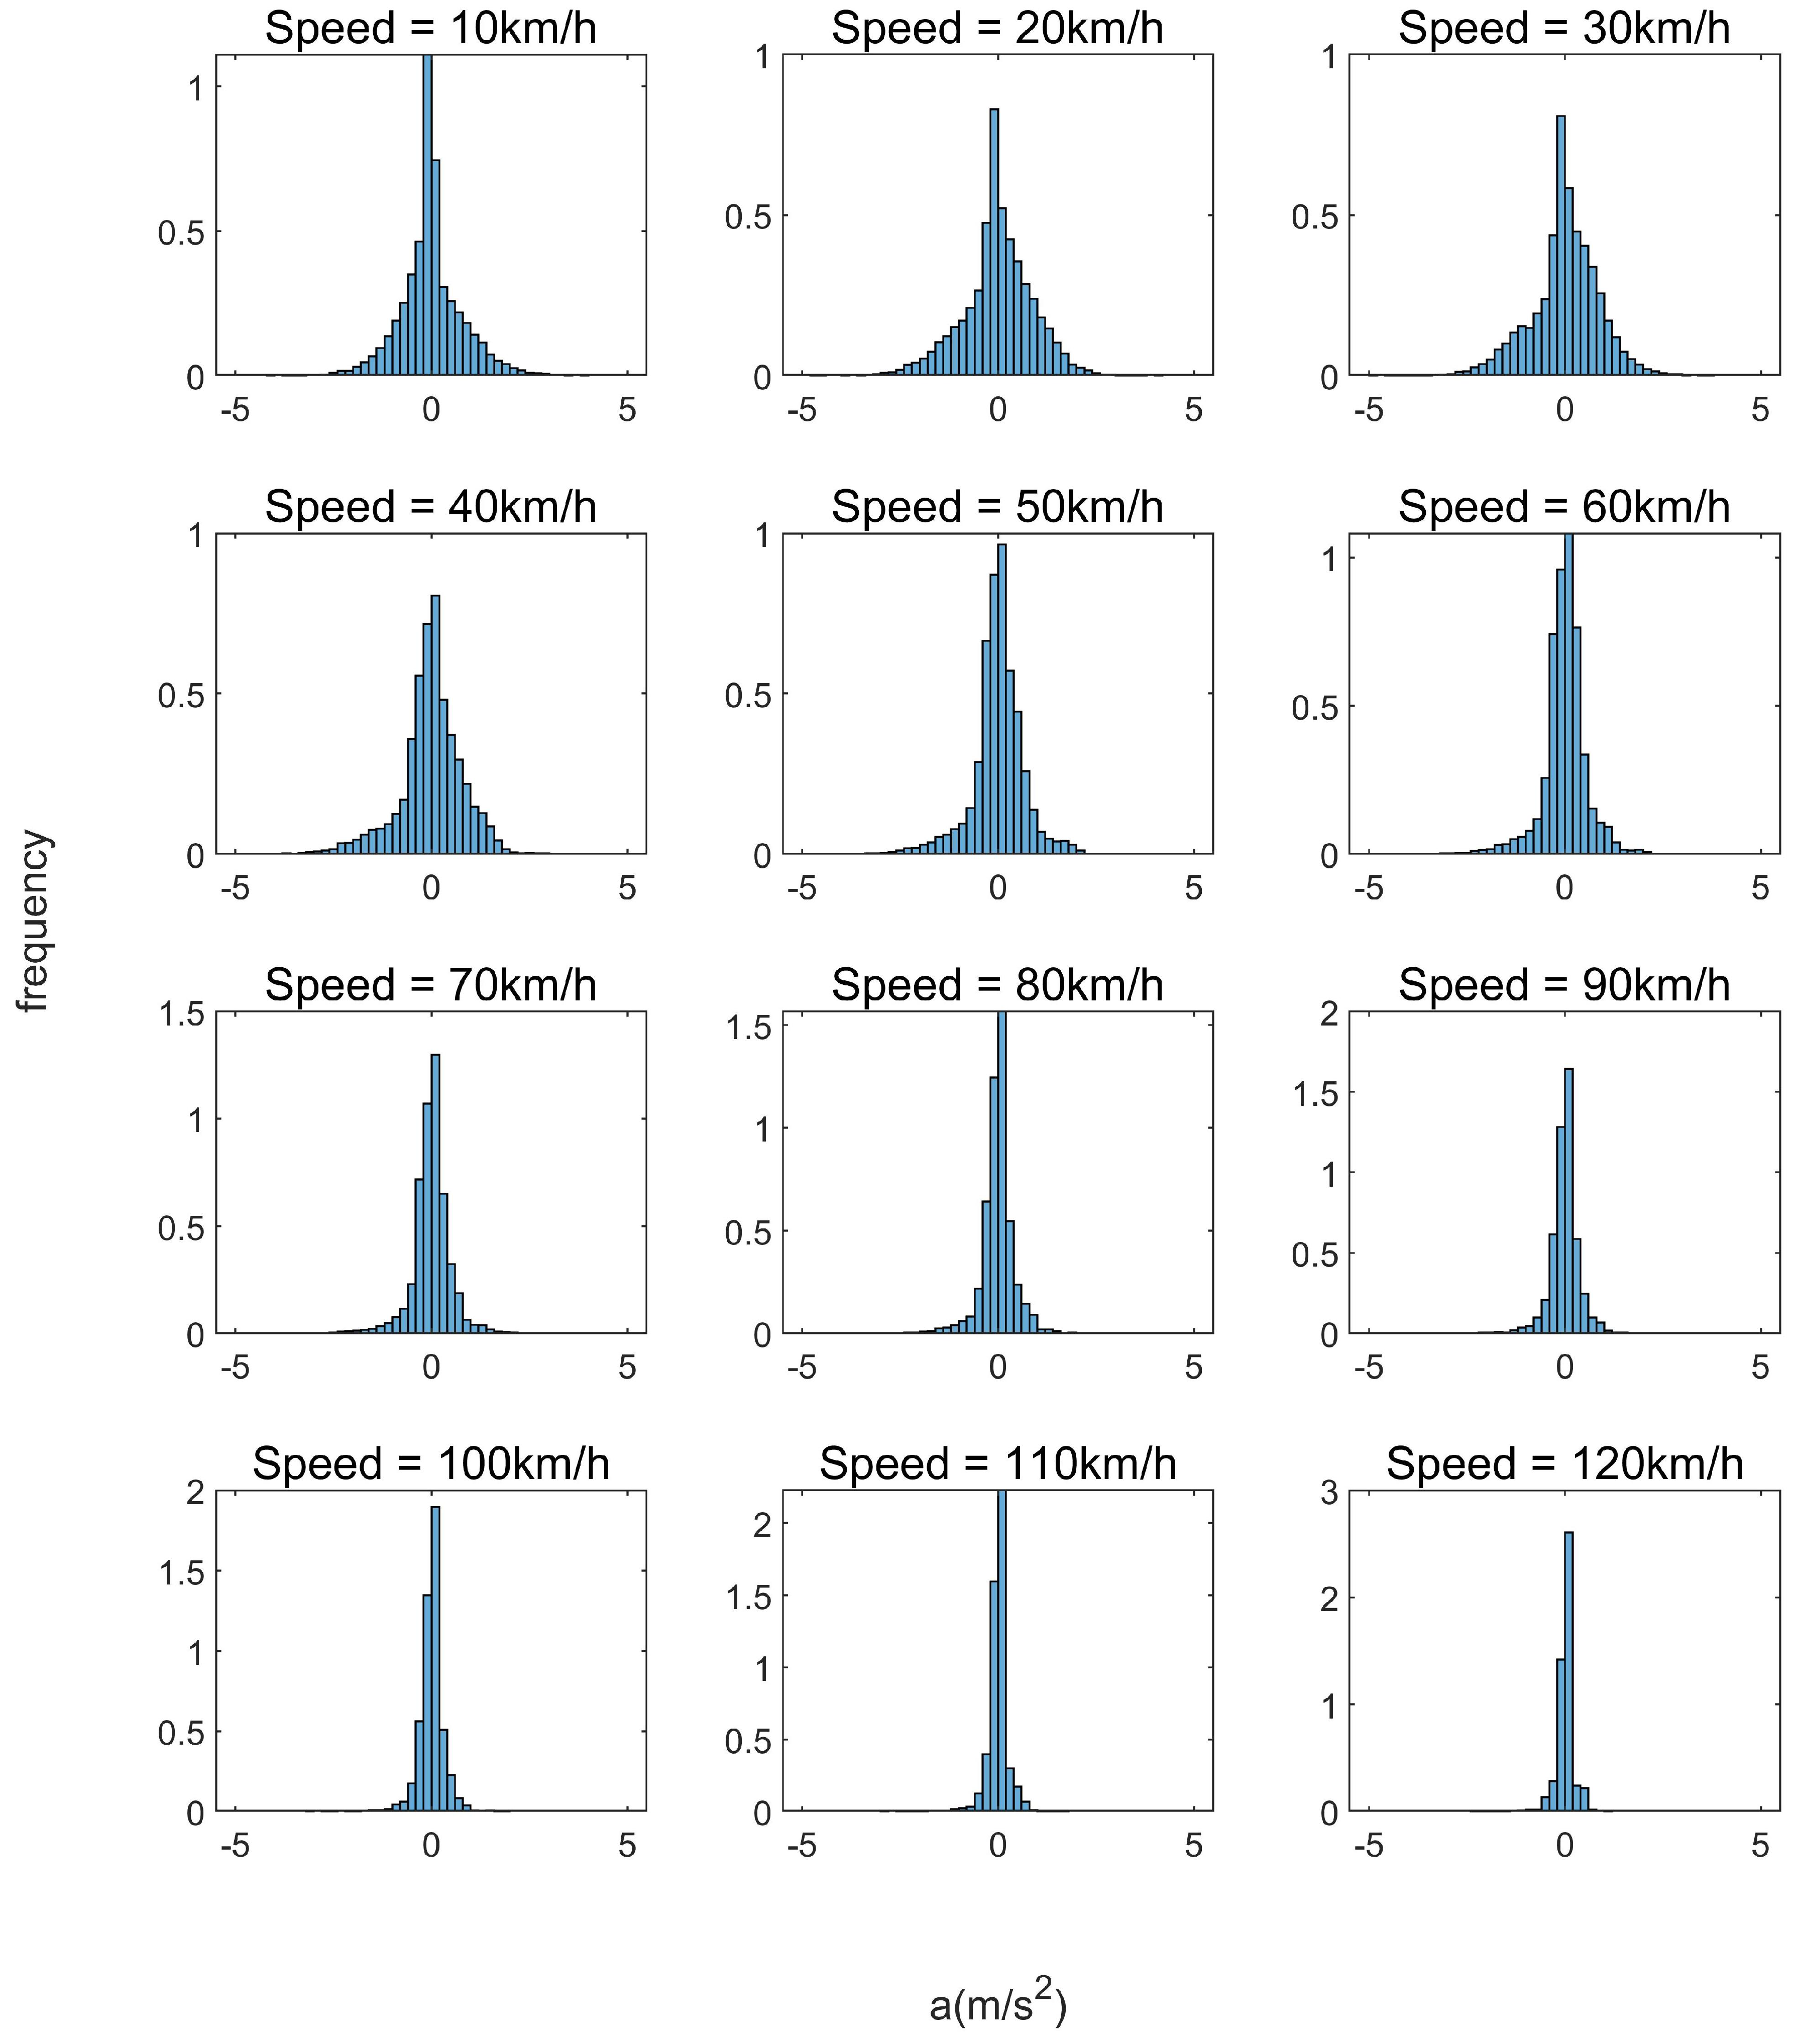
Figure 5 shows the probability density function of acceleration at speeds v = {10 km/h, 20 km/h, …, 120 km/h}. According to Liu Rui, the empirical distribution of acceleration in different speed intervals basically conforms to the Pareto distribution [23]. That is, under the same speed interval, the acceleration near 0 m/s2 has the largest proportion, and the probability of extreme acceleration and deceleration is low. In normal scenarios, drivers generally control the distance to the leading vehicle by adding or subtracting speed gently; in case of danger, drivers tend to take emergency braking measures to avoid collisions, which results in a large deceleration.
As shown in Figure 4, the 95% quantile-regression line (green) is selected as the boundary between the normal and aggressive driving behavior domains; the lower 99% quantile-regression line (red) is selected as the boundary between the aggressive and critical driving behavior domains.
3.3. Testing Scenarios Frequency Weights
Since the frequency of different scenarios in the driving process is different, their weighting in evaluation should also varies, thus introducing the testing scenario frequency weight . Data of one weekday are randomly selected from NDS for statistical analyze. Five of the eight test vehicles produced data with a cumulative driving time of 5 h, 22 min, and 24 s, and a cumulative mileage of 202 km. Among them, the car-following process totaled 162 km. In the proposed human-like testing scenarios, the proportion of mileage accounted for by the scenario is used as the scenario frequency weight, that is:
For safety testing scenarios, the frequency ratio of the occurrence of each event in NDS was used as the scenario frequency weight as shown in Table 2.
4. Evaluation Method for Safety and Human-Like
4.1. Scoring Method for Safety
The safety evaluation involves two indicators: and a. For , the boundaries among safe, critical, and dangerous driving behavior domains are all natural baselines for objective safety, denoted as and respectively. For a, the boundary between critical and aggressive driving behavior domains works as the baseline for subjective safety and denoted as hereafter.
The ACC system is scored after completing all scenarios of the safety testing. If a collision occurs during the test then the safety level is ’fail’ and . In the absence of a collision, the objective safety of the system is calculated withing the following equation.
where i is the scenario number, and is the objective safety level of the vehicle in scenario i. v is the speed of the host vehicle, is the objective safety level of the vehicle in scenario i when the speed is v, V is the maximum speed of the vehicle in the test scenario, and the speed resolution is 0.1 m/s; and are the values of the baselines and when the speed is v respectively.
The subjective safety of the ACC system with acceleration as indicator is calculated using the following equation.
where is the subjective safety level of the vehicle in scenario i. is the subjective safety level of the vehicle when the vehicle speed is v in scenario i. is the value of the baseline when the speed is v. is the acceleration value of the host vehicle when the speed of the vehicle is v in the test. In the same scenario, the comprehensive safety of the system is recorded as the mean value of the subjective and objective safety, and after completing all safety testing scenarios, the safety level of the system is obtained as follows.
where, N is the total number of human-like test scenarios, and is the scenario frequency weight of the i scenario. The value range of the safety level is [0, 1]. The closer the is to 1, the higher the safety level is, indicating that the vehicle is less likely to enter a dangerous state during the driving process.
4.2. Scoring Method for Human-Like
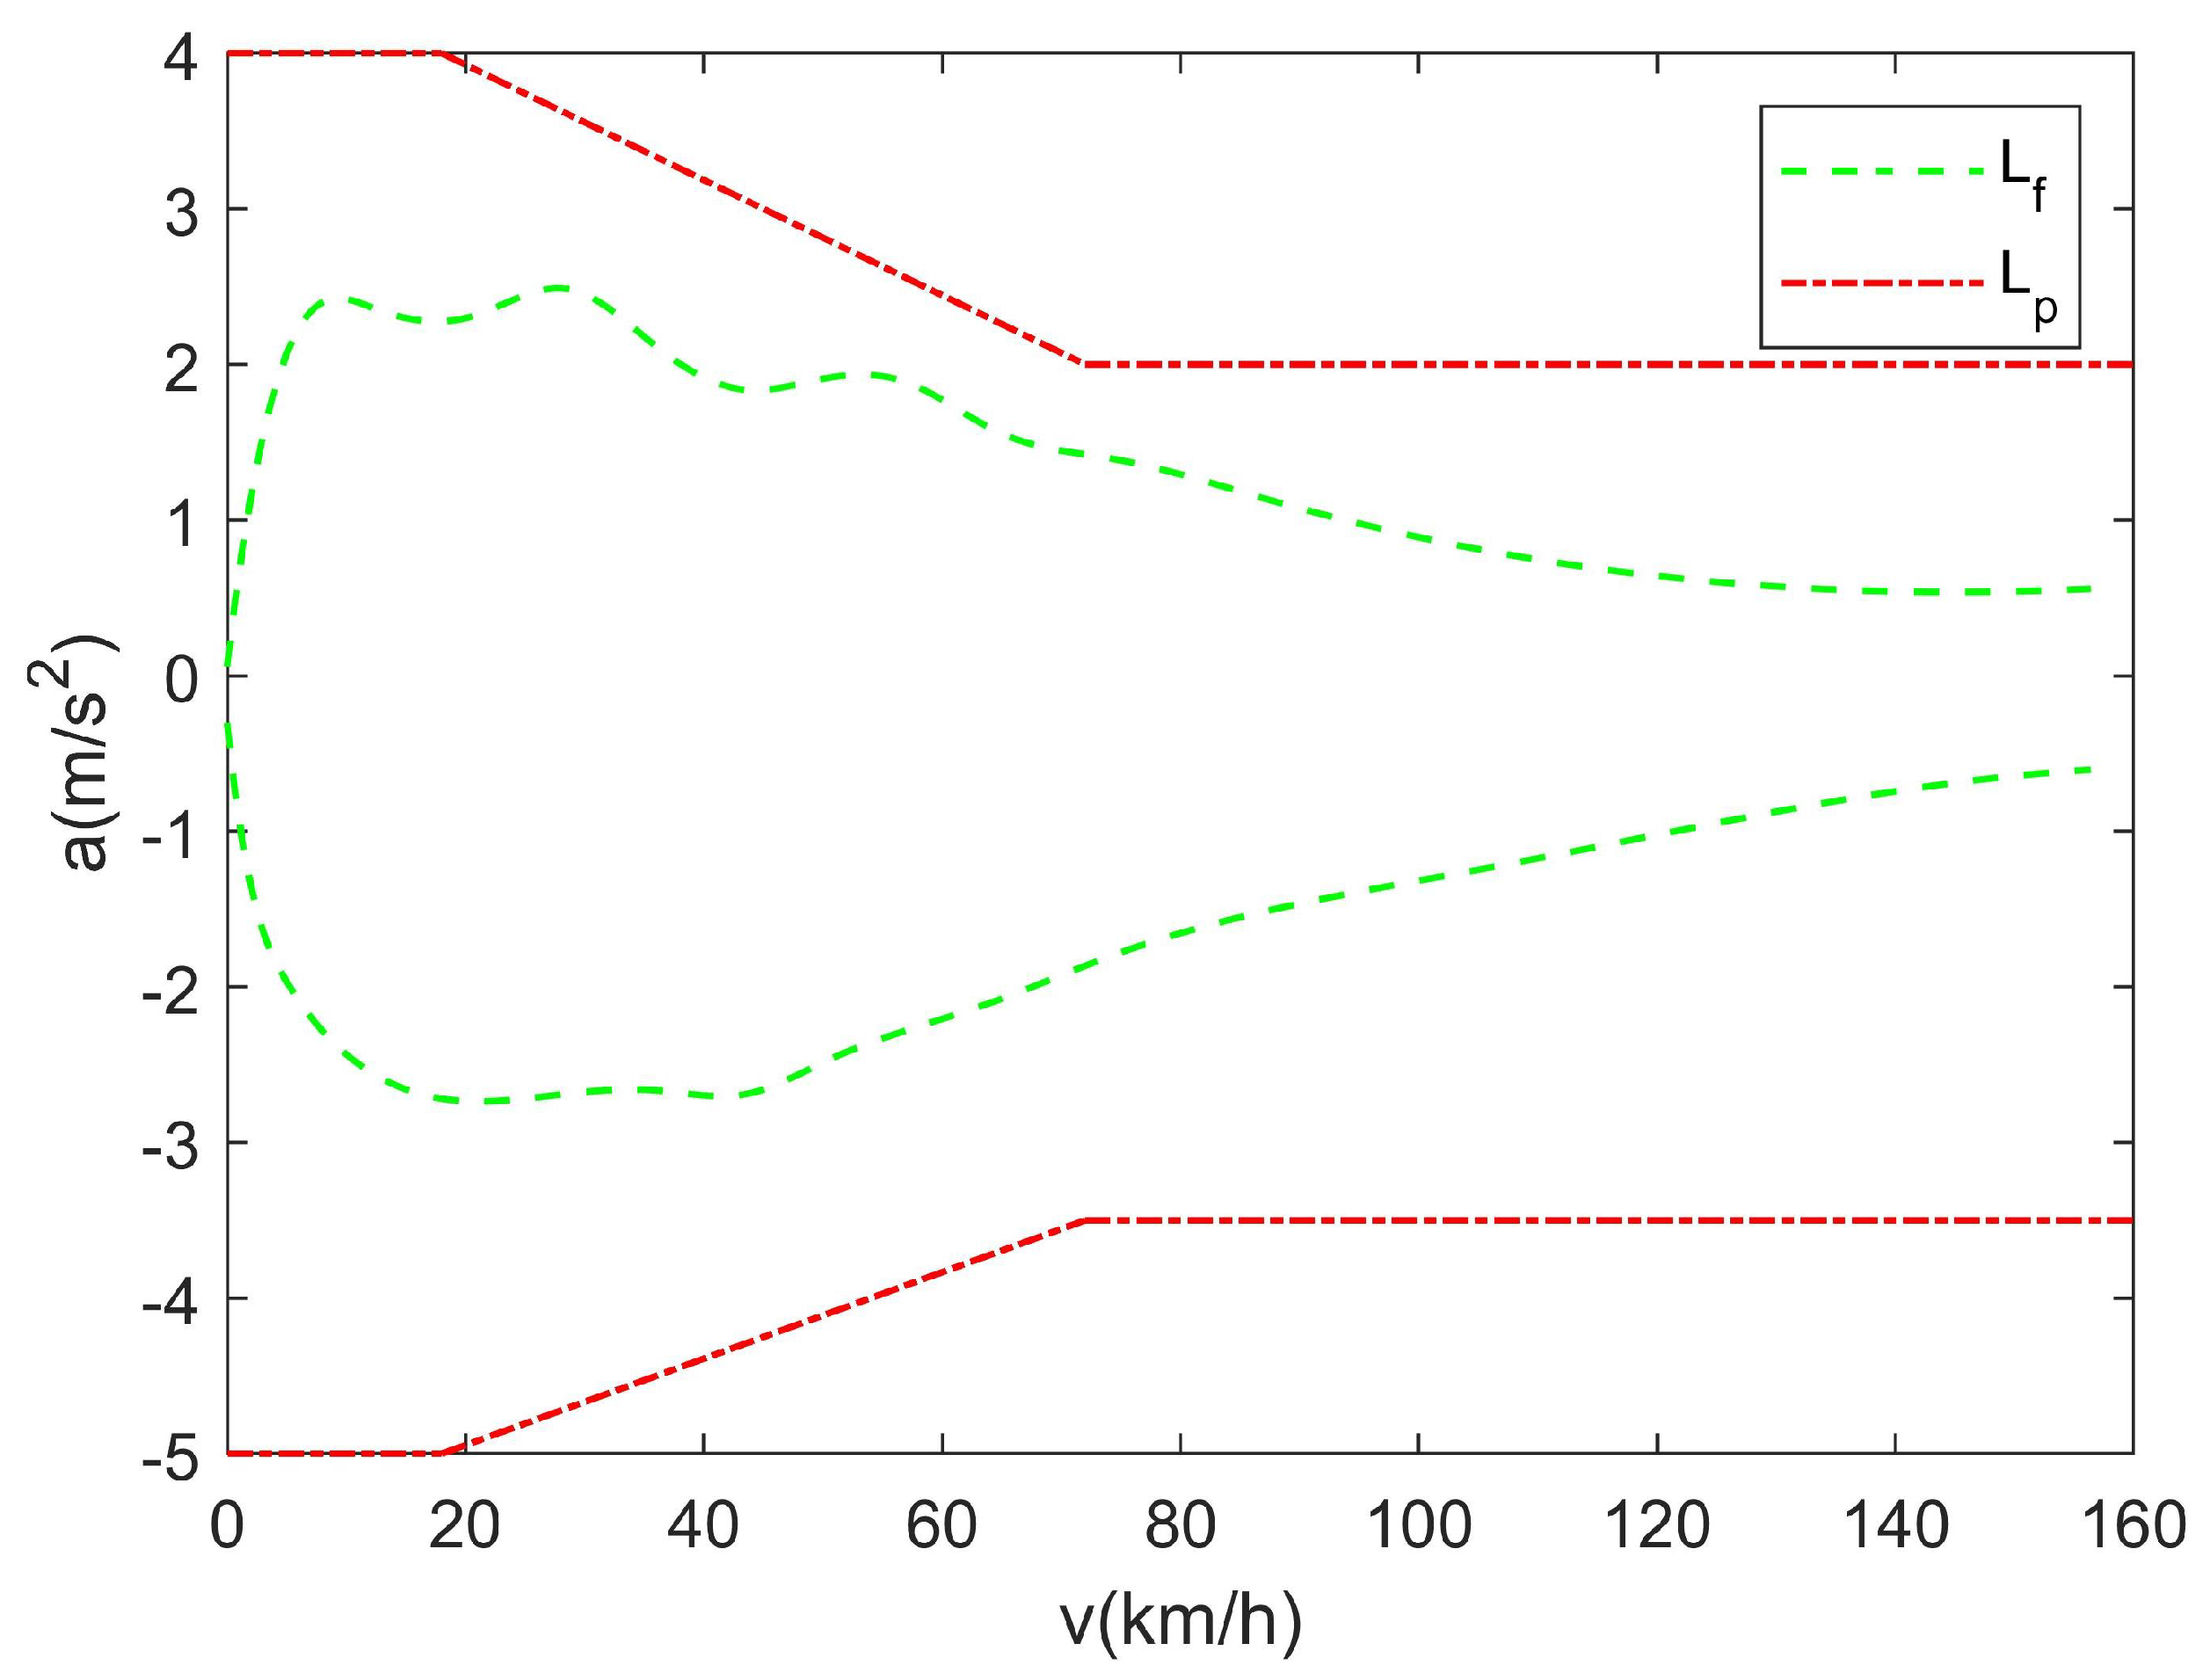
Acceleration is the direct reflection of drivers intention in longitudinal direction. When there is no critical issue, drivers seldom apply violent acceleration or hard deceleration. Therefore, as shown in Figure 6 the 95% quantile-regression line (green dash line) is selected as the reference for human-like evaluation. Acceleration out of this range may cause discomfort or unsafe feeling of drivers.
Besides, the requirement for acceleration during the operation of the ACC system in the international standard ISO15622 [11] is also applied and denoted as the red dotted line. As shown in the figure, the area enclosed by the green dash line is much smaller and narrower than the area enclosed by the red dotted line, indicating a higher requirement proposed from human driving characteristics than from the ISO standard.
Therefore, green dash line is defined as the full-score line . The acceleration within these lines could be regarded as a human-like behavior. Furthermore, the red dotted line is defined as the passing line. The behavior which exceeds these lines will fail the test.
The system is scored after completing all scenarios of the human-like test. If the acceleration exceeds the passing line in any scenario during the test, it can be considered that the ACC system does not conform to the international standard. Then the system is judged as ‘fail’ without subsequent scoring, and the human-like level is recorded as 0. On the premise of meeting the passing line, the calculation method of the human-like score in a single test scenario is:
where is the human-like level of the vehicle in scene i; v is the speed of the vehicle, is the human-like level of the vehicle when the speed is v in scene i, V is the maximum speed of the vehicle in this test scenario, and the resolution of the speed is 0.1 m/s; is the acceleration of the vehicle when the vehicle speed is v, is the acceleration value of when the speed is v, and is the acceleration value of when the velocity is v.
After completing all human-like testing scenarios, the human-like level of the ACC system is calculated as:
where, i is the scenario number, N is the total number of human-like testing scenarios, and is the scenario frequency weight of the i scenario. The value range of the vehicle human-like level is [0, 1]. The closer the is to 1, the higher the human-like level is, indicating that the vehicle motion control conforms to the driving habits of human drivers.
5. Test and Results
5.1. Test Vehicle and Data Processing
A vehicle equipped with the ACC system was selected for the test. On a flat and straight road, the leading vehicle is controlled by an experienced driver according to the scenario description and the host vehicle turns on the ACC system for motion control. The following data were recorded throughout the field experiment: speed and acceleration of the host vehicle and the leading vehicle (if any), distance between them and TTC. The recording frequency is 100 Hz. The data are smoothed with a sliding time window of 0.1 s, and then safety and human-like evaluations are performed separately.
5.2. Results and Discussion
5.2.1. Results of Safety Evaluation
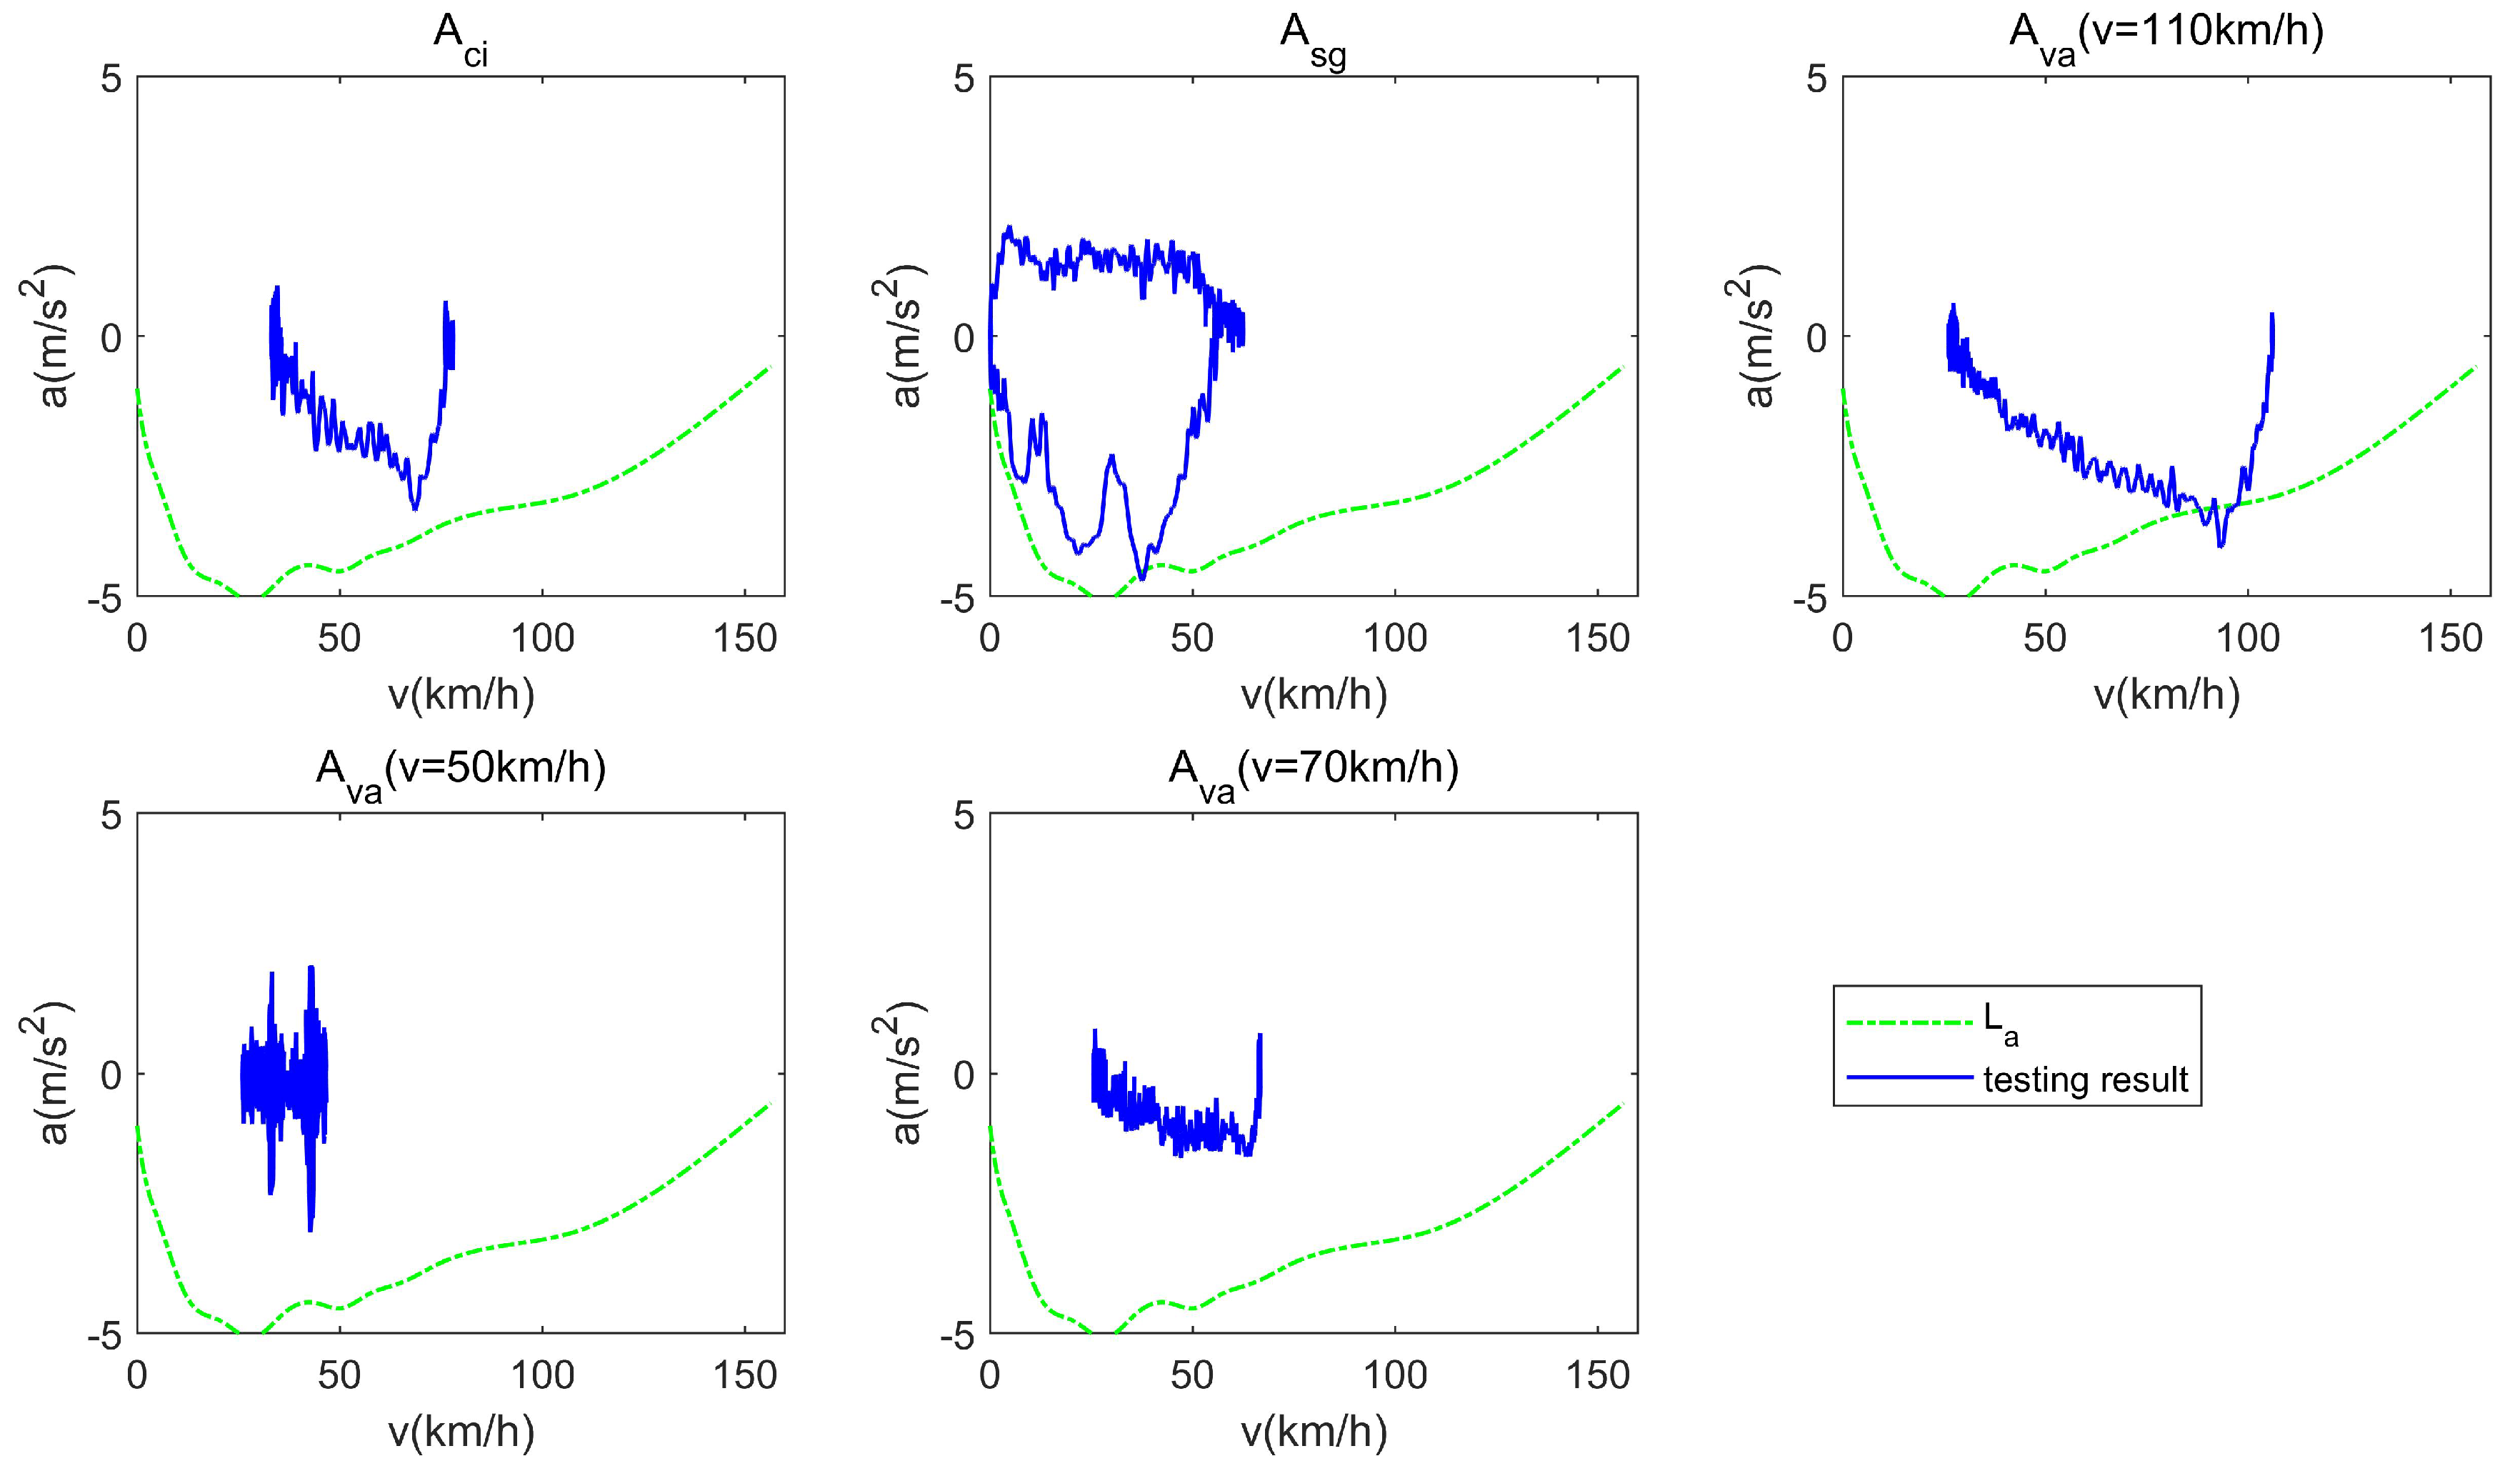
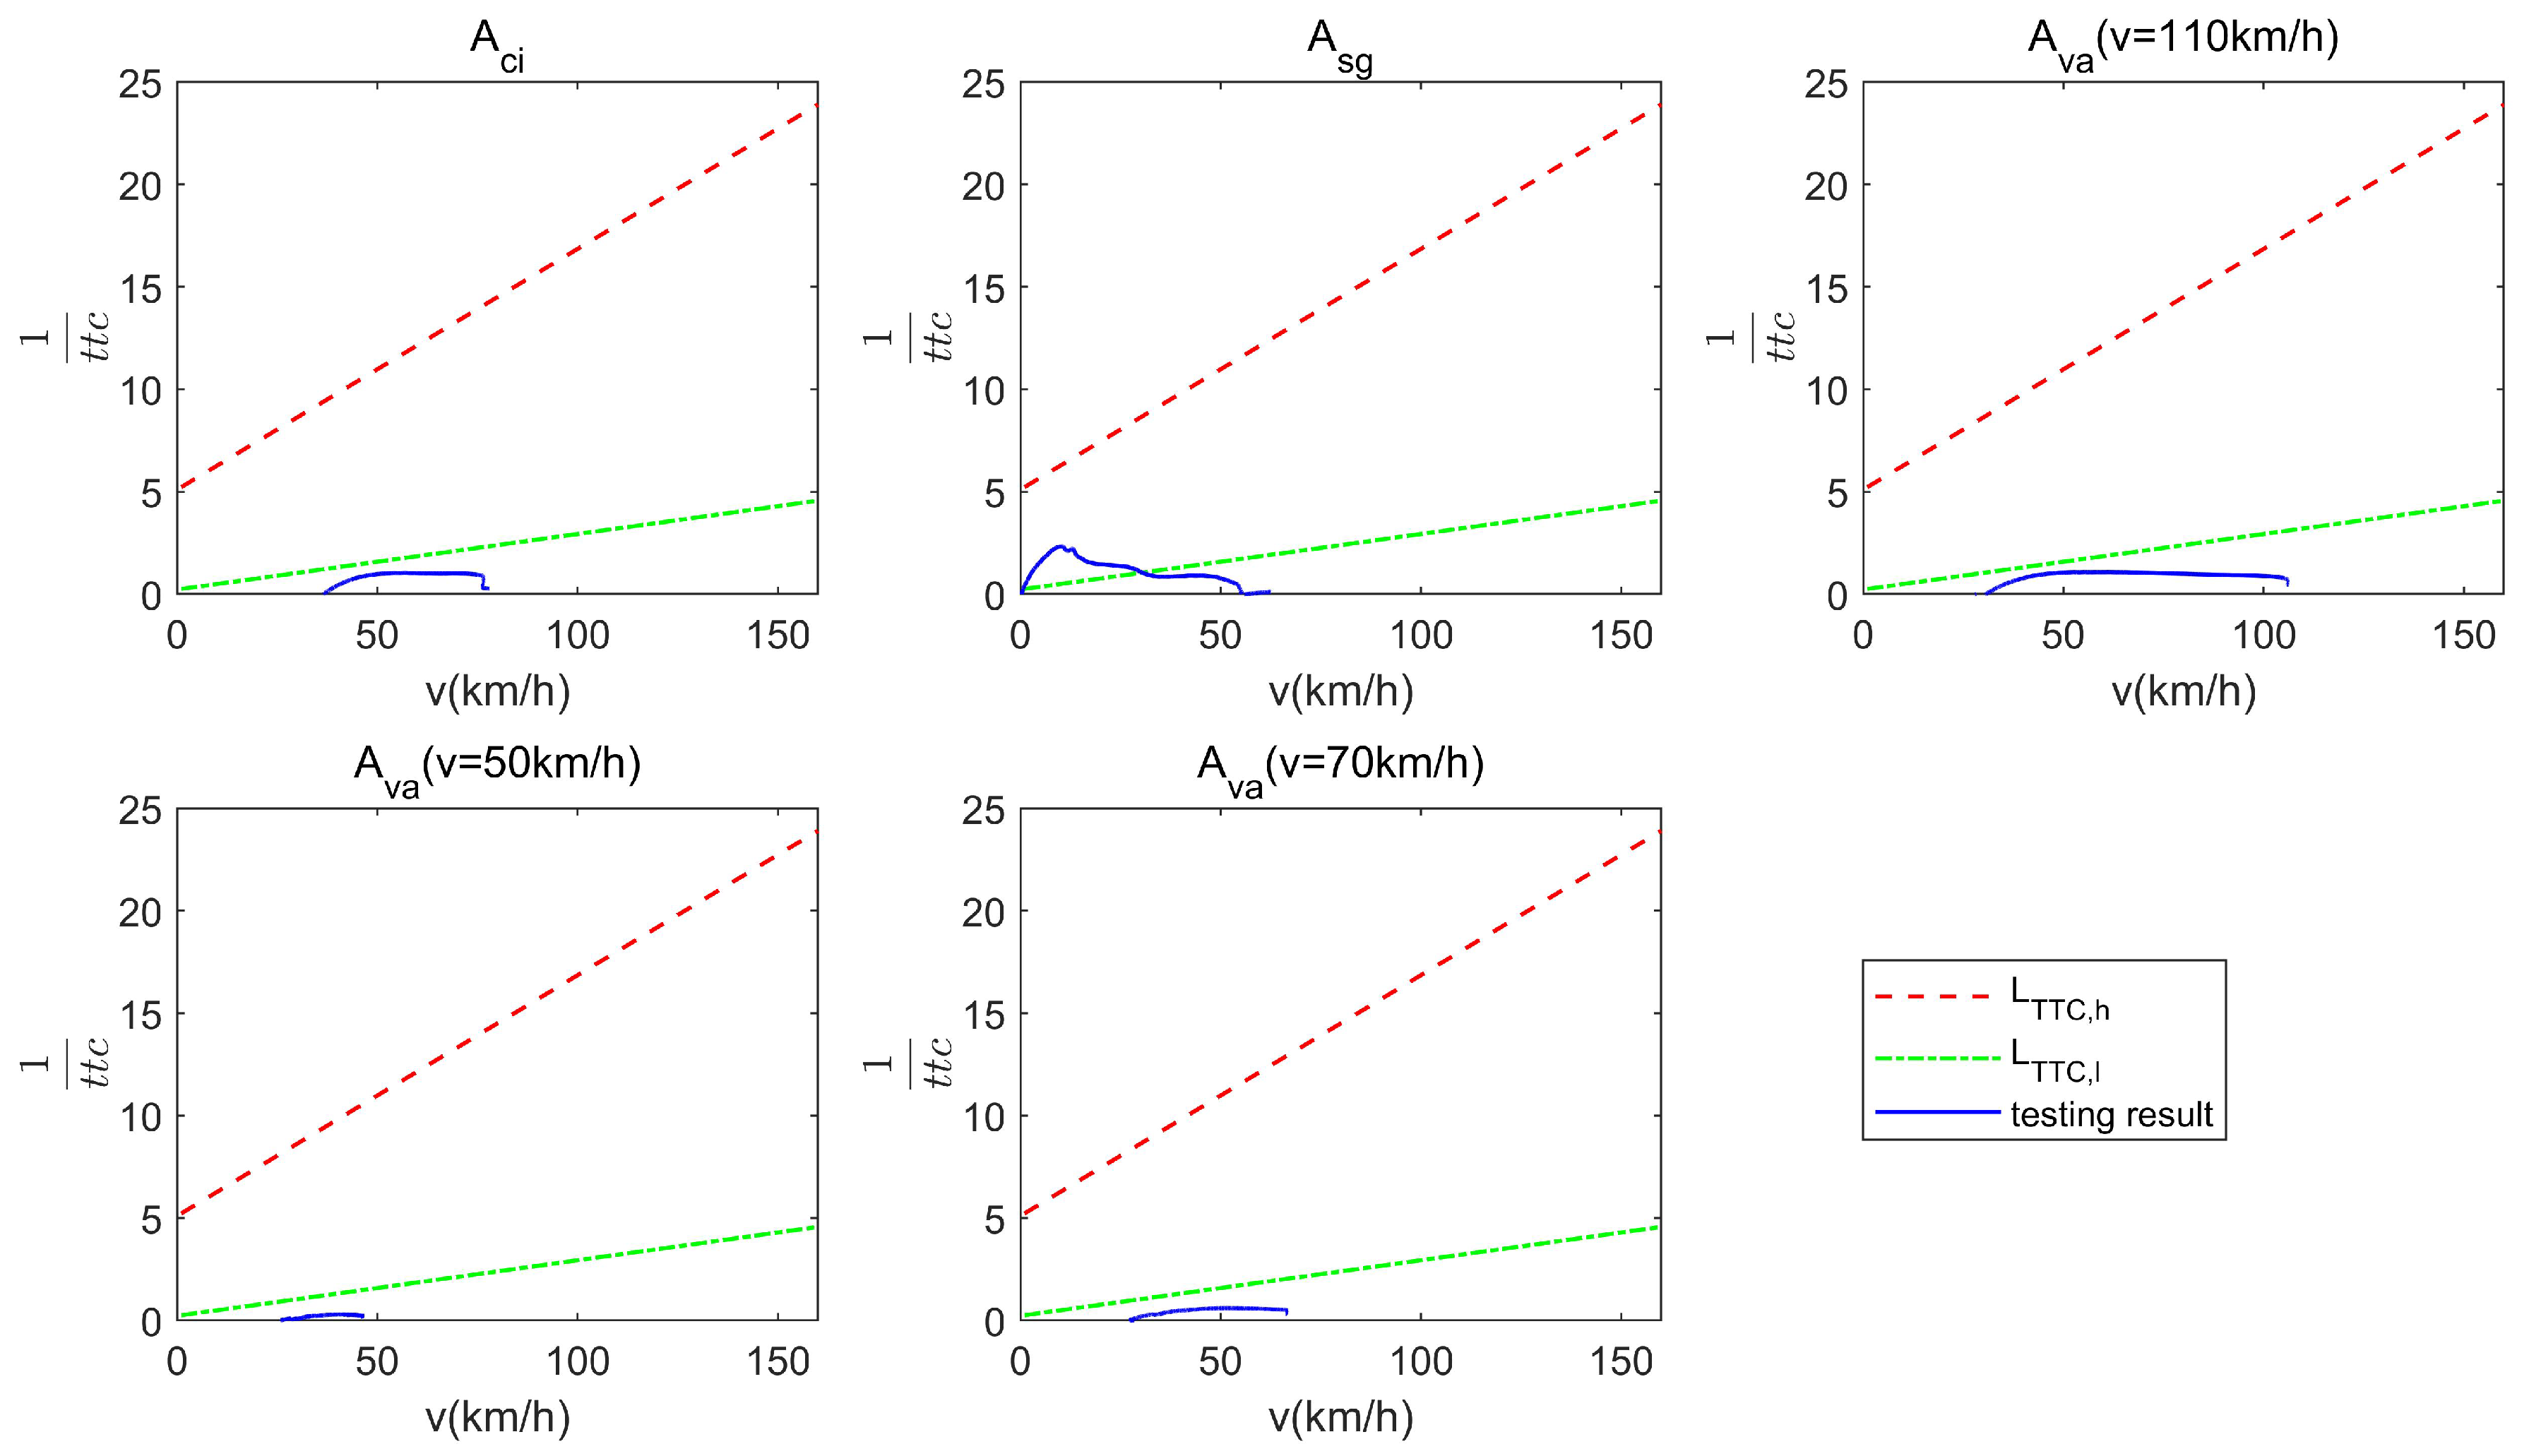
Figure 7 and Figure 8 describe the safety testing results in terms of and a respectively. Since a negative indicates the host vehicle is driving away from the leading vehicle, indicating a safe scenarios, the Figure 7 only demonstrates the positive with a collision potential.
As shown in Figure 7, in all of the five testing scenarios, the testing vehicle did not exceed the baseline . Only in scenario (i.e., stop and go scenario), the vehicle reached the baseline and got a score of . The rest of the four scenarios all got the , where i = 1, 3, 4, 5.
Figure 8 demonstrates the safety testing results in terms of a. In scenario (the testing vehicle approaching the 40 km/h leading vehicle with speed of 110 km/h), a exceeded the baseline when the speed was around 100 km/h and got a score of . The rest of the four scenarios all got the , where i = 1, 2, 4, 5. The final score of safety evaluation was .
5.2.2. Results of Human-Like Evaluation
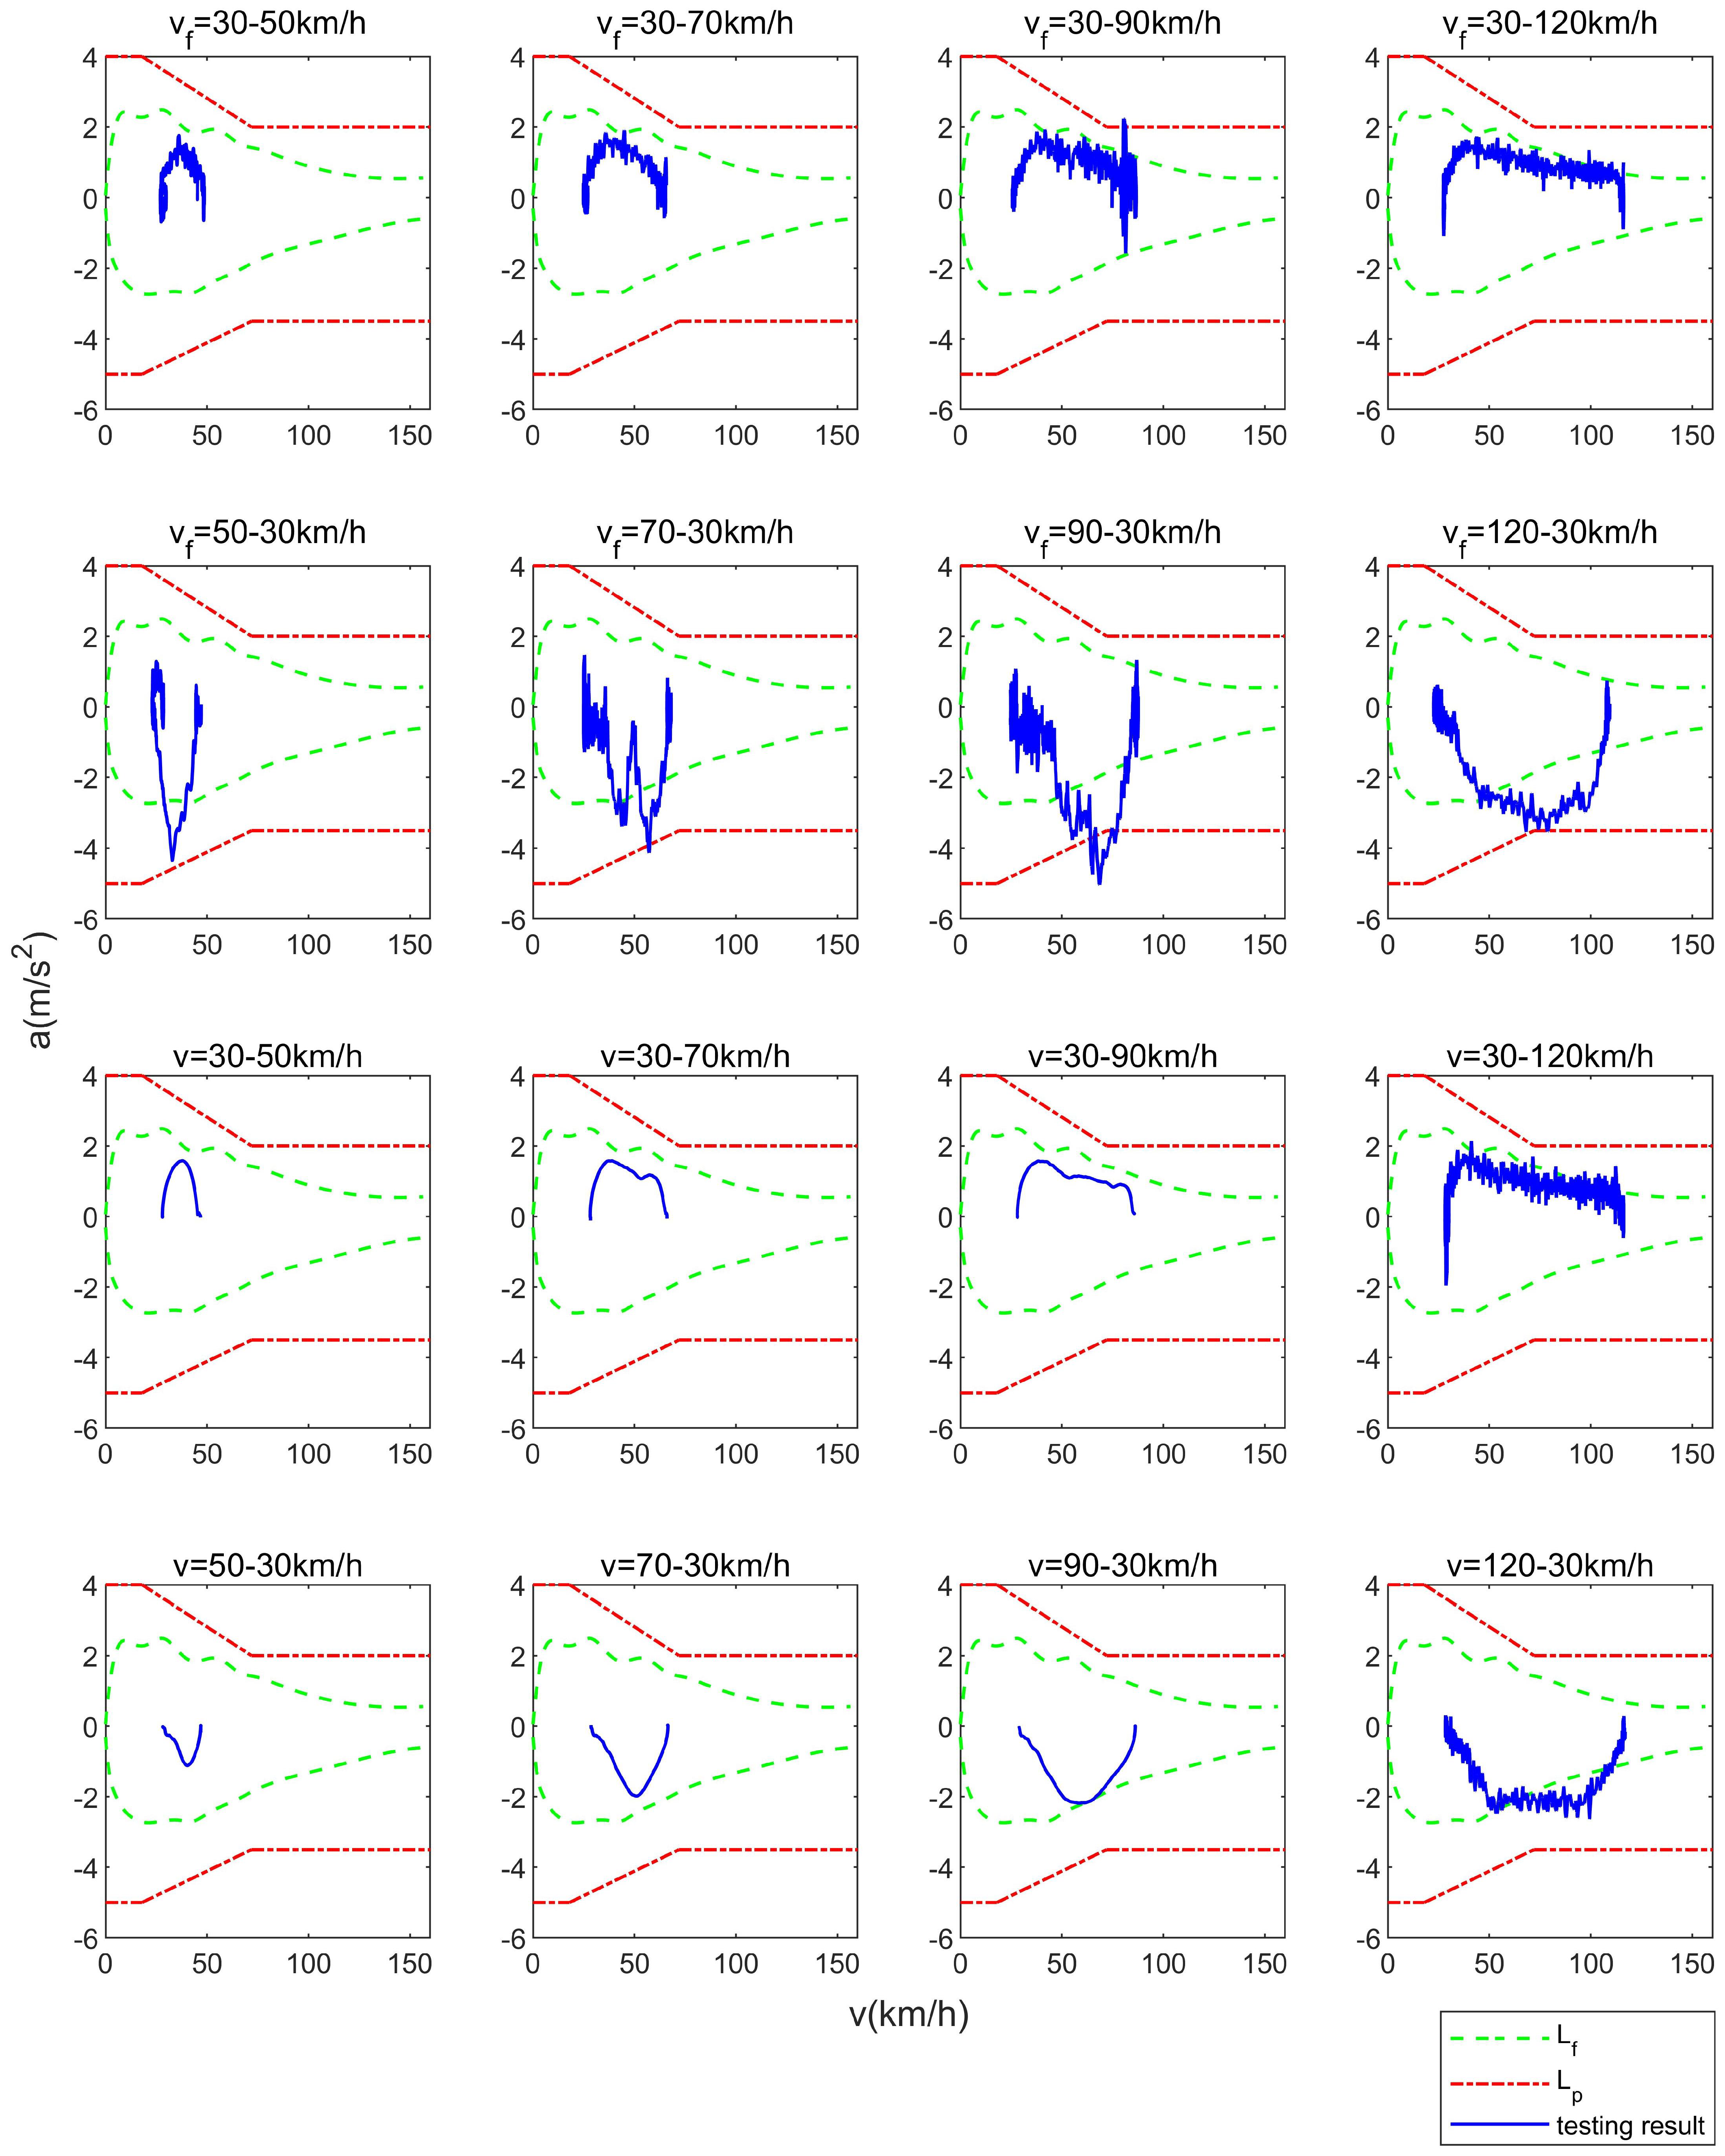
Figure 9 demonstrates the human-like testing results. The upper two rows of the subfigures demonstrate the car-following scenarios with a speeding up front leading vehicle and with a slowing down front leading vehicle separately. here is the speed change of the front vehicle. The lower two rows demonstrate the free-cruising scenarios separately. The dotted lines stand for the passing line from ISO 15622 while the dash lines are the full-score line from the human driving characteristics. The blue line demonstrates the real acceleration profile generated from field tests.
Among all 16 testing scenarios, the testing vehicle’s behavior runs out of the passing line in 4 scenarios. Therefore, the final score of the human-like evaluation was .
All of the four failed scenarios are car-following scenarios. Compared with free cruising scenarios, the car-following scenarios are more challenging, as the longitudinal behavior decision should be restricted with a reasonable distance to the leading vehicle. In these four failed scenarios, three of them are with a decelerating leading vehicle as the decreasing following range may cause a safety issue, forcing the system to apply a relative hard brake to avoid entering a critical state. One possible improvement of the system that might be undertaken is to bring forward the timing of braking to flatten the decelerating curve. Another failed scenario is with an accelerating vehicle: the excessive acceleration may give the drivers an aggressive impression.
6. Conclusions
This paper proposed an ACC system testing and evaluation method based on human driver characteristics generated from naturalistic driving data, including testing scenarios and testing result evaluation method. The usage scenarios of the ACC system are defined and testing scenarios are then designed based on collision likelihood. The statistical analysis of real human driving data was conducted to obtain the speed- and speed-acceleration distributions to describe human drivers’ perception of safety and driving habits. Quantiles of and acceleration are calculated to represent the majority behaviors.
Within the speed- distribution, the safe, critical, and dangerous driving behavior domains were divided by 5% and 95% quantiles, and the two boundaries were used as objective safety evaluation baseline. The normal, aggressive, and critical driving behavior domains were divided within the velocity-acceleration distribution by 5%, 95%, and 1% quantiles separately, and the boundaries were used as the baseline for human-like and subjective safety evaluation. Then the result evaluation method is accordingly designed.
An ACC system from the market is tested and evaluated. The system passed the safety tests with a score of 0.9496 (full score = 1) while failed the human-like tests. The results show the system has a more aggressive acceleration strategy and a delay on brake timing compared with human drivers.
The proposed testing and evaluation method has the following improvements compared with the existing testing protocols.
(1) The testing scenarios are derived from naturalistic driving data, improving the consistency with real driving scenarios. By introducing the scenario frequency coefficients, the final test results can reflect the real performance of the ACC system in real usage.
(2) The evaluation method is a supplement to the existing functional and safety evaluation of ACC systems for the human-like evaluation, which can help to improve the riding-comfort, user-trust, and user-acceptance of the system.
This study has the limitation that the proposed method is only applied to one ACC system due to time and budget. The comparison of the testing and evaluation results could further validate the method. Future works could apply the conception of human-like evaluation on other ADAS systems like LKS and also automated driving systems.
Author Contributions
Conceptualization, L.L., Q.Z., R.L., X.Z. and Z.M.; methodology, L.L., Q.Z. and X.Z.; validation, L.L.; investigation, L.L. and R.L.; data curation, Q.Z., X.Z. and Z.M.; writing—original draft preparation, L.L.; writing—review and editing, L.L. and X.Z.; visualization, L.L.; supervision, X.Z. All authors have read and agreed to the published version of the manuscript.
Funding
This research was funded by Shenzhen Future Intelligent Traffic Innovation Center(SFITIC), grant number TJ2020108591.
Institutional Review Board Statement
Not applicable.
Informed Consent Statement
Not applicable.
Data Availability Statement
The data presented in this study are available on request from the corresponding author. The data are not publicly available due to privacy.
Conflicts of Interest
The authors declare no conflict of interest.
References
- Manolis, D.; Spiliopoulou, A.; Vandorou, F.; Papageorgiou, M. Real time adaptive cruise control strategy for motorways. Transp. Res. Part C Emerg. Technol. 2020, 115, 102617. [Google Scholar] [CrossRef]
- Gong, X.; Ge, W.; Yan, J.; Zhang, Y.; Gongye, X. Review on the Development, Control Method and Application Prospect of Brake-by-Wire Actuator. Actuators 2020, 9, 15. [Google Scholar] [CrossRef] [Green Version]
- Du, H.; Man, Z.; Zheng, J.; Cricenti, A.; Zhao, Y.; Xu, Z.; Wang, H. Robust control for vehicle lane-keeping with sliding mode. In Proceedings of the IEEE 2017 11th Asian Control Conference (ASCC), Gold Coast, Australia, 17–20 December 2017; pp. 84–89. [Google Scholar]
- Han, I.C.; Luan, B.C.; Hsieh, F.C. Development of autonomous emergency braking control system based on road friction. In Proceedings of the 2014 IEEE International Conference on Automation Science and Engineering (CASE), New Taipei, Taiwan, 18–22 August 2014; pp. 933–937. [Google Scholar]
- De Beaucorps, P.; Streubel, T.; Verroust-Blondet, A.; Nashashibi, F.; Bradai, B.; Resende, P. Decision-making for automated vehicles at intersections adapting human-like behavior. In Proceedings of the 2017 IEEE Intelligent Vehicles Symposium (IV), Los Angeles, CA, USA, 11–14 June 2017; pp. 212–217. [Google Scholar]
- Häuslschmid, R.; von Buelow, M.; Pfleging, B.; Butz, A. SupportingTrust in autonomous driving. In Proceedings of the 22nd International Conference on Intelligent User Interfaces, Limassol, Cyprus, 13–16 March 2017; pp. 319–329. [Google Scholar]
- Waytz, A.; Heafner, J.; Epley, N. The mind in the machine: Anthropomorphism increases trust in an autonomous vehicle. J. Exp. Soc. Psychol. 2014, 52, 113–117. [Google Scholar] [CrossRef]
- Zihsler, J.; Hock, P.; Walch, M.; Dzuba, K.; Schwager, D.; Szauer, P.; Rukzio, E. Carvatar: Increasing trust in highly-automated driving through social cues. In Proceedings of the 8th International Conference on Automotive User Interfaces and Interactive Vehicular Applications, Ann Arbor, MI, USA, 24–26 October 2016; pp. 9–14. [Google Scholar]
- Wei, J.; Dolan, J.M.; Litkouhi, B. A learning-based autonomous driver: Emulate human driver’s intelligence in low-speed car following. In Unattended Ground, Sea, and Air Sensor Technologies and Applications XII; International Society for Optics and Photonics: Orlando, FL, USA, 2010; Volume 7693, p. 76930L. [Google Scholar]
- Wang, X.; Zhu, M.; Chen, M.; Tremont, P. Drivers’ rear end collision avoidance behaviors under different levels of situational urgency. Transp. Res. Part C Emerg. Technol. 2016, 71, 419–433. [Google Scholar] [CrossRef] [Green Version]
- ISO 15622:2018. Intelligent Transport Systems—Adaptive Cruise Control Systems—Performance Requirements and Test Procedures; International Organization for Standardization, Vernier: Geneva, Switzerland, 2018. [Google Scholar]
- China Academy of Transportation Science, W.U. GB/T 20608-2006. Intelligent Transportation Information Systems—Adaptive Cruise Control Systems—Performance Requirements and Test Procedures; Standards Press of China: Beijing, China, 2006. [Google Scholar]
- Sayer, J. Adaptive Cruise Control (ACC) Operating Characteristics and User Interface: Standard J2399; Society of Automotive Engineers: Warrendale, PA, USA, 2003. [Google Scholar]
- American Automobile Association. Advanced Driver Assistance Technology Names: AAA’s Recommendation for Common Naming of Advanced Safety Systems. AAA News Room, 25 January 2019. [Google Scholar]
- Amy, H.; John Pierowicz, R.M. Concept of Operations and Voluntary Operational Requirements for Forward Collision Warning Systems (CWS) and Adaptive Cruise Control (ACC) Systems on Board Commercial Motor Vehicles; Technical Report; US Department of Transportation, Federal Motor Carrier Safety Administration: Washington, DC, USA, 2005.
- Li, Y.; Li, Z.; Wang, H.; Wang, W.; Xing, L. Evaluating the safety impact of adaptive cruise control in traffic oscillations on freeways. Accid. Anal. Prev. 2017, 104, 137–145. [Google Scholar] [CrossRef] [PubMed]
- Qiu, S.; Rachedi, N.; Sallak, M.; Vanderhaegen, F. A quantitative model for the risk evaluation of driver-ADAS systems under uncertainty. Reliab. Eng. Syst. Saf. 2017, 167, 184–191. [Google Scholar] [CrossRef]
- Stark, L.; Düring, M.; Schoenawa, S.; Maschke, J.E.; Do, C.M. Quantifying Vision Zero: Crash avoidance in rural and motorway accident scenarios by combination of ACC, AEB, and LKS projected to German accident occurrence. Traffic Inj. Prev. 2019, 20, S126–S132. [Google Scholar] [CrossRef] [PubMed] [Green Version]
- Dingus, T.A.; Klauer, S.G.; Neale, V.L.; Petersen, A.; Lee, S.E.; Sudweeks, J.; Perez, M.A.; Hankey, J.; Ramsey, D.; Gupta, S.; et al. The 100-Car Naturalistic Driving Study, Phase II-Results of the 100-Car Field Experiment; Technical Report; Department of Transportation, National Highway Traffic Safety Administration, Springfield: Fairfax County, VA, USA, 2006.
- Antin, J.F. Design of the in-Vehicle Driving Behavior and Crash Risk Study: In Support of the SHRP 2 Naturalistic Driving Study; Transportation Research Board: Washington, DC, USA, 2011. [Google Scholar]
- Sagberg, F.; Eenink, R.; Hoedemaeker, M.; Lotan, T.; van Nes, N.; Smokers, R.; Welsh, R.; Winkelbauer, M. Recommendations for a Large-Scale European Naturalistic Driving Observation Study; PROLOGUE Deliverable D4.1; Institute of Transport Economics: Oslo, Norway, 2011. [Google Scholar]
- Hayward, J.C. Near Miss Determination through Use of a Scale of Danger; Transportation Research Board: Washington, DC, USA, 1972. [Google Scholar]
- Liu, R.; Zhu, X. Statistical Characteristics of Driver Accelerating Behavior and Its Probability Model. arXiv 2019, arXiv:1907.01747. [Google Scholar]
Figure 1.
Car following process example.

Figure 2.
Naturalistic driving study.

Figure 3.
Joint-distribution of speed-.

Figure 4.
Joint-distribution of speed-acceleration.

Figure 5.
Frequency of acceleration with different speed.

Figure 6.
Full-score and passing line of acceleration.

Figure 7.
Safety evaluation results-.

Figure 8.
Safety evaluation results-a.

Figure 9.
Human-like evaluation results under car-following scenarios with an accelerating leading vehicle.
Figure 9.
Human-like evaluation results under car-following scenarios with an accelerating leading vehicle.


Table 1.
List of testing scenarios.
| Type | Scenarios | Code | Cases and Description |
|---|---|---|---|
| human-like test | car-following | the leading vehicle speeds up from 30 km/h to 50/70/90/120 km/h | |
| the leading vehicle slows down from 50/70/90/120 km/h to 30 km/h | |||
| cruising | the host vehicle speeds up from 30 km/h to 50/70/90/120 km/h | ||
| the host vehicle slows down from 50/70/90/120 km/h to 30 km/h | |||
| safety test | cut-in | the host vehicle is at 40 km/h and the leading vehicle cuts in with speed of 40 km/h and the range is 50 m | |
| vehicle appears | the host vehicle approaches the 40 km/h leading vehicle with speed of 50/70/110 km/h | ||
| stop-go | the leading vehicle slows down from 60 km/h to a full stop and then accelerates to 60 km/h |
Table 2.
Event statistic.
| Event | Count | Frequency | Weight |
|---|---|---|---|
| Cut-in | 113 | 48.29% | |
| Stop-go | 76 | 32.48% | |
| Vehicle-appear | 45 | 19.23% | |
| Sum | 234 | 100.00% |
Publisher’s Note: MDPI stays neutral with regard to jurisdictional claims in published maps and institutional affiliations. |
© 2021 by the authors. Licensee MDPI, Basel, Switzerland. This article is an open access article distributed under the terms and conditions of the Creative Commons Attribution (CC BY) license (https://creativecommons.org/licenses/by/4.0/).
Share and Cite
MDPI and ACS Style
Liu, L.; Zhang, Q.; Liu, R.; Zhu, X.; Ma, Z. Adaptive Cruise Control System Evaluation According to Human Driving Behavior Characteristics. Actuators 2021, 10, 90. https://0-doi-org.brum.beds.ac.uk/10.3390/act10050090
AMA Style
Liu L, Zhang Q, Liu R, Zhu X, Ma Z. Adaptive Cruise Control System Evaluation According to Human Driving Behavior Characteristics. Actuators. 2021; 10(5):90. https://0-doi-org.brum.beds.ac.uk/10.3390/act10050090
Chicago/Turabian StyleLiu, Lin, Qiang Zhang, Rui Liu, Xichan Zhu, and Zhixiong Ma. 2021. "Adaptive Cruise Control System Evaluation According to Human Driving Behavior Characteristics" Actuators 10, no. 5: 90. https://0-doi-org.brum.beds.ac.uk/10.3390/act10050090
Note that from the first issue of 2016, this journal uses article numbers instead of page numbers. See further details here.