Article

Development and Performance Evaluation of a Precise Application System for Liquid Starter Fertilizer while Sowing Maize

1
College of Engineering, China Agricultural University, Beijing 100083, China
2
Beijing Municipal Bureau of Agriculture and Rural Affairs, Beijing 100005, China
*
Author to whom correspondence should be addressed.
Submission received: 2 August 2021 / Revised: 30 August 2021 / Accepted: 31 August 2021 / Published: 3 September 2021

Abstract

:
At present, liquid starter fertilizer (LSF) application technologies experience problems with low fertilizer utilization efficiency. In this study, we adopted a method of precise application of LSF near the seeds on seed bed in point form during sowing. A precise application system that can detect seed information in real time and control the solenoid valve to open automatically was developed for this method. The LSF supply system and detection control system were studied in detail. Field experiments were conducted to evaluate the performance of the precise application system in terms of operation quality (qualified index of the length of the LSF, QIL; the amount of the LSF, FA; and qualified index of the distance between the seeds and the LSF, QID) at forward speeds of 4, 6, and 8 km/h and pressures of 0.10, 0.15, 0.20, 0.25, and 0.30 MPa. The results indicated that QIL was 96.4%, the range of FA was 1.34 to 13.86 mL, and QID was 82.6%, which signifies the developed system meets the demands of precise LSF application. This method achieves the target of improving fertilizer use efficiency and provides a reference for developing fertilization devices for precisely applying LSF.

1. Introduction

Fertilizer is an important input in agricultural production as it increases crop yields with proper use [1,2,3]. To ensure food security, large amounts of fertilizer have been used in the past several decades [4,5]. However, the long-term excessive application of fertilizer leads to problems such as eutrophication, soil acidification, and low-quality agricultural products [6]. The use of nitrogenous fertilizer also generates greenhouse gases and causes global warming [7,8,9]. Therefore, fertilizer reduction is an important goal in agricultural production and management.
Starter fertilizer is usually applied for maize while sowing as it improves nutrient uptake, nutrient use efficiency, and the germination of seeds at the early growth stage of maize. Some researchers have studied the response of maize to starter fertilizer. The results showed that starter fertilizer is conducive to increasing maize yield when the amount and application methods are suitable [10,11,12,13]. The methods of applying starter fertilizer mainly consist of in-furrow placement and deep-band placement (5 cm below and 5 cm to the side of the seed row) [14,15]. In-furrow placement of fertilizer increases the salt concentration surrounding the seeds and might affect seed emergence. This problem can be avoided by deep-band placement, which keeps the fertilizer away from the seeds. Moreover, deep-band placement applies the fertilizer into the subsurface, which is less susceptible to loss nutrient and beneficial to reduce the environmental pollution. However, when deep-band placement is used, starter fertilizer is not sufficiently absorbed because the fertilizer placement between adjacent seeds is far from the roots of the plants [16]. It is necessary to study more precise application methods of starter fertilizer to improve fertilizer use efficiency.
Liquid fertilizer is widely used all around the world. Compared with traditional granular fertilizer, the liquid one requires less energy to produce, is more easily absorbed, and has a high use efficiency [17,18]. In recent years, it has been widely used as starter fertilizer. The methods used for applying a liquid fertilizer include mainly spraying, drip irrigation, and deep placement [19]. The spraying has the advantages of high work efficiency and quick absorption by crops. However, the liquid fertilizer is not uniformly atomized during spraying, which causes its waste. The pulse width modulation (PWM) spray controller was developed to improve spray deposit homogeneity [20]. Drip irrigation applies a liquid fertilizer to the root system of plants through the drip irrigation pipeline system. Studies of automatic drip fertilization system were conducted using a wireless sensor and a fuzzy logic algorithm. The system could accurately calculate the water and fertilizer demand of crops by collecting real-time data, such as temperature, soil humidity, and soil nutrients [21,22]. Deep placement is used to apply a liquid fertilizer into the subsurface. The self-propelled spoke wheel applicator for injecting the liquid fertilizer was designed and tested, and the results indicated that the amount of fertilizer was related to the pressure of the liquid fertilizer and the forward speed of the equipment [23]. Da Silva et al. [17,24] used a cam-crank rocker combination mechanism as the driving component for deep placement of a liquid fertilizer. A gear mechanism was also used as the driving system to achieve the deep placement of a liquid fertilizer [25].
The above-mentioned methods of applying a liquid fertilizer are not suitable or sufficiently precise for starter fertilizer, for which some novel, precise methods of applications have been constructed. One of them included applying a liquid fertilizer near the seeds in point form. Drazic et al. [26] applied a liquid starter fertilizer (LSF) in belt and point forms near seeds and studied the impact of different amounts of the LSF. The results showed that 30% of the LSF could be saved without reducing yield when it was applied in point form. The method was able to reduce fertilizer usage and improve its use efficiency. It is necessary to develop a precise system for applying a LSF in point form.
Currently, prescription map and real-time detection sensors are two main technologies for a precision fertilizer application. The prescription map is a vectorized map of soil nutrients and crop growth information obtained using geographic information system (GIS), global positioning system (GPS), and remote sensing (RS). Using variable control technologies, the agricultural machinery adjusted the fertilizer amount and the ratio of N, P, and K according to the specific characteristics of each operating unit of the prescription map [27,28]. Real-time detection sensors, such as near-infrared soil and crop density sensors, have been used to obtain soil nutrients information. The fertilizer was applied variably using a suitable variable fertilization model and algorithm by analyzing the obtained soil nutrients information [29,30].
The length of the liquid starter fertilizer (FL), the amount of the liquid starter fertilizer (FA), and the distance between the seeds and liquid starter fertilizer (DSL) are key evaluation indicators of the application of the LSF in point form. A wet spot remains on the ground after such an application, and the length of the LSF and its distance from the seeds are measured by this wet spot. If the length is large, the fertilizer, being far away from the seeds, cannot be effectively absorbed, which is similar to applying a LSF in belt form. The amount of the LSF would also not satisfy the demands of maize growth if the length of the LSF is short. The amount of the LSF should meet the demands of different conditions and crops. The distance between the seeds and the LSF affects seed emergence. If it is too large, the seed germination rate might be reduced [16].
To achieve the goal of applying a LSF in point form while sowing maize, a precise application system was developed in this study. The performance of the precise application system was evaluated on the basis of the operation quality (qualified index, distribution uniformity of the length and amount of the LSF, and qualified index of the distance between the seeds and the LSF) at different forward speeds and pressures.

2. Materials and Methods

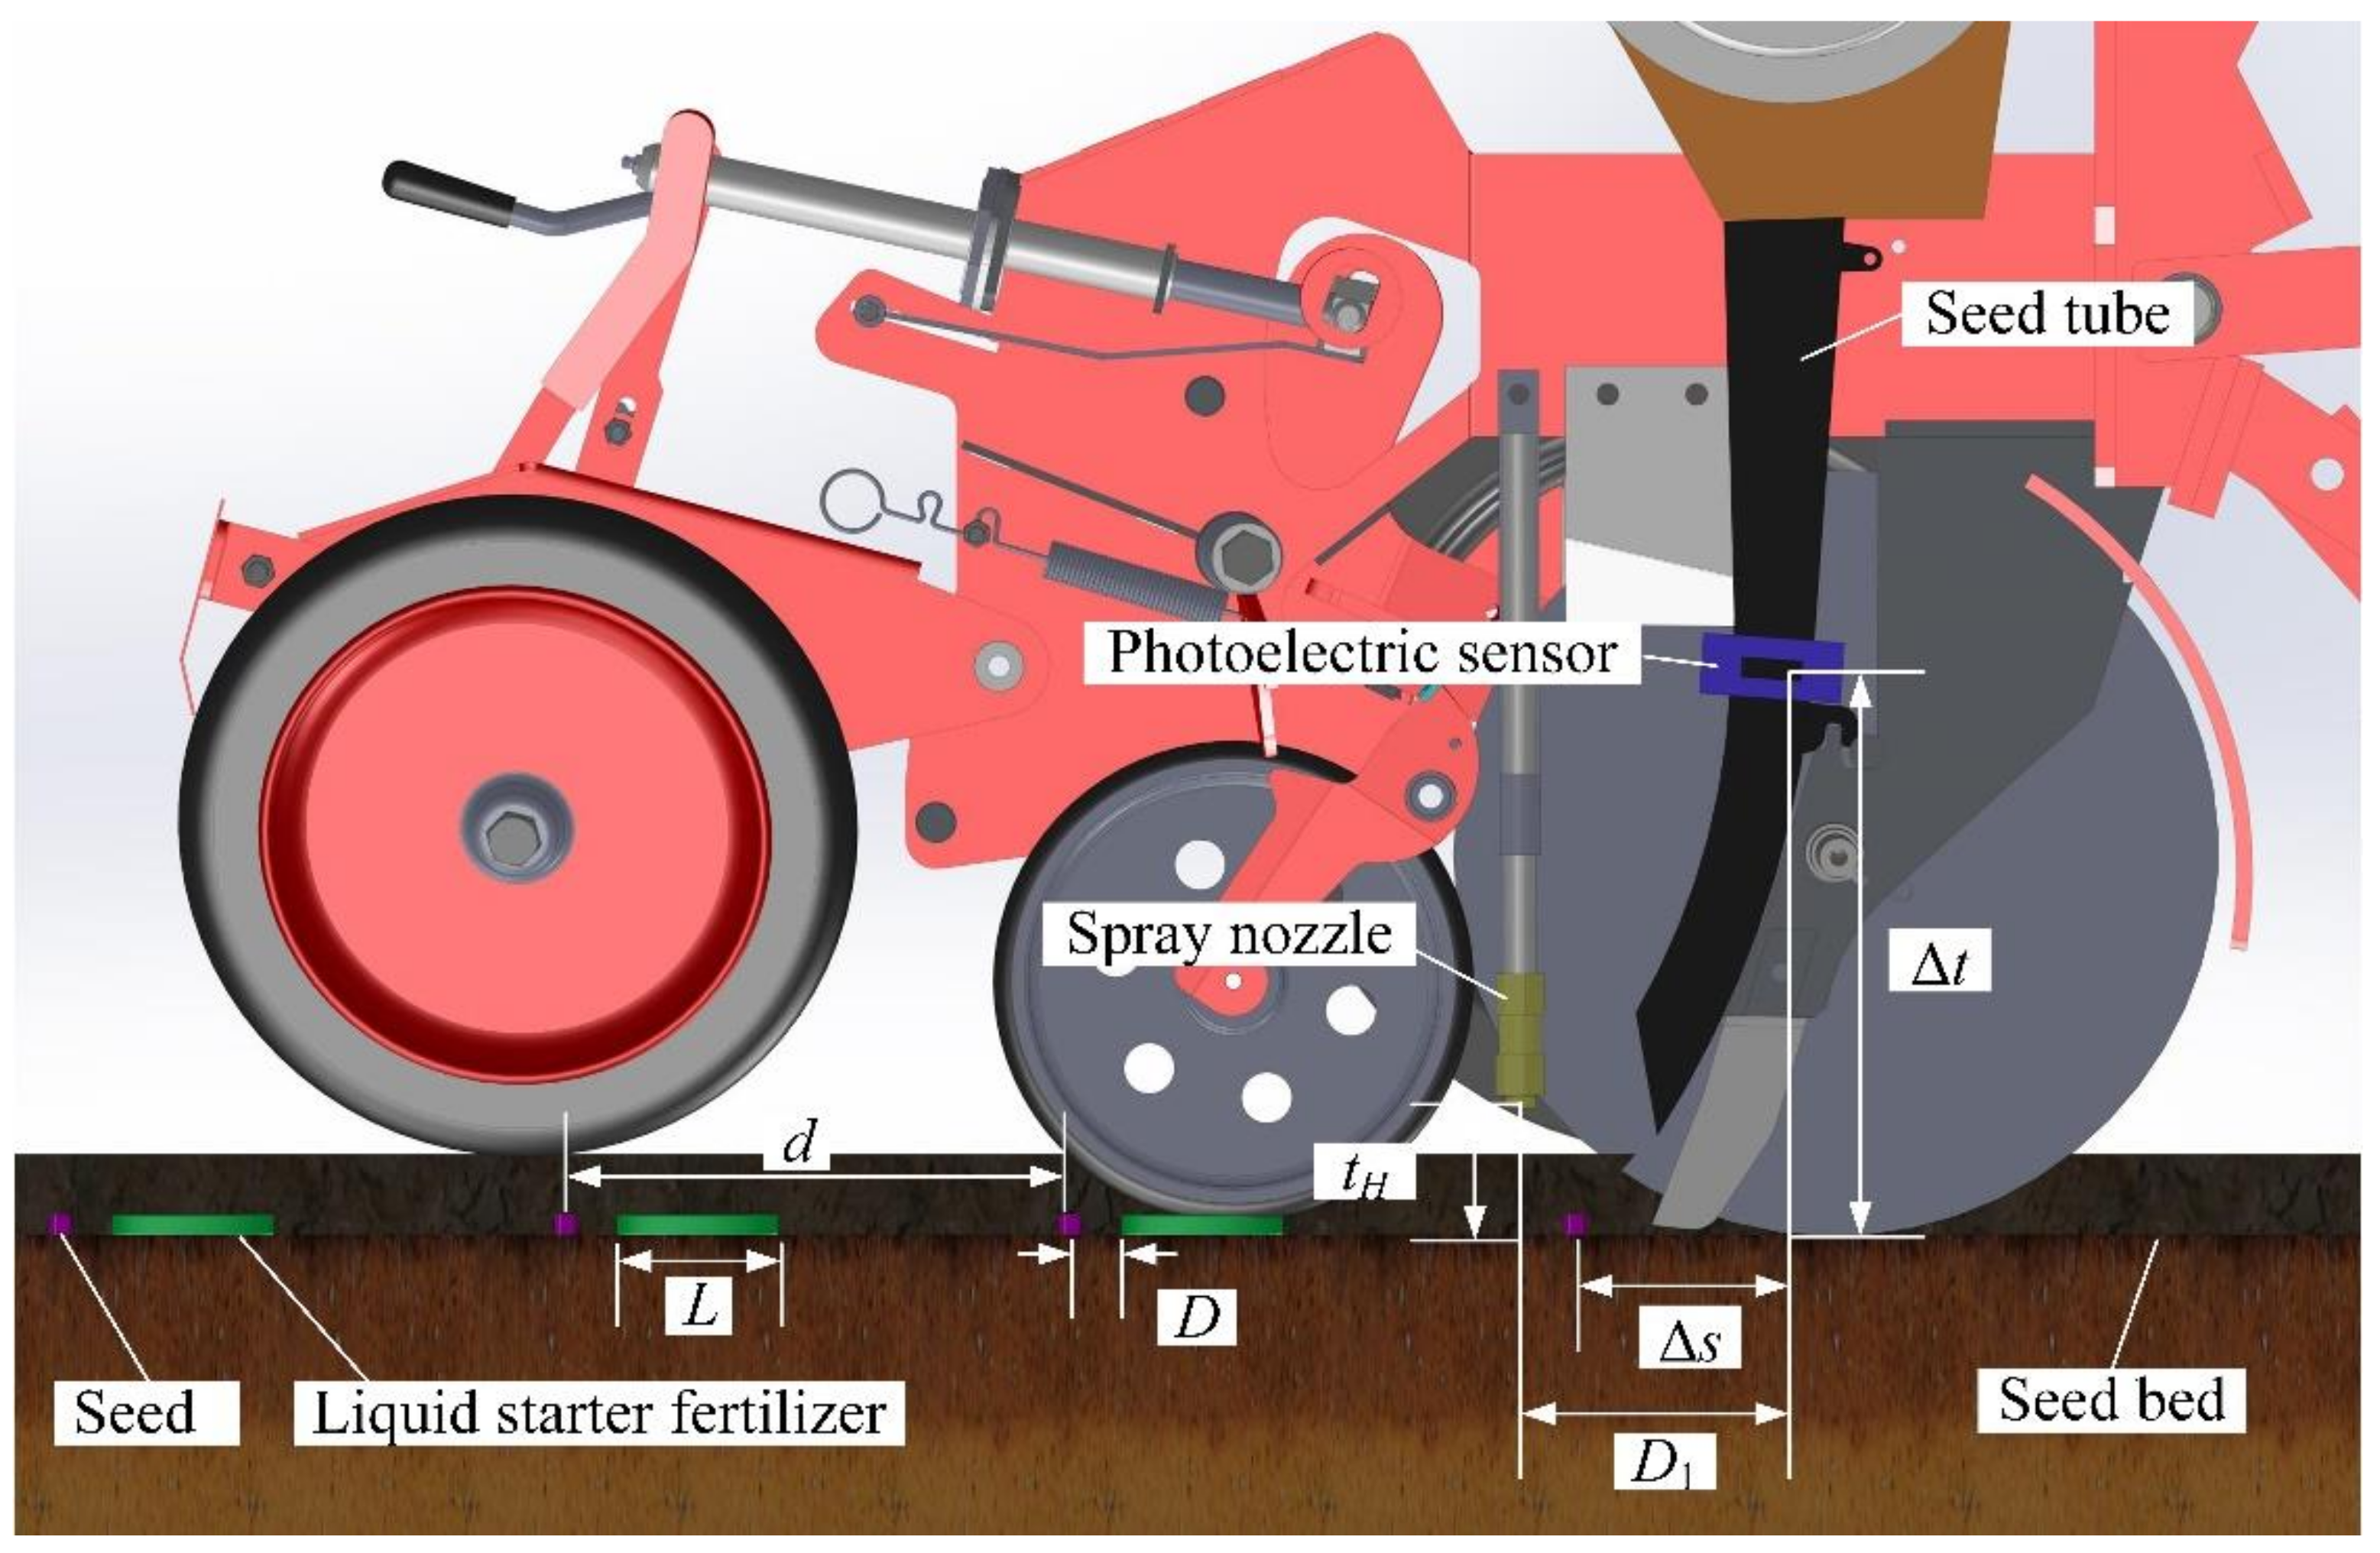
2.1. Description of Method of Precisely Applying Liquid Starter Fertilizer

The method of precisely applying a LSF in point form while sowing maize is shown in Figure 1, where d is the plant spacing of maize, L is the length of the LSF, and D is the distance between the seeds and the LSF. A wet spot remains on the ground after applying the LSF in point form. L and D were measured by this wet spot. The placement of the LSF was about 0.05 m away from the seeds on the seed bed. In this study, the LSF was obtained by dissolving crystalline (NH4)2HPO4 (N/P/K ratio 21%:53%:0%) in water.

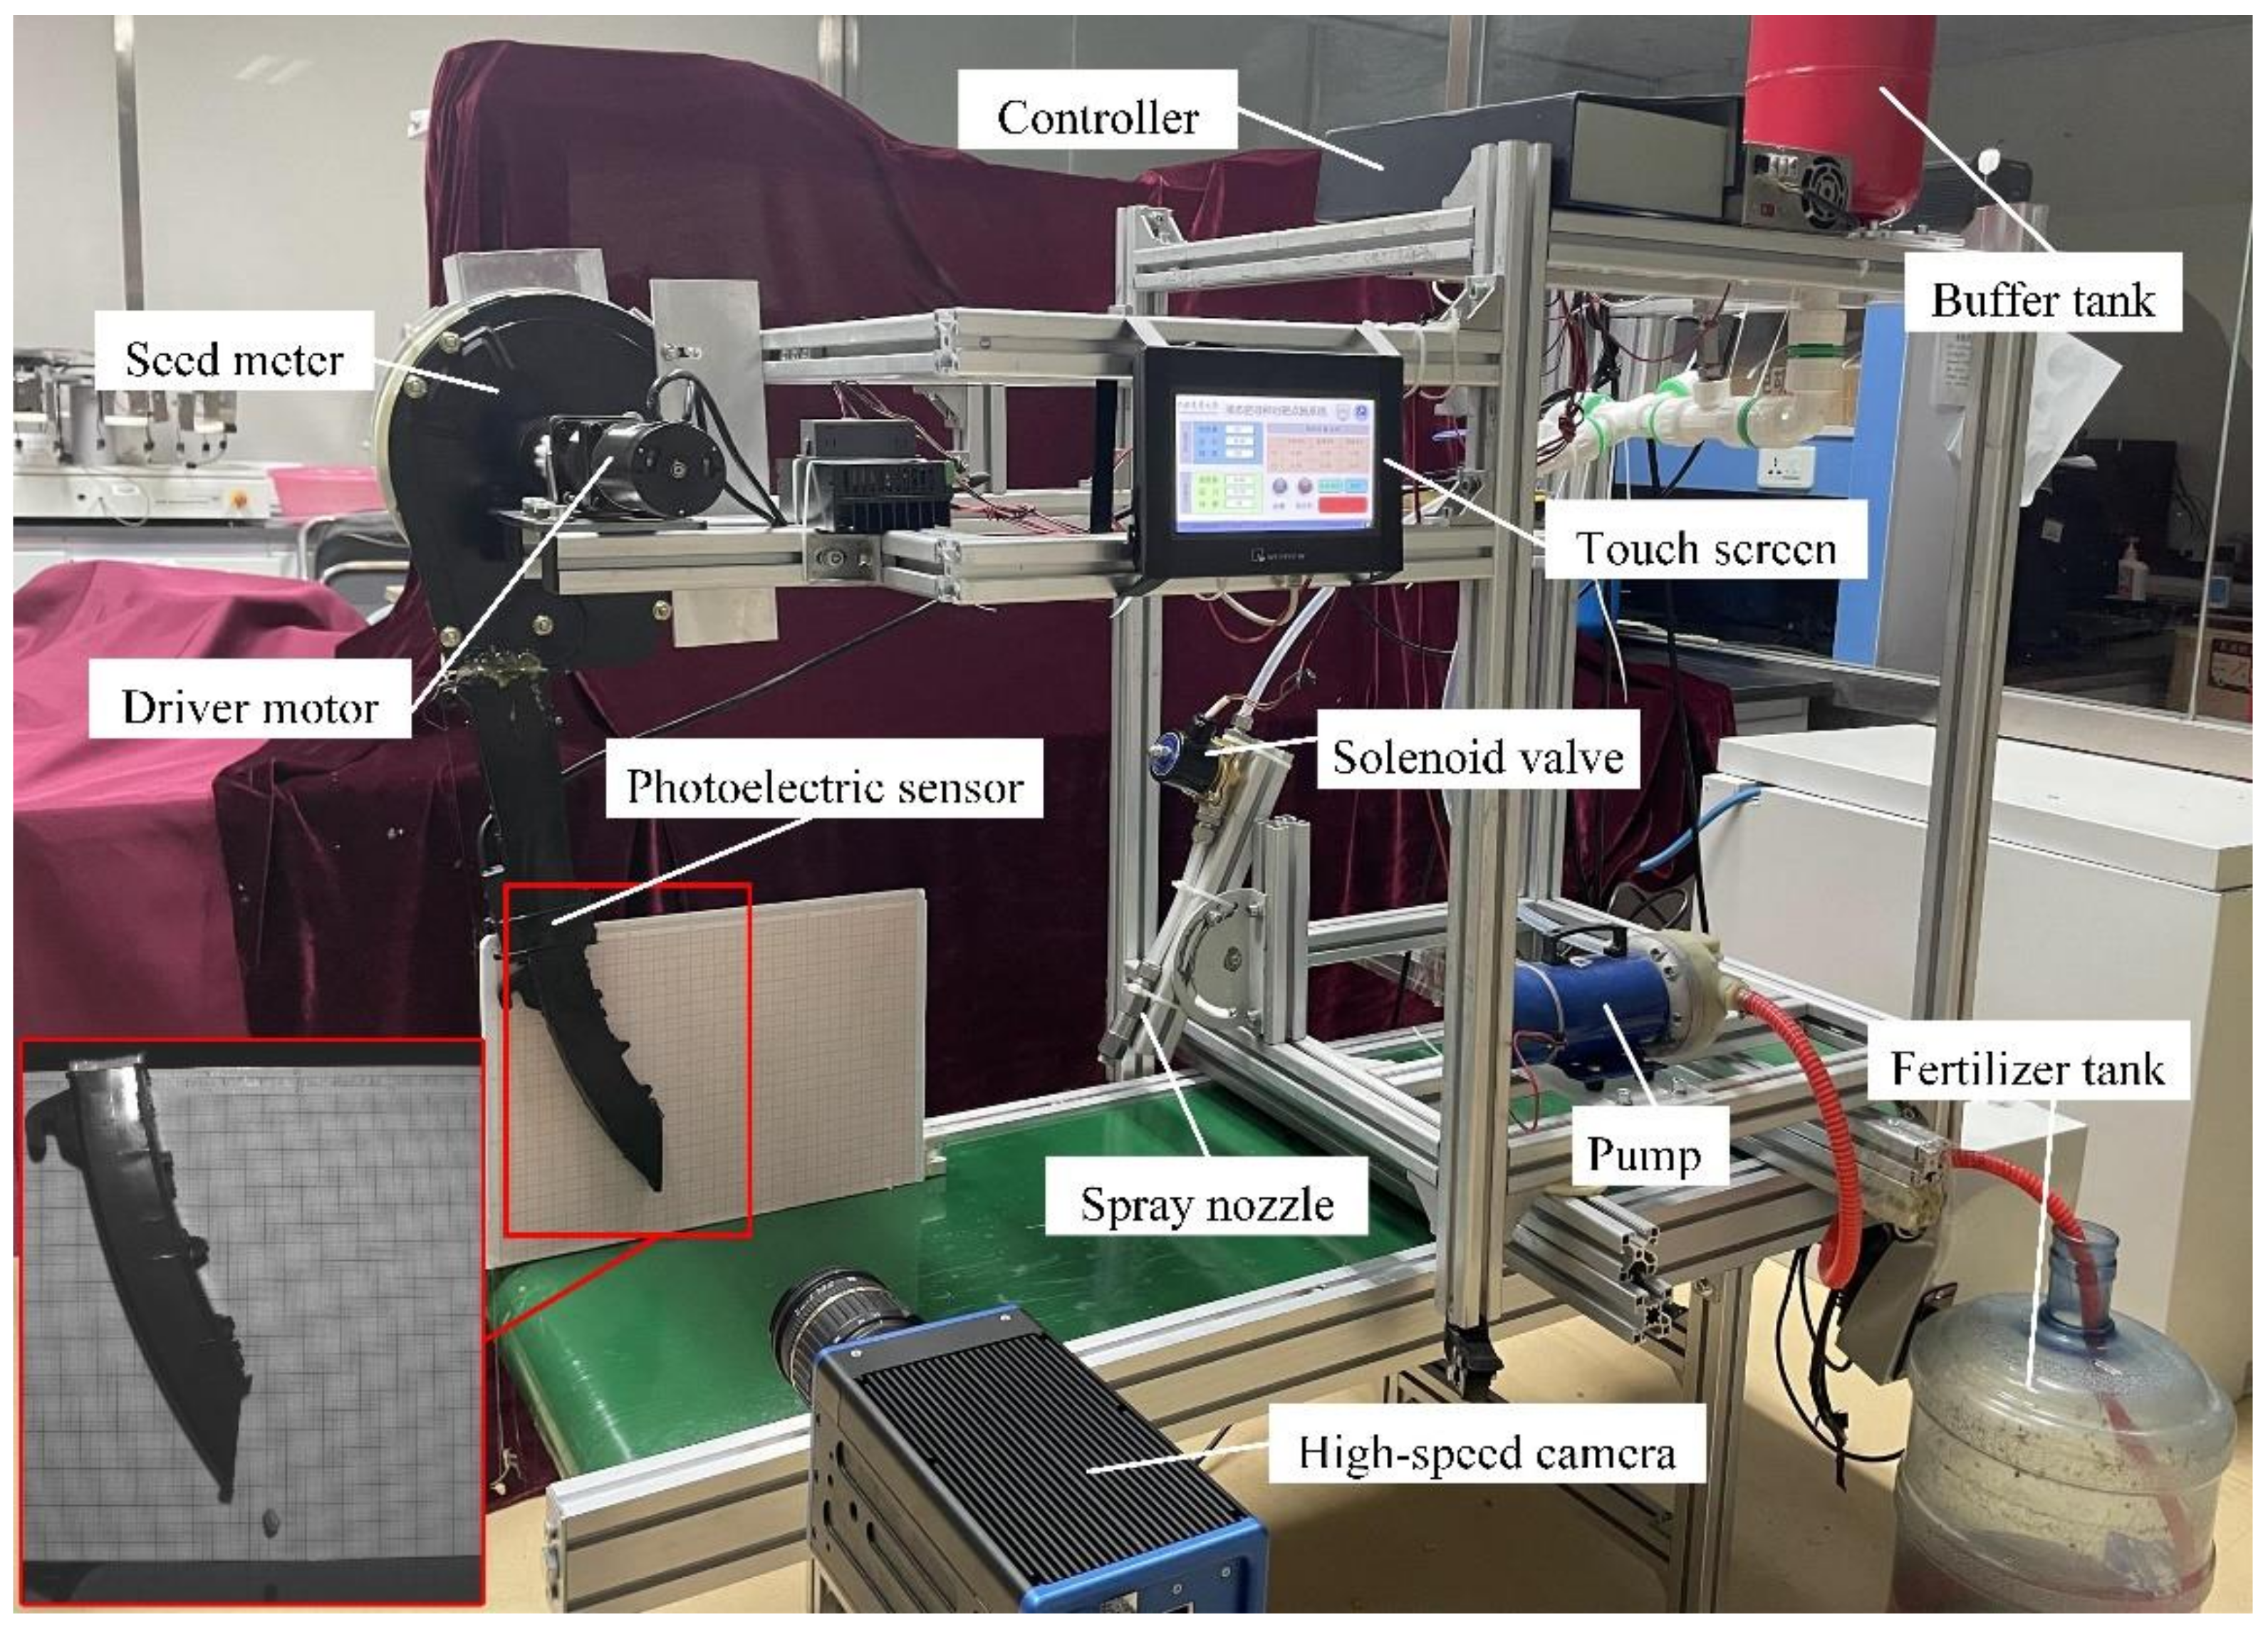
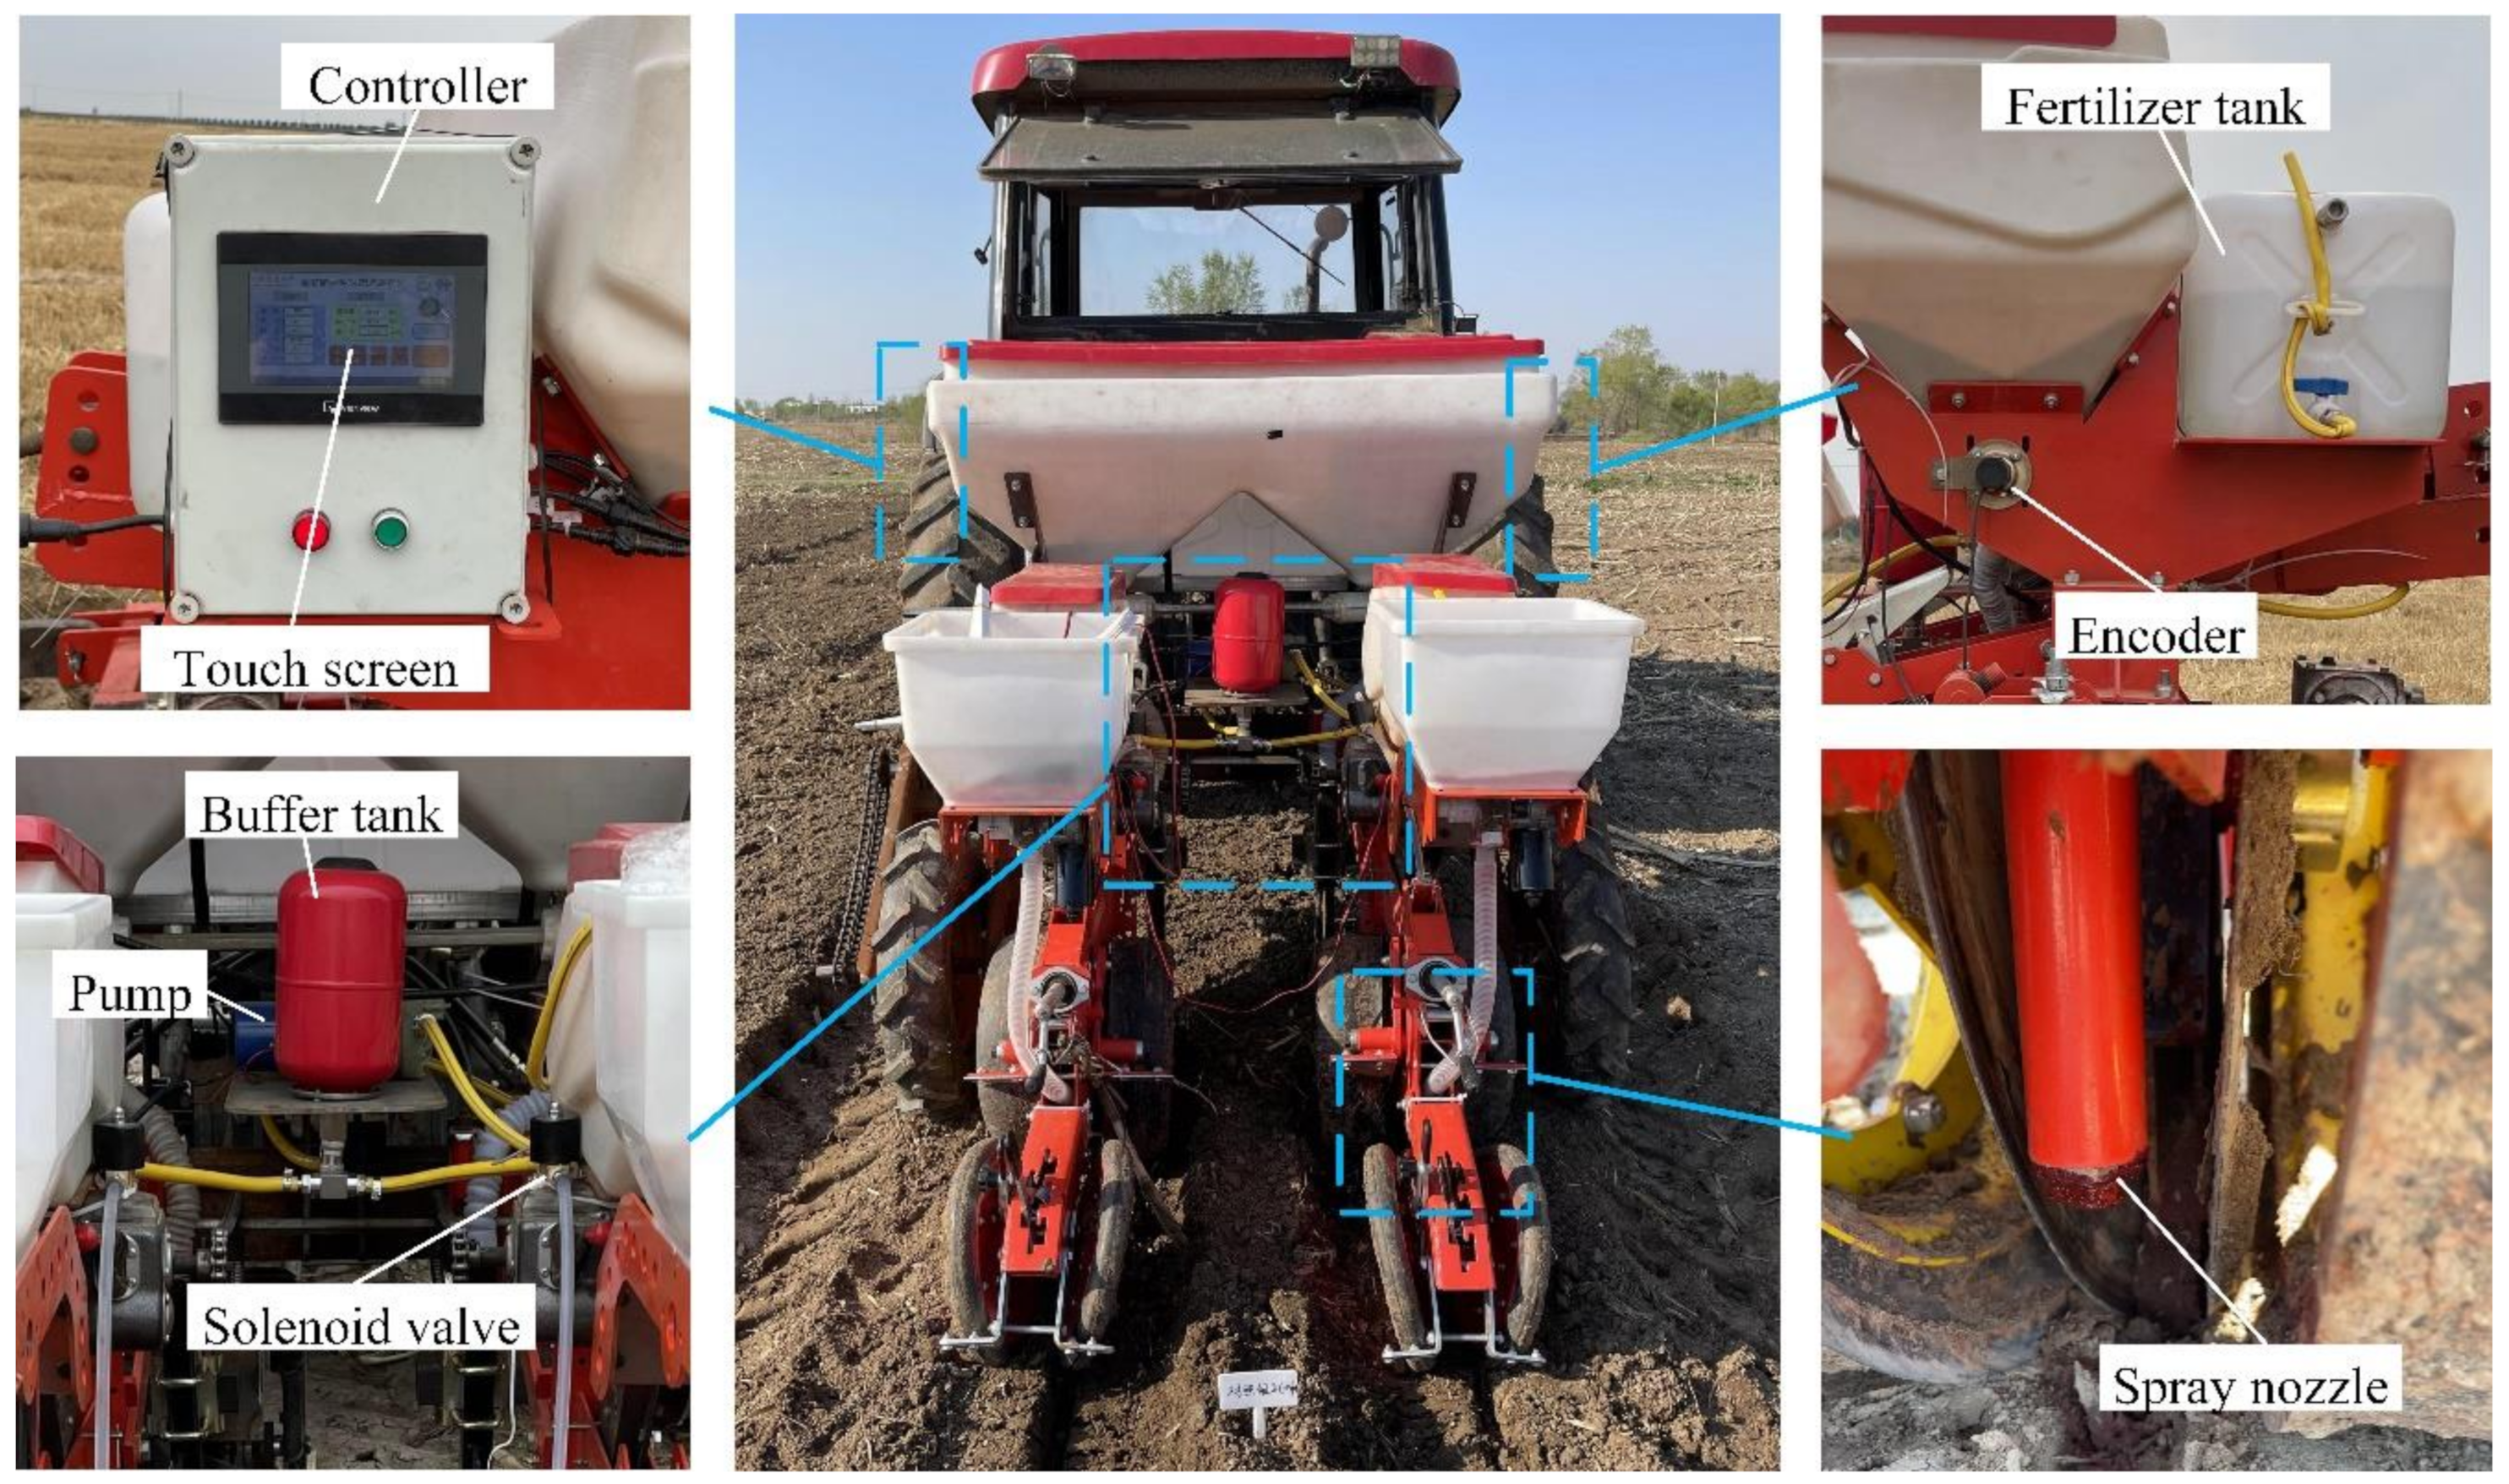
2.2. Design of the Precise Application System

The precise application system for a LSF is a technology based on real-time detection sensors for precision fertilization [29,30]. The system mainly consists of a LSF supply system and a detection control system (Figure 2). The supply system provides the LSF with stable flow and pressure for precise application. The detection control system detects the signal of seeds falling into the seed tube from the seed metering device using a photoelectric sensor and control the opening and closing of the solenoid valve. The working principle of the liquid fertilizer supply system and detection control system is introduced in detail below.

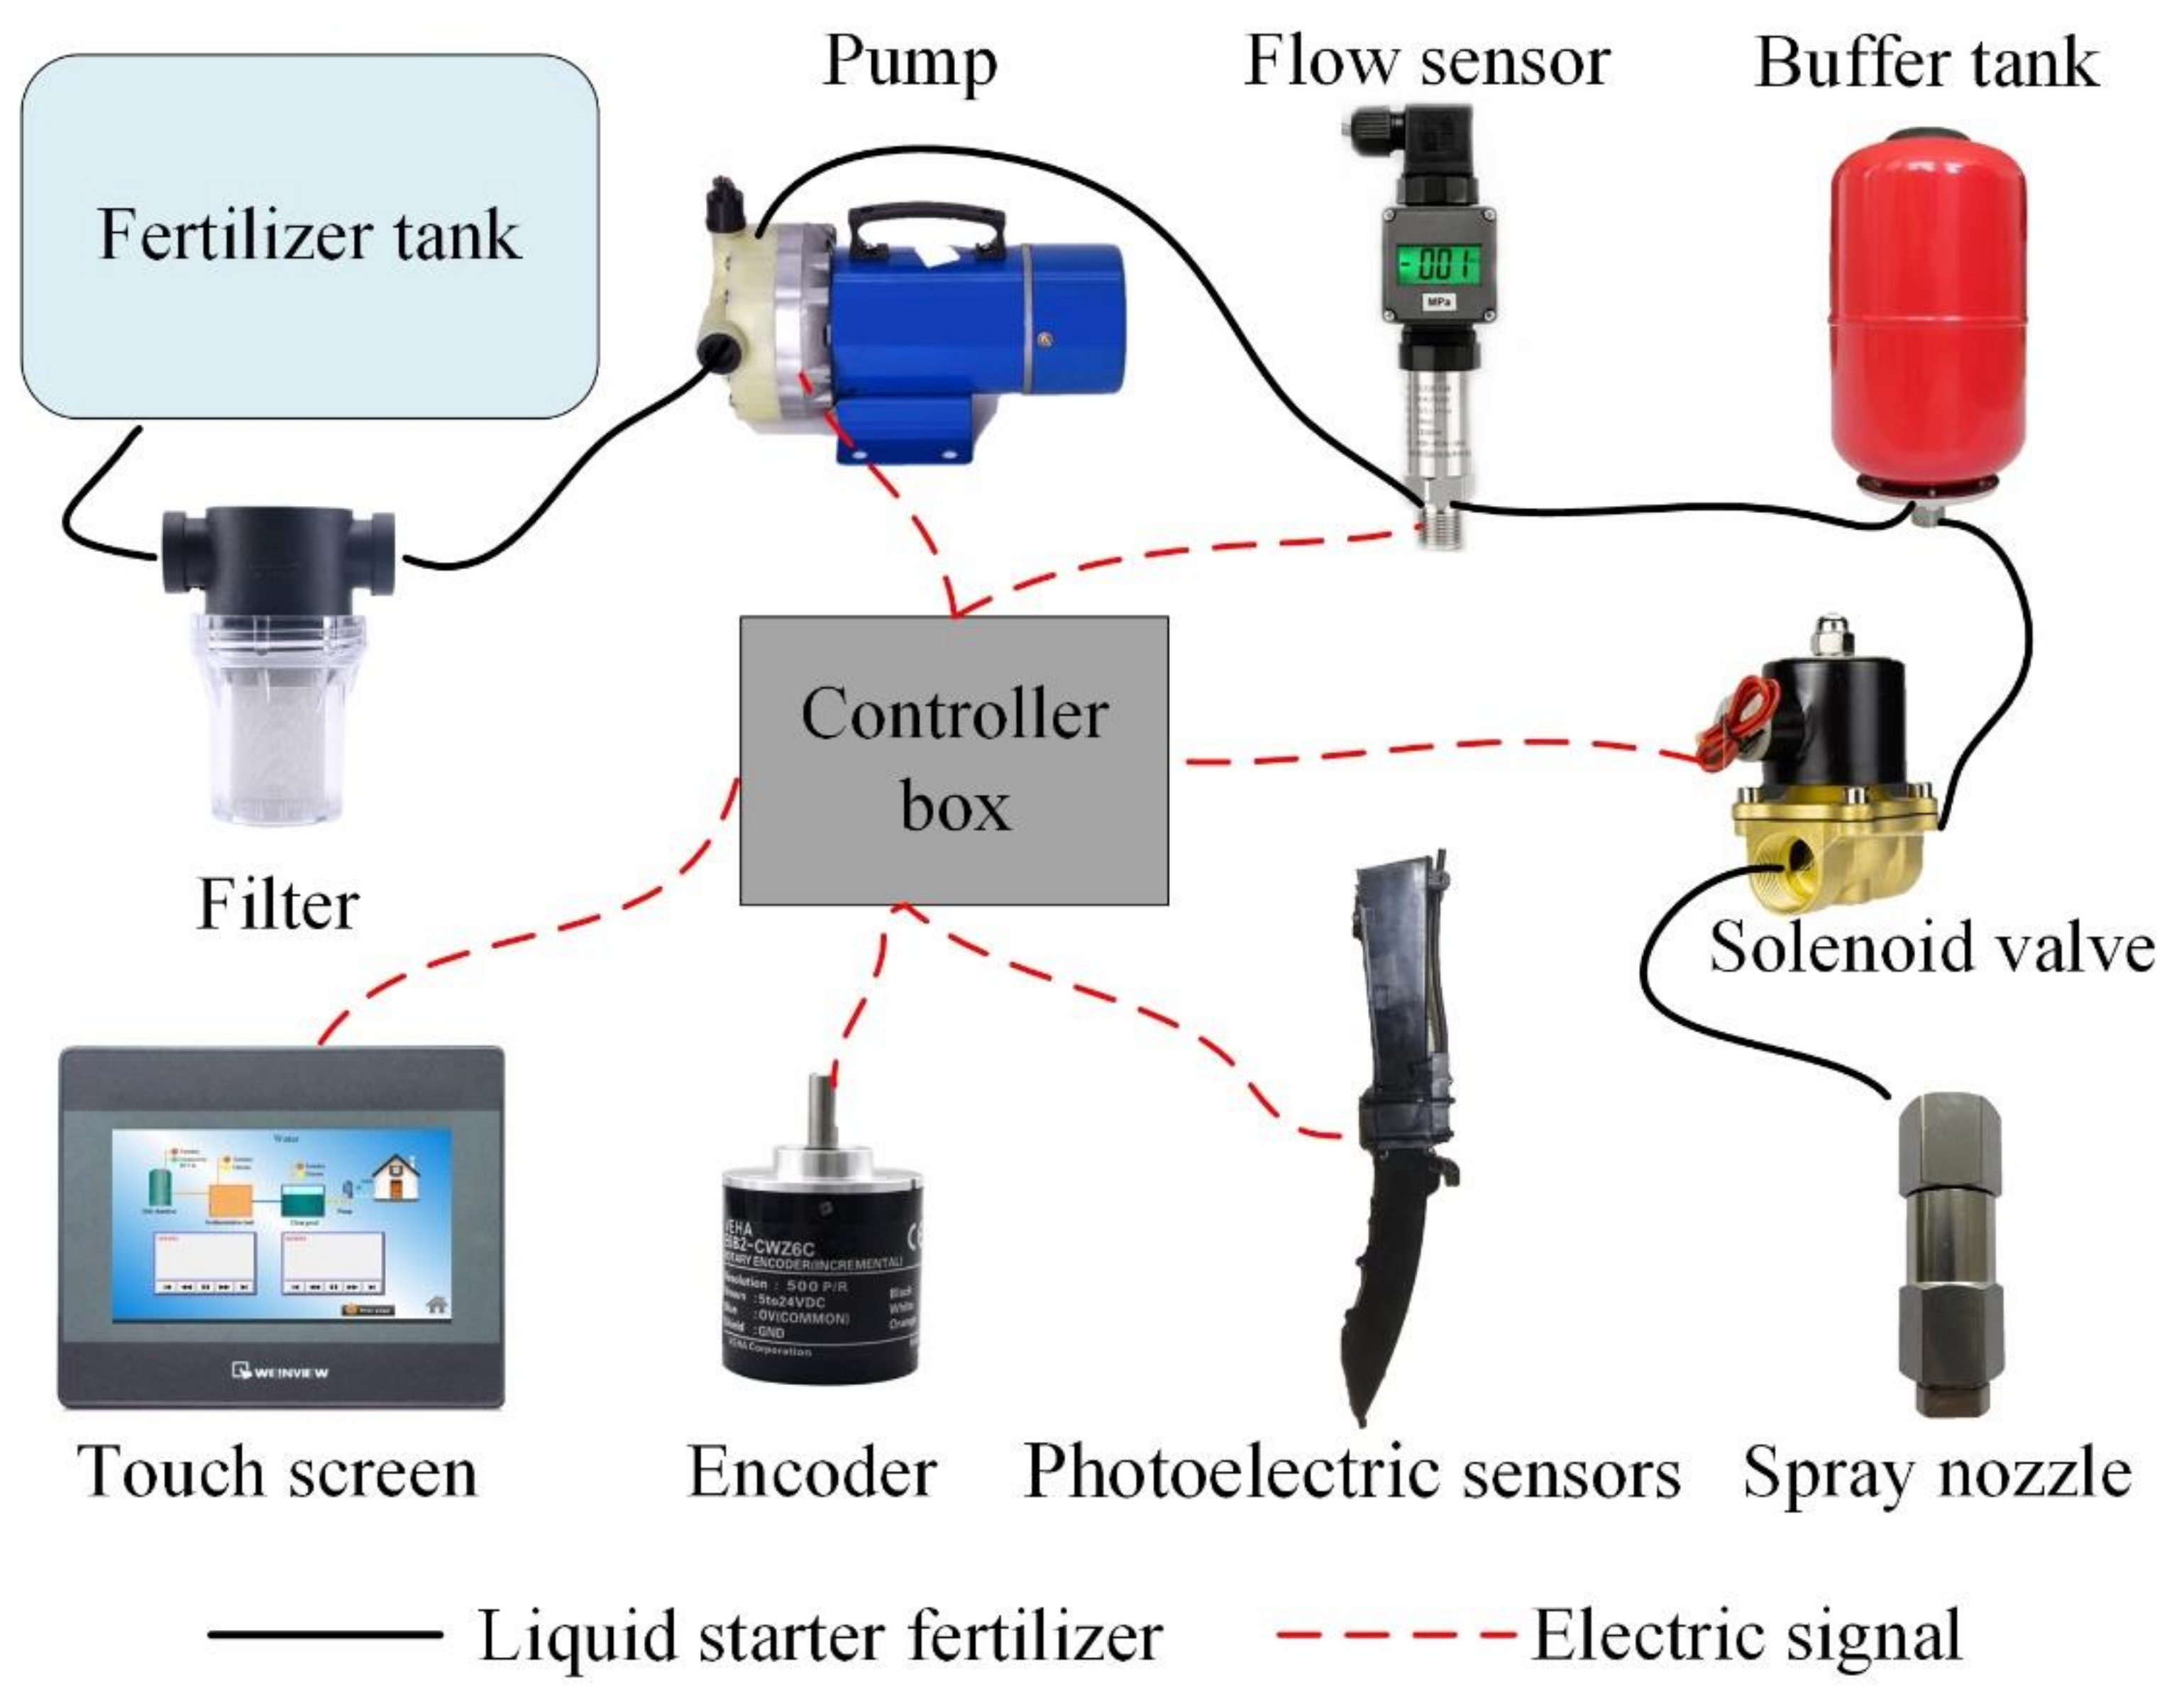
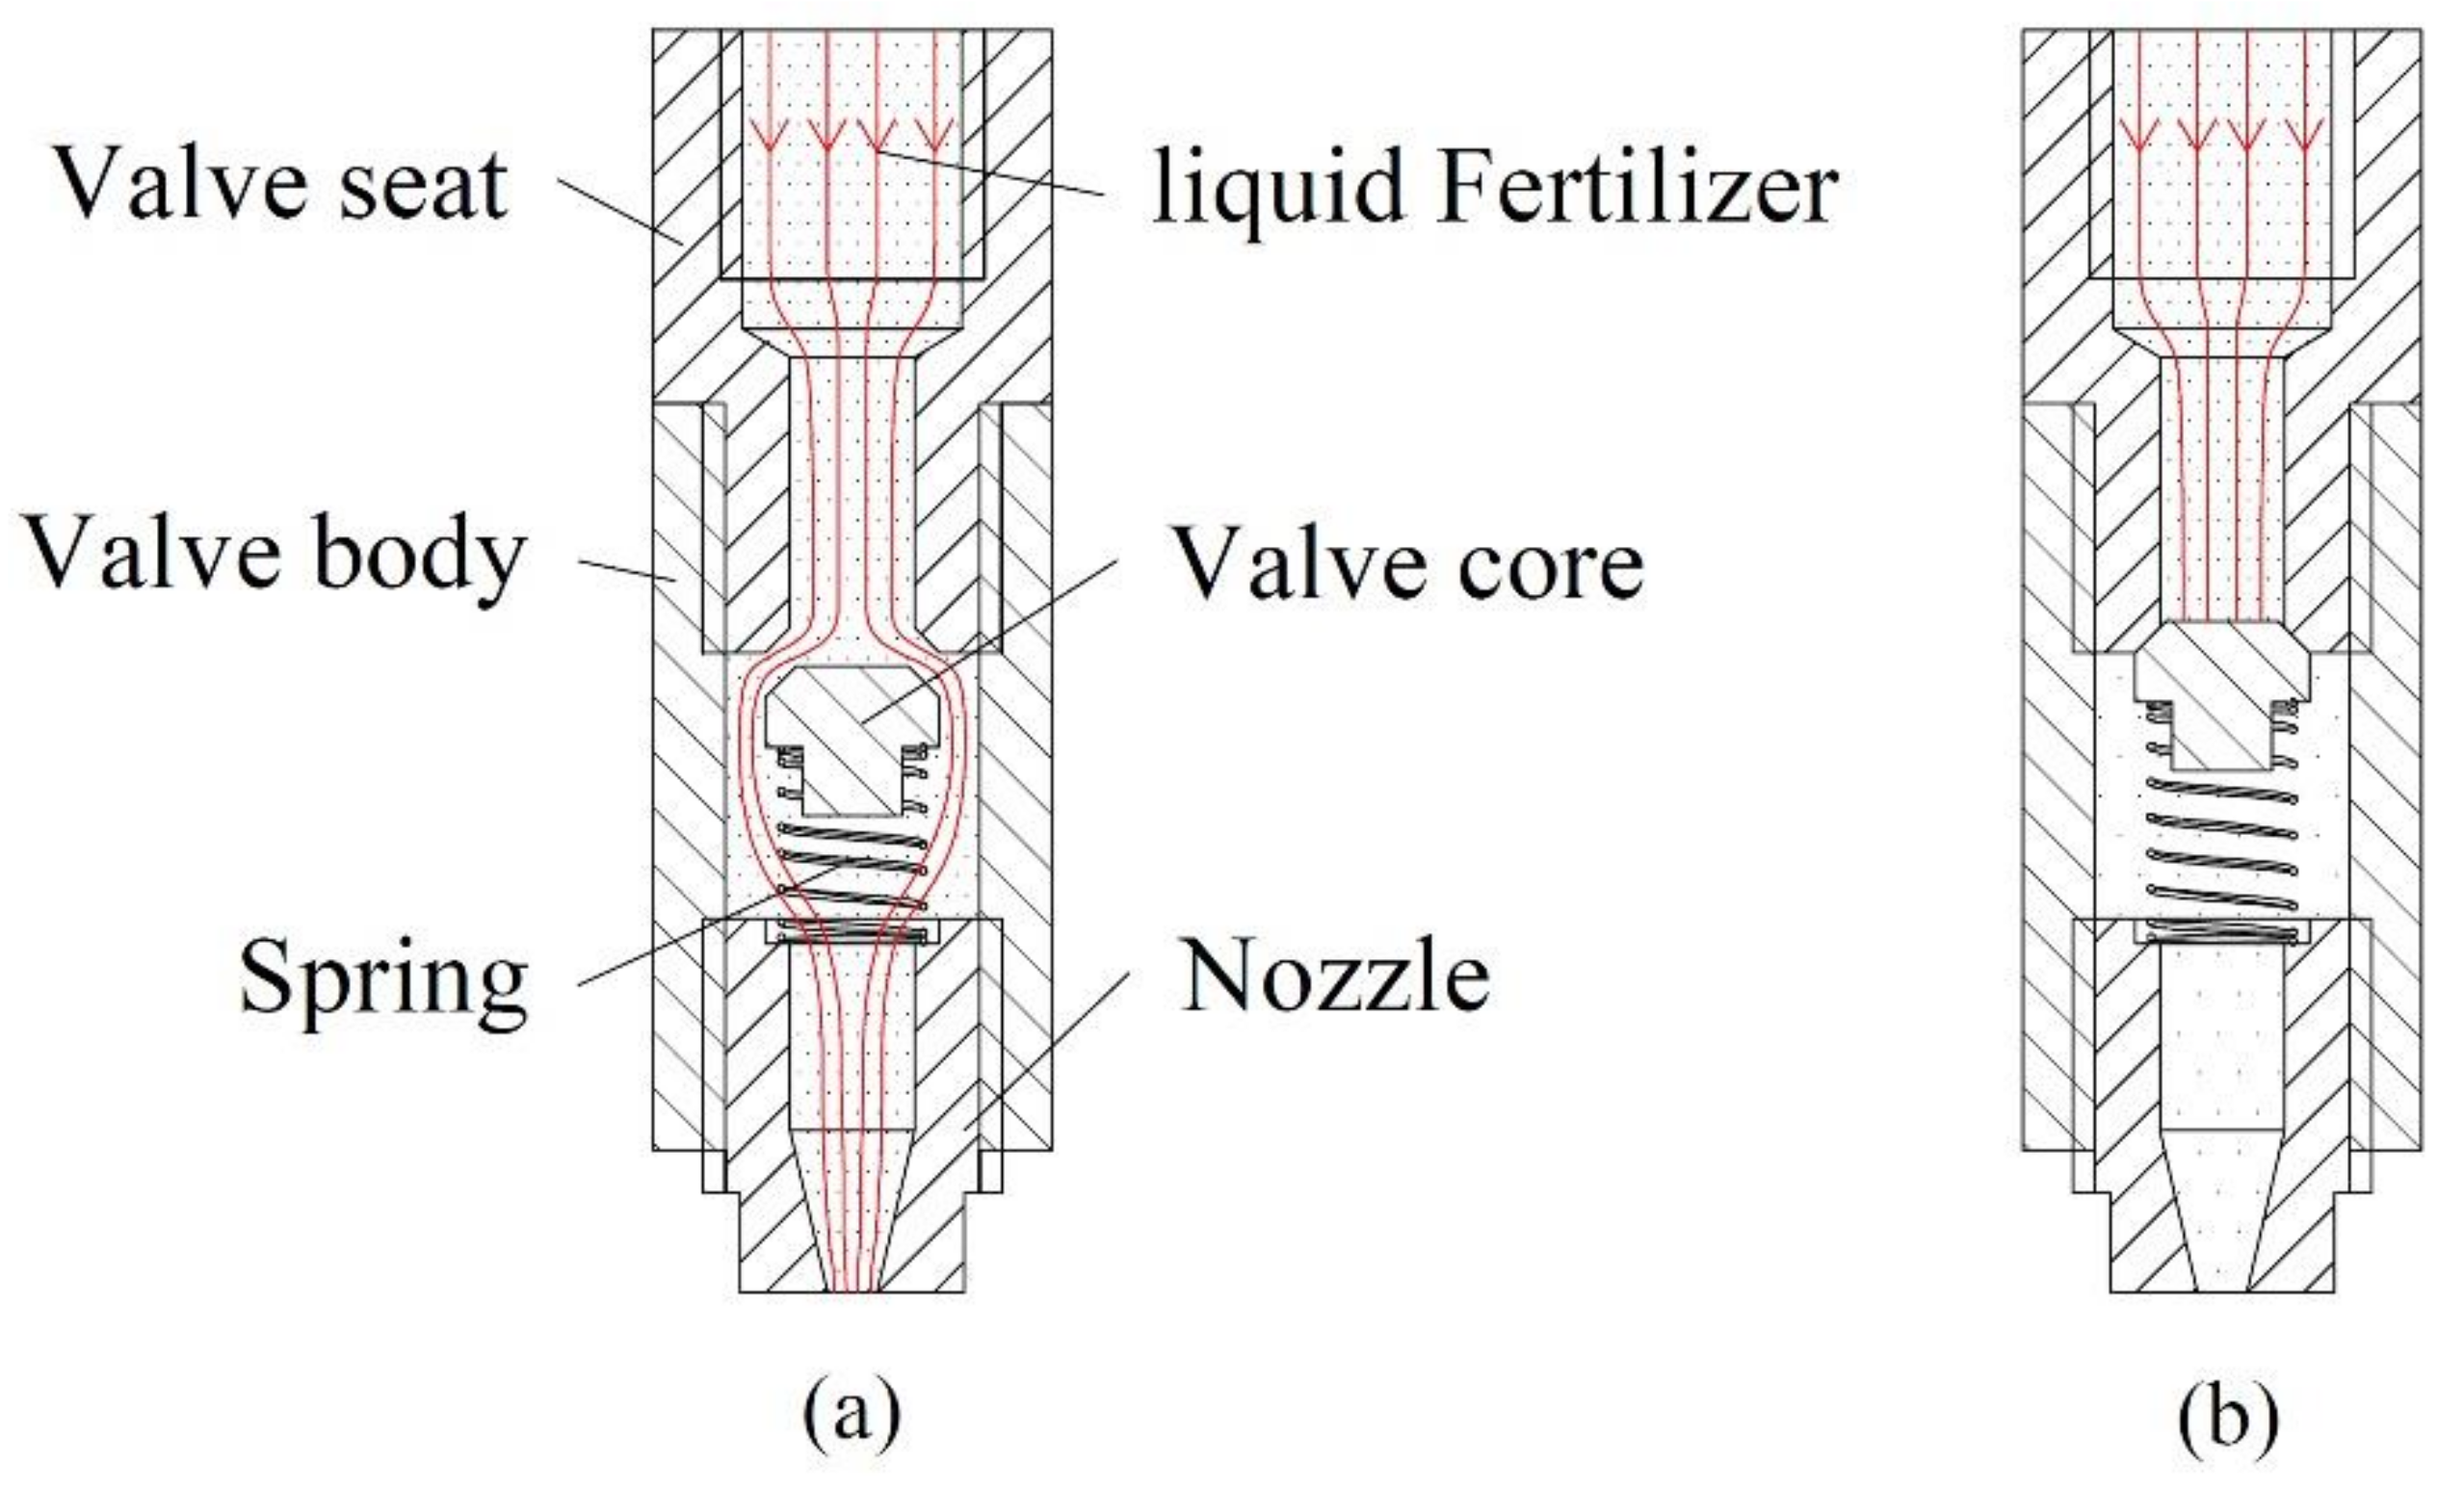
2.2.1. Liquid Starter Fertilizer Supply System

The LSF supply system is composed of a fertilizer tank, a filter (WOEN, Jinhua, China), a pump (Dafengda 5G-210, Chaoshan, China), a buffer tank (Taizhou Tianyang Electrical Co., Ltd. TY-11-0.5G-5, Taizhou, China), a solenoid valve (CHNT 160-15 DC24V, Shanghai, China), a spray nozzle and some pipes (Figure 2). The buffer tank is used to weaken the pressure fluctuation in the LSF. The solenoid valve is used to control the opening and closing of the LSF supply system and realizes the intermittent application of the LSF. The mechanical structure of the solenoid valve works by electromagnetic force when electricity is supplied with a delay between the control signal and the mechanical structure of solenoid valve [31,32].
The spray nozzle was studied in previous research [19], which consists of a valve body, spring, valve seat, valve core and nozzle, as shown in Figure 3. The spool moves down and opens the spray nozzle when the pressure of the LSF is greater than the preload of the spring (Figure 3a). The LSF is sprayed into the soil through nozzle. Otherwise, the spray nozzle closes, and the LSF application system does not work (Figure 3b). The spray nozzle is installed behind the seed tube (Figure 1). The distance between the spray nozzle and photoelectric sensor in the horizontal direction (D1) is 0.127 m.

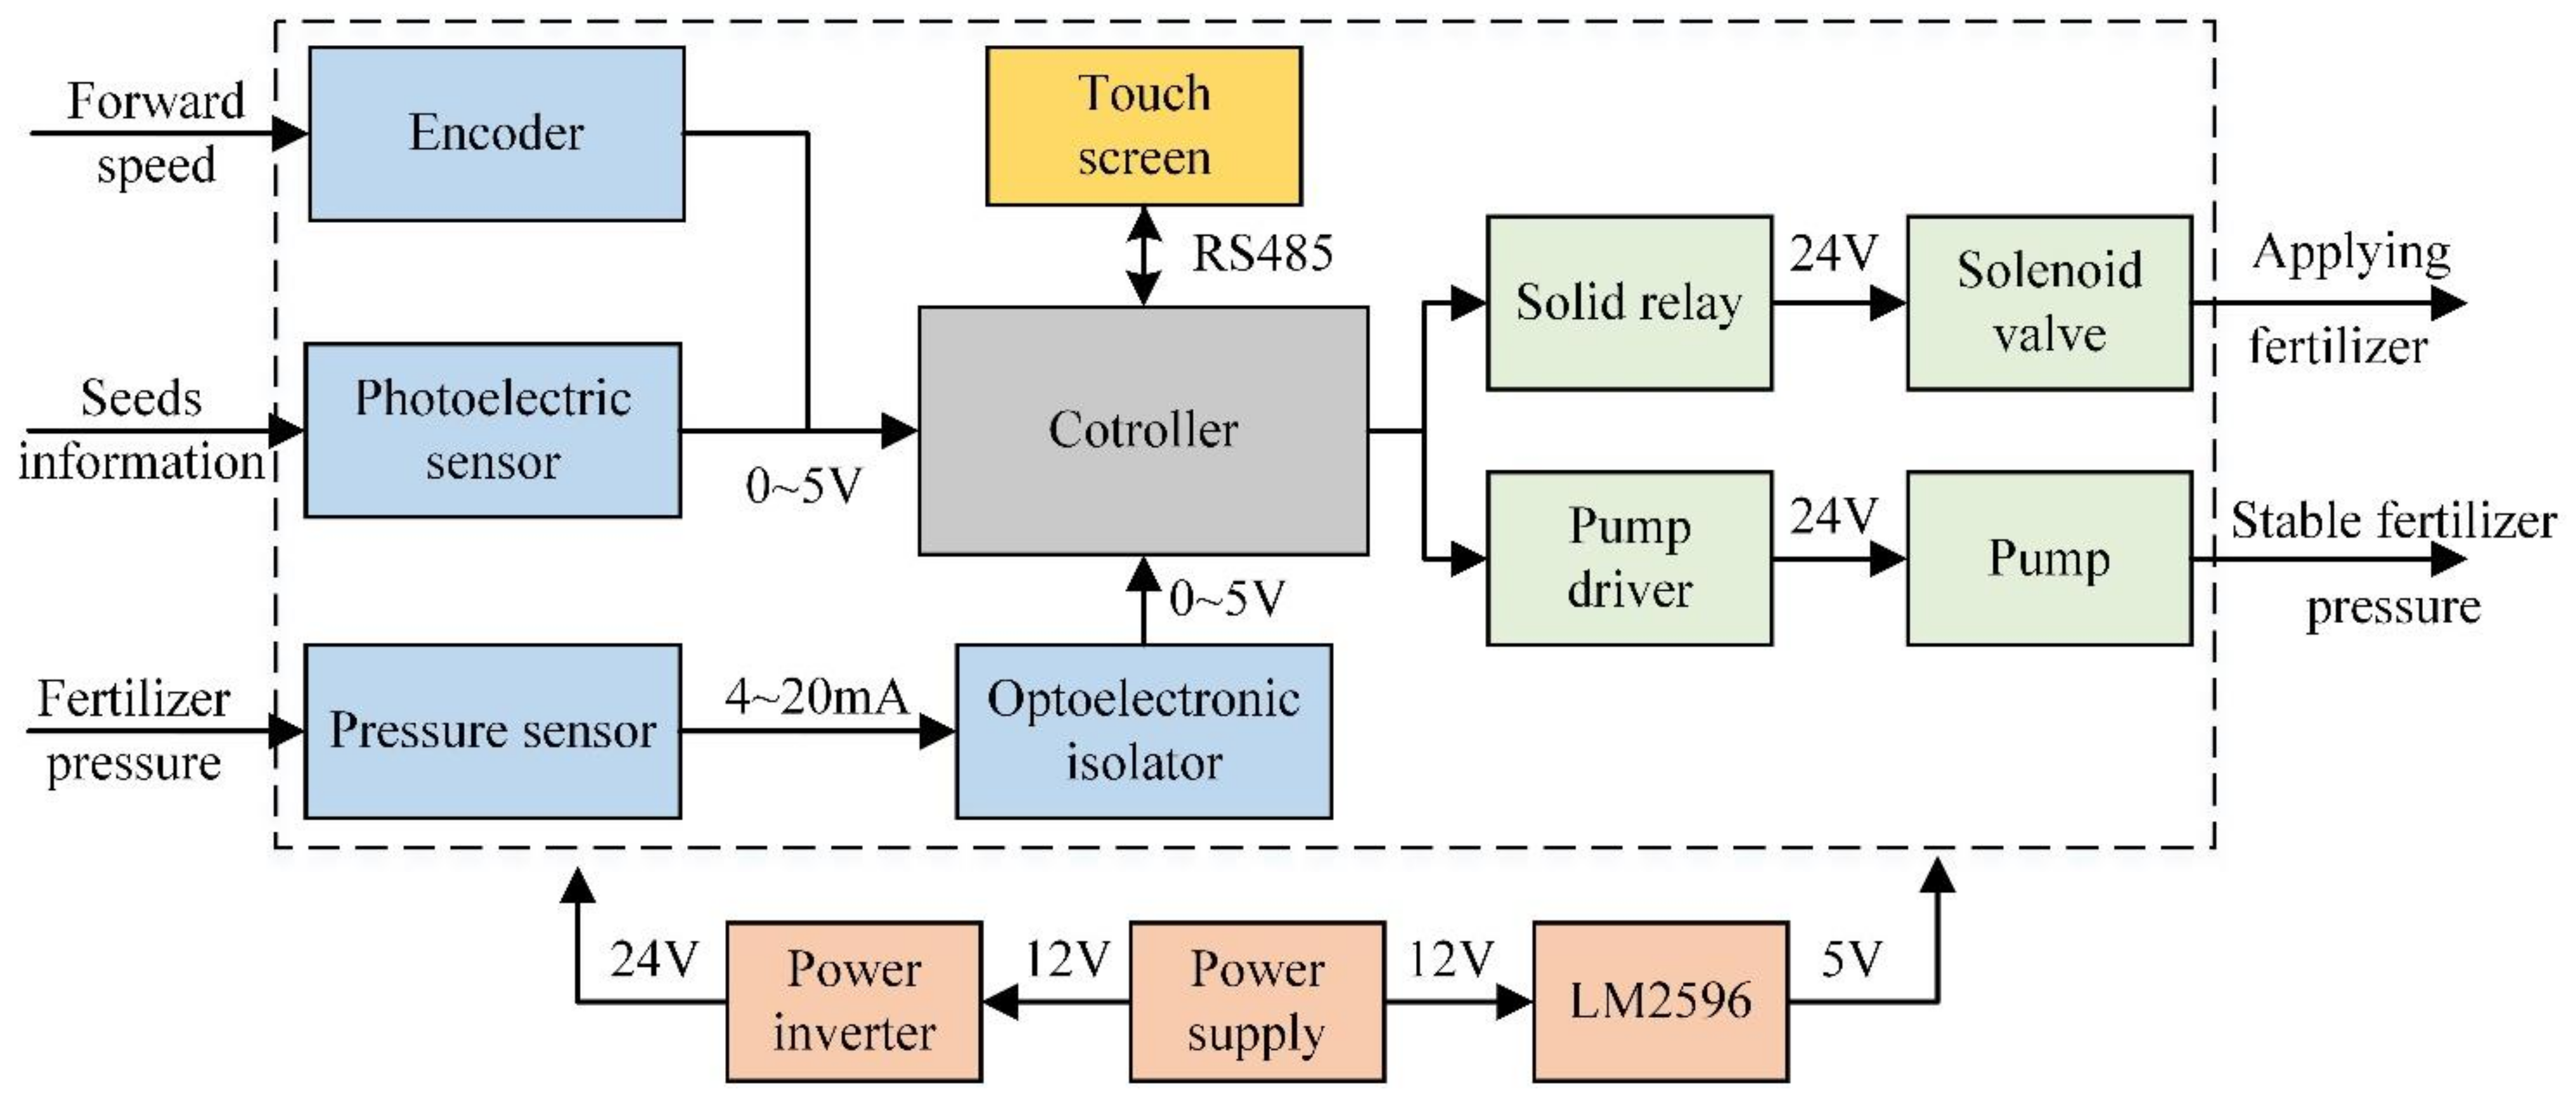
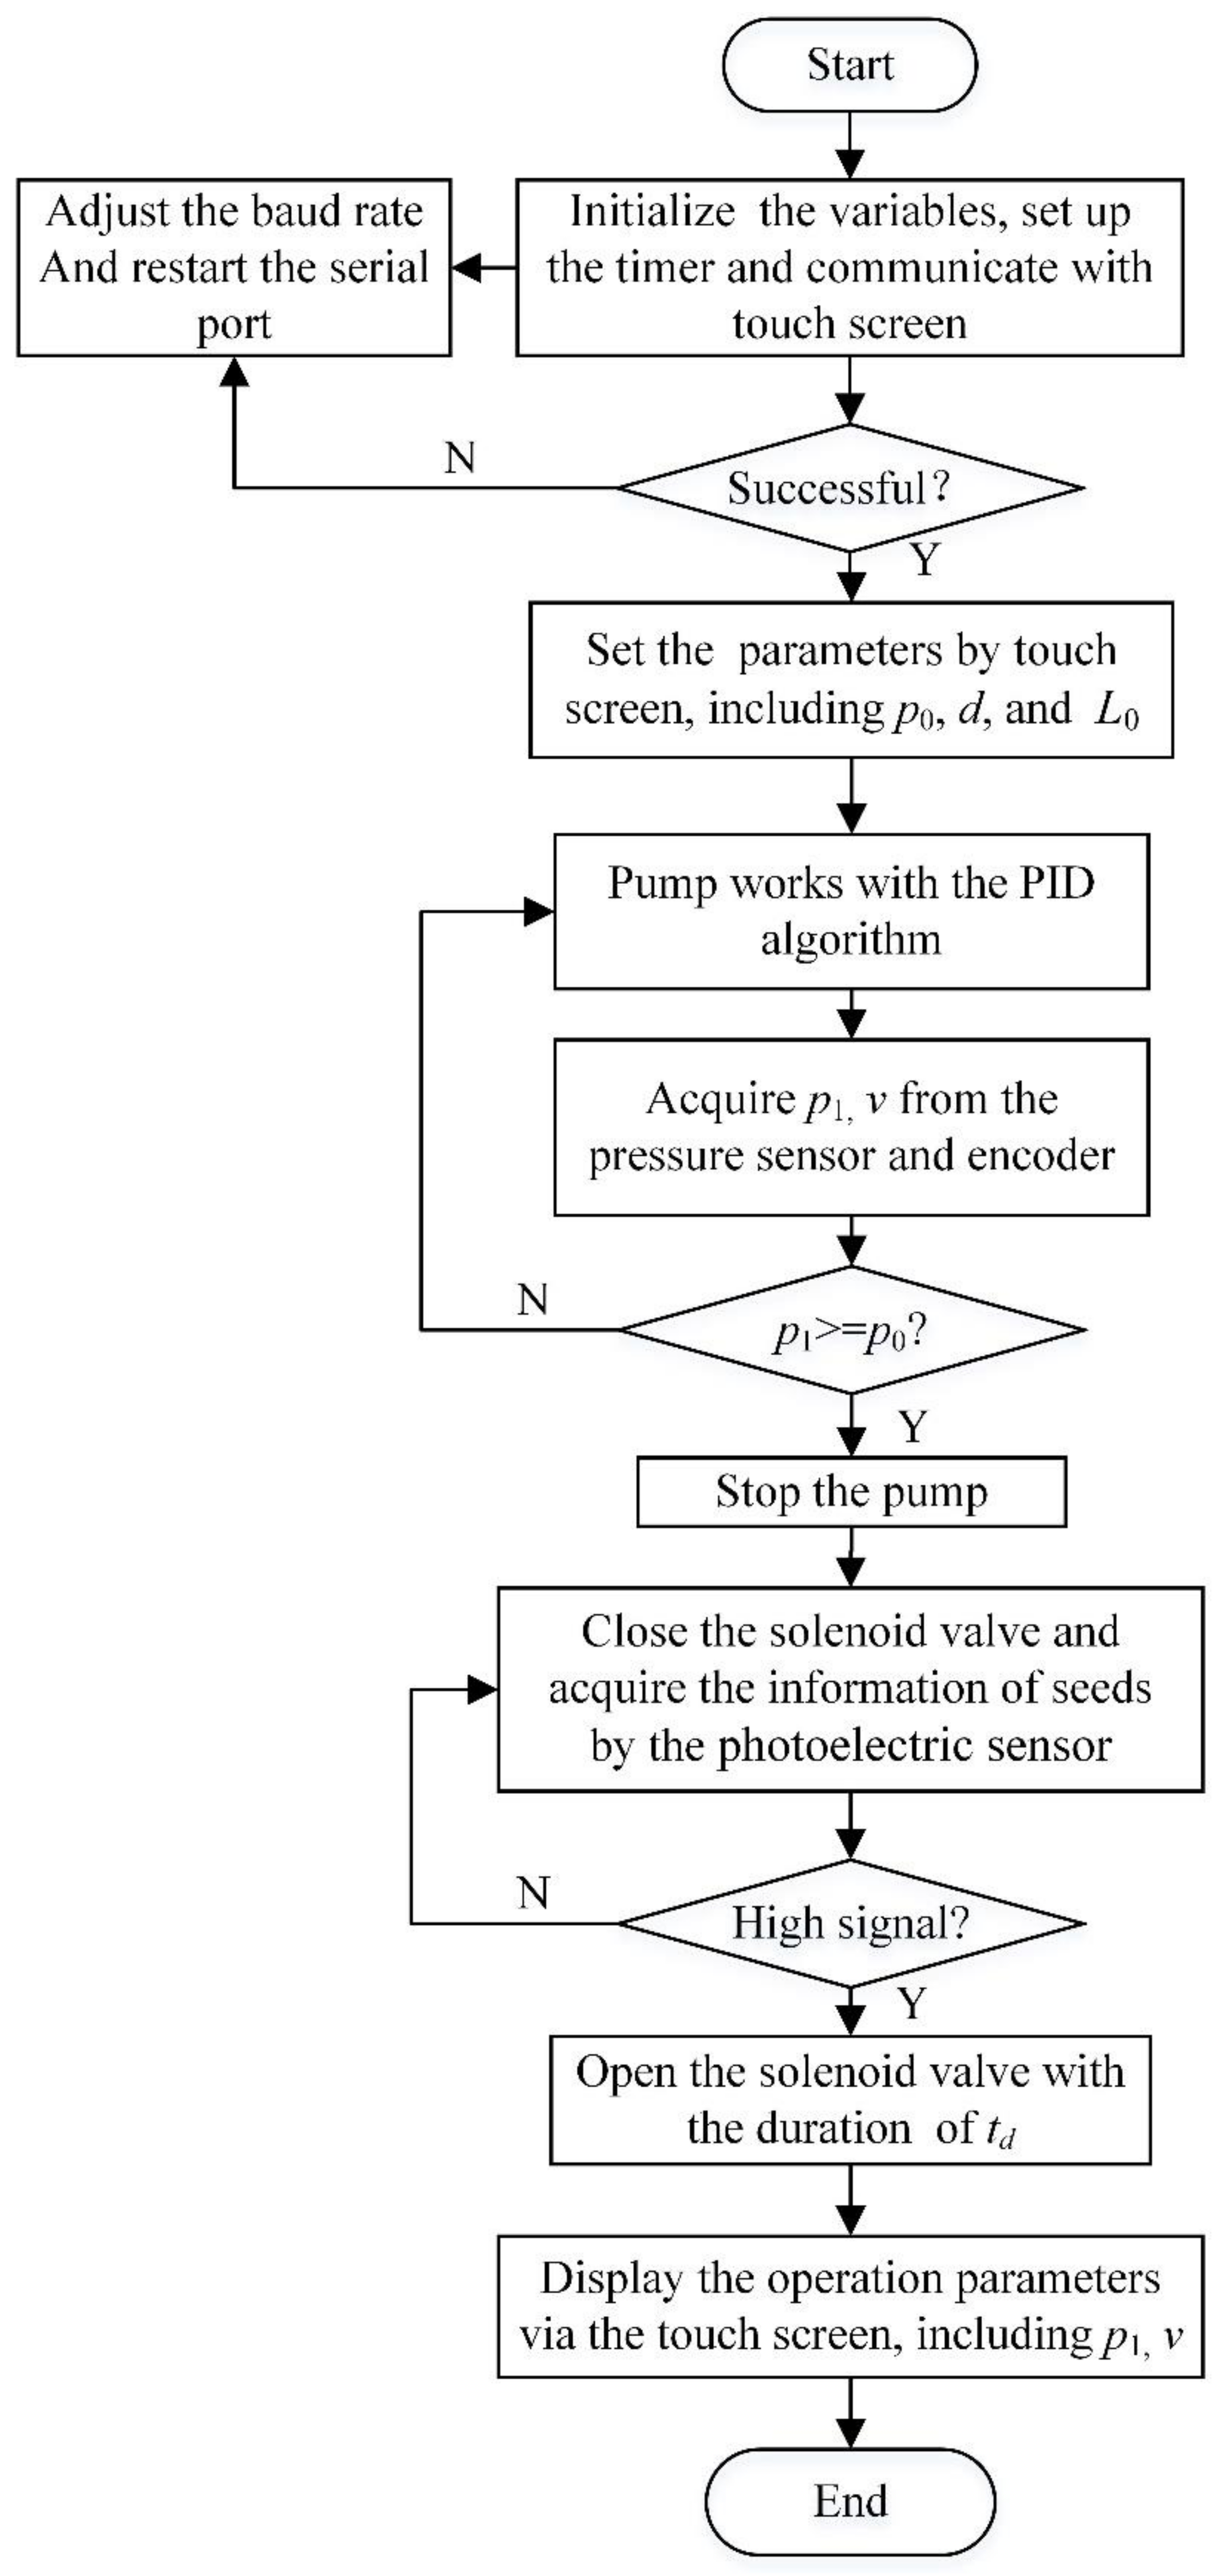
2.2.2. Detection Control System

The detection control system consists of a controller (Guangzhou Xingyi Electronic Technology Co., Ltd. STM32F103ZET6, Guangzhou, China), a photoelectric sensor (Changzhou Huaiyu Electronic Co., Ltd., Changzhou, China), an encoder (VEHA Corporation E6B2-CWZ3E, China), a pressure sensor (MEACON MIK-P300, Hangzhou, China), and a touch screen (WEINVIEW MT6071IP, Shenzhen, China), as shown in Figure 2. The photoelectric sensor detected the signal of seeds falling into the seed tube from the seed metering device. The encoder was used to obtain the forward speed of the tractor. The pressure sensor measured the pressure of the LSF from 0 to 1.0 MPa with a measurement accuracy of 0.005 MPa.
The hardware circuit of the detection control system is shown in Figure 4. The power of was supplied by the tractor’s 12 V battery. A power inverter was chosen to meet the voltage demand of 24 V for the touch screen, pump, and solenoid valve. A voltage reduction circuit using LM2596 was designed to meet the 5 V demand of the controller, encoder, and photoelectric sensor. The touch screen communicated with the controller through RS485 transceivers, which displayed the operation parameters, such as forward speed, pressure, and number of seeds. Additionally, the preset pressure and the plant spacing of maize could be set using the touch screen in real time. The signal of seeds falling into the seed tube and the forward speed were acquired by the controller via a photoelectric sensor and an encoder. The pressure sensor sent the current signal from 4 to 20 mA. An optoelectronic isolator that converted the current signal (4~20 mA) to the voltage signal (0~5 V) was added due to the controller not being able to directly receive the current signal. The power of the pump was controlled in real time by sending different duty cycles of the pulse width modulation signal from the controller to the pump driver, which made the pump work at different flow rates. The opening and closing of the solenoid valve were controlled by the controller through a solid relay.
The algorithm flow chart of detection control system is shown in Figure 5. The controller started to initialize and communicated with the touch screen when power was supplied. When the communication status between the controller and touch screen was successful, the operation parameters, such as the current pressure of the LSF supply system (p0), the plant spacing of maize (d), and the target length of the LSF (L0), were set via the touch screen, and the system started to work. The diaphragm pump worked when the actual pressure of the LSF supply system (p1) was less than p0 and stopped working when p1 was equal or greater than p0. The PID algorithm was widely used in closed loop control. The target value was obtained by correcting the output of the controlled object through feedback [33,34]. The PID algorithm was used to stabilize the pressure of the LSF and had been studied in previous research [35]. The controller sent a high signal to open the solenoid valve after a delay of t1, when the photoelectric sensor detected the signal of seeds falling into the seed tube. t1 is composed of the following two parts: program execution time (t2) and delay time set by the program (tdel). t2 was determined to be 0.096 s by calculating the algorithm execution time of the controller using an oscilloscope (Tektronix, Inc. THS3000, Beaverton, OR, USA). To guarantee the target value (0.05 m) of the distance between the seeds and the LSF (L, Figure 1), t1 should satisfy Equation (1),
t 1 = Δ t + ( D + D 1 Δ s ) 3.6 v t H
where tH is the time required by the LSF to proceed from the spray nozzle to the seed bed (s); D is the distance between the seeds and the liquid starter fertilizer (m); D1 is the distance between the spray nozzle and the photoelectric sensor in the horizontal direction (m); Δs is the distance between the seeds on the seed bed and the photoelectric sensor in the horizontal direction (m); Δt is the time for the seeds falling form the photoelectric sensor to the seed bed (s); v is the real-time forward speed of the tractor (km/h).
High-speed camera can capture and record the instantaneous state of objects, and it has been used in some studies needing to capture rapid changes [36,37]. A high-speed camera (FuHuang AgileDevice Revealer 5F01, Hefei, China) was used to monitor the seeds falling from the photoelectric sensor to the seed bed and the LSF spraying from spray nozzle to the seed bed in this study. The actual time value (ta) was calculated using Equation (2):
t a = F n F
where ta is the actual time (s), Fn is the total number of frames, and F is the frame rate of the high-seed camera (frame per second).
The values of tH ranged from 0.010 to 0.018 s at the pressures of 0.10 to 0.30 MPa. In this study, tH was determined by the average value, which was 0.014 s. D and D1 were 0.05 and 0.127 m, respectively. Δs and Δt were set as 0.112 m and 0.132 s, respectively, as detailed in Section 3.2. Therefore, tdel was ultimately derived by
t d e l = 0.022 + 0.018 v
The solenoid valve was closed after opening time of td. td is the duration of every seed to which LSF was, calculated as:
t d = 3.6 L 0 v
where L0 is the target length of the LSF (m).
The operation parameters (p1 and v) of the system were detected and displayed on touch screen in real time. The program was stopped by setting the parameters on touch screen once the fertilization task was completed.

2.3. Evaluation Experiments

2.3.1. Test Arrangement

The FL was determined by the duration of every seed application of the LSF (DT). DT was controlled by the time set using the timer in the controller (ST), but the values between DT and ST were not exactly same due to the delay caused by the mechanical structure of the solenoid valve [31,32]. A calibration experiment was conducted first to determine the relationship between DT and ST at pressures of 0.10 (P 0.10), 0.15 (P 0.15), 0.20 (P 0.20), 0.25 (P 0.25), and 0.30 MPa (P 0.30), and three replications were conducted. The ST was set to 16 (ST 16), 20 (ST 20), 30 (ST 20), 40 (ST 40), 50 (ST 50), or 60 ms (ST 60) by the pre-experiment results. The pre-experiment was conducted at different ST values. The DT values were obtained by a high-speed camera according to Equation (2). The values of ST chosen in this study could satisfy the DT demand at different forward speeds.
The distance between the seeds on the seed bed and the photoelectric sensor in the horizontal direction (Δs) as well as the time required for the seeds falling form photoelectric sensor to the seed bed (Δt) (Figure 1) were significant factors affecting the distance between the seeds and the LSF. The values of Δs and Δt were collected at the forward speeds of 4, 6, and 8 km/h. We conducted 20 trials for each forward speed.
The operation quality of the precise application system for a LSF was evaluated by testing the FL, FA, and DSL at the forward speeds of 4, 6, and 8 km/h and the pressures of 0.10 (P 0.10), 0.15 (P 0.15), 0.20 (P 0.20), 0.25 (P 0.25), and 0.30 MPa (P 0.30). The experiments were repeated 20 times for FL and 3 times for FA and DSL at different treatments, respectively.

2.3.2. Test Conditions and Indexes

To calibrate DT and acquire Δs and Δt, a test bench of the precise application system and electric-driven sowing system were developed (Figure 6). The electric-driven sowing system was used to simulate the field operation of planters, which consisted of a seed meter (Precision Planting, Tremont, IL, USA), drive motor (Times Brilliant Electrical LLC 57BL115S21-230, China), and motor reducer (Times Brilliant Electrical LLC PX57, China). The relationship between the rotating speed of the drive motor, the plant spacing of the maize, and the forward speed was derived using
n = 50 3 × i v N d
where n is the rotating speed of the driver motor (rotations/min), N is the total number of finger clamps of the seed meter, i is the reduction ratio of the motor reducer, d is the plant spacing of maize (m). i and N were held constant, while the types of seed meter and drive motor were varied. d was set before operating according to the different seed and field conditions. Therefore, the forward speed of the tractor was simulated by setting different rotating speeds of the driver motor. In this study, the values of i, N, and d were 12, 36, and 0.25 m, respectively.
The bench experiments were conducted at the Conservation Tillage Research Center of China Agricultural University. A high-speed camera was used to obtain the DT values. In this study, the time required by the seeds to leave from the seed tube to the seed bed was very short. Thus, the influence of the tractor’s forward speed on the seed trajectory during this process was not considered. The seed trajectory was captured by the high-speed camera at different simulated forward speeds. Δt was calculated by Equation (2) through the frames captured by the high-speed camera. Δs was measured using a graph paper (Figure 6). The average values of 20 trials were taken as the values of Δt and Δs.
Field experiments were conducted in Shenyang, Liaoning Province, China, to evaluate the performance of the precision application system (Figure 7). The FL, the amount of the FL, FA, and DSL were obtained at different forward speeds and pressures (Figure 8). The FL and the DSL were measured using a ruler. The FA for every seed was obtained using a measuring cylinder.
The qualified index of the length of the liquid starter fertilizer (QIL) and the qualified index of the distance between the seeds and the liquid starter fertilizer (QID) were used to evaluate the accuracy of the precise application system, which were calculated by Equations (6) and (7), respectively:
Q I 1 = 1 | L L 0 | L 0 × 100 %
Q I 2 = | D D 0 | D 0 × 100 %
where QI1 is the qualified index of the length of the liquid starter fertilizer for each seed (%), QI2 is qualified index of the distance between the seeds and the liquid starter fertilizer (%), D0 is the target distance between the seeds and the liquid starter fertilizer (m), and L0 is the target length of the liquid starter fertilizer (m). L0 and D0 were set to 0.07 m and 0.05 m, respectively, in this study.
The values of FA for every seed were obtained by a measuring cylinder. To eliminate random error, the average value from 10 trials was taken as the amount of the liquid fertilizer for every seed. The average value of FA was calculated by
V = 1 n i = 1 n V i ( i = 1 , 2 n )
where V is the average amount of the liquid starter fertilizer for every seed (mL), n is the total number of seeds, and Vi is the ith amount of the liquid starter fertilizer (mL).

2.3.3. Statistical Analysis

Analysis of variance (ANOVA) was conducted using the general linear model function of the statistical software (IBM SPSS Statistics 26, IBM, USA) to examine the effects of the experimental factors (pressure and forward speed) on the FL, FA, and DSL.
The full factors model was chosen for ANOVA, and the interaction of factors was considered. Statistical significance was considered at p < 0.05. The statistics were repeated three times for each treatment. Means of measured variables were compared using the least significant difference (LSD).

3. Results and Discussion

3.1. Calibration of the Duration of Applying Liquid Starter Fertilizer to Every Seed

The DT values are provided in Table 1. DT and ST showed a positive correlation: DT increased with increasing ST. The minimum and maximum value of DT were 34.5 and 145.3 ms, respectively. DT was affected by pressure, and the values of DT were much higher with higher pressure. The difference in DT between different pressures were 1.3, 2.2, 9.0, 16.6, 24.2, and 21.8 ms for ST 16, ST 20, ST 30, ST 40, ST 50 and ST 60, respectively. The difference in DT with different pressures might have been caused by the spray nozzle. As described in Section 2.2.1, the spray nozzle was opened when the pressure was greater than the preload of the spring. The compression and extension times of the spring are related to force according to Newton’s second law [19]. The time is short when the force is low. In this research, the force was exerted by the pressure of the LSF. Thus, the opening of the spray nozzle occurred later, and the closing of spray nozzle occurred earlier when the pressure of the LSF was low. The DT values were thus small when the pressure was low, which is consistent with the experimental results. The opposite results were obtained when the pressure was high.
The experimental results of DT and ST were fit at different pressures (Figure 9). The degree of fit was greater than 0.989, indicating a good linear relationship between DT and ST. The slopes of the fitted equations were 1.918, 1.874, 2.285, 2.387, and 2.467 for P 0.10, P 0.15, P 0.20, P 0.25, and P 0.30, respectively. The results showed that a larger changing rate of DT occurred when pressure was high, indicating that a wider adjustment range of DT could be acquired. The error of DT was larger compared with the fitted equation when ST was 16 ms. This may be caused by a delay in the mechanical structure of the solenoid valve [31,32]. The values of DT were affected by the delay of the solenoid valve particularly when ST was close to the delay time. In this study, the DT value with ST 16 was significantly affected by the delay in the solenoid valve, with larger error than in the other treatments.

3.2. Determination of the Falling Time and Position of Seeds

The distance between the seeds on the seed bed and the photoelectric sensor in the horizontal direction (Δs) and the time for the seeds falling from the photoelectric sensor to the seed bed (Δt) at forward speed of 4, 6, and 8 km/h are shown in Figure 10 and Figure 11, respectively. Different forward speeds simulated by the seed meter were not significantly different for Δt and Δs in the bench tests. Δs and Δt ranged from 0.099 to 0.127 m and 0.120 to 0.151 s, respectively. The average values of Δs and Δt were 0.112 m and 0.132 s, respectively. The random change in Δs and Δt might have been caused by the irregular bouncing of seeds in the seed tube when the seeds were falling from the seed meter, which was similar to the research results of seed location prediction based on satellite positioning [38]. Ultimately, we determined Δs and Δt to be 0.112 m and 0.132 s, respectively.

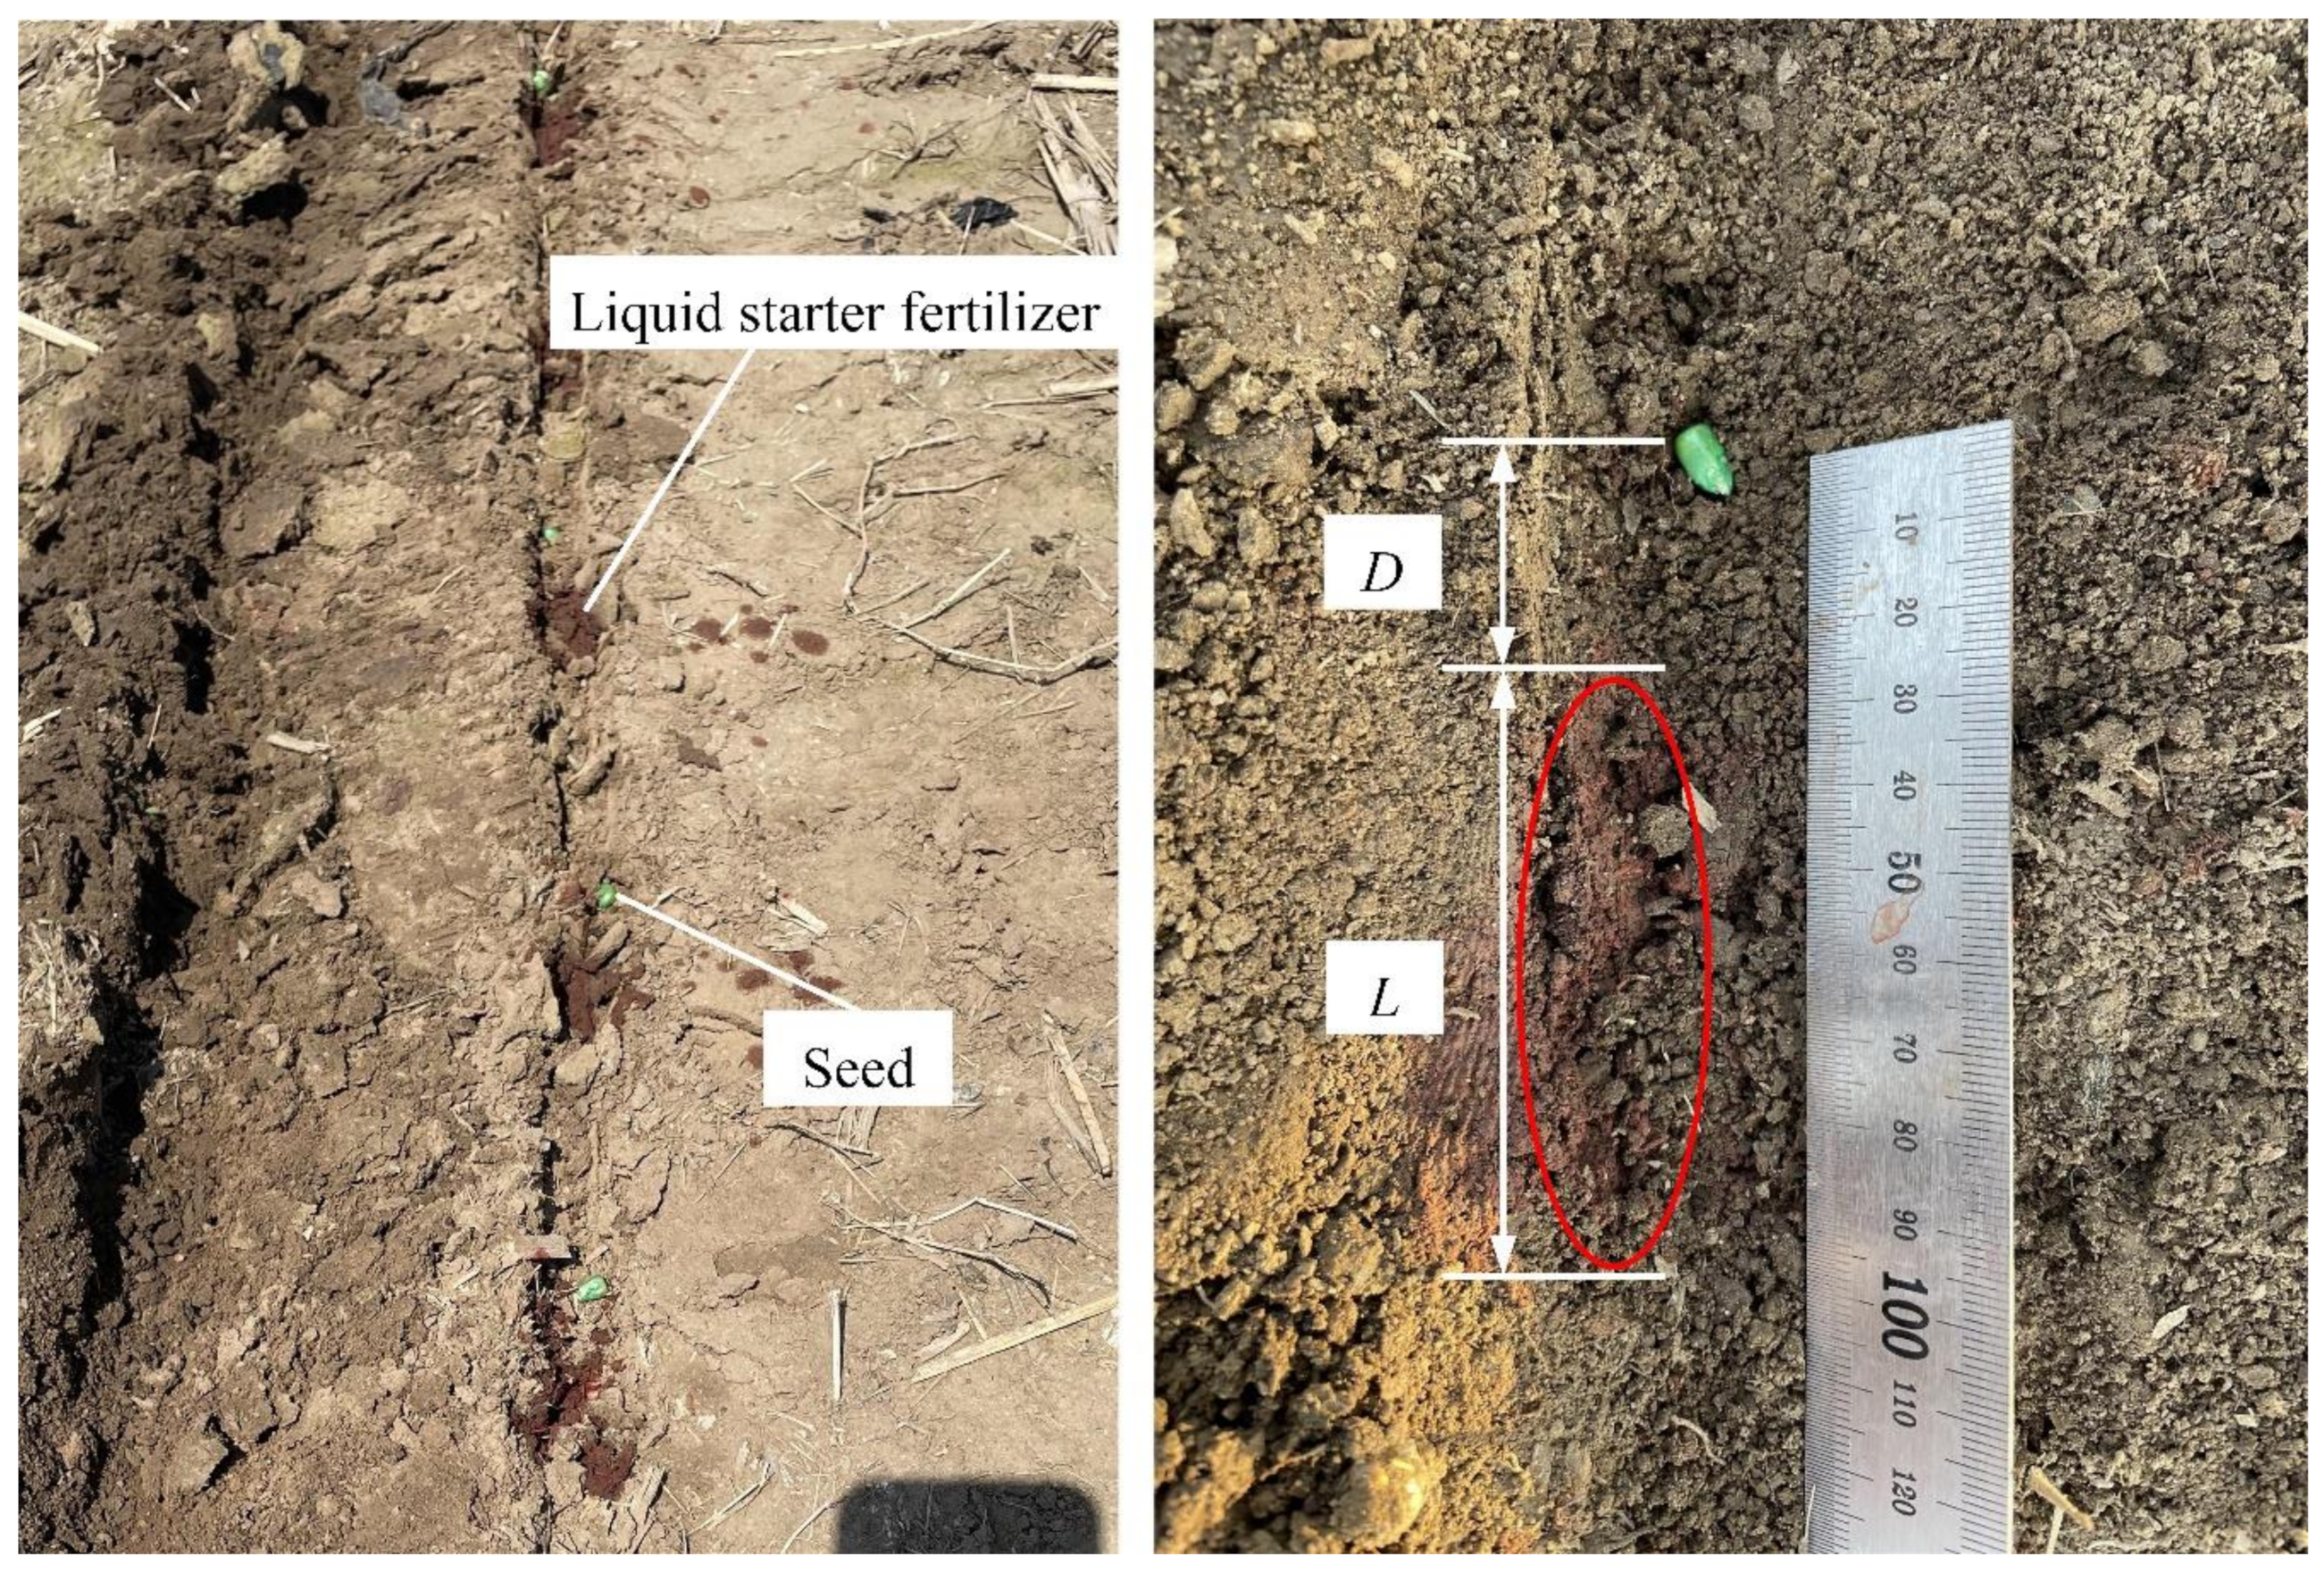
3.3. Length of Liquid Starter Fertilizer

The QIL values are provided in Table 2. As the pressure increased, the QIL decreased at the three forward speeds except for P 0.10. A higher QIL was acquired when the pressures were 0.15 and 0.20 MPa. The P 0.25 and P 0.30 treatment had worse QIL values, especially P 0.30, maybe because the opening time of the spray nozzle was longer when the pressure of the LSF was much higher than the preload force of the spring. The values of FL were larger than the target value (0.07 m) and a lower QIL was obtained. Conversely, the FL value was smaller than the target value when the pressure was lower than the preload force of the spring. A lower QIL was obtained with the P 0.10 treatment. The QIL decreased with increasing forward speed. According to Equation (4), the values of DT were determined by the forward speed if the target value of FL was obtained. The value of DT was small when the forward speed was high. The smaller DT was easily affected by the delay in the solenoid valve, and DT would be less than the target value according to the analysis in Section 3.1. Therefore, the QIL was lower when the forward speed was higher. The highest QIL was 96.4% when the forward speed was 4 km/h, and the pressure was 0.15 MPa.
The distribution uniformity of FL for P 1.0, P 2.0, and P 3.0 is shown in Figure 12. The distribution uniformity was worse with increasing pressure and forward speed. Worse distribution uniformity might have caused the lower QIL. The pressure of the LSF supply system was unstable when the preset pressure was high. The FL was affected by the unstable pressure, resulting in worse distribution uniformity. The values of ST were smaller when the forward speed was high. The error in DT was easily affected by the delay on the solenoid valve. Thus, greater fluctuation in FL occurred when the forward speed was high.
The ANOVA of FL is described in Table 3. FL was significantly affected by the forward speed (p < 0.05) and pressure (p < 0.01), indicating that the appropriate pressure and forward speed are important to obtain higher QIL values. The results showed that FL increased with the increase of pressure (Figure 13). The value of FL was close to the target in treatments P 0.15 and P 0.20. Treatment P 0.30 had biggest FL value. The actual values of FL were larger than the target value (0.07 m), except for treatment P 0.10 in the test. That means DT was longer than ST in most instances. In the calibration experiment, the solenoid valve worked in a single opening state. However, the solenoid valve worked at a high-frequency switching state of opening and closing during the field experiments, this might have caused values of FL larger than the target value. The values of FL were smaller than the target value when the pressure was 0.10 MPa, probably because the force exerted by the pressure of the LSF was close to the preload of the spring of the spray nozzle. The values of DT were less than the target value influenced by the spray nozzle, which resulted in smaller FL values.

3.4. Amount of Liquid Starter Fertilizer

FA was significantly (p < 0.01) affected by the pressure and forward speed (Table 3). The experimental results are shown in Figure 14. The range of FA for this system was from 1.34 to 13.86 mL, which is wider than in the case of EUKU-1 developed by Drazic et al. [26]. The maximum FA value was 13.86 mL when the pressure was 0.30 MPa and forward speed was 6 km/h. The minimum value of FA was 1.34 mL when the pressure was 0.10 MPa and forward speed was 10 km/h. The value of FA increased with the increase of pressure. Wang et al. [39] also found that the amount of the liquid fertilizer is positively related to the pressure. The FA decreased as the forward speed increased. DT showed an inverse relationship with the forward speed when the value of L was constant, as described by Equation (4). A shorter DT caused a smaller FA. Thus, a smaller value of FA was obtained when the forward speed was higher.

3.5. Distance between the Seeds and Liquid Starter Fertilizer

The values of QID regarding the treatments with different pressures and forward speeds are provided in Table 2. QID showed a decreasing trend as the forward speed increased. The values of QID did not obviously change with the change in pressure. The best QID was 82.6%, obtained when the pressure was 0.25MPa and the forward speed was 4 km/h. The ANOVA of DSF is described in Table 3. The DSF was significantly affected by the forward speed (p < 0.01) and the pressure did not significantly affect DSF (p > 0.05). The DSF increased with the increase in forward speed (Figure 15), which is consistent with the results of QID. This might have occurred because the seed may have bounced when the forward speed was higher. The bounce of seeds could have caused the position of seeds to move backward and the DSL to be longer than normal [38]. The values of DSF were all bigger than the target value of 0.05 m. This circumstance was caused by the delay in the LSF spraying from the solenoid valve through the spraying nozzle. The longer the pipe between the solenoid valve and the spraying nozzle, the longer the delay. Thus, the actual values of DSF in the field experiments were longer than the target value.

3.6. Comprehensive Analysis

To obtain a proper FA and higher QIL and QID, the main influencing factors (forward speed and pressure) in Table 3 should be comprehensively considered. As analyzed above, QIL decreased with decreasing forward speed and pressure, except for the pressure of P 0.10. FA increased with the increase in pressure but decreased with the decrease in forward speed. QID decreased with the decrease of forward speed and was not significantly affected by pressure. This means that high pressure can increase the values of FA but lowers QIL. The FA values with P 0.30 were 8.16, 10.44, and 13.86 mL, and the QIL for P 0.30 was 83.0%, 85.8%, and 89.3% at the speed of 4, 6, and 8 km/h, respectively. A higher forward speed caused lower QIL and QID values (Table 2) but led to lower FA values (Figure 14). The forward speed was also an important parameter for evaluating the work efficiency of the field operation and should be set as high as possible before evaluating the fertilization performance. In general, the FA should be determined first by the field conditions and the type of corn. The optimal forward speed and pressure were chosen for the precise application system according to the FA in Figure 14, and the QIL and QID in Table 2. The forward speed of a tractor was not constant when operating in the field. The pressure of the system was adjusted in real time to guarantee target values of FA, FL, and DSF. Additionally, the bounce of seeds in the seed tube should be further studied. Precise position prediction of the seeds could improve the operating quality. In the future, agronomic experiments of this system will be conducted in terms of yield and cost benefits compared with other application methods.

4. Conclusions

We developed a system for applying a LSF precisely while sowing maize to improve the fertilizer use efficiency. We conducted calibration experiments and field experiments and drew the following main conclusions of the study:
(1)
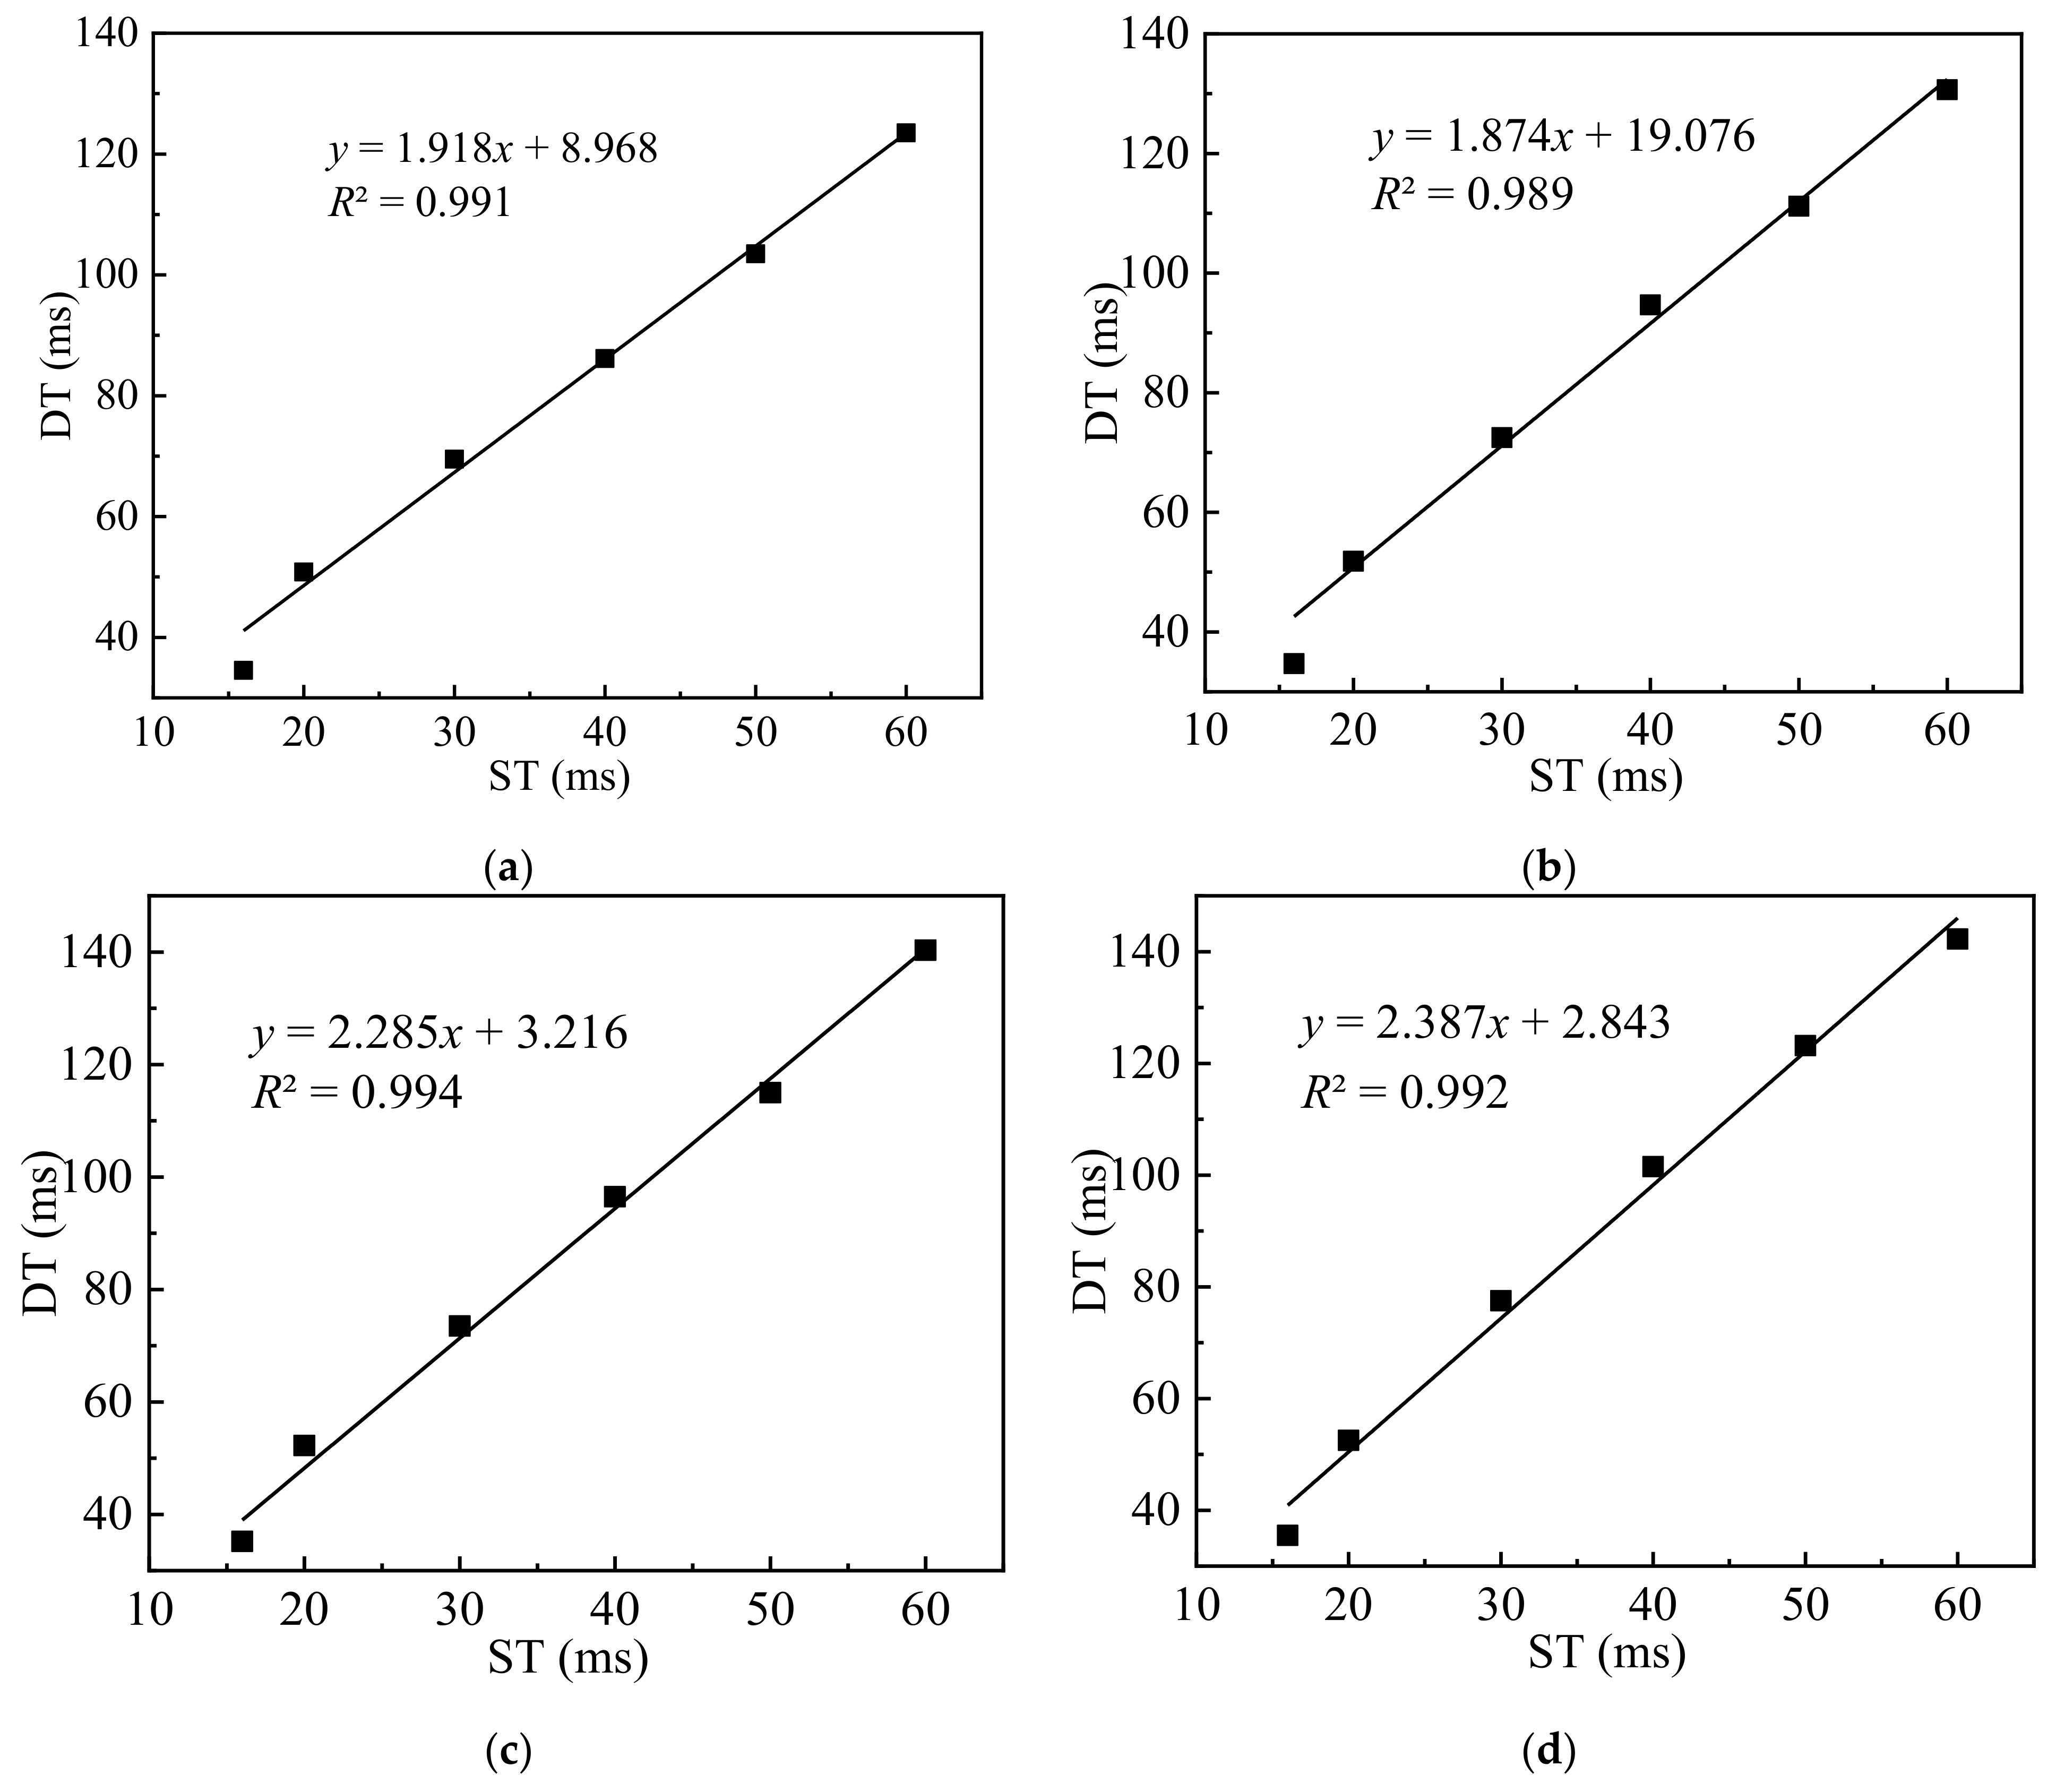
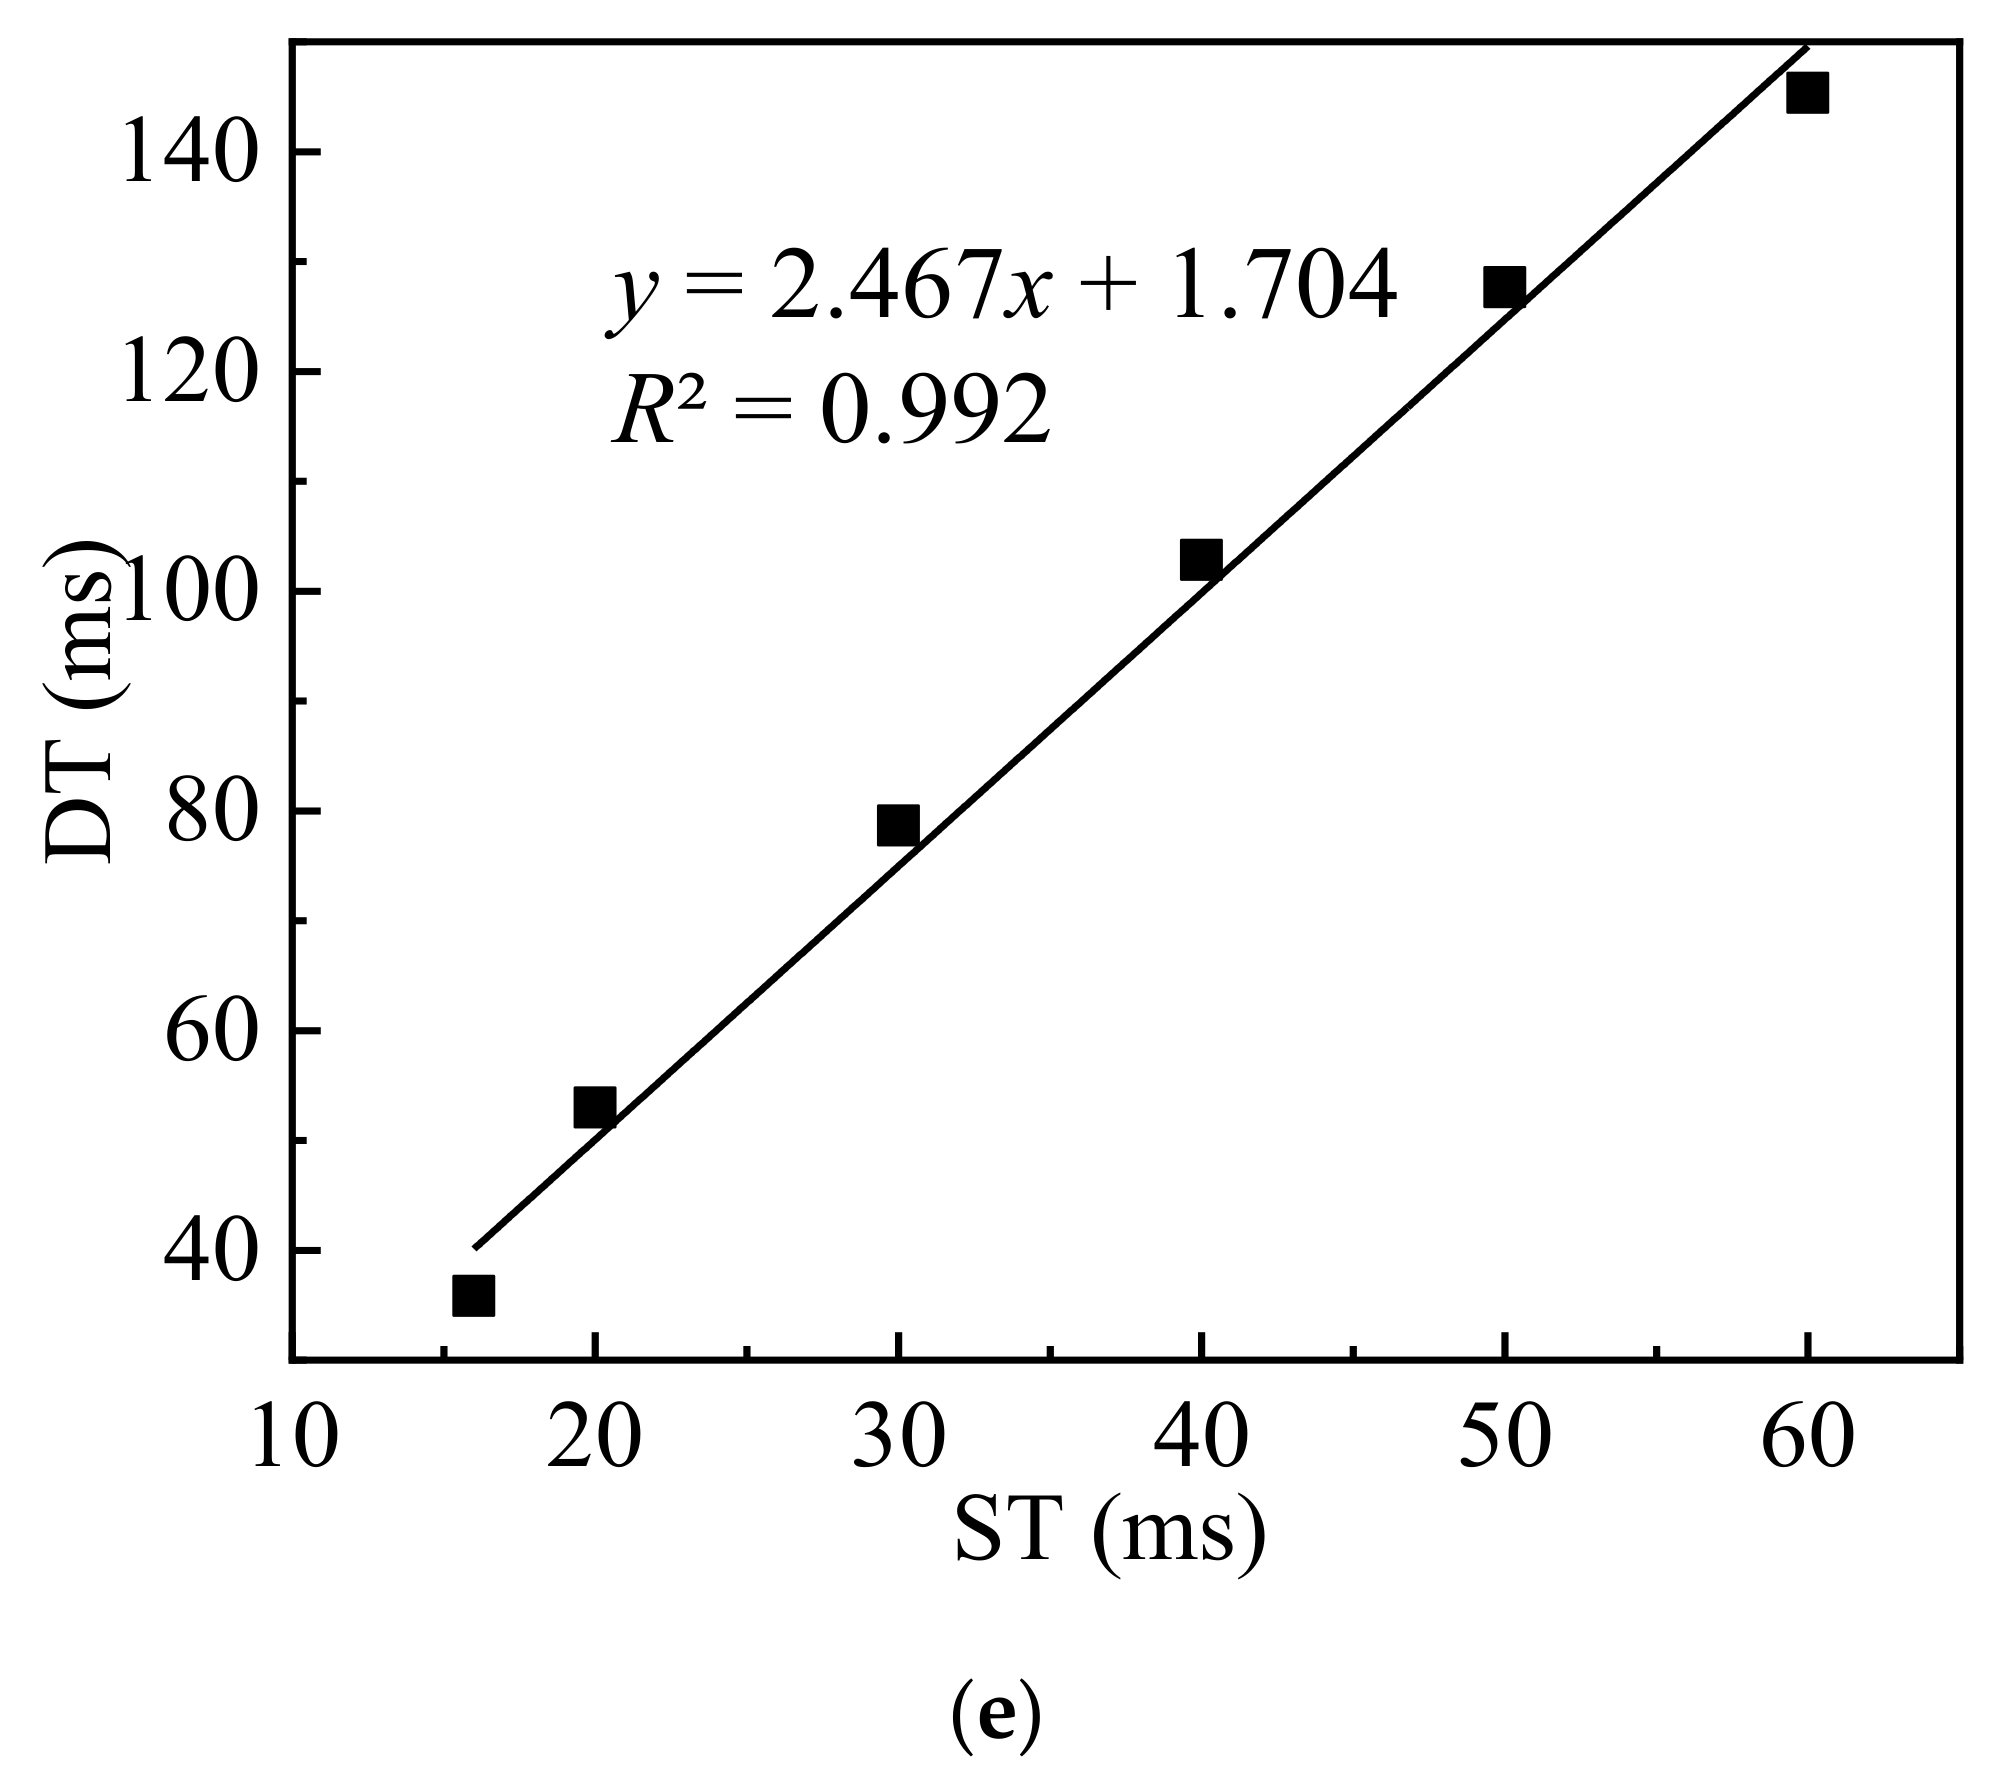
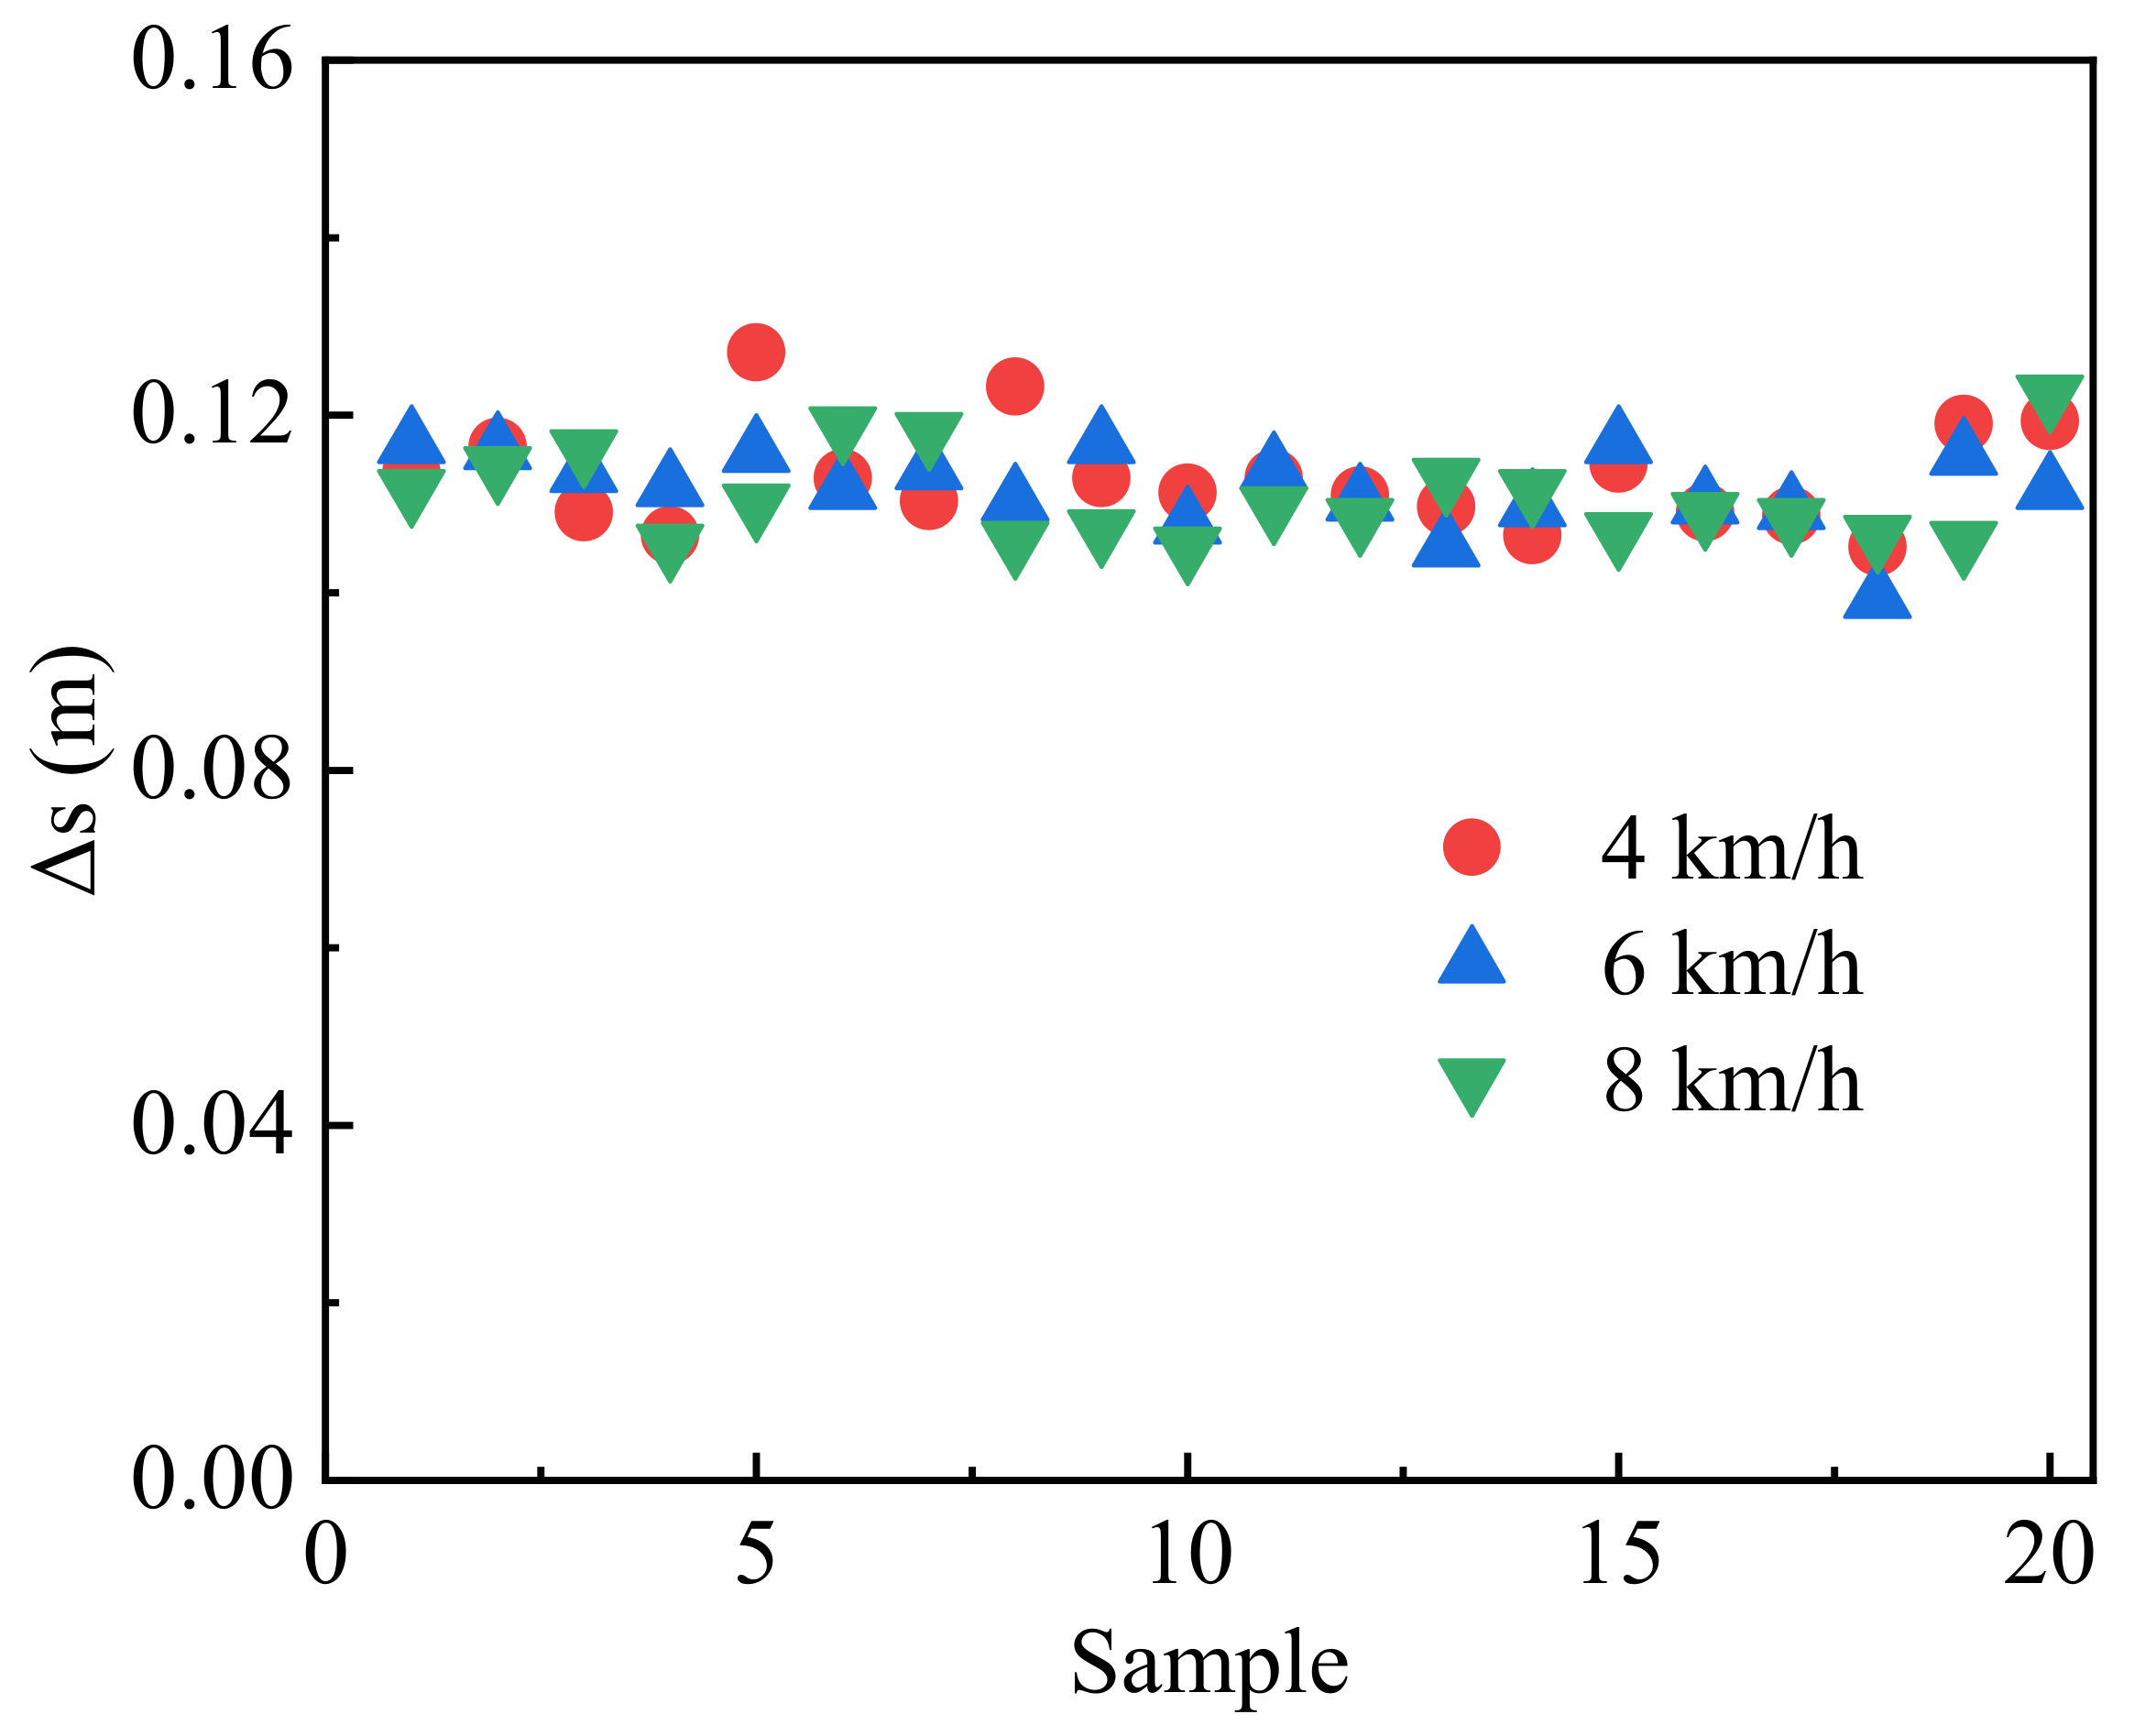
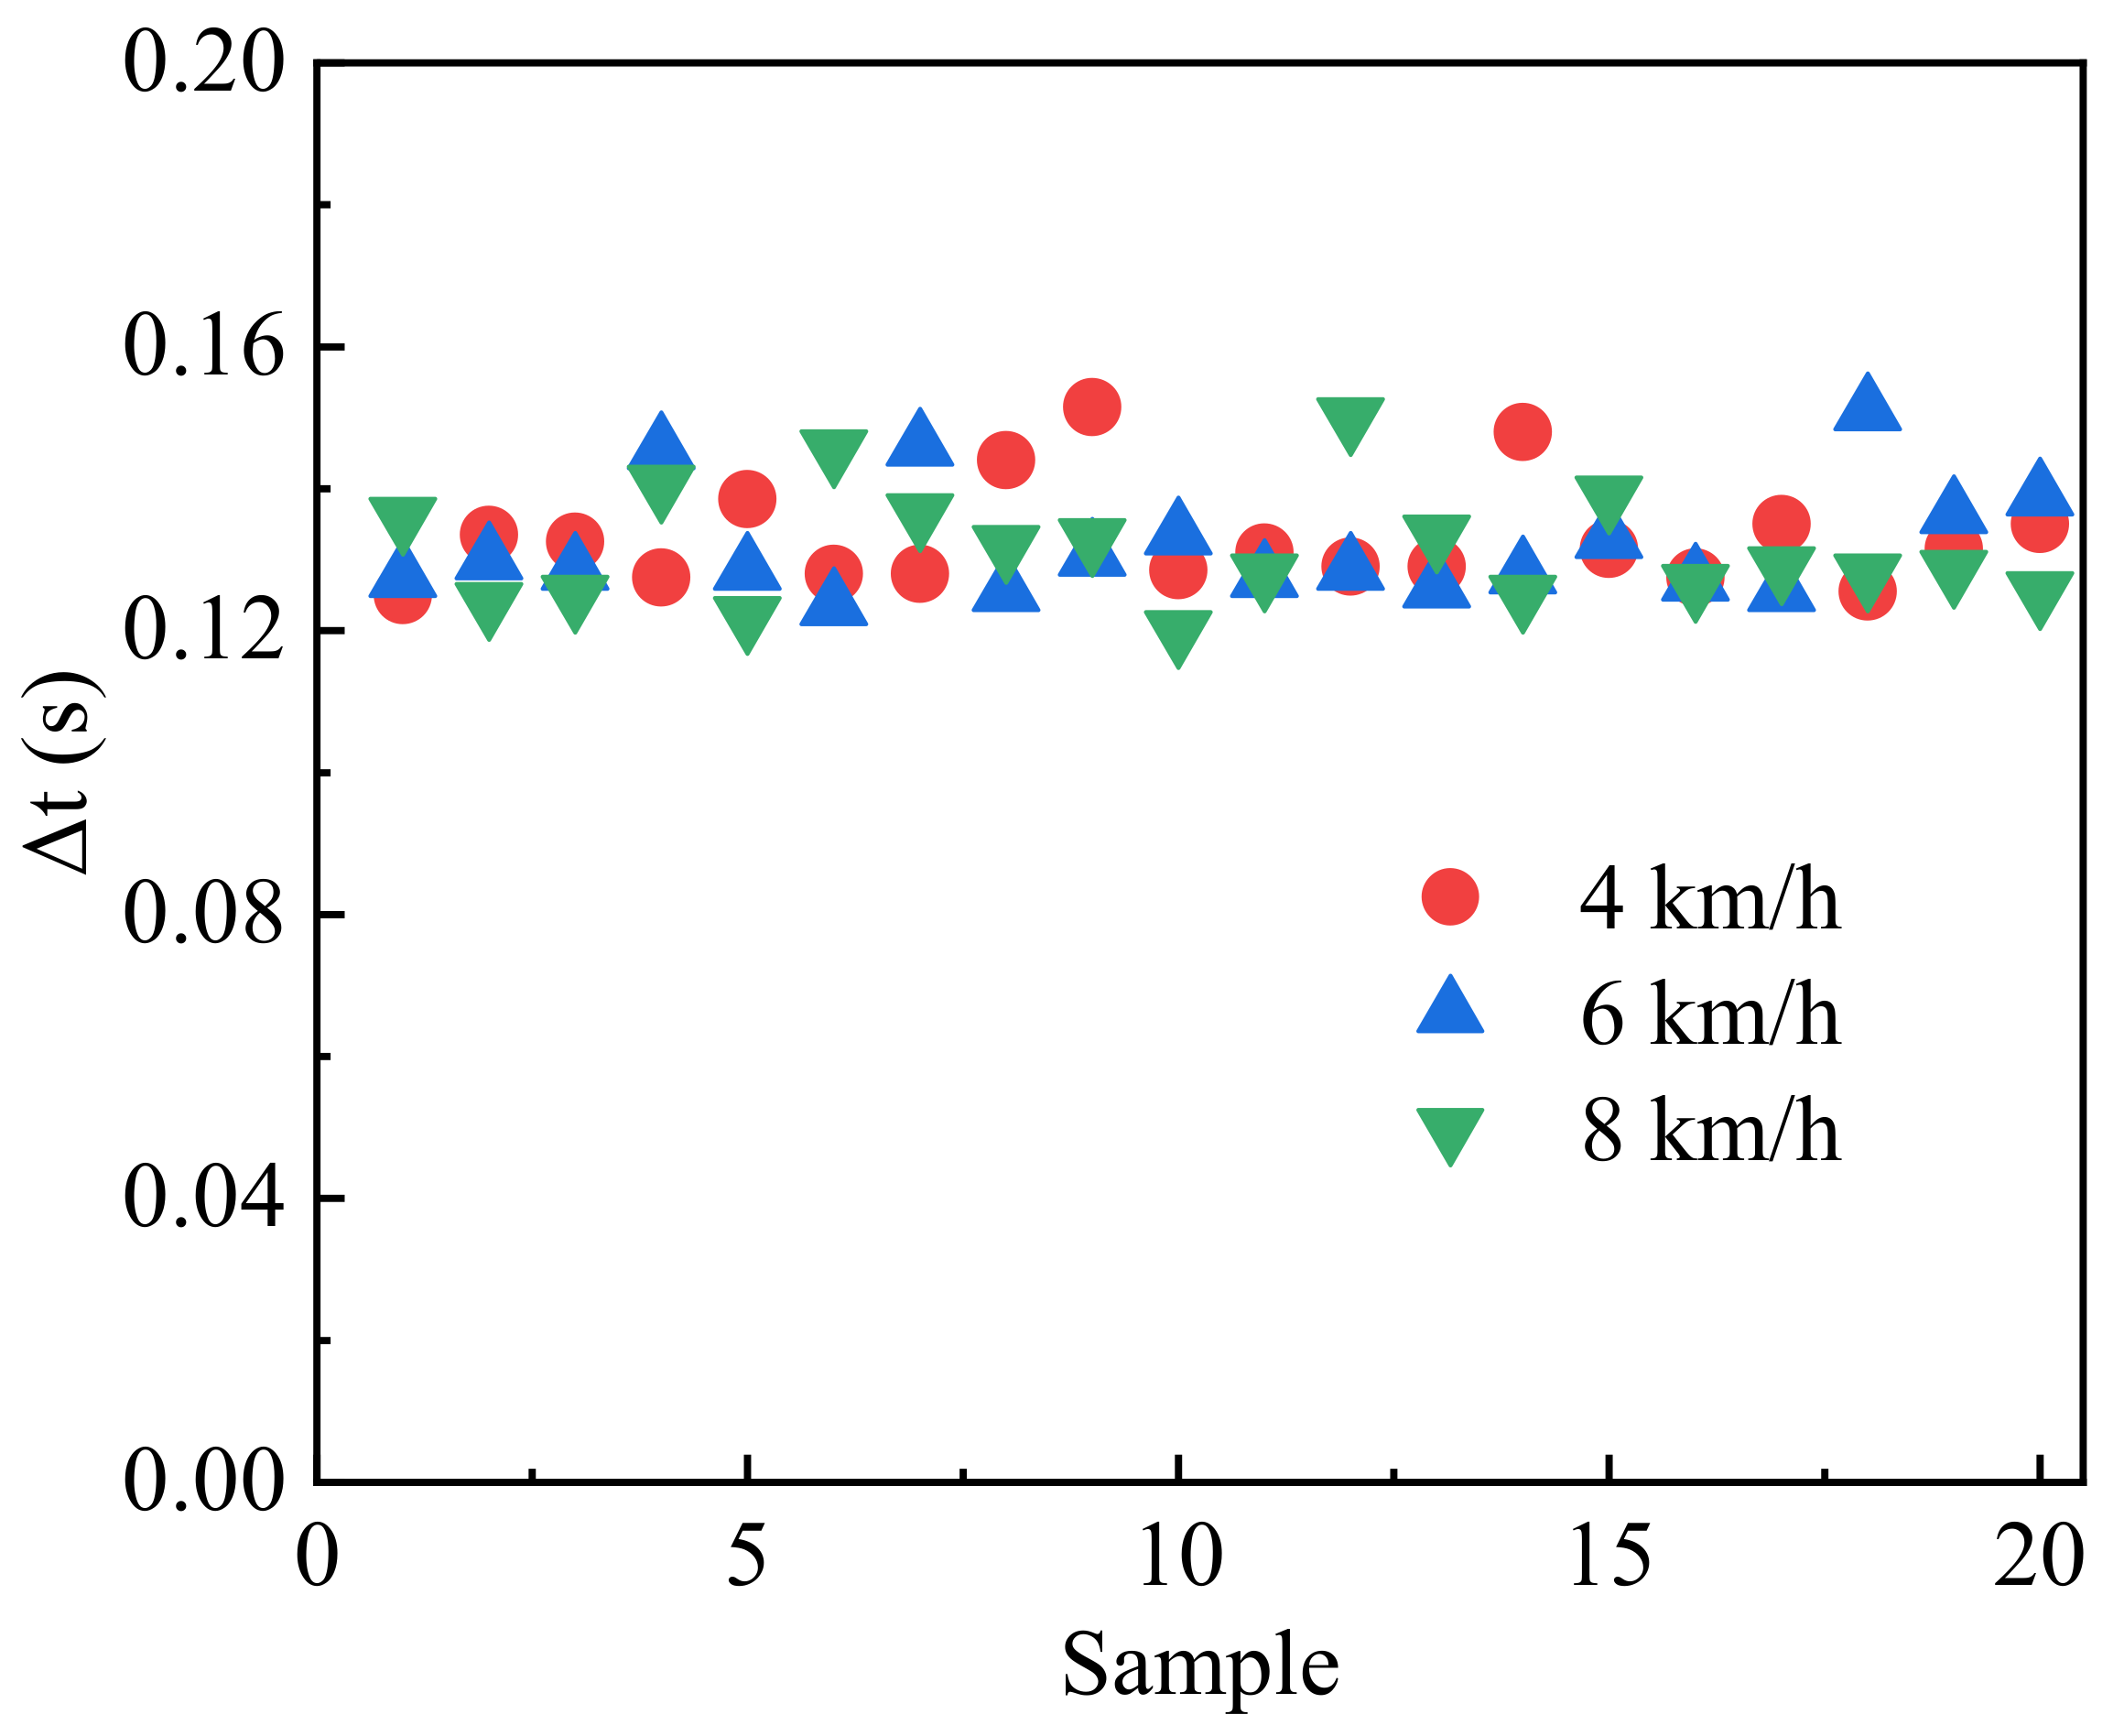
DT and ST had a positive correlation. The minimum and maximum DT were 34.5 and 145.3 ms, respectively. Fitted equations were obtained at different pressures, and degrees of fit were greater than 0.989. The slopes of fitted equations were 1.918, 1.874, 2.285, 2.387, and 2.467 for P 0.10, P 0.15, P 0.20, P 0.25, and P 0.30, respectively. Different forward speeds simulated by the seed meter were not significantly different for Δt and Δs in the bench tests. The Δs and Δt were determined as 0.112 m and 0.132 s, respectively.
(2)
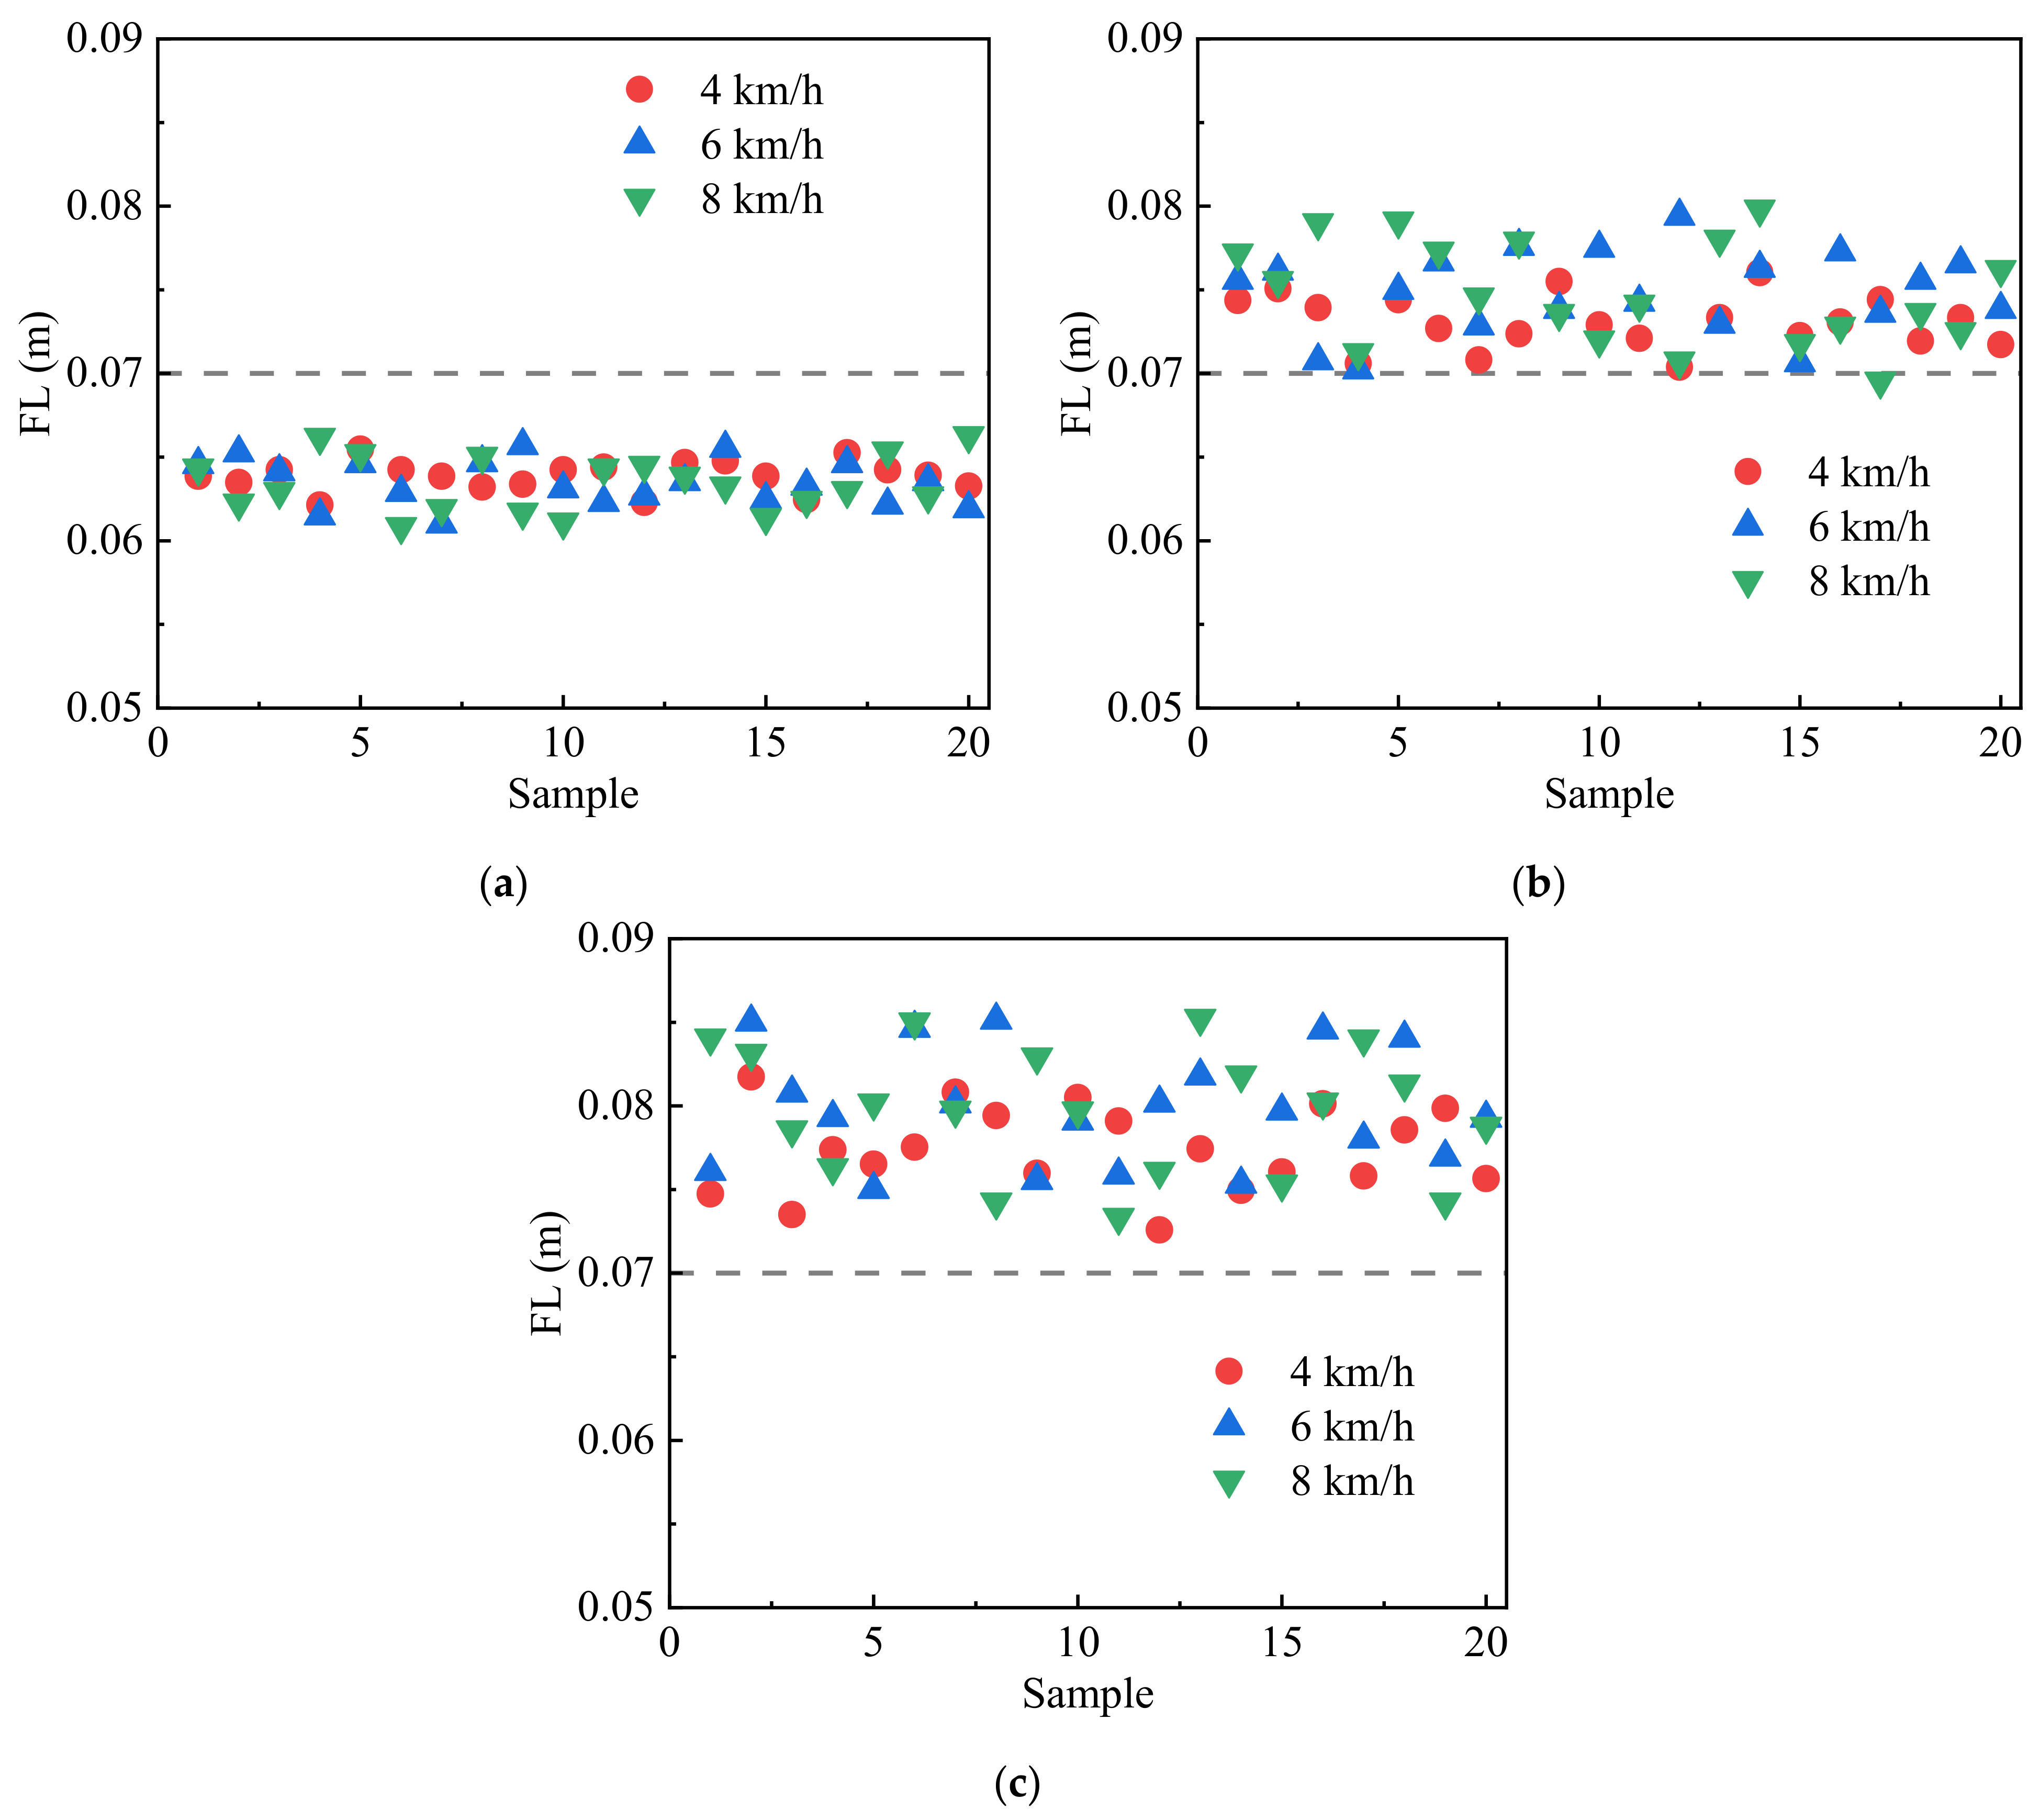
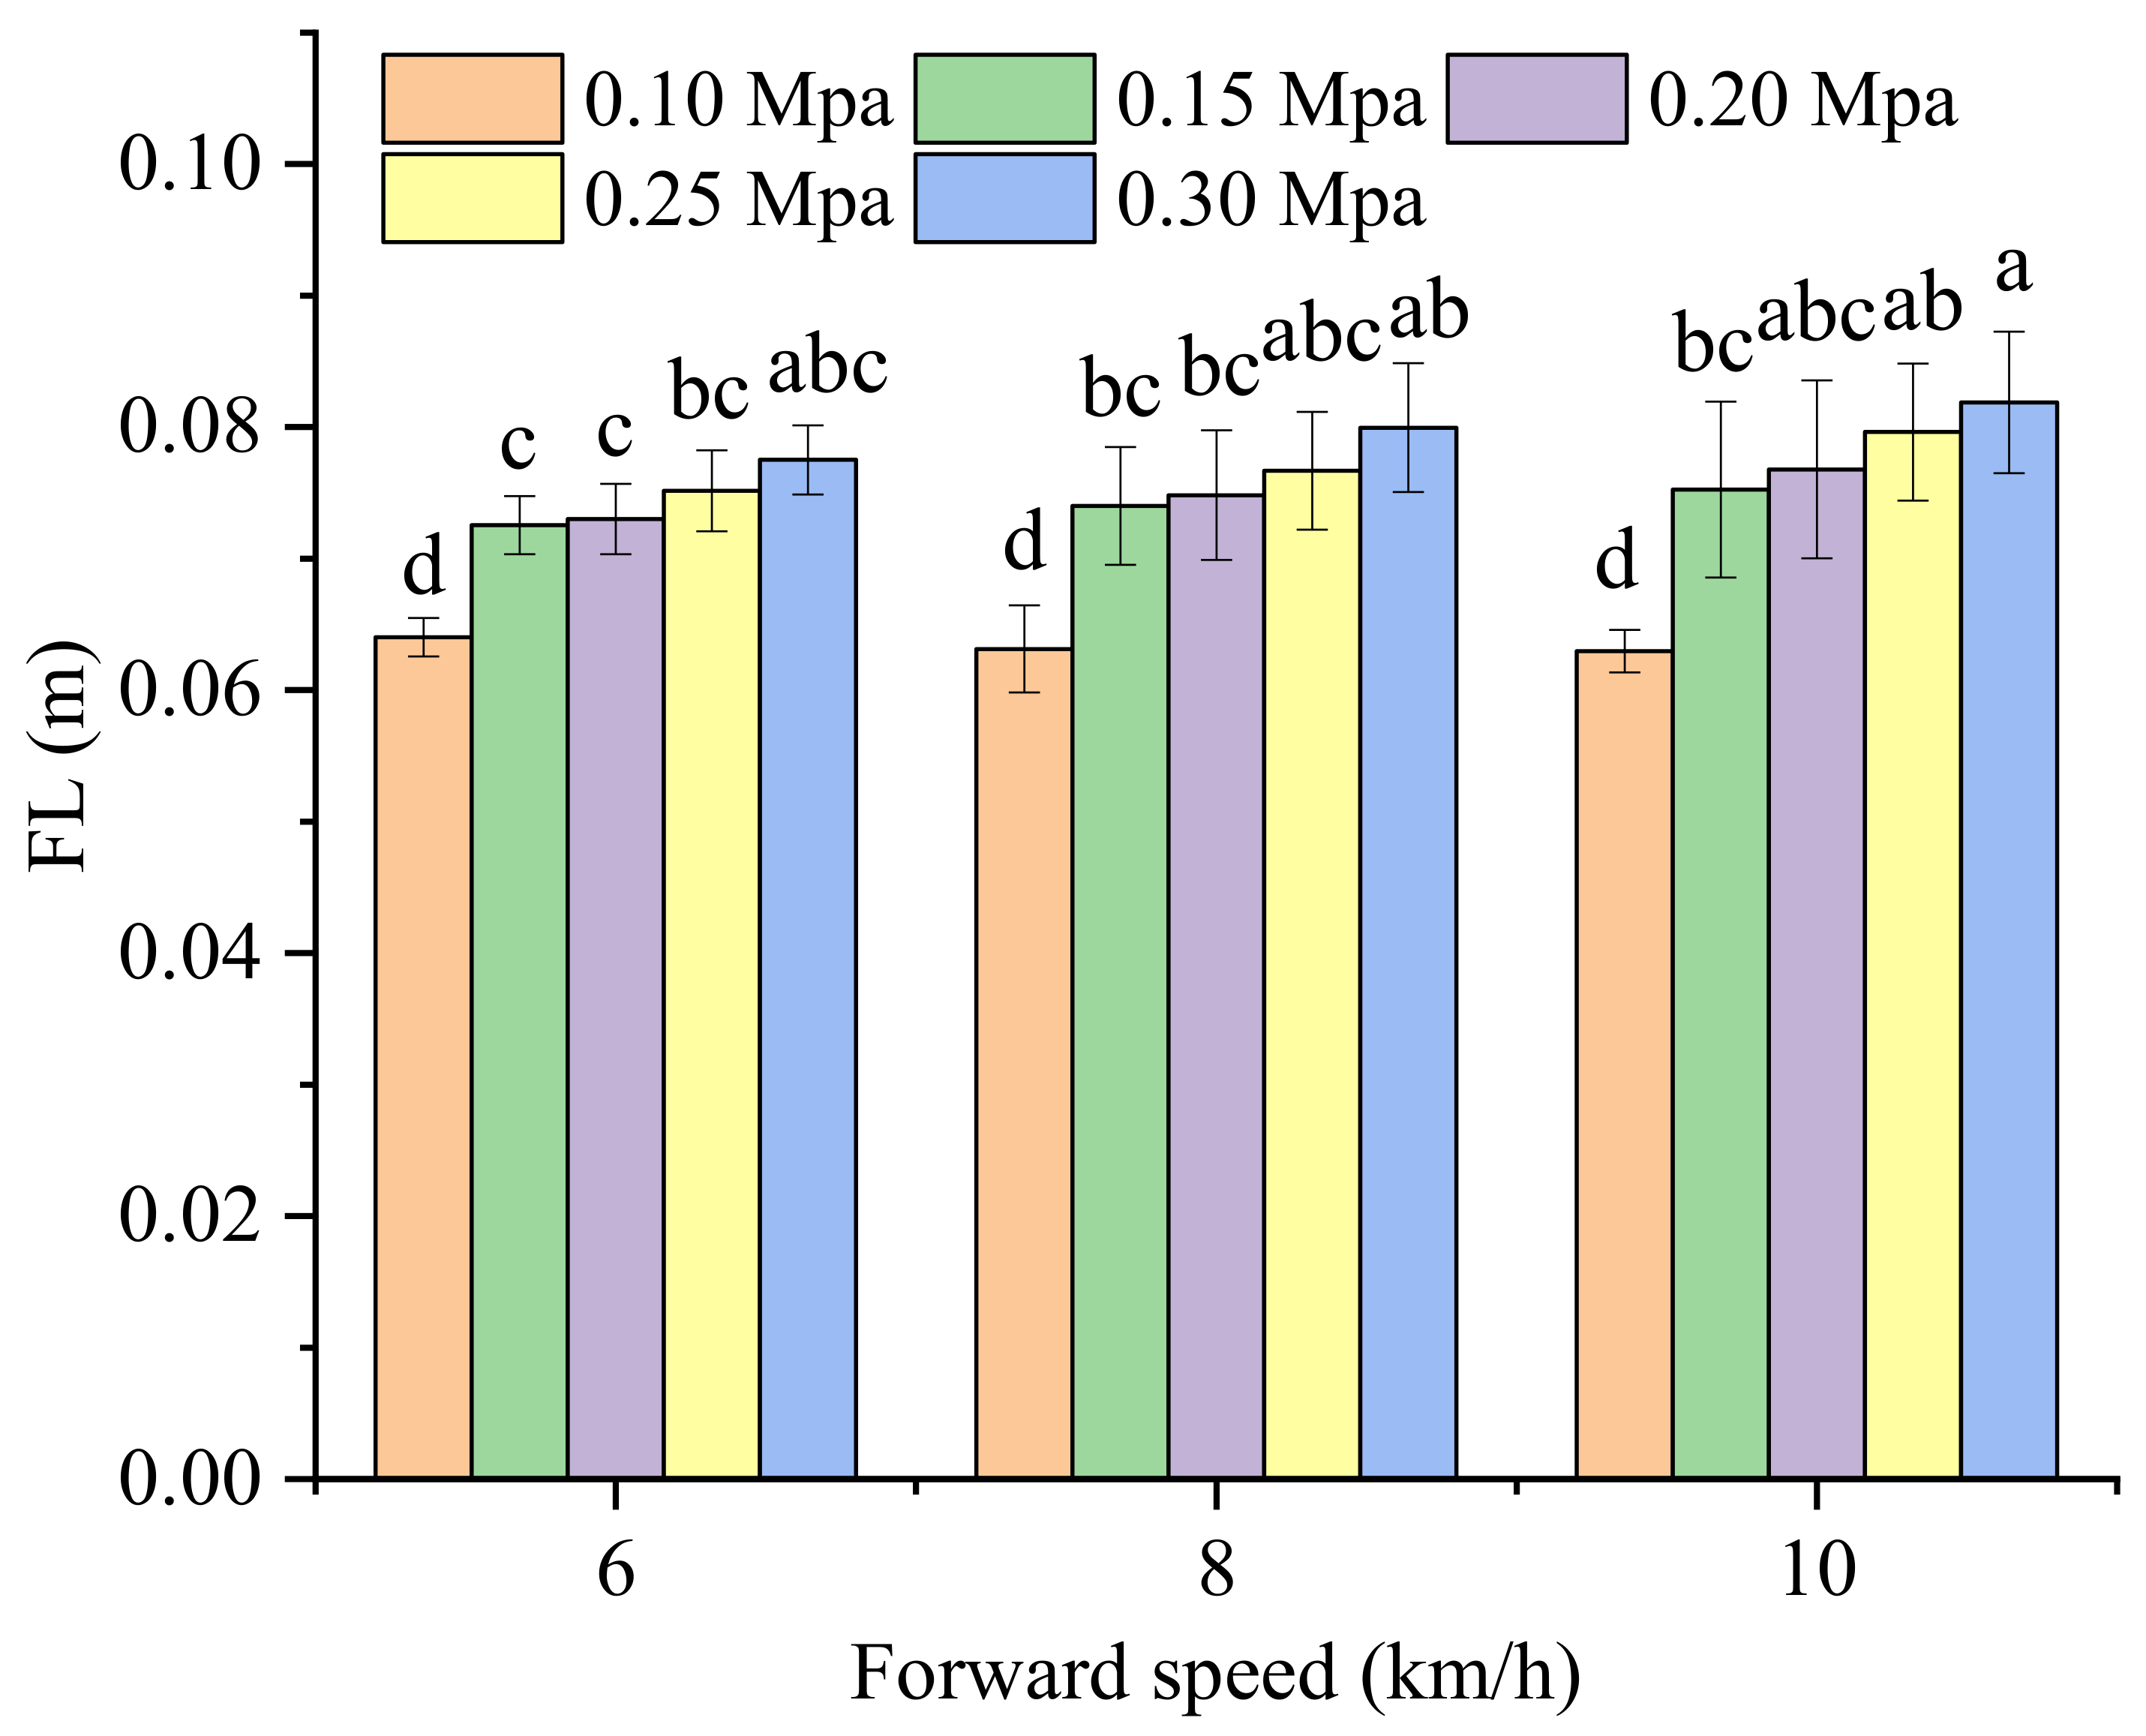
The results of the field experiments indicated that the precision application system for a LSF had higher QIL when the pressure was 0.15 MPa and 0.20 MPa at three forward speeds. The P 0.10, P 0.25, and P 0.30 treatment led to worse QIL values, especially P 0.30. The highest QIL was 96.4% at the forward speed of 6 km/h and pressure of 0.15 MPa, close to the target FL value. FL was significantly affected by the forward speed (p < 0.05) and pressure (p < 0.01). The distribution uniformity of FL was worse with increasing pressure and forward speed. A more uniform distribution of FL was obtained at lower pressure and forward speed.
(3)
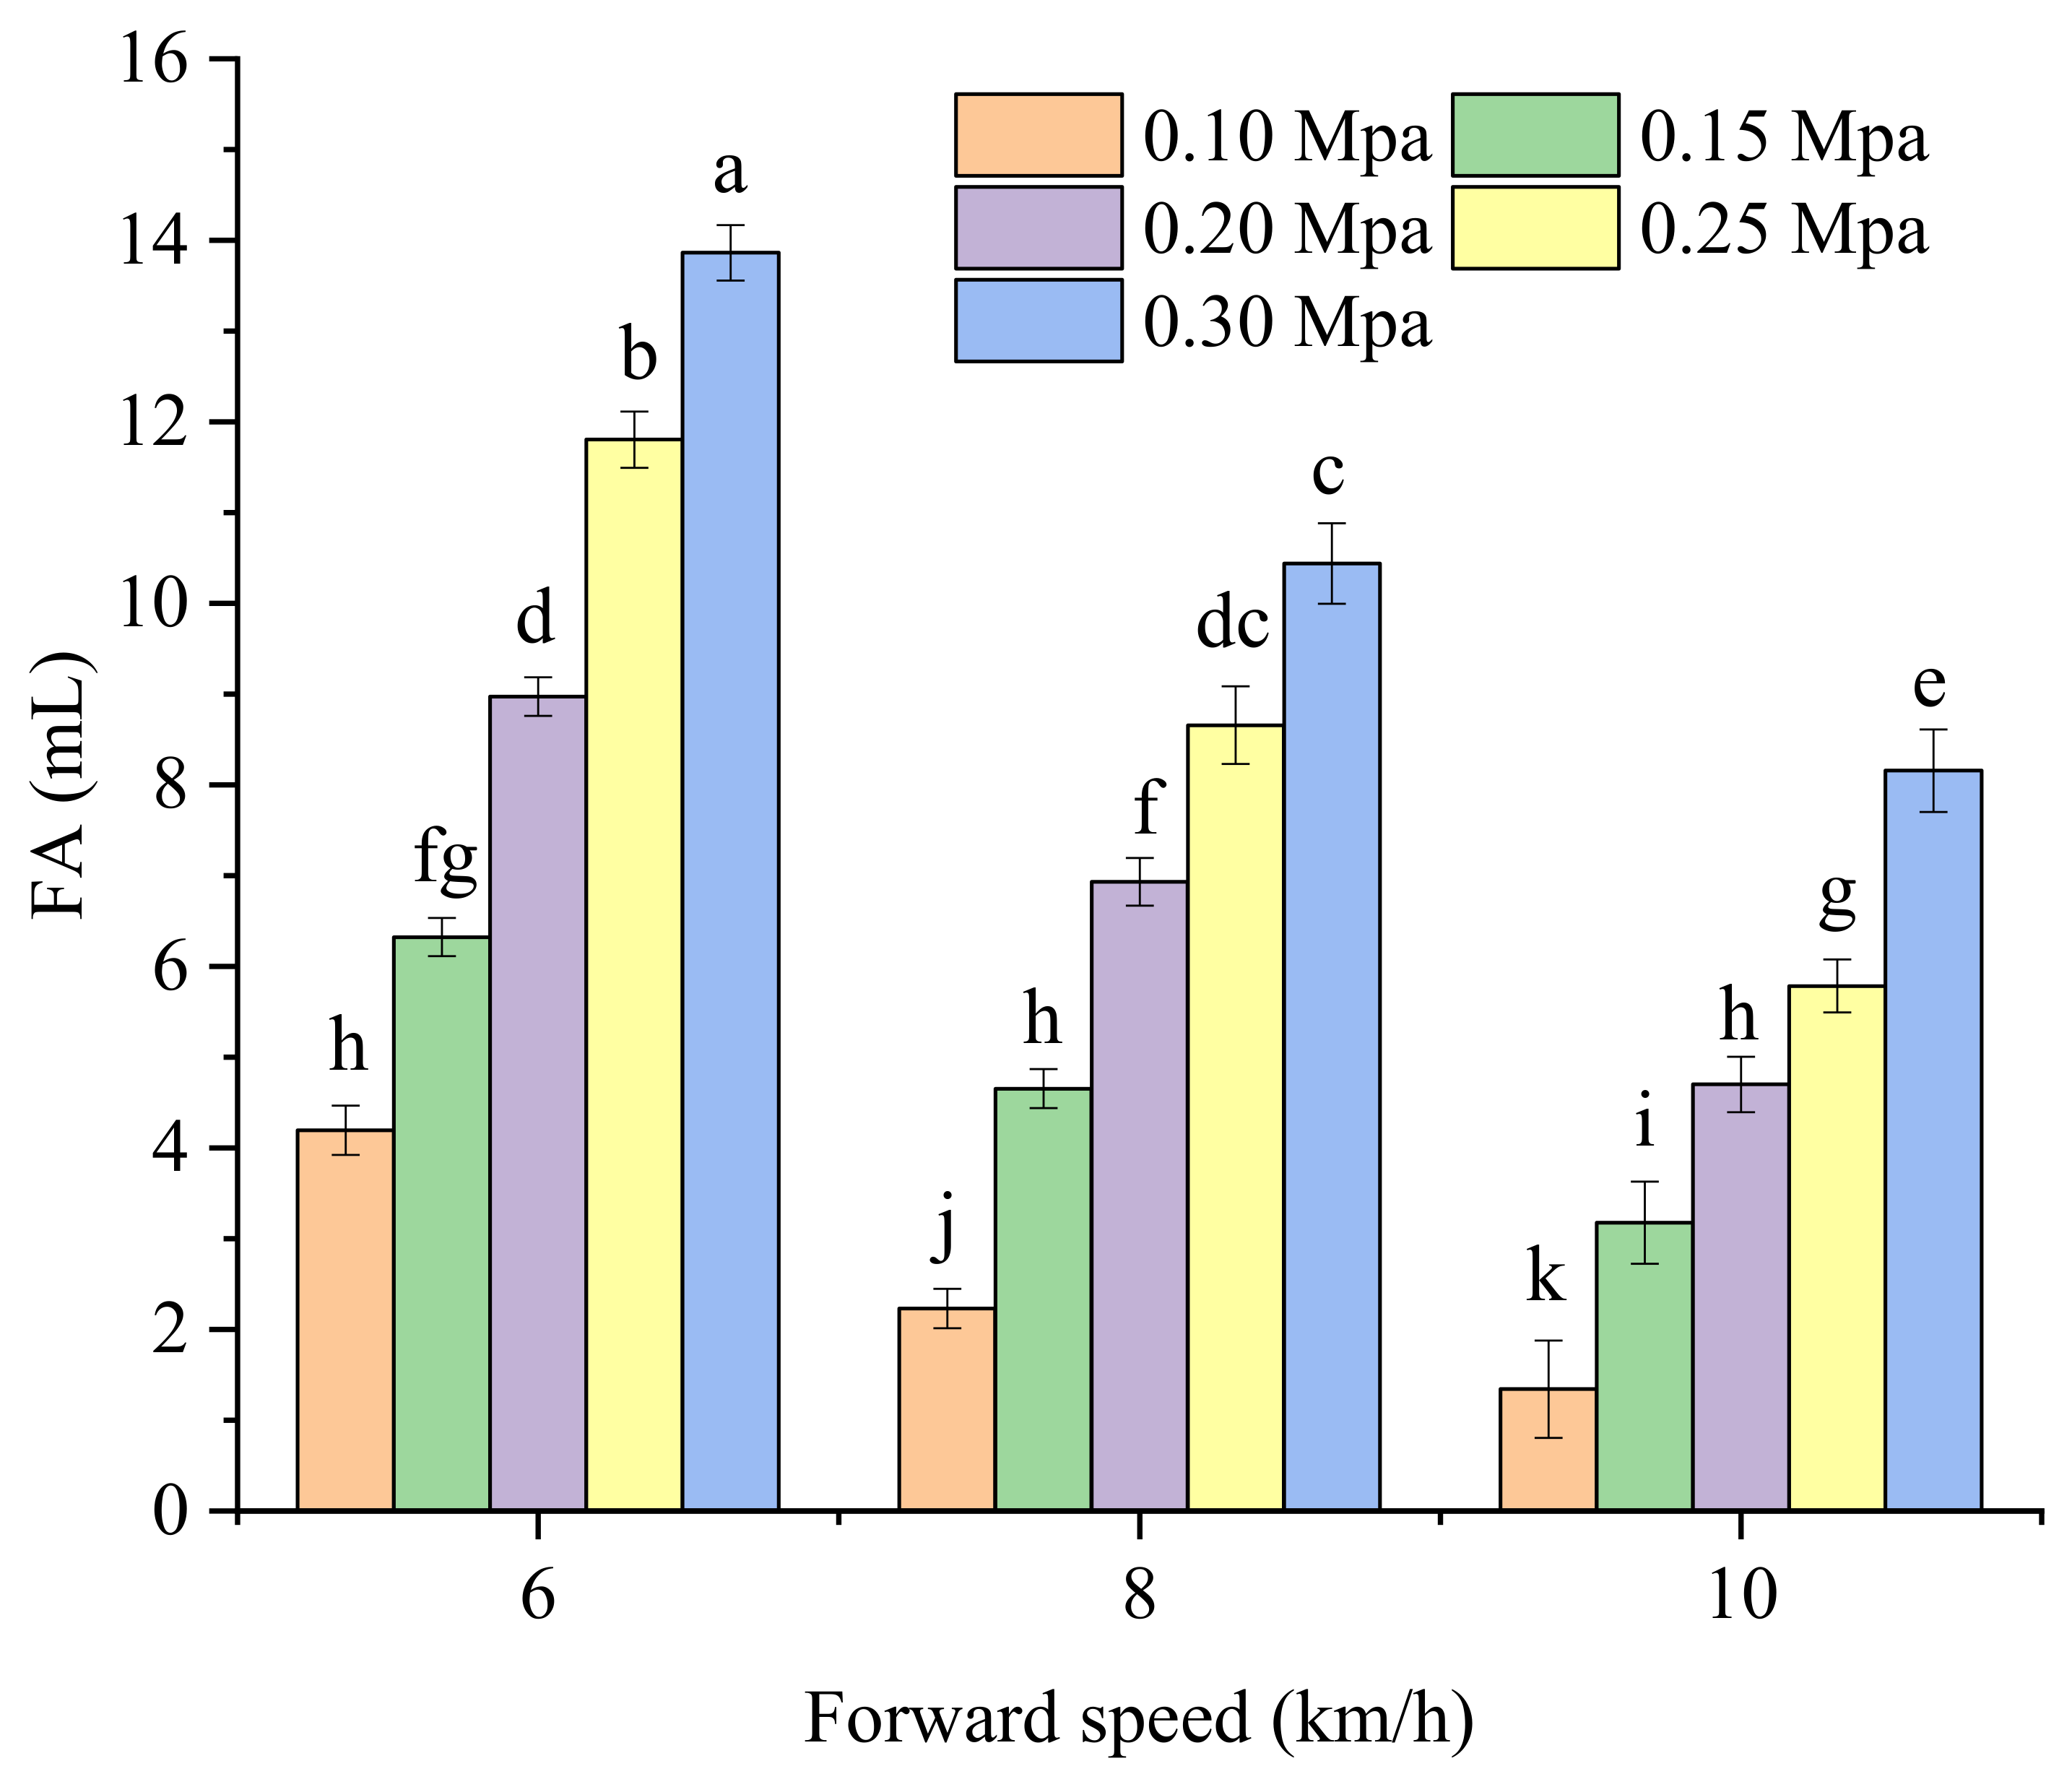
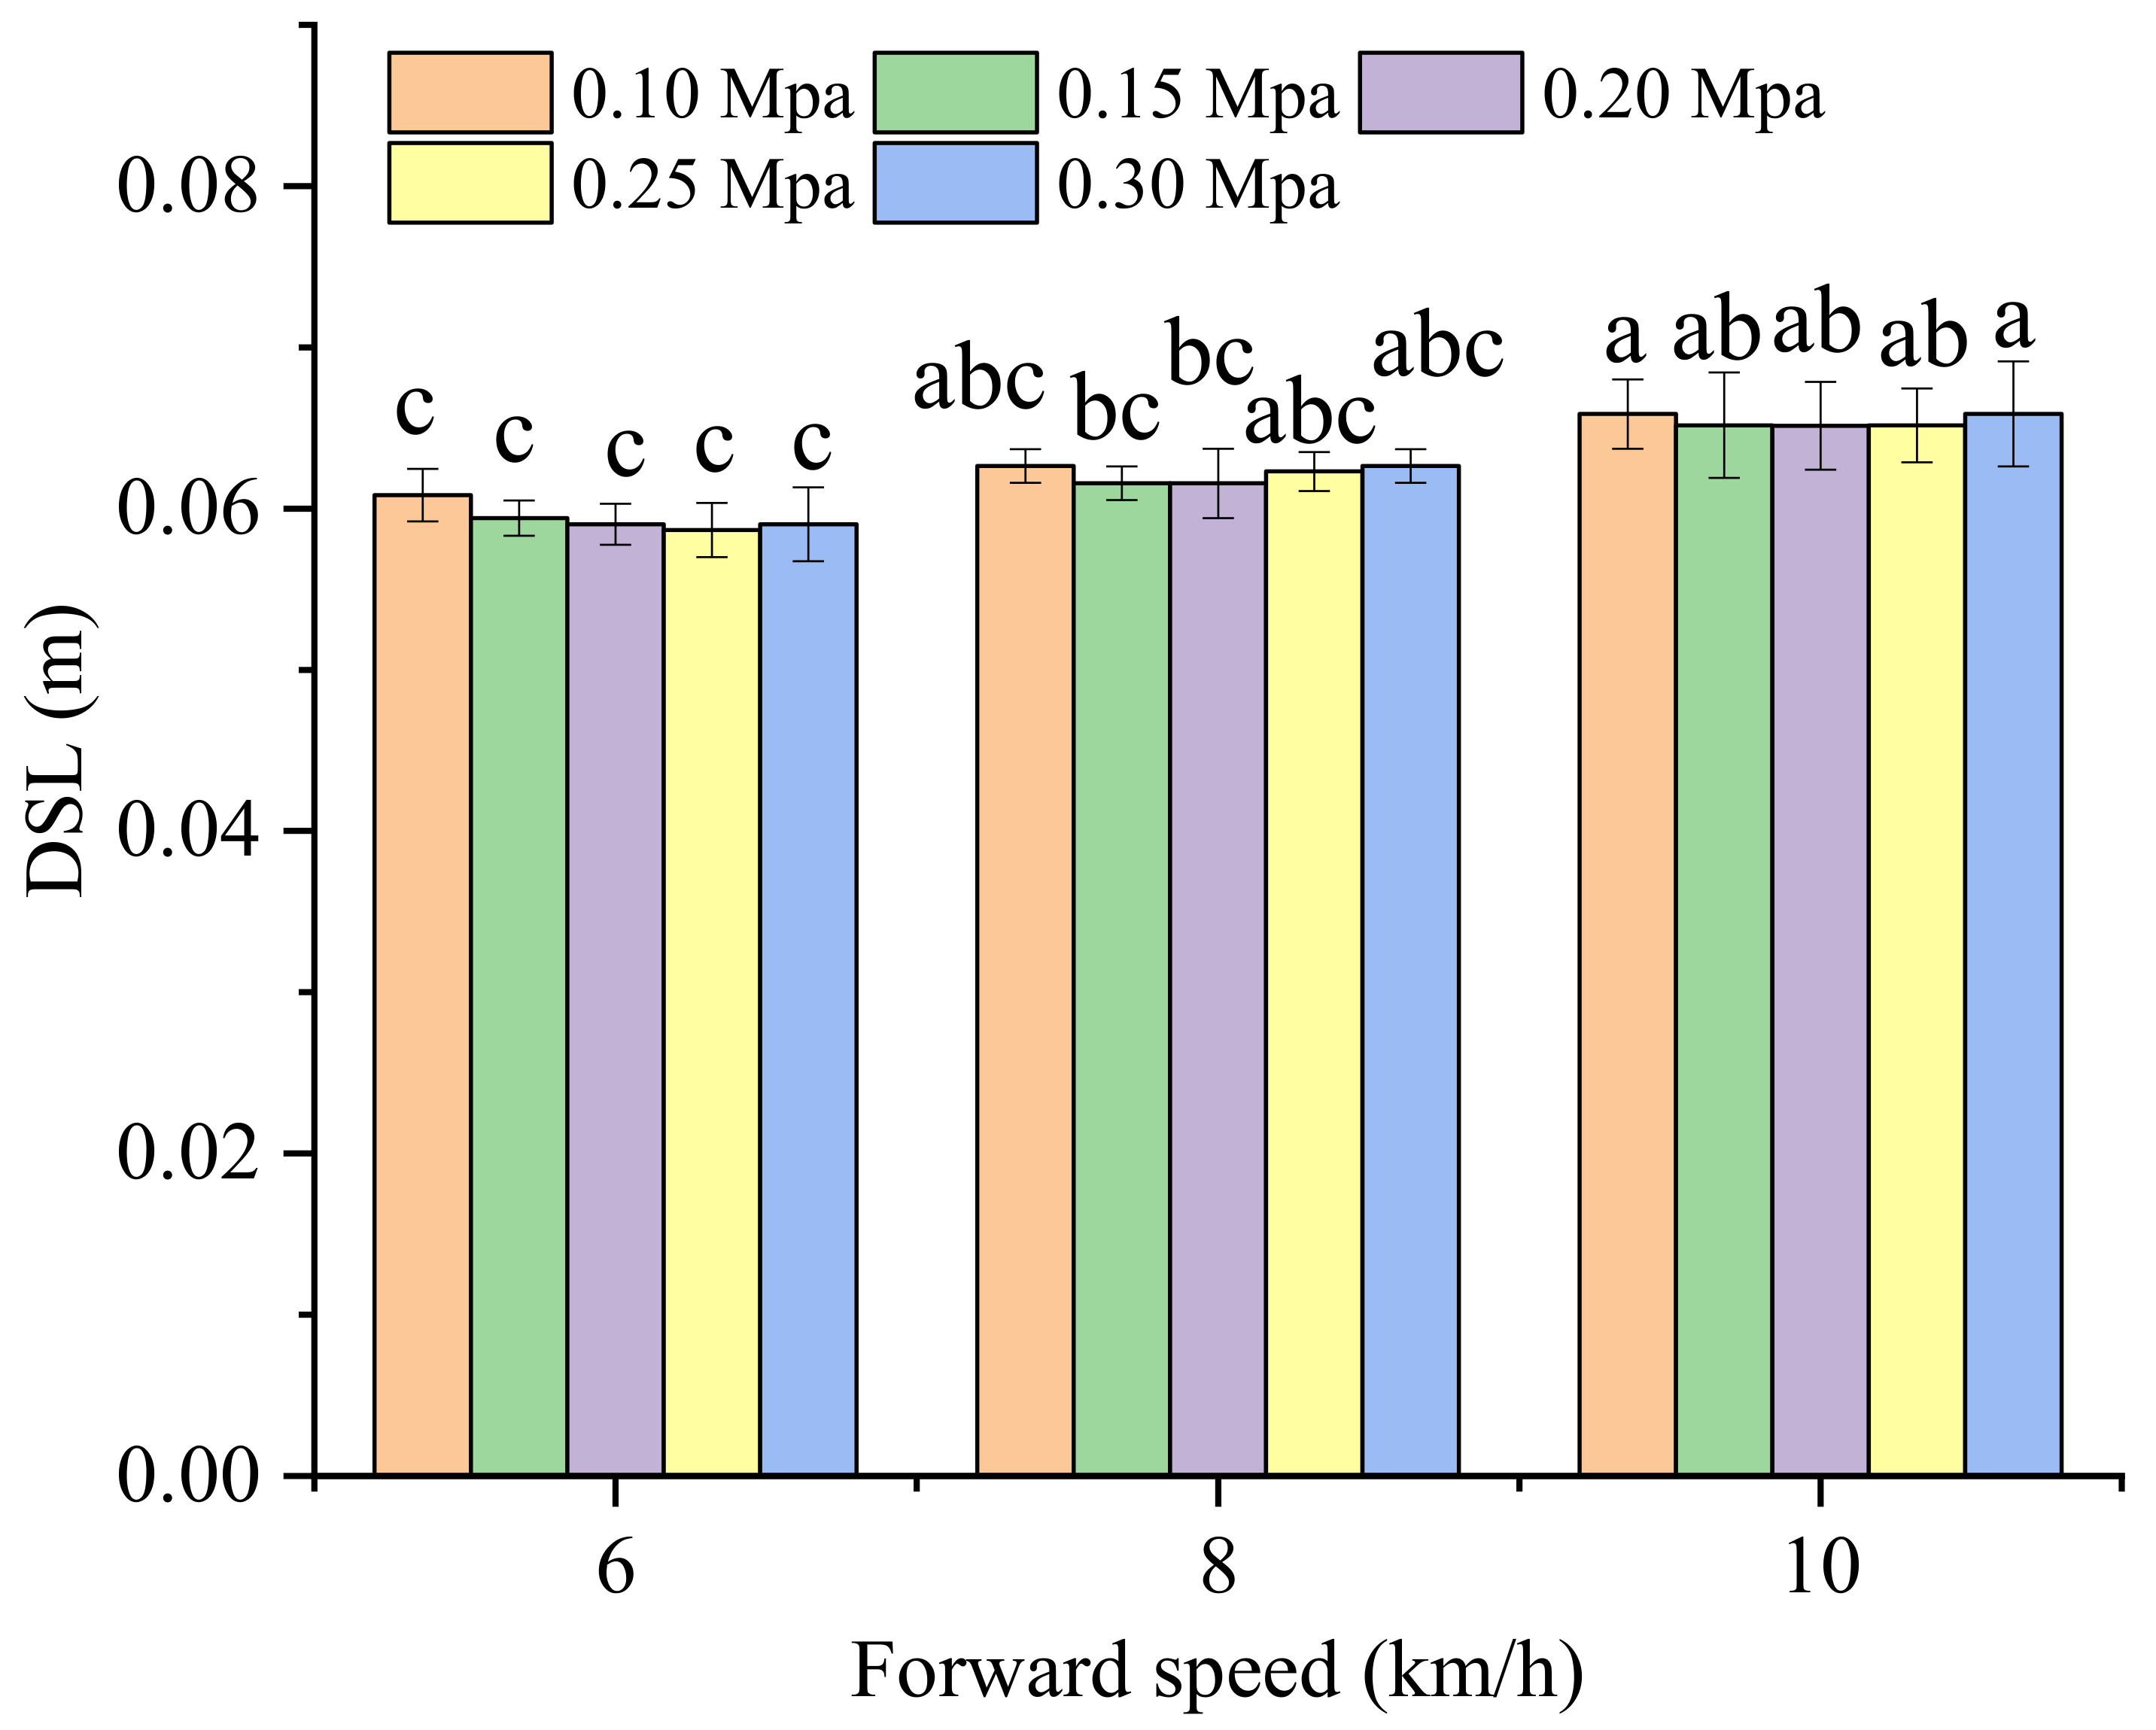
FA was significantly affected by the pressure and forward speed (p < 0.01). The range of FA was 1.34 to 13.86 mL at different treatments, which could satisfy the demands of different conditions. QID showed a decreasing trend as the forward speed increased and did not obviously change with the change in pressure. The best QID of 82.6% was obtained when the pressure was 0.25 MPa and the forward speed was 4 km/h. DSF was significantly affected by the forward speed (p < 0.01) and the pressure did not significantly affect DSF it (p > 0.05).

Author Contributions

Conceptualization, C.Y. and Q.W.; methodology, C.Y. and Q.W.; data curation, C.Y., X.C. and X.W.; writing—original draft preparation, C.Y.; writing—review and editing, S.J. and S.G. All authors have read and agreed to the published version of the manuscript.

Funding

This study was funded by the National Key Research and Development Program of China, grant number No. 2016YFD0200600, Innovative Research Team in University of China, grant number No. IRT13039, and Chinese Universities Scientific Fund, grant number No. 2021TC011.

Institutional Review Board Statement

Not applicable.

Informed Consent Statement

Not applicable.

Data Availability Statement

The data presented in this study are available on request from the corresponding author.

Acknowledgments

This study was funded by the 2115 Talent Development Program of China Agricultural University.

Conflicts of Interest

The authors declare no conflict of interest.

References

  1. Parent, S.É.; Dossou-Yovo, W.; Ziadi, N.; Leblanc, M.; Tremblay, G.; Pellerin, A.; Parent, L.E. Corn response to banded phosphorus fertilizers with or without manure application in Eastern Canada. Agron. J. 2020, 112, 2176–2187. [Google Scholar] [CrossRef]
  2. Kablan, L.A.; Chabot, V.; Mailloux, A.; Bouchard, M.È.; Fontaine, D.; Bruulsema, T. Variability in corn yield response to nitrogen fertilizer in eastern Canada. Agron. J. 2017, 109, 2231–2242. [Google Scholar] [CrossRef] [Green Version]
  3. Scharf, P.C.; Wiebold, W.J.; Lory, J.A. Corn yield response to nitrogen fertilizer timing and deficiency level. Agron. J. 2002, 94, 435–441. [Google Scholar] [CrossRef]
  4. Prasad, R. Efficient fertilizer use: The key to food security and better environment. J. Trop. Agric. 2009, 47, 1–17. [Google Scholar]
  5. Stewart, W.M.; Roberts, T.L. Food security and the role of fertilizer in supporting it. Procedia Eng. 2012, 46, 76–82. [Google Scholar] [CrossRef] [Green Version]
  6. Massah, J.; Azadegan, B. Effect of chemical fertilizers on soil compaction and degradation. Agric. Mech. Asia Afr. Lat. Am. 2016, 47, 44–50. [Google Scholar]
  7. Dimkpa, C.O.; Fugice, J.; Singh, U.; Lewis, T.D. Development of fertilizers for enhanced nitrogen use efficiency–Trends and perspectives. Sci. Total Environ. 2020, 731, 139113. [Google Scholar] [CrossRef]
  8. Kim, S.; Dale, B.E. Effects of nitrogen fertilizer application on greenhouse gas emissions and economics of corn production. Environ. Sci. Technol. 2008, 42, 6028–6033. [Google Scholar] [CrossRef]
  9. Savci, S. An agricultural pollutant: Chemical fertilizer. Int. J. Environ. Sci. Dev. 2012, 3, 73. [Google Scholar] [CrossRef] [Green Version]
  10. Bermudez, M.; Mallarino, A.P. Yield and early growth responses to starter fertilizer in no-till corn assessed with precision agriculture technologies. Agron. J. 2002, 94, 1024–1033. [Google Scholar] [CrossRef] [Green Version]
  11. Galpottage Dona, W.H.; Schoenau, J.J.; King, T. Effect of starter fertilizer in seed-row on emergence, biomass and nutrient uptake by six pulse crops grown under controlled environment conditions. J. Plant Nutr. 2020, 43, 879–895. [Google Scholar] [CrossRef]
  12. Mallarino, A.P.; Bergmann, N.; Kaiser, D.E. Corn responses to in-furrow phosphorus and potassium starter fertilizer applications. Agron. J. 2011, 103, 685–694. [Google Scholar] [CrossRef]
  13. Kaiser, D.E.; Mallarino, A.P.; Bermudez, M. Corn grain yield, early growth, and early nutrient uptake as affected by broadcast and in-furrow starter fertilization. Agron. J. 2005, 97, 620–626. [Google Scholar] [CrossRef]
  14. Quinn, D.J.; Lee, C.D.; Poffenbarger, H.J. Corn yield response to sub-surface banded starter fertilizer in the US: A meta-analysis. Field Crops Res. 2020, 254, 107834. [Google Scholar] [CrossRef]
  15. Kaiser, D.E.; Coulter, J.A.; Vetsch, J.A. Corn hybrid response to in-furrow starter fertilizer as affected by planting date. Agron. J. 2016, 108, 2493–2501. [Google Scholar] [CrossRef]
  16. Niehues, B.J.; Lamond, R.E.; Godsey, C.B.; Olsen, C.J. Starter nitrogen fertilizer management for continuous no-till corn production. Agron. J. 2004, 96, 1412–1418. [Google Scholar] [CrossRef]
  17. Da Silva, M.J.; Magalhães, P.G. Modeling and design of an injection dosing system for site-specific management using liquid fertilizer. Precis. Agric. 2019, 20, 649–662. [Google Scholar] [CrossRef]
  18. Kasal, E.Y.; Thakare, S.K.; Deshmukh, M.M. Development and laboratory optimization of liquid fertilizer application system. Int. J. Trop. Agric. 2015, 33, 3783–3787. [Google Scholar]
  19. Yu, C.; Wang, Q.; He, J.; Li, H.; Lu, C.; Liu, Z. Development of spraying device for precise and deep application of liquid fertilizer in sowing period. Trans. Chin. Soc. Agric. Eng. 2019, 35, 50–59. [Google Scholar]
  20. Lebeau, F.; El Bahir, L.; Destain, M.F.; Kinnaert, M.; Hanus, R. Improvement of spray deposit homogeneity using a PWM spray controller to compensate horizontal boom speed variations. Comput. Electron. Agric. 2004, 43, 149–161. [Google Scholar] [CrossRef]
  21. Anand, K.; Jayakumar, C.; Muthu, M.; Amirneni, S. Automatic drip irrigation system using fuzzy logic and mobile technology. In Proceedings of the 2015 IEEE Technological Innovation in ICT for Agriculture and Rural Development (TIAR), Chennai, India, 10–12 July 2015. [Google Scholar]
  22. Awati, J.S.; Patil, V.S. Automatic Irrigation Control by using wireless sensor networks. J. Exclus. Manag. Sci. 2012, 1, 1–7. [Google Scholar]
  23. Dixit, J.; Mahal, J.S.; Manes, G.S. Design of nitrogen (Liquid Urea) metering mechanism for point injection in straw mulched fields. AMA-Agric. Mech. Asia Afr. Lat. Am. 2016, 47, 28–35. [Google Scholar]
  24. Da Silva, M.J.; Franco, H.C.J.; Magalhães, P.S.G. Liquid fertilizer application to ratoon cane using a soil punching method. Soil Tillage Res. 2017, 165, 279–285. [Google Scholar] [CrossRef]
  25. Wang, J.; Zhou, W.; Li, X.; Feng, J.; Jiang, D.; Wang, J. Design and experiment of variable speed picking hole mechanism for Oval and circular gear planetary system. Trans. Chin. Soc. Agric. Mach. 2018, 49, 136–142. [Google Scholar]
  26. Drazic, M.; Gligorevic, K.; Pajic, M.; Zlatanovic, I.; Spalevic, V.; Sestras, P.; Skataric, G.; Dudic, B. The Influence of the Application Technique and Amount of Liquid Starter Fertilizer on Corn Yield. Agriculture 2020, 10, 347. [Google Scholar] [CrossRef]
  27. Alameen, A.A.; Al-Gaadi, K.A.; Tola, E. Development and performance evaluation of a control system for variable rate granular fertilizer application. Comput. Electron. Agric. 2019, 160, 31–39. [Google Scholar] [CrossRef]
  28. Reyes, J.F.; Esquivel, W.; Cifuentes, D.; Ortega, R. Field testing of an automatic control system for variable rate fertilizer application. Comput. Electron. Agric. 2015, 113, 260–265. [Google Scholar] [CrossRef]
  29. Maleki, M.R.; Mouazen, A.M.; De Ketelaere, B.; Ramon, H.; De Baerdemaeker, J. On-the-go variable-rate phosphorus fertilisation based on a visible and near-infrared soil sensor. Biosyst. Eng. 2008, 99, 35–46. [Google Scholar] [CrossRef]
  30. Ehlert, D.; Schmerler, J.; Voelker, U. Variable rate nitrogen fertilisation of winter wheat based on a crop density sensor. Precis. Agric. 2004, 5, 263–273. [Google Scholar] [CrossRef]
  31. Taghizadeh, M.; Ghaffari, A.; Najafi, F. Modeling and identification of a solenoid valve for PWM control applications. Comptes Rendus Mec. 2009, 337, 131–140. [Google Scholar] [CrossRef]
  32. Xu, X.; Han, X.; Liu, Y.; Liu, Y.; Liu, Y. Modeling and dynamic analysis on the direct operating solenoid valve for improving the performance of the shifting control system. Appl. Sci. 2017, 7, 1266. [Google Scholar] [CrossRef] [Green Version]
  33. Gao, Y.; Wang, X.; Yang, S.; Zhao, X.; Dou, H.; Zhao, C. Design and test of pneumatic downforce control system for planting. Trans. Chin. Soc. Agric. Mach. 2019, 50, 19–29. [Google Scholar]
  34. He, X.; Cui, T.; Zhang, D.; Wei, J.; Wang, M.; Yu, Y.; Liu, Q.; Yan, B.; Zhao, D.; Yang, L. Development of an electric-driven control system for a precision planter based on a closed-loop PID algorithm. Comput. Electron. Agric. 2017, 136, 184–192. [Google Scholar] [CrossRef]
  35. Yu, C.; Li, H.; He, J.; Chen, G.; Lu, C.; Wang, Q.L. Design and Experiment of High-frequency Intermittent Fertilizer Supply System Based on PID Algorithm. Trans. Chin. Soc. Agric. Mach. 2020, 51, 45–53. [Google Scholar]
  36. Karayel, D.; Wiesehoff, M.; Özmerzi, A.; Müller, J. Laboratory measurement of seed drill seed spacing and velocity of fall of seeds using high-speed camera system. Comput. Electron. Agric. 2006, 50, 89–96. [Google Scholar] [CrossRef]
  37. Zhan, Z.; Yaoming, L.; Jin, C.; Lizhang, X. Numerical analysis and laboratory testing of seed spacing uniformity performance for vacuum-cylinder precision seeder. Biosyst. Eng. 2010, 106, 344–351. [Google Scholar] [CrossRef]
  38. Yan, B.; Fu, W.; Wu, G.; Xiao, Y.; Meng, Z. Seed location prediction method of maize high-height precision planting based on satellite positioning. Trans. Chin. Soc. Agric. Mach. 2021, 52, 44–54. [Google Scholar]
  39. Wang, J.; Liu, Y.; Wang, J.; He, J. Optimization design and experiment of liquid-fertilizer applying deep-fertilization mechanism for planetary elliptic gears. Trans. Chin. Soc. Agric. Mach. 2012, 43, 59–60. [Google Scholar]
Figure 1. Method of applying a liquid starter fertilizer in point form.
Actuators 10 00221 g001
Figure 2. Components of the precise application system for a liquid starter fertilizer.
Actuators 10 00221 g002
Figure 3. Working principle of spray nozzle, (a) opening and (b) closing of spray nozzle.
Actuators 10 00221 g003
Figure 4. The hardware circuit of the detection control system.
Actuators 10 00221 g004
Figure 5. Algorithm flow chart of the detection control system.
Actuators 10 00221 g005
Figure 6. The test bench of the precise application system for a liquid starter fertilizer.
Actuators 10 00221 g006
Figure 7. The field experiment with the double-row precise application system for liquid starter fertilizer.
Actuators 10 00221 g007
Figure 8. The distribution of seeds and the liquid starter fertilizer in the field experiments.
Actuators 10 00221 g008
Figure 9. Relationship of the duration of the application of the liquid starter fertilizer to every seed (DT) and the time set using the timer in the controller (ST) at different pressures of (a) 0.10, (b) 0.15, (c) 0.20, (d) 0.25 and (e) 0.30 MPa.
Actuators 10 00221 g009aActuators 10 00221 g009b
Figure 10. The distance between the seeds on the seed bed and photoelectric sensor in the horizontal direction (Δs) of 20 samples at different forward speeds.
Actuators 10 00221 g010
Figure 11. The time required for the seeds to fall form the photoelectric sensor to the seed bed (Δt) of 20 samples at different forward speeds.
Actuators 10 00221 g011
Figure 12. The distribution uniformity of the length of the liquid starter fertilizer (FL) at different pressures of (a) 0.1, (b) 0.2, and (c) 0.3 MPa.
Actuators 10 00221 g012
Figure 13. The length of the liquid starter fertilizer (FL) for different treatments. Only the values that are each denoted by different letter(s) (ad) differ significantly at p < 0.05.
Actuators 10 00221 g013
Figure 14. The amount of liquid starter fertilizer (FA) of different treatments. Only the values that are each denoted by different letter(s) (ak) differ significantly at p < 0.05.
Actuators 10 00221 g014
Figure 15. The distance between the seeds and the liquid starter fertilizer (DSL) with different treatments. Only the values that are each denoted by different letter(s) (ac) differ significantly at p < 0.05.
Actuators 10 00221 g015
Table 1. Mean values of the duration of applying the liquid starter fertilizer (DT) to every seed at the different time set using the timer in the controller (ST) and pressures.
Fertilizer PressureMean Values of DT (ms)
ST 16ST 20ST 30ST 40ST 50ST 60
P 0.1034.550.869.586.2103.5123.5
P 0.1534.751.872.594.7111.2130.7
P 0.2035.252.373.596.5115.0140.3
P 0.2535.552.577.5101.5123.3142.3
P 0.3035.853.078.5102.8127.7145.3
Table 2. Mean value of the qualified index of the length of the liquid starter fertilizer (QIL) and the qualified index of the distance between the seeds and the liquid starter fertilizer (QID) at different forward speeds and pressures.
Forward Speed(km/h)QIL (%)QID (%)
P 0.10P 0.15P 0.20P 0.25P 0.30P 0.10P 0.15P 0.20P 0.25P 0.30
491.596.495.792.689.378.381.281.982.681.9
690.294.393.190.485.874.776.977.375.474.7
889.992.590.386.383.068.269.769.368.768.2
Table 3. ANOVA of the length of the liquid starter fertilizer (FL), the amount of the liquid starter fertilizer (FA), and the distance between the seeds and the liquid starter fertilizer (DSL).
FLFADSL
Sig.Sig.Sig.
Forward speed0.049*0.000**0.000**
Pressure0.000**0.000**0.708ns
Note: *, **, and ns indicate significant difference at p < 0.05 and p < 0.01, and no significant difference (p > 0.05), respectively.
Publisher’s Note: MDPI stays neutral with regard to jurisdictional claims in published maps and institutional affiliations.

