Electrothermal Phenomena in Ferroelectrics


International Center for Actuators and Transducers, The Pennsylvania State University, University Park, PA 16802, USA
Actuators 2020, 9(4), 93; https://0-doi-org.brum.beds.ac.uk/10.3390/act9040093
Submission received: 16 August 2020
/
Revised: 9 September 2020
/
Accepted: 16 September 2020
/
Published: 23 September 2020
(This article belongs to the Special Issue Piezoelectric Actuators and Ultrasonic Motors: Future Perspectives)
Abstract
:Physical properties of lead-zirconate-titanate (PZT) ceramics change according to the initial electric poling process and electrical boundary conditions. This paper reports the electrothermal, piezothermal, and piezoelectric coupling phenomena in ferroelectrics from thermodynamics viewpoints, in particular, thermal property differences between unpoled and poled PZT’s in the poling direction for open circuit and short circuit conditions. We propose a new terminology, “secondary electrothermal” coupling factor kλ, which is analogous to the electromechanical coupling factor k, relating the elastic compliances under short- and open-circuit conditions, in order to explain the fact that the short-circuit condition exhibited the larger thermal diffusivity than the open-circuit condition. On the other hand, the unpoled specimen exhibits the lowest thermal diffusivity. This tutorial paper was authored for providing comprehensive knowledge on equilibrium and time-dependent thermodynamics in ferroelectrics.
1. Background
Thermoelectric devices generate voltage when each side of the device is set at different temperatures. Conversely, when voltage is applied to it, heat is transferred from one side to the other, creating a temperature gradient. This effect can be used to generate voltage in “thermocouple” to measure temperature of a specimen. Because heating or cooling is determined by the applied electric field direction, thermoelectric devices can also be utilized as temperature controllers. Popular thermoelectric phenomena include the Seebeck effect, Peltier effect, and Thomson effect in metallic or semiconductive materials based on the “electron” flow. On the contrary, this paper handles the “electrothermal” effect in resistive ferroelectric materials based on the “phonon” flow. The “pyroelectric effect” is a phenomenon in which a ferroelectric material shows voltage under a change in temperature. Its inverse effect, the so-called “electrocaloric effect”, shows a reversible temperature (increase or decrease) change under an applied electric field polarity. It should not be confused in principle with the semiconductor “thermoelectric effect”, in which a temperature difference occurs when a current is driven through an electric junction with two dissimilar conductors.
Electrocaloric materials were initially the focus of significant application interest in the 1940s (during World War II). The US and Japan accelerated the research for developing the air-cooling system particularly in submarines without generating mechanical noise (like air-compressor-embedded refrigerators). Due to the confidential military research, not many publications have been disclosed on this research. The author personally learned from his former bosses in the university in the 1960s, when the research on this topic was fading out because the electrocaloric effect was insufficient for practical applications. However, in the beginning of 21st century, we restarted its development in parallel to the enthusiasm on new compact refrigeration technique in the “sustainable” society. Our report on giant response in Pb(Zn1/3Nb2/3)O3-PbTiO3 (PZN-PT) bulk single crystals in 2003 [1], being 0.3 °C under 1 kV/mm electric field applied, ignited the “renaissance” of electrocaloric effect. Successive reports on the high response, 12 °C under an applied electric field of 48 kV/mm in thin film (or ribbon) lead zirconate-titanate (PZT) by Mischenko et al. [2] (that is equivalent to 0.25 °C under 1 kV/mm, lower performance than PZN-PT single crystals), and the demonstration of 12 °C of cooling near room temperature with a ferroelectric polymer by Neese et al. in 2008 [3] also accelerated the research boom on electrocaloric devices.
On the other hand, our research group at the Penn State University has been concentrating on the development of high power piezoelectrics for 40 years, which can handle the power density as high as 40 W/cm3 [4]. One of the Figures-of-Merit for the high-power density is the “maximum vibration velocity” in the same material species such as PZT’s, which is defined by the vibration velocity generated at the sample edge under its resonance operation, when the maximum temperature rise (i.e., at the nodal point) reaches 20 °C above the room temperature [5,6]. When we operate the piezo-sample under higher vibration levels, even though highly resistive under the off-resonance, the piezoelectric PZT starts generating heat via its dielectric, elastic and piezoelectric losses. Most of the additional input electric energy over the maximum vibration velocity level is converted to heat, like a “ceramic heater”! The current commercially available top data is around in a rectangular plate PZT’s, which corresponds to the energy density of 40 W/cm3. We found that the maximum vibration velocity strongly depends on the thermal conductivity. Figure 1 demonstrates the simulation results of the saturated temperature distribution profile difference between two compositions, PZT-5H and PZT-19, under the same vibration velocity operating condition. These two compositions exhibit significant difference in thermal conductivity: 0.14 W/m K versus 2 W/m K [7,8]. The profile curve of PZT-5H (low thermal conductivity) fits a sinusoidal line beautifully, while PZT-19 shows considerable edge temperature rise. You can understand easily that this profile difference is originated primarily from the thermal conductivity or diffusivity difference. Taking the total thermal energy dissipated from the specimen by integrating the temperature rise with respect to the position coordinate, we can expect a similar “mechanical quality factor” Qm value (i.e., similar intensive elastic loss tan ϕ′) for these two specimens. However, you can notice that the peak temperature at the nodal point is significantly lower for the larger thermal diffusivity material, which means we can excite the vibration more under higher voltage for the PZT-19, since the maximum vibration velocity is defined by the highest temperature rise 20 °C above room temperature at the node (plate center) from the human safety viewpoint in the practical industrial standard (e.g., human fingers will be burned above 50 °C).
This is our motivation on the thermal property measurements, in particular, conductivity/diffusivity on ferroelectric/piezoelectric ceramics from the practical application viewpoint. We propose a “secondary electrothermal” coupling factor kλ, which is applied for irreversible thermal flow status and explain the difference in the thermal conductivity between the electric constraint difference, that is, under short- and open-circuit conditions [9].
This tutorial paper was written for the encouragement to the researchers, who are currently studying electrocaloric or high-power piezoelectric materials, by providing them comprehensive and underlying thermodynamical backgrounds on the “electrothermal effect” in comparison with the “mechanothermal” and “electromechanical coupling”. Suitable textbooks or review papers have not been found in this area, to the best of the author’s knowledge.
2. Review of Phenomenology in Ferroelectrics
We discuss the phenomenology in ferroelectrics on the following four stages with increasing the complexity in analyses: (1) linear equilibrium in Section 2.1, (2) nonlinear equilibrium in Section 2.1.3 and Section 4.1, (3) harmonic dynamic in Section 2.2 and Section 4.2, and (4) anharmonic dynamic in Section 4.3.
2.1. Static/Equilibrium Ferroelectric Phenomenology
2.1.1. Thermodynamical Functions
A thermodynamic phenomenological theory is discussed basically in the form of expansion series of the “internal energy” U as a function of the physical properties; the free energy is composed of “thermal energy” dQ, “mechanical energy” Xdx (stress X, strain x) and “electrical energy” EdD (dielectric displacement D (almost equal to polarization P in high permittivity materials), electric field E) in ferroelectrics. When a material is ferromagnetic, magnetic energy HdB is integrated. Further, thermal energy dQ is given by dQ ≦ TdS, where temperature is T and entropy is S. Equality “=” is for the reversible process, and “<” is true for the irreversible process. We can describe U as follows:
dU = dQ + Xdx + EdD
≦ TdS + Xdx + EdD
≦ TdS + Xdx + EdD
According to the combination possibilities among (T, S), (X, x) and (E, D), there are eight types of energy. We will use Helmholtz free energy A = U − TS, Gibbs free energy G = U − TS − Xx − ED and elastic Gibbs energy G1 = U − TS − Xx as examples in this paper; that is,
Internal energy U is described in terms of “extensive” physical parameters (S, x, D). Since the phase transition and experiments are normally conducted under external T = constant, X = 0 and E = 0, Gibbs free energy described in terms of “intensive” physical parameters (T, X, E) is the most popularly utilized. The elastic Gibbs energy G1 is most convenient for discussing the ferroelectric phase transition because of the two merits: (1) by describing higher order Taylor expansion terms of the “order parameter” D (or P), we can derive the spontaneous polarization, and (2) external X can be controlled explicitly, and E is related with easily with .
We can obtain the famous “Maxwell relationship” examples from Equation (2) as follows, taking the second partial derivative:
The meaning of Equation (3a,b) are the “piezoelectric coefficients”, discussed in Section 2.1.4.1, while Equation (3c) is used in the “pyroelectric coefficient” p derivation in Section 2.1.6.
2.1.2. Linear Energy Handling
We consider a practical formula of the Gibbs free energy G(T, X, E) for the case of a small value change in temperature θ = T − TR (room temperature), external X and E (1D case). If the change of parameters is small, we may adopt the three-parameter Taylor expansion approximation up to second derivatives in order to discuss just the linear relationships, based on the description by Mitsui et al. [10]:
Taking into account , we obtain first the relations, , and . Since is the entropy density at , we take this as the original value and set it to . The values and are considered to be spontaneous strain and spontaneous polarization in the ferroelectric phase of this material (refer to the next Section 2.1.3), and set them as zero in the discussion merely in the ferroelectric phase. Now, Equation (4) can be transformed as
Continued discussions on the linear handling are made after Section 2.1.4. Though nonlinear energy handling is not our direct purpose in this section, we describe Landau/Devonshire theory briefly in order to provide the reader the key idea on how the spontaneous polarization and strain are generated in a ferroelectric material [11,12,13,14]. We use the elastic Gibbs energy G1 for the phase transition discussion, as in Section 2.1.1.
2.1.3. Nonlinear Energy Handling
We first construct the electric energy formula, expanding the energy in terms of so-called order parameter, polarization P, including nonlinear terms as follows:
G1(P) = G1(0) + a1P + a2P2 + a3P3 + a4P4 + a5P5 + a6P6 + ⋯
Considering that the free energy form of the crystal should be applied for any temperature range below or above the phase transition temperature (which is called “Curie temperature”), and that if the mother phase (high temperature phase) has “cubic symmetry” (like perovskite PZT and PZN-PT), the Gibbs energy should not change with polarization reversal (P → −P), that is, G1(P) = G1(−P). Thus, the energy expansion series should not contain terms in odd powers of a component, P, or the expansion series include only even powers of P.
2.1.3.1. Second-Order Phase Transition
We start from the simplest nonlinear phenomenon “second-order phase transition” model [14]:
G1(P,T) = (1/2)αP2+ (1/4)β P4
The coefficients α and β depend, in general, on the temperature, but only α is assumed to be temperature dependent and β is positive constant in the following discussion for the sake of minimizing the required parameters. The phenomenological formulation should be applied to the whole temperature range over which the material is in the paraelectric (high temperature) and ferroelectric (low temperature) states. Because the spontaneous polarization should be zero in the paraelectric state, the free energy should be zero in the paraelectric phase at any temperatures above its phase transition temperature (i.e., Curie temperature). To stabilize the ferroelectric state with a spontaneous polarization, the free energy for a certain polarization P should be lower than “zero”. Otherwise, the paraelectric state is maintained. Thus, at least, the coefficient α of the P2 term must be negative for the spontaneously polarized state to be stable, while, in the paraelectric state, it must be positive passing through zero at a certain temperature T0, called Curie–Weiss temperature. From this concept, we assume α as a linear relation:
where C is taken as a positive constant called the Curie–Weiss constant, and T0 is equal to or lower than the actual transition temperature TC (Curie temperature), in general. This temperature dependence can also be interpreted as the adoption of the “TP2” electrothermal coupling term [] in the Taylor expansion of the G1 energy. The temperature parameter θ here is the deviation from the Curie–Weiss temperature T0. From [ in our discussion], the equilibrium polarization under an electric field E should satisfy the condition:
(∂G1/∂P) = E = α P + β P3 = P∙(α + β P2)
With no electric field applied, Equation (8) provides two cases: (i) P = 0 and (ii) P2 = −α/β. The trivial solution in (i) case corresponds to a paraelectric (high temperature) state, while the polarization solutions (PS = in (ii) case correspond to a ferroelectric (low temperature, α < 0) state.
Figure 2 shows the temperature dependence of the free energy curve. One potential minimum at a high temperature will split into two minimum-branches at a low temperature phase. This “Y”-shape phase splitting is called “bifurcation” in terms of temperature. The critical point corresponds to the Curie temperature TC (in this case also T0). In a lattice vibration model, we can rephrase the above situation as follows: at a high temperature, the nearly “harmonic” atomic (or lattice) vibration (usually an “optical phonon” mode, which generates the polarization deviation) in a sharp convex “parabolic” potential at a high temperature will reduce the vibration frequency with decreasing the temperature approaching to the Curie temperature (i.e., critical slowing down) because of the flat curvature of the potential around TC. This “phonon softening” phenomenon is interpreted by the nonlinearity of the phonon mode [Refer to Section 4.2]. Because the free energy curve is symmetric with respect to the polarization P when the external field E = 0, the probability of the state +PS (=+ or −PS (= should be equal. Thus, with decreasing the temperature, passing through TC, +PS domains and −PS domains may arise locally in a specimen with equal volumetric ratio, leading to the “multidomain states” in general. In order to produce the net spontaneous polarization, strain, and piezoelectricity, we need to apply large electric field (higher than “coercive field”, which is given by in the second order phase transition), which is called the “electric poling” process to make a crystal with mono-domain-like status. The double-well potential change with the applied field is illustrated in the inserted figure. Note first that the minimum potential well energy is negative (that is, stabler than the paraelectric phase energy zero), and second that external electric field enforces one spontaneous state more stable. Though the poling process in polycrystalline ceramic samples, composed of many micro single crystals (i.e., “grain”) with random crystal orientations, is not easy, a similar phenomenology is assumed to be adopted qualitatively in this paper.
2.1.3.2. First-Order Phase Transition
The theories for electrostriction in ferroelectrics were formulated in the 1950s by Devonshire [11,12] and Kay [13]. The elastic Gibbs energy is expanded in a 1D form:
where P, X, T are the polarization, stress, and temperature, respectively, and s and Q are called the elastic compliance and the electrostrictive coefficient, respectively. The elastic Gibbs energy definition, , leads to
G1(P,X,T) = (1/2)α P2 + (1/4)β P4 + (1/6)γ P6
− (1/2)s X2 − Q P2X, (α = (T − T0)/ε0 C)
− (1/2)s X2 − Q P2X, (α = (T − T0)/ε0 C)
E = (∂G1/∂P) = α P + β P3 + γ P5 − 2Q PX minus sign
x = − (∂G1/∂X) = sX + QP2
When the external stress X is zero, the following equations are derived:
E = α P + β P3 + γ P5
x = QP2
1/ε0 ε = (∂E/∂P) = α + 3 β P2 + 5 γ P4
When β < 0, γ > 0, the “first-order” phase transition comes out. If the external electric field is equal to zero (E = 0), two different states are derived; P = 0 and P2 = (−β +)/2γ.
(i) Paraelectric phase: PS = 0 or P = ε0ε E (under small E)
Permittivity: ε = C/(T − T0) (Curie-Weiss law)
Electrostriction: x = Q (ε0ε)2 E2
(ii) Ferroelectric phase: PS2 = (−β + )/2γ or P = PS + ε0ε E (under small E)
where we define the spontaneous strain xS and the piezoelectric constant d as:
x = Q(PS + ε0ε E)2 = QPS2 + 2 ε0ε QPS E (+Q (ε0ε)2E2)
Spontaneous strain: xS = QPS2
Piezoelectric constant: d = 2 ε0 ε QPS
Note here that the electrostriction is a nonlinear phenomenon originated from the anharmonic potential energy, which will be again discussed in Section 3.1. We see from Equation (17) that piezoelectricity is equivalent to the “electrostrictive phenomenon” biased by the spontaneous polarization”, which was already mentioned in the derivation process of Equation (4). The temperature dependences of the spontaneous polarization and dielectric constant are plotted in Figure 3 by comparing the second-order (a) and first-order (b) phase transitions.
Temperature dependence of various parameters are expressed in simple formulas in the case of second-order transition as follows:
(i) Paraelectric phase—T > T0
PS = 0
1/ε0 ε = α, then ε = C/(T − T0) (Curie-Weiss Law)
(ii) Ferroelectric phase—T < T0
1/ε0 ε = α + 3 β P2 = −2α, then ε = C/2(T0 − T)
xS = QPS2 = Q (T0 − T)/ε0Cβ
From Equations (18b) and (19b), the piezoelectric constant is obtained as
2.1.4. Isothermal Process—Piezoelectric Coupling
2.1.4.1. Thermodynamical Meaning of Piezoelectric Constant
We continue the “linear energy handling” in Section 2.1.2. When the temperature is constant (i.e., isothermal), in Equation (5b,c), we can obtain the “intensive” parameter-based piezoelectric constitutive equations:
where the following notations are used, and denoted as elastic compliance under constant E, dielectric permittivity under stress free:
The Maxwell relation, Equation (3a), verifies that the piezoelectric coefficient d in Equation (22a,b) are thermodynamically the same.
When we start from the Helmholtz free energy A (), by taking a similar Taylor expansion approach, we obtain another set of piezoelectric constitutive equations in terms of “extensive” parameters, x and D:
where cD is elastic stiffness under constant D, and κ0κx is inverse permittivity () under strain free condition, and these coefficients are expressed by:
X = cD x − h D,
E = −h x + κ0κx D,
The Maxwell relation, in Equation (3b), verifies that the inverse piezoelectric coefficients h in Equation (24a,b) are thermodynamically the same.
2.1.4.2. Electromechanical Coupling Factor
The term, electromechanical coupling factor k, is defined as the square value k2 being the ratio of the converted energy over the input energy: when electric to mechanical
and when mechanical to electric,
k2 = (Stored mechanical energy/Input electrical energy),
k2 = (Stored electrical energy/Input mechanical energy)
Let us derive Equation (26a) first practically, when an external electric field E3 is applied to a piezoelectric material in a pseudo-static process. See Figure 4a first, when we apply the electric field on the top and bottom electrodes under stress free conditions (X = 0). Input electric energy must be equal to (1/2)ε0ε3XE32 from Equation (4), and the output strain generated by E3 should be d33E3 from Equation (22a). Since the converted/stored mechanical energy is obtained as (1/2 s33E) x32, we obtain:
k332 = [(1/2)−(d33 E3)2/s33E]/[(1/2) ε0ε3XE32]
= d332/ε0ε3X∙s33E
= d332/ε0ε3X∙s33E
Let us now consider Equation (26b), when an external stress X3 is applied to a piezoelectric material in a pseudo-static process. Refer to Figure 4b. Under short-circuit condition (E3 = 0), the input mechanical energy must be equal to (1/2)s33EX32 from Equation (4), and the electric displacement D3 (or polarization P3) generated by X3 should be equal to d33X3 from Equation (22b). This D3 can be obtained by integrating the short-circuit current in terms of time through the electric lead. Since the converted/stored electric energy is obtained as (1/2 ε0 ε3X) D32, we obtain:
k332 = [(1/2 ε0ε3X) (d33X3)2]/[(1/2)s3EX32]
= d332/ε0ε3X∙s33E
= d332/ε0ε3X∙s33E
It is essential to understand that the electromechanical coupling factor k (or k2, which has a physical meaning of energy transduction/conversion rate), can be exactly the same for both converse (27a) and direct (27b) piezoelectric effects. The conditions under constant X (free stress) or constant E (short-circuit) are considered to be non-constrained.
2.1.4.3. Constraint Physical Parameters
It is important to consider the conditions under which a material will be operated when characterizing the dielectric constant and elastic compliance of that material. When a constant electric field is applied to a piezoelectric sample as illustrated in Figure 5 Top, the total input electric energy (left) should be equal to a combination of the energies associated with two distinct mechanical conditions that may be applied to the material: (1) stored electric energy under the mechanically clamped state, where a constant strain (zero strain) is maintained and the specimen cannot deform, and (2) converted mechanical energy under the mechanically free state, in which the material is not constrained and is free to deform. This situation can be expressed by:
such that:
When a constant stress is applied to the piezoelectric as illustrated in Figure 5 Bottom, the total input mechanical energy will be a combination of the energies associated with two distinct electrical conditions that may be applied to the material: (1) stored mechanical energy under the open-circuit state, where a constant electric displacement is maintained, and (2) converted electric energy (i.e., “depolarization” field) under the short-circuit condition, in which the material is subject to a constant electric field. This can be expressed as:
which leads to:
In principle, if we measure the permittivity in a piezoelectric specimen under stress-free and completely-clamped conditions, we can obtain and , respectively. However, in practice, cannot be measured because of the experimental difficulty to maintain the ideal strain-free (clamped) condition for a long period. Similarly, if we measure the strain in a piezoelectric specimen as a function of applied stress pseudo-statically, under short-circuit and open-circuit conditions, we can obtain and , respectively. However, in practice, cannot be measured because of the induced bound charge (or polarization) “screening” by migrating charge in the electrode, specimen or surrounding atmosphere in a couple of minutes. Thus, the clamped permittivity or open-circuit D-constant can only be measured with high-frequency dynamical methods, such as an impedance analyzer around the resonance/antiresonance frequencies.
In conclusion, we obtain the following equations:
where
We can also write equations of a similar form for the corresponding reciprocal quantities:
where, in this context,
This new parameter k in Equation (32) is also the electromechanical coupling factor in the “extensive” parameter description, and identical to the k in Equation (30). Note the k expression derivation from the piezoelectric constitutive equations, Equations (22a,b) and (24a,b):
2.1.5. Adiabatic Process 1—Piezothermal Effect
When we discuss the piezoelectric coupling phenomena, we assume the isothermic condition; that is, the specimen temperature is maintained constant, even the energy conversion is conducted between the electrical and mechanical energy. We consider next the adiabatic process; that is, the specimen is isolated from the external heat source, and temperature may be changed during the energy conversion process by the external input. When the electric field is constant, in Equation (5a,b), we can obtain the following equations:
or
where the following notations are used, and denoted as specific heat capacity under X = 0 and E = 0, elastic compliance under constant E:
Let us discuss here the diagonal expansion coefficient in terms of specific heat capacity. Recall the relation dq = TdS in the “reversible” thermal process, where dq is the thermal energy flow per unit “mass”, given by the total energy flow dQ = ρVdq (ρ: mass density, V: volume). The specific heat capacity is defined by
It is noteworthy that the piezothermal coefficient is usually called “linear thermal expansion coefficient” because . This piezothermal coefficient contributes to the converse effect; that is, temperature change under the stress application, which can be called “piezo-caloric” effect. The reader might have experienced in your elementary or middle school age that you felt “cool” temperature when you touched a thick rubber band on your lip immediately after expanding it. The piezothermal coefficient is originated from a nonlinear elastic vibration or the anharmonic phonon interaction, which will be discussed in Section 4.3.1. The “piezothermal coupling factor” kPT can be defined from Equation (34a,b) by
We can derive the completely “clamped” (strain x free) specific heat capacity and the “adiabatic” elastic compliance in terms of theoretically as follows, though these may not be useful physical parameters: Under strain-free condition (x = 0), we obtain from Equation (34b). Since Equation (34a) gives , we finally obtain . On the other hand, under the adiabatic condition (S = 0), we obtain from Equation (34a). Since Equation (34b) gives , we obtain .
2.1.6. Adiabatic Process 2—Electrothermal Effect
Direct effect is known as pyroelectricity, which is popularly used for temperature sensors and night-vision devices, while the converse effect is “electrocaloric” phenomenon, which is a recent hot topic for the application to a new refrigeration technology, as mentioned in Section 1 Background.
When the stress is constant, in Equation (5a,c), we can obtain the following equations:
or
where the following notations are used, and denoted as specific heat capacity (per unit mass) under X = 0 and E = 0, permittivity under constant stress X:
The primary electrothermal coupling coefficient is usually called “pyroelectric coefficient”, defined by
where we used the relation .
2.1.6.1. Constraint Specific Heat Capacity
In Equation (36), we introduced specific heat capacity (per unit mass) under X = 0 and E = 0; that is, under a short-circuit condition of a ferroelectric specimen’s surface electrodes. We may consider a different specific heat capacity under an open-circuit condition (i.e., D = constant or zero) [14].
Taking the first derivative of Equation (39a) with respect to T by keeping X = D = 0, and ,
From Equation (38b) at D = 0, we obtain
If we denote and , we can obtain
Here, we denoted the primary “electrothermal coupling factor” from Equation (39a,b) as
It is important to note that Equation (43) is analogous to Equation (29b) to correlate the D-constant and E-constant parameters in terms of “coupling factors”, and .
2.1.6.2. Constraint (Adiabatic) Permittivity
Permittivity was defined isothermally so far. However, we may consider adiabatic permittivity theoretically when no heat flow is hypothesized, such as the case where a ferroelectric specimen is suspended in a vacuum chamber [10].
From Equation (39b), isothermal permittivity () is given by
Under adiabatic condition, by putting S = 0 in Equation (39a), we obtain
Inserting Equation (46) into Equation (39b),
Thus, “adiabatic (S =constant) permittivity” is related with “isothermal (T = constant) permittivity” again by using primary electrothermal coupling factor as:
2.1.6.3. Electrocaloric Effect
Equation (39a) gives the necessary formula for the electrocaloric effect. When we take “adiabatic” condition; that is, constant entropy dS = 0, and Equation (46)
Here, is specific heat capacity (per unit mass) under E = 0, and p is pyroelectric coefficient given by . The material’s development strategy should be higher p and lower at room temperature (i.e., operation temperature 300 K).
Using a simple second-order phase transition, let us evaluate the temperature dependence of the electrocaloric figure of merit, . Recall the following equations obtained in the ferroelectric phase (T < TC = T0) in Section 2.1.3.2:
- (a)
- Specific Heat Capacity
- (b)
- Pyroelectric CoefficientNoting here , the pyroelectric coefficient is obtained as
- (c)
- Figure of Merit of Electrocaloric Effect
Since the pyroelectric coefficient increases significantly with approaching the phase transition temperature, in practical applications, the Curie temperature of the material is designed slightly higher than room temperature (i.e., operation temperature).
In order to realize the refrigeration function, a large “negative electric field” is required theoretically, so that the material’s “depoling” is anticipated. Since the coercive field is evaluated in the second-order phase transition [4] as
the EC reduces significantly with approaching the Curie temperature. Thus, in practice, by applying a high positive electric field gradually (pseudo-equilibrium or isothermally), then, a sudden decrease down to zero is conducted to lower the temperature to escape from the depoling problem in a low coercive field material.
2.1.6.4. “Electrothermal Coupling Factor”
Let us obtain a practical number of “electrothermal coupling factor” Equation (44) in PZTs at room temperature: . Initially, all parameters are listed below:
Specific heat capacity is measured by Differential Scanning Calorimetry (DSC), where endothermic and exothermic processes are monitored by keeping the input energy flow constant. Since the measuring time period is around 5–10 min, we cannot observe the difference between the short-circuited and open-circuited ferroelectric specimens, that is, and . This happens probably because the pyroelectrically induced charge is almost screened by the migrating free charge during a rather long measuring time (several minutes):
- Permittivity
PZT-APC841—1375 [19]
Finally, the electrothermal coupling factor is calculated as follows:
We can conclude that the electrothermal coupling factor in PZTs has a comparable order of magnitude to the electromechanical coupling factor k of 30–70%. It is interesting to calculate the value for the second-order phase transition case: using Equations (49)–(51), , irrelevant to any temperature, very idealistically.
2.2. Time-Dependent Ferroelectric Phenomenology
We handle transident reponse of a physical parameter after slightly deviated from the equilibrium state in terms of the “relaxation” time.
2.2.1. Polarization Relaxation
Landau and Khalatnikov developed a theory for the temperature dependence of the “relaxation time” of the order parameter, P, that is based on the Ginzburg–Landau theory of phase transitions [20,21]. This mean-field approach shows a divergence of near a second-order phase transision point, TC. The key assumption is that the change of polarization P with time (i.e., ) is proportional to internal energy decrease rate with the unit order parameter change (i.e., ). By introducing “relaxation time” , the inverse of which is taken as a proportional constant:
We use again the simple “second-order phase transition” model here for a practical calculation:
G1(P,T) = (1/2)α P2 + (1/4)β P4 [α = (T − T0)/ε0 C]
Recall the fact that, in the ferroelectric phase (T < T0), the spontaneous polarization is expressed as
Equation (55) is expressed in practice by
We consider the initial polarization ( by applying small electric field on a ferroelectric specimen with . The meaning of Equation (56) is to provide how quickly the P should return to the equilibrium state after sudden termination of the field. Equation (56) can be solved as
Thus, we obtain
The actual “relaxation time constant” τ is provided by
From Equations (57) and (58), we can conclude the following items:
- Time constant is proportional to “permittivity” .
- t → gives P → PS.
- With approaching T → T0, → . The recovery time of P is very slow around TC = T0.
The relaxation time τ is a measure of time delay of P generation after the external E is applied, which corresponds to the “reaction resistance” or “dielectric loss”. A similar concept is introduced in Section 4.3.2 for explaining the thermal resistivity/conductivity.
2.2.2. Temperature Relaxation
Time dependence of temperature (uniform temperature in a small volume) is considered in this section. We start from an equation similar to the previous section:
If we take the Gibbs energy transformed from Equation (4) under stress-free condition (X = 0),
Equation (59) is transformed into
The meaning of Equation (61) is to provide how quickly the θ should approach the equilibrium status after sudden application of the field E. As you realize, the electrocaloric effect under an adiabatic condition indicates the temperature change in the equilibrium status Equation (46) as
Equation (61) can be solved as
The actual relaxation time constant τ is expressed by
From Equations (63) and (64), we can conclude the following items:
- In a uniform (no space gradient) specimen, temperature change follows an exponential trend with time: .
- t → gives → . corresponds to the temperature change by the electrocaloric effect.
- Time constant is proportional to temperature, and inversely proportional to the specific heat capacity . The larger the specific heat capacity , and the lower the temperature, the lower the time constant . The recovery time of θ is quicker. This τ is roughly a suitable rise time period of an applying pseudo-step electric field.
The relaxation time constant τ in Equation (64) is very relevant to the time constant in thermal diffusivity measurement discussed in Section 3.2, where . Note the opposite effect of the specific heat capacity to the above relaxation time constant, and the heat flow relaxation time.
3. Thermal Diffusivity and Conductivity
So far, we discussed the equilibrium and time-dependent (dynamic) phenomenology in the uniform ferroelectric specimen (that is, uniform temperature distribution in a specimen). We will discuss spatially non-uniform (i.e., “space-gradient”) phenomenology in this chapter. The concept of “heat flow” is introduced, where the exponential trend with time such as is not sustained correctly.
3.1. 1D Heat Conduction Model
We will develop a 1D heat transfer model, as shown in Figure 6a, where a uniform disk or rod is thermally isolated so that no heat escapes from its sides [22]. Temperature gradient is introduced, and we define the temperature function θ(x,t) ( difference from the TR) at a point a distance x from one end of rod. We introduce the following three parameters:
- q—Heat flux = quantity of heat passing through cross section of rod per unit area per unit time. The unit of heat quantity is calorie (cal), and 1 cal corresponds to 4.186 Joule in energy.
- λ—Thermal conductivity = thermal or heat conductance per unit length of material. The inverse 1/λ is the resistance which measures the temperature drop per unit length when heat flux is unity.
- C—Heat capacitance of material = specific heat capacity cp (, ) density ρ, number of heat units to raise block of unit area and unit length (i.e., per unit volume) 1 °C in temperature. Note that the specific heat capacity [J/(kg·K)] is determined per unit mass (kg), which must be multiplied by density (kg/m3) to obtain the heat capacitance per unit volume [J/(m3·K)].
First, if is the temperature at a point at a distance of from the end of the rod, we have (considering the unit cross section area tube)
Thus, we obtain
Next, the heat flux at the point x raises the temperature of the lamina of thickness dx at the rate , and heat flux of magnitude emerges from the lamina of width dx. We thus have the equation
Again expanding by Taylor’s expansion, we obtain
From Equations (65b) and (66b) to eliminate the parameter q, we obtain 1D heat transfer equation as
The proportional constant is called “thermal diffusivity” , which is practically measured by thermal experiments. Units and typical numbers of the necessary parameters in PZT are summarized:
- Thermal conductivity — [W/(m·K)]
- Specific heat capacity — [J/(kg·K)]
- Mass density —7600 [kg/m3]
- Thermal diffusivity — [m2/s]
3.2. Solution of 1D Heat Transfer Equation
Let us solve the heat equation Equation (67) using the Laplace operator:
Taking as the Laplace transform of (), we have
We may assume the solution form as
Knowing the inverse Laplace transform,22)
and , Equation (70) can be transformed into
We consider the boundary condition: Large heat source ( = 0) is attached suddenly (t = 0) on the surface A (x = 0) in Figure 6a; that is, heat flux is given as a step-function with respect to time. Excluding immediately after t = 0 and adjacent to x = 0 point, we consider the region t > δ, x > δ’, and assume the following equation in most of the rod material’s length:
Equation (72b) is a sort of “Error function” in terms of coordinate x, and indicates that
- At x = 0, —Temperature is constant at , irrelevant to time after attaching to heat source.
- At x = L, —By measuring temperature change with t at x = L, we can obtain the thermal diffusivity .
Figure 7a shows temperature distribution profiles as a function of position x for various time lapses, and Figure 7b shows the temperature change with time at the position x = L. This simulation used the following values: , L = = [m2/s]. As can been seen, heat flux penetration speed for 2 mm thick sample does not take longer than 0.5 s, and the temperature monitoring finishes in less than 3 s. Even for a thicker specimen with 10 mm, the measuring time is still shorter than 30–40 s.
It is noteworthy that the temperature distribution profiles as a function of position x is not a simple exponential curve, but resembles a half positive part of so-called “error function”, when the abrupt step-function heat flux is inserted from the position x = 0 at t = 0. Because the curve profile of Figure 7b seems to be a simple exponential curve, we previously used the approximate formula [9]:
We verify this handling equivalency with the exact formula,
By putting , we obtain , then . Taking Taylor expansion,
we verify the relation
However, note the numerical factor difference; that is, in Equation (73a), and 4 in Equation (74). This means that the experimentally determined with Equation (73a) was overestimated from the value with Equation (73b) or (74) by the factor of . The absolute values may need to be modified by this factor from the previously reported values in Ref. [9], if required.
3.3. Thermal Diffusivity Measurements
We can find previous papers [23,24], which report on the thermal properties of PZT ceramics at low temperature (20 K–300 K), indicating a transition temperature between 50 K and 80 K, and at high temperature (300 K–800 K), characterizing the effect of phase transition on the thermal properties. However, to the author’s knowledge, the relationship of thermal properties with electrical boundary conditions and poling status in the PZTs and other ferroelectric piezoelectric ceramics has not been systematically studied yet.
We utilized our new experimental setup for measuring the thermal diffusivity of PZT’s. Though Ref. [25] reported the details of the experimental setup, we summarize it briefly for the reader’s sake (see Figure 6b). Hot isothermal condition is imposed on a flat disk sample in our experiments by suddenly being applied on the top surface (x = 0) at t = 0. The transient temperature increase of the bottom side of the rod specimen is analytically similar to an exponential formulation with a classic time constant, as described in the previous section in Equation (74). The thermal diffusivity is given proportional to the “inverse time constant”. This method hosts a variety of advantages over other methods such as (1) high accuracy, (2) low cost, (3) elimination of interface effects, and (4) small specimen size. Best of all, (5) the measuring time period is short (10–20 s) enough for measuring the difference between (short-circuit condition) and (open-circuit condition). The accuracy of our setup has already been demonstrated in several materials with low to medium thermal diffusivity (0.1–3 m2/s). The thermal diffusivity measurements in this experiment have an accuracy of 5% or better for some standard materials such as Fused Quartz and Pyrex 7740, in comparison to the literature values [25].
Using this method, the thermal diffusivity was measured on “poled” and “unpoled” commercially-available hard PZT ceramic disks, APC 841 (APC International, Mill Hall, PA, USA), of a diameter of 51 mm with thickness 2–5 mm. The ‘unpoled’ sample was “depoled” by heating the specimen, annealing, and then checking their no piezoelectric response on a conventional d33 m. The thermal diffusivity was measured in the direction of polarization for the poled samples. In parallel, the absolute value of heat capacity of a small specimen was measured using the DSC Q2000 (TA Instruments, New Castle, DE, USA), by comparing it to a sapphire reference sample. The “specific heat capacity (per mass)” and density are respectively cp = 340 J/kgK and ρ = 7600 kg/ m3. The specific heat capacity difference between and could not be detected under electrical boundary condition difference (short- and open-circuit) because the differential scanning calorimetry (DSC) took too long (5 min) to keep the “depolarization field”.
Table 1 summarizes thermal diffusivity, specific heat capacity, and thermal conductivity of a Hard PZT (APC 841), for unpoled and poled under different electrical boundary conditions (open- and short-circuit) [9]. Note the significant difference in “thermal diffusivity” obtained experimentally in these three electrical constraint conditions. The origin of this difference is discussed in the following section.
3.4. Thermal Diffusivity under Different Electrical Constraints
We discovered the fact that experimentally obtained “thermal diffusivity” exhibits the largest in a poled specimen under short-circuit condition, second in a poled specimen under open-circuit condition, and the smallest in an unpoled specimen; all disk samples have electrode on both the top and bottom surfaces. Because the thermal diffusivity is expressed by
where , cp, ρ are thermal conductivity, specific heat capacity, and mass density, respectively. The difference in must be the combination effect of the and cp differences (the density ρ may not be changed by the electric constraint condition).
3.4.1. Specific Heat Capacity—Scalar Parameter
Recall the two types of specific heat capacity, and , which are correlated by
Here, the primary “electrothermal coupling factor” is given by .
We propose an assumption on the “depolarization field” generation during temperature rise by pyroelectric effect, as shown in Figure 8: (a) poled specimen under short-circuit condition, (b) poled specimen under open-circuit condition, and (c) unpoled specimen. Because a polycrystalline PZT specimen is composed of multiple micro crystals, the situation is not actually so simple as described here. However, we assume that poled specimens are handled as a completely aligned single crystal with a monodomain; while the unpoled specimens have no net polarization, but each grain (i.e., microcrystal) generates the polarization change with temperature, which generates so-called “depolarization field” described as in each domain and grain [13].
Note first that the heat capacity is a “scalar” parameter, the value of which is not affected by the specimen orientation. When a specimen is poled and short-circuited with electrodes on the whole specimen (except for the narrow specimen sides) in Figure 8a, the depolarization field inside the material should be zero because the free charge in the electrode covers the bound charge on the surface and compensate the internal field; thus, is expected to be observed. On the contrary, in an unpoled specimen, though the polarization directions are randomly aligned in the specimen, since each grain experiences the polarization reduction with temperature, the internal depolarization field should be generated in each grain. We assume no free charge on the grain boundary region inside the specimen to compensate the depolarization field, though total macroscopic field may be zero (Figure 8c). Thus, is expected to be observed. We may need to modify this assumption slightly, if required, because the bound charge of the adjacent grains may partially compensate on the grain boundary; that is, may approach (slightly larger). The complex situation is found in a specimen of poled under open-circuit condition. Because of the surface electrode, E-constant two-dimensionally on the disk surface, but along the heat flow direction, D-constant seems to be maintained by the depolarization field generation (Figure 8b). We assume the effective specific heat capacity be evaluated by the average of 3D such as because of scalar characteristics. We decided first from the DSC equipment. Then, using , . Finally, for an unpoled specimen was calculated. See the center column data of Table 1.
The “depolarization field” generation mechanism is very analogous to the piezoelectric effect. Recall kt or k33 piezoelectric resonance modes, where the thickness or length stress distribution generates the depolarization field anti-parallel to the induced polarization (∆P = d33X3) in order to satisfy the D—constant (constraint) condition. The elastic compliance and sound propagation speed ( are modified by the electromechanical coupling factor or as . While in the electrothermal material, the polarization modulation is made from the temperature change via the pyroelectric effect. The specific heat capacity is modified by the electrothermal coupling factor as depending on the electrical constraint. We may also imagine the heat-flow (i.e., thermal conductivity) modulation according to the electrical constraint condition.
3.4.2. Thermal Conductivity—Tensor Parameter
Using with , we calculated thermal conductivity λ as listed in the last column of Table 1. Note first that the thermal conductivity is a second-rank tensor (similar to the electrical conductivity ), different from the scalar “specific heat capacity”.
Let us discuss the difference among the measured thermal conductivity values for poled short-circuit, poled open-circuit, and unpoled specimens. Note that, once poled, the piezo-ceramic crystallographic symmetry becomes (equivalent symmetry to in terms of tensor notations). First, the open-circuit thermal conductivity λD33 is 0.57 times smaller than the short-circuit one λE33. We denote the superscripts E and D of the conductivity λ, supposing that the sample is roughly maintained “electric field E constant” and “electric displacement D (or P) constant” during a rather short experimental time period less than 10 s. Subscript “33” stands for the tensor component relating to heat flux vector q3 and x-component of the temperature gradient grad (θ) (i.e., vector) along the spontaneous polarization PS direction. Second, the unpoled specimen exhibits a crystallographic symmetry of isotropic cubic (different from the poled specimens), and the thermal conductivity λu11 shows the smallest value, 25% less than that of the poled open circuit case (see the last column of Table 1). Different from the scalar analysis, the tensor analysis is directly coupled with the material’s crystallographic symmetry. The unpoled specimen cannot be discussed in parallel with the poled specimens because of the crystallographic symmetry difference.
We would like to define a new “electrothermal coupling coefficient” kλ33 below, in the relationship between the open-circuit λD33 and short-circuit thermal conductivity λE33 such as:
Let us consider a derivation of this “secondary coupling coefficient kλ33” with using a “space-gradient model” illustrated in Figure 9. Analogous to Equation (39a,b),
We define “heat flux” per unit time per unit area [W/m2] and [K/m], and gradient of vector [V/m2]. Nabra is the gradient, . In our simple model, we focus only on the x-direction component. Knowing the facts in 1D model: (1) , and (2) heat flux seems to be controlled by the electric field E (because of the difference between and ), we assume the following constitutive equations, resembling Equation (39a,b) above, but taking the gradient with respect to the heat flux direction x:
If we assume that the room temperature is reasonably low from the Curie temperature, enough to satisfy , (that is, the pyroelectric coefficient and permittivity change with temperature (or space coordinate x) is reasonably small), we can approximate the following equations:
We adopt another assumption, that is, D-constant along the thermal flow. From , we obtain , where , drift velocity of electric-displacement-charge. We can transform the gradient equations into time dependence:
Since means the electric-displacement-current, Equation (78b) stands for the dynamic (transient) current density and electric field relation, modified by additional current originating from the temperature gradient via pyroelectric effect. The constitutive equations are valid theoretically only under the equilibrium conditions. However, even a transient and irreversible status, if the phenomenon is in a pseudo-steady state like electric current or heat flow, we may assume similar constitutive equations: Equation (78a,b) are with respect to , , , and , instead of S, D, θ, and E in Equation (39a,b). Recall that and are intensive (irrelevant to volume) and and are extensive (size dependent) parameters. Let us confirm the units of all equation parameters: since the unit of entropy S is [J/K], we may assume the unit of as flow per second per unit area (normalize by size) [W/K·m2]. Because T and have [K] and [K/m], respectively, should possess the unit of [W/K·m] (normalized by time). While has [V/m2], should have [Cm/K·s]. On the contrary, Equation (78b) requires a tricky explanation: we assume is total charge flow (multiplied by cross-section area) per second with the unit [C/s]. In this case, taking as [K/m], should have [Cm/K·s]. The remaining problem is the last term: has [C/Vm] and has [V/m2], thus the product should have the unit of [C/m3]. We need to translate this term by multiplying the volume, such as (here C: capacitance, V: voltage). The new coupling parameter p′ seems to be analogous to pyroelectric coefficient p [C/K·m2] but is the total charge flow (multiplied by volume) per second because we are discussing basically space-gradient temperature profile. From Equation (78a,b), we may define a new “electrothermal coupling coefficient” kλ33 as
though Equation (77a,b) are not in an equilibrium state, but in an irreversible state. When we consider D3 = constant (i.e., open-circuit), we get from Equation (77b), then Equation (77a) is transformed into
The reader can understand that Equation (80) provides the support for the Equation (76) formula. The experimental result, λD33 = 0.57 λE33, gives . Knowing and , T = 300 K, we can obtain . The remaining problem is how to integrate the volume and unit time calibration into the term to satisfy all units.
We will discuss a more microscopic “phonon model” in Section 4 on the heat flow in conjunction with the above phenomenological explanation.
3.5. Thermal Conductivity in Pb-Free Piezoelectrics
In 2006, European Union started RoHS (Restrictions on the use of certain Hazardous Substances), which explicitly limits the usage of lead (Pb) in electronic equipment. Basically, we may need to regulate the usage of lead zirconate titanate (PZT), currently the most-widely used piezoelectric ceramics, in the future. Because of this background, the research on Pb-free piezoelectrics is now accelerated including their high-power performance. When we compare the maximum vibration velocity in Pb-free piezoelectric with PZT’s, 1 m/s (rms) vs. 0.6 m/s in k31 type plate specimens. Table 2 summarized the preliminary data on the thermal conductivity in the NKN-based material with the PZT’s value (both unpoled samples). Pb-free piezoceramics such as (Na,K)NbO3− and (Bi,Na)TiO3− based materials show much higher maximum vibration velocity than the PZT’s [26,27]. Much larger thermal conductivity in the NKN-based material than the PZT’s may also contribute to this good high-power performance in NKN-ceramics because of the definition of the maximum vibration velocity, as we have discussed in Figure 1 in Section 1.
4. Nonlinear Elastic Performances and “Phonons”
We discussed the phenomenological discussions in ferroelectrics on (1) linear equilibrium in Section 2.1, (2) nonlinear equilibrium in Section 2.1.3, and (3) Harmonic dynamic in Section 2.2. We discuss in this section the remaining nonlinear equilibrium and (4) Anharmonic dynamic. Important nonlinear equilibrium effects include the “electrostriction”, “thermal expansion”, and the anharmonic dynamic lattice vibration creates the “phonon thermal conductivity”.
4.1. Electrostriction and Thermal Expansion
Heat transport in dielectric solids is by way of elastic dynamic vibrations of the lattice (i.e., phonons) [28]. If the effective elastic energy potential for the crystal atoms possesses nonlinearity or anhormonicity, thermal expansion, electrostriction, and isothermal compressibility come out under equilibrium status. According to our previous paper Ref. [29], we introduce the effect derivation process briefly.
We shall use the theory of cohesive forces in ionic crystals here, proposed by Born [30]. In the interests of simplicity, we derive various formulae for two-ion rock-salt structure. We start from the potential function involving an inverse power type of repulsive energy of the form:
where M is the Madelung constant for Coulombic energy, N the coordination number and b is a potential constant for the quantum mechanical energy. Expanding the potential function around the equilibrium position (), we obtain the form as a function of (=r − r0):
where and . Using the Boltzmann distribution for Gibbs energy , the average equilibrium separation at high temperatures under an applied electric field E is as follows:
where subscripts denote the ion pairs in the positive and negative directions of the electric field respectively. The strain is therefore given by:
where the first term represents thermal expansion and the second term, electrostriction. The reader can understand that both coefficients are originated from “”, which is an anharmonic term, and when the crystal is purely harmonic, neither thermal expansion nor electrostriction occur. Knowing the polarization P, given by,
the thermal expansion coefficient and electrostrictive Q coefficient can be calculated
Finally, using the “First Law” of thermodynamic of (p: hydrostatic pressure, V: volume), the isothermal compressibility becomes:
Changing the variable from V to r and developing the result leads to the equation
Comparing Equations (87) and (89), we obtain the relationship, . The compressibility and electrostrictive coefficient are induced strain originated from the same crystal lattice anharmonic potential against the force and electric field.
4.2. Lattice Vibration and Phonon
We may speculate the physical reasons of the thermal conductivity difference under short- and open-circuit conditions from the aspects of phonon mode scattering, orientation of domains, and elastic compliance in this section. Remember the fact that ferroelectric-originated piezoelectric materials exhibit the phase transition associated with phonon mode “softening” (in particular, optical phonon mode) [14]. Using the “first-principle” calculations, Zhang et al. obtained elastic compliances, heat capacity, and thermal expansion coefficient, based on phonon dispersion curves [31]. Though the detailed discussion is beyond our target in this paper, we introduce here briefly basic concepts on the lattice vibration and “phonon”, based on books by Ashcroft and Mermin [28] and Ishii [32].
4.2.1. Lattice Vibration—One-Atom Chain Model
We consider the simplest one-atom (mass M) 1D chain (number of atoms N) connected by a harmonic spring (spring constant K), as shown in Figure 10a (Note two end atoms in a free condition). When we denote the displacement of the n-th atom from the equilibrium position as , we can obtain the following set of Newton equations:
Assuming a harmonic vibration, , where ω is the frequency,
Thus, we can write the following matrix formula:
where u is an N-Dimensional vector with the components of , and is a symmetric matrix with the components:
Here, we used Kronecker , which means that for ; for .
We will now solve the “eigenvalue equation” of Equation (91). Knowing the matrix component relation
and the boundary condition for the “free-end” (), assuming the a general solution of “difference equation” Equation (93) in the form of , we obtain the following characteristic equation:
When , we can put
where k, a are the wave number and the lattice unit size. The solution of Equation (94) is expressed as
Then, we can express a general solution of Equation (93) as
The “free-end” boundary condition gives the relations:
To realize the meaningful solution (or A and B values), at least the following “determinant = 0” should be satisfied:
This requirement determines the solutions regarding the k value
and for ,
Taking the normalizing factor determined by , we obtain the eigenvectors and eigen frequencies as follows:
When , unique solution , exists. However, when , no solution exists to satisfy the “free-end” boundary condition.
is called “wave number”, and the relationship between the frequency and wave number (Equation (103)) is called “dispersion relation”. As shown in Figure 11a, is valid only for a low k range (long wavelength λ); that is, a wave packet shape distorts significantly via frequency dispersion. This is the reason why “” curve is called “dispersion relation”.
The reader now understands that there are N lattice vibration eigenmodes for N eigenvalues in the N-chain crystal lattice. Each mode is identified as a “phonon”. Because the actual crystal size includes Avogadro number (1023 per mol) of atoms of N, the energy gap among phonons is quantum-mechanically small. According to the Gibbs statistical dynamics for the equilibrium status, thermo-dynamical properties in a crystal lattice is determined by these eigenvalues of the phonons. The internal energy U is expressed by using quantum-mechanically small unit as
Here, is the Planck constant, the Boltzmann constant, and T is temperature. The reader remembers in your high school physics that Einstein introduced “” quantum energy unit for “photon” introduction. Equation (104) comes from the same philosophical concept.
We usually take N → in an ideal crystal, and exists densely (N modes) just . In the case of large crystal (N → ), we occasionally use so-called “periodic boundary condition”, instead of “end-free” condition; that is, the end atom (N-th) is connected with the first atom with a spring K to the lattice chain as a “ring”. In this case, Equation (92) is modified as
We solve the above difference equation under the boundary condition .
The results are slightly different from Equations (102) and (103):
Here, is the Gauss symbol, which means the maximum integer number . The key difference due to the boundary condition change is the doubled unit cell; that is, even and odd number position atoms are not identical. The wave number exhibits double-degenerated eigenvalues, which correspond to the following two eigen functions:
These waves correspond to left-ward and right-ward progressive waves. Taking an atomic distance “a”, the wavelength and wave velocity v are given by
Equation (110) means that the wave velocity depends on the wave number; thus, a wave packet with different frequency mixture distorts. Just for a long wavelength range (), the wave velocity approaches and is valid.
4.2.2. Lattice Vibration—Two-Atom Chain Model
We now consider the two-atom (mass M and m, rock-salt-like) 1D chain (total number of atoms 2N) connected by a harmonic spring (spring constant K), as shown in Figure 10b [28,32]. When we denote the displacement of the n-th atom from the equilibrium position as , the dynamic equations are expressed as
Mass m (or M) is located at an even (or odd) number lattice position, and assuming the solutions
Equation (111) can be calculated as
In the matrix notation,
where
The lattice chain has a unit cell of size 2a with M and m atoms, and and are the “polarization (displacement) vectors” of m (even number position) and M (odd number position), respectively. From Equation (114), the eigenvalue ω should satisfy
The solution of the above equation is given by
We assume there are N unit cells with two atoms (M and m) in unit cells with a unit cell size of 2a, and the “period boundary condition” is adopted in this model. For N → , k will vary from 0 to 2π. At ,
while, at , from [supposing M > m]
Figure 11b illustrates the dispersion curves, plotted in the ka range of (because of the period symmetry). You can initially find frequency gap between and , where no solution (i.e., phonon mode) exists. If we take the case of M = m, this gap disappears and the dispersion curve becomes equivalent to that of one-atom model in Figure 11a, by considering the unfold shape at . corresponds to the upper curve, which is called “optical branch”. This branch approaches to with :
Around , the “polarization vector” e satisfies
which indicates that the two species of atoms move in opposite directions from each other by keeping the center of gravity position. When we consider ionic crystal such as rock-salt (or PZT), Na+ and Cl- ions move in opposite directions, leading to the electric polarization deviation. This phonon mode can easily couple with the external electric field such as “optical light” electric wave; thus, this is called “optical branch.” The reader can imagine that this interaction may be a part of the origin of “electrothermal coupling” in ferroelectric materials.
On the contrary, the lower branch of in Figure 11b is called “acoustic branch”. This branch approaches with ; a long-wavelength vibration transfer with a constant wave speed. The polarization vector e satisfies the following condition at k = 0:
Two species of atoms displace in the same direction with the same amplitude.
4.2.3. Phonon Spectral Density
As expressed in Equation (100), the phonon modes are uniformly distributed in terms of wave number k. However, in terms of frequency ω, the distribution is not uniform, but non-uniform. Due to the sinusoidal relationship, , the flat parts of the dispersion curve in Figure 11a,b condense phonon modes significantly. The number of phonon eigenvalues which exist between the frequency and is denoted as , where N is the total number of atoms and is called “spectral density”. Figure 11a,b inserted a modified phonon spectral density (i.e., frequency square spectral density), , for the reader’s reference.
4.3. Anharmonic Phonon Modes and Electrothermal Coupling
4.3.1. Anharmonic Phonon Modes and Wave Packet
Thermal energy can be stored in the lattice vibration normal phonon modes as a vibration amplitude. However, in a perfectly harmonic crystal, the phonon states are stationary, wide-spread in the crystal uniformly as a wave (not an isolated wave packet or particle-like phonon). Since phonon vibration is not disturbed, we can say the thermal resistance is zero, or thermal conductivity is infinite [28]. However, when the atomic energy potential includes nonlinear terms, the cubic anharmonic term just introduced in Equation (82) or the quartic term in Equation (6), the resonance frequency should include at least or , higher order harmonic modes. According to the uncertainty of the resonance frequency from the definite to , the phonon distribution changes from wide spread state to a sort of packet status. Figure 12 demonstrates a phonon wave packet generation from the anharmonic lattice vibration. From Equation (101), we assume the normal phonon eigenfunctions as
Taking into account a modified “phonon spectral density” (i.e., frequency square spectral density), as the summation weight, and the low frequency acoustic mode dispersion relation , we calculate the sum of ’s, which exist in
Individual wave forms (time dependence) are illustrated for = 1, 2, 3 and 0.2 in Figure 12, for the reader’s reference. Here, we took the atomic distance a = 1 as a normalized unit. One, two, and three sinusoidal wave forms and a rather flat long-wavelength shape ( = 0.2) are observed. When we sum up wave forms up to , the top wave packet can be obtained. Note that, if we add up to ideally, the wave shape should theoretically be a square pulse inserted in Figure 12. Once multiple phonons are generated synchronously via the anharmonic potential interactions, the phonon energy localization is expected (not uniformly distributed as a separated harmonic vibration), leading to the concept of wave-to-particle transition (i.e., the reason of the terminology introduction of “phonon” from the elastic lattice vibration wave). If we rephase the above argument in a reverse way, by having an excess of phonons with similar directed group velocities (i.e., by touching a heat source on the solid crystal), the anharmonic part of the ionic interaction plays the wave packet into creation, destruction or scattering of various frequency phonons, which corresponds to “thermal resistivity” (i.e., inverse of thermal conductivity).
4.3.2. Heat Flow and Electrothermal Coupling
First, the sound velocity of the longitudinal wave is much faster than the transverse waves in dielectric solid. Thus, thermal conductivity seems to be determined primarily by the speed of longitudinal phonons. Second, phonons in the acoustical branch dominate the phonon heat conduction as they have greater energy dispersion and a greater distribution of phonon velocities. Additional “optical modes” can also be caused by the presence of charge or mass at lattice points. Though it is implied that the sound velocity of the optical modes is low and their contribution to the lattice thermal conduction is small in general [33], the optical mode contribution seems to also be important in ferroelectric materials such as PZT’s because of their low-frequency soft-phonon modes, which are highly interactive with the electric field. Third, when the phonon number deviates from the equilibrium value , thermal current arises as expressed by
where is the energy transport velocity of phonons, equivalent to v in Equation (78a,b). There are two mechanisms to cause time variation of in a particular region, the thin segmented disk in Figure 9: (1) The number of phonons that diffuse into and diffuse out between the considering region and neighboring regions, and (2) phonon decay inside the same region into other phonons. A special form of the Boltzmann equation provides
Time variation in the latter term is described with a relaxation time (τ) approximation.28) Assuming the spirit of the Drude model, the phonon collision occurs in a distance (: energy transport velocity) in terms of the relaxation time τ. Though the microscopic origin is not clear, this relaxation time concept has also been integrated in Section 2.2:
When the “steady state” condition is assured, that is, , the local thermal equilibrium (i.e., dynamic equilibrium) is assumed, leading to the equation
Using the relaxation time approximation for the Boltzmann equation and assuming steady-state conditions, the phonon thermal conductivity λ can be determined:
Let us now discuss the thermal conductivity changes under different electrical constraints. Phonon transmission speed is proportional to the thermal conductivity λ. First, because of the random orientation of domains in the unpoled sample, it is expected that there will be the most phonon scattering at the domain boundaries in this specimen (i.e., acoustic mismatch at the grain boundaries). Therefore, it will have the lowest thermal conductivity. Second, by increasing the degree of domain orientation by the electric poling process, less scattering is expected in the poled specimens and thermal conductivity will be larger for the poled material (λE33 and λD33), according to the crystallographic symmetry change from to . Third, because the elastic compliance under the short-circuit condition (sE33) is softer than the elastic compliance under open-circuit conditions (sD33) via the relation sE33(1 − k332) = sD33, and the sound velocity is smaller than , the lattice vibration and domain wall dynamic motion are expected to be larger in the polarization direction under the short-circuit condition. In the thermal conductivity measurement, the “depolarization field” in parallel to the spontaneous polarization direction under open-circuit condition (i.e., D-constant), originated from the pyroelectric charge during the temperature rise, stabilizes the crystal vibration. The internal electric field in piezo-materials in general stabilizes the lattice vibration (in particular optical branch) and domain wall motion. The larger lattice vibration and domain wall dynamics in the short-circuit condition may also introduce a larger phonon transportation, i.e., larger thermal conductivity (λE33). This speculation can also suggest the analogous relations among two coupling factors: electromechanical k33 and secondary electrothermal kλ33.
5. Thermal Analysis on Piezoelectric Transducers
Based on the aforementioned knowledge, we introduce two practical thermal analysis case studies in piezoelectric transducers in this section.
Heat generation in piezoelectric materials are originated from three losses: dielectric, elastic, and piezoelectric losses. The hysteresis curves: dielectric D vs. E, elastic x vs. X, and piezoelectric x vs. E under a stress-free condition and D vs. X under a short-circuit condition correspond dielectric, elastic, and piezoelectric coupling losses, respectively. We discuss the heat generation mechanisms of piezoelectric actuators under (1) off-resonance operation for actuator applications (under a large electric field, 1 kV/mm or higher), where the dielectric loss is the primary origin, and (2) resonance (or anti-resonance) operation for ultrasonic transducer applications (under a high vibration condition at low electric field, 100 V/mm or lower), where the intensive elastic loss is the primary heat generation factor.
5.1. Pseudo-DC Piezoelectric Actuators
5.1.1. Heat Generation from Multilayer Actuators
Zheng et al. reported the heat generation at an off-resonance frequency from various configurations of multilayer (ML) type piezoelectric ceramic (soft PZT) actuators [34]. Figure 13 shows a structure of the multilayer piezoelectric actuators. The temperature change with time in the actuators was monitored when driven at 3 kV/mm (high electric field) and 300 Hz (much lower frequency than the resonance frequency) (Figure 14a). The specimen temperature reached up to 140 °C, depending on the size, showing an exponential increase with the operation time lapse. Figure 14b plots the saturated temperature as a function of Ve/A, where Ve is the effective volume (electrode overlapped part, abL in the figure) and A is the all surface area. Because the temperature was uniformly generated in a bulk sample (no significant stress distribution, except for the small inactive portion of the external electrode sides), this linear relation is reasonable because the volume Ve generates the heat, which is dissipated through the area A. Thus, if we need to suppress the temperature rise, a small Ve/A design is preferred. Instead of one ML, four (1/4) small-ML’s connected in parallel are preferred.
5.1.2. Thermal Analysis on ML Actuators
According to the law of energy conservation, the amount of heat stored in the piezoelectric, which is just the difference between the rate at which heat is generated, qg, and that at which the heat is dissipated, qd, can be expressed as
where it is assumed that a “uniform temperature distribution” exists throughout the sample and V is the total volume, ρ is the mass density, and cp is the specific heat capacity (per mass) of the specimen. The heat generation in the piezoelectric is attributed to losses. Thus, the rate of heat generation, qg, is expressed as:
where w is the loss per driving cycle per unit volume, f is the driving frequency, and Ve is the effective volume of active ceramic (no-electrode parts are omitted). According to the measurement conditions (no significant stress in the sample at off-resonance), this w may correspond primarily to the dielectric hysteresis loss (i.e., P-E hysteresis), we, which is expressed in terms of the intensive dielectric loss tan δ’ as:
qg − qd = V ρ cp (dT/dt),
qg = w f Ve,
w = we = π εXε0 E02 tan δ’.
If we neglect the transfer of heat through conduction, the rate of heat dissipation (qd) from the sample is the sum of the rates of heat flow by radiation (qr) and by convection (qc):
where e is the emissivity of the sample, A is the sample surface area, σ is the Stefan–Boltzmann constant, To is the initial sample temperature, hc is the average “convective heat transfer coefficient”. Thus, Equation (98) can be written in the form:
where the quantity
is the overall “heat transfer coefficient”. If we assume that k(T) is relatively insensitive to temperature change (if the temperature rise is not large), solving Equation (130) for the rise in temperature of the piezoelectric sample yields:
where the time constant τ is expressed as:
qd = qr + qc = eAσ (T4 − To4) + hc A(T − To),
w f Ve − A k(T) (T − To) = V ρ Cp (dT/dt),
k(T) = σe (T2 + To2)(T + To) + hc
T − To = [w f Ve/k(T) A] (1 − e−t/τ),
τ = ρCp V/k(T) A.
We can understand that the specimen temperature rise follows only when the heat transfer coefficient k(T) is nearly constant.
As t → ∞, the maximum temperature rise in the sample becomes:
while, as t → 0, the initial rate of temperature rise is given by
where wT can be regarded under these conditions as a measure of the total loss of the piezoelectric. The dependence of k(T) on applied electric field and frequency are shown in Figure 15a,b, respectively. Note that k(T) is almost constant, as long as the driving voltage or frequency is not very high (E < 1 kV/mm, f < 2 kHz). The total loss, wT, as calculated from Equation (137b) is given for three multilayer specimens in Table 3, three values of which are almost the same in less than 2% deviation. In parallel, we measured the P-E hysteresis losses under stress-free conditions. The we values obtained (Equation (130)) are also listed in Table 3 for comparison. It is intriguing that the extrinsic P-E hysteresis loss contributes more than 90% of the calculated total loss associated with the heat generated in the operating piezoelectric specimen [34,35]. We can conclude that the heat generation of the piezoelectric specimen under high-electric field off-resonance operation is primarily originated from the intensive dielectric loss factor, tan δ’.
ΔT = w f Ve/k(T) A,
dT/dt = (wT f Ve/ρCp V) = ΔT/τ,
5.2. Resonance Drive Piezoelectric Transducers
5.2.1. Heat Generation from a Resonating Piezoelectric Specimen
Tashiro et al. observed the heat generation in a rectangular piezoelectric plate during a resonating drive [36]. Even though the electric field is not large, considerable heat is generated due to the large induced strain/stress at the resonance. The maximum heat generation was observed at the nodal regions for the resonance vibration, which correspond to the locations where the maximum strains/stresses are generated.
The ICAT at the Penn State University also worked on the heat generation comprehensively in rectangular piezoelectric k31 plates (Figure 16) when driven at the resonance [37]. The temperature distribution profile in a PZT-based plate sample was observed with a pyroelectric infrared camera (FLIR Systems ThermaCAM S40 outfitted with a 200 mm lens), as shown in Figure 17, where the temperature variations are shown in the sample driven at the first (28.9 kHz) (a) and second resonance (89.7 kHz) (b) modes, respectively. The highest temperature (bright spot) is evident at the nodal line areas of the length resonance for the specimen in Figure 17a,b. This observation supports that the heat generated in a resonating sample is primarily originated from the intensive elastic loss, tanφ’. Remember that the maximum vibration velocity is defined as the velocity under which a 20 °C temperature increase occurs at the maximum temperature point (i.e., nodal line!) in the sample.
5.2.2. Heat Generation at the Antiresonance Mode
The resonance and antiresonance are both mechanical resonances with the electrical admittance maximum and almost zero (or maximum), respectively, when electrically excited. We can amplify the generating displacement (or vibration velocity) significantly by the factor of mechanical quality factor QA at the resonance under constant voltage drive, while by QB at the antiresonance under constant current drive. In the k31 mode, we derived the mechanical quality factors QA and QB as follows [37]:
Here, tanδ33′, tanϕ11′, and tanθ31′ are intensive loss factors for ε33X, s11E, d31, respectively, and ΩB,31 is the normalized antiresonance frequency:
where the antiresonance (normalized) frequency ΩB,31 is k31 dependent, and can be obtained from the equation . Because the intensive dielectric loss tanθ31′ is larger than in PZT piezoceramics, QB at antiresonance is higher than QA at resonance; that is, the antiresonance operation seems to be more efficient than the resonance drive.
Figure 18a,b show temperature variations in a PZT-based plate specimen driven at the antiresoance (a) and resonance frequency (b) under the same vibration velocity (i.e, almost the same output mechanical energy), which clearly exhibit lower temperature rise in the antiresonance, than that in the resonance drive. Remember the similar resonance and antiresonance vibration modes for a reasonable electromechanical coupling factor k31 = 30% [37]. In comparison with the fundamental resonance mode, though the antiresonance mode exhibits the strain-zero lines (i.e., anti-node lines) a little inside from the plate edges for this small k31 case, the overall vibration configurations for resonance and antiresonance modes are rather close to each other. Namely, as long as the vibration velocity at the plate edge is the same, the total mechanical energy is assumed to be the same for both resonance and antiresonance operations. Numerical profiles of the temperature distribution for the A- and B-type resonance modes are shown in Figure 18c for various vibration velocity, which seems to be pseudo-sinusoidal curves in terms of the length position coordinate. Under the same vibration velocity, 550 mm/s RMS, the resonance nodal line area shows the temperature up to 100 °C, while the antiresonance mode shows the maximum around 60 °C; dramatic heat generation reduction under the antiresonance drive
5.2.3. Thermal Analysis on the Resonance Mode
5.2.3.1. Heat Transfer Modeling
We develop a 1D heat transfer model for the k31 mode piezoelectric rectangular plate around the resonance/antiresonance frequency range. In comparison with the off-resonance model, where the heat is generated primarily from the dielectric loss and the uniform temperature distribution profile due to no particular stress in the specimen, the resonance case generates the heat originated from the intensive elastic loss on a sinusoidal stress distribution of a specimen. Because of the initial heat source being sinusoically distributed in the specimen, we need to integrate the thermal diffusivity of the piezo-ceramic in order to analyze the temperature distribution of the sample.
We set the following assumptions for developing the heat diffusion equation:
- (1)
- 1D heat conduction in the specimen.
- (2)
- Heat generation is proportional to strain squared (i.e., elastic energy), distributed on the specimen.
- (3)
- Heat dissipation via convection (to air) and radiation. Conduction is neglected.
Using a temperature parameter T(x,t), which is defined as temperature of a sliced volume Δx from the position coordiate x to (x + Δx) at time t, the following equation is assumed:
where λ is thermal conductivity [unit: W/m K], cp (cE in the k31 case) is specific heat (unit: J/kg K), ρ density, and is called thermal diffusivity [unit: m2/s].4,7) The first term of the right-hand-side of Equation (140) describes the temperature distribution in respect of the position x, which changes the shape with time. The second term corresponds to the temperature increment caused by heat generation per unit volume (devided by ), which may exhibit a sinusoidal distribution. The third term indicates the heat dissipation proportional to the temperature difference ΔT from the ambient temperature .
Regarding the heat generation, we further assume that is expressed in proportion to the square of the sinusoidally-distributing strain, as visualized in Figure 19:
The heat dissipation hd is a proportional constant to [T − Tair], similar to “heat transfer coefficient” introduced in Equation (131).
5.2.3.2. Temperature Distribution Profile Change with Time
We prepared a piezoelectric k31 rectangular plate specimen with in size with a hard PZT composition (APC 841, American Piezo Company, Mill Hall, PA, USA) for both admittance and thermal imaging observation purposes. We used a constant vibration velocity method for the measurements under 300 mm/s RMS. Figure 20a shows the temperature distribution profile change with time after driving. You can notice that the plate edge temperature increases significantly with time lapse, primarily due to the thermal diffusion in the PZT from the nodal highest point to the edge lowest temperature point. The saturated temperature distribution profile for the k31 specimen is shown in Figure 20b, which can be used for calculating the total thermal dissipation energy gh. A small temperature dent at x = 0 originated from the heat dissipation by the center sample-holding rod conduction, which is neglected in the simulation.
If we adopt the most general definition of the mechanical quality factor as
we can obtain Qm from
Note that this is the unique approach to determine the mechanical quality factor with using merely the thermal data, without using any electrical energy information.
Shekhani et al. measured the admittance spectrum on the above PZT sample () with the resonance frequency at 20.04 kHz at room temperature, and obtained Qm = 507 by a 3-dB-down method on an admittance spectrum. Then, the sample was excited under the vibration velocity of 400 mm/s for 30 s, which corresponds to the heat dissipation of 11.6 W/m2. Figure 21 shows the Qm obtained at three frequencies slightly above the resonance frequency (20.04 kHz) [7]. The Qm values around 550 agree with the extraporated values from the above 507. Thus, we can conclude that this thermal method can determine the Qm reasonably at any frequency around the resonance and anti-resonance region. An increase of Qm with increasing the frequency suggests that a maximum-Qm frequency (i.e., the highest efficiency) exists between the resonance and antiresonance frequencies [38].
6. Conclusions
The electrothermal, piezothermal, and piezoelectric coupling phenomena in ferroelectrics have been introduced with thermodynamics viewpoints—in particular, thermal property differences among unpoled and poled PZT’s in the poling direction for open circuit and short circuit conditions. The derivation processes for piezoelectric, piezothermal and electrothermal “coupling factors” have been introduced comprehensively. We proposed a new “electrothermal” coupling factor kλ for the thermal conductivity analysis, relating the parameter change under short- and open-circuit conditions, in order to explain the fact that the short-circuit condition exhibited larger thermal diffusivity than the open-circuit condition. On the other hand, the unpoled specimen exhibits the lowest thermal conductivity. This tutorial paper was authored for providing comprehensive knowledge on equilibrium and time-dependent thermodynamics in ferroelectrics. Electrothermal coupling may be categorized as primary and secondary effects in general. The primary effect includes “pyroelectric” and “electro-caloric” phenomena, and the secondary effect includes the space-gradient (i.e., first-derivative) phenomena, such as “thermal conductivity” and local “electric displacement current”. The author is expecting further theoretical expansion in this electrothermal coupling area, and industrial application products.
Funding
Office of Naval Research—grant number: ONR N00014-12-1-1044.
Acknowledgments
The author is indebted to Husain N. Shekhani for his valuable experimental data on “thermal conductivity” and other heat generation modeling in PZT ceramics, which motivated me to author this paper. The author would also like to acknowledge the Office of Naval Research for this research support under grant number: ONR N00014-12-1-1044.
Conflicts of Interest
The author declares no conflict of interest. The funders had no role in the design of the study; in the collection, analyses, or interpretation of data; in the writing of the manuscript, or in the decision to publish the results.
References
- Priya, S.; Uchino, K. Estimation of Polarocaloric Contribution to Dielectric Loss in Oriented 0.92PZN-0.08PT Single Crystals. Jpn. J. Appl. Phys. 2003, 42, 5158–5164. [Google Scholar] [CrossRef]
- Mischenko, A.S.; Zhang, Q.; Scott, J.F.; Whatmore, W.R.; Mathur, N.D. Giant Electrocaloric Effect in Thin-Film PbZr0.95Ti0.05O3. Science 2006, 311, 1270–1271. [Google Scholar] [CrossRef] [PubMed] [Green Version]
- Neese, B.; Chu, B.; Lu, S.-G.; Wang, Y.; Furman, E.; Zhang, Q.M. Large Electrocaloric Effect in Ferroelectric Polymers Near Room Temperature. Science 2008, 321, 821–823. [Google Scholar] [CrossRef] [PubMed]
- Uchino, K. High. Power Piezoelectrics and Loss Mechanisms; CRC Press: Boca Ratton, FL, USA, 2020; ISBN 978-0-367-54069-2. [Google Scholar]
- Uchino, K.; Hirose, S. Loss Mechanisms in Piezoelectrics: How to Measure Different Losses Separately. IEEE-UFFC Trans. 2001, 48, 307–321. [Google Scholar] [CrossRef] [PubMed]
- Ural, S.; Park, S.; Priya, S.; Uchino, K. High Power Piezoelectric Transformers with Cofired Copper Electrodes—Part I. In Proceedings of the 10th International Conference New Actuators, Bremen, Germany, 14–16 June 2006; pp. 556–558. [Google Scholar]
- Shekhani, H.N.; Uchino, K. Characterization of Mechanical Loss in Piezoelectric Materials Using Temperature and Vibration Measurements. J. Am. Ceram. Soc. 2014, 97, 2810–2814. [Google Scholar] [CrossRef]
- Uchino, K. High Power Piezoelectric Materials. In Proceedings of the IEEE UFFC Distinguished Lectures, University of Mexico, Morelia, Mexico, 29 April–3 May 2019. [Google Scholar]
- Shekhani, H.N.; Gurdal, E.A.; Ganapatibhotla, L.; Maranas, J.K.; Staut, R.; Uchino, K. Thermal Conductivities of PZT Piezoelectric Ceramics under Different Electrical Boundary Conditions. J. Insight Mat. Sci. 2020, 3, 10–14. [Google Scholar] [CrossRef]
- Mitsui, T.; Tatsuzaki, T.; Nakamura, E. Ferroelectrics. In Related Substances, b)(LANDOLT-BORNSTEIN Numerical Data and Functional Relationships in Science and Technology, IIV16b; Springer: Berlin/Heidelberg, Germany, 1982; p. 1969. [Google Scholar]
- Devonshire, A.F. Theory of Barium Titanate. Philos. Mag. 1949, 40, 1040–1063. [Google Scholar] [CrossRef]
- Devonshire, A.F. Theory of Ferroelectrics. Adv. Phys. 1954, 3, 85–130. [Google Scholar] [CrossRef]
- Kay, H.F. Electrostriction. Rep. Prog. Phys. 1955, 43, 230. [Google Scholar] [CrossRef]
- Uchino, K. Ferroelectric Devices, 2nd ed.; CRC Press: New York, NY, USA, 2009. [Google Scholar]
- Cooks, W.R., Jr.; Berlincourt, D.A.; Scholz, F.J. Thermal Expansion and Pyroelectricity in Lead Titanate Zirconate and Barium Titanate. J. Appl. Phys. 1963, 34, 1392. [Google Scholar] [CrossRef]
- Lang, S.B. Pyroelectric Thermometer for Use at Low Temperatures. Rev. Sci. Instr. 1969, 40, 274. [Google Scholar] [CrossRef]
- Lane, R.; Luff, D.; Brown, K.R.; Marshallsay, H.J. The variation of the pyroelectric coefficient with composition and phase structure for lead zirconate titanate ceramics. Trans. J. Br. Ceram. Soc. 1973, 72, 39. [Google Scholar]
- Lines, M.E.; Glass, A.M. Principles and Applications of Ferroelectrics and Related Materials; Clarendon Press: Oxford, UK, 1977. [Google Scholar]
- Physical and Piezoelectric Properties of APC Materials. Available online: https://www.americanpiezo.com/apc-materials/physical-piezoelectric-properties.html (accessed on 18 September 2011).
- Landau, L.D.; Khalatnikov, I.M. Collected Papers of Landau, L.D.; Haar, D.T., Ed.; Gordon & Breach: New York, NY, USA, 1965. [Google Scholar]
- Landau, L.D.; Khalatnikov, I.M. On the anomalous absorption of sound near a second order phase transition point. Dokladii Academii Nauk 1954, 96, 469–472. [Google Scholar]
- Pipes, L.A. Applied Mathematics for Engineers and Physicists, 2nd ed.; McGraw-Hill Book Company: New York, NY, USA, 1958. [Google Scholar]
- Yarlagadda, S.; Chan, M.; Lee, H.; Lesieutre, G.A.; Jensen, D.W.; Messer, R.S. Low temperature thermal conductivity, heat capacity, and heat generation of PZT. J. Intell. Mater. Syst. Struct. 1995, 6, 757–764. [Google Scholar] [CrossRef]
- Kallaev, S.N.; Gadzhiev, G.G.; Kamilov, I.K.; Omarov, Z.M.; Sadykov, S.A.; Reznichenko, L.A. Thermal properties of PZT-based ferroelectric ceramics. Phys. Solid State 2006, 48, 1169–1170. [Google Scholar] [CrossRef]
- Shekhani, H.N.; Uchino, K. Thermal diffusivity measurements using insulating and isothermal boundary conditions. Rev. Sci. Instrum. 2014, 85, 015117. [Google Scholar] [CrossRef]
- Gurdal, E.A.; Ural, S.O.; Park, H.Y.; Nahm, S.; Uchino, K. High Power Characterization Of (Na0.5K0.5)NbO3 Based Lead-Free Piezoelectric Ceramics. Sens. Actuators A Phys. 2013, 200, 44–46. [Google Scholar] [CrossRef]
- Hejazi, M.; Taghaddos, E.; Gurdal, E.; Uchino, K.; Safari, A. High Power Performance of Manganese-Doped BNT-Based Pb-Free Piezoelectric Ceramics. J. Am. Ceram. Soc. 2014, 97, 3192–3196. [Google Scholar] [CrossRef]
- Ashcroft, N.W.; Mermin, N.D. Solid State Physics; W.B. Saunders Co.: Orlando, FL, USA, 1976; ISBN 0-03-083993-9. [Google Scholar]
- Uchino, K.; Cross, L.E. Electrostriction and its Interrelation with Other Anharmonic Properties of Materials. Jpn. J. Appl. Phys. 1980, 19, L171–L173. [Google Scholar] [CrossRef]
- Born, M.; Göppert-Mayer, M. Handbuch der Physik; Springer: Berlin/Heidelberg, Germany, 1933; Volume 24, p. 623. [Google Scholar]
- Zhang, H.; Shang, S.L.; Wang, Y.; Saengdeejing, A.; Chen, L.Q.; Liu, Z.K. First-principles calculations of the elastic, phonon and thermodynamic properties of Al12Mg17. Acta Mater. 2010, 58, 4012–4018. [Google Scholar] [CrossRef]
- Ishii, K. Vibration and Eigenvalue Problem. Mod. Math. 1972, 5, 24–32. [Google Scholar]
- Pichanusakorn, P.; Bandaru, P. Nanostructured thermoelectrics. Mat. Sci. Eng. R. Rep. 2009, 67, 19–63. [Google Scholar] [CrossRef]
- Zheng, J.; Takahashi, S.; Yoshikawa, S.; Uchino, K.; de Vries, J.W.C. Heat Generation in Multilayer Piezoelectric Actuators. J. Am. Ceram. Soc. 1996, 79, 3193–3198. [Google Scholar] [CrossRef]
- Uchino, K.; Zheng, J.; Joshi, A.; Chen, Y.H.; Yoshikawa, S.; Hirose, S.; Takahashi, S.; de Vries, J.W.C. High Power Characterization of Piezoelectric Materials. J. Electroceram. 1998, 2, 33–40. [Google Scholar] [CrossRef]
- Tashiro, S.; Ikehiro, M.; Igarashi, H. Influence of temperature rise and vibration level on electromechanical properties of high-power piezoelectric ceramics. Jpn. J. Appl. Phys. 1997, 36, 3004–3009. [Google Scholar] [CrossRef]
- Uchino, K. Micromechatronics, 2nd ed.; CRC Press: Boca Raton, FL, USA, 2019; ISBN-13: 978-0-367-20231-6. [Google Scholar]
- Yuan, T.; Dong, X.; Shekhani, H.; Li, C.; Maida, Y.; Tou, T.; Uchino, K. Driving an inductive piezoelectric transducer with class E inverter. Sens. Actuators A Phys. 2017, A261, 219–227. [Google Scholar] [CrossRef]
Figure 1.
Saturated temperature distribution profile difference between PZT-5H and PZT-19.

Figure 2.
Temperature and electric field dependence of the electric free energy curve.

Figure 3.
Phase transitions in a ferroelectric: (a) second-order and (b) first-order transition.

Figure 4.
Calculation models of electro-mechanical coupling factor k for (a) electric input under stress free, and (b) stress input under short-circuit condition.
Figure 4.
Calculation models of electro-mechanical coupling factor k for (a) electric input under stress free, and (b) stress input under short-circuit condition.

Figure 5.
Schematic representation of the response of a piezoelectric material under: Top constant applied electric field and Bottom constant applied stress conditions.
Figure 5.
Schematic representation of the response of a piezoelectric material under: Top constant applied electric field and Bottom constant applied stress conditions.

Figure 6.
(a) 1D thermal diffusion model, (b) experimental setup for determining directional thermal diffusivity.
Figure 6.
(a) 1D thermal diffusion model, (b) experimental setup for determining directional thermal diffusivity.

Figure 7.
(a) temperature distribution profiles as a function of position x for various time lapses, and (b) temperature change with time at the position x = L.
Figure 7.
(a) temperature distribution profiles as a function of position x for various time lapses, and (b) temperature change with time at the position x = L.

Figure 8.
Depolarization field generation during temperature rise by pyroelectric effect: (a) poled specimen under short-circuit condition, (b) poled specimen under open-circuit condition, and (c) unpoled specimen.
Figure 8.
Depolarization field generation during temperature rise by pyroelectric effect: (a) poled specimen under short-circuit condition, (b) poled specimen under open-circuit condition, and (c) unpoled specimen.

Figure 9.
1D thermal conduction model of a ferroelectric under open-circuit condition.

Figure 10.
1D thermal conduction model of a ferroelectric under open-circuit condition.

Figure 11.
ω–k Dispersion curve for (a) one-atom 1D lattice chain model, and (b) two-atom 1D lattice change model.
Figure 11.
ω–k Dispersion curve for (a) one-atom 1D lattice chain model, and (b) two-atom 1D lattice change model.

Figure 12.
Phonon wave packet generation from the anharmonic lattice vibration.

Figure 13.
Structure of a multilayer piezoelectric actuator.

Figure 14.
(a) device temperature change with driving time for ML actuators of various sizes; (b) temperature rise at off-resonance versus Ve/A in various size soft PZT ML actuators, where Ve and A are the effective volume and the surface area.
Figure 14.
(a) device temperature change with driving time for ML actuators of various sizes; (b) temperature rise at off-resonance versus Ve/A in various size soft PZT ML actuators, where Ve and A are the effective volume and the surface area.

Figure 15.
Overall heat transfer coefficient, k(T), plotted as a function of applied electric field (a), and of frequency (b) for a PZT ML actuator with 7 × 7 × 2 mm3 driven at 400 Hz.
Figure 15.
Overall heat transfer coefficient, k(T), plotted as a function of applied electric field (a), and of frequency (b) for a PZT ML actuator with 7 × 7 × 2 mm3 driven at 400 Hz.

Figure 16.
A rectangular piezo-ceramic plate (L ≫ w ≫ b) for a longitudinal mode through the transverse piezoelectric effect (d31).
Figure 16.
A rectangular piezo-ceramic plate (L ≫ w ≫ b) for a longitudinal mode through the transverse piezoelectric effect (d31).

Figure 17.
Temperature variations in a PZT-based plate sample observed with an infrared camera, driven at: (a) first resonance and (b) second resonance mode.
Figure 17.
Temperature variations in a PZT-based plate sample observed with an infrared camera, driven at: (a) first resonance and (b) second resonance mode.

Figure 18.
Temperature variations in a PZT-based plate specimen observed with a pyroelectric infrared camera, when driven at the antiresoance (a) and resonance frequency (b); (c) numerical temperature profile for the A- and B-type resonance modes.
Figure 18.
Temperature variations in a PZT-based plate specimen observed with a pyroelectric infrared camera, when driven at the antiresoance (a) and resonance frequency (b); (c) numerical temperature profile for the A- and B-type resonance modes.

Figure 19.
Heat generation modeling in proportion to strain square.

Figure 20.
(a) Temperature distribution profile change with time after driving; (b) the saturated temperature distribution profile for k31 specimen with mm3.
Figure 20.
(a) Temperature distribution profile change with time after driving; (b) the saturated temperature distribution profile for k31 specimen with mm3.

Figure 21.
Change in Qm with frequency (fr ≈ 20.006 kHz) [7].
Figure 21.
Change in Qm with frequency (fr ≈ 20.006 kHz) [7].


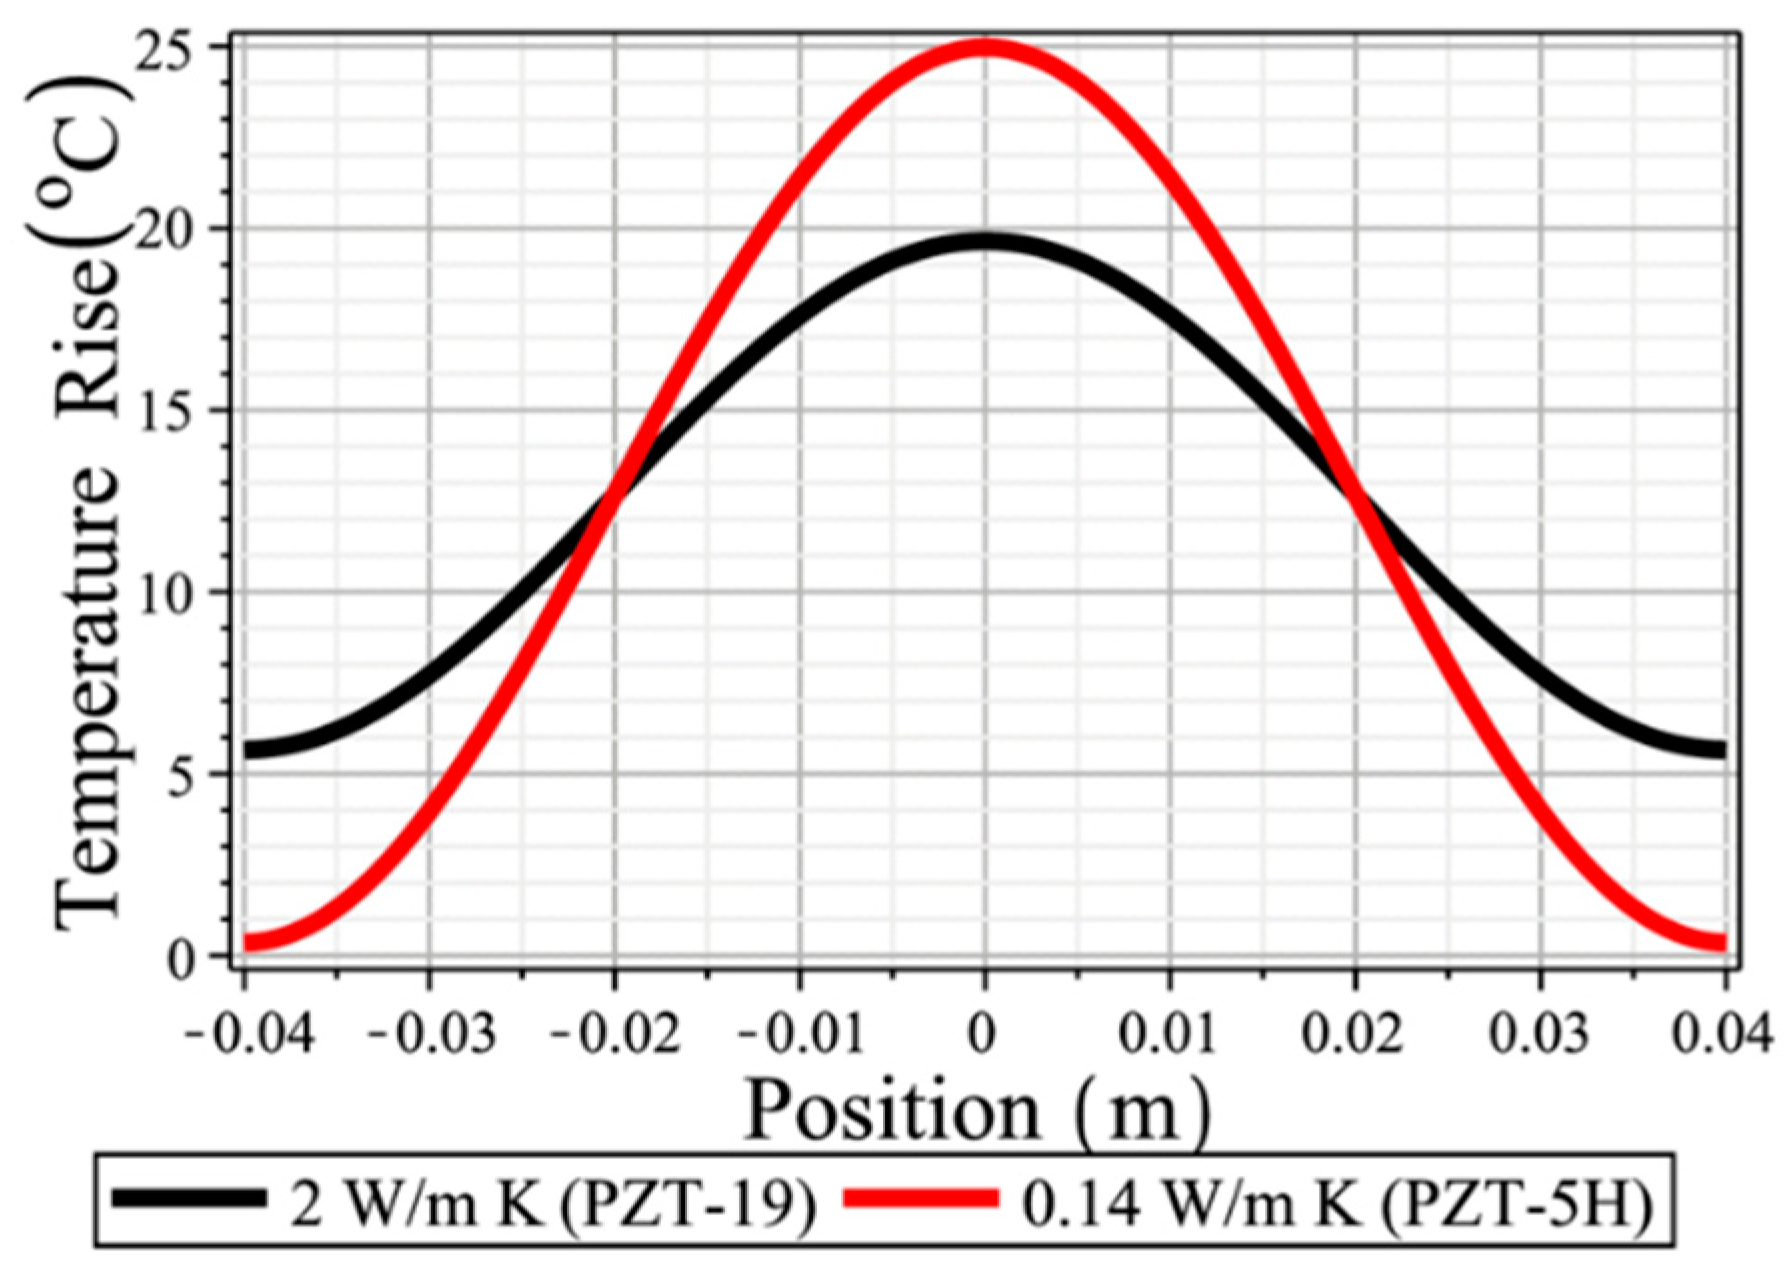
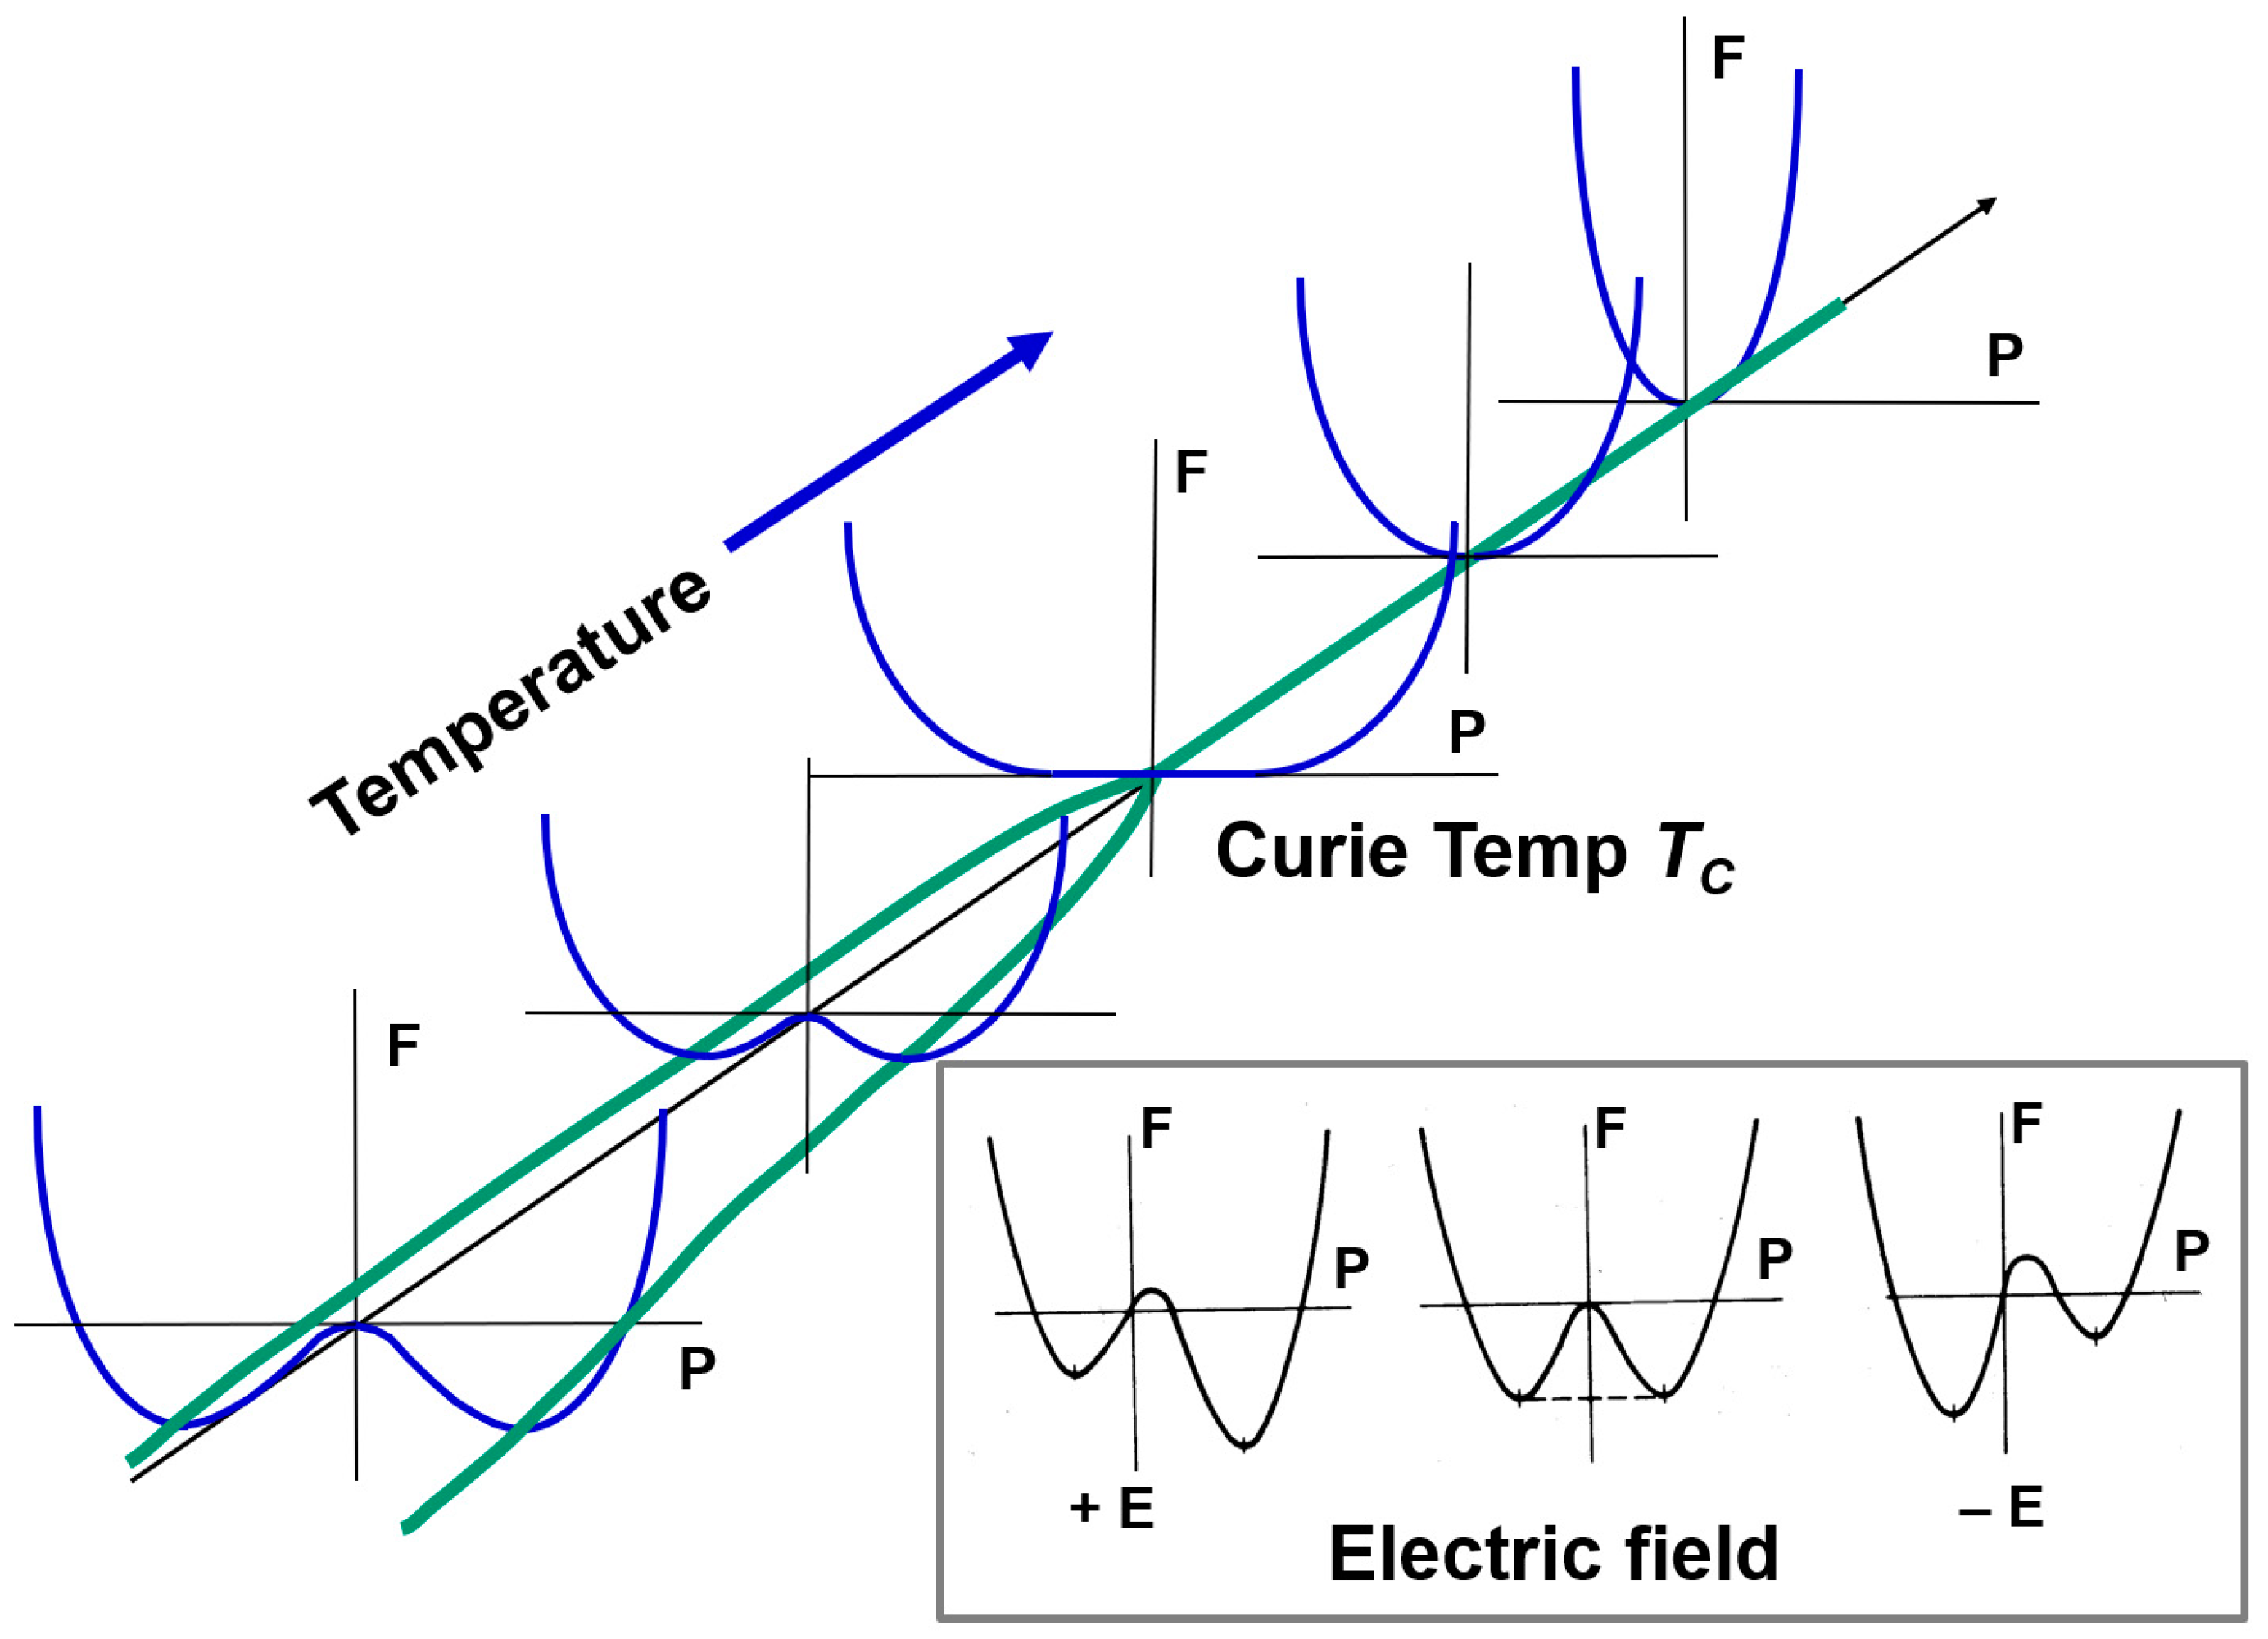
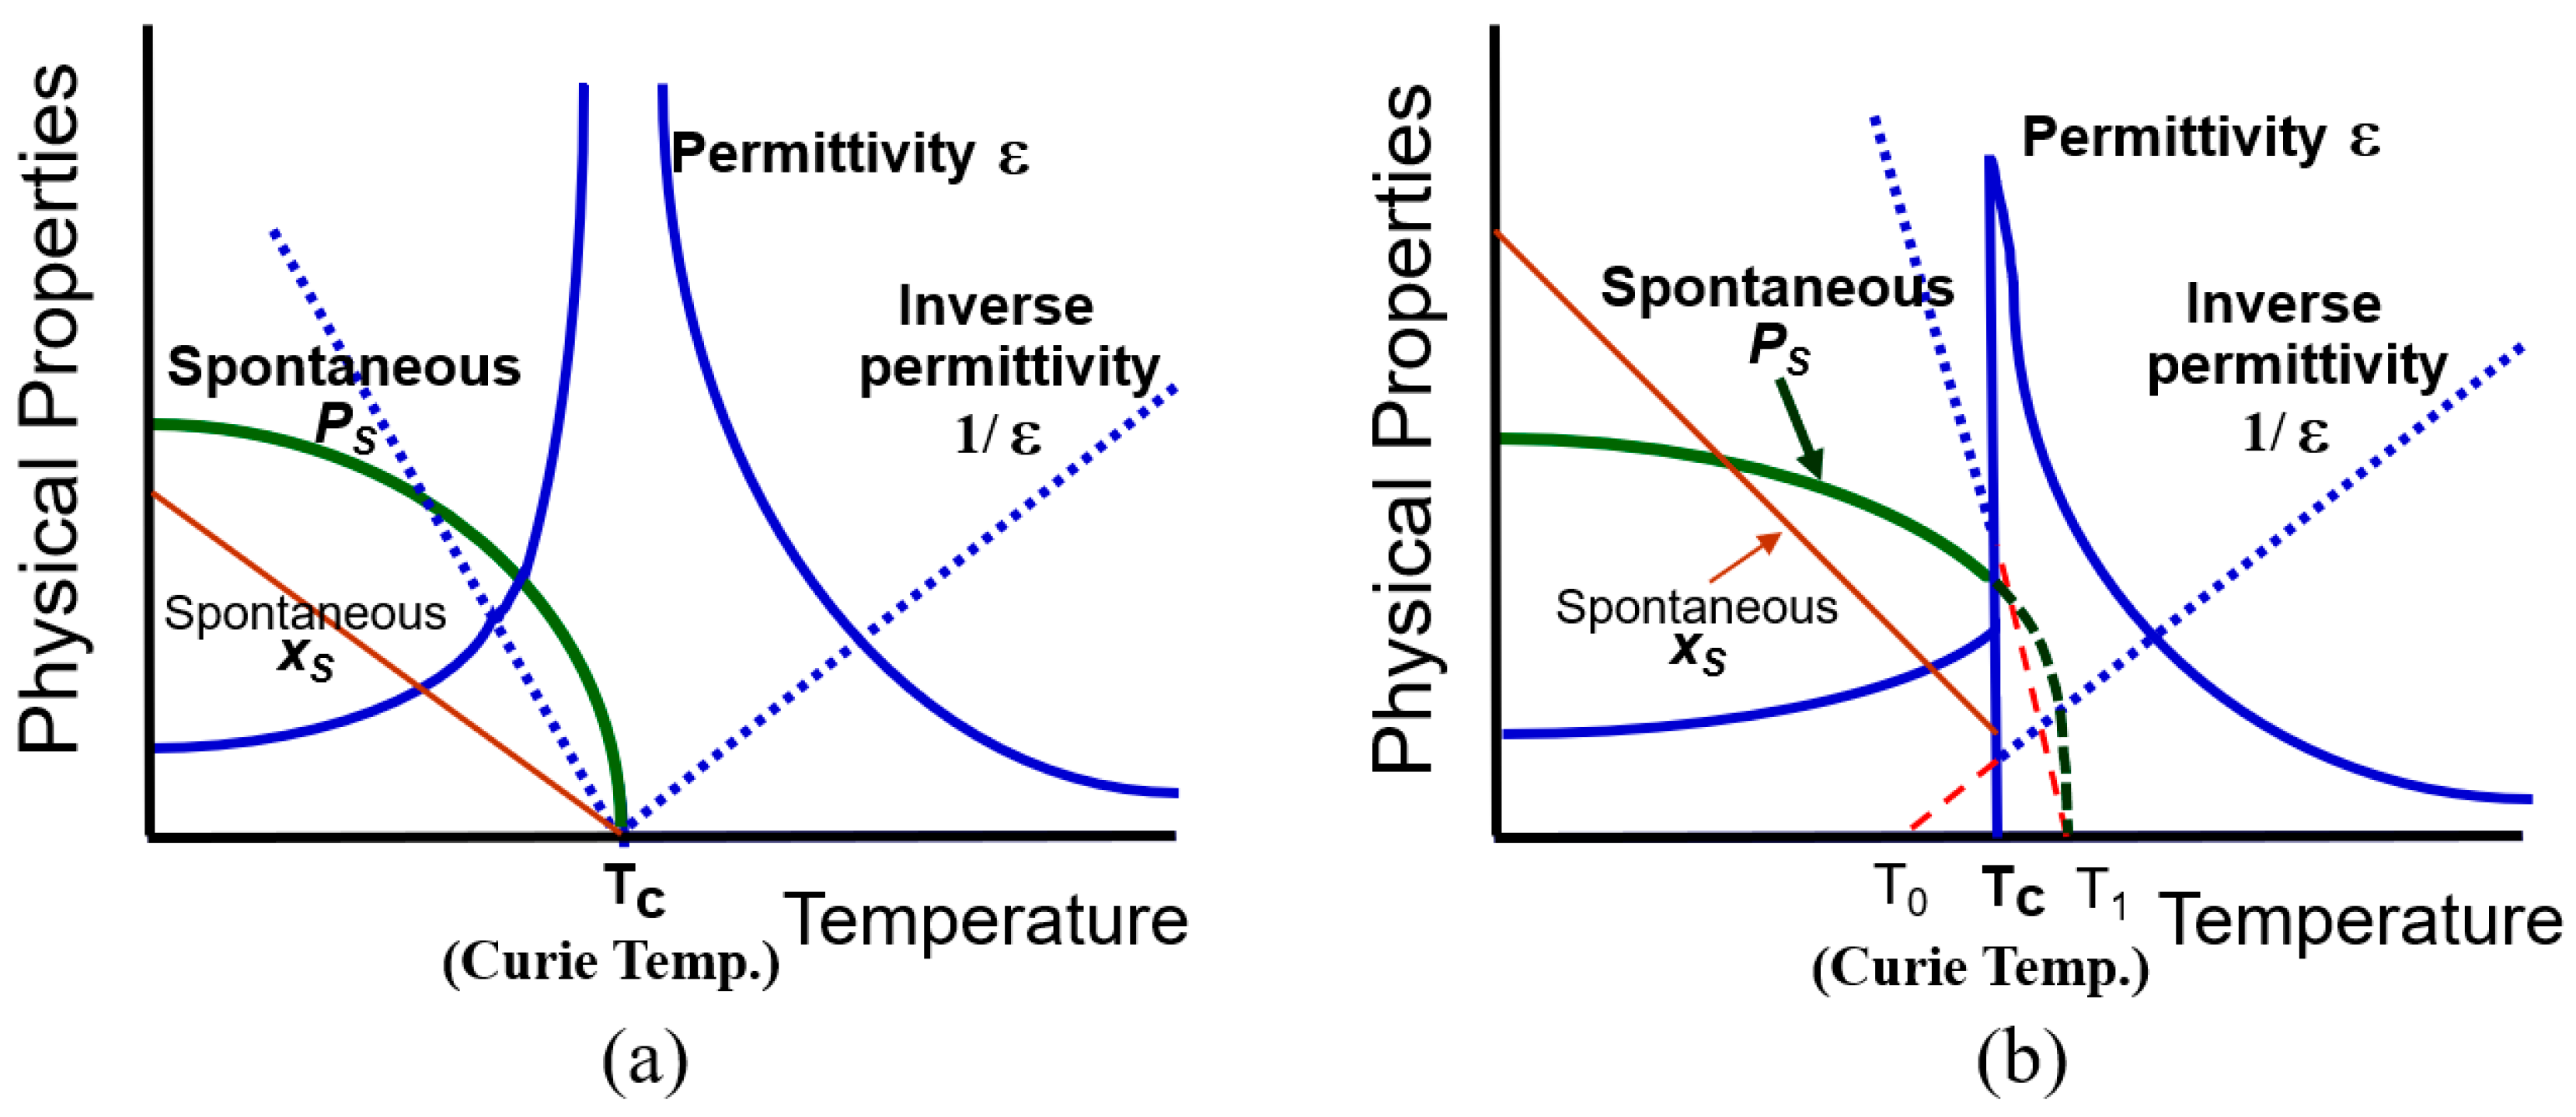
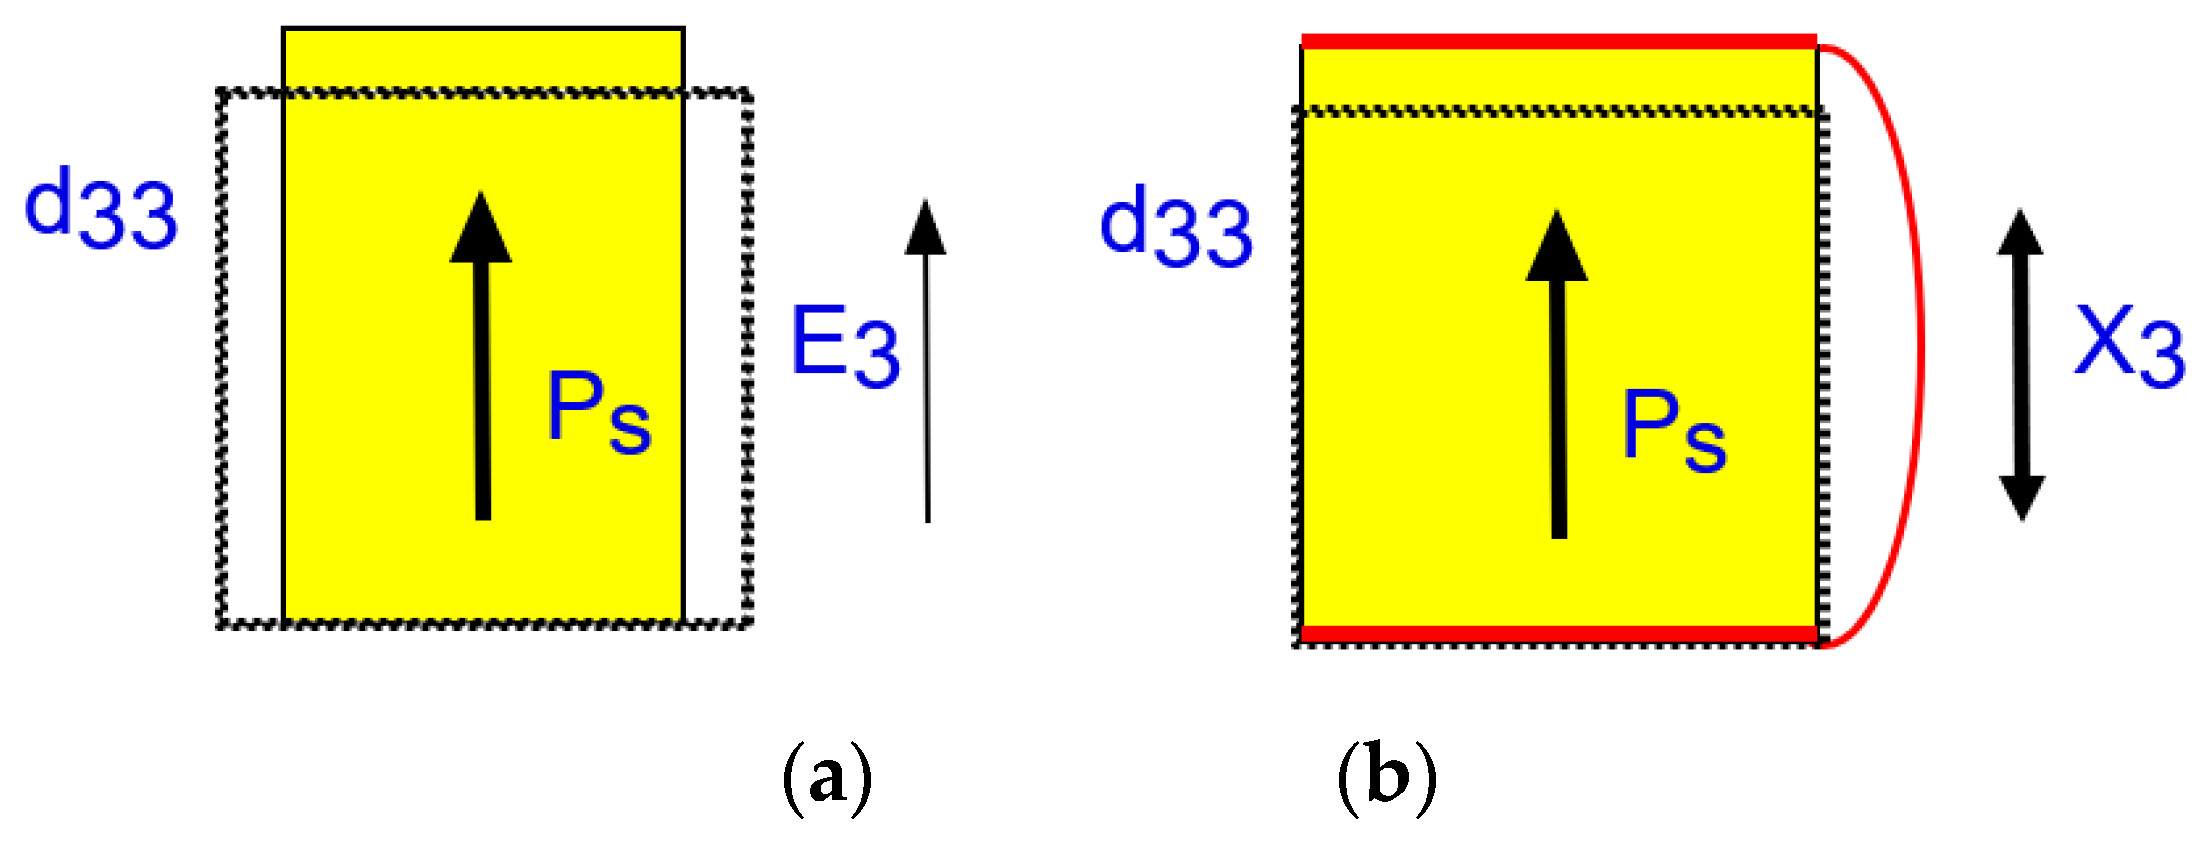
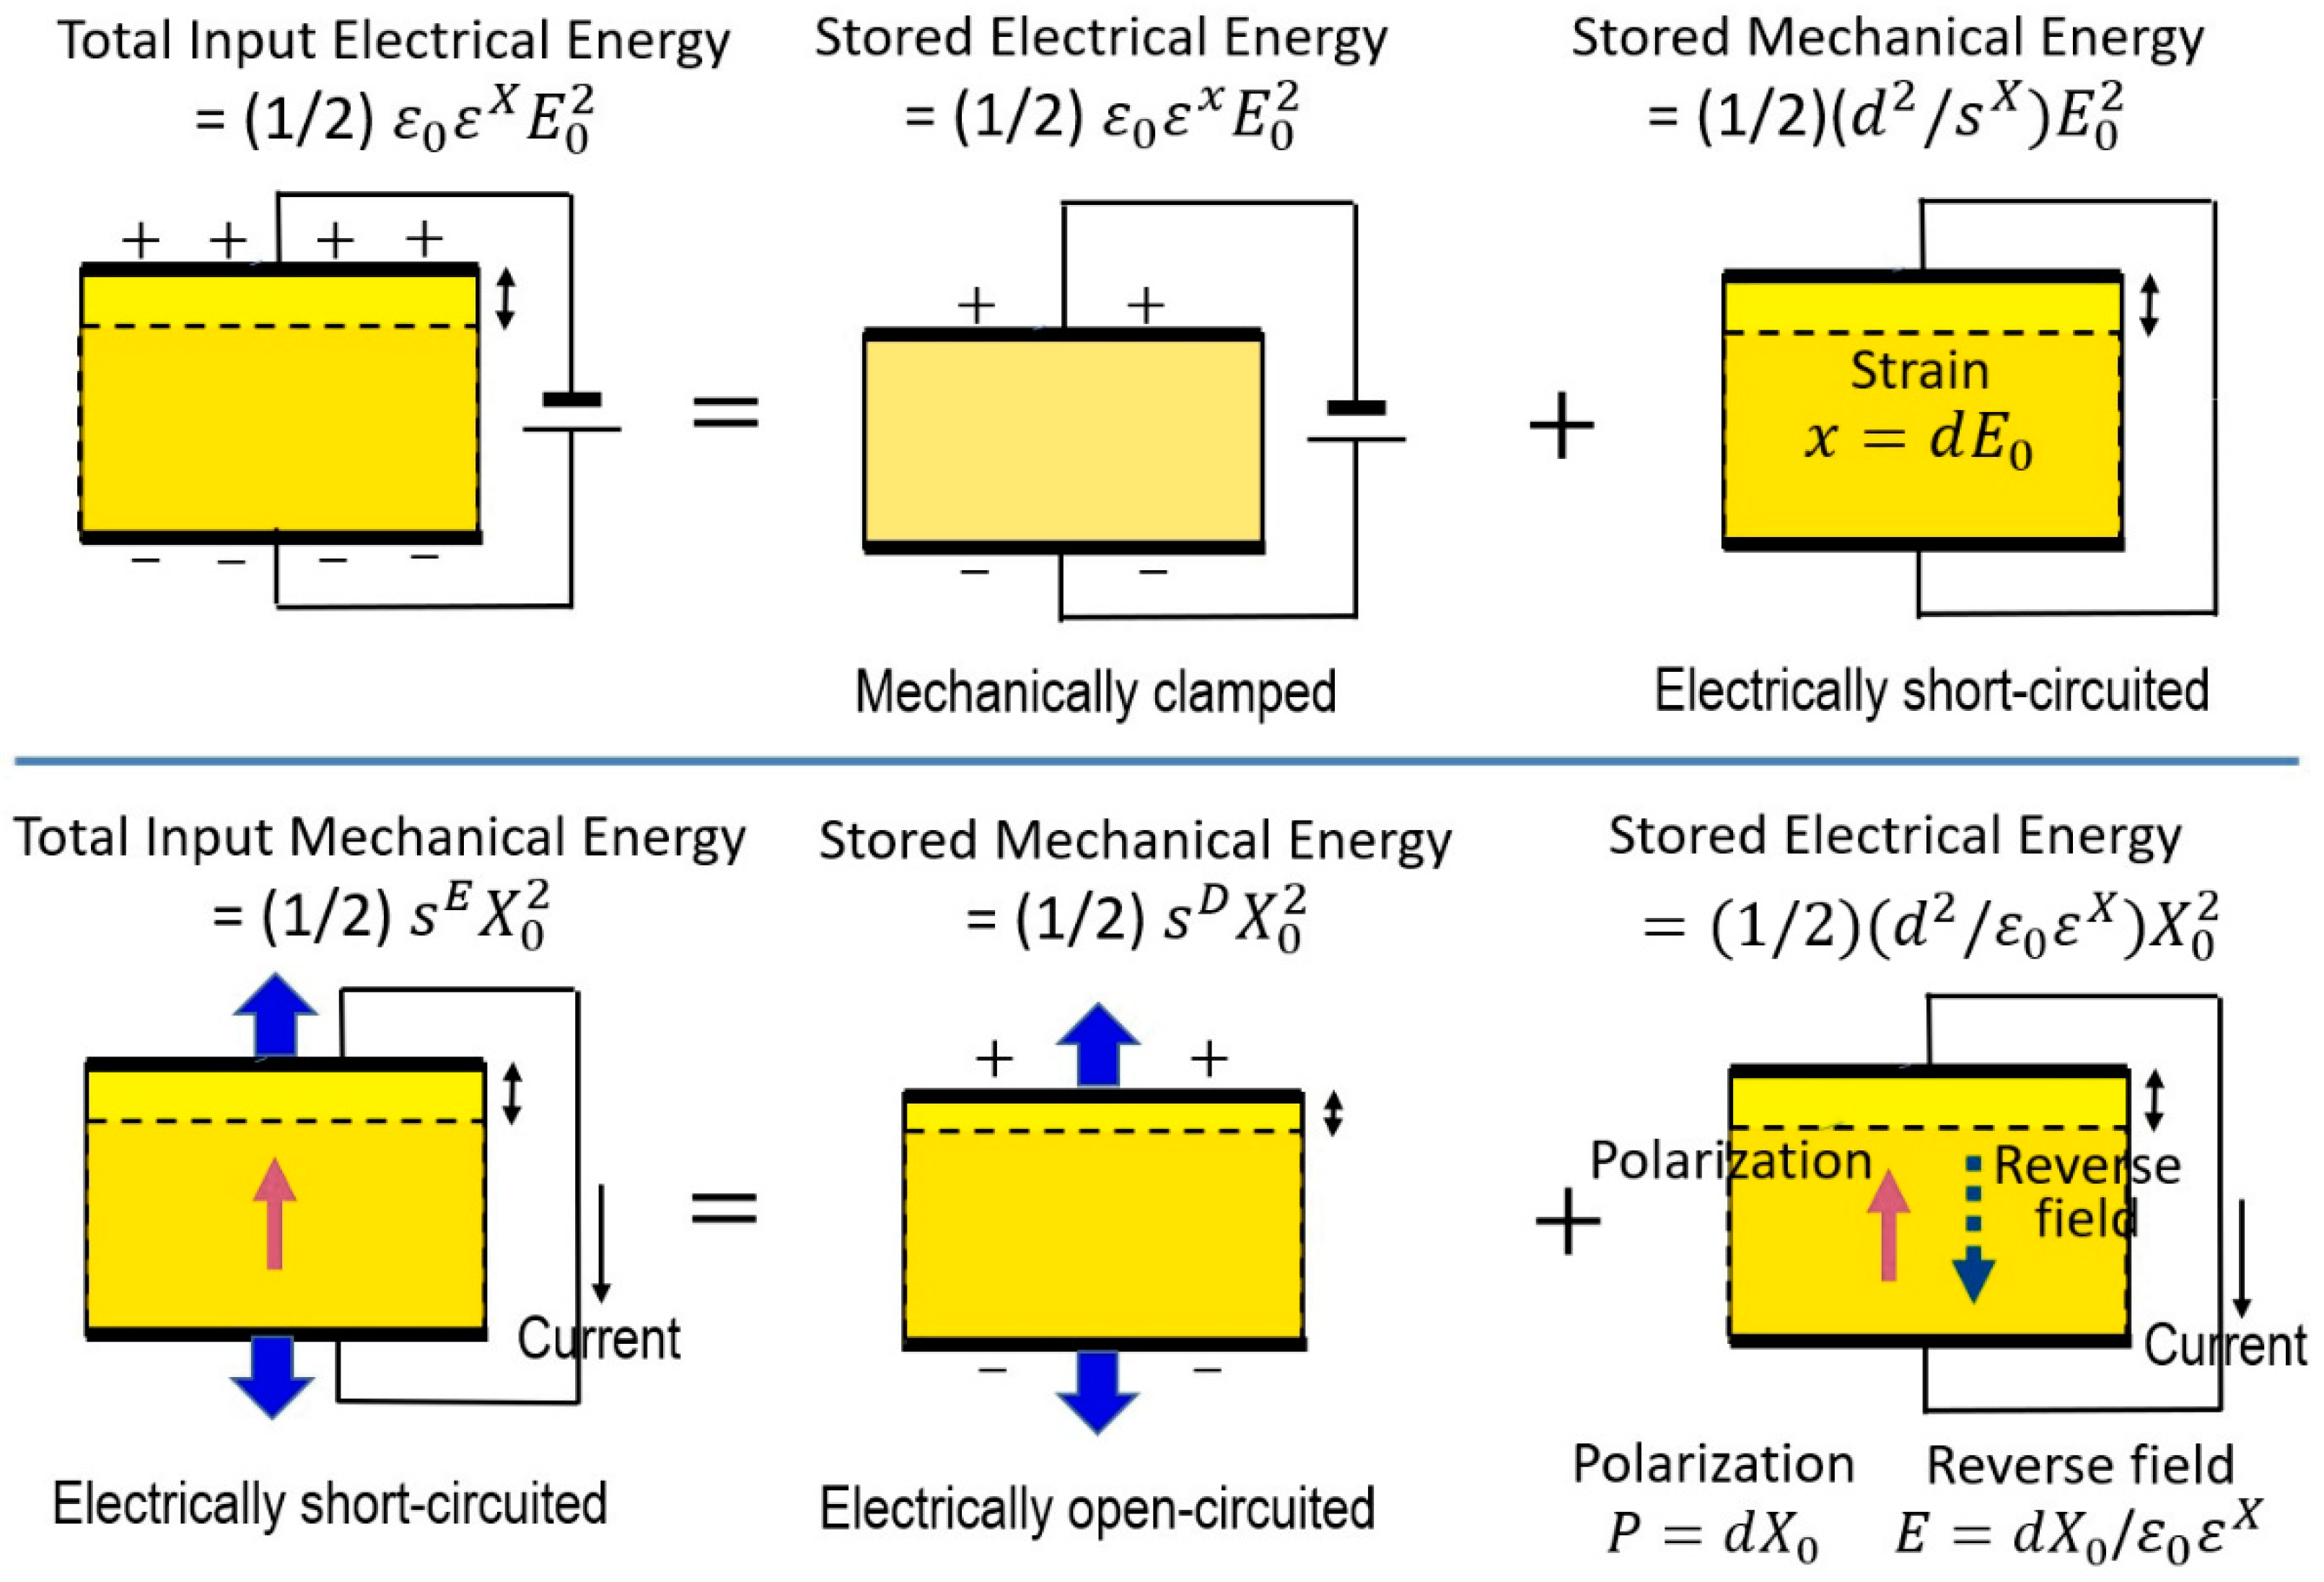
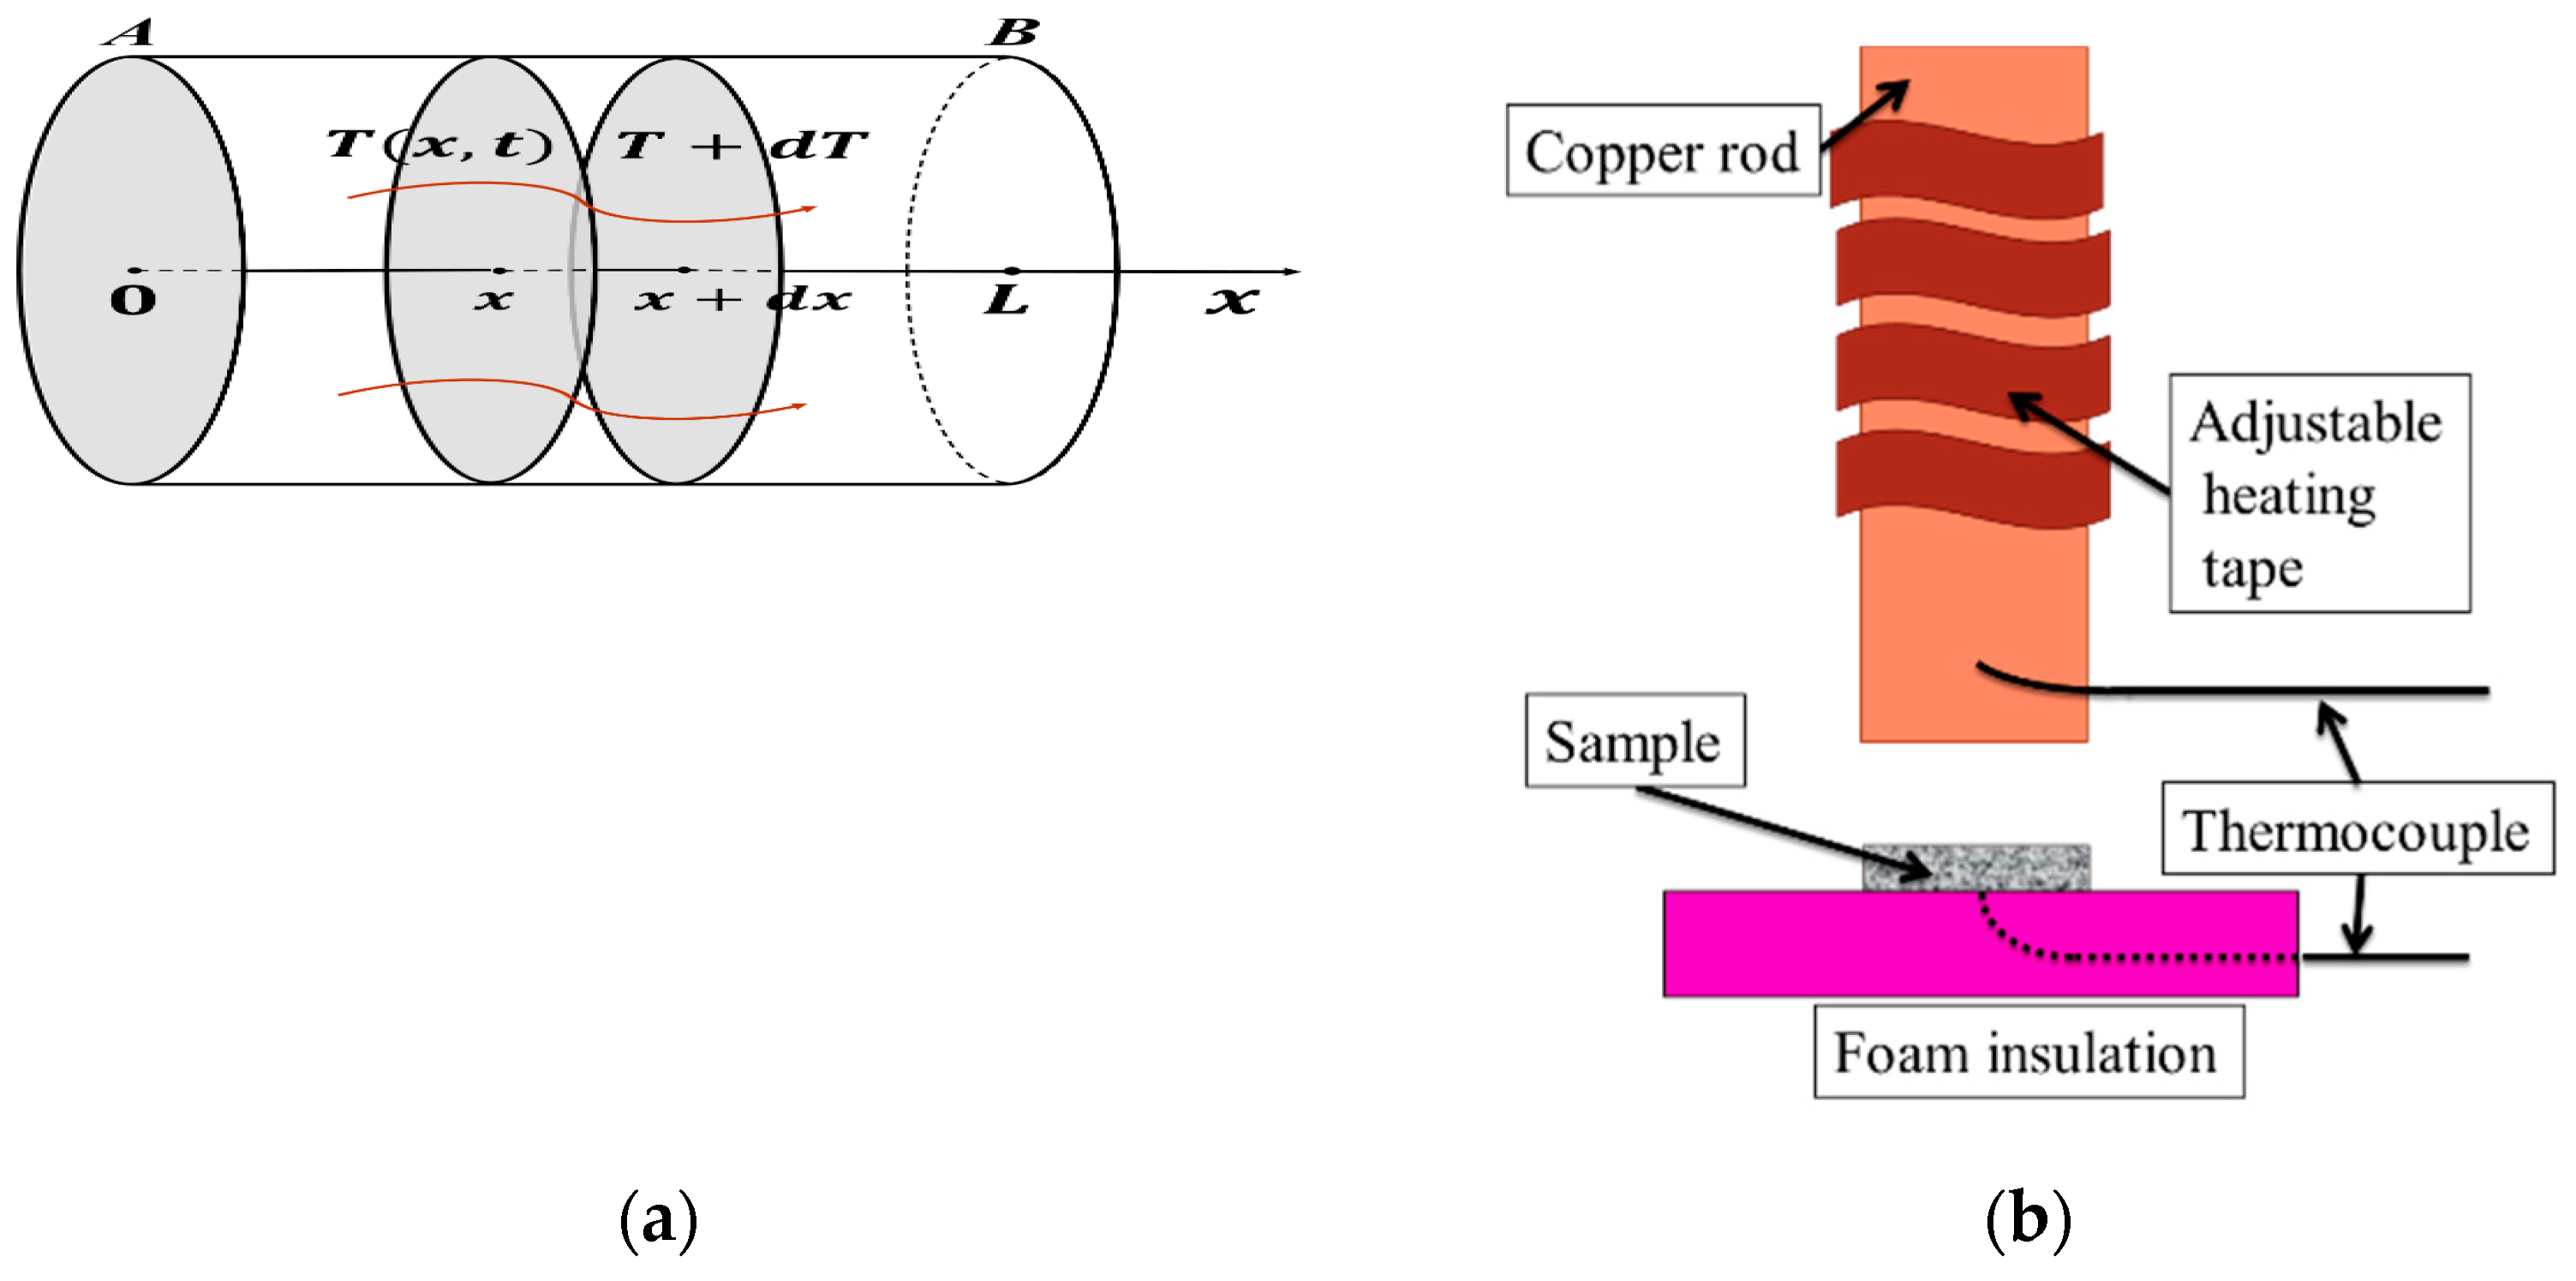
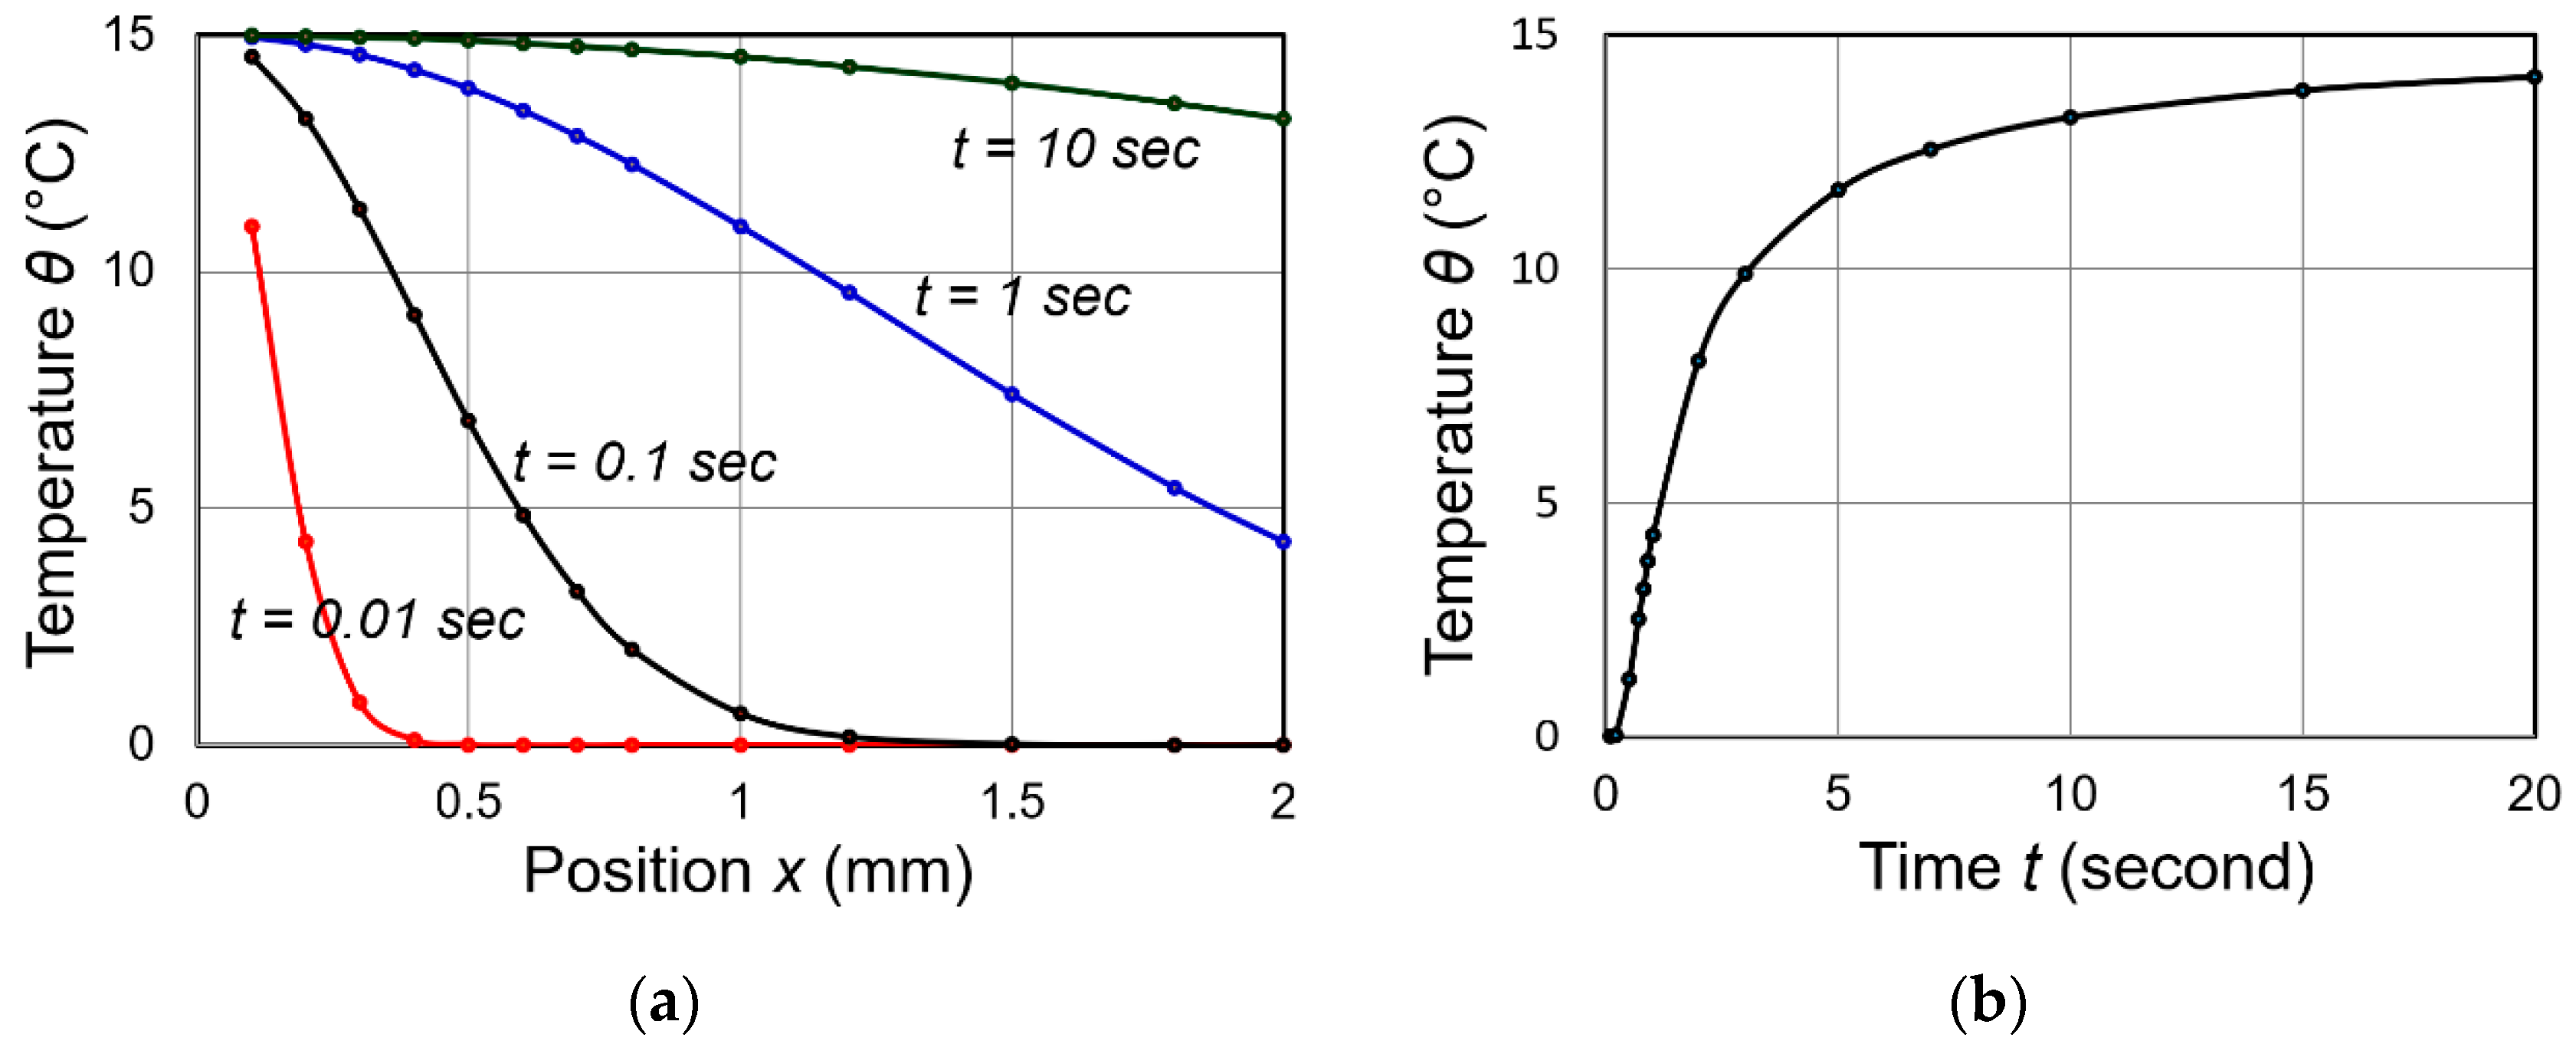
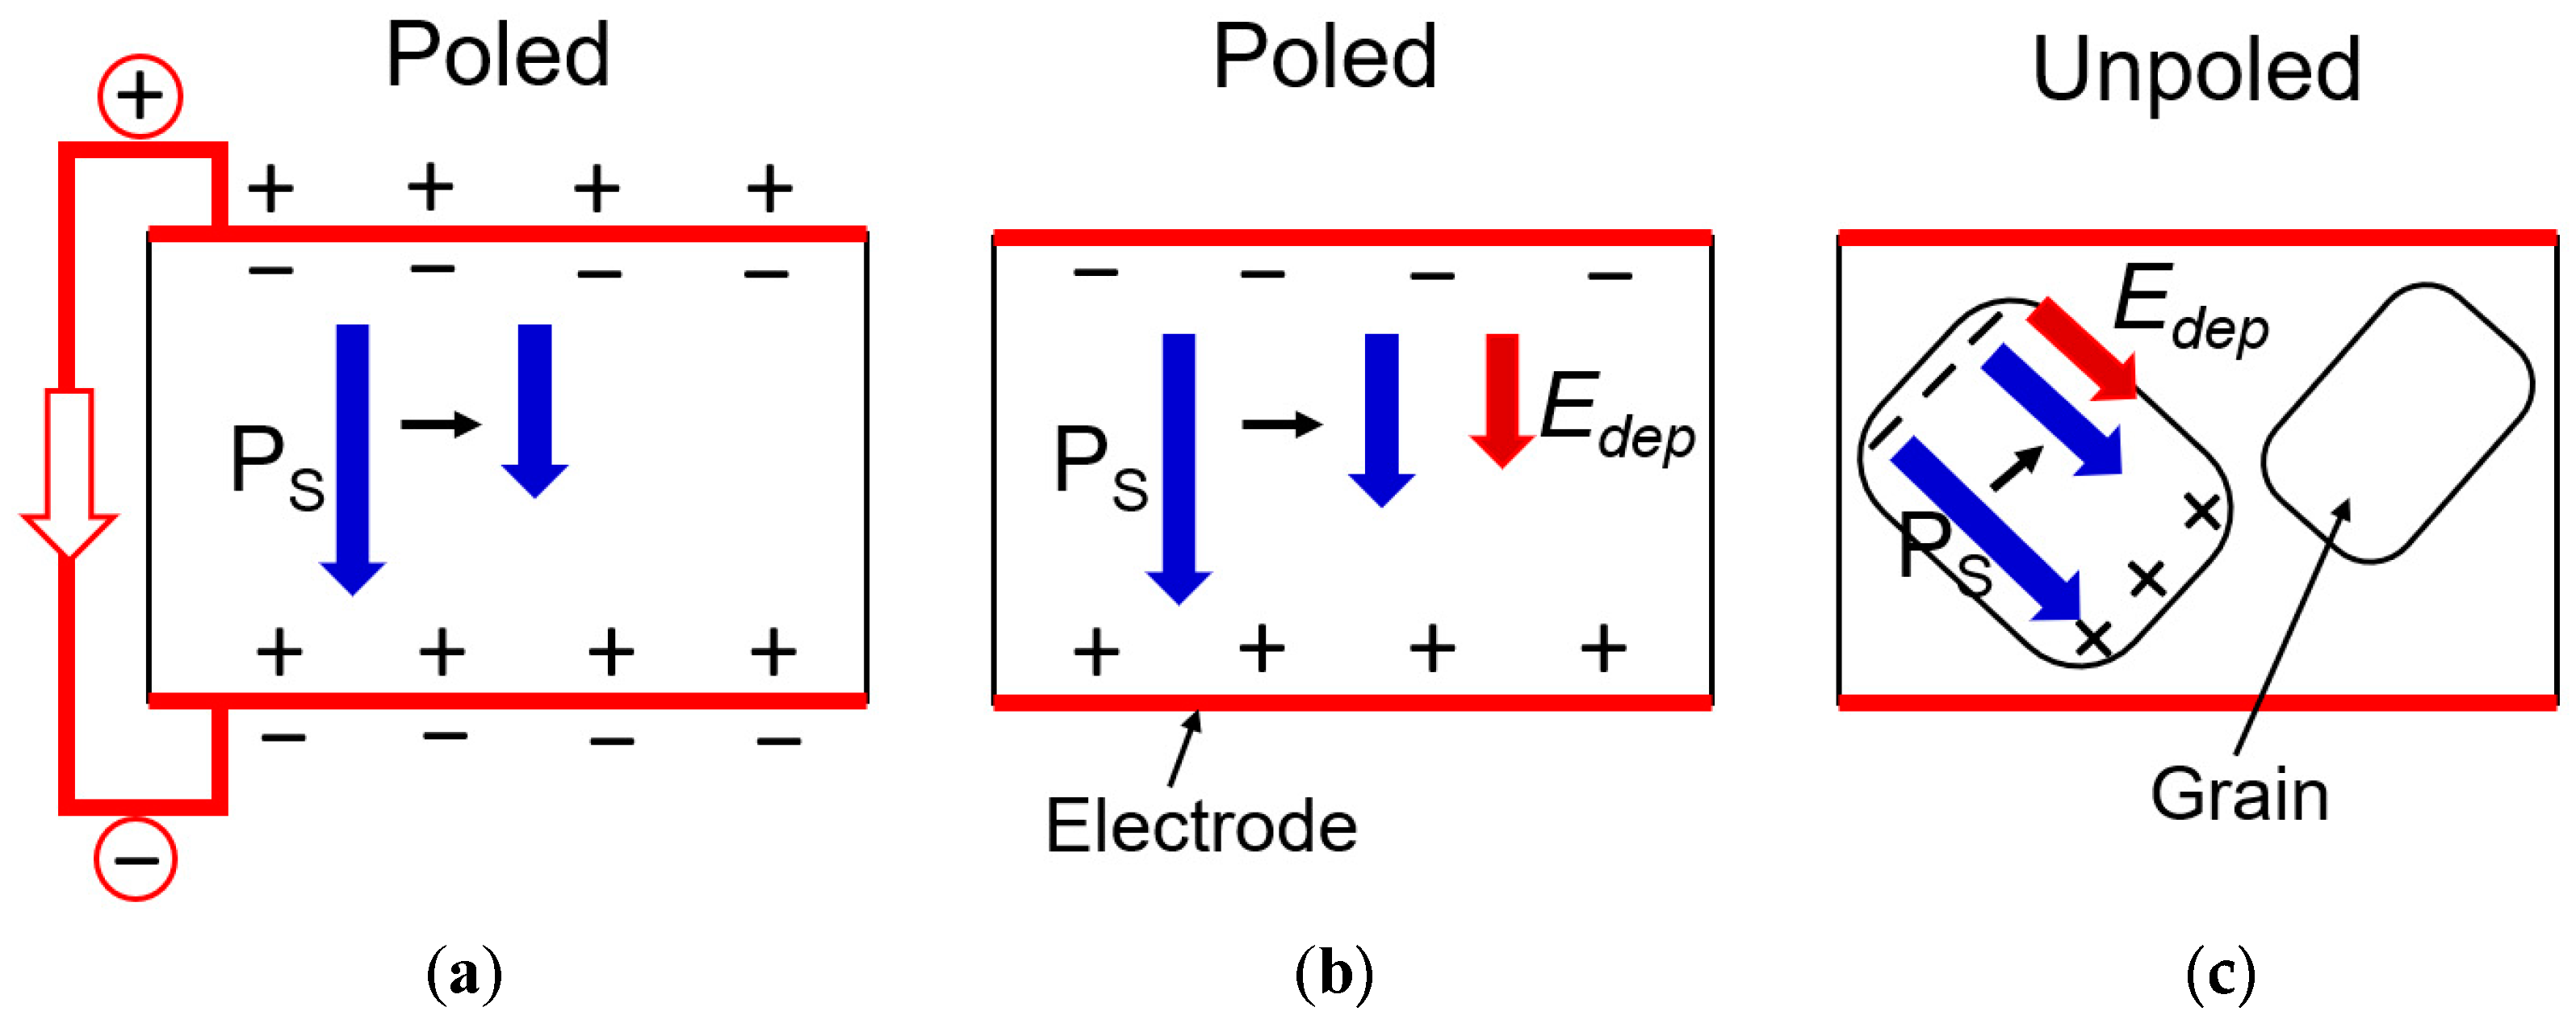
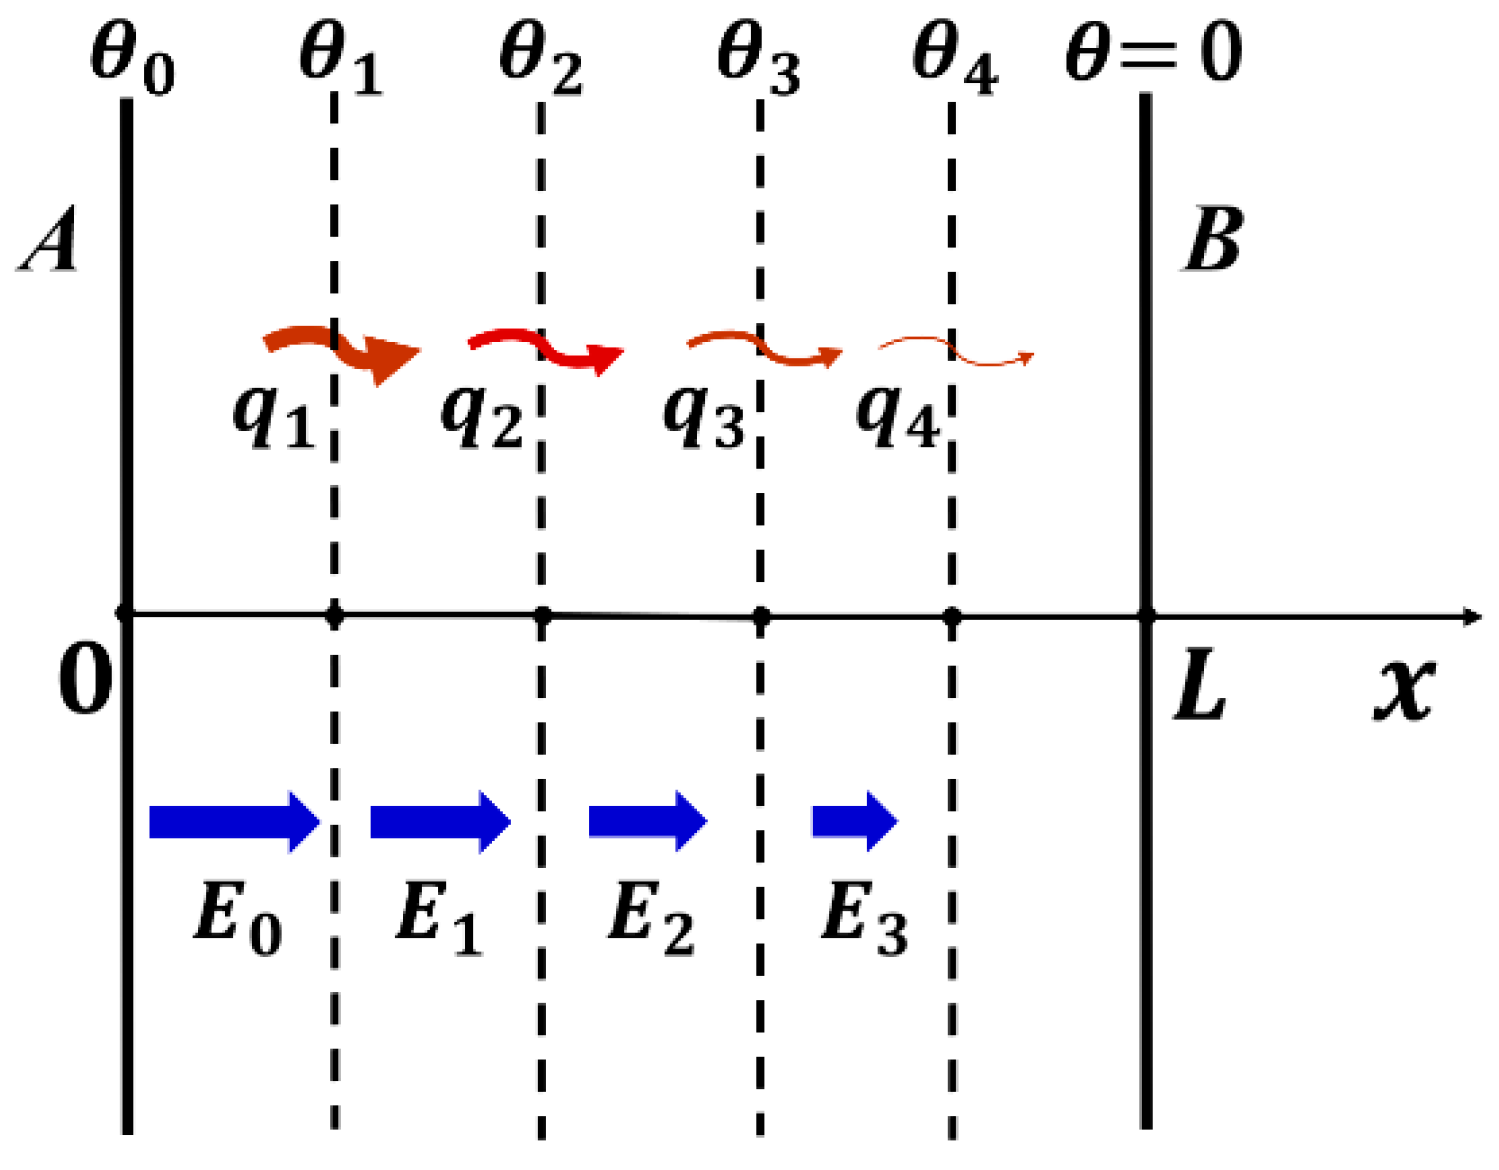
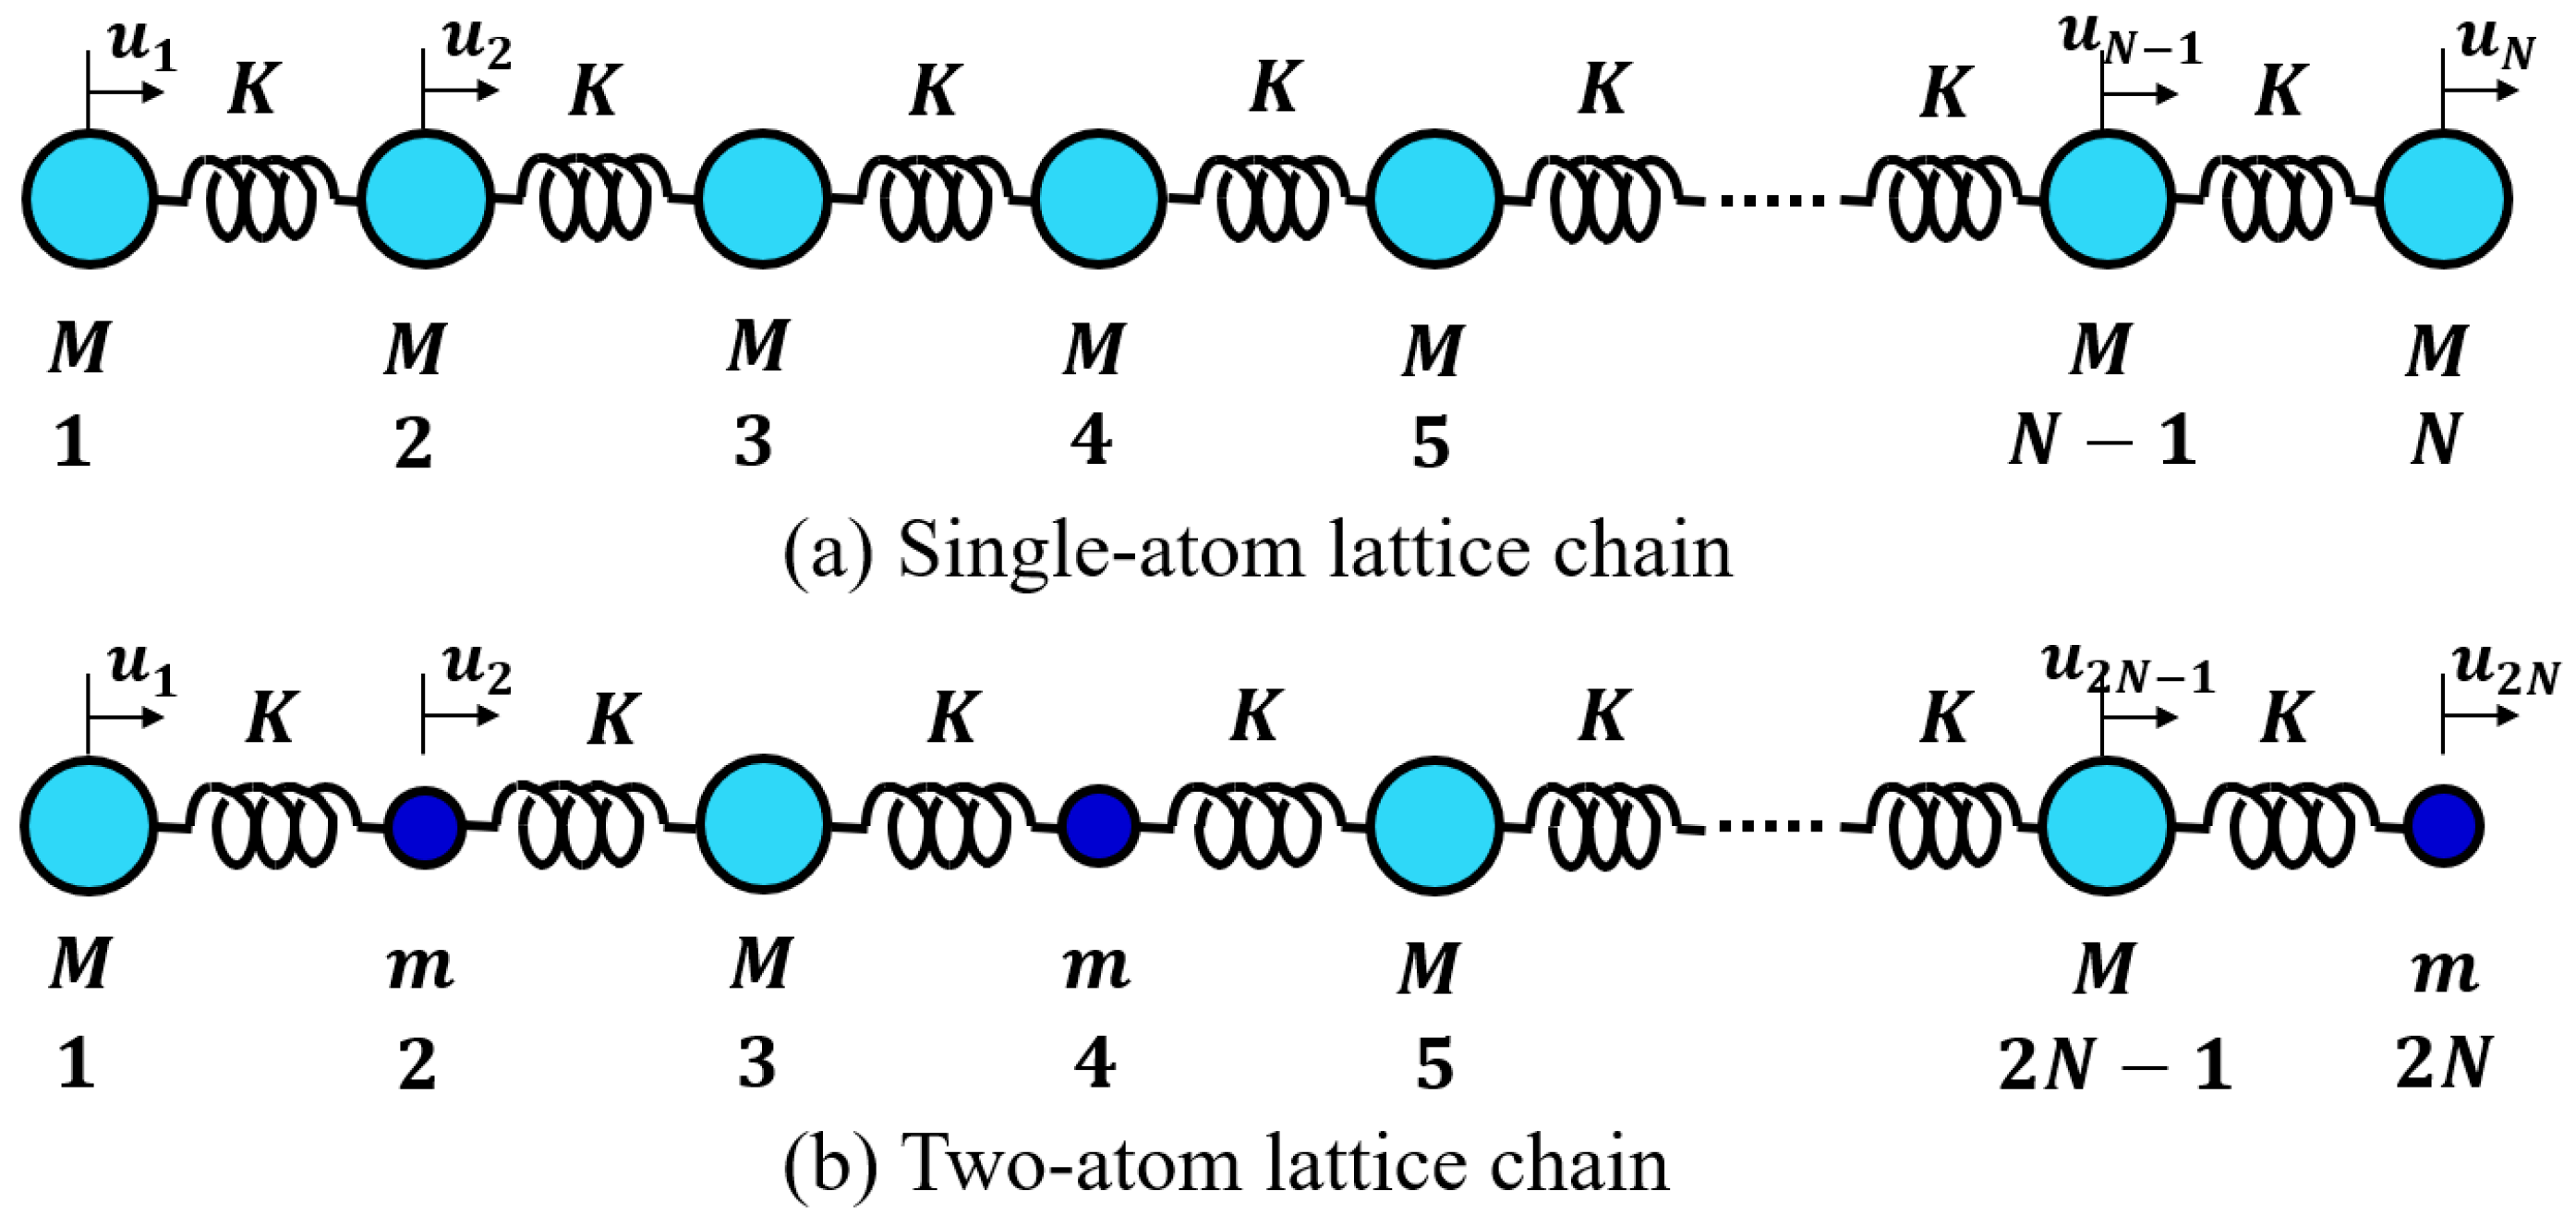
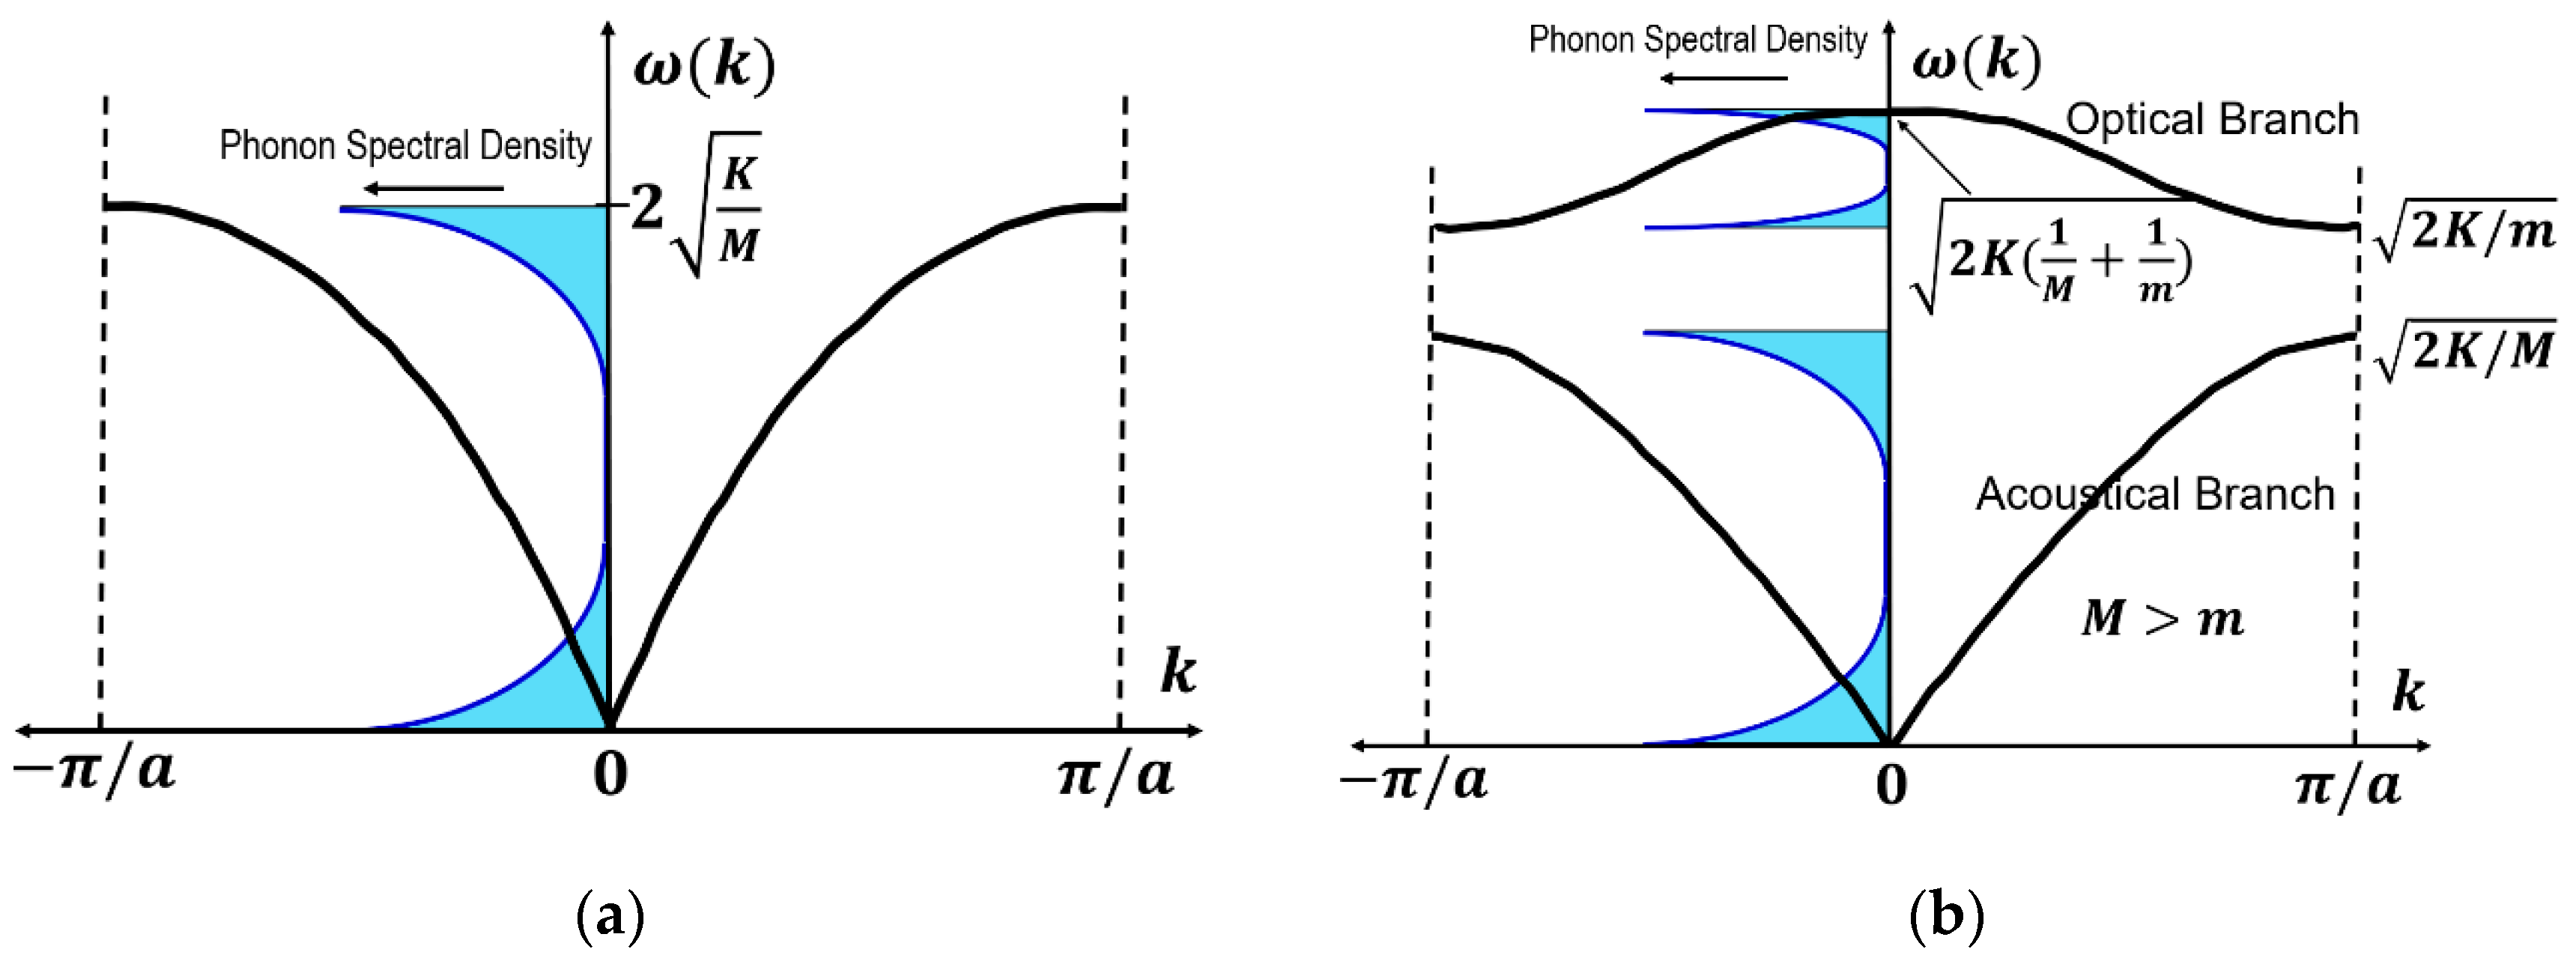
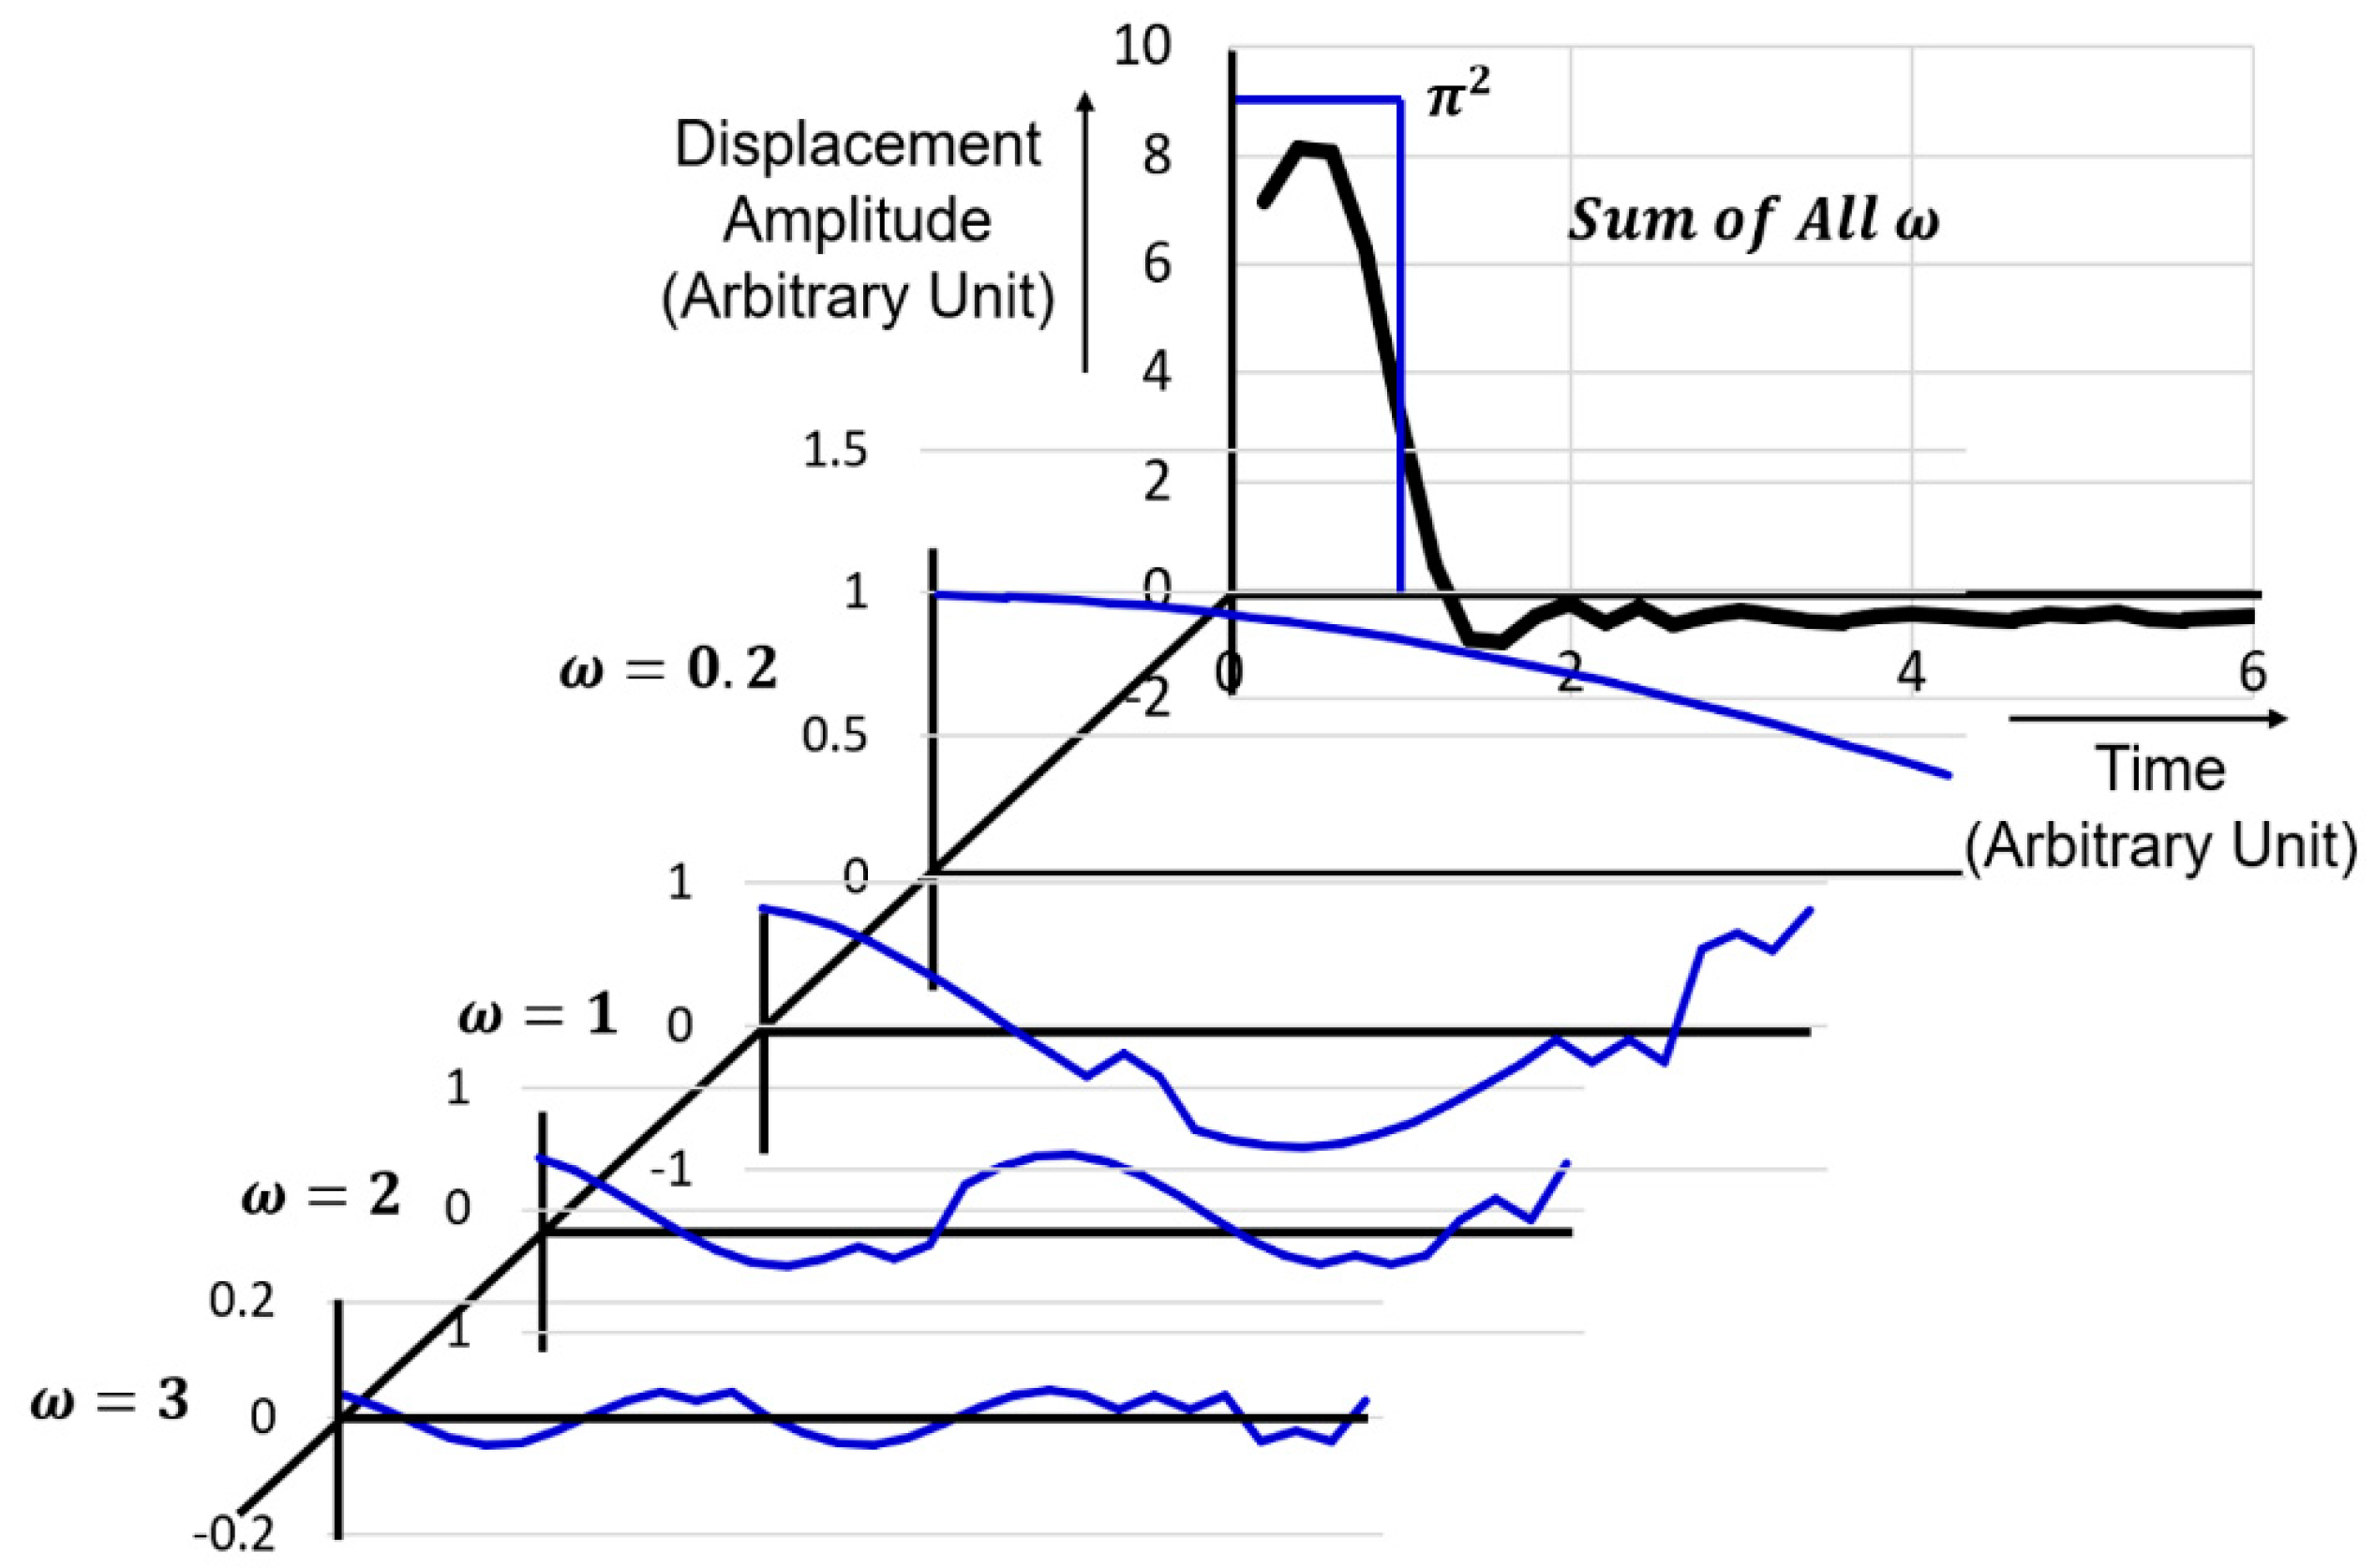
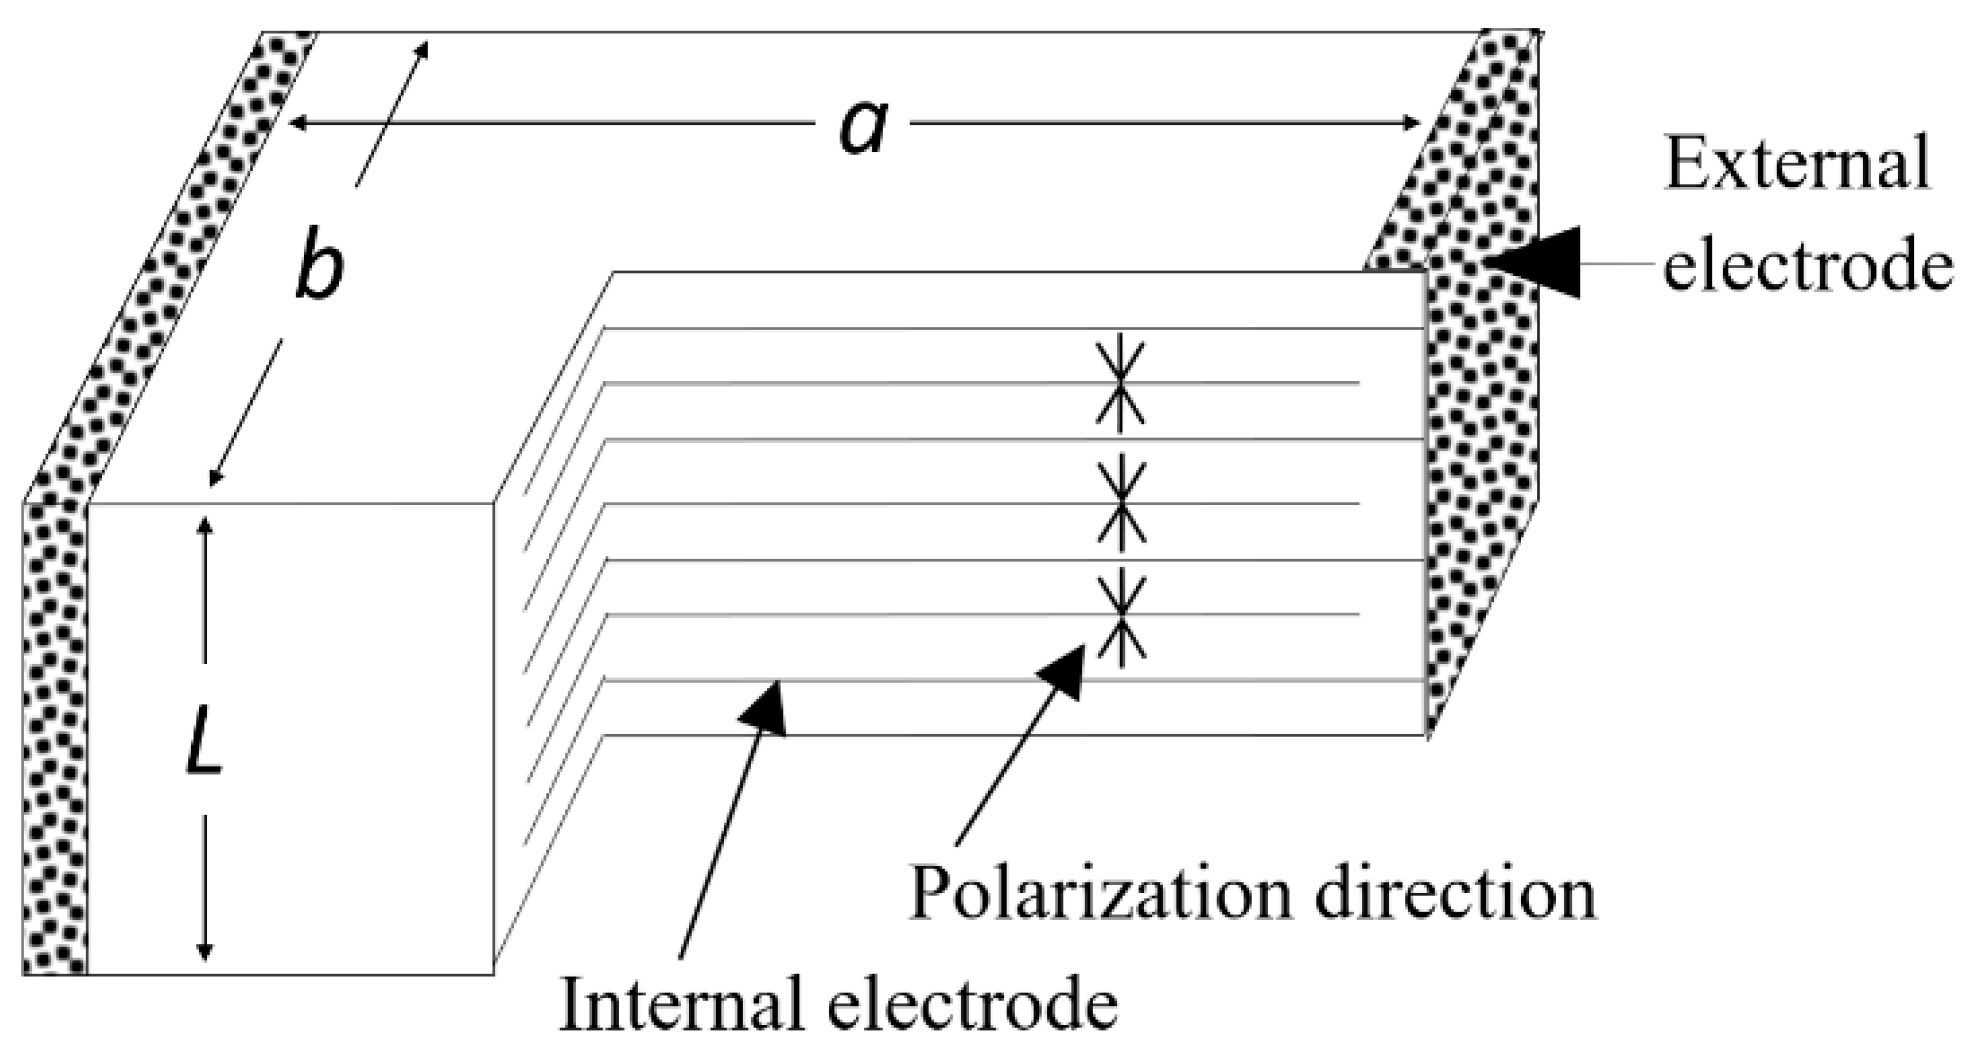
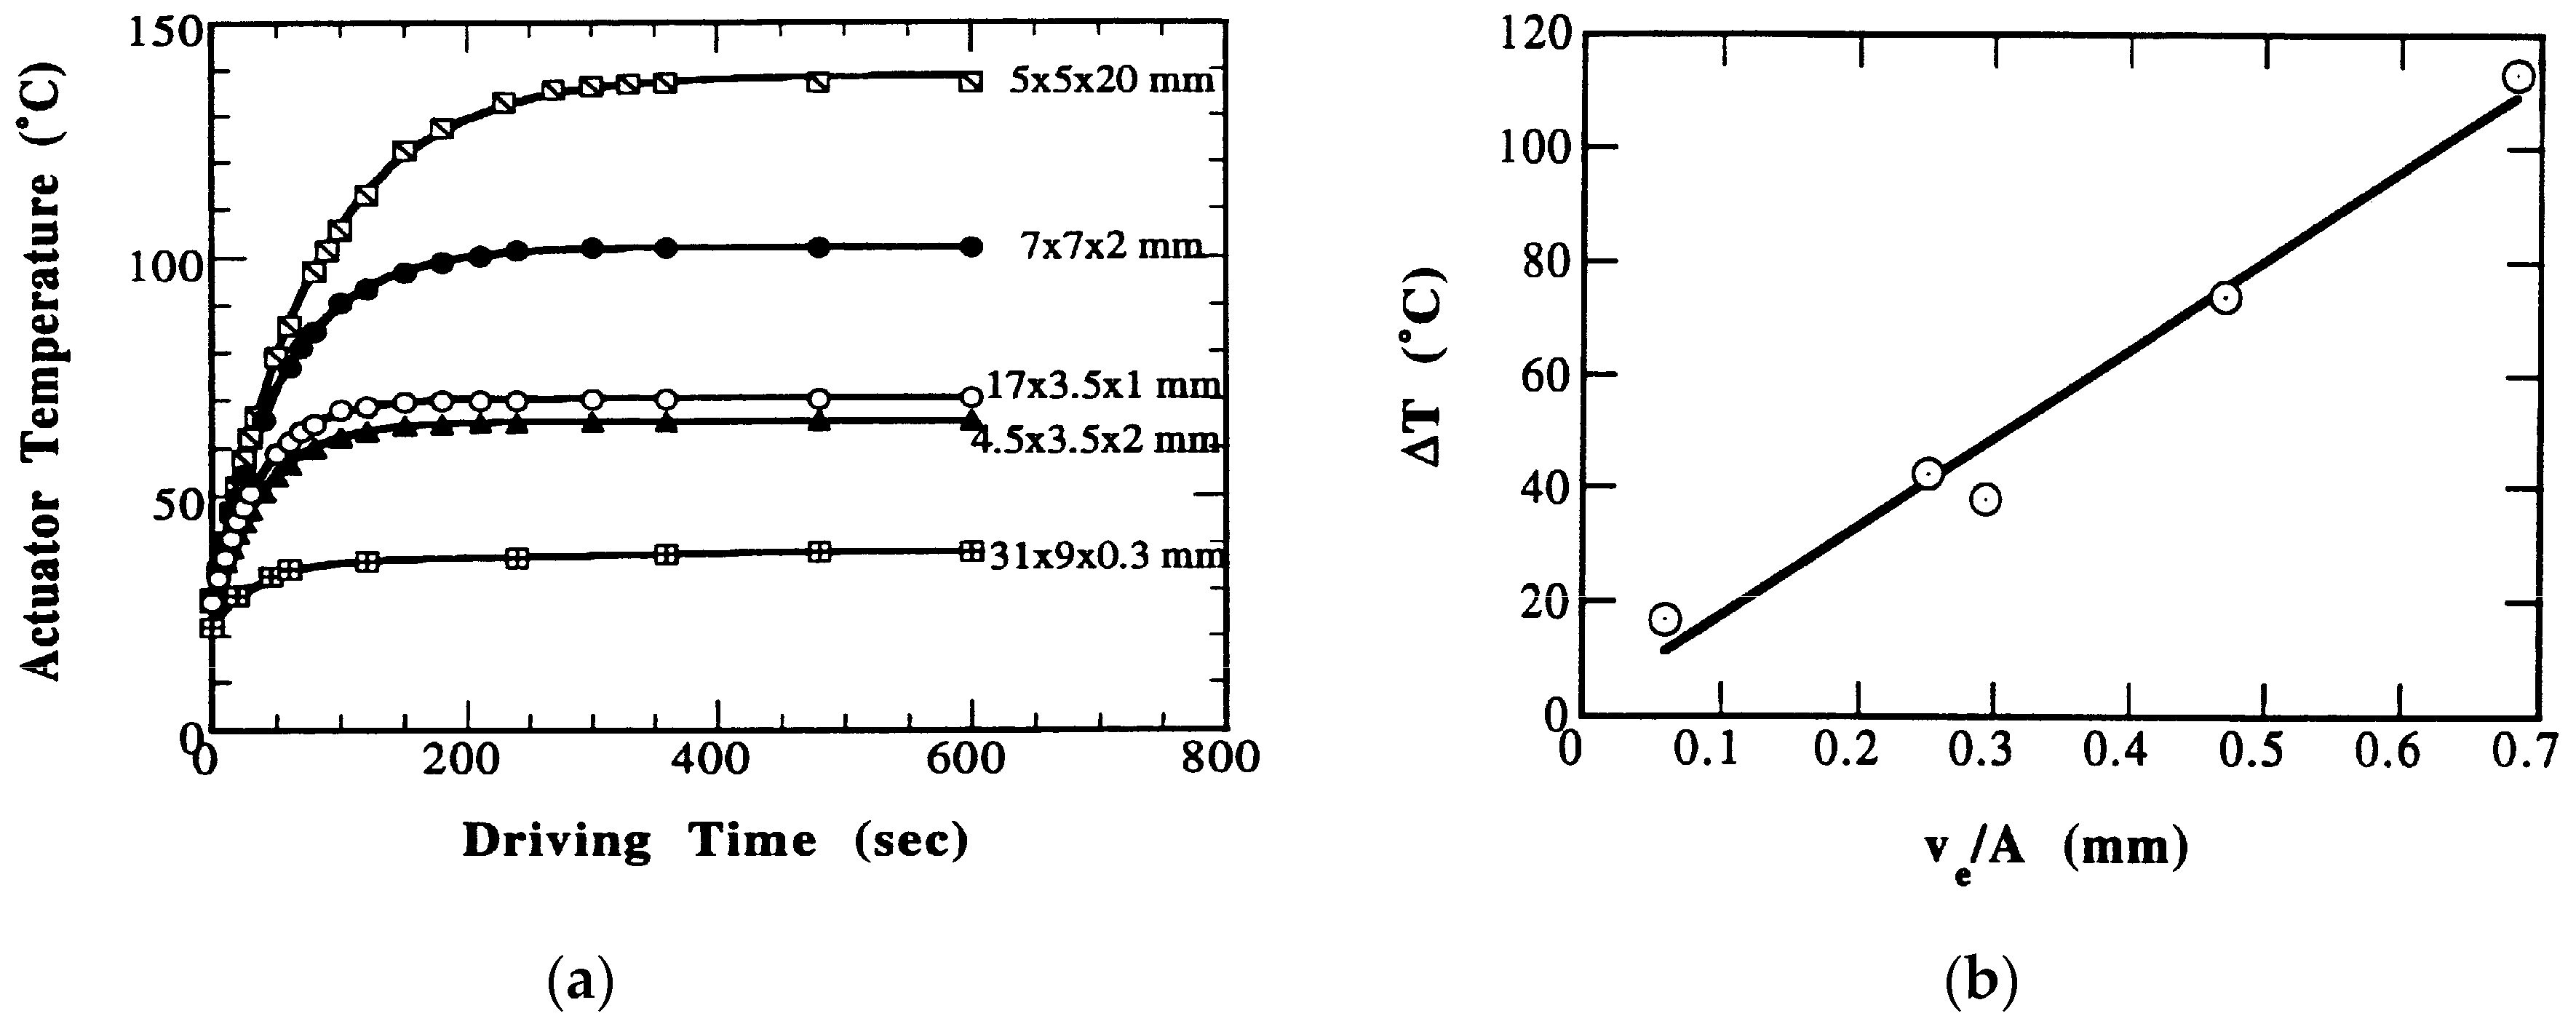
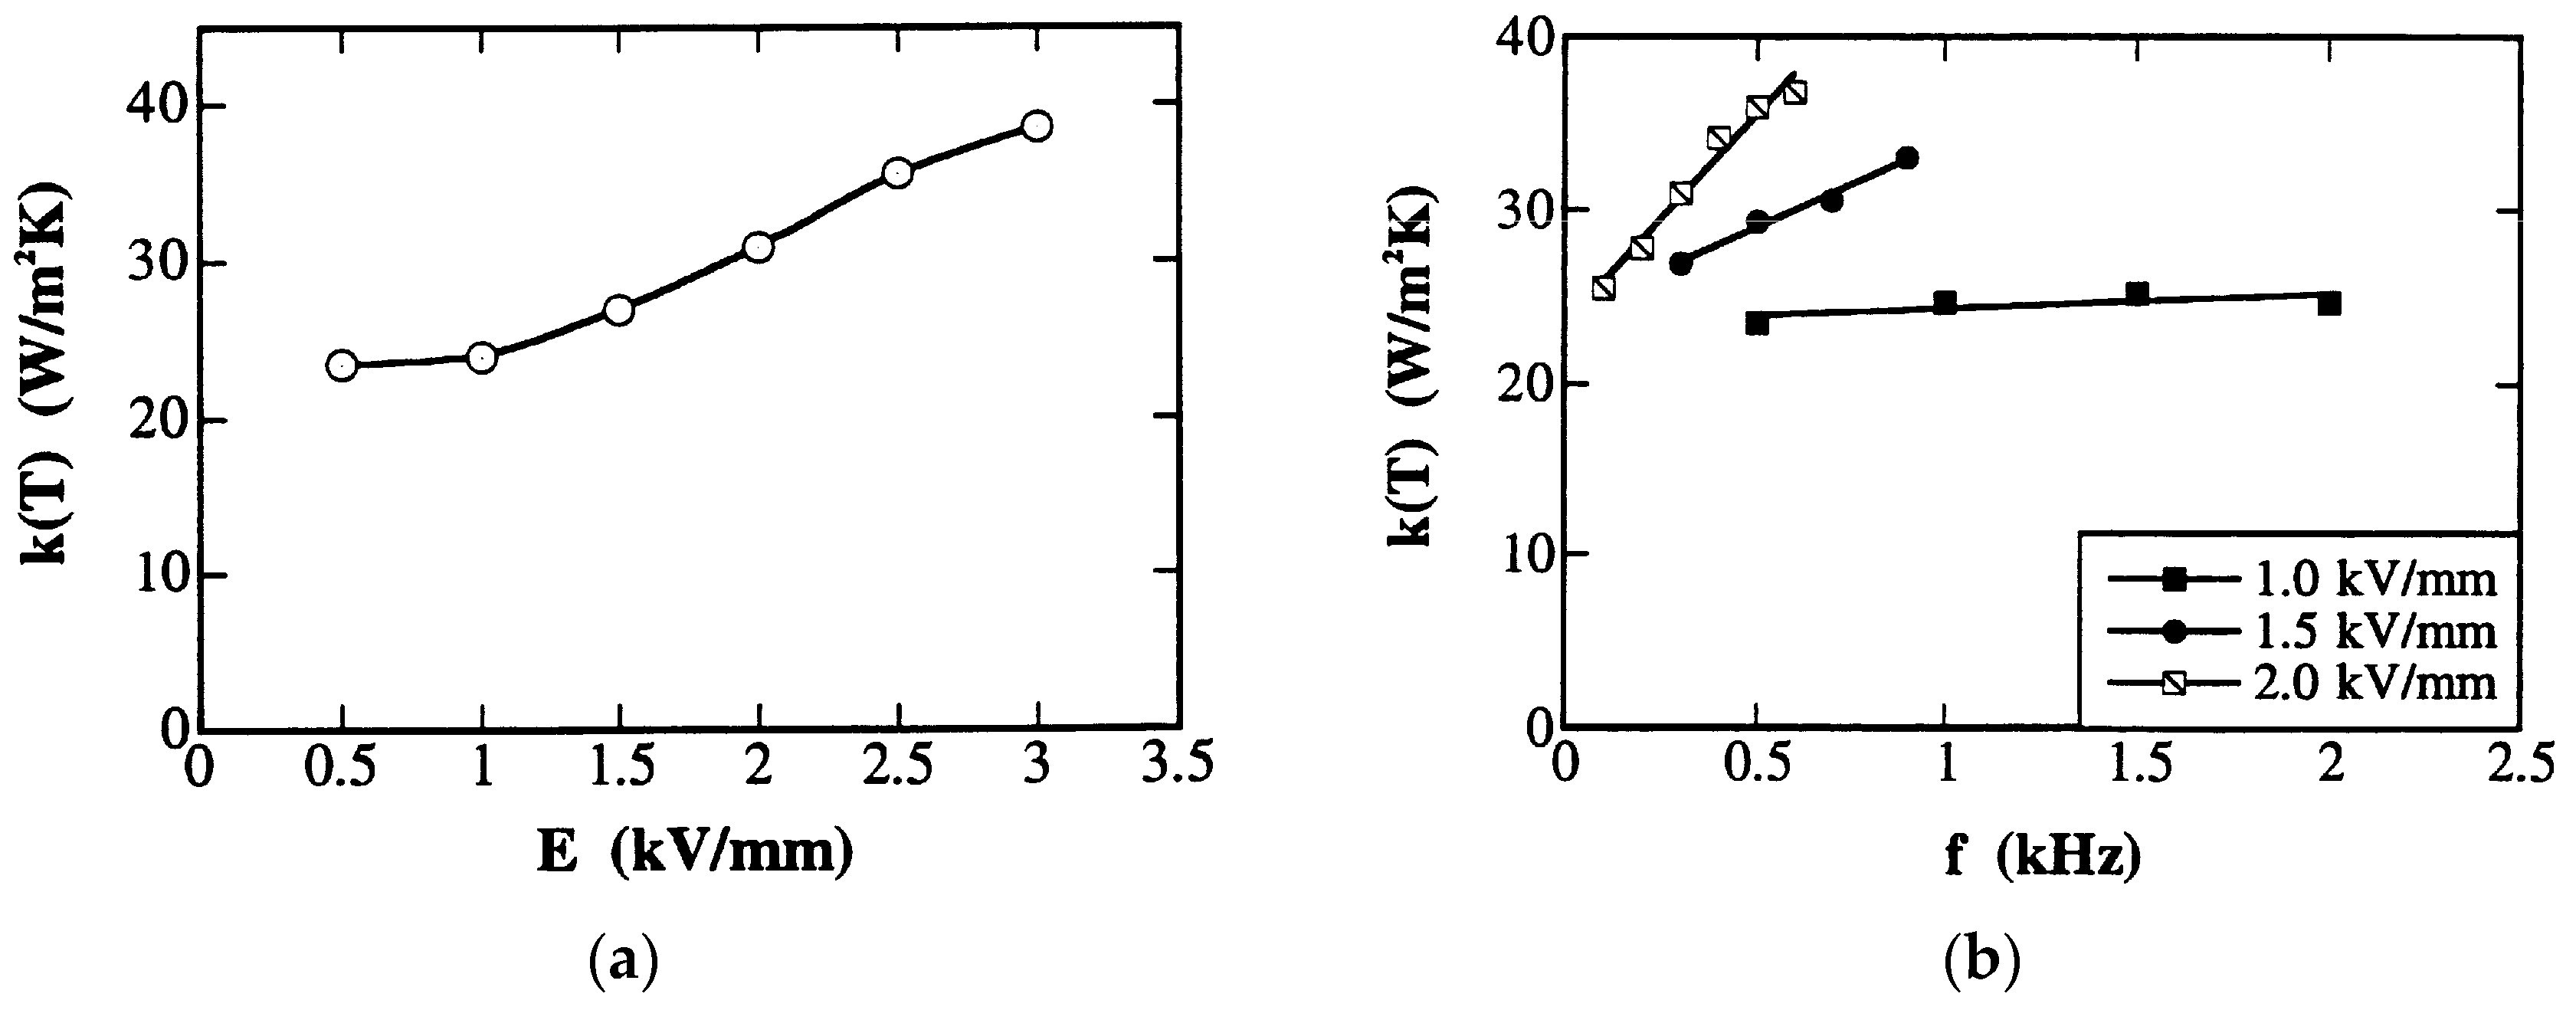
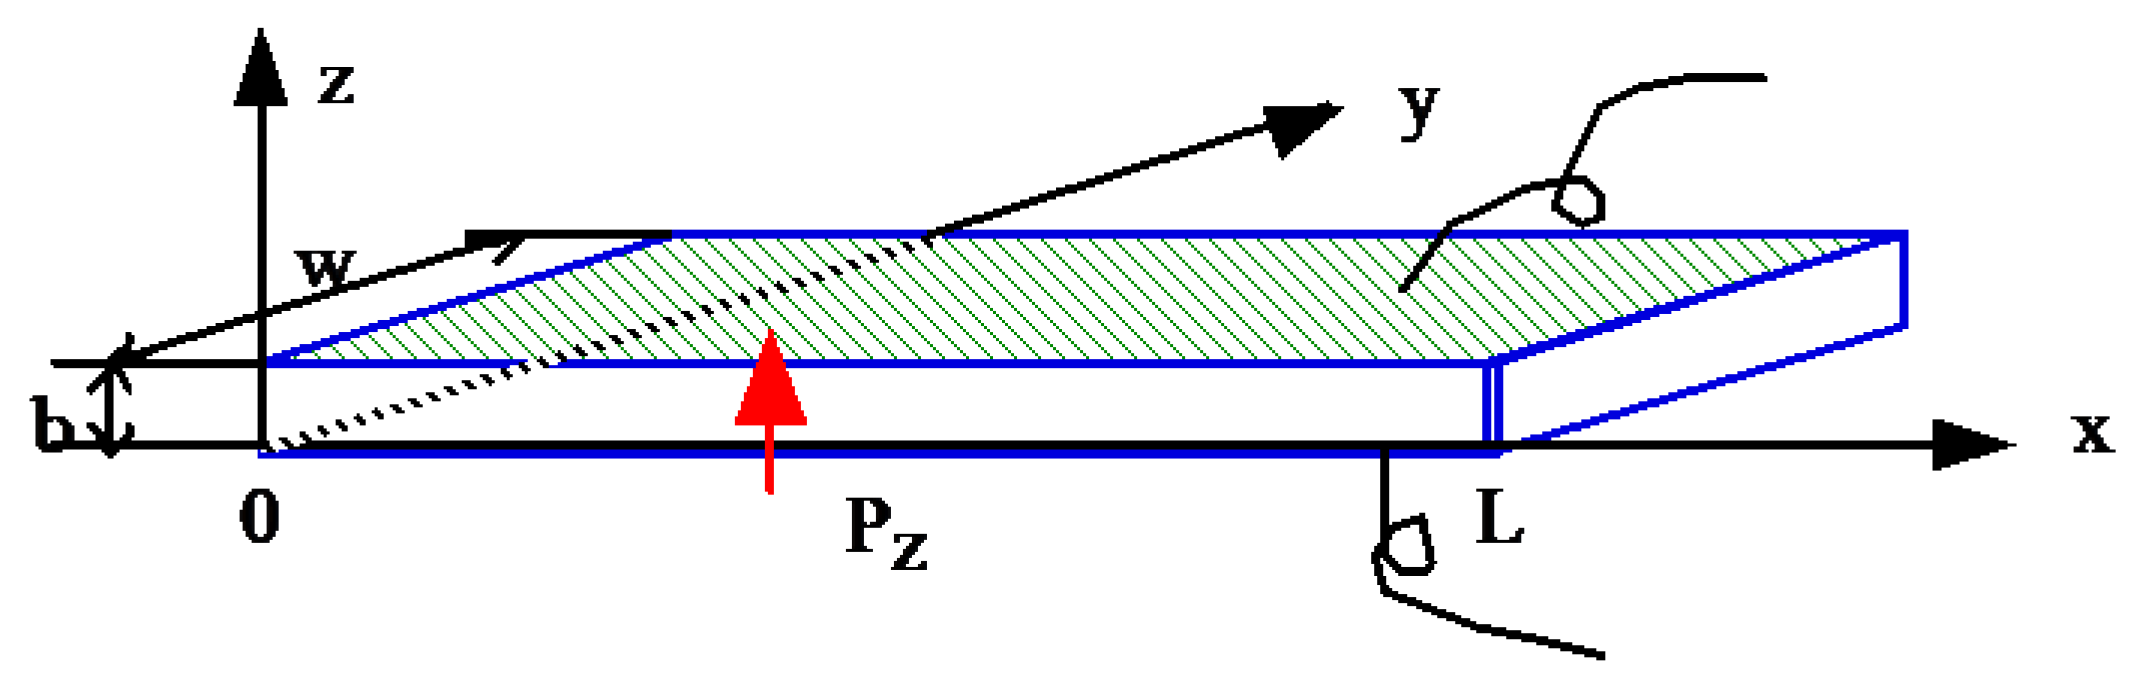
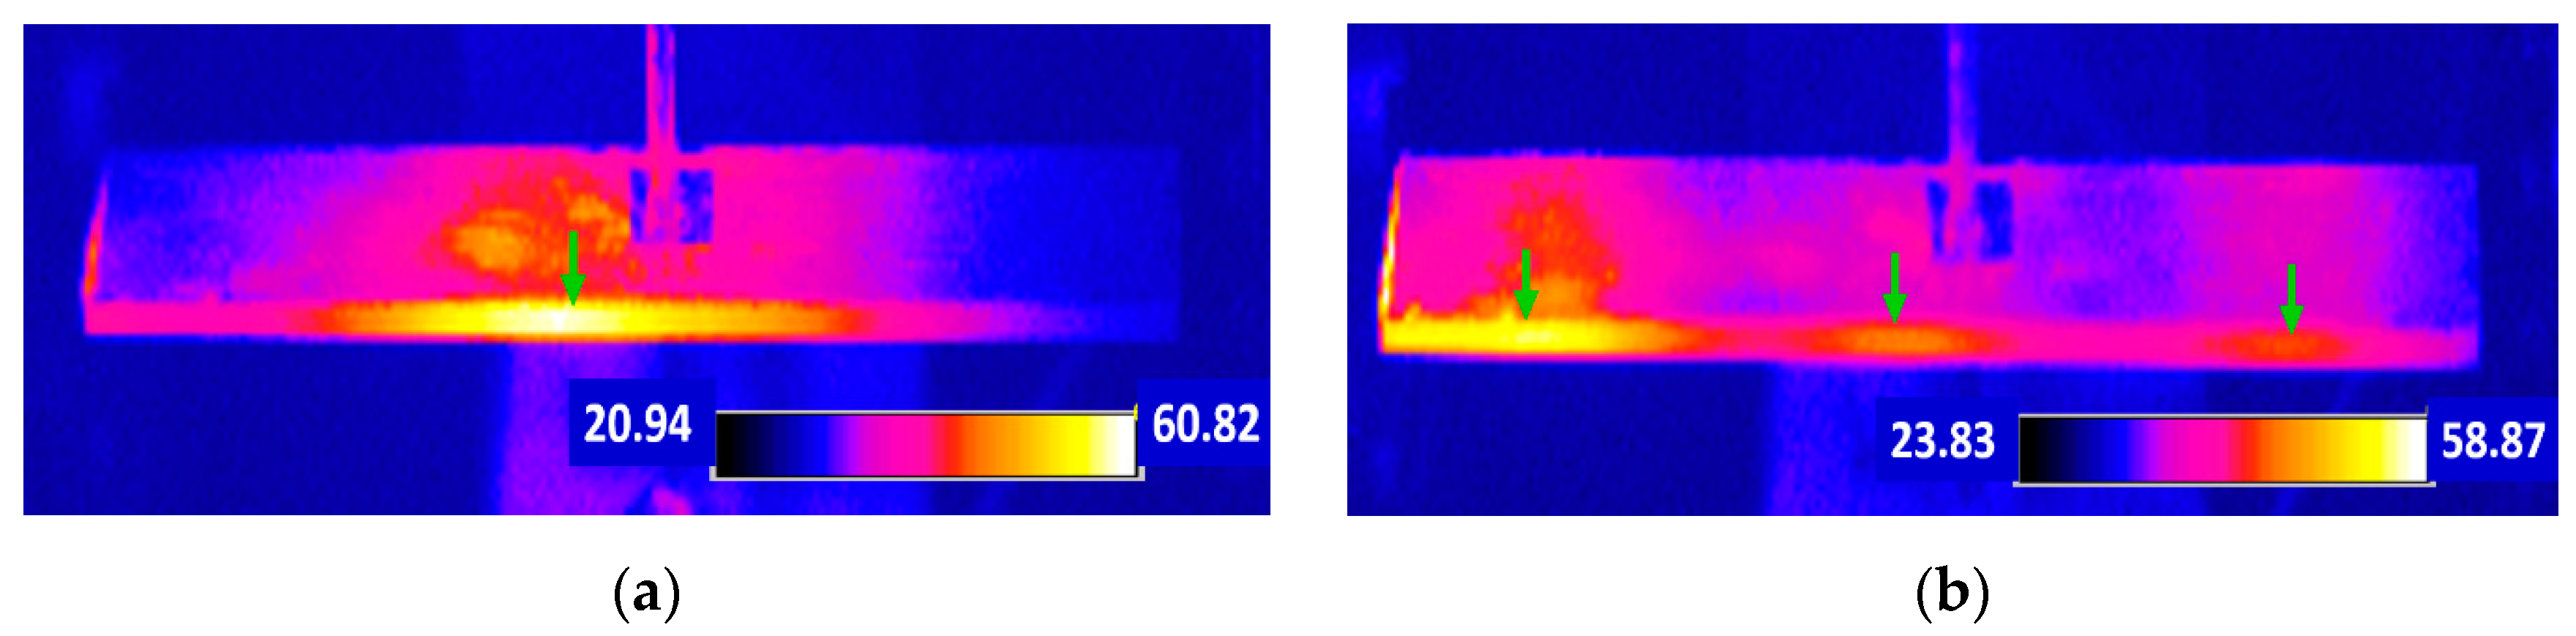
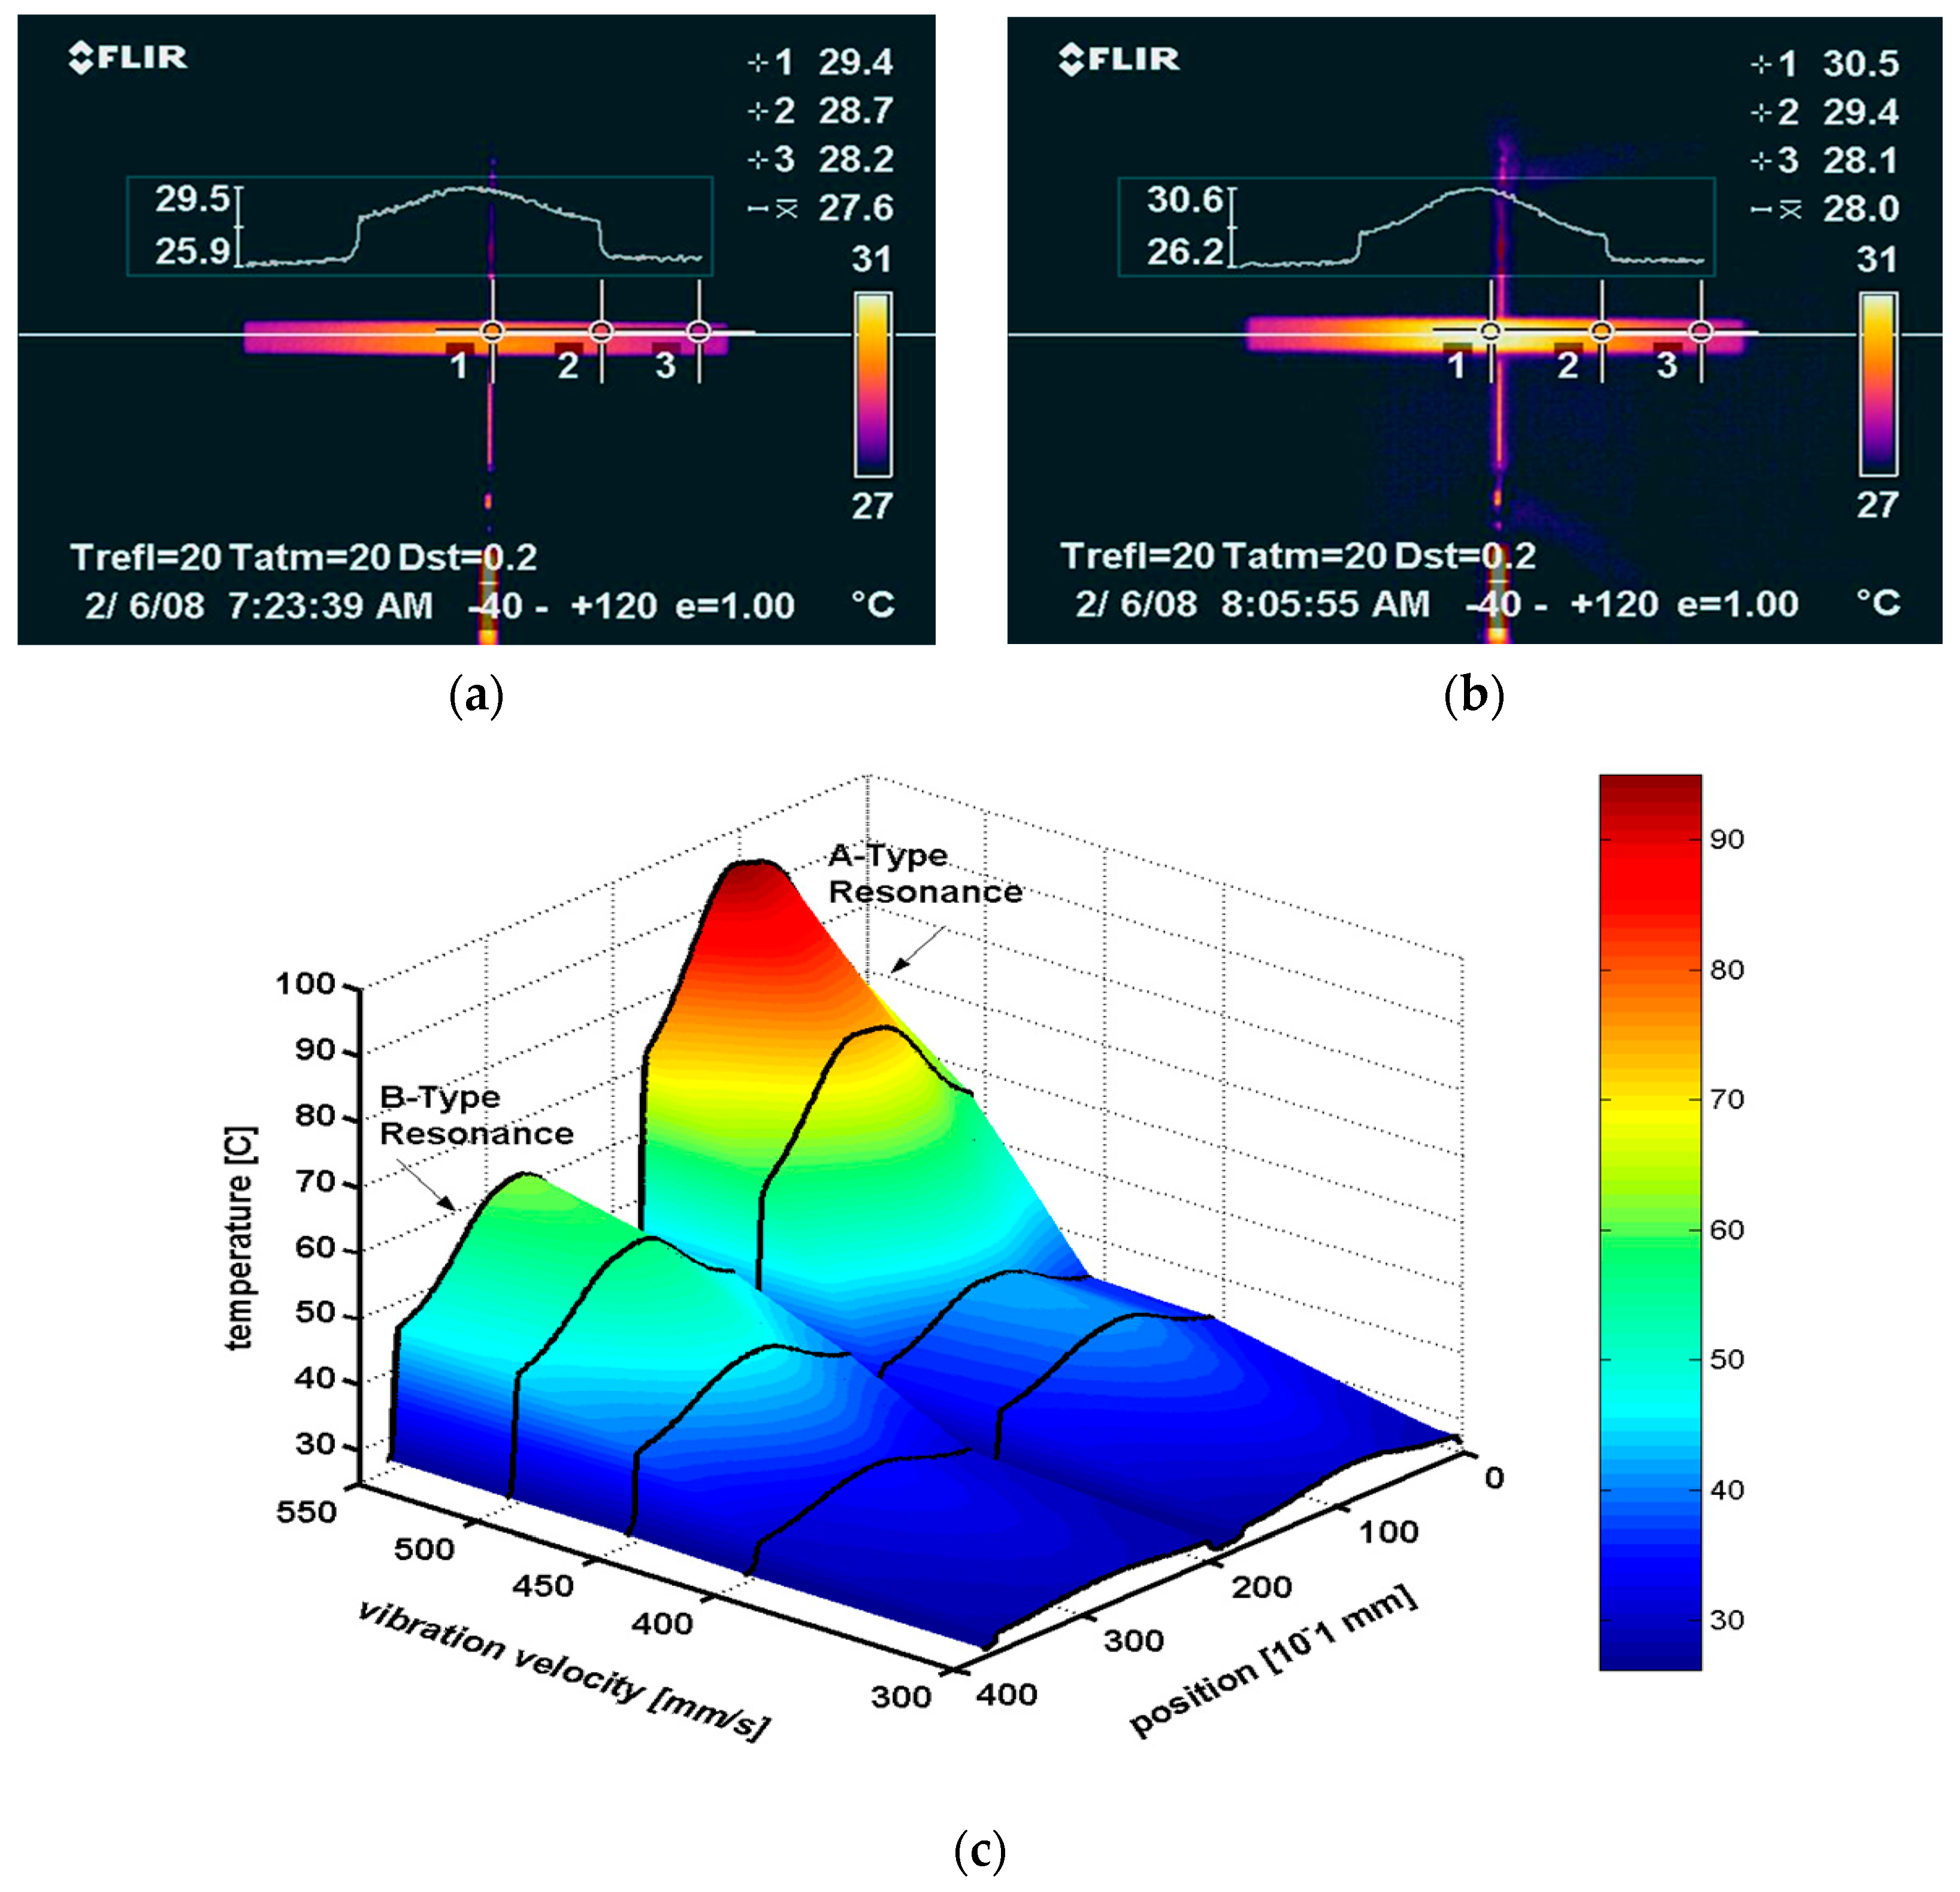
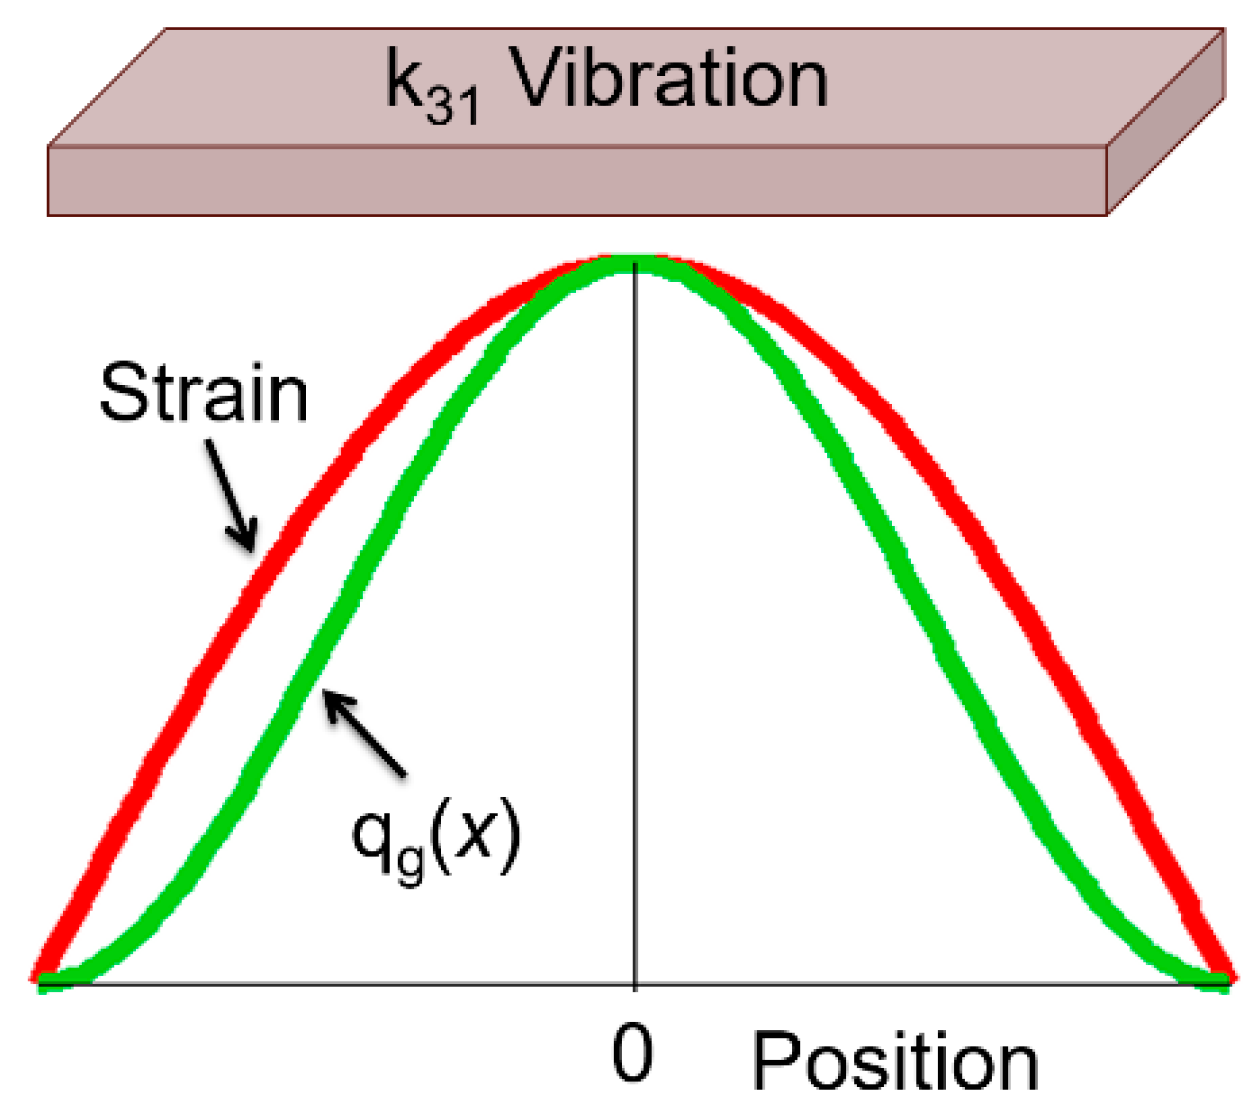
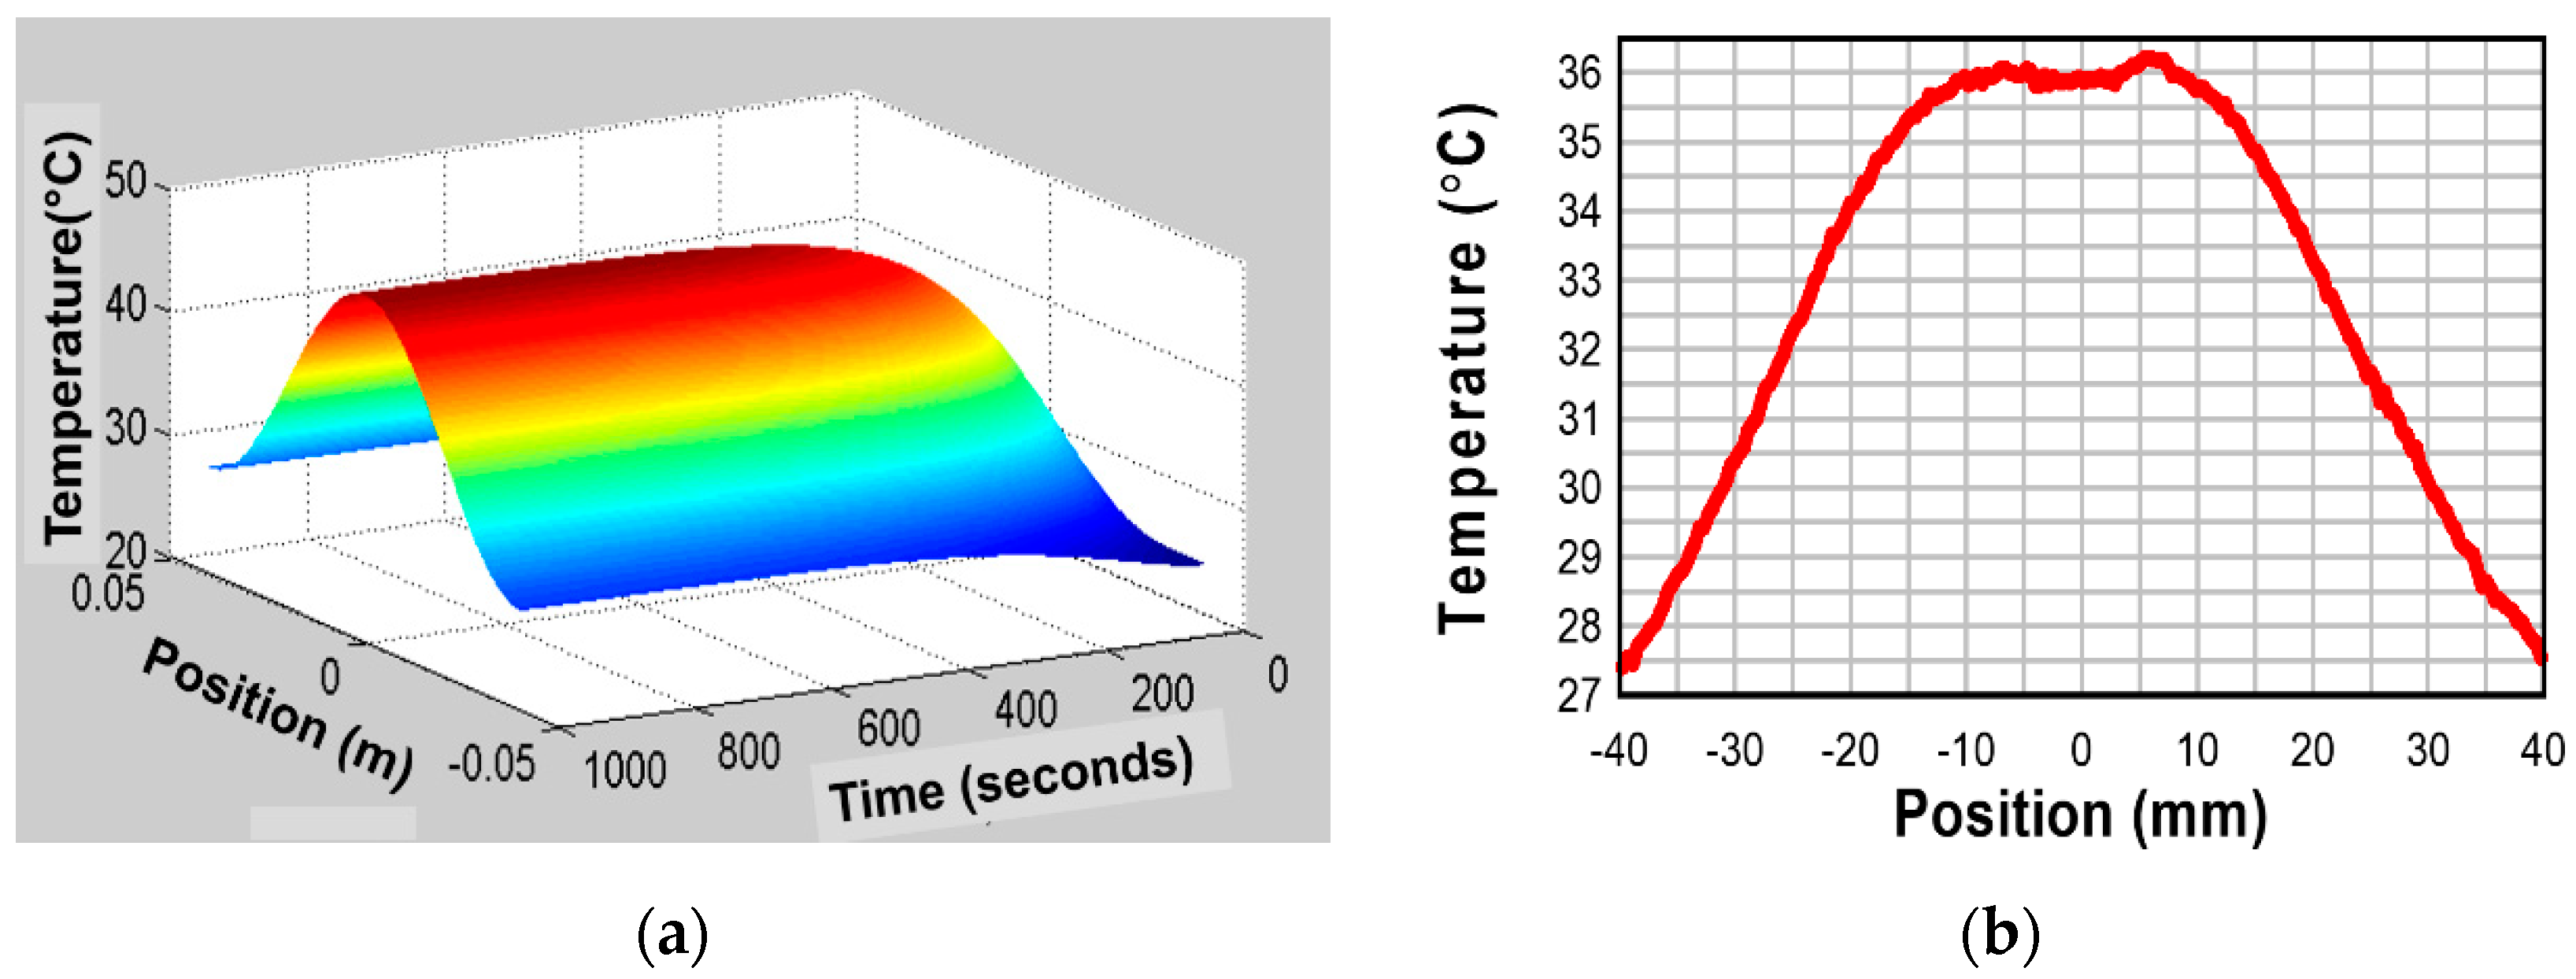
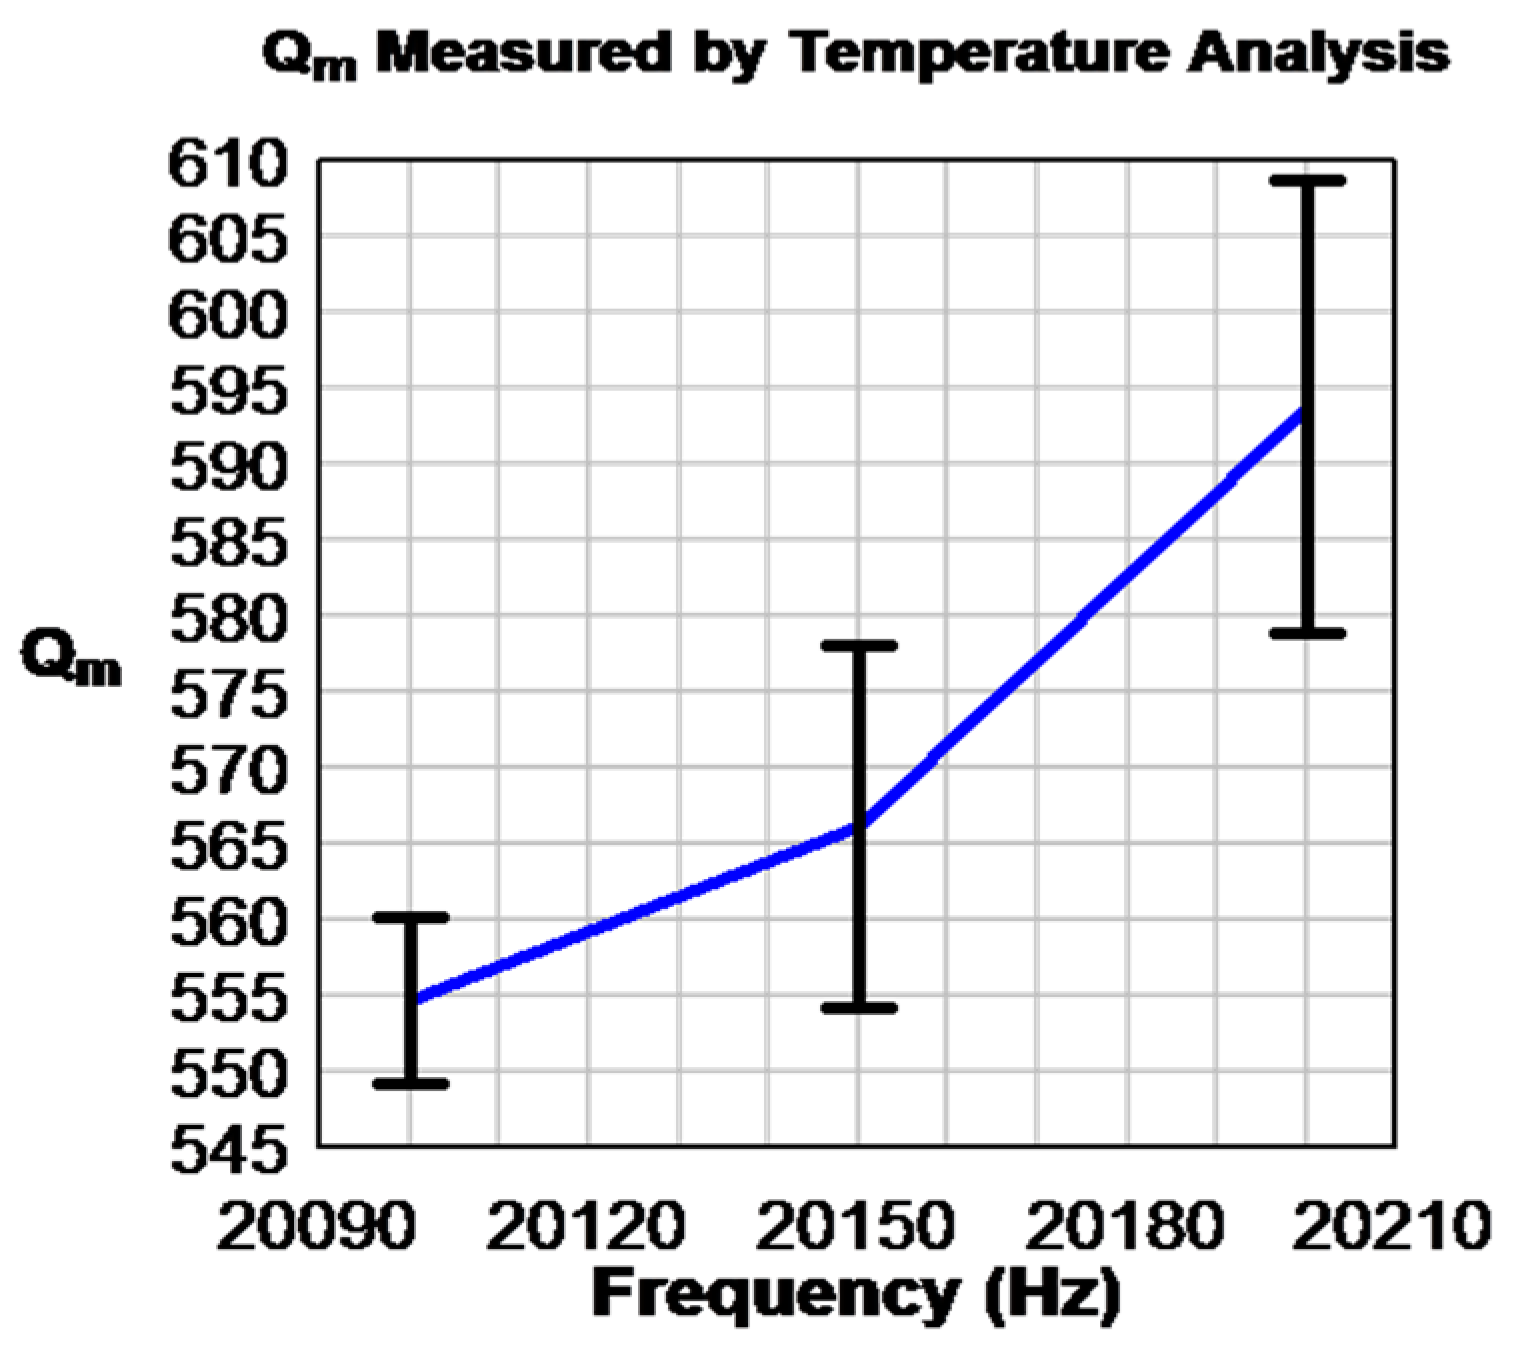
Table 1.
Thermal diffusivity, specific heat capacity, and thermal conductivity of a Hard PZT, for unpoled and poled under different electrical boundary conditions.
Table 1.
Thermal diffusivity, specific heat capacity, and thermal conductivity of a Hard PZT, for unpoled and poled under different electrical boundary conditions.
| Hard PZT | Thermal Diffusivity (10−7 m2/s) | +/− | Specific Heat Capacity cp (J/kg K) | Thermal Conductivity (W/m K) | +/− |
|---|---|---|---|---|---|
| Unpoled | 4.32 | 0.34 | = 279 | 0.91 | 0.10 |
| Open Circuit | 5.02 | 0.23 | = 320 | 1.22 | 0.06 |
| Short Circuit | 8.25 | 0.78 | = 340 | 2.13 | 0.23 |
Table 2.
Thermal properties of NKN-Cu in comparison with Hard PZT.
| Thermal Properties | cp (J/kg K) | λ (W/m/K) |
|---|---|---|
| Hard-PZT | 420 | 1.25 |
| NKN-Cu | 580 | 3.10 |
Table 3.
Loss and overall heat transfer coefficient for PZT multilayer samples (under E = 3 kV/mm, f = 300 Hz) [34].
Table 3.
Loss and overall heat transfer coefficient for PZT multilayer samples (under E = 3 kV/mm, f = 300 Hz) [34].
| Actuator | 4.5 × 3.5 × 2.0 mm3 | 7.0 × 7.0 × 2.0 mm3 | 17 × 3.5 × 1.0 mm3 |
|---|---|---|---|
| wT (kJ/m3) [] | 19.2 | 19.9 | 19.7 |
| P-E hysteresis loss (kJ/m3) | 18.5 | 17.8 | 17.4 |
| k(T) (W/m2 K) | 38.4 | 39.2 | 34.1 |
Publisher’s Note: MDPI stays neutral with regard to jurisdictional claims in published maps and institutional affiliations. |
© 2020 by the author. Licensee MDPI, Basel, Switzerland. This article is an open access article distributed under the terms and conditions of the Creative Commons Attribution (CC BY) license (http://creativecommons.org/licenses/by/4.0/).
Share and Cite
MDPI and ACS Style
Uchino, K. Electrothermal Phenomena in Ferroelectrics. Actuators 2020, 9, 93. https://0-doi-org.brum.beds.ac.uk/10.3390/act9040093
AMA Style
Uchino K. Electrothermal Phenomena in Ferroelectrics. Actuators. 2020; 9(4):93. https://0-doi-org.brum.beds.ac.uk/10.3390/act9040093
Chicago/Turabian StyleUchino, Kenji. 2020. "Electrothermal Phenomena in Ferroelectrics" Actuators 9, no. 4: 93. https://0-doi-org.brum.beds.ac.uk/10.3390/act9040093
Note that from the first issue of 2016, this journal uses article numbers instead of page numbers. See further details here.