Article

How Quality Management System Components Lead to Improvement in Service Organizations: A System Practitioner Perspective

1
School of Business, Macao Polytechnic Institute, Macao, China
2
Department of Logistics and Maritime Studies, The Hong Kong Polytechnic University, Hong Kong, China
*
Author to whom correspondence should be addressed.
Submission received: 23 October 2018 / Revised: 12 November 2018 / Accepted: 19 November 2018 / Published: 23 November 2018
(This article belongs to the Special Issue Behavioral Dimensions of Operations Management)

Abstract

:
Service organizations use quality management systems as a part of their overall strategies to improve business processes and operations management. Nevertheless, how quality management components lead to improvement and whether task conflicts influence quality management components have not yet been identified clearly. This paper examines the mechanisms that link different quality management components to improvement and the role of task conflict in the mechanisms. Data were collected from 495 employees responsible for quality management in Macao’s service organizations. Results from structural equation modeling showed that leadership i.e., the supportive behaviors of top management towards quality management has direct, significant effects on quality management components such as process approach, engagement of people, relationship management, and evidence-based decision making while customer focus has the largest total effect on improvement. On the other hand, task conflict was weakly but significantly related to relationship management. The study provides a deeper understanding of how quality management works in service contexts.

1. Introduction

Throughout history, people have looked for quality products and services to meet their needs. At the turn of the last century, manufacturers started mass-producing consumer products and inspected the quality of semi-finished products output by individual processes and the overall quality of finished products output by factory production lines. Management gurus including W.A. Shewhart, W.E. Deming, and J.M. Juran introduced statistical methods to monitor and improve production processes (Woodall 2000). They also emphasized that quality must be built into a system and advocated the Plan-Do-Check-Act Cycle or a similar continuous improvement cycle. Quality management has evolved from quality inspection, statistical quality control, quality planning, and total quality management. It has changed from a basic engineering and statistical concept centered on physical goods to one that encompasses broad managerial issues and scopes across a wide range of industrial and service sectors (Kim and Chang 1995; Kim et al. 2001).
The service sector contributes to over 70 percent of gross domestic product (GDP) in most developed countries and around 50 percent of GDP in many developing countries such as China, India, and Russia (CIA 2018). It has become the most important sector in the 21st century. Quality management is now recognized as a way of helping organizations gain competitive advantage and sustain the growth of world economy (Talib and Rahman 2010). Quality management in service organizations has become one of the hottest research topics in recent years (Jaca and Psomas 2015; José Tarí et al. 2013; Lee et al. 2009; Wang et al. 2012). According to the latest statistics from the International Organization for Standardization (ISO), over 1.05 million organizations have been certified to the ISO 9001:2008/2015 quality management system (QMS) standard, of which about 35% are service organizations (ISO 2018). Its implementation is known to bring internal and external benefits to service organizations (Djofack and Camacho 2017). Additionally, ISO 9001:2008/2015 has a specific framework that indicates the core components of QMS and how they affect one another. It clarifies management responsibilities influencing resource management which in turn leads to product realization and so forth, in order to achieve continual improvement and customer satisfaction. However, the complexity of services makes it difficult for service organizations to follow the sequential manner implied by the ISO. Although ISO system practitioners may implement QMS components in a more pragmatic way in the service context, there is an urgent need to examine, in sufficient detail, the linkages existing among QMS components, by using employee-level data. Unlike manufacturers, service organizations operate in a much more dynamic environment because the customers are from all walks of life. In the hospitality industry, service organizations such as restaurants, hotels, and casinos tend to adopt flatter organizational structures so that top management can empower employees to be more responsive to customer needs and influence quality practices more directly (Lashley 2012). In addition, quality-related employees work personally and closely with suppliers and customers. Due to these special characteristics, the mechanism by which QMS components work together to achieve continual improvement can be different from the sequential framework advocated by the ISO in which organizational leaders manages firm resources, with customer inputs to produce services, and then monitor the level of customer satisfaction. On the other hand, organizational work teams consist of members with diverse backgrounds and perspectives. Conflict is unavoidable when members of the team that may include members of service suppliers make complex decisions. The ambiguous nature of complex issues induces task-related or person-oriented incompatibilities among team members (Janssen et al. 1999). Janssen et al. (1999) argued that task conflict could enhance organizational performance by utilizing diverse inputs from members while personal conflict adversely influenced organizational performance. Specifically, the study aims to answer the following two research questions. What are the relationships between different QMS components in service contexts? Will task conflict affect relationship management? The findings of the study can shed light on identifying the underlying mechanism of quality management systems and whether task conflict has an influence on quality management.
The rest of the paper is structured as follows. The next section presents a brief review of quality management and service quality and presents a set of hypotheses. Section 3 describes the methodology including the context, data collection, samples, and instruments used, followed by data analyses and findings. The paper ends with a discussion on managerial implications.

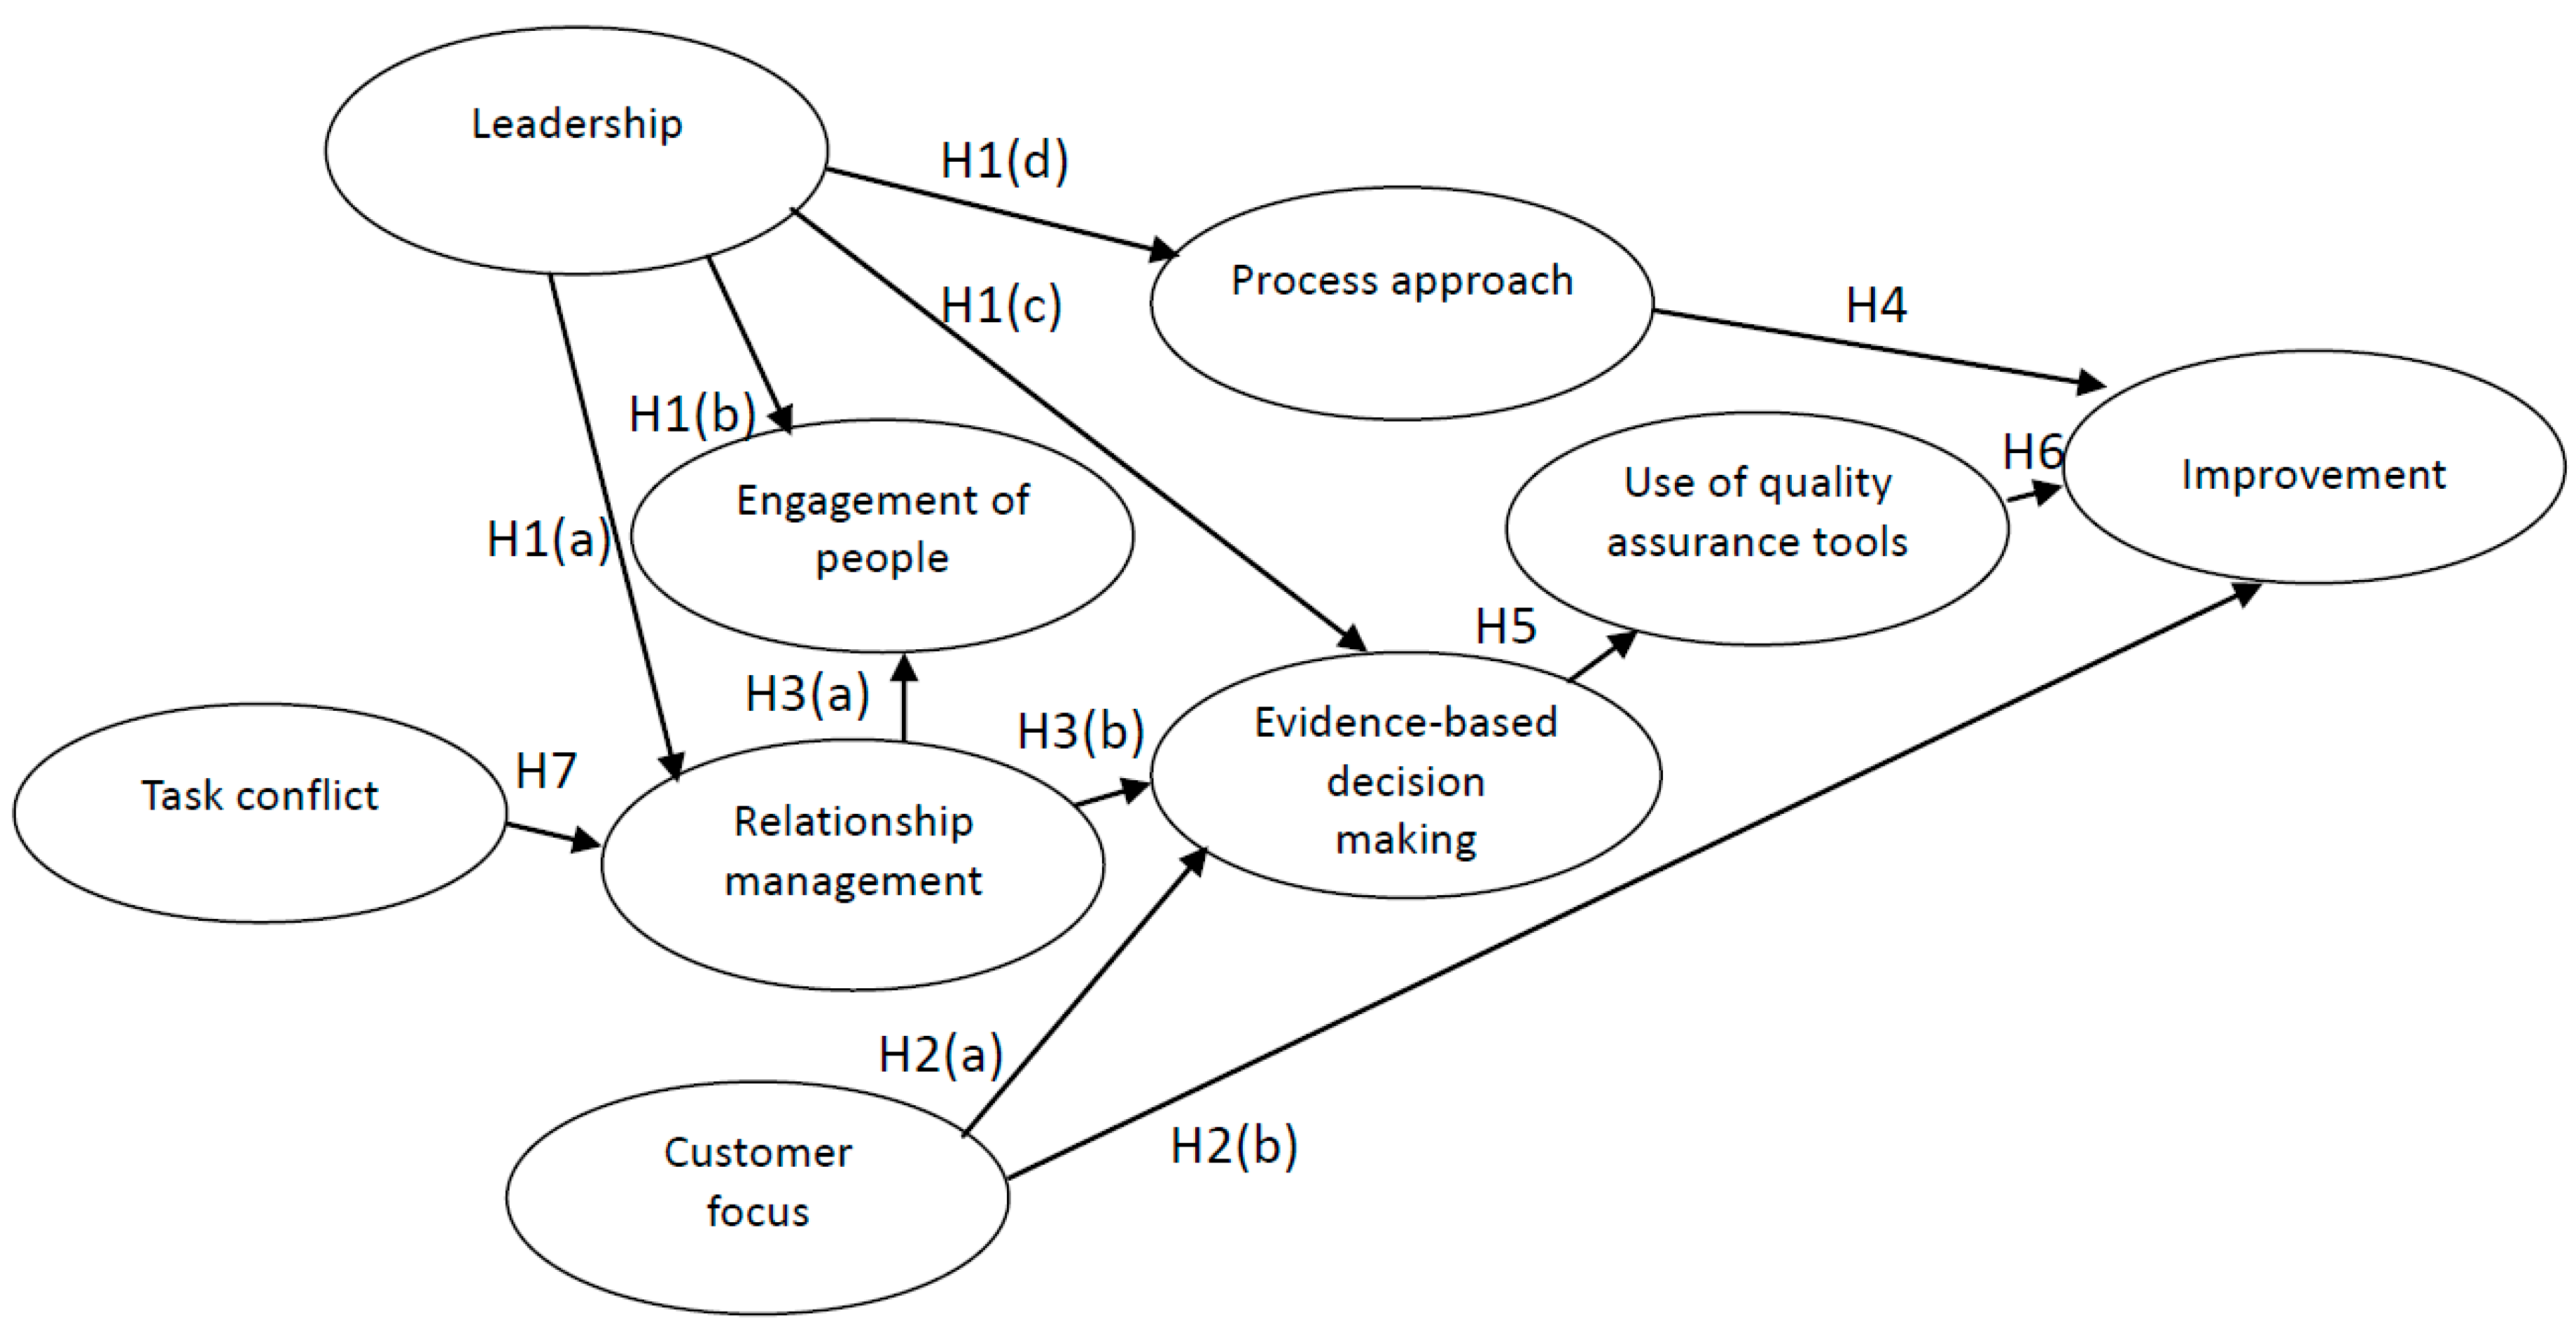
2. Literature Review and Hypotheses Development

Quality management has been a principal focus for academic researchers, industrial practitioners, and business managers alike since the early 1980s (Grandzol and Gershon 1998). In 1986, the ISO introduced the ISO 9000 family of standards that presented a generic QMS for any organization, large or small, in any sector or part of the world. ISO 9001 QMS was revised four times in the past two decades: once in 1994, once with a major change in 2000, once with a minor revision in 2008, and once with some changes in 2015. ISO 9001:2000/2008/2015 QMS emphasizes a process orientation and adopts the Plan-Do-Check-Act approach for continual improvement. ISO 9001:2000/2008 indicated that organizations should focus on eight principles, i.e., QMS components, namely (1) customer focus, (2) leadership, (3) involvement of people, (4) process approach, (5) system approach to management, (6) continual improvement, (7) factual approach to decision making, and (8) mutually beneficial supplier relationships (To et al. 2011). Although many service organizations had been certified to ISO 9001 QMS standards in the 1990s and 2000s, most of the studies on ISO 9001 QMS prior to the work of Lee et al. (2009) focused on the manufacturing sector and quality management models were generally investigated through the lens of the manufacturing sector (Lee et al. 2009). Lee and his associates (Lee et al. 2009; To et al. 2011; Yu et al. 2012) were one of the first adopting ISO 9001 QMS components to study the implementation and performance of organizations in the service sector. More specifically, Lee et al. (2009) highlighted that not all organizations were implementing QMS components to the same degree and organizational performance was strongly associated with the level of adoption of QMS components. Yu et al. (2012) indicated that one of the QMS components, the system approach to management, overlapped significantly with other components such as the process approach and continual improvement. Yu et al. (2012) suggested using seven QMS components rather than eight QMS components to explore the mechanisms of ISO 9001:2000/2008. The ISO released the 2015 version of ISO 9001 QMS adopting seven components including (1) customer focus, (2) leadership, (3) engagement of people, (4) process approach, (5) improvement, (6) evidence-based decision making, and (7) relationship management (ISO 2015).
In service contexts, researchers (Dabholkar et al. 1995; Gronroos 1984; Parasuraman et al. 1985, 1988; To et al. 2013) developed multidimensional models/constructs to assess the quality of services. Specifically, Parasuraman et al. (1988) developed a 22-item SERVQUAL instrument that has been widely adopted in a range of service settings such as dental school patient clinics, business school placement centers, tire stores, acute care hospitals (Carman 1990), pest control, dry cleaning, fast food shops, banking (Cronin and Taylor 1992; Kumar et al. 2018), and the leasing market (Ramanathan et al. 2018). Parasuraman et al. (1985) established a service quality gap model that included five gaps. The most significant gap is customer expectation and perception gap because it affects customer satisfaction and behavioral responses such as word of mouth communication and loyalty. This specific gap is a function of the other four gaps that depend on management perceptions on customer expectation, service specifications defined by management, communications to customers, and actual service delivery (Parasuraman et al. 1985). According to this gap model, customer focus, and management commitment to quality service are crucial to achieving excellent services. Management commitment to quality service includes their commitment to understand customer needs and expectations, their effort in translating customer needs and expectations to service specifications, and the way they communicate formally and informally with employees about the service delivery. Research has shown that quality management system should be a key factor in sustaining service quality (Stamenkov and Dika 2015). However, quality management system is a complex and dynamic system. It is necessary to reveal how different QMS components interact with each other, eventually leading to improvement. In ISO 9001 QMS terms, one needs to cover leadership, process approach, and engagement of people, i.e., employees.

2.1. Theoretical Model of QMS

ISO 9001 QMS uses a process-orientation approach and considers organizational activities as chains of interlinked processes within a loop. The loop begins with “management responsibility”, i.e., leadership that places customer requirements as the focal point of the organizational objective (customer focus). Management responsibility is followed by “resources management” that covers engagement of people and mutually beneficial supplier relationship (now relationship management). “Product/service realization” covers process approach and evidence-based decision making and turns customer requirements and organizational resources to products/services. “Measurement, analysis and improvement” uses quality assurance tools to analyze customer satisfaction levels. The results are utilized by management to evaluate staff and internal results leading to “continual improvement” or “improvement” in 9001:2015 terminology. Yu et al. (2012) articulated several hypotheses based on the ISO 9001 QMS framework. After analyzing 120 responses from employees working in Macao’s public organizations, Yu et al. (2012) identified that leadership is an antecedent of mutually beneficial supplier relationships (now relationship management), involvement of people (now engagement of people), factual approach to decision making (now evidence-based decision making), and process approach. Process approach is related to improvement while factual approach to decision making (now evidence-based decision making) has an influence on improvement through the use of quality assurance tools, such as Product Service System (Kim et al. 2015).
In high-contact service environments such as hospitality, banking, and finance, a service is produced and consumed simultaneously. How a decision is made during the customer-employee interaction reflects the extent to which customer focus is emphasized. Besides, customer focus leads to improvement (Prajogo et al. 2008). Following this line of reasoning and taking into account the flatter structure adopted by service organizations, we suggest that leadership, i.e., the behaviors of top management affects QMS components as follows:
Hypothesis 1 (H1).
Leadership is positively related to (a) relationship management, (b) engagement of people, (c) process approach, and (d) evidence-based decision making.
The ISO suggests that customer focus is a high level element which affects nearly all QMS components to help achieve improvement. Nevertheless, frontline service employees work directly with customers and they together make decisions with customers. An emphasis on customer focus has a direct motivational effect on frontline service employees to constantly improve their services and decision making quality (Berry et al. 1994; Hartley 2005). Research has shown that tools such as quality function deployment and analytic hierarchy process can effectively help convey customer needs for improvement (Kim et al. 2015). Hence, we posit that:
Hypothesis 2 (H2).
Customer focus is positively related to (a) evidence-based decision making and (b) improvement.
Service organizations’ suppliers are likely to be service providers too such as security guards in hotels or management information system providers in casinos. Hence, employees of the buyer and supplier organizations basically work together at the same location. In this situation, employees of the buyer (i.e., the service organization) watch and experience how the supplier’s employees create and deliver the service, encouraging them to use evidence-based decision-making. Additionally, a high level of relationship management could mean a high level of outsourcing, implying that employees of the service organization could engage in more high-level tasks such as managing and monitoring service providers’ performance and supporting the concepts of people engagement, similarly to the buyer-seller relationship in the fashion industry (Kim 2013). Thus, we hypothesize that:
Hypothesis 3 (H3).
Relationship management is positively related to (a) engagement of people, and (b) evidence-based decision making.
In ISO9001:2015, process approach means that processes should be managed as a group of interrelated activities. A successful implementation of process approach is expected to lead to improvement (Arribas Díaz and Martínez-Mediano 2018). Hence, we posit that:
Hypothesis 4 (H4).
Process approach is positively related to improvement.
With the advent of information and communication technologies such customer relationship management and point-of-sale applications, service organizations can obtain accurate and detailed information on customers. As a result, more and more service organizations will be able to implement evidence-based decision making and collect and analyze evidences by using different quality assurance tools, leading to improvement. Hence, we hypothesize that:
Hypothesis 5 (H5).
Evidence-based decision making is positively related to the use of quality assurance tools.
Hypothesis 6 (H6).
The use of quality assurance tools is positively related to improvement.

2.2. Effect of Task Conflict on QMS

In most organizational teams, including quality management teams, team members may not share the same views due to their diverse backgrounds and perspectives. Hence, team members may have conflicting views on the adoption and implementation of quality management system. Task conflict refers to disagreements on the work to be done including the purposes of quality management, the allocation of resources, and the development and implementation of quality-related practices including the management of relationships with suppliers and other stakeholders (Curşeu 2011; Janssen et al. 1999). Janis (1982) suggested that task-oriented disagreements prevent groupthink. Task conflict stimulates the identification, scrutiny, and ultimate integration of different perspectives needed to produce high-quality organizational practices. Janssen et al. (1999) indicated that task conflict enhances organizational performance by facilitating the utilization of members’ diverse inputs. More specifically, Bradford et al. (2004) studied the effects of conflict in retail networks and suggested that the management of relationships between buyers and sellers played an important role in network performance. As task conflict encourages a diversity of opinions (Janis 1982; Wu et al. 2013), it is positively related to relationship management. Hence, we posit that:
Hypothesis 7 (H7).
Task conflict has a positive effect on relationship management.
Figure 1 shows the mechanism how leadership and customer focus lead to improvement through other QMS components. It also demonstrates the effect of task conflict on an organization’s QMS.

3. Methodology

3.1. Context

The research hypotheses were tested by using the data collected from quality management teams in a range of service organizations in Macao. Macao has a land area of just 30 km2 and a population of 0.64 million. Nevertheless, it welcomes 31.5 million visitors a year and has become the world’s gaming center in recent years (To et al. 2015). In 2017, the service sector contributed to over 90 percent of Macao’s GDP, similar to other cities in developed nations. Considering the importance of the service sector in its economy, the results of this study should be relevant to service organizations in most cities of the world.

3.2. Data Collection and Sample

According to the Macao Productivity and Technology Transfer Center (CPTTM 2017), 236 Macao’s organizations have been certified to ISO 9001 QMS since 1990. Discarding 25 manufacturing and 58 civil-engineering and contracting firms, there are 153 service organizations certified to ISO 9001 QMS. Additionally, casinos (35 of them), four- and five-star hotels and resorts (45 of them), and banks and insurance companies (49 of them) in Macao have established industry-specific QMS. Thus, the total number of target organizations including ISO 9001 certified organizations, major gaming and hospitality organizations, and financial institutions were 282. The authors contacted management representatives who are responsible for the implementation of QMS in those organizations. About a quarter (65) agreed to participate in the study. Ten well-trained interviewers approached the management representative and their associates working in quality-related activities of each organization in their workplaces to distribute 40 copies of questionnaire.
Following Dillman’s (2007) suggestion, clear instructions were provided to guide respondents to complete the self-administered questionnaires. This ensured that the respondents remained anonymous and their specific responses confidential. They were invited to participate in the study voluntarily and could dropout at anytime. In the end, 495 respondents from 65 organizations (mostly certified to ISO 9001:2015 standard) participated in the study. This sample size would produce a margin of error of 4.4% at a 95% confidence level.

3.3. Measures

The instrument was developed based on ISO 9001 QMS components in English (ISO 2015; To et al. 2011; Yu et al. 2012). As a majority of the respondents of the study were Chinese, the English version of the instrument was translated into Chinese by following the approach recommended by Zhao et al. (2006). The English version of the instrument was checked independently by two researchers and the Chinese version of the instrument was tested in a pilot study involving three researchers and ten QMS practitioners in service organizations. The purpose of the pilot study was to obtain views on whether (1) QMS components and task conflict were understandable from the respondents’ perspective, and whether (2) the measurement items functioned as they should. As suggested by the researchers and QMS practitioners, some minor modifications were made to ensure the clarity of the items. The constructs of the instrument are briefly described below.
Customer focus refers to the extent that the organization puts customer needs as its focal point. Five items were adopted from Yu et al. (2012). Leadership describes how management creates a clear vision and provides employees with the required resources. Four items were adopted from Yu et al. (2012). Engagement of people refers to whether employees are willing to accept responsibilities and seek opportunities to enhance job competence. Four items were adopted from Yu et al. (2012). Relationship management describes how the organization works closely with its stakeholders including suppliers. Three items were adopted from Yu et al. (2012). Process approach describes whether the organization defines the scopes of different activities and treats them as processes. Three items were adopted from Yu et al. (2012). Evidence-based decision making refers to the extent that the organization values the data and makes use of the data and information on decision making. Three items were adopted from Yu et al. (2012). The use of quality assurance tools describes whether the organization uses different types of charts and diagrams to collect, analyze, and present data. Three items were adopted from To et al. (2011) and Yu et al. (2012). Improvement refers to changes in customer satisfaction and organizational image after the implementation of ISO 9001 QMS (or other similar QMS). Three items were adopted from ISO (2015) and Yu et al. (2012). Task conflict refers to differences in viewpoints and opinions pertaining to team tasks and decisions. Four items were adapted from Janssen et al. (1999). The items of QMS components were measured using a five-point Likert scale with 1 representing strongly disagree and 5 representing strongly agree. The items of task conflict were measured using a 5-point scale with 1 representing none and 5 representing a lot. The Cronbach’s alpha values of these measures ranged from 0.78 to 0.90.

4. Results

4.1. The Sample

Four hundred and ninety-five respondents completed the questionnaires, representing a response rate of 19%. The response rate was slightly lower than the one reported by To et al. (2013). The proportions of male and female respondents were almost even. All respondents indicated that they worked in the service sector with sufficient experience to comprehend the questionnaire items. Almost 40% of the respondents had more than eight years of experience. Fifty-eight percent held a bachelor degree, and almost 12% had master’s degrees. The profiles of respondents along with their demographic characteristics are shown in Table 1.

4.2. Measurement Validity

All measures must exhibit content validity, reliability, and convergent validity. The study’s measures were taken directly from previous QMS research; content validity can be assumed. For a more vigorous validation, scale reliability was validated using confirmatory factor analysis by LISREL 8 (Jöreskog and Sörbom 1996). All latent variables were included in a first-order measurement model. The χ2 statistic of the model was 957.26 (df = 459, p < 0.01), while the independence model’s χ2 statistic was 36,768.46 (df = 528). The value of goodness-of-fit index (GFI) was 0.895 and the root mean square error of approximation (RMSEA) was 0.0469. The test statistics of the measurement models indicated acceptable fits (Browne and Cudeck 1992). The non-sample dependent indices such as the comparative fit index (CFI), non-normed fit index (NNFI), and incremental fit index (IFI) were 0.987, 0.985, and 0.987, respectively. They were all acceptable from a practical viewpoint (Bentler 1990). Table 2 presents the factor loadings and composite reliabilities for assessing internal consistency. Composite reliabilities were acceptable with the threshold value of 0.70. Thus, the confirmatory factor analysis results supported the reliability of the measurement model. In it, the estimated pattern coefficients for all measurement items were significantly loaded to the prescribed latent variables, satisfying the basics for convergent validity (Anderson and Gerbing 1988).
Since all the latent variables were measured using items in a questionnaire completed by a single respondent, common method variance was examined by conducting Harman’s one-factor test (Podsakoff and Organ 1986). All measurement items were entered into a one-factor model, the χ2 statistic of the model was 4147.39 (df = 495, p < 0.01). The value of GFI and RMSEA were 0.663 and 0.122, respectively, indicating a poor fit. Thus, common method variance should not be a problem in the study (Podsakoff and Organ 1986).
Table 3 shows the correlation matrix for the study variables that support the claims of predictive validity (Garver and Mentzer 1999). For example, as theorized, leadership and engagement of people are significantly correlated (0.75, p < 0.01), relationship management and evidence-based decision making are significantly correlated (0.72, p < 0.01), and evidence-based decision making and improvement are significantly correlated (0.75, p < 0.01). Hence, all measures exhibit sufficient predictive validity.

4.3. Hypothesis Testing

A structural assessment of the full model has indicated that the model fits the data well with a χ2 statistic of the model 1,046.91 (df = 480, p < 0.01). The value of GFI was 0.886 and the RMSEA was 0.0489, indicating an acceptable fit (Browne and Cudeck 1992). The non-sample dependent indices CFI, NNFI, and IFI were 0.985, 0.983, and 0.985, respectively, which were all acceptable for practical purposes (Bentler 1990). While the overall theorized model fit the data well, the standardized estimates and associated t-values supported all hypotheses developed in this study. Path coefficients were tested for their t-values and the significance. Table 4 shows the estimates and the corresponding t-values. All paths were significant at the 0.01 level. For instance, H1(a) was about the positive and direct relationship between leadership and relationship management; the path was significant at the 0.001 level and result indicated a strong effect (with standardized coefficient of 0.706). Likewise, most other hypotheses showed strong relationships. In comparison, H7 turned out to be a weak, though significant, effect. It implied that, other than task conflict, relationship management was affected by some other more important factors (like leadership, H1(a)). Taken together, the hypothesized paths were supported by the empirical findings. Finally, we estimated the predictive ability of the model with the squared multiple correlations for structural equations, which provided information about the percentages of explained variance in the dependent variables. The squared multiple correlations for engagement of people, process approach, evidence-based decision-making, relationship management, the use of quality assurance tools and improvement were 0.675, 0.686, 0.796, 0.498, 0.380, and 0.539, respectively. Thus, the model was most successful in explaining the variance of evidence-based decision making by up to 79.6%, and least successful in explaining the variance of use of quality assurance tools (only 38%). Overall, this high explanatory power was satisfactory.

5. Discussion

The objectives of the study were two fold. The first was to explore how QMS leads to improvement in service organizations. The second objective was to investigate the effect of task conflict on QMS. The results of the study supported Yu’s et al. (2012) findings that customer focus and leadership were key drivers of other QMS components (also see Basnet et al. 2006). More specifically, customer focus translated into evidence-based decision-making and improvement while leadership was moderate to strong, with significant influences on evidence-based decision making, engagement of people, relationship management, and process approach. Customer focus had the largest direct and total effect on improvement and leadership or management commitment to quality had a multitude of influences on perceived performance through various QMS components. Yee et al. (2013) had studied the relationships between leadership, goal orientation, and service quality in Hong Kong’s high-contact service industries. They found that transformational leadership was more effective than transactional leadership in influencing employee’s positive work attitude in high-contact service firms. The findings of Yee et al. (2013) should also be applicable to Macao’s situations. Task conflict was conceived as a positive factor because it prevented group thinking (Janis 1982) and enabled organizations to have diverse inputs from members including its external partners in the value chain (Janssen et al. 1999). In this study, task conflict had a weak but significant effect on relationship management. This finding is not surprising because Tjosvold et al. (2006), who explored conflict management in Chinese teams, also reported that task conflict did not significantly affect outcomes such as team effectiveness. Tjosvold et al. (2006) hypothesized that there could be complicated, dynamics interactions between task conflict and other variables such as relational conflict that might affect organizational practices. Besides, task conflict particularly those involving employees from service suppliers shall be clearly monitored. As Kang et al.’s (2017) study demonstrated, a supplier’s high corporate ability does not affect how consumer evaluate a firm’s product but a supplier’s low corporate ability (or the lack of the ability of align their actions with the firm’s objectives and interests) will have a negative effect on consumer evaluation of the firm’s product (or service).
QMS has been implemented across a wide range of sectors including many service industries. The system is founded on several key QMS components. However, the key drivers of quality management activities have received only cursory attention so far and the mechanism on how a QMS component affects other components has seldom been investigated using empirical data (Yu et al. 2012). By contrast, this study has addressed these significant research gaps by (i) confirming customer focus and leadership to be key drivers of other QMS components, and (ii) recognizing that leadership, either moderately or strongly, will significantly affect evidence-based decision making, engagement of people, relationship management, and process approach in the service setting. Additionally, the results from the present study have demonstrated that task conflict did not have a strong, positive effect on relationship management. This was because task conflict on the one hand may promote informational diversity and on the other hand may cause tension among members (Curşeu 2011; De Dreu and Weingart 2003) that produces relational conflict (Gamero et al. 2008) and negative influence on organizational practice(s).

5.1. Managerial Implications

Leadership in service organizations is critical because it has a significant influence on employee creative self-efficacy and creativity, which are particularly useful in the service industries where customers can make all sorts of peculiar demands (Wang et al. 2014). When leadership is properly executed, for example, using transformational leadership, employees can be fully engaged in achieving the organizational goals. Besides, quality is defined by customers. A conscious transformational leader must make use of process approach to continually refine the system based on customer and employee feedback and make decisions based on factual evidences.
Implementing and sustaining a quality initiative is not an easy task. Quality management in the service environment involves changes in employee behaviors because customers are becoming more knowledgeable and demanding due to the advent of information and communication technologies. Moreover, a service, unlike tangible goods, is produced and consumed simultaneously and the quality of service is determined by the moment of truth, i.e., during that particular time the service firm and/or its employees can demonstrate to the customer the quality of its services (Gronroos 2011). All these factors render the interactions among QMS components become more complex and dynamic. In other words, the findings from this study have demystified complex interactions between different QMS components. Quality management practitioners can have a useful guide to link customer focus and leadership all the way to improvement.

5.2. Limitations and Future Work

The study has several limitations. First, the data of the study were obtained from a cross-sectional survey. In order to provide further evidence on the causal relationships among QMS components, we suggest that future research should explore other data collection methods, such as longitudinal and experimental designs. Second, although task conflict was critically examined in the study, it should be noted that other conflicts such as relational conflict might harm the performances of QMS. Third, measurement of the outcome of QMS was based on respondents’ own subjective perceptions. It should be worthwhile to use objective performance data for similar studies in the future. Lastly, the research context of this study was Macao’s service organizations and respondents were Chinese. Hence, caution should be exhibited in the generalizing of our findings to other non-Asian contexts. A replication study can be conducted using data from different contexts so as to examine whether the mechanism that links different QMS components is the same in other sectors and countries.

6. Conclusions

This study explored the direct and indirect relationships between different QMS components and the role of task conflict in the relationships. Based on responses from 495 members working in Macao’s service organizations, the structural equation modeling results confirmed that customer focus and leadership are key drivers of other QMS components such as evidence-based decision making, use of quality assurance tools, and improvement. Specifically, customer focus was found to have the largest direct and total effect on improvement. Leadership, i.e., the supportive behaviors of top management towards quality management was found to have a strong, significant influence on process approach, engagement of people and relationship management, and a moderate, significant influence on evidence-based decision-making. Moreover, task conflict was found to have a weak but significant effect on relationship management. The findings of the study demonstrated that service organizations must continuously perceive customer needs and measure and analyze customer satisfaction and organizational leaders must exhibit supportive behaviors to manage internal and external relationships with employees and suppliers.

Author Contributions

Conceptualization, W.M.T., B.T.W.Y. and P.K.C.L.; methodology, W.M.T. and B.T.W.Y.; formal analysis, W.M.T. and B.T.W.Y.; writing—original draft preparation, W.M.T.; writing—review and editing, B.T.W.Y. and P.K.C.L.

Funding

This research received no external funding.

Acknowledgments

This research was supported in part by the Hong Kong Polytechnic University (project code: G-YBQN).

Conflicts of Interest

The authors declare no conflict of interest.

References

  1. Anderson, James C., and David W. Gerbing. 1988. Structural equation modeling in practice: A review and recommended two-step approach. Psychological Bulletin 103: 411–23. [Google Scholar] [CrossRef]
  2. Arribas Díaz, Jorge Antonio, and Catalina Martínez-Mediano. 2018. The impact of ISO quality management systems on primary and secondary schools in Spain. Quality Assurance in Education 26: 2–24. [Google Scholar] [CrossRef]
  3. Basnet, Chuda, Paul Childerhouse, Les Foulds, and Valerie Martin. 2006. Sustaining supply chain management in New Zealand. International Journal of Logistics Systems and Management 2: 217–29. [Google Scholar] [CrossRef]
  4. Bentler, Peter M. 1990. Fit indexes, Lagrange multipliers, constraint changes and incomplete data in structural models. Multivariate Behavioral Research 25: 163–72. [Google Scholar] [CrossRef] [PubMed]
  5. Berry, Leonard L., Anantharanthan Parasuraman, and Valerie A. Zeithaml. 1994. Improving service quality in America: Lessons learned. Academy of Management Perspectives 8: 32–45. [Google Scholar] [CrossRef]
  6. Bradford, Kevin D., Anne Stringfellow, and Barton A. Weitz. 2004. Managing conflict to improve the effectiveness of retail networks. Journal of Retailing 80: 181–95. [Google Scholar] [CrossRef]
  7. Browne, Michael W., and Robert Cudeck. 1992. Alternative ways of assessing model fit. Sociological Methods & Research 21: 230–58. [Google Scholar]
  8. Carman, James M. 1990. Consumer perceptions of service quality: An assessment of the SERVQUAL dimensions. Journal of Retailing 66: 33–66. [Google Scholar]
  9. CIA. 2018. The World Factbook—GDP Composition by Sector of Origin; Washington: The Central Intelligence Agency. Available online: https://www.cia.gov/library/publications/the-world-factbook/fields/2012.html (accessed on 1 October 2018).
  10. CPTTM. 2017. List of ISO 9001 Certified Organizations in Macau. Macao: Macao Productivity and Technology Transfer Centre, Available online: http://cms.cpttm.org.mo:8080/index.php?option=com_content&view=article&id=109&Itemid=230&lang=en (accessed on 25 December 2017).
  11. Cronin, J. Joseph, Jr., and Steven A. Taylor. 1992. Measuring service quality: A reexamination and extension. Journal of Marketing 56: 55–68. [Google Scholar] [CrossRef]
  12. Curşeu, Petru L. 2011. Intra-group conflict and teamwork quality: The moderating role of leadership styles. Administrative Sciences 1: 3–13. [Google Scholar] [CrossRef]
  13. Dabholkar, Pratibha A., Dayle I. Thorpe, and Joseph O. Rentz. 1995. A measure of service quality for retail stores: Scale development and validation. Journal of the Academy of Marketing Science 24: 3–16. [Google Scholar] [CrossRef]
  14. De Dreu, Carsten K. W., and Laurie R. Weingart. 2003. Task versus relationship conflict, team performance, and team member satisfaction: A meta-analysis. Journal of Applied Psychology 88: 741–49. [Google Scholar] [CrossRef] [PubMed]
  15. Dillman, Don A. 2007. Mail and Internet Surveys: The Tailored Design Method. New York: John Wiley. [Google Scholar]
  16. Djofack, Sidonie, and Marco Antonio Robledo Camacho. 2017. Implementation of ISO 9001 in the Spanish tourism industry. International Journal of Quality & Reliability Management 34: 18–37. [Google Scholar]
  17. Gamero, Nuria, Vicente González-Romá, and José M. Peiró. 2008. The influence of intra-team conflict on work teams’ affective climate: A longitudinal study. Journal of Occupational and Organizational Psychology 81: 47–69. [Google Scholar] [CrossRef]
  18. Garver, Michael S., and John T. Mentzer. 1999. Logistics research methods: Employing structural equation modeling to test for construct validity. Journal of Business Logistics 20: 33–57. [Google Scholar]
  19. Grandzol, John R., and Mark Gershon. 1998. A survey instrument for standardizing TQM modeling research. International Journal of Quality Science 3: 80–105. [Google Scholar] [CrossRef]
  20. Gronroos, Christian. 1984. A service quality model and its marketing implications. European Journal of Marketing 18: 36–44. [Google Scholar] [CrossRef]
  21. Gronroos, Christian. 2011. Management and Marketing: Marketing the Moment of Truth in Service Competition. Lexington: Lexington Books. [Google Scholar]
  22. Hartley, Jean. 2005. Innovation in governance and public services: Past and present. Public Money and Management 25: 27–34. [Google Scholar]
  23. ISO. 2015. Quality Management Principles. Geneva: The International Organization for Standardization, Available online: https://www.iso.org/files/live/sites/isoorg/files/archive/pdf/en/pub100080.pdf (accessed on 1 October 2018).
  24. ISO. 2018. The ISO Survey of Certifications to Management System Standard Certifications—2017. Geneva: The International Organization for Standardization, Available online: https://www.iso.org/the-iso-survey.html (accessed on 1 October 2018).
  25. Jaca, Carmen, and Evangelos Psomas. 2015. Total quality management practices and performance outcomes in Spanish service companies. Total Quality Management & Business Excellence 26: 958–70. [Google Scholar]
  26. Janis, Irving Lester. 1982. Groupthink: Psychological Studies of Foreign Policy Decisions and Fiascoes, 2nd ed. Boston: Houghton-Mifflin. [Google Scholar]
  27. Janssen, Onne, Even Van De Vliert, and Christian Veenstra. 1999. How task and person conflict shape the role of positive interdependence in management teams. Journal of Management 25: 117–41. [Google Scholar] [CrossRef]
  28. Jöreskog, Karl G., and Dag Sörbom. 1996. LISREL 8 User’s Reference Guide. Chicago: Scientific Software International. [Google Scholar]
  29. José Tarí, Juan, Iñaki Heras-Saizarbitoria, and Jorge Pereira. 2013. Internalization of quality management in service organizations. Managing Service Quality 23: 456–73. [Google Scholar] [CrossRef]
  30. Kang, Hyunjin, Bowon Kim, and Yun Shin Lee. 2017. Suppliers’ corporate ability and consumer evaluations of a manufacturer. International Journal of Services and Operations Management 27: 19–34. [Google Scholar] [CrossRef]
  31. Kim, Bowon. 2013. Competitive priorities and supply chain strategy in the fashion industry. Qualitative Market Research: An International Journal 16: 214–42. [Google Scholar] [CrossRef]
  32. Kim, Kee Young, and Dae Ryun Chang. 1995. Global quality management: A research focus. Decision Sciences 26: 561–68. [Google Scholar] [CrossRef]
  33. Kim, Bowon, Jaisok Shim, and Jongjoo Kim. 2001. Managers’ quality and performance perceptions: The case of the Korean semiconductor industry. Total Quality Management 12: 643–55. [Google Scholar] [CrossRef]
  34. Kim, Seungkyum, Changho Son, Byungun Yoon, and Yongtae Park. 2015. Development of an Innovation Model Based on a Service-Oriented Product Service System (PSS). Sustainability 7: 14427–49. [Google Scholar] [CrossRef]
  35. Kumar, Mukesh, K. Sukumaran Sujit, and Vincent Charles. 2018. Deriving managerial implications through SERVQUAL gap elasticity in UAE banking. International Journal of Quality & Reliability Management 35: 940–64. [Google Scholar]
  36. Lashley, Conrad. 2012. Empowerment: HR Strategies for Service Excellence. New York: Routledge. [Google Scholar]
  37. Lee, Peter K. C., Wai Ming To, and Billy T. W. Yu. 2009. The implementation and performance outcomes of ISO 9000 in service organizations: An empirical taxonomy. International Journal of Quality & Reliability Management 26: 646–62. [Google Scholar]
  38. Parasuraman, Anantharanthan, Valarie A. Zeithaml, and Leonard L. Berry. 1985. A conceptual model of service quality and its implications for future research. Journal of Marketing 49: 41–50. [Google Scholar] [CrossRef]
  39. Parasuraman, Anantharanthan, Valarie A. Zeithaml, and Leonard L. Berry. 1988. SERVQUAL: A multiple-item scale for measuring consumer perceptions of service quality. Journal of Retailing 64: 12–40. [Google Scholar]
  40. Podsakoff, Philip M., and Dennis W. Organ. 1986. Self-reports in organizational research: Problems and prospects. Journal of Management 12: 531–44. [Google Scholar] [CrossRef]
  41. Prajogo, Daniel I., Peggy McDermott, and Mark Goh. 2008. Impact of value chain activities on quality and innovation. International Journal of Operations & Production Management 28: 615–35. [Google Scholar]
  42. Ramanathan, Usha, Sandar Win, and Andreas Wien. 2018. A SERVQUAL approach to identifying the influences of service quality on leasing market segment in the German financial sector. Benchmarking: An International Journal 25: 1935–55. [Google Scholar] [CrossRef]
  43. Stamenkov, Gjoko, and Zamir Dika. 2015. A sustainable e-service quality model. Journal of Service Theory and Practice 25: 414–42. [Google Scholar] [CrossRef]
  44. Talib, Faisal, and Zillur Rahman. 2010. Critical success factors of TQM in service organizations: A proposed model. Services Marketing Quarterly 31: 363–80. [Google Scholar] [CrossRef]
  45. Tjosvold, Dean, Kenneth S. Law, and Haifa Sun. 2006. Effectiveness of Chinese teams: The role of conflict types and conflict management approaches. Management and Organization Review 2: 231–52. [Google Scholar] [CrossRef] [Green Version]
  46. To, Wai Ming, Peter K. C. Lee, and Billy T. W. Yu. 2011. ISO 9001: 2000 implementation in the public sector: A survey in Macao SAR, the People’s Republic of China. TQM Journal 23: 59–72. [Google Scholar] [CrossRef]
  47. To, Wai Ming, Joyce F. Y. Tam, and Millissa F. Y. Cheung. 2013. Explore how Chinese consumers evaluate retail service quality and satisfaction. Service Business 7: 121–42. [Google Scholar] [CrossRef]
  48. To, Wai Ming, Ernest F. Martin Jr., and Billy T. W. Yu. 2015. Effect of management commitment to internal marketing on employee work attitude. International Journal of Hospitality Management 45: 14–21. [Google Scholar] [CrossRef]
  49. Wang, Cheng-Hua, Kuan-Yu Chen, and Shiu-Chun Chen. 2012. Total quality management, market orientation and hotel performance: The moderating effects of external environmental factors. International Journal of Hospitality Management 31: 119–29. [Google Scholar] [CrossRef]
  50. Wang, Chung-Jen, Huei-Ting Tsai, and Ming-Tien Tsai. 2014. Linking transformational leadership and employee creativity in the hospitality industry: The influences of creative role identity, creative self-efficacy, and job complexity. Tourism Management 40: 79–89. [Google Scholar] [CrossRef]
  51. Woodall, William H. 2000. Controversies and contradictions in statistical process control. Journal of Quality Technology 32: 341–50. [Google Scholar] [CrossRef]
  52. Wu, Kewen, Julita Vassileva, Qinghua Zhu, Hui Fang, and Xiaojie Tan. 2013. Supporting group collaboration in Wiki by increasing the awareness of task conflict. Aslib Proceedings: New Information Perspectives 65: 581–604. [Google Scholar] [CrossRef]
  53. Yee, Rachel W. Y., Peter K. C. Lee, Andy C. L. Yeung, and Edwin T. C. Cheng. 2013. The relationships among leadership, goal orientation, and service quality in high-contact service industries: An empirical study. International Journal of Production Economics 141: 452–64. [Google Scholar] [CrossRef]
  54. Yu, Billy T. W., Wai Ming To, and Peter K. C. Lee. 2012. Quality management framework for public management decision making. Management Decision 50: 420–38. [Google Scholar] [CrossRef]
  55. Zhao, Xiande, Barbara B. Flynn, and Aleda V. Roth. 2006. Decision sciences research in China: A critical review and research agenda—Foundations and overview. Decision Sciences 37: 451–96. [Google Scholar] [CrossRef]
Figure 1. Theoretical model of QMS and effect of task conflict on QMS.
Admsci 08 00073 g001
Table 1. Profile of respondents’ demographic characteristics.
VariableClassN%VariableClassN%
Gender:Male25651.7Work Exp.:<2 years8316.8
Female23948.3 2 to <4 years8717.6
Age:20–2919138.6 4 to <6 years8617.4
30–3916032.3 6 to <8 years479.5
40–4910831.8 8 years or above19238.8
50 or above367.3Industry:Hospitality5010.1
Education:High school9018.2 Retailing377.5
Bachelor28858.2 Banking & Fin.7014.1
Masters5911.9 Public services15631.5
Others5811.7 Others18236.8
Position:Frontline19238.8
Supporting15230.7ISO9001Yes42786.2
Admin.8517.2certified firmNo6813.8
Management6613.3
Table 2. Assessment of internal consistency.
FactorItemFLCR
LeadershipManagement establishes a clear vision of the organization’s future.0.640.76
Management creates shared values at all values.0.73
Management provides people with the required resources.0.66
Management provides people with the required training.0.61
Engagement of peopleEmployees do not blame others for problems.0.610.72
Employees accept responsibility for solving problems.0.64
Employees seek opportunities to enhance their competence.0.59
Employees share knowledge openly.0.65
Customer focusThe firm analyzes customer needs.0.660.78
The firm publicizes customer needs to all employees.0.65
The firm measures customer satisfaction periodically.0.64
The firm acts on customer complaints/feedback.0.61
The firm has systems to manage customer relationships.0.65
Process approachThe firm establishes clear responsibility for managing key activities0.700.81
The firm measures the capability of key activities.0.80
The firm analyzes the capability of key activities.0.80
Evidence-based decision makingThe firm has a system to ensure that data are accurate and reliable.0.680.70
The firm makes data accessible to those who need it.0.63
The firm analyzes data using valid scientific methods.0.67
Relationship managementThe firm shares information with key suppliers.0.650.71
The firm encourage key suppliers to participate new service dev.0.74
The firm rewards suppliers’ contributions.0.62
Use of quality assurance toolsThe firm uses ‘standard forms’ to collect data.0.650.79
The firm uses ‘charts’ to present data.0.83
The firm uses ‘charts’ or ‘numbers’ to indicate job performance.0.76
ImprovementCustomer satisfaction has improved since the adoption of QMS.0.660.78
Customer complaints have dropped since the adoption of QMS.0.70
The firm’s image has improved since the adoption of QMS.0.70
Task conflictHow often do people you work with disagree about opinions on QMS implementation?0.690.87
How much conflict about QMS related works you do is there among people you work with?0.94
How frequently are there conflicts about QMS related ideas among people you work with?0.92
To what extent are their differences of opinions about QMS among those you work with?0.59
Note: FL stands for ‘factor loading’ while CR stands for ‘composite reliability’.
Table 3. Correlation matrix for the measurement model.
FactorLEPCFPADMRMUTI
Leadership (L)1.00
Engagement of people (EP)0.75 **1.00
Customer focus (CF)0.79 **0.69 **1.00
Process approach (PA)0.78 **0.69 **0.72 **1.00
Ev.-based decision making (DM)0.82 **0.72 **0.79 **0.72 **1.00
Relationship management (RM)0.66 **0.70 **0.59 **0.60 **0.72 **1.00
Use of quality assu. tools (UT)0.53 **0.47 **0.49 **0.51 **0.60 **0.42 **1.00
Improvement (I)0.71 **0.62 **0.66 **0.61 **0.77 **0.57 **0.49 **1.00
Task conflict (TC)−0.08−0.06−0.08−0.06−0.060.060.02−0.08
Note: ** p < 0.01.
Table 4. Hypothesis testing.
HypothesisPathStandardized Coefficientst-Value
H1(a)Leadership → Relationship management0.70611.45
H1(b)Leadership → Engagement of people0.6088.55
H1(c)Leadership → Process approach0.82813.97
H1(d)Leadership → Evidence-based decision making0.4464.41
H2(a)Customer focus → Evidence-based decision making0.3063.62
H2(b)Customer focus → Improvement0.4867.20
H3(a)Relationship management → Engagement of people0.2734.25
H3(b)Relationship management → Ev.-based decision making0.2273.90
H4Process approach → Improvement0.1923.23
H5Ev.-based decision making → Use of quality assu. tools0.61710.44
H6Use of quality assu. tools → Improvement0.1643.47
H7Task conflict → Relationship management0.1222.75

