Carbohydrate and Amino Acid Profiles of Cotton Plant Biomass Products


1
USDA-ARS, Southern Regional Research Center, 1100 Robert E Lee Blvd., New Orleans, LA 70124, USA
2
USDA-ARS, National Laboratory for Agriculture and the Environment, Ames, IA 50011, USA
3
USDA-ARS, Crop Science Research Laboratory, Mississippi State, MS 39762, USA
4
Department of Plant and Soil Sciences, Oklahoma State University, Stillwater, OK 74078, USA
5
Pontotoc Ridge-Flatwoods Branch Experiment Station, Mississippi State Univ., Pontotoc, MS 38863, USA
*
Author to whom correspondence should be addressed.
Agriculture 2020, 10(1), 2; https://0-doi-org.brum.beds.ac.uk/10.3390/agriculture10010002
Submission received: 20 November 2019
/
Revised: 12 December 2019
/
Accepted: 16 December 2019
/
Published: 18 December 2019
Abstract
:To achieve the optimal and diverse utilization of cotton (Gossypium hirsutum) plant residues in various agricultural, industrial, and environmental applications, the chemical composition of cotton biomass tissues across different plant parts (e.g., seed, boll, bur, leaves, stalk, stem, and root) is of essential information. Thus, in this work, we collected field-grown whole mature cotton plants and separated them into distinct biomass fractions including main stems, leaf blades, branches, petioles, roots, and reproductive parts (mid-season growth stage) or bur, peduncles/bract, and seed cotton (pre-defoliation stage). The contents of selected carbohydrates and amino acids in these cotton biomass materials were determined. Both essential and nonessential amino acids were enriched in cotton leaf blades and reproductive parts. The distribution pattern of the selected carbohydrates differed from that of amino acids—higher contents of carbohydrate were found in roots, main stems, and branches. Although glucose was the most abundant non-structural carbohydrate in cotton plant parts at mid-season, xylose was the most abundant in most plant parts at the pre-defoliation stage. Nutritional carbohydrates and amino acids were further accumulated in seeds at pre-defoliation. The information reported in this work would be helpful in exploring and optimizing management practices and processing strategies for utilizing cotton crop biomass materials as valuable and renewable natural resources.
1. Introduction
Cotton (Gossypium hirsutum) is one of America’s greatest value-added crops. Much of the cotton land area in the United States is located in the southern and southeastern regions [1,2,3,4]. The most valuable product of cotton crop is the lint. Recently, studies have shown that biomass materials from other parts of the cotton plant are also useful as a soil amendment, animal feed supplement, bioenergy source, and industrial raw material [5,6,7,8,9,10,11]. In addition, Kirkan et al. [12] proposed that cotton stalk could be an important alternative source of bioactive components. Fidan et al. [13] reported liquefaction of cotton stalks for use as a bio-based wood adhesive.
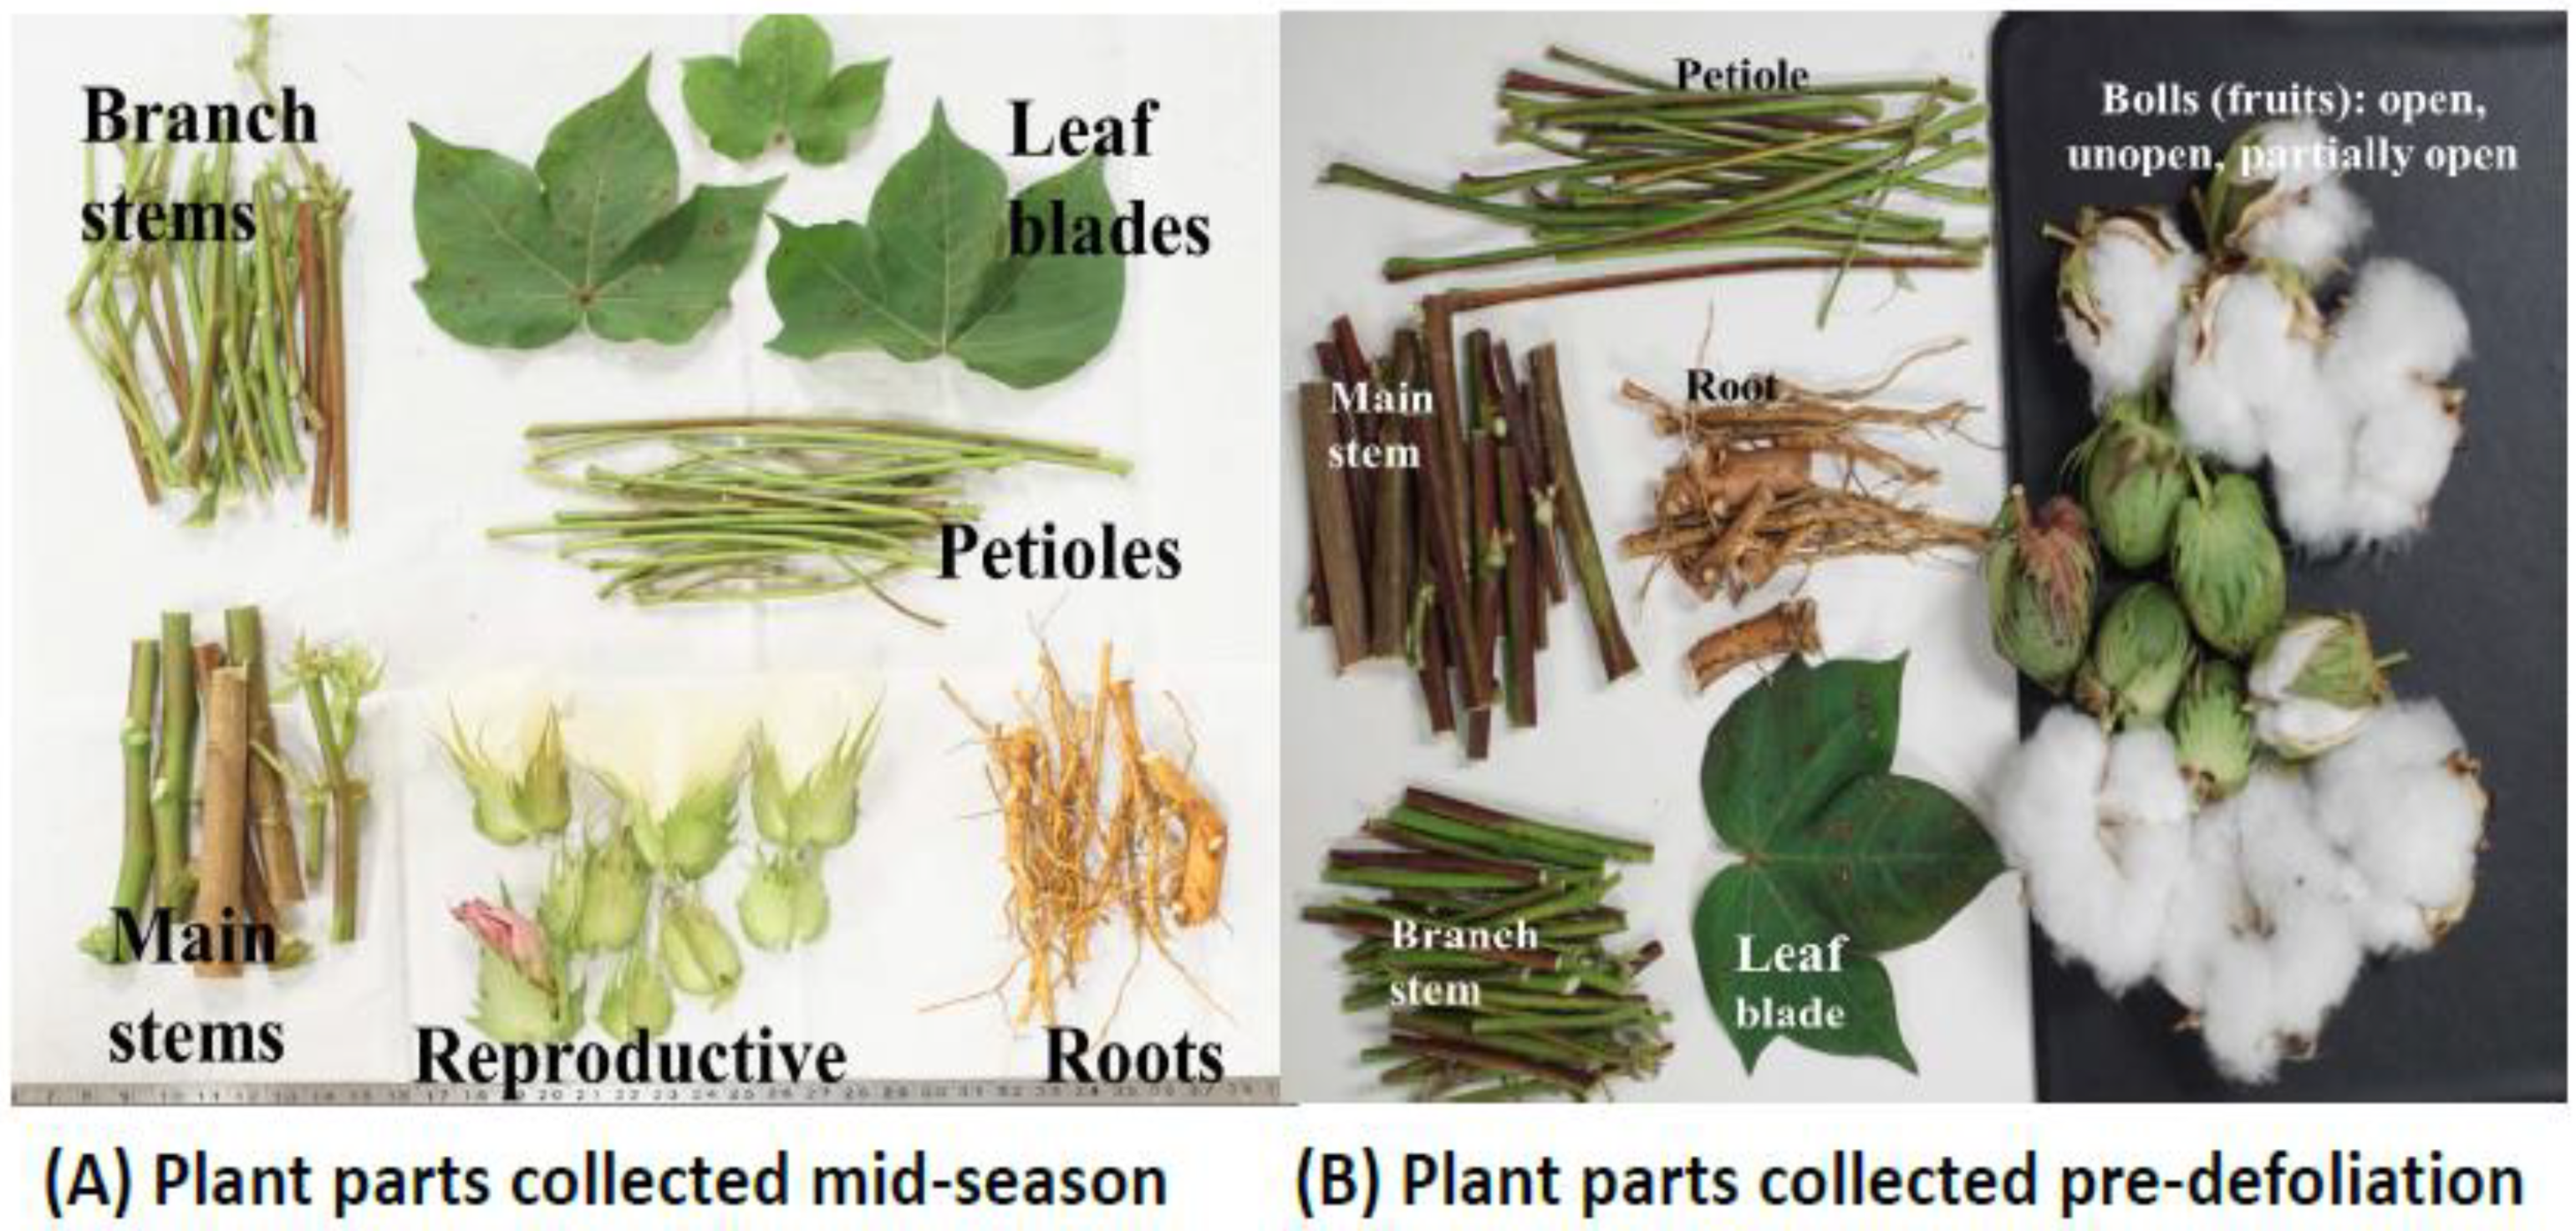
While cotton biomass has the potential to be a valuable resource, the chemical composition, in particular the distribution of some critical compounds (e.g., phenolics, fatty acids, lipids, carbohydrates, and proteins) differs in seed, boll, bur, leaves, stalk, stem, and root of the cotton plant [14]. Egbuta et al. [12] reviewed the phytochemicals associated with different parts of cotton plants (e.g., leaves, bolls, stalks, and stems) and their biological activities to promote the full exploitation of the values of cotton biomass products. Wanjura et al. [15] separated cotton crop biomass into four components: seedcotton (lint and seed), burs, sticks/stems, and other vegetative matter (OVM). They further quantified and chemically characterized these components in order to find helpful information for cotton producers and processors to maximize profitability through improved use of un-harvested biomass resources. Similarly, we [16,17] separated cotton plant biomass into six (at mid-season stage) or eight (at pre-defoliation) fractions: main stems, leaf blades, branches, petioles, roots, and reproductive parts (or bur, peduncles/bracts, and seed cotton) (Figure 1). Subsequently, the compositional features of these cotton plant biomass fractions were characterized using attenuated total reflection Fourier transform infrared (ATR FT-IR) spectroscopy and wet chemistry composition analysis. The ATR-FTIR spectra of cotton biomass fractions fell into two distinct clusters representing two types of cotton plant parts: stem cluster (main stems, roots, branches, and petioles) and leaf cluster (leaf blades, bracts, bur, and/or reproductive parts). Comparison of the ATR FT-IR data of the same plant parts collected between mid-season and pre-defoliation stages revealed the more rapid accumulation of major carbohydrate components in main stems, roots, and branches than in petioles and leaf blades. Wet chemistry data revealed lowest contents of most elements in roots and stems, but high ash and mineral contents in leaf blades and petioles in the mid and late growth phases. These data suggested that (i) main stems and branches, having less ash and minerals, were favorable for lignocellulosic feedstock and (ii) feed quality characteristics of cotton seed were comparable to those of common forage crops.
The exploitation of plant byproducts resulting from agricultural production has great appeal if viewed within the approach of circular economy and the concept of biorefinery [18]. Thus, our main idea is that cotton may provide valuable amounts of residues that require a careful characterization. Indeed, amino acids and carbohydrates are important components of plant biomass and other natural materials [19,20,21,22,23]. Previously, we explored their contents in cottonseed and its derived products [24,25]. To establish a full composition archive of cotton plant biomass, through the present study, we analyzed the amino acid and carbohydrate profiles in cotton roots, main stems, branches, petioles, leaf blades, and reproductive parts (burs, peduncles, and seeds). Therefore, the objectives of this work were (1) to document the compositional characteristics of the individual biomass components and (2) to improve the mechanistic understanding of their accumulation during plant growth and development. More detailed comparisons on the amino acid and carbohydrate profiles between mid-season and pre-harvest cotton biomass samples could be also useful in developing an effective diagnostic tool for monitoring plant biosynthesis for cotton plant physiology and for identifying management practices to grow a high-yielding crop [26,27,28]. The relevant data would also be helpful to the cotton industry in making decisions to maximize the profitability through better use of cotton biomass resources.
2. Materials and Methods
2.1. Cotton Plant Collection and Treatments
The cotton plants (variety DP 1321 B2RF) were grown at the Mississippi Agricultural and Forest Experiment Station near Pontotoc, MS (34°8′30″ N, 88°59′36″ W) and received conventional inorganic fertilizers according to recommendations of the Mississippi State University Extension Service soil testing laboratory [2]. Four to eight whole plants were collected from each plot of four replications by digging and loosening the soil to recover as much of the roots as possible. The plants were 67 days old for the mid-season (MS) samples and 99 days for the pre-defoliation (PD, which is near maturity) samples, counted from the day plants emerged from the ground, or 80 and 112 days counted from the day the cotton was planted. The plants were placed in large plastic bags and stored in a walk-in cooler (≈4 °C) until processed. The plants were cleaned and then separated into leaf blades, petioles, branch stems, main stems, and reproductive parts, and dried at 65 °C, as described in He et al. [16,17]. Table 1 summarizes the sampling parts of cotton plants at the two developmental stages of MS and PD. All samples except for cotton fibers were ground to <1 mm and kept at relative humidity of 65% ± 2% and temperature of 21 ± 2 °C prior to characterization.
2.2. Determination of Amino Acids
Ion chromatography coupled with amperometric detection was used to measure 17 proteinaceous amino acids in the cotton biomass samples [19,29]. Each sample (20 mg) was mixed with 2 mL of 4 M methanesulfonic acid (MSA) amended with 2 g L−1 tryptamine and autoclaved for 16 h at 136 °C (112 kPa). The acid extracts were titrated to pH 4 to 5 with NaOH and centrifuged to remove precipitates. Aliquots of the supernatants were diluted properly with deionized water. Concentrations of amino acids were measured using cation exchange chromatography followed by ninhydrin derivatization and measurement of visible light absorption through an Agilent 1100 high performance liquid chromatogram instrument (Agilent Technologies, Santa Clara, CA, USA) attached to a Pinnacle PCX system (Pickering Laboratories, Mountain View, CA, USA).
2.3. Determination of Carbohydrates
Seven carbohydrates (i.e., fucose, arabinose, rhamnose, galactose, glucose, xylose, and mannose) were measured in these samples using anion chromatography techniques [25,30]. Specifically, 100 mg of cotton biomass were thoroughly mixed with 800 μL of 6 M H2SO4 and incubated for 30 min at room temperature. After dilution to 1 M H2SO4 with deionized water, the solution was autoclaved for 30 min at 121 °C and then centrifuged. The supernatant containing the weak acid-extractable carbohydrates was adjusted to pH 5.5–6.5 with NaOH, diluted, and analyzed using a Dionex ICS-5000 anion chromatography (Thermo Scientific, Waltham, MA, USA) equipped with a CarboPac PA-10 column (2 mm diameter × 250 mm length). All carbohydrates were detected with triple-pulsed amperometry. The strong acid extractable glucose was isolated from the dried residue from the weaker acid extraction using 300 μL of 18 M H2SO4, which was then diluted to 1.5 M after sitting for 30 min, followed by autoclaving, pH adjustment, and dilution similar to the amino acid analysis.
These samples had previously been determined for acid detergent fiber (ADF), neutral detergent fiber (NDF), and acid detergent lignin (ADL) using an Ankom Fiber Analyzer (Ankom Technology, Macedon, NY, USA), and the results were reported elsewhere [17]. In this work, the data of cellulose and hemicellulose were computed from the difference in contents between ADF and ADL, and that between NDF and ADF, respectively [31].
2.4. Data Treatment and Statiscal Analysis
The data analysis package in Microsoft Excel 2007 was used for statistical analysis. The Descriptive Statistics Tool Data was used to calculate means and standard errors of quadruplicate field samples. The Correlation Analysis Tool was used to analyze correlation coefficients between the data sets of different parameters.
3. Results and Discussion
3.1. Carbohydrate Profiles
Contents of seven carbohydrates for each plant part are listed for both sampling times (at different cotton growth stages) in Table 1. Glucose and xylose were the major carbohydrates, with little fucose present in these cotton biomass parts. Glucose concentrations in all five plant parts decreased with advancement of growth stage. The observation seemed reasonable as the biosynthetic activity should have decreased in the matured plants as the portion of glucose was composed of some “true” biosynthetic monomer intermediates with some contributions derived from complicated matrices (e.g., cellulose). Xylose was rich in all plant parts except leaf blades, with concentrations increasing at the more advanced growth stage. Galactose and arabinose were moderate in content, showing changes from high in leaf blades to low in roots. Contents of galactose and mannose also increased consistently with the growth stage in all five parts, but to a lesser extent than those of xylose. The relative abundances of these carbohydrates were similar to those of harvested cottonseed and other agricultural crop products and byproducts [20,25].
We further analyzed the contents of carbohydrates in cotton reproductive parts in the MS and PD phases (Figure 2). In this analysis, the lint (fiber) was separated from the cottonseed at PD but not analyzed because it is cellulose-based [16]. The content of glucose in the reproductive parts was higher at MS than at PD (Figure 2). In contrast, the content of xylose in reproductive parts was lower at MS than at PD. Martins et al. [32] measured the contents of carbohydrates of roots and aboveground materials collected at the full flowering stage for nine plant species (soybean, corn, common bean, pearl millet, grain sorghum, pigeon pea, sunn hemp, sunflower, and oilseed radish). They found that plant biomass of the Poaceae species (corn, pearl millet, and sorghum) was enriched in pentoses relative to the other plant species. The highest glucose content was in the roots and aboveground plant materials of the Poaceae species (corn, pearl millet, grain sorghum, and rice) and sunn hemp. Xylose was the second most abundant monosaccharide, and its content was markedly higher in the aboveground parts of the Poaceae than in the dicots plants beans, pigeon pea, sunn hemp, sunflower, and oilseed radish in the study. Overall, the xylose content of the roots was higher than that of the aboveground plant materials. The third most abundant monosaccharide in the aboveground plant biomass and roots of the Poaceae species and sunn hemp was arabinose, whereas it was mannose in the pigeon pea and galactose in soybean, bean, sunflower, and oilseed radish. Fucose and rhamnose were minor carbohydrates in these plants. In spite of the differences in the specific amounts (e.g., more abundant arabinose in Martinz et al. [32] than in this study), the trend of our cotton biomass at mid-season was similar to these plants. At the PD stage, xylose (not glucose) became the most abundant in cotton roots and all aboveground parts other than leaf blades. Indeed, there is no statistically significant difference in the xylose content between the two boll components PD-bur and PD-cottonseed per ANOVA analysis (p > 0.05).
The ratio of GM/AX ((galactose + mannose)/(arabinose + xylose)) ranged from 0.14 to 1.15 (Table 1). The general order of the ratio is leaf blades > petioles > branches > main stems > roots. However, there were substantial differences in the three values among the last three biomass parts. At the later crop growth stage, the value decreased with root samples from 0.26 to 0.14. In contrast, the ratio increased with leaf blades from 0.89 to 1.15. The ratio of the reproductive parts at mid-season was close to that of leaf blade, whereas it decreased at the late growth phase. This information may have some impacts on the utilization of these biomass products. For example, gin trash mainly comprises cotton leaves and stems with some seed cotton residues [33]. The much higher GM/AX ratio of leaf blade than other biomass products in gin trash may have little impact on biochar products [33]. However, separating leaves from other plant parts may be helpful for extraction of more homogenous sugars from cotton gin trash [34,35].
As carbohydrates containing the two hexoses (galactose and mannose) are synthesized predominantly by microorganisms, whereas the two pentoses (arabinose and xylose) are synthesized predominantly by plants, the GM/AX ratio has been used widely to infer the relative contributions of microbial versus plant C contributions to soil C [32,36,37]. However, plant species, as well as their biomass parts within the same species, differ in the amounts and composition of carbohydrates, which can affect the final soil carbohydrate composition. In their study of carbohydrate composition and water-stable aggregation of an Oxisol, Martinz et al. [32] reported higher soil GM/AX ratios under oilseed radish and sunn hemp than under the three Poaceae species (corn, grain sorghum, and pearl millet) in winter crop sequences. With the hypothesis that a lower GM/AX ratio implies higher recalcitrance of residues [32], the GM/AX data in Table 1 suggested the persistence of cotton plant-derived carbohydrates in soil would be in the order of roots ≥ main stems ≈ branches > petioles > leaf blades.
3.2. Structural Carbohydrate Profiles
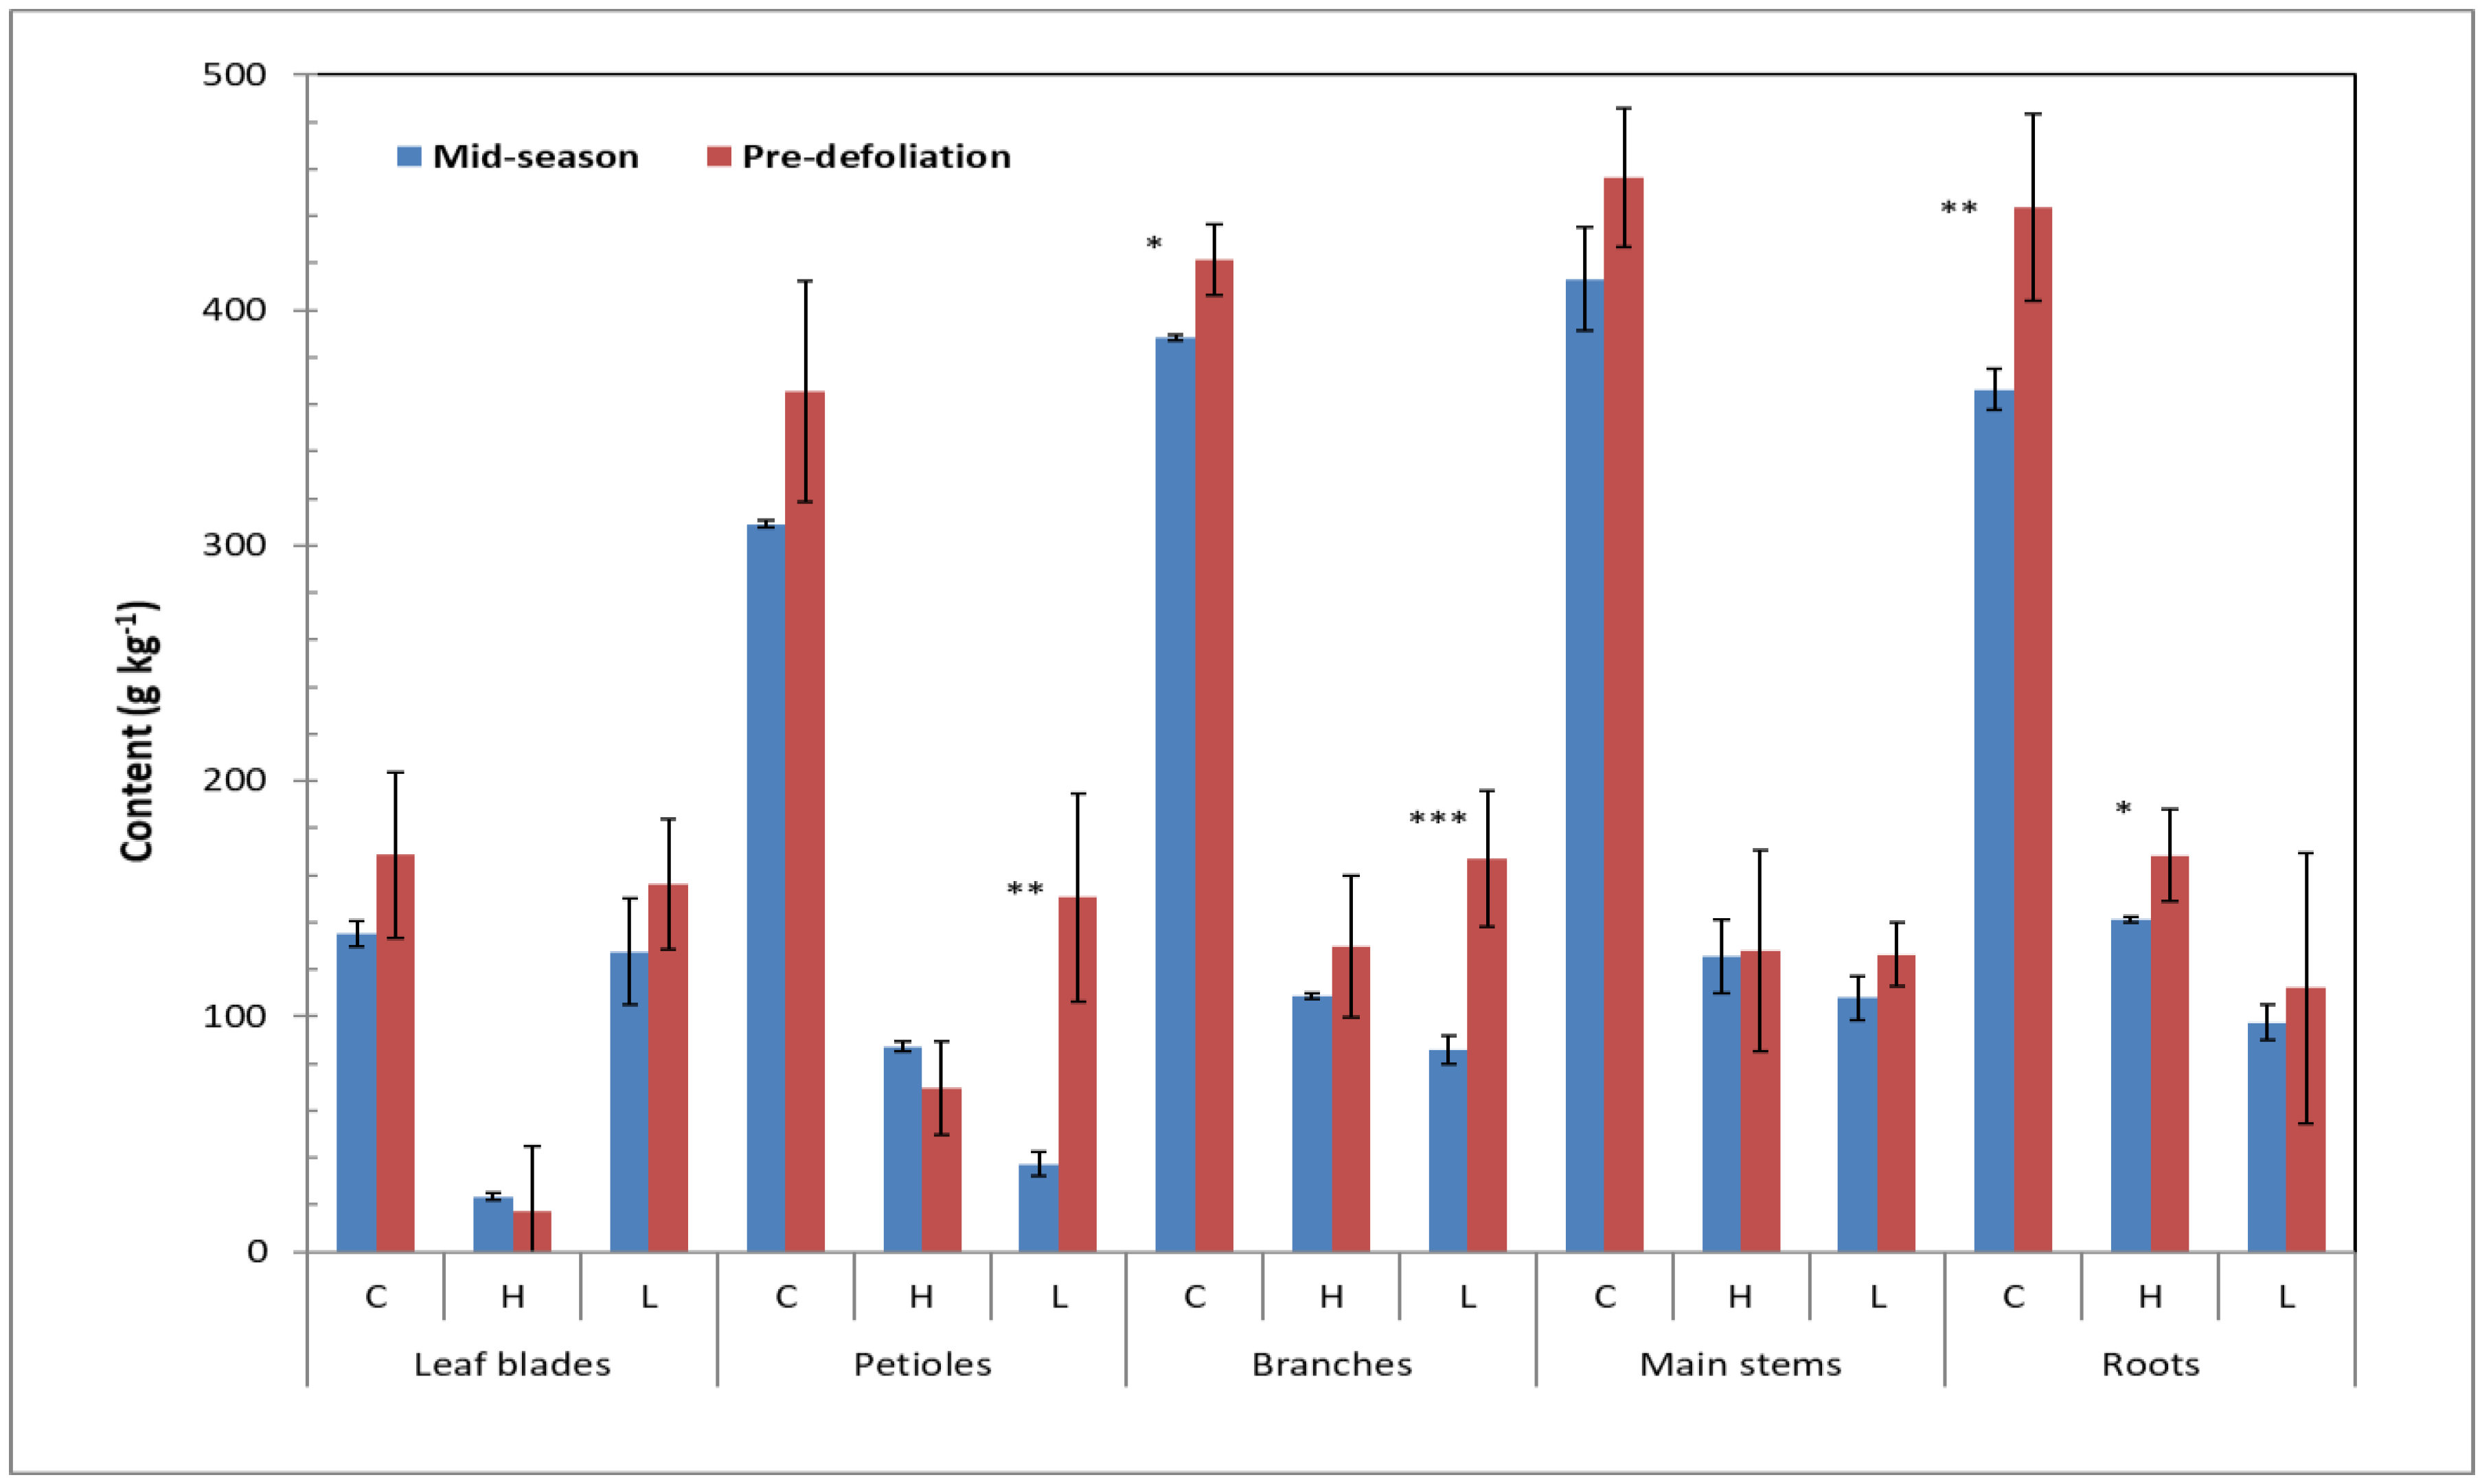
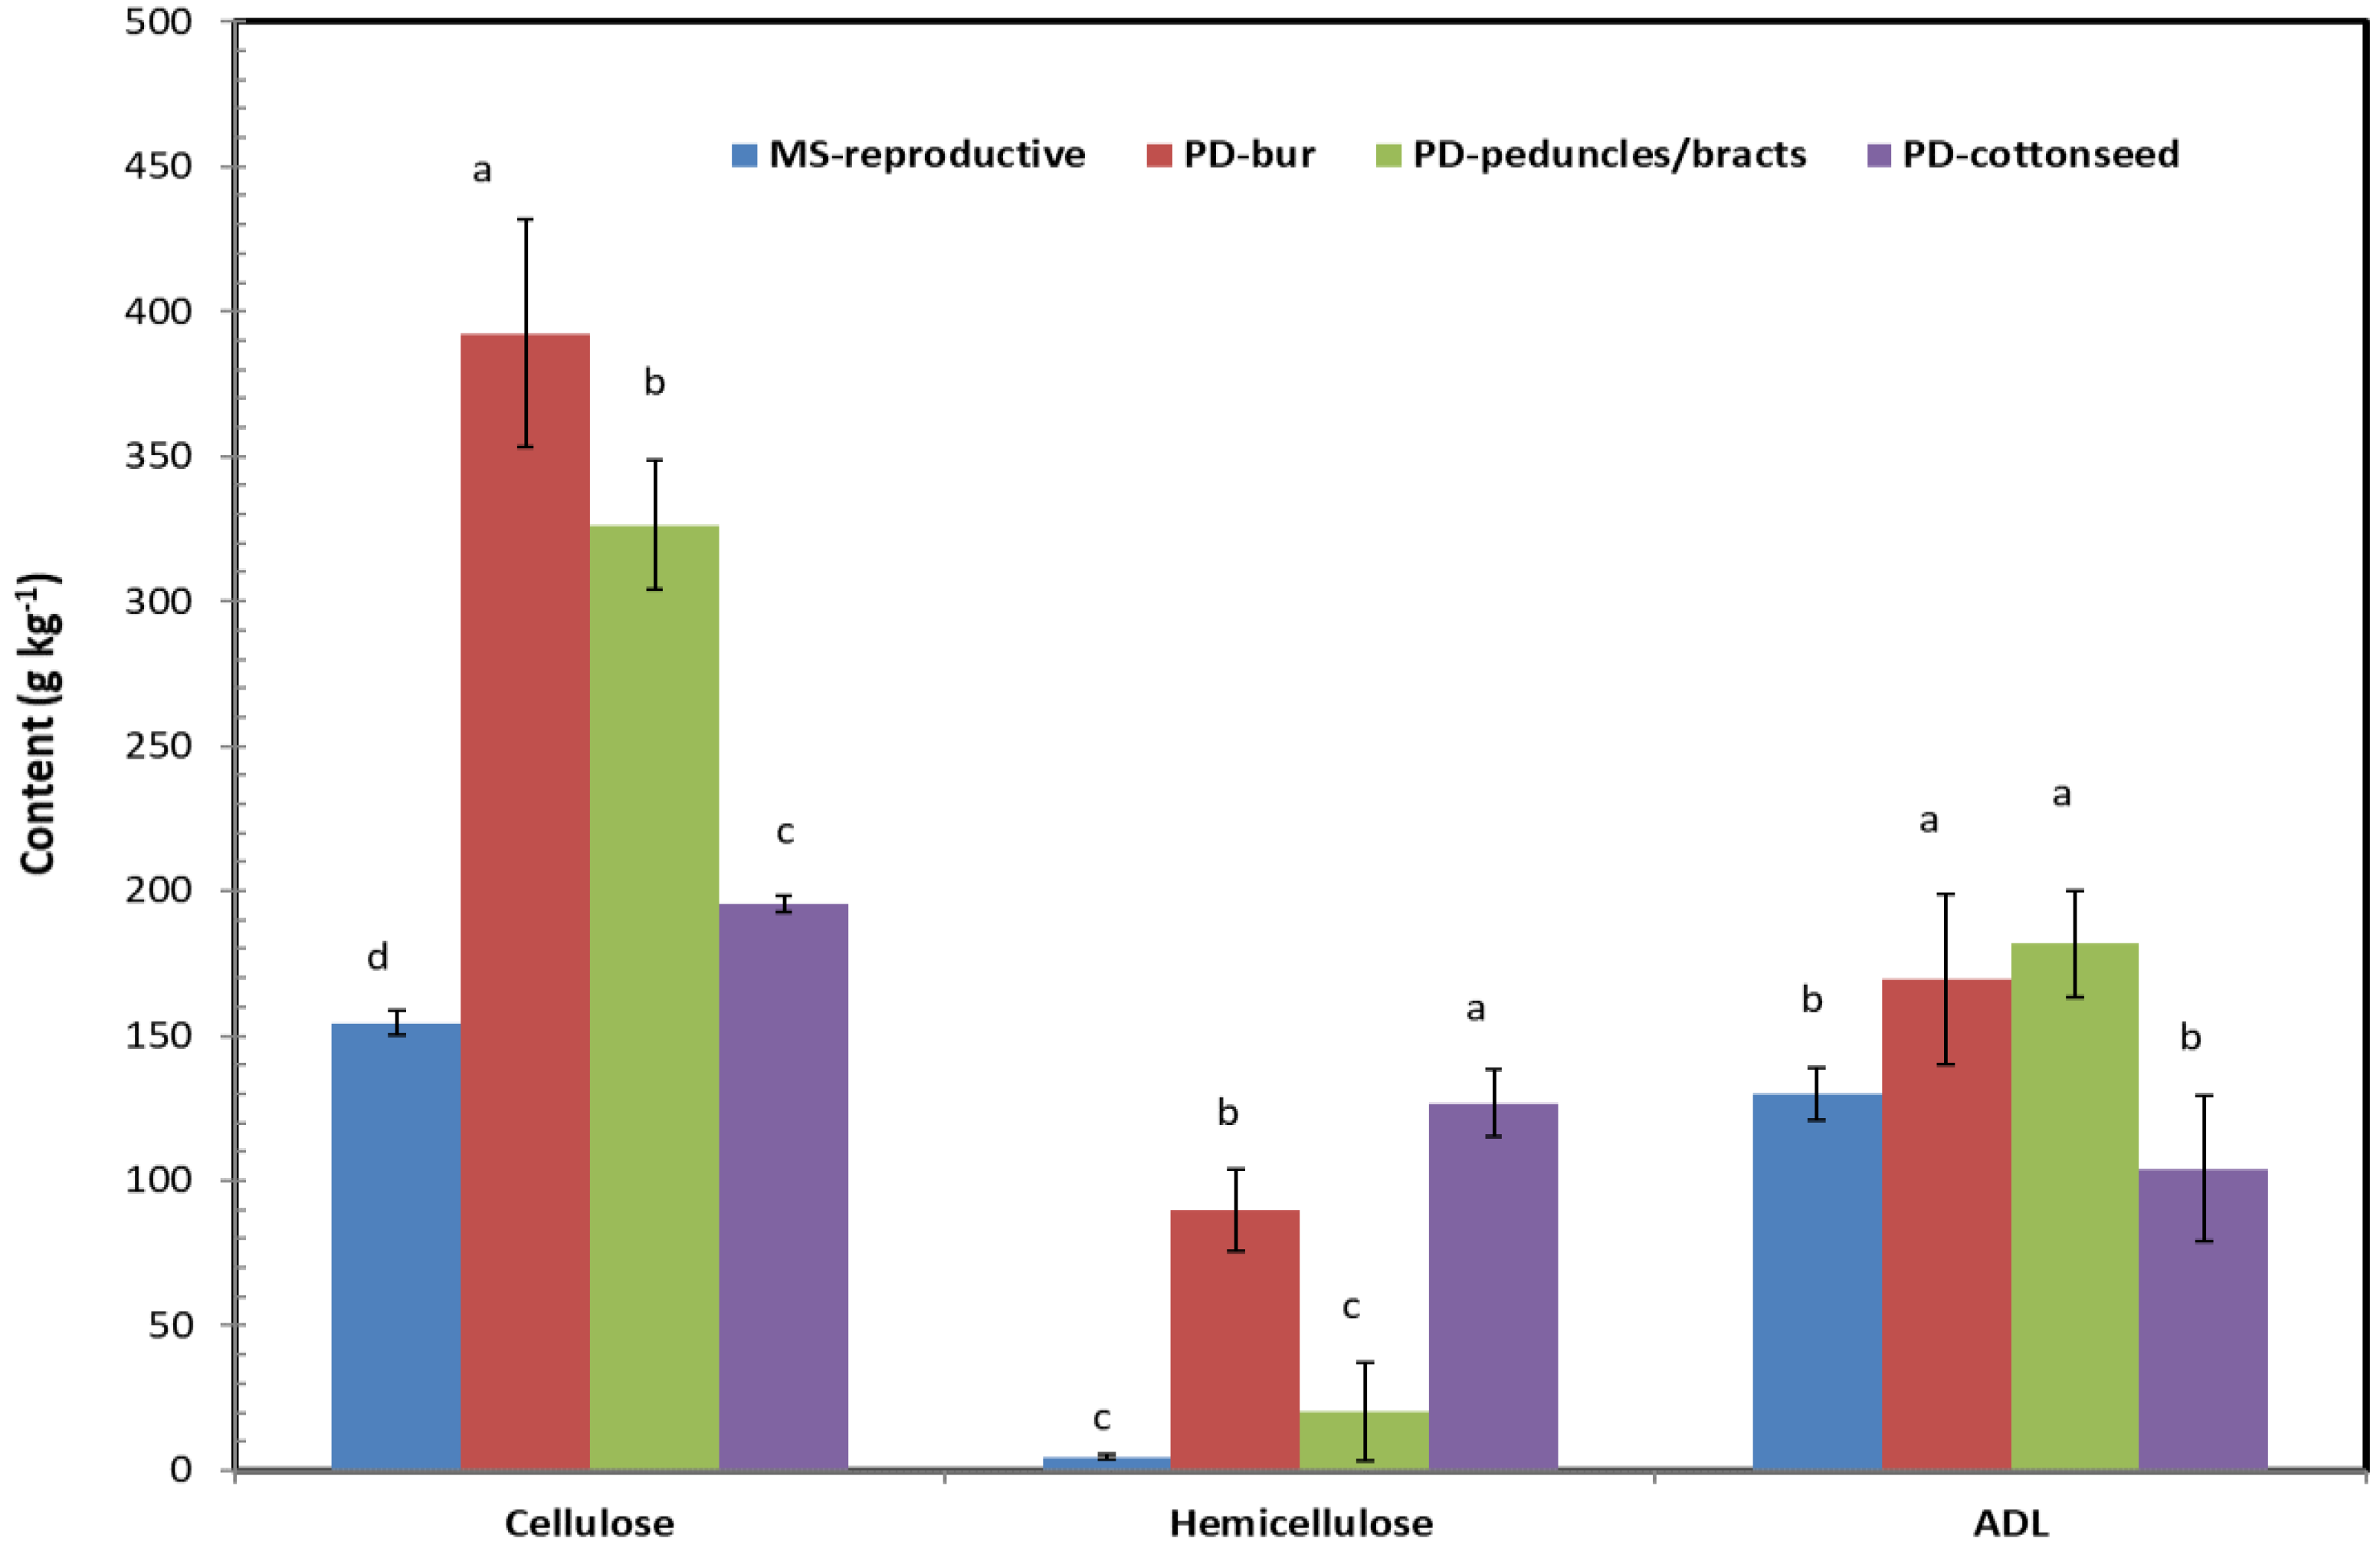
As the structural carbohydrates of the plant cell wall are mainly composed of cellulose, hemicellulose, and lignin, we measured hemicellulose, cellulose, and acid detergent lignin in these cotton plant biomass samples (Figure 3 and Figure 4). The general order of content was cellulose > lignin ≥ hemicellulose with means of 324.0, 125.2, and 88.6 g kg−1 (or 32.4%, 12.5%, and 8.9%) of dry matter, respectively. These findings are consistent with those found in the literature. For example, Keshav et al. [38] reported that cellulose, hemicellulose, and lignin accounted for 40.1%, 13.6%, and 29.4% of their dry cotton stalk samples. Binod et al. [33] reported 30% cellulose, 13% hemicellulose, and 31% lignin in their cotton plant biomass waste (whole plant waste without leaves after harvesting the cotton). However, our data provide additional insight on the distribution of these structural carbohydrates within specific cotton biomass parts. The contents of cellulose and hemicellulose are lower in leaf blades than in other plant parts. The content of acid detergent lignin is at the same level in all plant parts except petioles at the MS stage. The contents of cellulose in cotton plant biomass increased with the growth season. Increase of lignin with growth was high in petioles and branches, but not apparent in other parts. Hemicellulose basically remained the same at both growth stages. In the reproductive parts, the contents of cellulose and hemicellulose were lower at MS than at PD. On the other hand, the lint (fiber) part of the cotton boll was separated but not analyzed for the pre-defoliation sample, and the content of cellulose was lower in cottonseed and the content of hemicellulose was lower in peduncles/bracts when compared to burs and cottonseed. In crop productivity research, Amthor [39] reported that synthesis of lignin via the tyrisine route instead of the phenylalanine route could substantially reduce growth respiration for the lignin fraction of biomass. As a high lignin crop, cotton plant is one of the target crops for altered lignin pathway for increasing the production value (i.e., gram of lignin produced per gram of sugar substrates consumed) [26]. The detailed information on the lignin content in the different biomass parts in the two growth phases presented in this work would be helpful in appropriate monitoring and comparison of the lignin production in such studies.
Hemicellulose produced by dicotyledonous plants is mainly composed of xyloglucan, whereas hemicellulose from monocot Poaceae species is mainly composed of arabinoxylans and β-glucans [40,41]. Xylose and arabinose are the components of cotton plant hemicellulose [42]. Thus, to clarify the relationships among the carbohydrates in cotton (a dicotiledonous malvaceae), we calculated the correlation coefficients (Table 2) of the 14 sets of all carbohydrate data in Figure 1, Figure 2 and Figure 3 and Table 1. The results showed that five carbohydrates (i.e., fucose, rhamnose, arabinose, galactose, and mannose) were significantly (p < 0.05) positively correlated. Glucose and xylose were two independent components, not significantly (p > 0.05) correlated to other monomeric carbohydrates. Glucose and lignin were not significantly (p > 0.05) correlated to other carbohydrates, but the two were negatively correlated with each other. Xylose was positively correlated to both cellulose and hemicellulose, indicating that xylose was a major component of the two structural carbohydrates. On the other hand, no significant (p > 0.05) correlation was observed between hemicellulose and arabinose, implying that the hemicellulose polymer contains a chain of xylose units that is variably substituted with arabinose residues. This observation needs further exploration, as the variation would influence the water solubility of the carbohydrates and their interaction with cellulose and lignin, and thus may impact the enzymatic degradation in soil or in industrial processing [32,43].
It is notable that cellulose contents in many samples were quite high (Figure 3 and Figure 4) whereas their levels of glucose were very low (Table 1 and Figure 2). On the other hand, high xylose levels were observed (Table 1 and Figure 2) whereas the hemicellulose was low in some samples (Figure 3 and Figure 4). These observations seemed contradictory with the knowledge that cellulose is a complex polymer containing glucose, and that xylose is delivered from hemicellulose. In addition to experimental errors, we hypothesized the methodologies used for their measurement also attributed to differences. One example was the 6 M H2SO4 used for carbohydrate extraction unable to hydrolyze and extract all glucose components in complicated matrices. Thus, we adopted an additional 18 H2SO4 treatment step to extract the glucose from the residual part after the 6 M H2SO4 extraction. Remarkable content of strong acid extractable glucose was observed in majority of these samples (Table 3). In fact, in some samples, there was more glucose extracted by the stronger acid treatment than the first step of weaker 6 M acid extraction.
3.3. Amino Acid Profiles
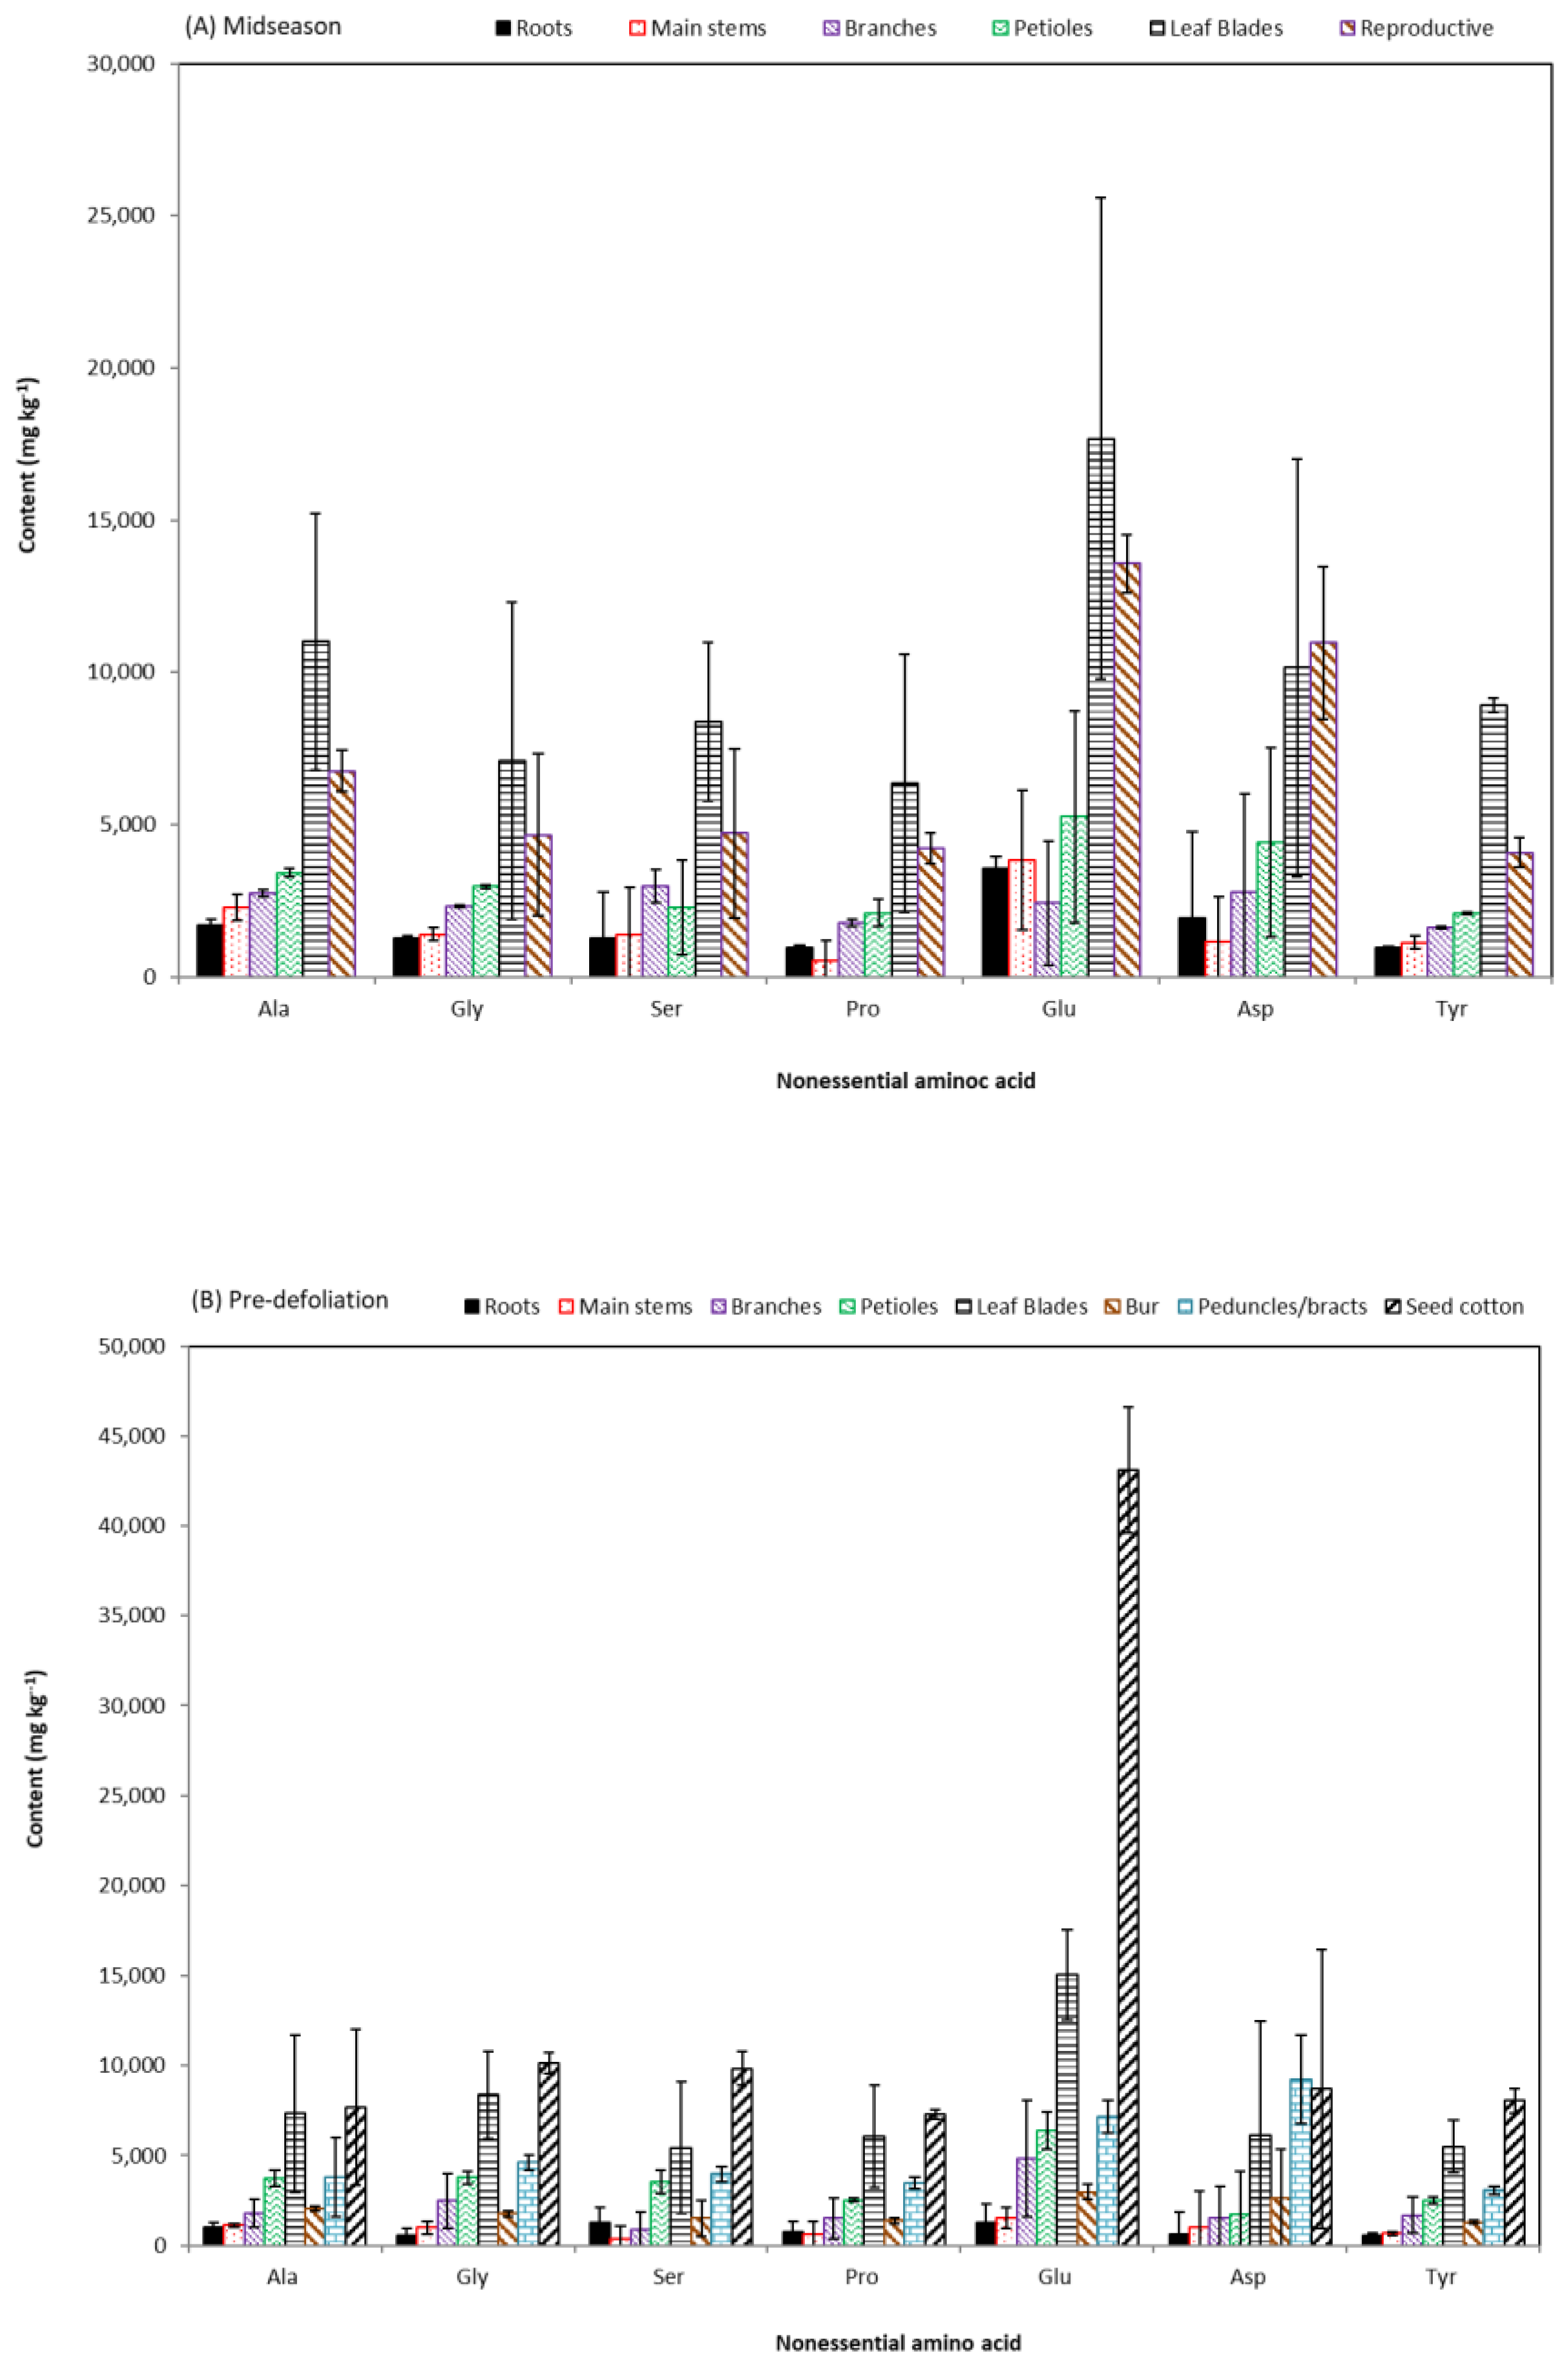
The average content and standard deviations (n = 4) of essential amino acids and non-essential amino acids are shown in Figure 5 and Figure 6, respectively. These data show that leucine (Leu), lysine (Lys), phenylalanine (Phe), and arginine (Arg) are major essential amino acids with contents >10 g kg−1 each. All biomass parts had similar orders in relative abundances of the 10 essential amino acids and of the 7 non-essential amino acids, similar to those of cottonseed [24,44] and biomass of other plant species [19,45]. The highest total content of both essential and non-essential amino acids were in leaf blades and reproductive biomass samples. At the MS stage, total content of amino acids in leaf blades were greater than those in reproductive parts. Total amino acids increased in the reproductive parts with advanced growth, leading to higher total content of amino acids in seed cotton than in leaf blade at the PD stage. To improve accessibility and conservation of nutrients of poultry litter in cotton fields, Tewolde et al. [28] measured plant nutrients including nitrogen in leaves, stems, petioles, and reproductive parts during growth. In the current work, amino acid profiles in more cotton biomass parts were presented. Per our observations, it seems unnecessary to track the nutrient levels in all biomass parts—nutrient values in petioles and leaf blades would be good enough to provide the “diagnostic" information for better nutrient management. Although extensive root system establishment is critical in the early stage of cotton growth [27], the low levels of nutrients in root part eliminated it as a applicable diagostic parameter. Our observations would also be helpful in the research effort of correlating and confirming plant quick nitrogen indices with soil/fertilization nitrogen utilization potential [27,46] as nitrogen is mainly in the protein parts (i.e., amino acid polymers).
In addition, Wanjura et al. [15] proposed that the cotton stem and bur should be more favorable as feedstock for biofuel or bio-based composite production due to their high carbohydrate content, and other vegetative matter is better used for soil amendment and animal feed for nutrient application. Our data in amino acids and feed quality [17] seemed to support this proposal. These data also implied that amino acid-enriched cottonseed byproduct would be a good feedstock of fermentation or pyrolysis for producing industrial interested N-containing compounds [7,47].
4. Conclusions
Exploitation of plant byproducts has great appeal for a sustainable economy and the concept of biorefinery. For such purposes, this work analyzed the inherent amino acid and carbohydrate profiles in cotton roots, main stems, branches, petioles, leaf blades, and reproductive parts (burs, peduncles, and seeds) sampled at the mid-season and pre-defoliation growth stages. The produced data documented the compositional characteristics of the individual cotton biomass components, showing some differences in the two profiles between these biomass parts, as well as between the same parts collected in the two growth phases. These observations confirmed that cotton byproducts might provide valuable amounts of residues but require a careful characterization for appropriate utilizations. In addition, our observations would also be helpful in future research efforts in terms of monitoring and correlating plant quick indices or “diagnosing” parameters with soil/fertilizer nutrient utilization potentials.
Author Contributions
Z.H. conceived and designed the project, analyzed the data, and wrote the manuscript. D.C.O. determined the contents of carbohydrate and amino acids, and assisted in data interpretation. H.T. designed the fieldwork, collected the samples, and assisted in data interpretation. H.Z. determined the contents of structural carbohydrates. M.S. managed the farm and cropping systems. All authors reviewed the manuscript and contributed to improving the quality of this paper. All authors have read and agreed to the published version of the manuscript.
Funding
This research received no external funding.
Acknowledgments
We sincerely thank three anonymous reviewers for their constructive comments on the manuscript. The mention of trade or manufacturer names is made for information only and does not imply an endorsement, recommendation, or exclusion by the United States Department of Agriculture (USDA) Agricultural Research Service. The USDA is an equal opportunity provider and employer.
Conflicts of Interest
The authors declare no conflict of interest.
References
- He, Z.; Shankle, M.; Zhang, H.; Way, T.R.; Tewolde, H.; Uchimiya, M. Mineral composition of cottonseed is affected by fertilization management practices. Agron. J. 2013, 105, 341–350. [Google Scholar] [CrossRef] [Green Version]
- Tewolde, H.; Shankle, M.W.; Way, T.R.; Adeli, A.; Brooks, J.P.; He, Z. Enhancing management of fall-applied poultry litter with cover crop and subsurface band placement in no-till cotton. Agron. J. 2015, 107, 449–458. [Google Scholar] [CrossRef]
- Mahan, J.; Payton, P. Design and implementation of a rainfed matrix for cotton. Agriculture 2018, 8, 193. [Google Scholar] [CrossRef] [Green Version]
- Mauget, S.; Ulloa, M.; Dever, J. Planting date effects on cotton lint yield and fiber quality in the U.S. Southern High Plains. Agriculture 2019, 9, 82. [Google Scholar] [CrossRef] [Green Version]
- He, Z.; Cheng, H.N.; Chapital, D.C.; Dowd, M.K. Sequential fractionation of cottonseed meal to improve its wood adhesive properties. J. Am. Oil Chem. Soc. 2014, 91, 151–158. [Google Scholar] [CrossRef]
- He, Z.; Uchimiya, S.M.; Guo, M. Production and characterization of biochar from agricultural by-products: Overview and use of cotton biomass residues. In Agricultural and Environmental Applications of Biochar: Advances and Barriers; Guo, M., He, Z., Uchimiya, S.M., Eds.; Soil Science Society of America, Inc.: Madison, WI, USA, 2016; pp. 63–86. [Google Scholar] [CrossRef]
- He, Z.; Guo, M.; Sleighter, R.L.; Zhang, H.; Fortier, C.A.; Hatcher, P.G. Characterization of defatted cottonseed meal-derived pyrolysis bio-oil by ultrahigh resolution electrospray ionization Fourier transform ion cyclotron resonance mass spectrometry. J. Anal. Appl. Pyrol. 2018, 136, 96–106. [Google Scholar] [CrossRef]
- Ren, J.; Li, N.; Li, L.; An, J.-K.; Zhao, L.; Ren, N.-Q. Granulation and ferric oxides loading enable biochar derived from cotton stalk to remove phosphate from water. Bioresour. Technol. 2015, 178, 119–125. [Google Scholar] [CrossRef]
- Kutlu, O.; Kocar, G. Upgrading lignocellulosic waste to fuel by torrefaction: Characterisation and process optimization by response surface methodology. Int. J. Energy Res. 2018, 42, 4746–4760. [Google Scholar] [CrossRef]
- Al Afif, R.; Anayah, S.S.; Pfeifer, C. Batch pyrolysis of cotton stalks for evaluation of biochar energy potential. Renew. Energy 2020, 147, 2250–2258. [Google Scholar] [CrossRef] [Green Version]
- Zubair, M.; Latif, A.; Rao, A.Q.; Azam, S.; Shahid, N.; Samiullah, T.R.; Yasmeen, A.; Shahid, A.A.; Nasir, I.A.; Husnain, T. A combinational approach of enhanced methanol production and double Bt genes for broad spectrum insect resistance in transgenic cotton. Mol. Biotechnol. 2019, 61, 663–673. [Google Scholar] [CrossRef]
- Kirkan, B.; Sarikurkcu, C.; Copuroglu, M.; Cengiz, M.; Tepe, B. Is it possible to use the stalks of Gossypium hirsitum L., an important by-product of cotton cultivation, as an alternative source of bioactive components? Eur. Food Res. Technol. 2018, 244, 1065–1071. [Google Scholar] [CrossRef]
- Fidan, M.S.; Alma, M.H.; Bektas, I. Liquefacation of cotton stalks (Gossypium hirsutum L.) with phenol. Wood Res. 2010, 55, 71–80. [Google Scholar]
- Egbuta, M.; McIntosh, S.; Waters, D.; Vancov, T.; Liu, L. Biological importance of cotton by-products relative to chemical constituents of the cotton plant. Molecules 2017, 22, 93. [Google Scholar] [CrossRef] [Green Version]
- Wanjura, J.D.; Barnes, E.M.; Kelley, M.S.; Holt, G.A.; Pelletier, M.G. Quantification and characterization of cotton crop biomass residue. Ind. Crop. Prod. 2014, 56, 94–104. [Google Scholar] [CrossRef]
- Liu, Y.; He, Z.; Shankle, M.; Tewolde, H. Compositional features of cotton plant biomass fractions characterized by attenuated total reflection Fourier transform infrared spectroscopy. Ind. Crop. Prod. 2016, 79, 283–286. [Google Scholar] [CrossRef]
- He, Z.; Zhang, H.; Tewolde, H.; Shankle, M. Chemical characterization of cotton plant parts for multiple uses. Agric. Environ. Lett. 2017, 2, 110044. [Google Scholar] [CrossRef] [Green Version]
- Guo, M.; Xiao, P.; Li, H. Valorization of agricultural byproducts through conversion to biochar and bio-oil. In Byproducts from Agriculture and Fisheries: Adding Value for Food, Feed, Pharma, and Fuels; Simpson, B.K., Aryee, A.N., Toldrá, F., Eds.; John Wiley & Sons Ltd.: Hoboken, NY, USA, 2020; pp. 501–522. [Google Scholar]
- He, Z.; Senwo, Z.N.; Zou, H.; Tazisong, I.A.; Martens, D.A. Amino compounds in poultry litter, litter-amended pasture soils and grass shoots. Pedosphere 2014, 24, 178–185. [Google Scholar] [CrossRef]
- He, Z.; Olk, D.C.; Waldrip, H.M. Soil amino compound and carbohydrate contents influenced by organic amendments. In Applied Manure and Nutrient Chemistry for Sustainable Agriculture and Environment; He, Z., Zhang, H., Eds.; Springer: Amsterdam, The Netherland, 2014; pp. 69–82. [Google Scholar]
- Martens, D.A.; Loeffelmann, K.L. Improved accounting of carbohydrate carbon from plants and soils. Soil Biol. Biochem. 2002, 34, 1393–1399. [Google Scholar] [CrossRef] [Green Version]
- Guidi, C.; Cannella, D.; Leifeld, J.; Rodeghiero, M.; Magid, J.; Gianelle, D.; Vesterdal, L. Carbohydrates and thermal properties indicate a decrease in stable aggregate carbon following forest colonization of mountain grassland. Soil Biol. Biochem. 2015, 86, 135–145. [Google Scholar] [CrossRef]
- Ghasemian, M.; Zilouei, H.; Asadinezhad, A. Enhanced biogas and biohydrogen production from cotton plant wastes using alkaline pretreatment. Energy Fuels 2016, 30, 10484–10493. [Google Scholar] [CrossRef]
- He, Z.; Zhang, H.; Olk, D.C.; Shankle, M.; Way, T.R.; Tewolde, H. Protein and fiber profiles of cottonseed from upland cotton with different fertilizations. Mod. Appl. Sci. 2014, 8, 97–105. [Google Scholar] [CrossRef] [Green Version]
- He, Z.; Zhang, H.; Olk, D.C. Chemical composition of defatted cottonseed and soy meal products. PLoS ONE 2015, 10, e0129933. [Google Scholar] [CrossRef] [PubMed]
- Amthor, J.S.; Bar-Even, A.; Hanson, A.D.; Millar, A.H.; Stitt, M.; Sweetlove, L.J.; Tyerman, S.D. Engineering strategies to boost crop productivity by cutting respiratory carbon loss. Plant Cell 2019, 31, 297–314. [Google Scholar] [CrossRef] [PubMed] [Green Version]
- Liu, S.; Wang, X.; Yin, X.; Savoy, H.J.; McClure, A.; Essington, M.E. Ammonia volatilizationloss and corn nitrogen nutrition and productivity with efficiency enhanced UAN and urea under no-tillage. Sci. Rep. 2019, 9, 6610. [Google Scholar] [CrossRef]
- Tewolde, H.; Shankle, M.W.; Way, T.R.; Pote, D.H.; Sistani, K.R.; He, Z. Poultry litter band placement affects accessibility and conservation of nutrients and cotton yield. Agron. J. 2018, 110, 675–684. [Google Scholar] [CrossRef]
- Olk, D.C.; Fortuna, A.; Honeycutt, C.W. Using anion chromatography-pulsed amperometry to measure amino compounds in dairy manure-amended soils. Soil Sci. Soc. Am. J. 2008, 72, 1711–1720. [Google Scholar] [CrossRef]
- Olk, D.C. Improved analytical techniques for carbohydrates, amino compounds, and phenols: Tools for understanding soil processes. Soil Sci. Soc. Am. J. 2008, 72, 1672–1682. [Google Scholar] [CrossRef]
- He, Z.; Klasson, K.T.; Wang, D.; Li, N.; Zhang, H.; Zhang, D.; Wedegaertner, T.C. Pilot-scale production of washed cottonseed meal and co-products. Mod. Appl. Sci. 2016, 10, 25–33. [Google Scholar] [CrossRef] [Green Version]
- Martins, M.d.R.; Angers, D.A.; Corá, J.E. Carbohydrate composition and water-stable aggregation of an Oxisol as affected by crop sequence under no-till. Soil Sci. Soc. Am. J. 2012, 76, 475–484. [Google Scholar] [CrossRef]
- Zhang, Y.; Idowu, O.J.; Brewer, C.E. Using agricultural residue biochar to improve soil quality of desert soils. Agriculture 2016, 6, 10. [Google Scholar] [CrossRef] [Green Version]
- Vancov, T.; Palmer, J.; Keen, B. A two stage pretreatment process to maximise recovery of sugars from cotton gin trash. Bioresour. Technol. Rep. 2018, 4, 114–122. [Google Scholar] [CrossRef]
- McIntosh, S.; Palmer, J.; Egbuta, M.; Liu, L.; Vancov, T. Refining spent cotton gin trash following essential oil extraction for value added cellulosic sugars. Bioresour. Technol. Rep. 2019, 7, 100223. [Google Scholar] [CrossRef]
- Guan, Z.-H.; Li, X.G.; Wang, L.; Mou, X.M.; Kuzyakov, Y. Conversion of Tibetan grasslands to croplands decreases accumulation of microbially synthesized compounds in soil. Soil Biol. Biochem. 2018, 123, 10–20. [Google Scholar] [CrossRef]
- Sugiura, Y.; Watanabe, M.; Nonoyama, Y.; Sakagami, N.; Guo, Y.; Murayama, S. Saccharides of ectomycorrhizal fungal sclerotia as sources of forest soil polysaccharides. Soil Sci. Plant Nutr. 2017, 63, 426–433. [Google Scholar] [CrossRef] [Green Version]
- Keshav, P.K.; Naseeruddin, S.; Rao, L.V. Improved enzymatic saccharification of steam exploded cotton stalk using alkaline extraction and fermentation of cellulosic sugars into ethanol. Bioresour. Technol. 2016, 214, 363–370. [Google Scholar] [CrossRef]
- Amthor, J.S. Efficiency of lignin biosynthesis: A quantitative analysis. Ann. Bot. 2003, 91, 673–695. [Google Scholar] [CrossRef] [Green Version]
- Pauly, M.; Albersheim, P.; Darvill, A.; York, W.S. Molecular domains of the cellulose/xyloglucan network in the cell walls of higher plants. Plant J. 1999, 20, 629–639. [Google Scholar] [CrossRef]
- Wakabayashi, K.; Soga, K.; Hoson, T. Modification of cell wall architecture in gramineous plants under altered gravity conditions. Biol. Sci. Space 2009, 23, 137–142. [Google Scholar] [CrossRef]
- Binod, P.; Kuttiraja, M.; Archana, M.; Janu, K.U.; Sindhu, R.; Sukumaran, R.K.; Pandey, A. High temperature pretreatment and hydrolysis of cotton stalk for producing sugars for bioethanol production. Fuel 2012, 92, 340–345. [Google Scholar] [CrossRef]
- Mortimer, J.C.; Miles, G.P.; Brown, D.M.; Zhang, Z.; Segura, M.P.; Weimar, T.; Yu, X.; Seffen, K.A.; Stephens, E.; Turner, S.R. Absence of branches from xylan in Arabidopsis gux mutants reveals potential for simplification of lignocellulosic biomass. Proc. Natl. Acad. Sci. USA 2010, 107, 17409–17414. [Google Scholar] [CrossRef] [Green Version]
- Bertrand, J.A.; Sudduth, T.Q.; Condon, A.; Jenkins, T.C.; Calhoun, M.C. Nutrient content of whole cottonseed. J. Dairy Sci. 2005, 88, 1470–1477. [Google Scholar] [CrossRef] [Green Version]
- Dahl-Lassen, R.; van Hecke, J.; Jørgensen, H.; Bukh, C.; Andersen, B.; Schjoerring, J.K. High-throughput analysis of amino acids in plant materials by single quadrupole mass spectrometry. Plant Methods 2018, 14, 8. [Google Scholar] [CrossRef] [PubMed] [Green Version]
- Wyngaard, N.; Cabrera, M.L.; Shober, A.; Kanwar, R. Fertilization strategy can affect the estimation of soil nitrogen mineralization potential with chemical methods. Plant Soil 2018, 432, 75–89. [Google Scholar] [CrossRef]
- Grewal, J.; Khare, S. 2-Pyrrolidone synthesis from g-aminobutyric acid produced by Lactobacillus brevis under solid-state fermentation utilizing toxic deoiled cottonseed cake. Bioprocess Biosyst. Eng. 2017, 40, 145–152. [Google Scholar] [CrossRef]
Figure 1.
Cotton plant biomass parts collected and used in this study.

Figure 2.
Contents of carbohydrates in cotton reproductive parts at mid-season (MS) and pre-defoliation (PD) growth phases. The ratio of GM/AX (galactose + mannose)/(arabinose + xylose) was 0.90 ± 0.04 for the reproductive parts at MS, and 0.21 ± 0.02, 0.53 ± 0.06, and 0.18 ± 0.03 for bur, peduncles/bracts, and cottonseed of PD reproductive samples, respectively.

Figure 3.
Cellulose (C), hemicellulose (H), and acid detergent lignin (L) in cotton vegetative plant parts at mid-season and pre-defoliation stages. Symbols *, **, and *** indicate the relevant contents between the mid-season and pre-defoliation samples significantly different at p = 0.05, 0.01, and 0.001, respectively.

Figure 4.
Cellulose (C), hemicellulose (H), and acid detergent lignin (L) in cotton reproductive parts at mid-season and pre-defoliation stages. Different letters indicate the content values in the same compound significantly different from each other at p = 0.05. ADL: acid detergent lignin.
Figure 4.
Cellulose (C), hemicellulose (H), and acid detergent lignin (L) in cotton reproductive parts at mid-season and pre-defoliation stages. Different letters indicate the content values in the same compound significantly different from each other at p = 0.05. ADL: acid detergent lignin.

Figure 5.
Content of essential amino acids in cotton plant parts at mid-season and pre-defoliation stages.
Figure 5.
Content of essential amino acids in cotton plant parts at mid-season and pre-defoliation stages.

Figure 6.
Content of non-essential amino acids in cotton plant parts at mid-season and pre-defoliation stages.
Figure 6.
Content of non-essential amino acids in cotton plant parts at mid-season and pre-defoliation stages.


Table 1.
Contents of seven carbohydrates in cotton vegetative plant parts collected at mid-season (MS) and pre-defoliation (PD) stages. GM/AX: (galactose + mannose)/(arabinose + xylose). Data are presented in g kg−1 of dry matter with average (A) and standard deviation (SD, n = 4).
Table 1.
Contents of seven carbohydrates in cotton vegetative plant parts collected at mid-season (MS) and pre-defoliation (PD) stages. GM/AX: (galactose + mannose)/(arabinose + xylose). Data are presented in g kg−1 of dry matter with average (A) and standard deviation (SD, n = 4).
| Fucose | Rhamnose | Arabinose | Galactose | Glucose | Xylose | Mannose | GM/AX | ||||||||||
|---|---|---|---|---|---|---|---|---|---|---|---|---|---|---|---|---|---|
| MS | PD | MS | PD | MS | PD | MS | PD | MS | PD | MS | PD | MS | PD | MS | PD | ||
| Leaf blades | A | 0.9 | 1.1 | 10.9 | 9.9 | 17.9 | 14.0 | 20.9 | 23.9 | 33.8 | 30.0 | 12.1 | 14.3 | 5.6 | 8.6 | 0.89 | 1.15 |
| SD | 0.1 | 0.1 | 2.0 | 1.3 | 2.2 | 1.4 | 2.1 | 2.0 | 3.6 | 2.0 | 2.4 | 1.7 | 1.0 | 0.2 | 0.06 | 0.05 | |
| Petioles | A | 1.5 | 1.8 | 11.8 | 13.5 | 23.9 | 23.7 | 17.4 | 23.7 | 43.0 | 22.3 | 40.8 | 56.5 | 7.7 | 8.1 | 0.40 | 0.40 |
| SD | 0.2 | 0.1 | 1.2 | 1.7 | 4.1 | 4.9 | 2.7 | 3.2 | 8.0 | 3.8 | 10.9 | 5.8 | 1.3 | 0.9 | 0.05 | 0.01 | |
| Branch stems | A | 0.7 | 1.0 | 7.4 | 8.6 | 15.5 | 13.2 | 12.3 | 13.2 | 66.1 | 23.9 | 61.9 | 82.2 | 5.8 | 6.1 | 0.23 | 0.20 |
| SD | 0.1 | 0.2 | 0.6 | 0.6 | 1.3 | 1.8 | 0.6 | 1.1 | 7.3 | 8.5 | 3.2 | 3.4 | 0.6 | 0.2 | 0.00 | 0.01 | |
| Main stems | A | 0.3 | 0.8 | 4.8 | 7.1 | 7.1 | 9.7 | 7.0 | 9.3 | 56.3 | 40.4 | 40.0 | 71.7 | 3.2 | 5.3 | 0.22 | 0.19 |
| SD | 0.1 | 0.2 | 1.0 | 1.4 | 1.0 | 1.1 | 0.9 | 0.9 | 8.9 | 14.2 | 7.6 | 19.2 | 1.3 | 0.5 | 0.03 | 0.06 | |
| Roots | A | 0.2 | 0.4 | 5.2 | 5.0 | 6.4 | 7.1 | 6.1 | 7.1 | 65.3 | 37.9 | 27.5 | 65.1 | 2.8 | 3.2 | 0.26 | 0.14 |
| SD | 0.1 | 0.1 | 0.4 | 0.8 | 0.7 | 0.8 | 0.5 | 0.5 | 8.8 | 9.6 | 2.3 | 7.4 | 0.2 | 0.3 | 0.03 | 0.01 | |
Table 2.
Correlation coefficients among different carbohydrates and acid detergent lignin (ADL).
| Fucose | Rhamnose | Arabinose | Galactose | Glucose | Xylose | Mannose | Cellulose | Hemicellulose | |
|---|---|---|---|---|---|---|---|---|---|
| Rhamnose | 0.904 *** | ||||||||
| Arabinose | 0.673 ** | 0.691 ** | |||||||
| Galactose | 0.802 *** | 0.854 *** | 0.744 ** | ||||||
| Glucose | −0.412 | −0.350 | −0.232 | −0.474 | |||||
| Xylose | 0.011 | −0.329 | −0.114 | −0.342 | −0.207 | ||||
| Mannose | 0.834 *** | 0.861 *** | 0.612 * | 0.778 ** | −0.116 | -0.302 | |||
| Cellulose | −0.038 | −0.313 | −0.456 | −0.554 * | 0.238 | 0.719 ** | −0.245 | ||
| Hemi cellulose | −0.468 | −0.739 ** | −0.422 | −0.749 ** | 0.312 | 0.726 ** | −0.640 * | 0.731 ** | |
| ADL | 0.243 | 0.27 | −0.242 | 0.306 | −0.640 * | 0.041 | 0.161 | −0.007 | −0.368 |
Symbols *, **, and *** indicate the values’ levels of statistical significance at p = 0.05, 0.01, and 0.001 (n = 14), respectively.
Table 3.
Content of strong acid extractable glucose in cotton vegetative plant parts collected at mid-season (MS) and pre-defoliation (PD) stages. Data are presented in g kg−1 of dry matter with average (A) and standard deviation (SD, n = 4).
Table 3.
Content of strong acid extractable glucose in cotton vegetative plant parts collected at mid-season (MS) and pre-defoliation (PD) stages. Data are presented in g kg−1 of dry matter with average (A) and standard deviation (SD, n = 4).
| Mid-Season | Leaf Blades | Petioles | Branches | Main Stems | Roots | Reproductive | ||
|---|---|---|---|---|---|---|---|---|
| A | 8.6 | 56.2 | 120.9 | 140.1 | 142.5 | 14.2 | ||
| SD | 5.6 | 22.8 | 13.6 | 40.6 | 28.7 | 6.3 | ||
| Pre-Defoliation | Leaf Blades | Petioles | Branches | Main Stems | Roots | Bur | Peduncles/Bracts | Cottonseed |
| A | 17.8 | 0.2 | 54.9 | 30.2 | 0.5 | 0.6 | 0.1 | 4.9 |
| SD | 5.2 | 0.2 | 46.8 | 39.7 | 0.3 | 0.5 | 0.0 | 5.2 |
© 2019 by the authors. Licensee MDPI, Basel, Switzerland. This article is an open access article distributed under the terms and conditions of the Creative Commons Attribution (CC BY) license (http://creativecommons.org/licenses/by/4.0/).
Share and Cite
MDPI and ACS Style
He, Z.; Olk, D.C.; Tewolde, H.; Zhang, H.; Shankle, M. Carbohydrate and Amino Acid Profiles of Cotton Plant Biomass Products. Agriculture 2020, 10, 2. https://0-doi-org.brum.beds.ac.uk/10.3390/agriculture10010002
AMA Style
He Z, Olk DC, Tewolde H, Zhang H, Shankle M. Carbohydrate and Amino Acid Profiles of Cotton Plant Biomass Products. Agriculture. 2020; 10(1):2. https://0-doi-org.brum.beds.ac.uk/10.3390/agriculture10010002
Chicago/Turabian StyleHe, Zhongqi, Dan C. Olk, Haile Tewolde, Hailin Zhang, and Mark Shankle. 2020. "Carbohydrate and Amino Acid Profiles of Cotton Plant Biomass Products" Agriculture 10, no. 1: 2. https://0-doi-org.brum.beds.ac.uk/10.3390/agriculture10010002
Note that from the first issue of 2016, this journal uses article numbers instead of page numbers. See further details here.