Article

Weed Flora and Soil Seed Bank Composition as Affected by Tillage System in Three-Year Crop Rotation

by
Beata Feledyn-Szewczyk
1,*,
Janusz Smagacz
1,
Cezary A. Kwiatkowski
2,
Elżbieta Harasim
2 and
Andrzej Woźniak
2
1
Department of Systems and Economics of Crop Production, Institute of Soil Science and Plant Cultivation—State Research Institute, Czartoryskich 8 Str., 24-100 Puławy, Poland
2
Department of Herbology and Plant Cultivation Techniques, University of Life Sciences, Akademicka 13 Str., 20-950 Lublin, Poland
*
Author to whom correspondence should be addressed.
Submission received: 16 April 2020 / Revised: 19 May 2020 / Accepted: 20 May 2020 / Published: 24 May 2020
(This article belongs to the Special Issue Weed Ecology and New Approaches for Management)

Abstract

:
In recent years, there has been an increasing interest around agricultural science and practice in conservation tillage systems that are compatible with sustainable agriculture. The aim of this study was to assess the qualitative and quantitative changes in weed flora and soil seed bank under reduced tillage and no-till (direct sowing) in comparison with traditional ploughing. In the crop rotation: pea/rape—winter wheat—winter wheat the number and dry weight of weeds increased with the simplification of tillage. The seed bank was the largest under direct sowing and about three times smaller in traditional ploughing. Under direct sowing, most weed seeds were accumulated in the top soil layer 0–5 cm, while in the ploughing system most weed seeds occurred in deeper layers: 5–10 and 10–20 cm. In the reduced and no-till systems, a greater percentage of perennial and invasive species, such as Conyza canadensis L., was observed. The results show that it is possible to maintain weed infestation in the no-till system at a level that does not significantly affect winter wheat yield and does not pose a threat of perennial and invasive weeds when effective herbicide protection is applied.

1. Introduction

Weed infestation in a field consists of the above-ground weed community and the seed stock in and on the soil, called the soil seed bank [1]. The soil seed bank is a reservoir in which the depositing of new seeds takes place systematically and the stock of those seeds changes due to various processes. The germination dynamics of weed seeds and their further development and competitiveness against crops depend on complex habitat, environmental and agrotechnical factors [2,3,4].
One of the most important agrotechnical factors influencing the weed flora of arable fields is the tillage method [5,6]. Contemporary tillage methods can be divided into three basic groups: (1) traditional tillage with the use of a plough, (2) reduced tillage, intended to eliminate the plough and replacing it with other passive or active tools whose primary task is to loosen the topsoil arable layer without turning it over, and (3) no-till system with direct sowing, including precise placement of the seeds in untilled soil with a specialist seed drill [7,8]. Sustainable agriculture promotes a reduction in the intensity of soil tillage treatments and seeks to replace plough cultivation with conservation tillage that does not turn the soil, or even with direct sowing. These treatments are reflected in scientific research although results on the impact of tillage simplifications on the diversity of the segetal flora and on the soil seed bank are inconclusive [9,10,11,12,13].
The stimulating effect of tillage on weed seed germination has been found in previous studies [14,15]. The exception is tillage at night, as daylight is a factor limiting the germination of the seeds of many weed species [16]. However, soil tillage leads to a decrease in the pool of seeds in the soil bank, which is indicated by their smaller amount in tilled soils as compared to untilled ones [17]. Soil tillage affects the dynamics of weed germination by modifying the seeds depth in the soil [16,18]. The literature shows that different tillage methods influence the accumulation and distribution of seeds in the soil profile. In traditional ploughed tillage systems, the seeds are distributed more or less evenly throughout the entire tillage layer, while in reduced systems a large portion of the seeds are concentrated in the surface layer of soil where they find more favourable conditions for germination [16,19,20]. This results in an increase in weed abundance under reduced tillage compared to ploughing, although the results also depend on the crop and weed species involved [15,21,22]. Moreover, the no-till system increases the number of weeds maturing in the stubble that remains after harvest, the seeds of which fall down, germinate and increase infestation [11]. According to other authors, the increase in weed infestation of the crop and soil occurs in the first few years after the introduction of tillage simplifications [23].
The simplification of soil tillage, including zero tillage, entails not only quantitative, but also qualitative changes in the species composition of weed flora and soil seed bank [4,23,24,25,26]. Species diversity is most often declining, although some authors have observed an increase in the biodiversity of weed communities under reduced tillage systems [19]. Some authors draw attention to the threats related to the occurrence of troublesome perennial species, mainly Elymus repens, and of invasive species under reduced tillage systems [19,20,27].
Two main methods are used to determine the abundance and species composition of seeds in the soil: the direct seed extraction method and the indirect germination method, called “greenhouse method”, or “seedling emergence method” [14,28,29]. The indirect method enables an estimation of the number of live seeds able to germinate under favorable conditions. Gross [30] and Cardina and Sparrow [31] evaluated the effectiveness of both methods for an assessment of the soil seed bank. The research carried out by Gross [30] shows that the number of seeds was much higher in samples determined by the direct method and that this was mainly due to the presence of dead seeds. However, if dead and resting seeds are deducted then the results obtained by the direct method were similar to those obtained by the germination method. According to Cardina and Sparrow [31], the germination method is best suited to predict weed emergence because it is most similar to field conditions.
The aim of the undertaken research was to determine qualitative and quantitative changes in weed flora composition and soil seed bank under a reduced tillage system and no-till cultivation and to investigate whether tillage simplifications lead to an increased threat of invasive species.
The research hypothesis was that simplifications in tillage cause an increase in weed infestation of the crop and the soil as well as leading to qualitative changes in the weed community, such as an increase in the number of invasive species.

2. Materials and Methods

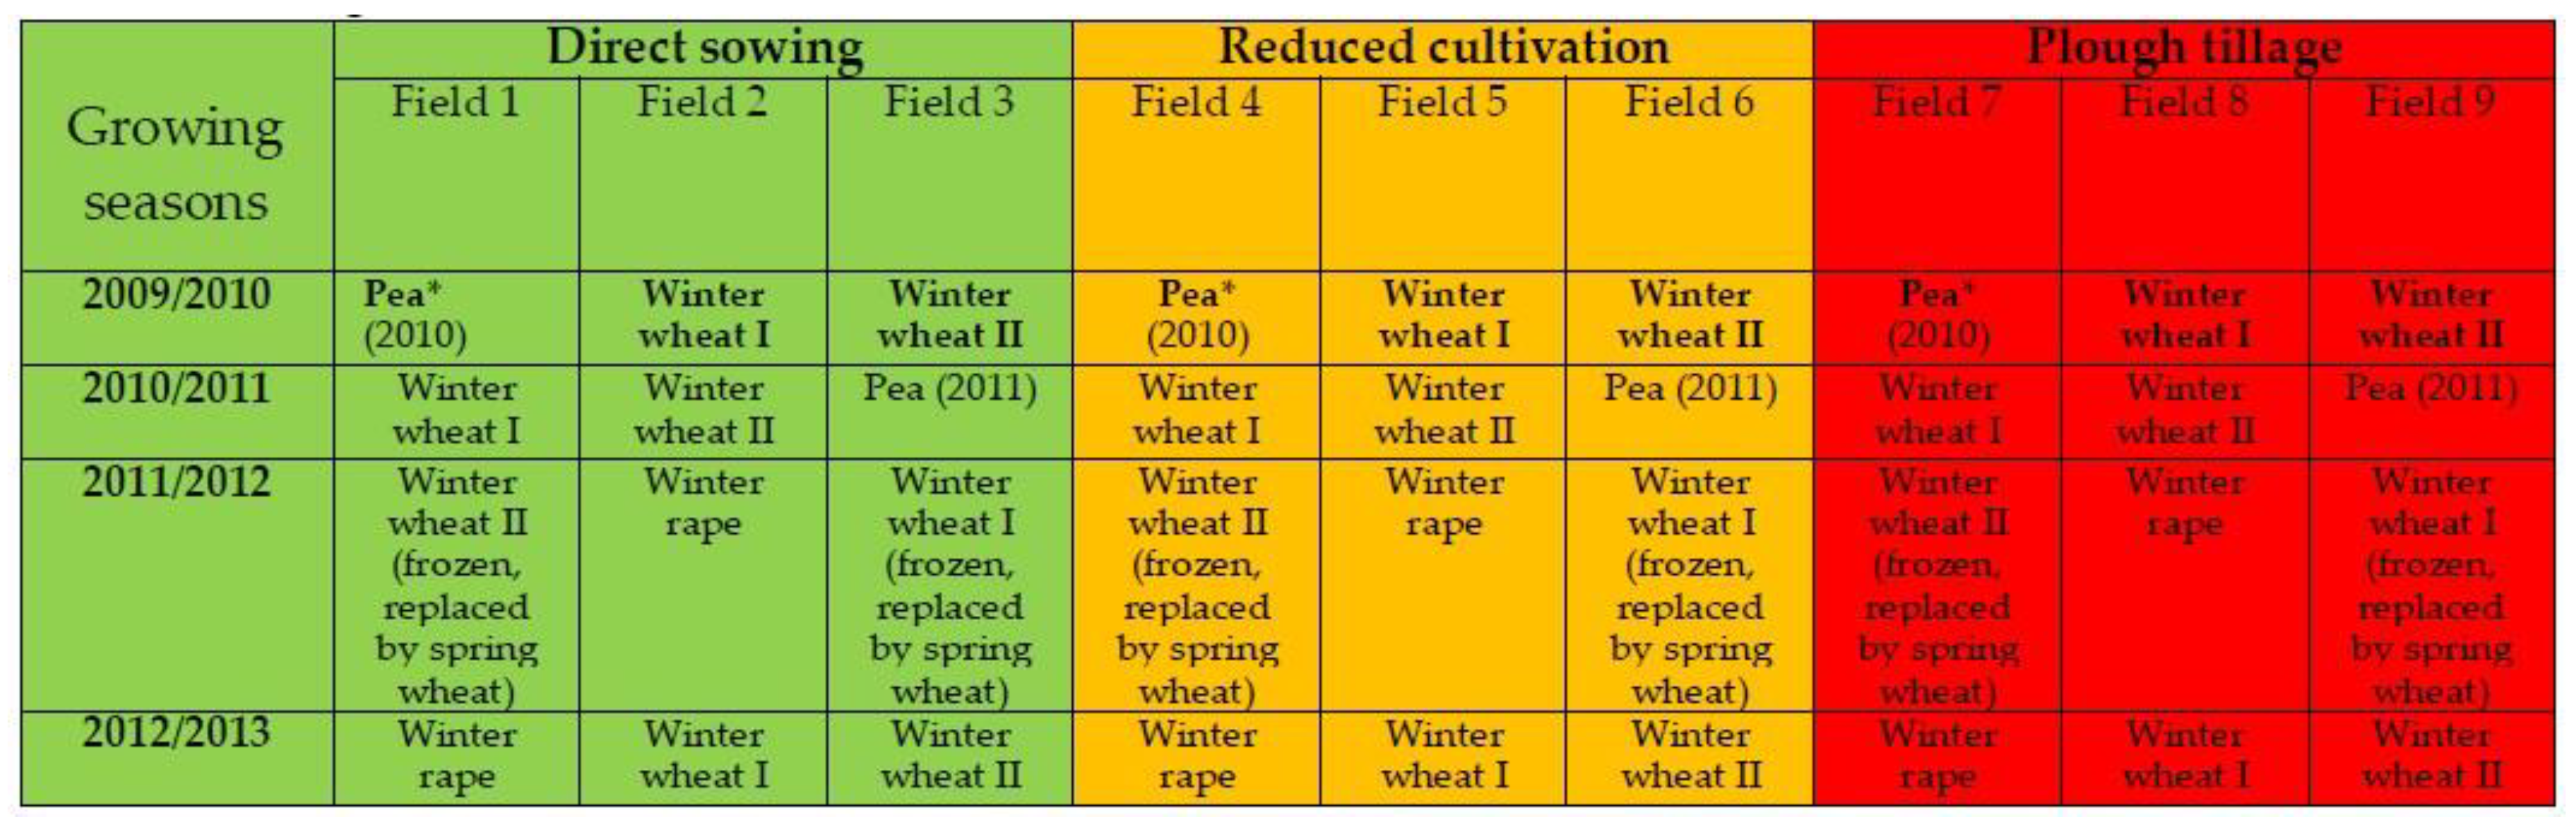
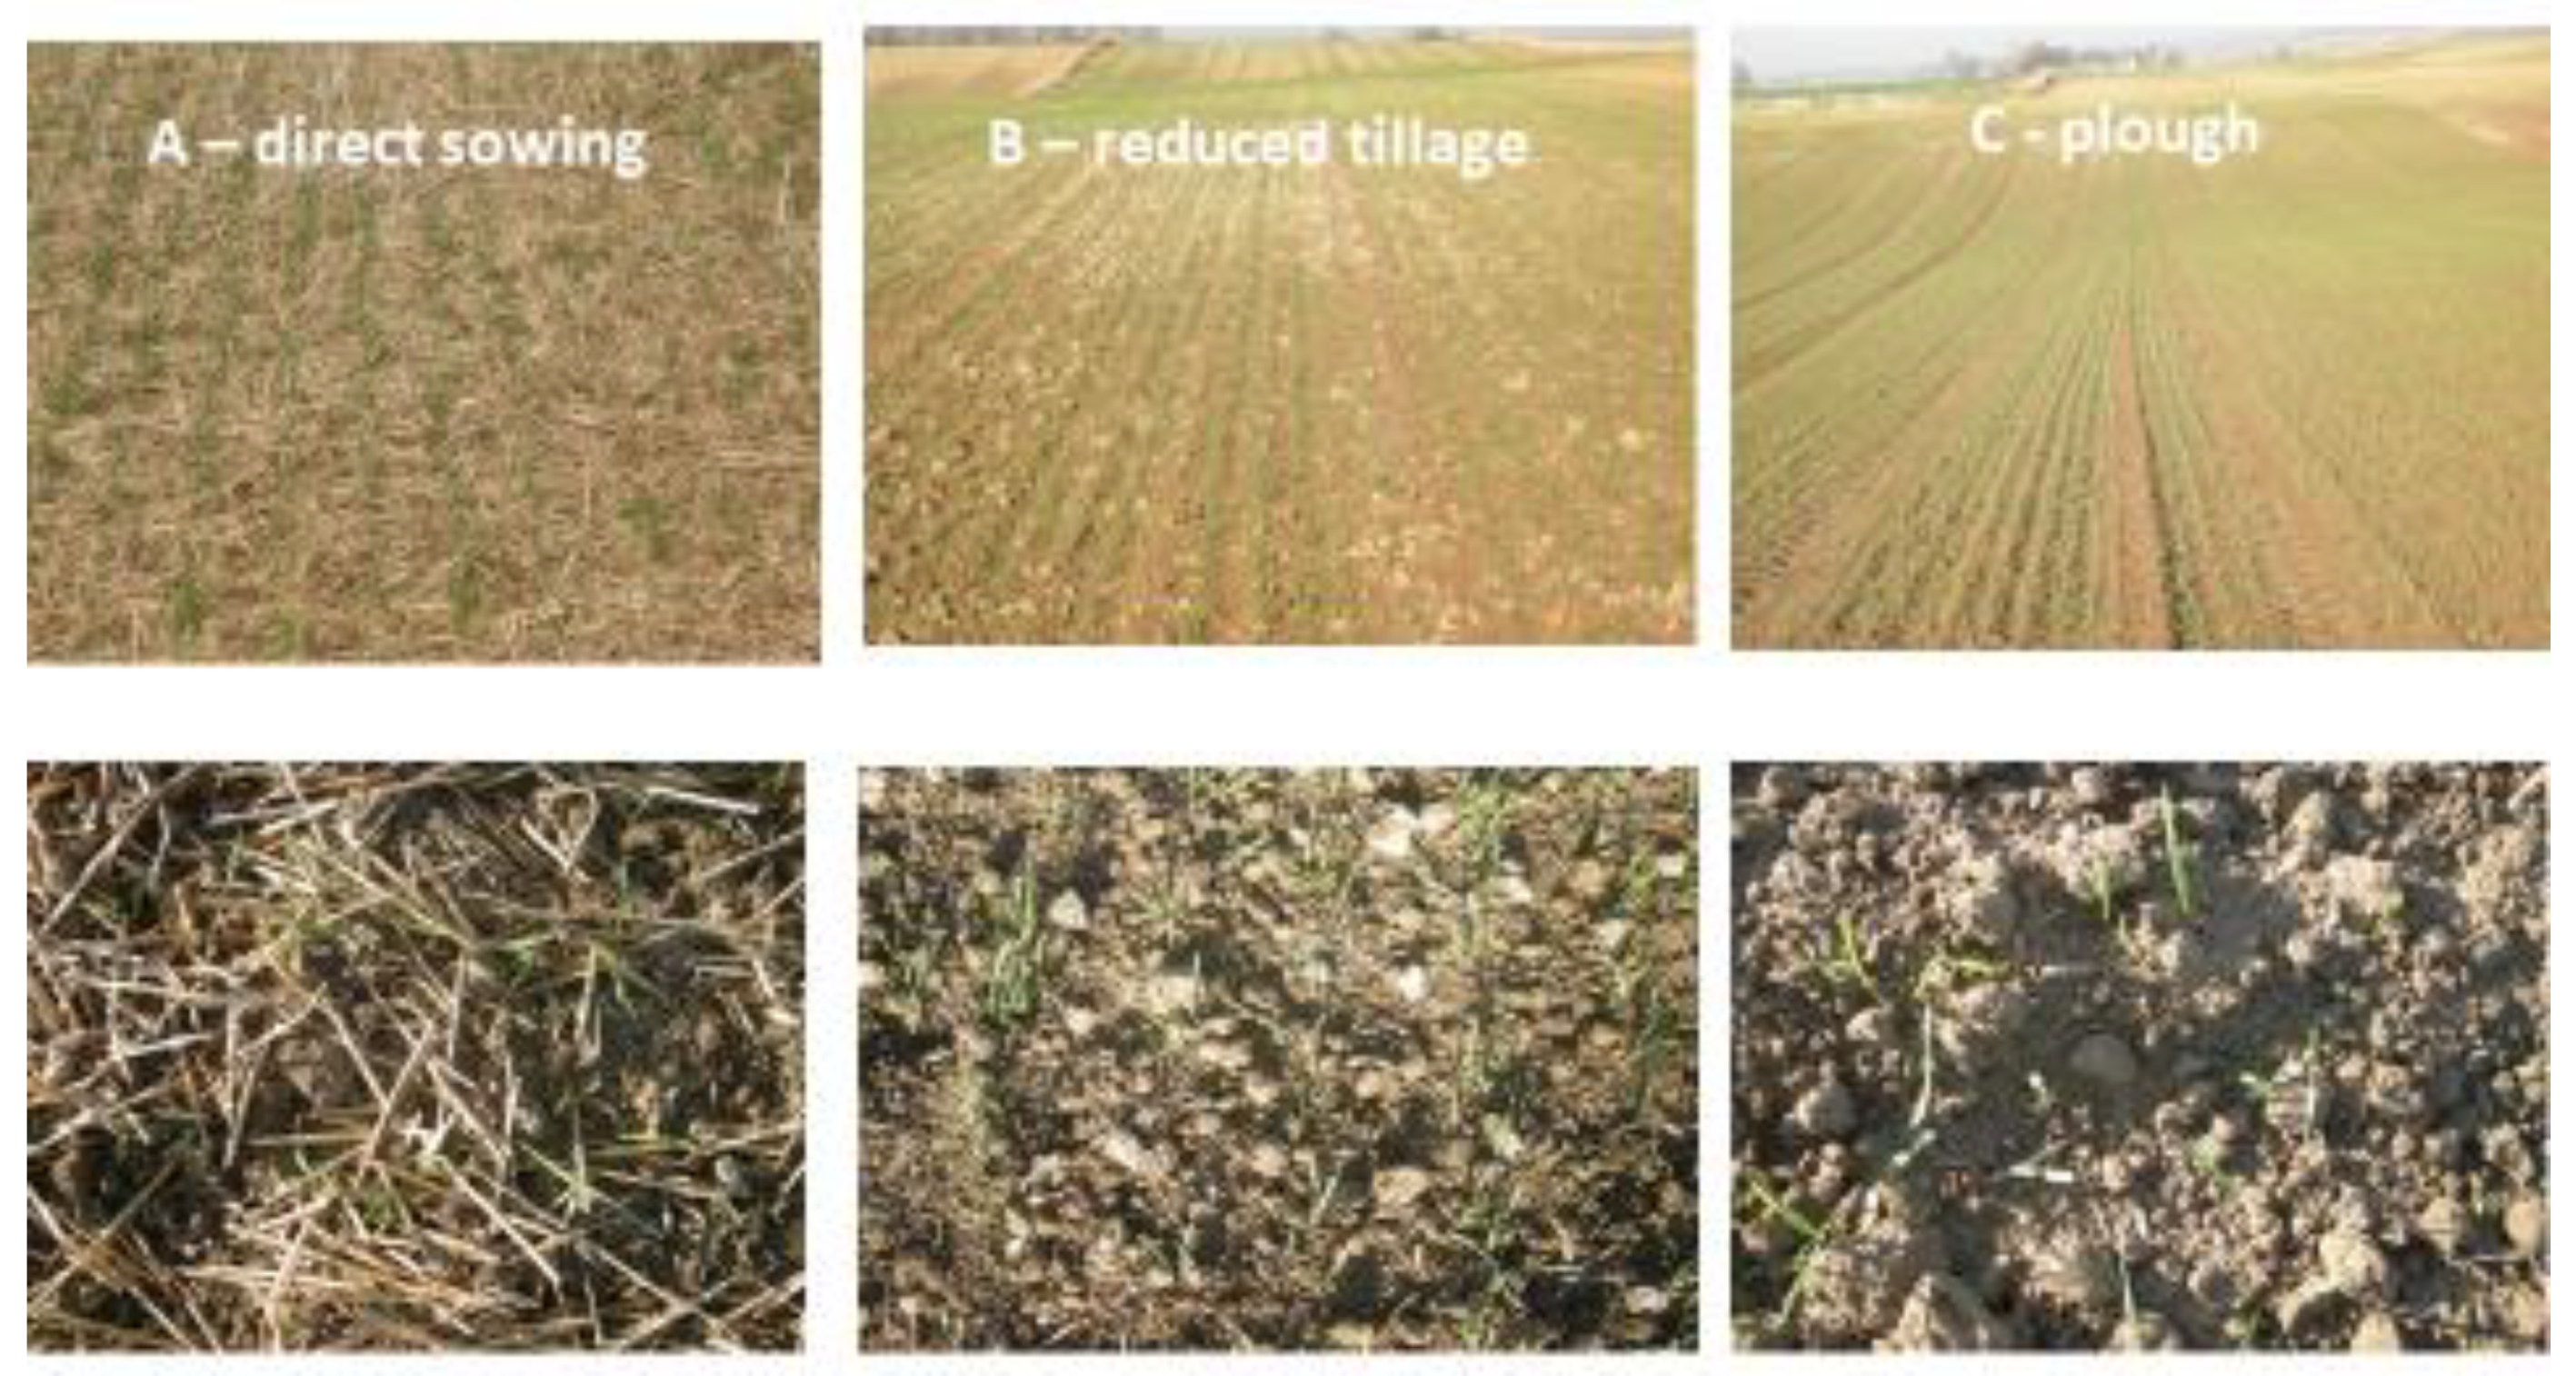
2.1. Characteristics of the Experiment with Tillage Systems

The research was conducted in the years 2010–2013 on 9 fields in total with three of these fields being used for each of the tillage systems: direct sowing, reduced tillage and ploughing, in a farm in Rogów, Lubelskie voivodeship, Poland (N: 51°28′, E: 22°4′) (Figure 1 and Figure 2). The experimental site is located in a moderate continental climatic zone. The long-term average annual total precipitation is 598 mm, with a mean air temperature of 8.5 °C (Table 1).
The fields used in the current experiment were set up in autumn 2002 on loess soil, with the granulometric composition of silt loam, characterized by a pH close to neutral (pH KCl = 6.6), a high phosphorus content (158.6 mg P kg−1 soil), and a medium potassium level (204.4 mg K kg−1 soil). The average humus content in the soil was 1.63%, and the organic carbon content was 0.94%.
In all of the tillage systems the same three-field crop rotation was applied: pea (2010–2011)/winter rape (2011/2012 and 2012/2013)—winter wheat I—winter wheat II (after winter wheat I). All crops in rotation were cultivated in each year. In January 2012, winter wheat froze out and was replaced by spring wheat. Each field was 1 ha in size and the whole experiment had a total of 9 ha (Figure 1).

2.2. Methods of Soil Treatment in Different Tillage Systems

The selection of cultivating machines and tools was varied and depended on the tillage system. In the plough cultivation, immediately after harvesting the forecrop, a shallow cultivation (stubble) was carried out with a disc harrow to a depth of 5–6 cm in order to stop the evaporation of water from the soil and stimulate the germination of weed seeds and volunteers. Then, before sowing winter plants, plowing was carried out using a reversible plough to a depth of 20 cm. Ploughing for peas was completed in late autumn to a depth of 25–30 cm. Sowing of wheat and rapeseed was carried out in autumn on optimal dates for this region of the country, while peas were sown in spring using a seedbed cultivator (disc harrow + cultivating roller + seeder + seed harrow).
In the reduced tillage system, after plant harvest, post-cultivation was carried out with a rotary cultivator to a depth of 5 cm. This treatment was then repeated after about 3–4 weeks to limit the emergence of weeds and volunteers. Winter crops were sown at optimal dates, while peas were sown in spring using a seedbed cultivator.
In the no-till system, the preparation of the field for sowing was reduced to the use of a herbicide based on glyphosate in order to limit weed infestation, followed by direct sowing of wheat and rapeseed in autumn, and peas in spring with a special seeder for direct sowing.

2.3. Fertilization

The fertilization of crops was not differentiated depending on the tillage system. Immediately after harvesting the forecrop plant and before the post-harvest cultivation, phosphorus, potassium, nitrogen and sulfur fertilization was applied. Top dressing with nitrogen was completed in spring, taking into account the crop requirements, as shown in Table 2.

2.4. Weed Control

In each growing season, intensive chemical control was used to reduce weed infestation of the crops. From 2 to 4 herbicides, including glyphosate, were used on each crop in growing season, the same herbicides in all tillage systems (Table 3).

2.5. Weed Flora Analysis

Analyses of species composition, number of weeds and air-dried matter of weeds were determined after collection using the weed-picking frame method. The weeds were collected from a frame with dimensions of 0.5 × 1 m, with five replications in each crop field. To avoid the edge effect, the frames were placed a few meters from the edges of plots.
Tillage effects on weed population composition were assessed in each field from July 2010 to April 2013 (3 growing seasons) on 5 terms:
  • before the crop harvest,
  • after the crop harvest and soil operations in the plough and reduced tillage systems,
  • before sowing of winter wheat, after pre-sowing soil treatment in the plough and reduced tillage systems,
  • late autumn, during the tillering stage of winter wheat,
  • spring, for winter wheat after the start of the growing season, for spring wheat in the tillering stage.
Plant species were identified according to the method of Rutkowski [32]. Dry matter of weeds and wheat was determined after drying at 40 °C for 7 days.

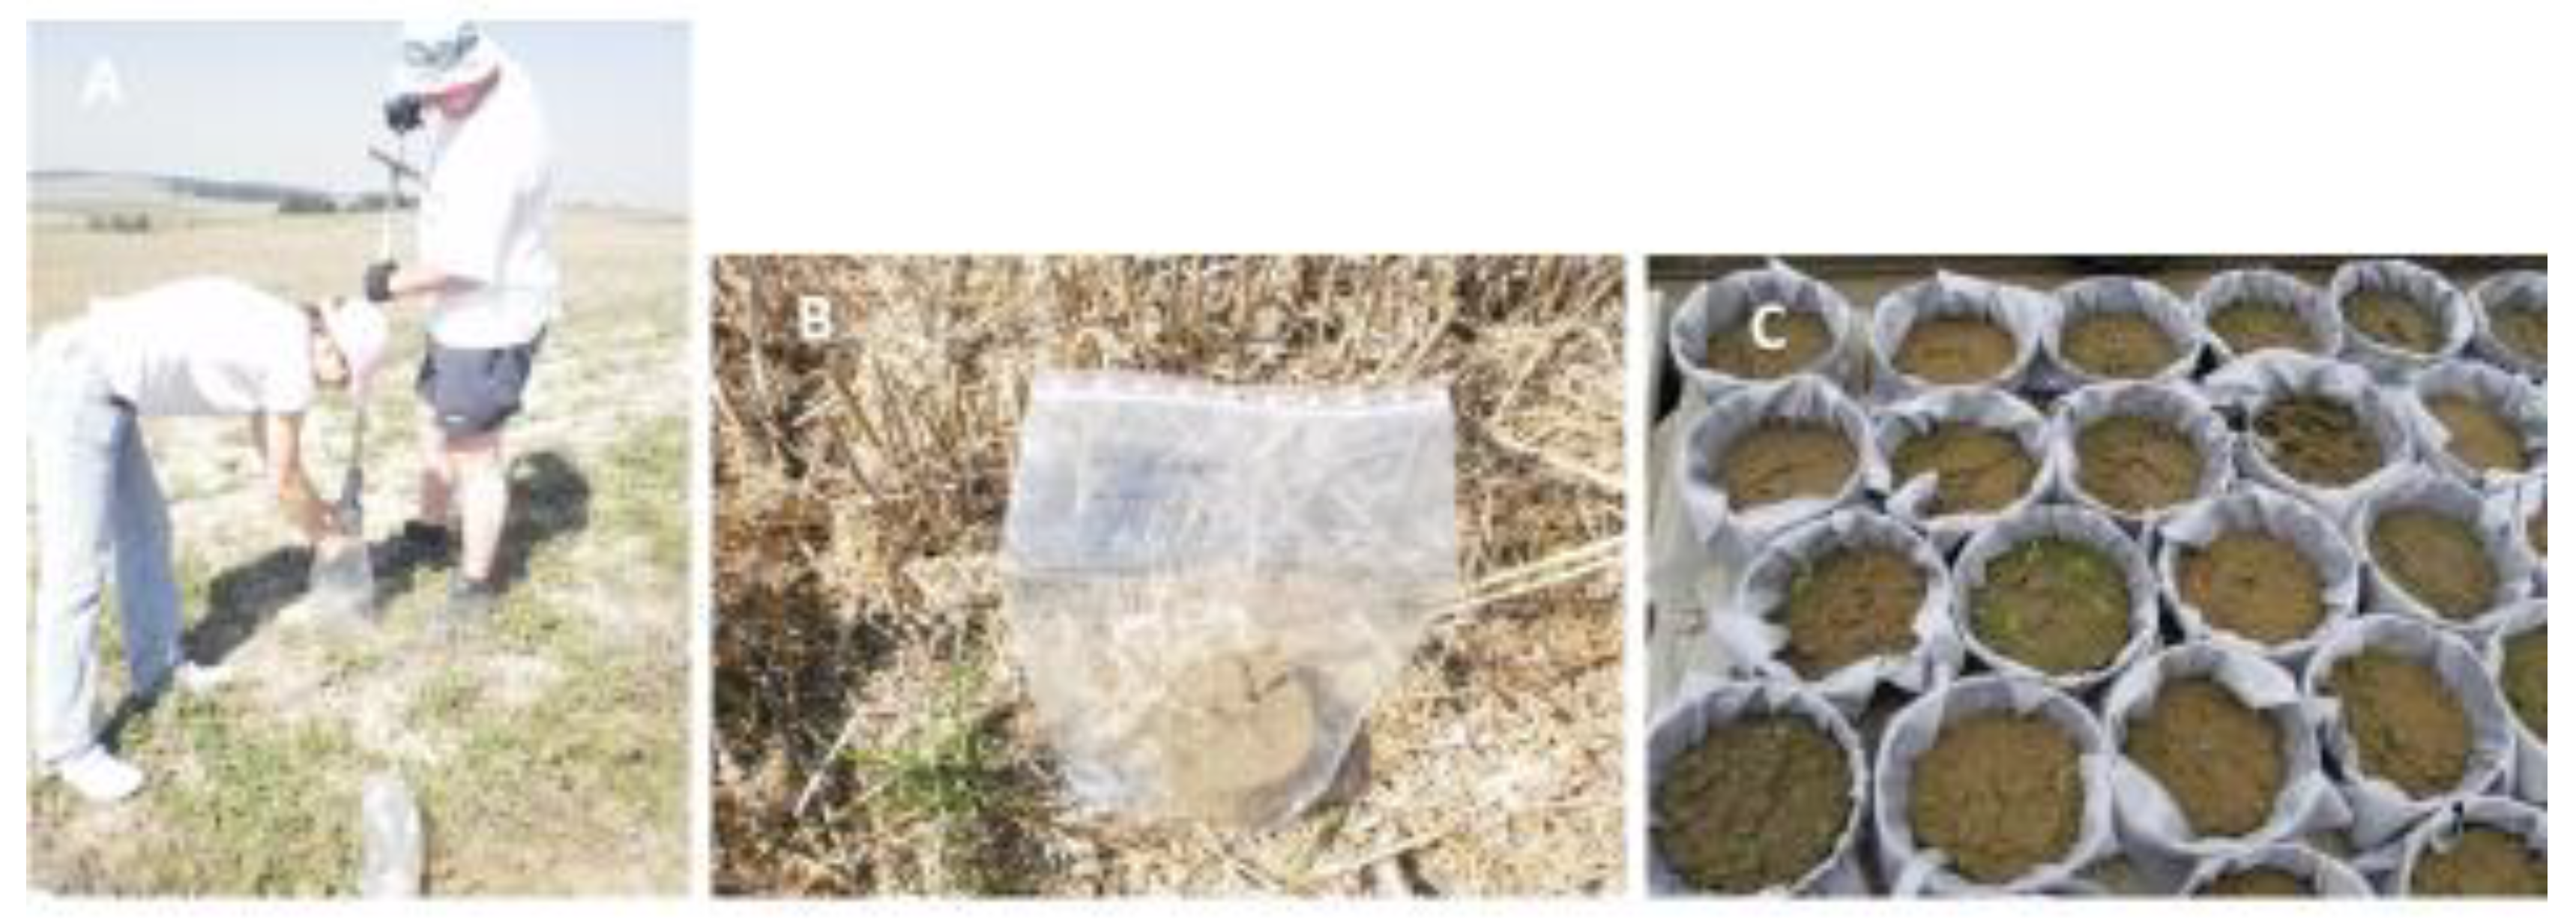
2.6. Soil Seed Bank Analysis

The seed bank was determined using the “greenhouse method” (seedling emergence method). Soil samples for the evaluation of the soil seed bank were taken in 3 years (2010–2012) from all fields after harvesting the crop, but before the cultivation operations. The soil was collected using a soil cylinder with a diameter of 8 cm, from levels: 0–5 cm, 5–10 cm and 10–20 cm, in 5 repetitions in each field (Figure 3A,B). Soil samples were placed into pots of about 20 cm in diameter that were partly filled with sand, which served as a drain, and covered with agro-textile (Figure 3C). The pots were placed in a vegetation hall and watered regularly for 11 months. Sprouting weeds were identified by species and counted every 1–2 months. The number of germinating weed seeds (viable seed bank) from the surface of each cylinder (50 cm2) were scaled up to that for 1 m2. Weed seed atlases were used for species determination [33].

2.7. Statistical Analyses

2.7.1. Diversity Indicators

The structures of weed communities and soil seed bank were analyzed using diversity indices: Shannon’s diversity index: H′ = −∑Pi ln Pi [34] and Simpson’s dominance index: SI = ∑Pi2 [35], where Pi is the probability of species occurrence in the sample. The values of the indicators were calculated using the Multi-Variate Statistical Package (MVSP) 3.1 program, Kovach Computing Services, Anglesey, United Kingdom [36].

2.7.2. Similarity Indices

The qualitative and quantitative Sorensen’s similarity indices were used to compare weed flora communities and soil seed banks in the different tillage systems [37]:
Sorensen’s qualitative index = 2C/A + B × 100%
where:
  • A—the number of species in one of the two communities compared,
  • B—the number of species in the second community compared,
  • C—the number of common species in the compared communities.
Sorensen’s quantitive index = 2 Nt/Na + Nb × 100%
where:
  • Nt—sum of the smallest numbers of common species in the compared variants,
  • Na—the number of all weeds in one of the compared variants,
  • Nb—the number of all weeds in the second variant compared.
The values of the indicators were calculated using the Multi-Variate Statistical Package (MVSP) 3.1 program, Kovach Computing Services, Anglesey, United Kingdom [36].

2.7.3. Assessment of the Significance of Differences

In order to check the normality of the distributions, the Shapiro–Wilk test was used. The data on weed species richness and abundance did not meet the requirements for parametric tests. Therefore, the nonparametric Kruskal–Wallis test was used for the identification of significant differences between samples at p ≤ 0.05 using Statistica 10 software (StatSoft, Kraków, Poland).

3. Results and Discussion

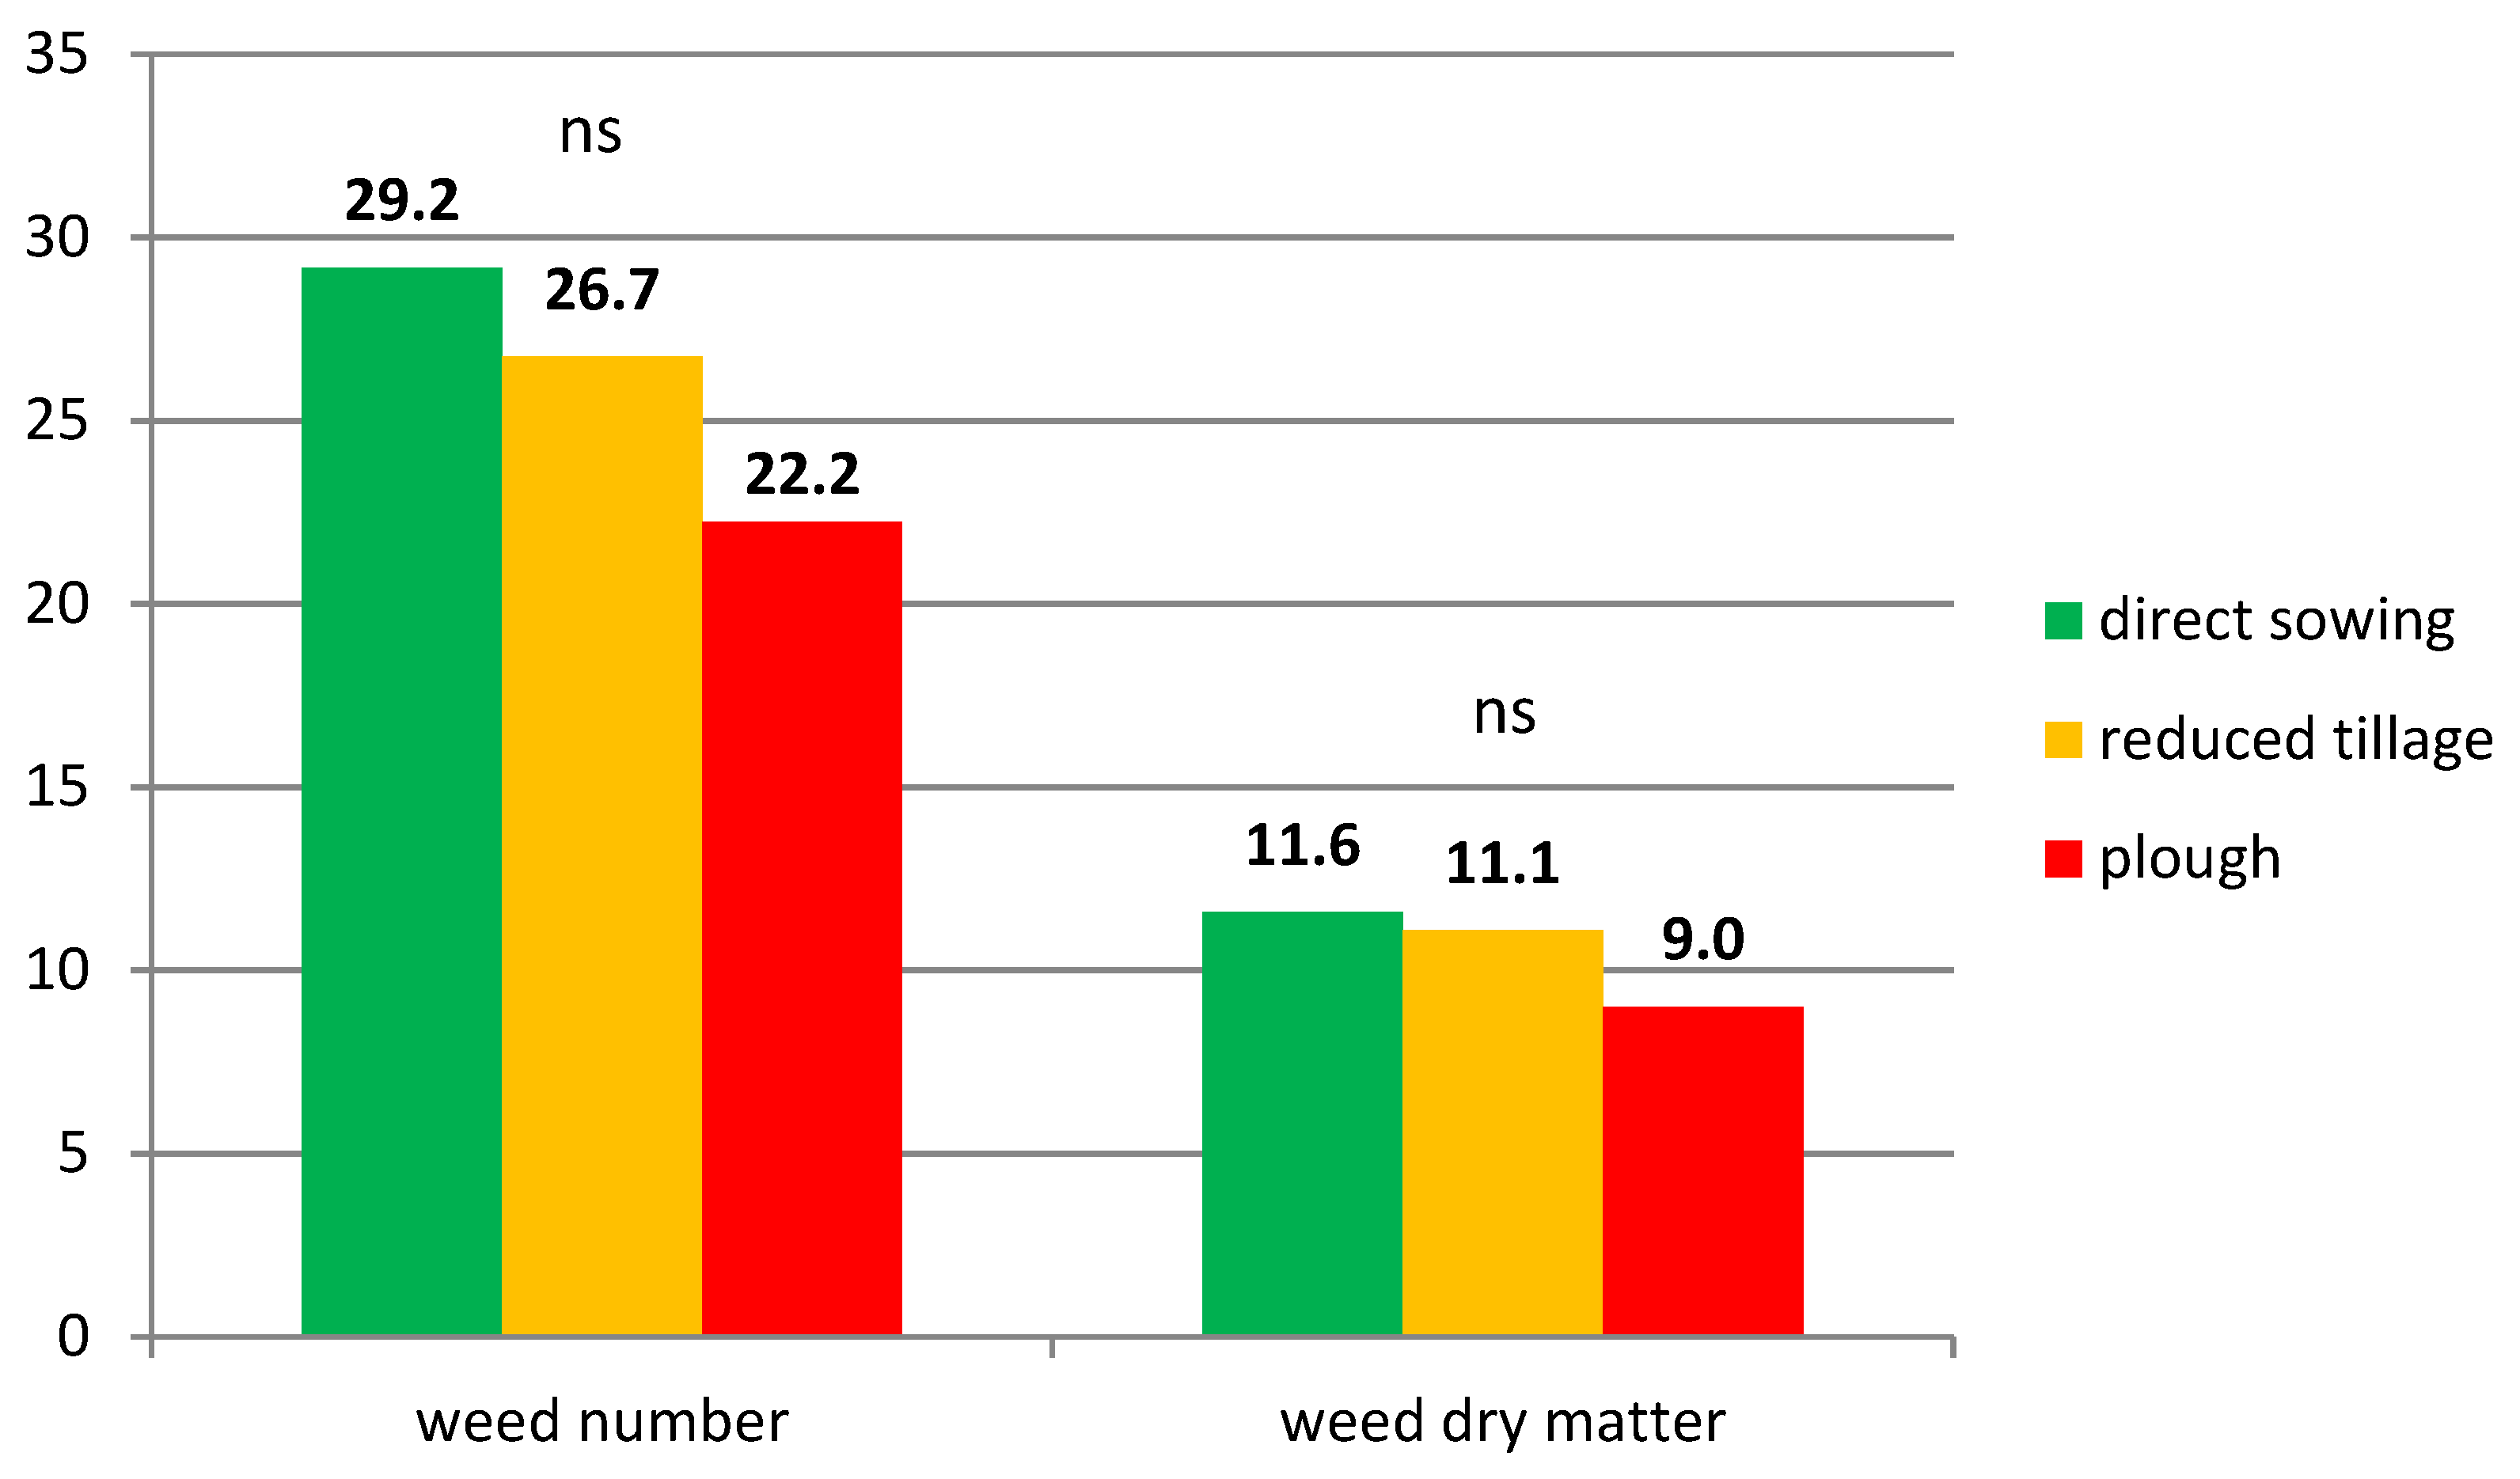
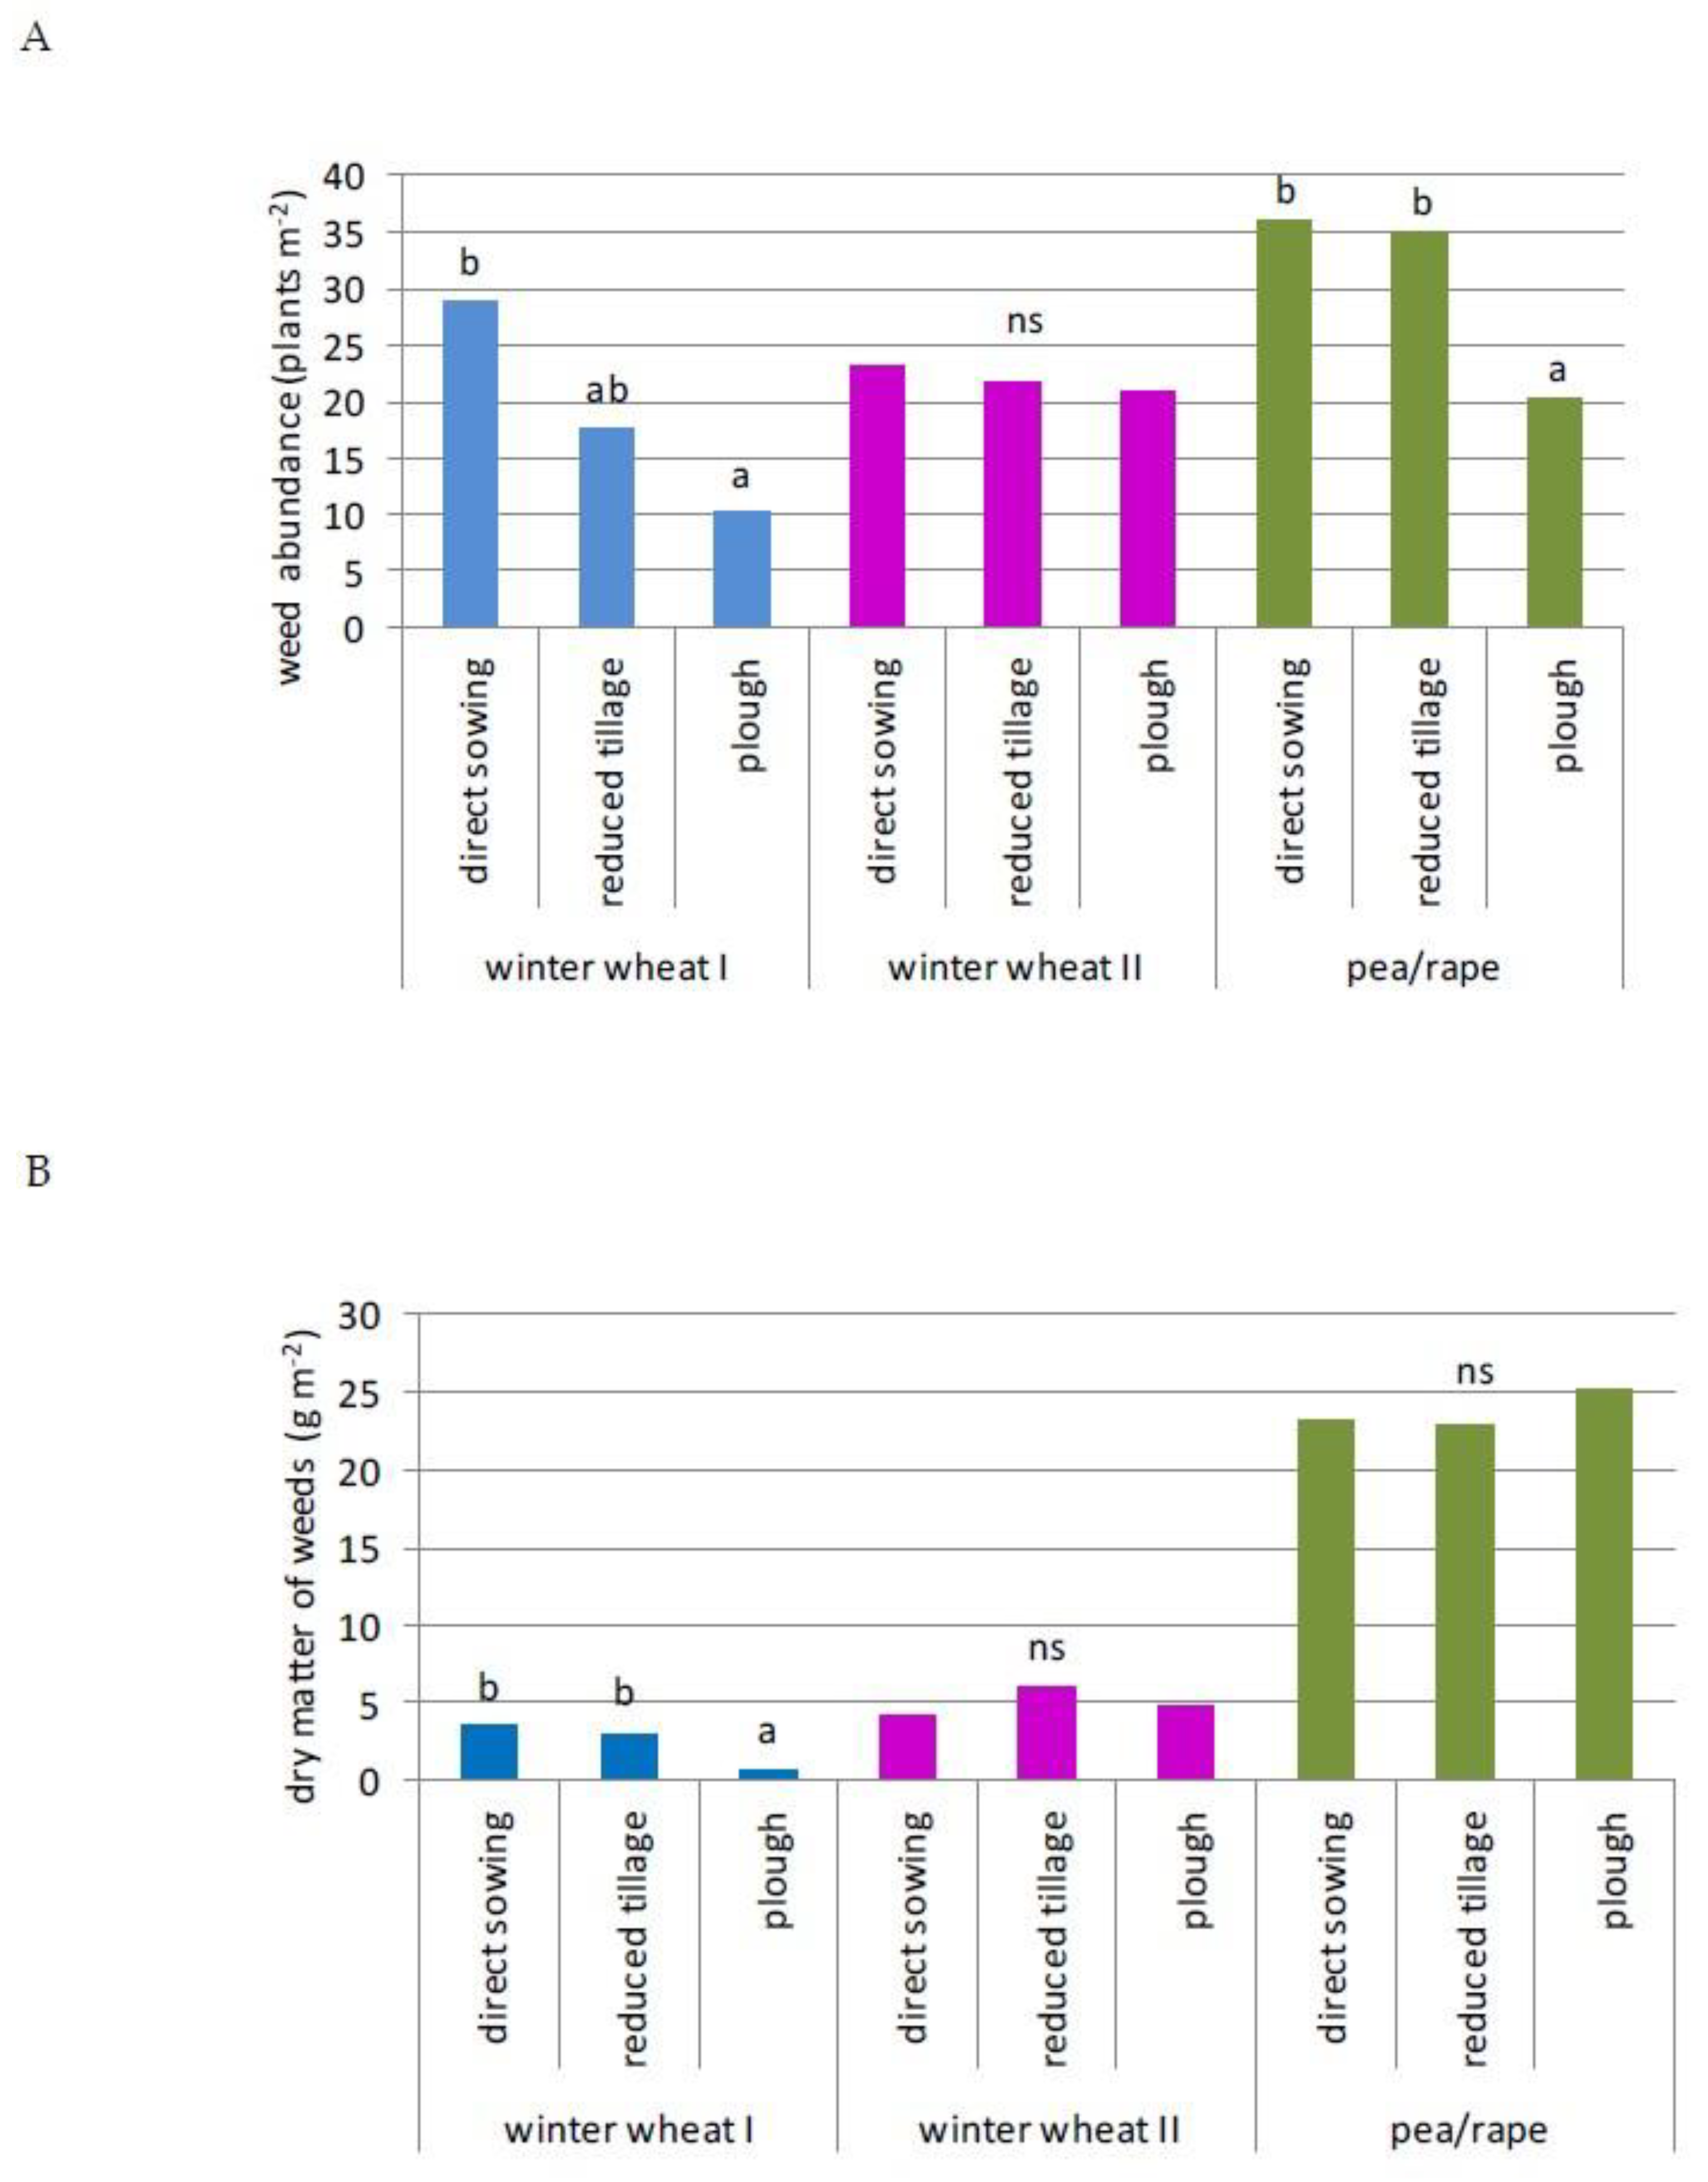
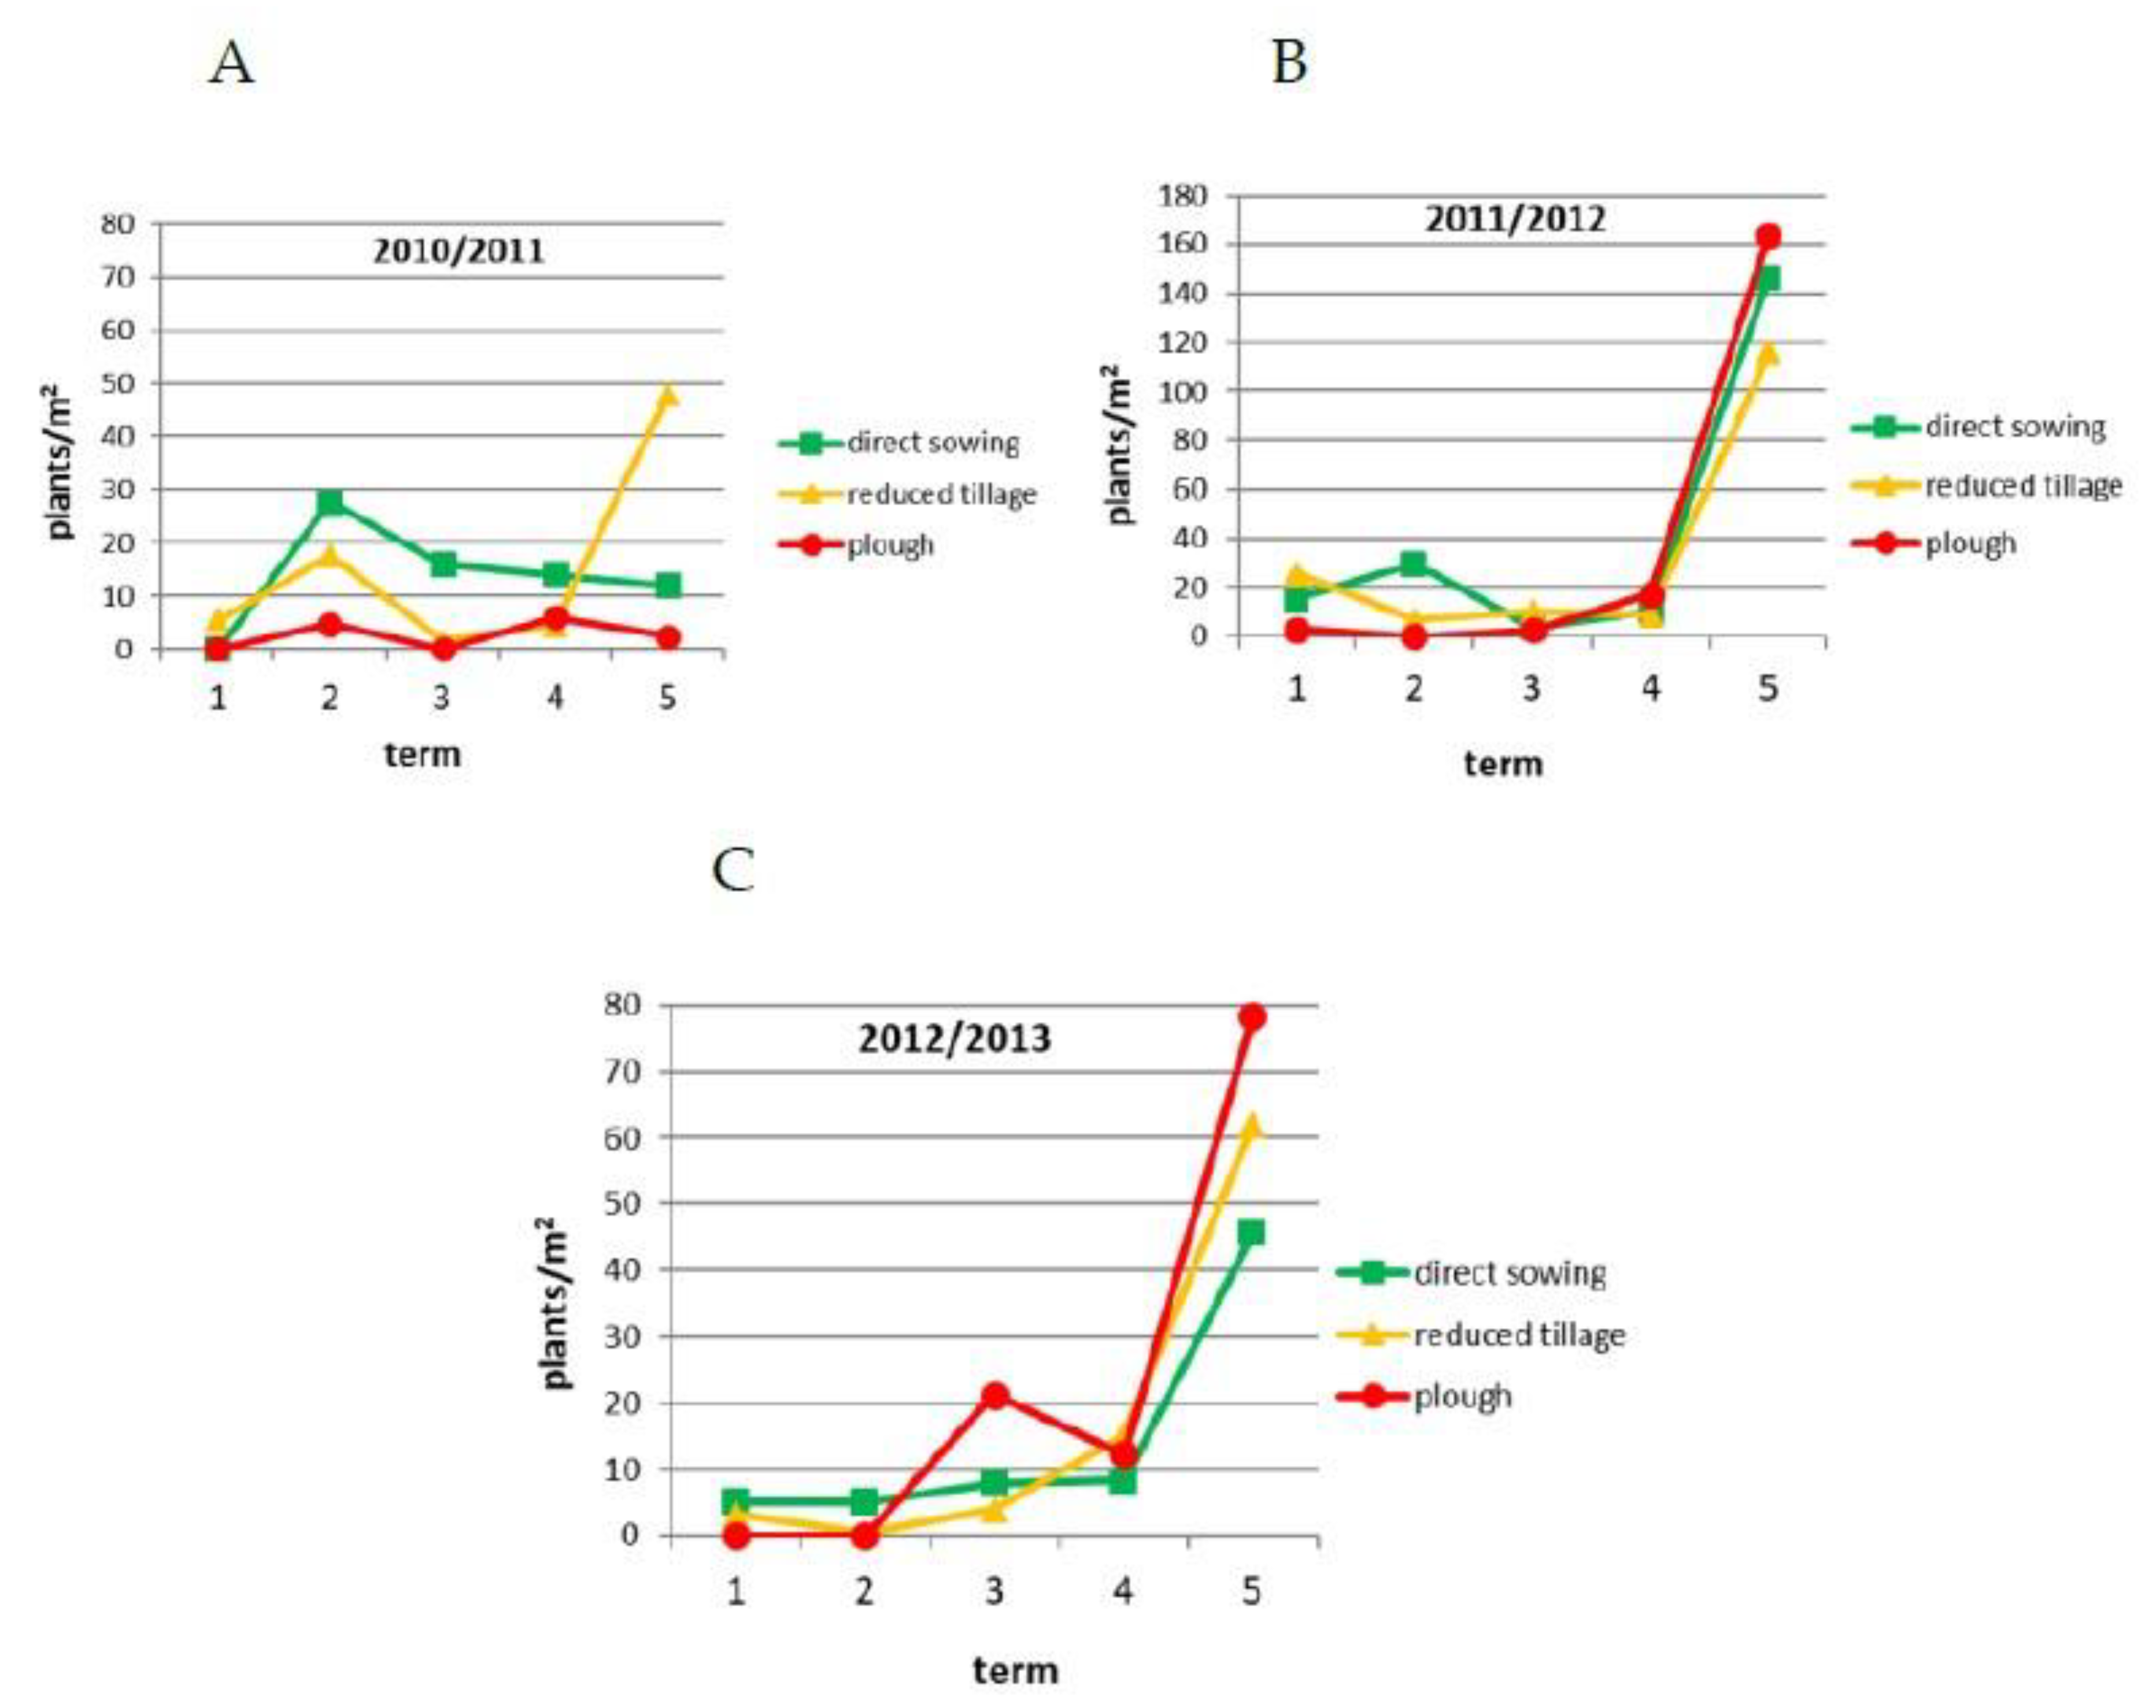
3.1. Above-Ground Weed Flora in the Different Tillage Systems

The average number of weeds and their dry matter did not differ significantly in the three tillage systems studied, but a tendency of increasing weed infestation in line with tillage simplification was found (Figure 4). The number of weeds (on average from all of the assessments of crops in rotation) in the plough tillage system was 22.2 plants m−2, under the reduced tillage conditions it was 20% higher, while under direct sowing it was 33% higher. The dry weight of weeds in the plough system was 9.0 g m−2, while in the reduced tillage system it was higher by 23% and in the no-till system by 28% in comparison to the plough system (Figure 4). The number and weight of weeds observed in all the cultivation systems was low due to intensive herbicide protection, including glyphosate (Table 3), which was very effective in weed control in all compared tillage systems. A higher weed abundance and density under reduced tillage as compared to plough has been confirmed by earlier studies [38,39,40]. Demjanová et al. [41] indicated that reduced soil tillage in maize was accompanied with significantly higher weed biomass compared to moldboard ploughing. Similarly, in the studies by Woźniak et al. [42] and Vakali et al. [43], a greater weed infestation of spring wheat and barley occurred in no-till and reduced tillage than in conventionally ploughed fields.
When analysing the weed infestation of individual crops, a significantly higher number and weight of weeds were found in winter wheat (I) under the direct sowing system as compared to the plough system (Figure 5A,B). In the wheat grown after wheat I (wheat II), the differences between tillage systems in the number and weight of weeds were insignificant. Armengot et al. [21] also found that total weed coverage was higher under reduced tillage, although this result was not consistent for different crops. In the study by Woźniak [44], no-plough tillage significantly increased the number and air-dried weight of weeds in winter wheat canopy as compared to ploughed tillage. In the studies by Starczewski and Czarnocki [45], triticale tillage simplifications resulted in a tendency to increase weed infestation, but a significant increase in their fresh and dry weight was only observed on no-till plots. In research of these authors, in the fields where soil tillage simplifications were applied, an increase in weed infestation was observed despite of the use of herbicides, as is the case in this present research.
Examples of the dynamics of weed infestation of winter wheat I (spring wheat in 2012) at different research dates and tillage systems are presented in Figure 6A,C. These tendencies were not constant, and various dependencies on weed abundance in the different tillage systems were found in particular study dates and years. In the first year of the study (2010/2011) the plough tillage system was characterized by the lowest number of weeds (Figure 6A), while in the last term of analysis (2012/2013) it was the highest (Figure 6C). The large number of weeds at the last term in the 2011/2012 season was associated with the poor wintering of winter wheat and low crop competitiveness (Figure 6B).
Analyses of weed flora biodiversity occurring in crops grown under different tillage systems showed a similar number of species (38–40), but differences in species composition occurred (Table 4). In the plough system the dominant species were Fallopia convolvulus and Galeopsis tetrahit, while under reduced tillage they were: Fallopia convolvulus and Viola arvensis (Table 4 and Table 5). Plough cultivation was accompanied by a larger number of Stellaria media, Thlaspi arvense, Sinapis arvensis, Anthemis arvensis and Brassica napus volunteers than in the other systems.
In crops sown directly, there was a larger number of Galium aparine, Veronica persica, Capsella bursa-pastoris, Lamium purpureum, Echinochloa crus-galli and Setaria glauca than in the other cultivation systems (Table 4 and Table 5). There was also a higher occurrence of perennial species: Equisetum arvense, Plantago major and Sonchus arvensis in comparison to the traditional ploughing. Only in the direct sowing system were Sonchus oleraceus, Melandium album and Anagallis arvensis found, while only in the plough system were Polygonum persicaria, Rumex obtusifolius, Lapsana communis and Arctium lappa found. Cardina et al.’s [11] study confirmed that, in no-tillage plots, the density of Veronica sp. was higher compared to moldboard plough plots.
Reduced cultivation was characterised by a higher occurrence of Fallopia convolvulus, Viola arvensis, Chenopodium album, Fumaria officinalis, Tripleurospermum inodorum, Descurainia sophia, Apera spica-venti, Galinsoga parviflora, Consolida regalis and the exclusive occurrence of Veronica hederifolia, Raphanus raphanistrum and Senecio vulgaris (Table 4 and Table 5). Similarly, Clements et al. [46] found that Chenopodium album dominated the aboveground weed population in chisel ploughing in comparison with moldboard ploughing and no-till.
Invasive alien weed species (IAS), which pose a threat to the biodiversity and the economy or human health, were more numerous in the reduced tillage systems compared to ploughing (Table 4). Most species belonged to the lowest invasiveness category (I) according to Tokarska-Guzik et al. [47]. It is worth emphasizing that, despite the greater number of invasive weeds in reduced and no-till systems, the number of weeds was not large (5.5 plants m−2 in total in no-till system and 2.1 plants m−2 in reduced tillage vs. 0.4 plants m−2 in plough system) (Table 4), due to effective chemical control using herbicides (Table 3). Other authors also draw attention to the risks associated with the presence of invasive species in reduced tillage systems [13]. In the research of Woźniak [44], the replacement of ploughing with harrowing caused an increase of two dominating species in the weed population: Echinochloa crus-galli and Viola arvensis.
Weed biodiversity as measured by Shannon’s index was the highest under reduced tillage—2.56, due to the most even share of weed species in the community (Table 4). The direct sowing system was characterized by the lowest value of the Shannon’s diversity index—2.28 and a high value of the Simpson’s dominance index—0.15, due to the domination of two species: Galium aparine and Fallopia convolvulus. Travlos et al.’s [13] review states that conservation tillage systems seem to be associated with higher weed richness and diversity, as the elimination of ploughing creates more enhancing conditions for some weed species. However, they found some cases where reduced tillage systems led to less diverse weed communities compared to more intensive tillage systems due to the domination of some weed species.
According to Legere et al. [27], the tillage method has little impact on weed diversity as expressed by diversity indices, but plays a key role in shaping the species composition of the weed community. Similarly, Sans et al. [48], in their research on tillage systems under the conditions of organic farming, did not find significant differences in Shannon’s diversity index values for weed communities in cereal crops, but observed a significantly higher degree of weed coverage in the reduced tillage system compared to the plough system. Plaza et al. [12], based on a 23-year long experiment, found that no large differences between tillage systems had arisen that was related to weed diversity. They only found that no-till appeared to support more species than the two other tillage systems. In addition, their species richness and Shannon diversity index varied greatly through the years in all the tillage systems. This indicates that research on weed diversity and changes as a result of different tillage methods should be carried out over many years, as too short a period of observation may lead to the divergent results that can be found in the literature. This was confirmed by Woźniak [44], who found that Shannon’s diversity index values for weed species composition in winter wheat were similar for different tillage systems and more diverse between study years.
The share of perennial species in the weed community in the no-tillage system was about two times higher than in the plough and reduced tillage systems (Figure 7). However, the high level of agricultural culture and the use of herbicides, especially glyphosate, prevented the excessive occurrence of perennial weeds, also in the no-till system. This has also been confirmed by other authors [49]. According to some authors, tillage simplification promotes an increase in perennial weeds in the field, mainly Elymus repens [19,50]. Starczewski and Czarnocki [45] found that, under a cultivation reduction system for winter triticale, perennial weeds were a major problem, while traditional ploughing effectively eliminated them. Bilalis et al. [25] found that three annual species prevailed in the conventional and minimum tillage systems, while one perennial species prevailed in the no-tillage system. Not using glyphosate in the no-tillage system leads to an increase in the abundance of perennial weeds, especially Cirsium arvense, Elymus repens and Convolvulus arvensis [51].
The comparison of weed communities occurring in plants grown under different tillage systems showed that there was a bigger qualitative than quantitative similarity, i.e., a bigger similarity in species composition than in the number of common species (Table 6), which is also confirmed by the results of Zanin et al. [24] and Duer and Feledyn-Szewczyk [52]. Sorensen’s qualitative and quantitative similarity indices showed that weed communities in the direct sowing and ploughing systems were the least similar.

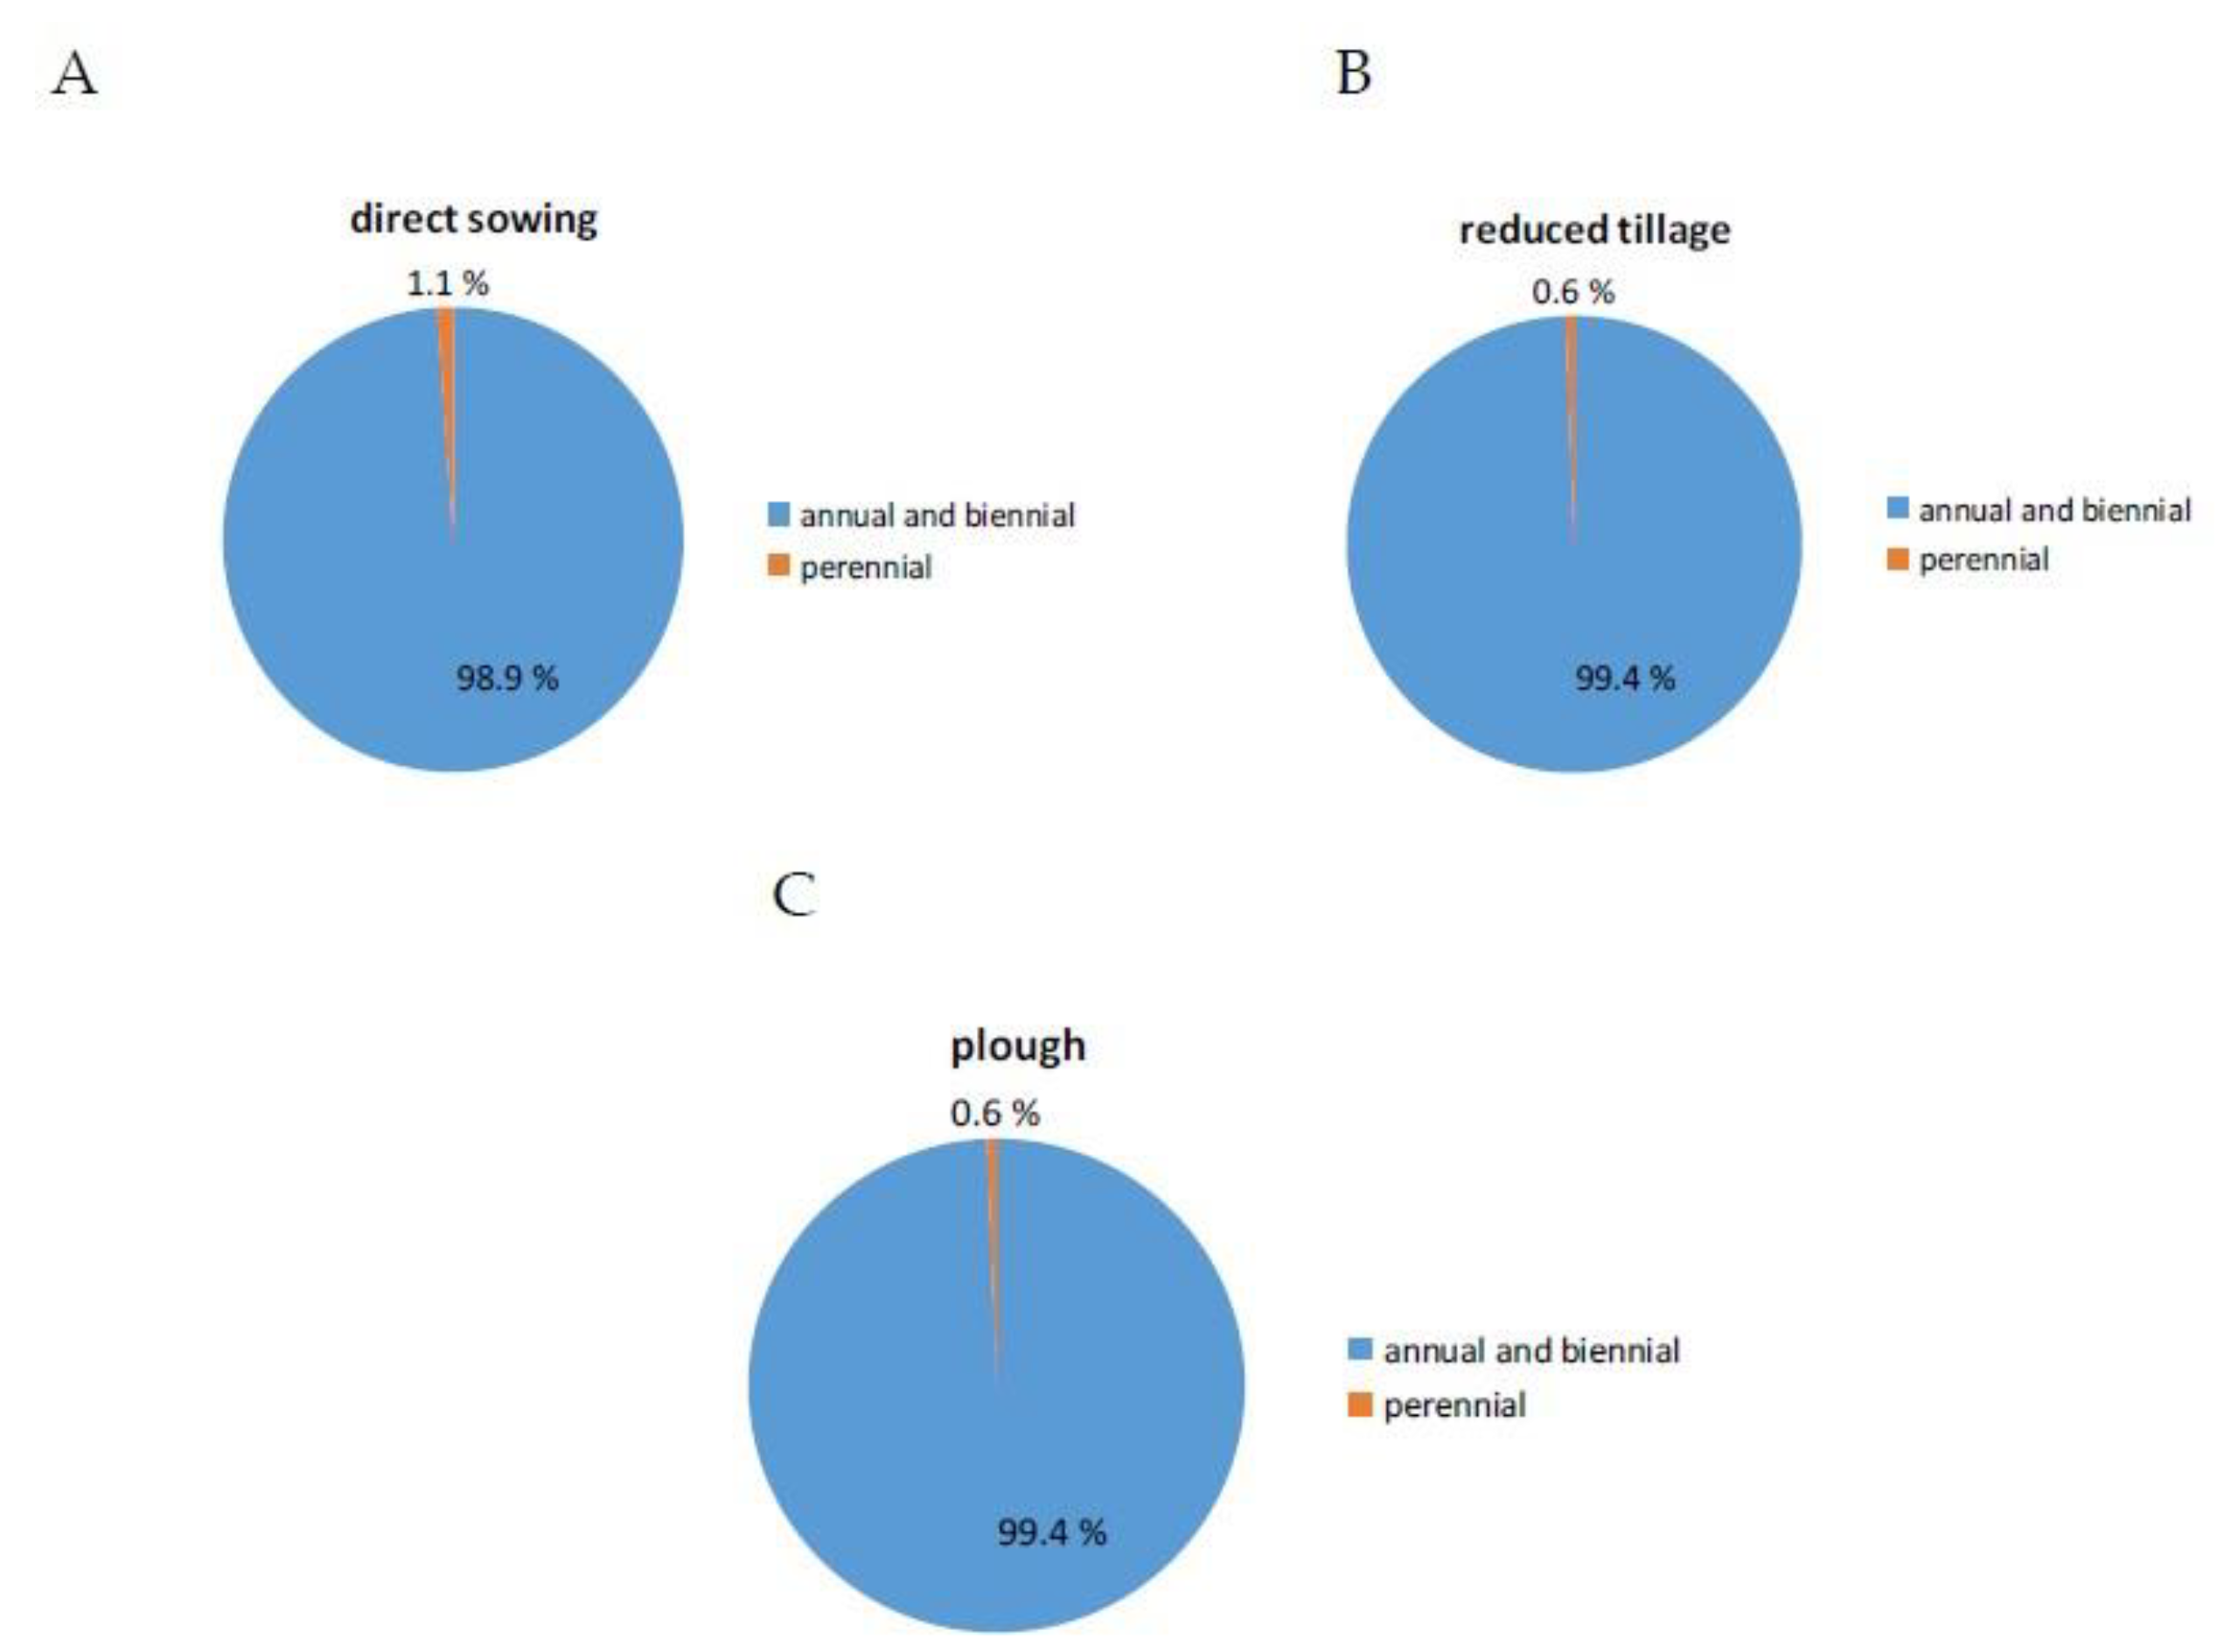
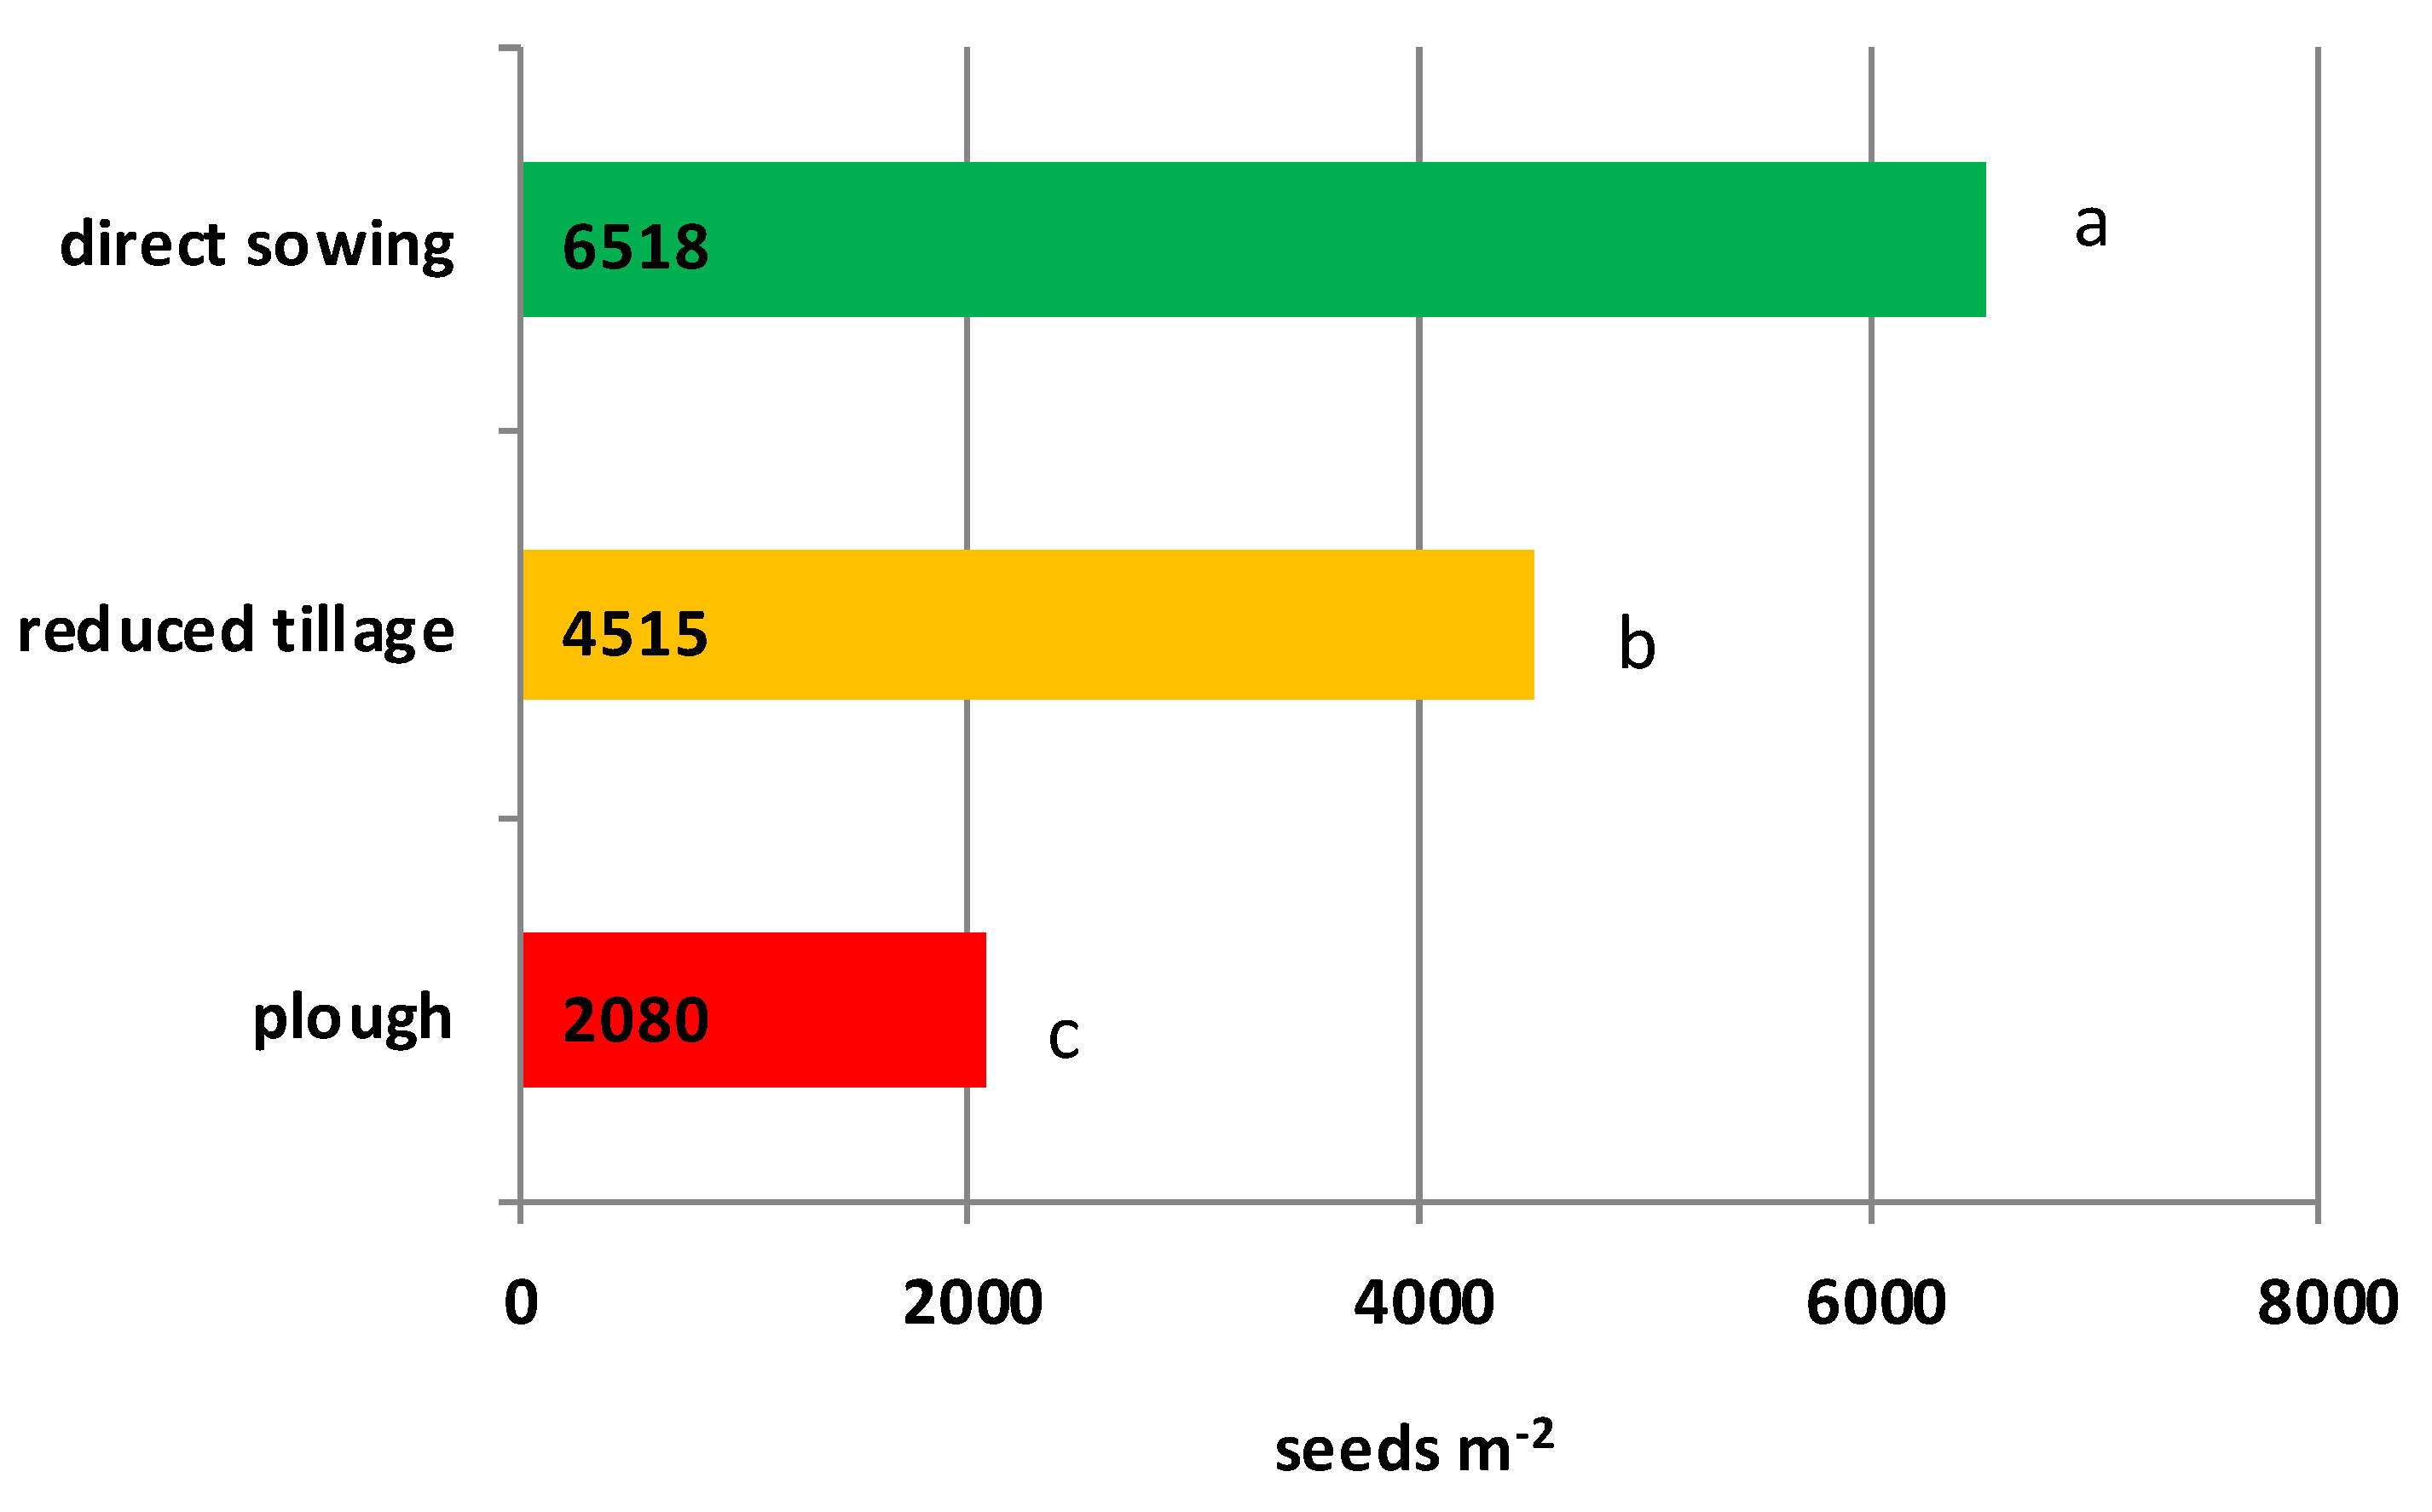
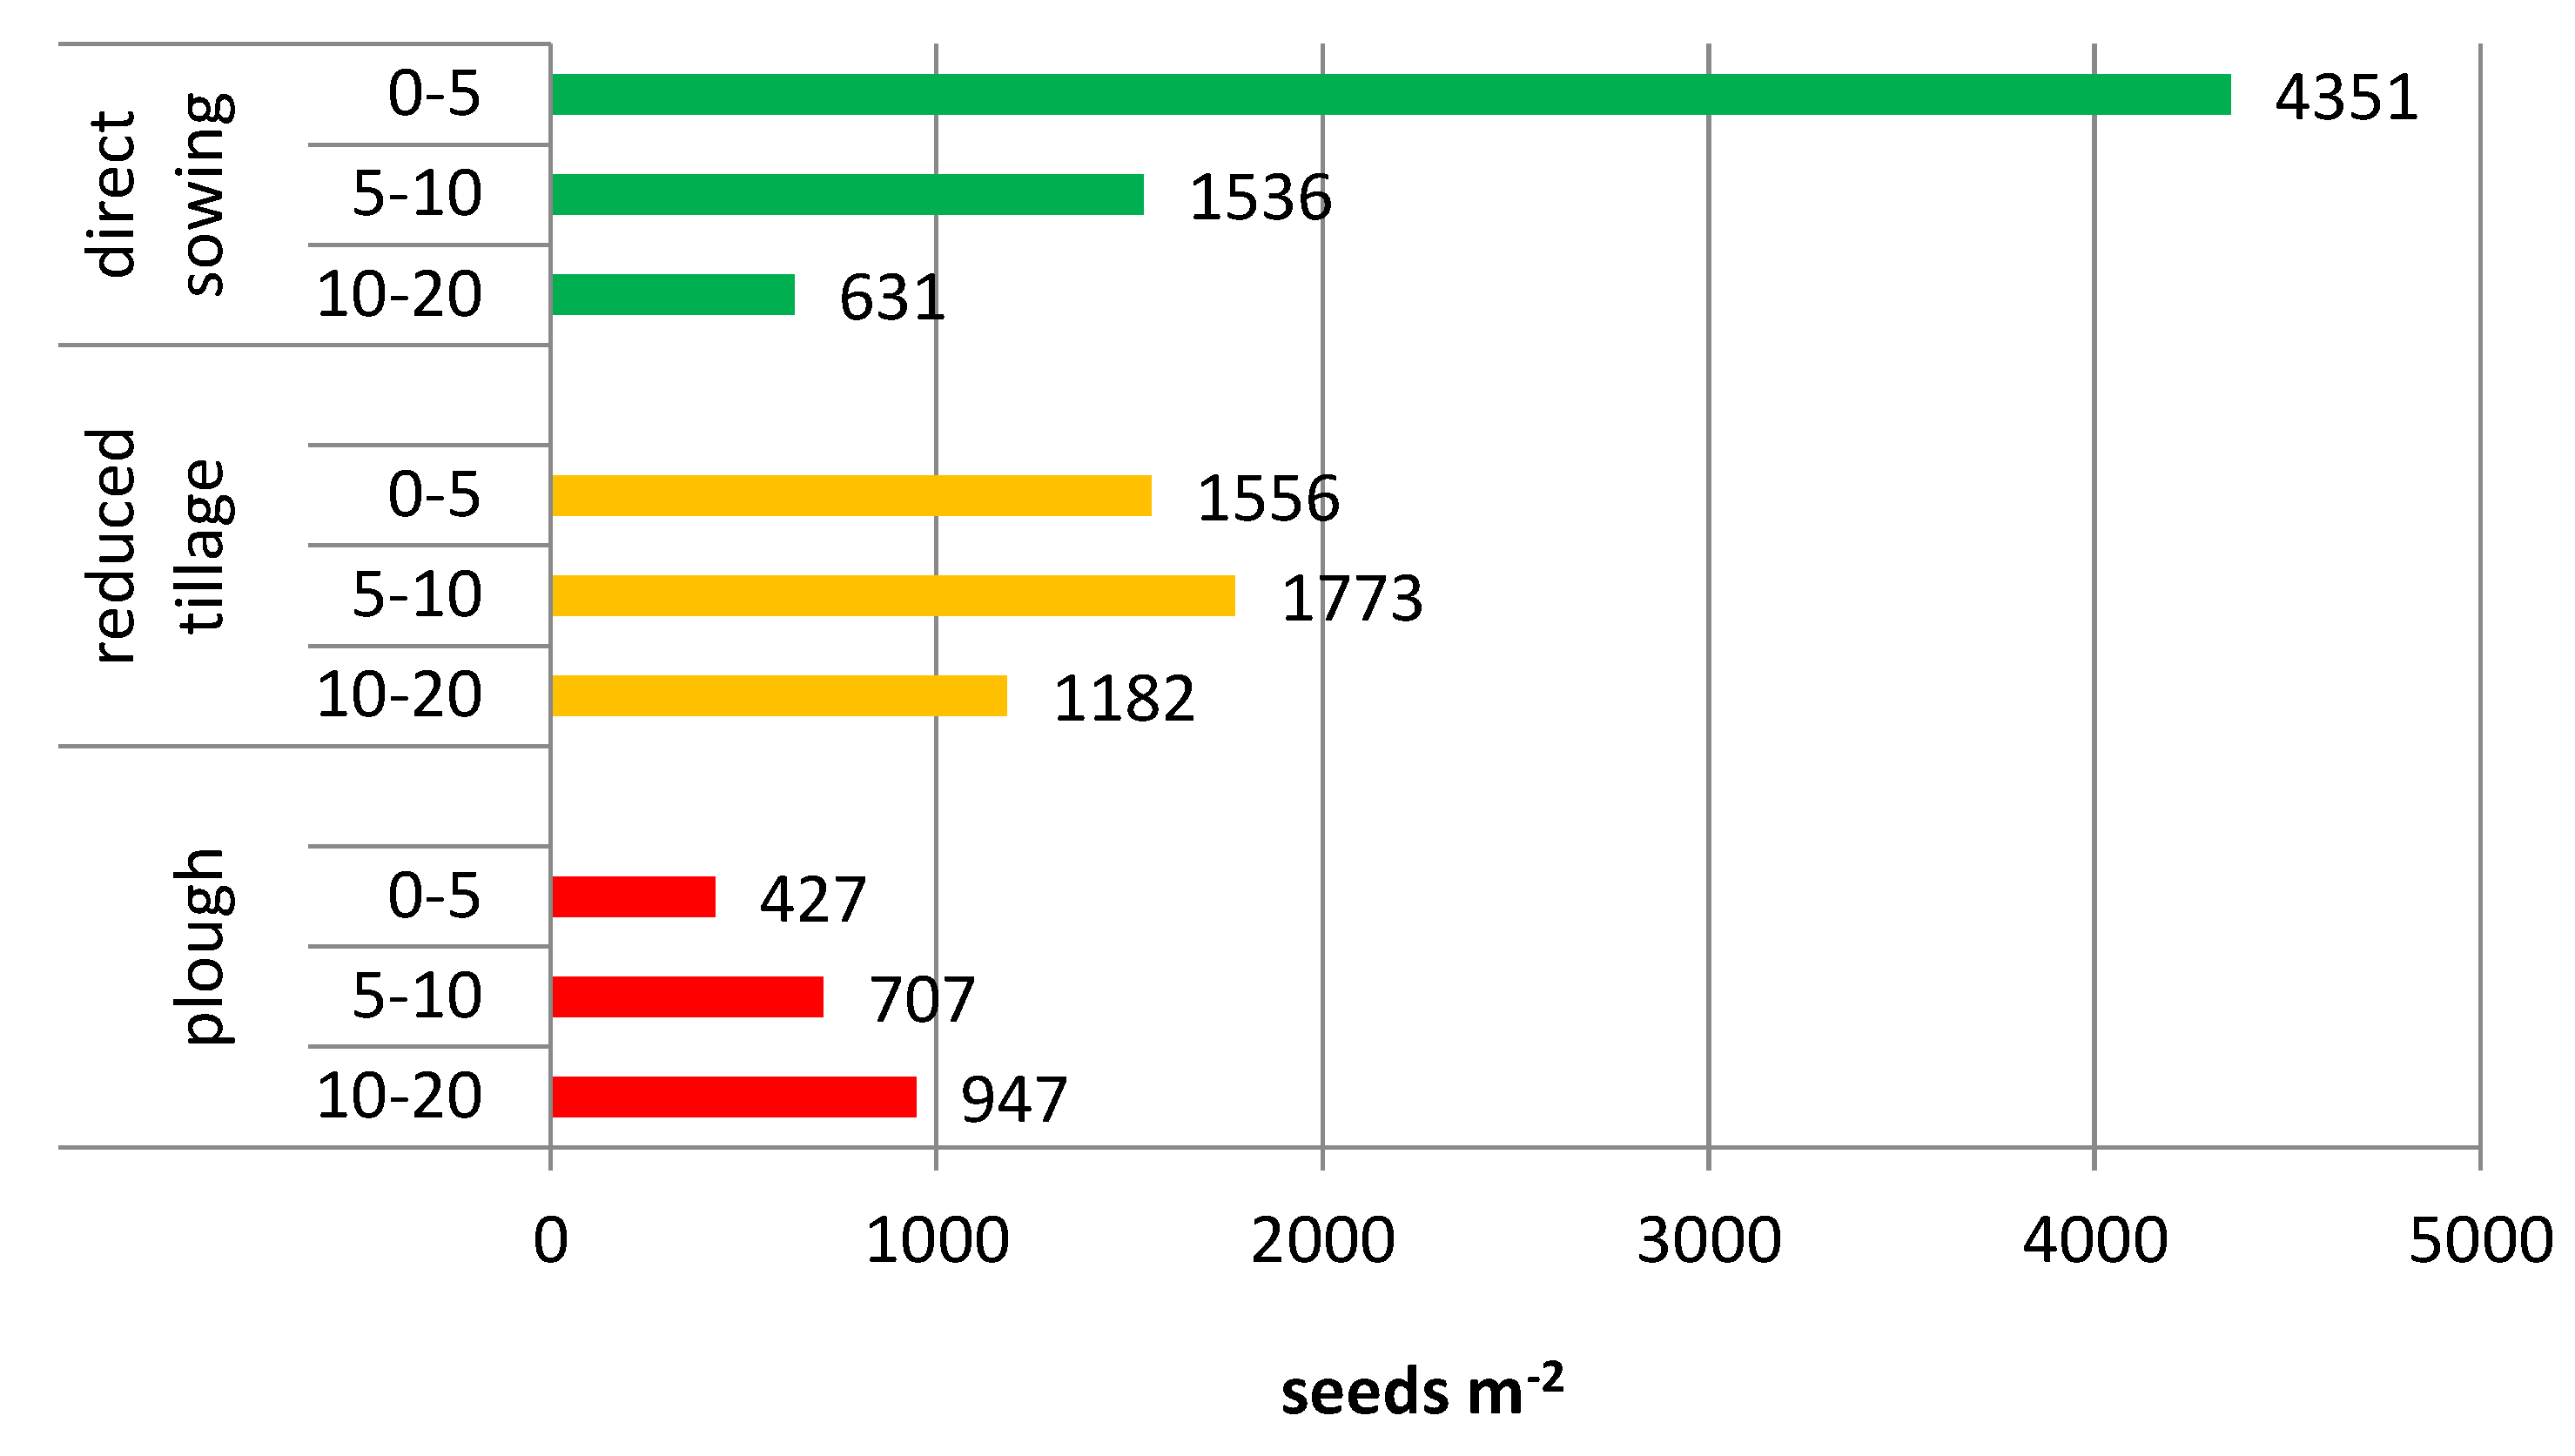
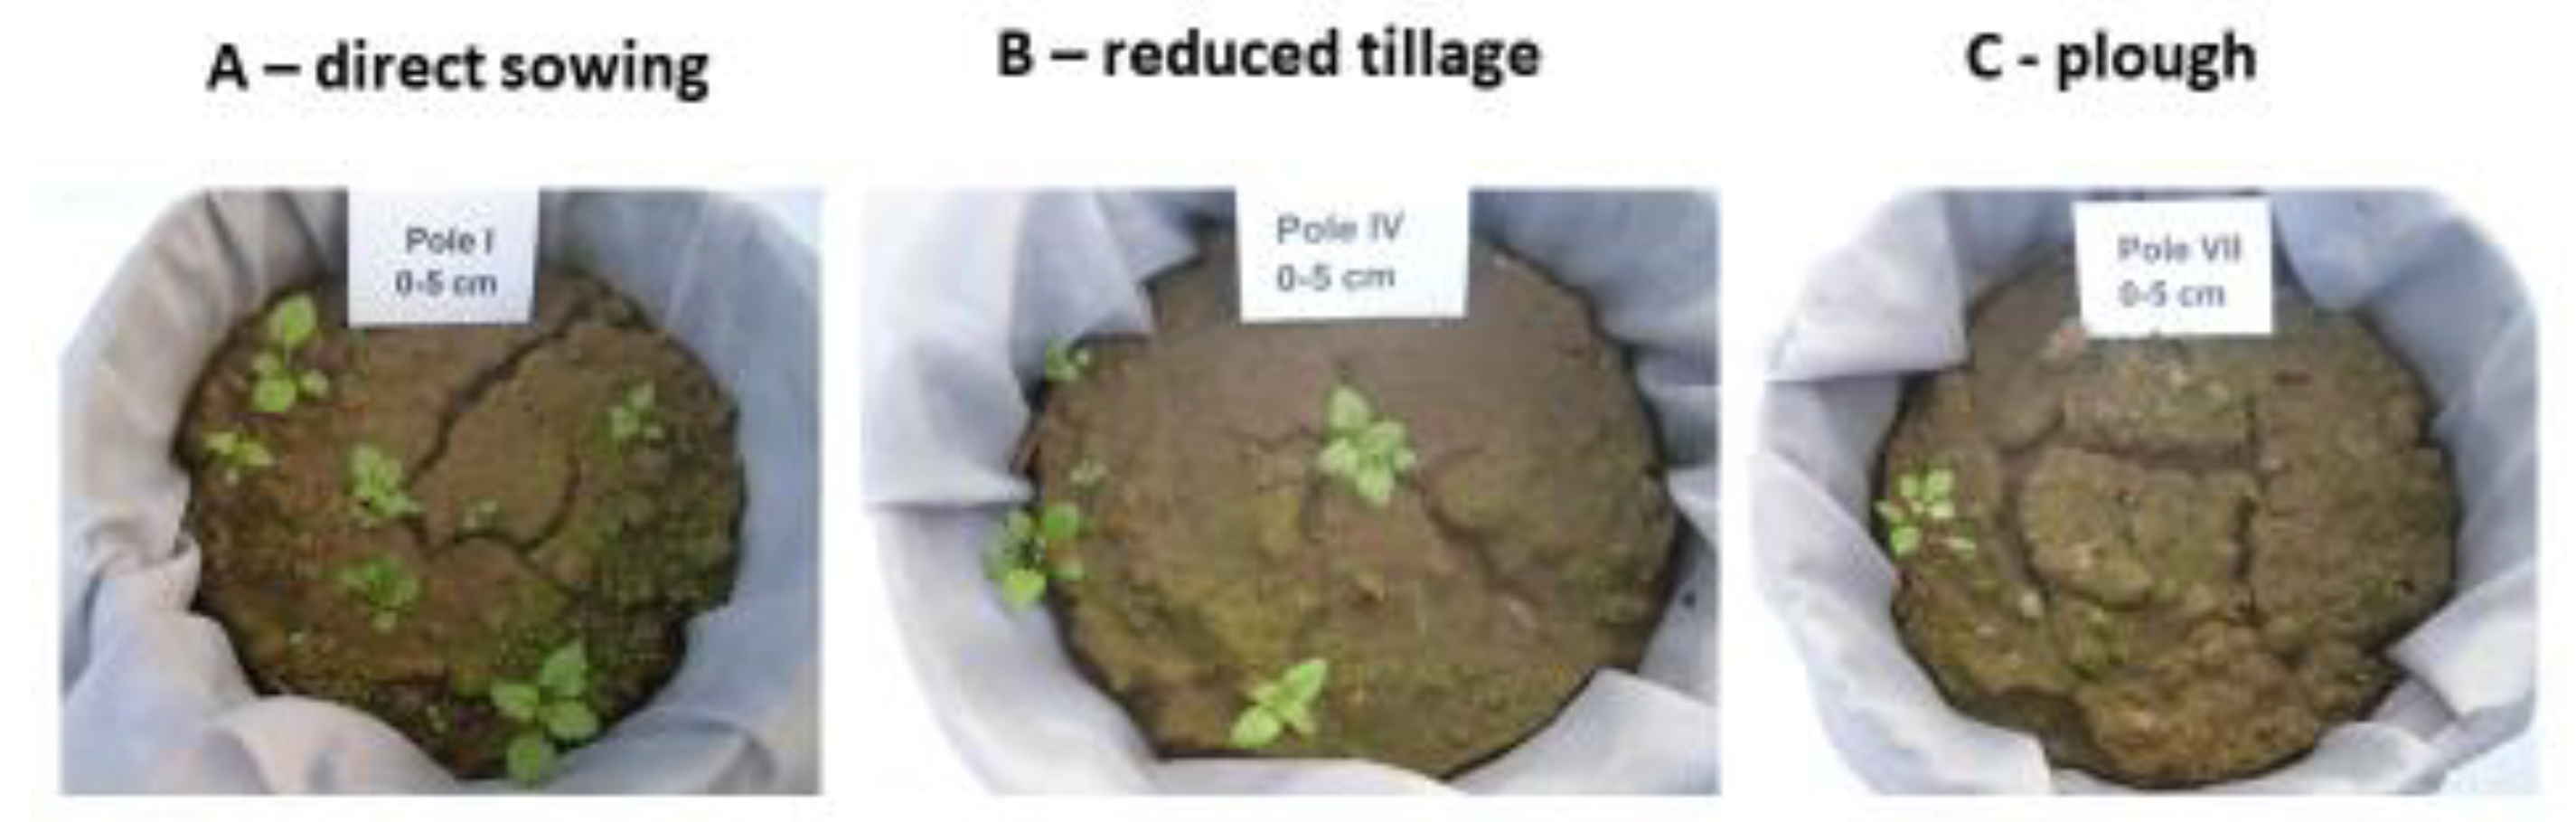
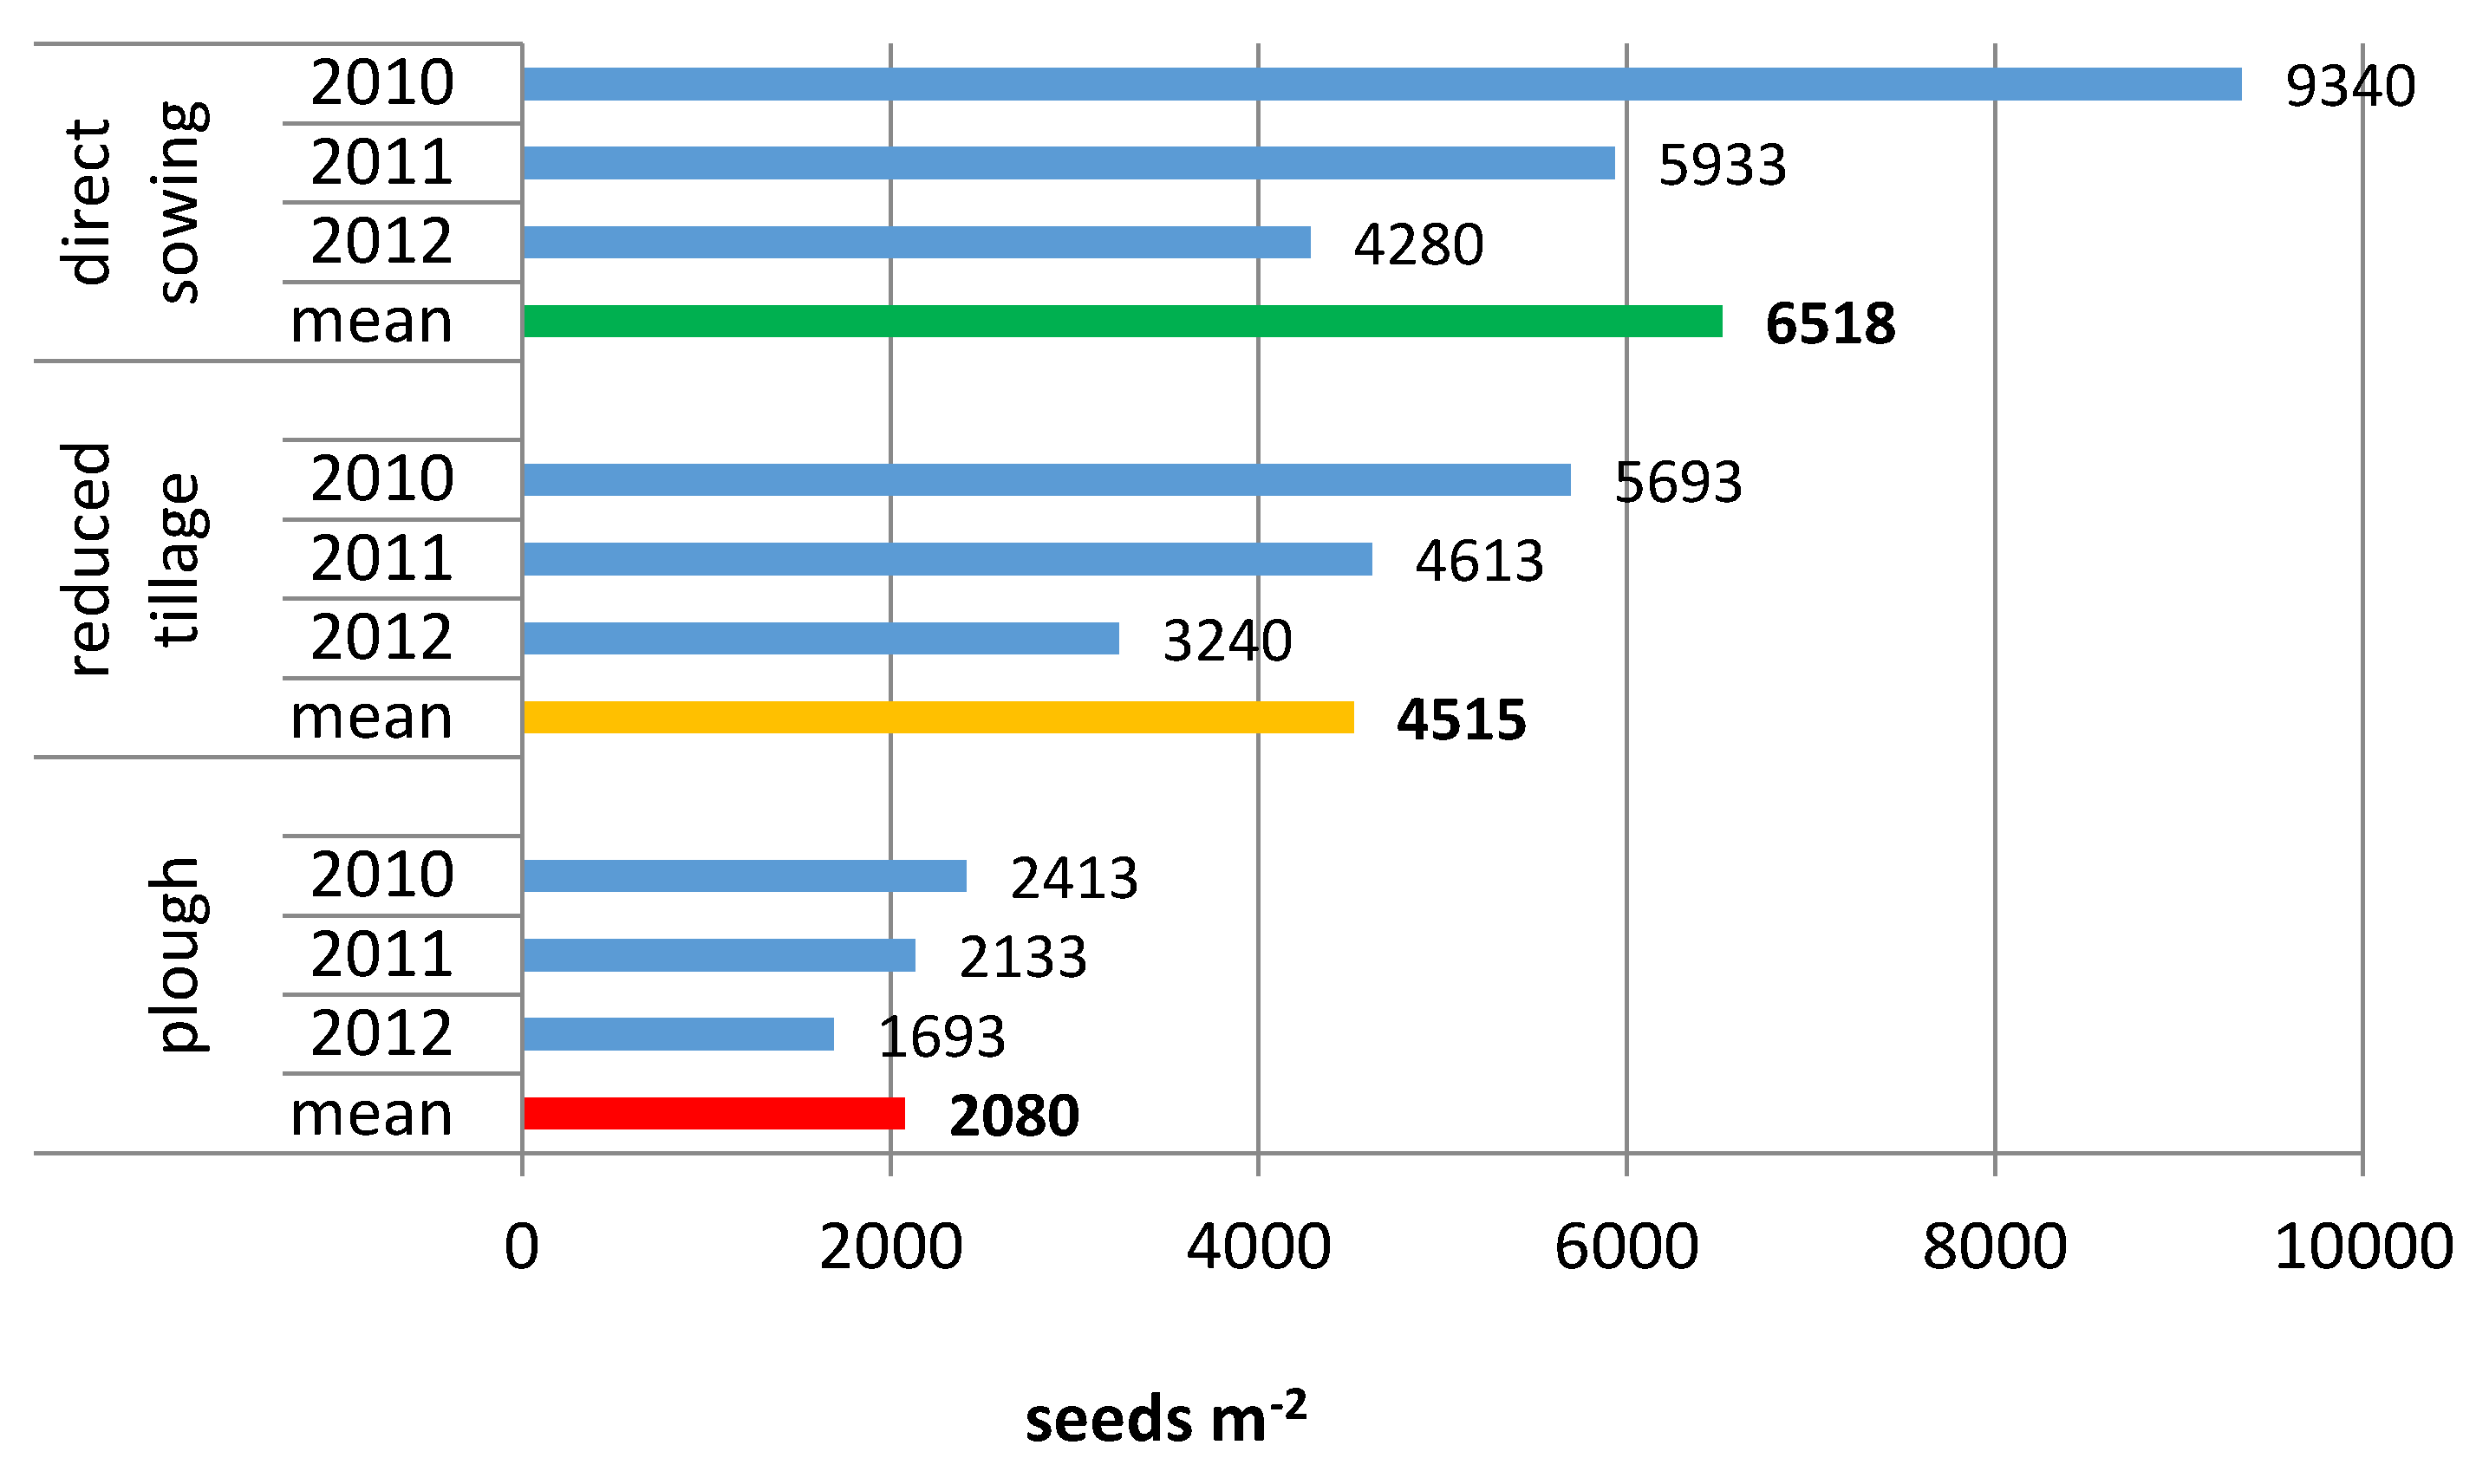
3.2. Soil Seed Bank in Different Soil Tillage Systems

The number of weed seeds was dependent on the tillage system and soil layer. The average number of weed seeds in the 0–20 cm soil layer was significantly the highest under the no-till system (6518 seeds m−2) and over 3 times lower in the fields where traditional ploughing was performed (2080 seeds m−2) (Figure 8). In Vanasse and Leroux’s [53] study, ridge-tilled fields had a larger soil seedbank (2992 seeds m−2) than moldboard-plowed fields (1481 seeds m−2) in the top 15 cm layer. They explained that the results were due to the larger perennial seedbank in reduced tillage fields at both the 0–5 cm and 5–15 cm depths.
The vertical distribution of weed seeds in the soil depended on the tillage system. In fields where the soil profile was not affected by tillage (direct sowing), the vast majority of seeds were at a depth of up to 5 cm and their number decreased rapidly in line with the depth (Figure 9 and Figure 10). The distribution of seeds in the soil profile of the ploughing system was reversed, where as a result of soil inversion, a large part of the seeds from the soil surface was moved to the layers 5–10 and 10–20 cm. In the fields where simplified tillage was applied, the seed distribution was variable. Reduced tillage caused an increase in the number of diasporas in the 0–10 cm layer and a decrease in the number of weed seeds in the deeper soil layer (10–20 cm). Piskier and Sekutowski [54] found that in corn cultivation, the highest weed seeds number were recorded in the soil samples collected from the 0–5 cm soil layer in both the no-tillage and reduced tillage systems. In conventional tillage (plough) they noted that weed seeds were more evenly distributed throughout all of the 0–20 cm soil layer. This is in line with the results of Clements et al. [46], who found that more than 60% of the weed seedbank was concentrated in the upper 5 cm of soil in chisel plow and no-till systems. They additionally found that the seedbank of the moldboard plough system was more uniformly distributed over depth, but, contrary to our results, was larger than in the other systems.
In all tillage systems, a decrease in the weed seed stock was found in subsequent years of the study, with the most significant decrease being in the direct sowing system and the smallest decrease being in the plough system (Figure 11). This is probably the result of intensive chemical weed control for years, including glyphosate, as presented in Table 3, which caused decrease in seeds reservoir. In Fracchiolla et al.’s study [26], the seed bank was clearly impoverished after the long-term applications of preemergence herbicides, both in terms of richness and of diversity.
The greatest diversity of species during the three years of research was noted in the seed bank under direct sowing (30 species in total), which could also be associated with a much higher number of seeds occurring in the 0–20 cm layer compared to the other systems (Table 7). A similar number of weed seed species (29) was found in the seedbank of fields where simplified tillage was applied, while the smallest number was recorded in the plough system (22 species).
Despite the highest number of weed seed species being in the no-till system, the weed seed pool was characterized by a low value of Shannon’s diversity index (2.04) and a high value of Simpson’s domination index (0.18), indicating the dominance of particular weed species: Capsella bursa-pastoris, Apera spica venti, Viola arvensis and Veronica persica (Table 7). The results of Conn’s [38] research confirm the high abundance of common, annual weed species with small seeds, such as Apera spica-venti, Viola arvensis, Capsella bursa pastoris, and Veronica persica under reduced tillage and direct sowing systems. A larger number of Apera spica-venti and Viola arvensis in the reduced tillage system compared to the traditional one was also observed by Sekutowski and Smagacz [24], whereas Krawczyk et al. [55] observed a decreasing number of these two species along with tillage simplifications.
In our study, the share of weed seeds in the soil in the plough system was the most evenly distributed and it is difficult to indicate dominant species, as evidenced by the high value of Shannon’s diversity index (2.4) and the low value of Simpson’s dominance index (0.11). Diversity indices used by Cardina et al. [15] and Borin et al. [56], comparing the structure of the soil seed bank under traditional and simplified tillage, showed that an increase in the frequency of tillage operations resulted in a decrease in species diversity of weed seeds. Sekutowski and Smagacz [23] pointed out the lower values of Shannon’s diversity index and the higher values of Simpson’s dominance index for the aboveground weed flora and soil seed bank in reduced tillage systems compared to the plough system. Feldman et al. [9] found a bigger species diversity in the soil seed bank of systems that cause less soil disturbance, i.e., in the reduced and zero tillage systems. Cardina et al. [11], on the basis of 35 years of research, concluded that the amount of seeds in the soil is more affected by crop rotations than by tillage methods (plough, simplified, or no-till). The authors also demonstrated a significant interaction of crop rotations and tillage system.
Some studies have revealed a direct correlation between the presence of specific weed species and the tillage system [3]. In our research, under the reduced and no-till systems, there was a higher percentage of seeds of invasive species in the soil, such as: Veronica persica, Conyza canadensis, Echinochloa crus-galli, Amaranthus retroflexus and Galinsoga parviflora (Table 7), although the latter two species occurred only in the no-till system. Similar to above-ground weed flora, most invasive species in soil seed bank belonged to the lowest (I) category of invasiveness [45]. Only Conyza canadensis represented the species of the highest invasiveness (IV category). Fracchoiolla et al. [26] also observed that seed bank of Conyza canadensis was higher in reduced tillage plots in comparison with conventional tillage fields. The study carried out by Sheley et al. [57] showed that invasive weeds are inclined to recover rapidly when tillage is interrupted. Shifts in plant communities are usually described or quantified by means of the various existing abundance and diversity indices.
Under the reduced and no-till systems there was a higher number of seeds of perennial species: Sonchus arvensis, Plantago major and Descurainia sophia, which is considered a ruderal species [58]. Similarly, in the study of Thomas et al. [59], perennial species such as Sonchus arvensis and Cirsium arvense were associated with reduced and no-till systems, while annual species were associated with a wider range of tillage systems.
The depth at which the seeds are placed in the soil is a factor that indirectly influences their germination capacity, since this involves differences in temperature, oxygen and light, i.e., the intensity of the factors directly affecting the germination process. Particularly sensitive to depth are fine-size seeds, for example, Stellaria media, which germinate best from a depth of 0.6 cm to 1.2 cm [33]. The seeds of Descurainia sophia germinate both in light and in the dark, although the access of light stimulates this process. The germination capacity of Descurainia sophia and Apera spica-venti seeds depends significantly on the sowing depth and they germinate the best from the soil surface [58]. The most numerous emergences of Echinochloa crus-galli were recorded when the seeds were placed at a depth of 1.5 to 3.0 cm [58]. Grundy et al. [60] observed that chamomile weeds, Stellaria media, Veronica persica, Veronica arvensis and Polygonum aviculare responded with a deterioration of germination capacity according to increasing soil depth, while Chenopodium album germinated less from the soil surface. Galeopsis tetrahit and Thlaspi arvense germinate 50% more when exposed to light, hence the higher amount of these weed seeds germinating in the ploughed and reduced tillage systems compared to the direct sowing system were observed.
The soil seed banks in the tested tillage systems were similar in terms of species composition, as indicated by similar values of the qualitative Sorensen’s similarity index (77–78) (Table 8). Similar to the aboveground flora, the qualitative similarity of the seed stock in soil was higher than the quantitative similarity (Table 6 and Table 8). Bigger differences between the tillage systems occurred in the values of the quantitative similarity index (36–57). The least similar were the seed banks in the plough system and direct sowing, similarly as for the aboveground weed flora (Table 6 and Table 8).
The results show that the consequence of the application of tillage simplifications is an increase in the number of seeds in the top layer of soil, which leads to an increase in the weed population in the crop canopy. Moreover, tillage reduction leads to an increase in the abundance of perennial and invasive weed species. Maintaining weed infestation at a level that does not significantly affect winter wheat yields (below 50 plants m−2 and 50 g m−2 of weed dry matter) is possible with adequately effective herbicide protection. Under effective weed control, an increase in the number of seeds in the topsoil does not adversely affect the competition between weed and crop. Dorado et al.’s [61] results also confirm the necessity of spring weed control in winter cereals when a no-till system is used. A comparison between moldboard and chisel ploughing presented by Ball [62] indicated that weed seeds of predominant species were more prevalent near the soil surface after chisel ploughing. They note that the number of predominant annual weed seed over the three-year period increased more rapidly in the seedbank after chisel ploughing compared to moldboard ploughing and that required effective weed control to produce a decline in the seedbank number. The complete soil cleansing of all weed seeds is not possible due to the complex nature of dormancy and its interaction with environmental factors, although it is possible to reduce the number significantly under the influence of agrotechnical treatments and by a reduction in the supply of new seeds [16]. Attempts are being made to manipulate the dynamics of seed dormancy [1,24,63]. There is ongoing research for methods to interrupt seed dormancy, for example by applying chemical germination stimulants to the soil in order to later effectively destroy all the weeds at the same time [64]. According to Travlos et al. [13], further research is essential in order to understand the complex relationships of weed species and how they are affected by different tillage systems.

4. Conclusions

Weed infestation of wheat and pea/rape fields increased with the simplification of tillage. The seed bank was the largest under direct sowing, and was about three times smaller in traditional ploughing. Under direct sowing, most weed seeds were accumulated in the top soil layer 0–5 cm, while in the ploughing system most weed seeds occurred in deeper layers: 5–10 and 10–20 cm. In the systems of reduced and no-till, a greater share of invasive species was observed, e.g., Veronica persica, Galinsoga parviflora, Echinochloa crus-galli, Setaria glauca (above-ground weed flora), Conyza canadensis, Galinsoga parviflora, Amarantus retroflexus (weed seed bank) and perennial species, mainly Sonchus arvensis L. and Plantago major L. The lowest similarity was found between weed communities and soil seed bank in the direct sowing and ploughing system. We conclude that maintaining weed infestation at a level that does not significantly affect winter wheat yields yet eliminates the risk of perennial and invasive weeds in the no-till system is possible with adequate effective herbicide protection. Weed management programs must take this information into account.

Author Contributions

Conceptualization, J.S. and B.F.-S.; methodology, B.F.-S.; validation, C.A.K., E.H. and A.W.; investigation, B.F.-S. and J.S.; data curation, B.F.-S.; writing—original draft preparation, B.F.-S. and J.S.; writing—review and editing, B.F.-S., C.A.K., E.H. and A.W.; visualization, B.F.-S., E.H.; supervision, J.S. and B.F.-S.; project administration, J.S.; funding acquisition, J.S. All authors have read and agreed to the published version of the manuscript.

Funding

The study was carried out under the project “Development of a soil cultivation system for sustainable agriculture” WND-POIG.01.03.01-00-042/09. The publication was prepared under the multi-annual program of IUNG-PIB, Task No 2.1. (2016-2020).

Acknowledgments

The authors thank Adam Berbeć, Ewa Markowska-Strzemska, and Marek Woźniak for their technical support while conducting the experiments and assessments.

Conflicts of Interest

The authors declare no conflict of interest. The funders had no role in the design of the study; in the collection, analyses, or interpretation of data; in the writing of the manuscript; or in the decision to publish the results.

References

  1. Radosevich, S.; Holt, J.; Ghersa, C. Weed Ecology: Implications for Management; John Wiley&Sons, Inc.: Hoboken, NJ, USA, 1997. [Google Scholar]
  2. Patterson, D.T. Effects of environmental stress on weed/crop interactions. Weed Sci. 1995, 43, 483–490. [Google Scholar] [CrossRef]
  3. Buhler, D.D.; Kohler, K.A.; Thompson, R.L. Weed seed bank dynamics during a five-year crop rotation. Weed Technol. 2001, 15, 170–176. [Google Scholar] [CrossRef]
  4. Fracchiolla, M.; Terzi, M.; Frabboni, L.; Caramia, D.; Lasorella, C.; De Giorgio, D.; Montemurro, P.; Cazzato, E. Influence of different soil management practices on ground-flora vegetation in an almond orchard. Renew Agric. Food Syst. 2015. [CrossRef]
  5. Wilson, R.G. Biology of Weed Seeds in the Soil. W: Weed Management in Agroecosystems: Ecological Approaches; Altieri, M.A., Liebman, M., Eds.; CRC Press, Inc.: Boca Raton, FL, USA, 1988; Volume 3, pp. 25–39. [Google Scholar]
  6. Sekutowski, T.; Smagacz, J. Share of anthropophytes in the crop sequence: Winter wheat―Maize―Spring wheat depending on tillage system. Acta Agrobot. 2014, 67, 117–122. [Google Scholar] [CrossRef] [Green Version]
  7. Koller, K. “Techniques of Soil Tillage,” in Soil Tillage in Agroecosystems; Titi, A.E., Ed.; CRC Press: Boca Raton, FL, USA, 2003; pp. 1–25. [Google Scholar]
  8. Smagacz, J. Conservation Soil Tillage―Tendencies and Importance in Contemporary Agriculture. Monografie i Rozprawy Naukowe; IUNG-PIB Puławy: Puławy, Poland, 2018; Volume 59, p. 126. (In Polish) [Google Scholar]
  9. Feldman, S.R.; Torres, C.A.; Lewis, P. The effect of different tillage systems on the composition of the seedbank. Weed Res. 1997, 37, 71–76. [Google Scholar] [CrossRef]
  10. Stevenson, F.C.; Legere, A.; Simard, R.R.; Angers, D.A.; Pageau, D.; Lafond, J. Weed species diversity in spring barley varies with crop rotation and tillage, but not with nutrient source. Weed Sci. 1997, 45, 798–806. [Google Scholar] [CrossRef]
  11. Cardina, J.; Herms, C.P.; Doohan, D.J. Crop rotation and tillage system effects on weed seedbanks. Weed Sci. 2002, 50, 448–460. [Google Scholar] [CrossRef]
  12. Plaza, E.H.; Kozak, M.; Navarrete, L.; Gonzalez-Andujar, J.L. Tillage system did not affect weed diversity in a 23-year experiment in Mediterranean dryland. Agric. Ecosyst. Environ. 2010, 140, 102–105. [Google Scholar] [CrossRef]
  13. Travlos, I.S.; Cheimona, N.; Roussis, I.; Bilalis, D.J. Weed-Species abundance and diversity indices in relation to tillage systems and fertilization front. Environ. Sci. 2018. [Google Scholar] [CrossRef] [Green Version]
  14. Froud-Williams, R.J.; Chancellor, R.J.; Drennan, D.S.H. Influence of cultivation regime upon buried weed seeds in arable cropping systems. J. Appl. Ecol. 1983, 20, 199–208. [Google Scholar] [CrossRef]
  15. Cardina, J.; Regnier, E.; Harrison, K. Long-term tillage effects on seed banks in three Ohio soils. Weed Sci. 1991, 39, 186–194. [Google Scholar] [CrossRef]
  16. Benech-Arnold, R.L.; Sanchez, R.A.; Forcella, F.; Kruk, B.C.; Ghersa, C.M. Environmental control of dormancy in weed seed banks in soil. Field Crops Res. 2000, 67, 105–122. [Google Scholar] [CrossRef]
  17. Dyer, W.E. Exploiting weed seed dormancy and germination requirements through agronomic practices. Weed Sci. 1995, 43, 498–503. [Google Scholar] [CrossRef]
  18. Ghersa, C.M.; Martinez-Ghersa, M.A. Ecological correlates of weed seed size and persistence in the soil under different tilling systems: Implications for weed management. Field Crops Res. 2000, 67, 141–148. [Google Scholar] [CrossRef]
  19. Mayor, J.-P.; Maillard, A. Resultats d'un essai de culture sans labour depuis plus de 20 ans a changins. IV. Stock semencier et maitrise de la flore adventice. Revue Suisse d'agric. 1995, 27, 229–236. [Google Scholar]
  20. Tørresen, K.S.; Skuterud, R.; Tandsaether, H.J.; Hagemo, M.B. Long-term experiments with reduced tillage in spring cereals. I. Effects on weed flora, weed seedbank and grain yield. Crop Protect. 2003, 22, 185–200. [Google Scholar] [CrossRef]
  21. Armengot, L.; Berner, A.; Blanco-Moreno, J.M.; Mäder, P.; Sans, F.X. Long-term feasibility of reduced tillage in organic farming. Agron. Sustain. Develop. 2015, 35, 339–346. [Google Scholar] [CrossRef] [Green Version]
  22. Armengot, L.; Blanco-Moreno, J.M.; Bàrberi, P.; Bocci, G.; Carlesi, S.; Aendekerk, R.; Berner, A.; Celette, F.; Grosse, M.; Huiting, H.; et al. Tillage as a driver of change in weed communities: A functional perspective. Agric. Ecosyst. Environ. 2016, 222, 276–285. [Google Scholar] [CrossRef]
  23. Sekutowski, T.; Smagacz, J. Similarity between soil seed bank and current weed infestation in winter wheat cultivation. J. Res. Appl. Agric. Eng. 2011, 56, 93–98. [Google Scholar]
  24. Zanin, G.; Otto, S.; Riello, L.; Borin, M. Ecological interpretation of weed flora dynamics under different tillage systems. Agriculture, Ecosyst. Environ. 1997, 66, 177–188. [Google Scholar] [CrossRef]
  25. Bilalis, D.; Efthimiadis, P.; Sidiras, N. Effect of three tillage systems on weed flora in a 3-year rotation with four crops. J. Agron. Crop Sci. 2001, 186, 135–141. [Google Scholar] [CrossRef]
  26. Fracchiolla, M.; Stellacci, A.M.; Cazzato, E.; Tedone, L.; Alhajj Ali, S.; De Mastro, G. Effects of Conservative Tillage and Nitrogen Management on Weed Seed Bank after a Seven-Year Durum Wheat—Faba Bean Rotation. Plants 2018, 7, 82. [Google Scholar] [CrossRef] [PubMed] [Green Version]
  27. Legere, A.C.S.F.; Stevenson, F.C.; Benoit, D.L. Diversity and assembly of weed communities: Contrasting responses across cropping systems. Weed Res. 2005, 45, 303–315. [Google Scholar] [CrossRef]
  28. Simpson, R.L.; Allessio Leck, M.; Parker, V.T. Seed Banks: General Concepts and Methodological Issues. In Ecology of Soil Seed Banks; Allessio Leck, M., Parker, V.T., Simpson, R.L., Eds.; Academic Press, Inc.: Cambridge, MA, USA, 1989; Volume 1, pp. 3–8. [Google Scholar]
  29. Forcella, F.; Eradat-Oskoui, K.; Wagner, S.W. Application of weed seedbank ecology to low-input crop management. Ecol. Appl. 1993, 3, 74–83. [Google Scholar] [CrossRef] [PubMed]
  30. Gross, K.L. A comparison of methods for estimating seed numbers in the soil. J. Ecol. 1990, 78, 1079–1093. [Google Scholar] [CrossRef]
  31. Cardina, J.; Sparrow, D.H. A comparison of methods to predict weed seedling populations from the soil seedbank. Weed Sci. 1996, 44, 46–51. [Google Scholar] [CrossRef]
  32. Rutkowski, L. Key to Identification of Vascular Plants in Lowland Poland; PWN: Warsaw, Poland, 2007. [Google Scholar]
  33. Grzesiuk, S.; Kulka, K. Seed Physiology and Biochemistry; PWRiL: Warsaw, Poland, 1981. (In Polish) [Google Scholar]
  34. Shannon, C.E. A mathematical theory of communications. Bell Syst. Tech. J. 1948, 27, 379–423. [Google Scholar] [CrossRef] [Green Version]
  35. Simpson, E.H. Measurement of diversity. Nature 1949, 168, 668. [Google Scholar] [CrossRef]
  36. Kovach, W.L. MVSP Version 3; Kovach Computing Services: Anglesey, UK, 2011; p. 112. [Google Scholar]
  37. Magurran, A.E. Ecological Diversity and Its Measurement; Princeton University Press: Princeton, NJ, USA, 1988. [Google Scholar] [CrossRef]
  38. Conn, J.S. Weed seed bank affected by tillage intensity for barley in Alaska. Soil Tillage Res. 2006, 90, 156–161. [Google Scholar] [CrossRef]
  39. Peigné, J.; Ball, B.C.; Roger-Estrade, J.; David, C. Is conservation tillage suitable for organic farming? A review. Soil Use Manag. 2007, 23, 129–144. [Google Scholar] [CrossRef]
  40. Gruber, S.; Claupein, W. Effect of tillage intensity on weed infestation in organic farming. Soil Tillage Res. 2009, 105, 104–111. [Google Scholar] [CrossRef]
  41. Demjanová, E.; Macák, M.; Dalovic, I.; Majernik, F.; Tyr, S.; Smatana, S. Effects of tillage systems and crop rotation on weed density, weed species composition and weed biomass in maize. Agron. Res. 2009, 7, 785–792. [Google Scholar]
  42. Woźniak, A.; Wesołowski, M.; Soroka, M. Effect of long-term reduced tillage on grain yield, grain quality and weed infestation of spring wheat. J. Agr. Sci. Tech. 2015, 17, 899–908. [Google Scholar]
  43. Vakali, C.; Zaller, J.G.; Köpke, U. Reduced tillage effects on soil properties and growth of cereals and associated weeds under organic farming. Soil Tillage Res. 2011, 111, 133–141. [Google Scholar] [CrossRef]
  44. Woźniak, A. Effect of tillage system on the structure of weed infestation of winter wheat. Span. J. Agric. Res. 2019, 16, e1009. [Google Scholar] [CrossRef]
  45. Starczewski, J.; Czarnocki, S. Tillage method and triticale weed infestation and yielding. Acta Sci. Pol. Agric. 2004, 3, 69–76. (In Polish) [Google Scholar]
  46. Clements, D.R.; Benoit, D.L.; Murphy, S.D.; Swanton, C.J. Tillage Effects on Weed Seed Return and Seedbank Composition; Cambridge University Press: Cambridge, UK, 1996; pp. 314–322. [Google Scholar] [CrossRef]
  47. Tokarska-Guzik, B.; Dajdok, Z.; Zając, M.; Zając, A.; Urbisz, A.; Danielewicz, W.; Hołdyński, C. The Plants of Foreign Origin in Poland, With Particular Regard to Invasive Species; The General Directorate for Environmental Protection: Warsaw, Poland, 2012; p. 197. Available online: http://www.gdos.gov.pl/files/artykuly/5050/Rosliny_obcego_pochodzenia_w_PL_poprawione.pdf (accessed on 4 May 2020). (In Polish)
  48. Sans, F.X.; Berner, A.; Armengot, L.; Mäder, P. Tillage effects on weed communities in an organic winter wheat–sunflower–spelt cropping sequence. Weed Res. 2011, 51, 413–421. [Google Scholar] [CrossRef]
  49. Puricelli, E.; Tuesca, D. Weed density and diversity under glyphosate-resistant crop sequences. Crop Prot. 2005, 24, 533–542. [Google Scholar] [CrossRef]
  50. Froud-Williams, R.J.; Drennan, D.S.H.; Chancellor, R.J. Influence of cultivation regime on weed floras of arable cropping systems. J. Appl. Ecol. 1983, 20, 187–197. [Google Scholar] [CrossRef]
  51. Woźniak, A.; Soroka, M. Biodiversity of weeds in pea cultivated in various tillage systems. Rom. Agric. Res. 2015, 32, 231–237. [Google Scholar]
  52. Duer, I.; Feledyn-Szewczyk, B. Interaction of crop production system with weed species composition and soil seed bank in winter wheat. Roczn. Nauk Rol. 2000, 115, 109–130. (In Polish) [Google Scholar]
  53. Vanasse, A.; Leroux, G.D. Floristic diversity, size and vertical distribution of the weed seedbank in ridge and conventional tillage systems. Weed Sci. 2000, 48, 454–460. [Google Scholar] [CrossRef]
  54. Piskier, T.; Sekutowski, T.R. Effect of simplified tillage on the number and distribution of weed seeds in soil. J. Res. Appl. Agric. Eng. 2013, 58, 109–117. [Google Scholar]
  55. Krawczyk, R.; Kubsik, K.; Mrówczyński, M.; Kaczmarek, S. Effect of soil variation and soil tillage systems on soil weed seedbank. Prog. Plant Prot./Post. Ochr. Roślin 2008, 48, 276–280. (In Polish) [Google Scholar]
  56. Borin, M.; Zanin, G.; Zuin, M.C. The Comparison of Seed Banks in Conventional and Ridge-Tilled Soils In North-Eastern Italy. In Soil Management in Sustainable Agriculture; Cook, H.F., Lee, H.C., Eds.; Wye College Press: Ashford, UK, 1995; pp. 544–555. [Google Scholar]
  57. Sheley, R.; James, J.; Rinella, M.; Blumenthal, D.; DiTomaso, J.; Briske, D. Invasive Plant Management and Anticipated Conservation Benefits: A Scientific Assessment. Conservation Benefits of Rangeland Practices―Assessment, Recommendations, And Knowledge Gaps; Briske, D.D., Ed.; Allen Press: Lawrence, Kansas, 2011; pp. 291–335. Available online: https://www.nrcs.usda.gov/Internet/FSE_DOCUMENTS/stelprdb1045802.pdf (accessed on 20 May 2020).
  58. Kapeluszny, J.; Haliniarz, M. Selected elements of germination biology of flaxweed [Descurainia sophia Webb. ex Prantl.] and rye brome [Bromus secalinus L.]). Sect. E Agric. 2007, 62, 226–233. (In Polish) [Google Scholar]
  59. Thomas, A.G.; Derksen, D.A.; Blackshaw, R.E.; Van Acker, R.C.; Légère, A.; Watson, P.R.; Turnbull, G.C. A multistudy approach to understanding weed population shifts in medium- to long-term tillage systems. Weed Sci. 2017, 52, 874–880. [Google Scholar] [CrossRef]
  60. Grundy, A.C.; Mead, A.; Bond, W. Modelling the effect of weed―Seed distribution in the soil profile on seedling emergence. Weed Res. 1996, 36, 375–384. [Google Scholar] [CrossRef]
  61. Dorado, J.; Del Monte, J.P.; López-Fando, C. Weed seedbank response to crop rotation and tillage in semiarid agroecosystems. Weed Sci. 1999, 47, 67–73. [Google Scholar] [CrossRef]
  62. Ball, D.A. Weed Seedbank Response to Tillage, Herbicides, and Crop Rotation Sequence. Weed Sci. 1992, 40, 654–659. [Google Scholar] [CrossRef]
  63. Kremer, R.J. Management of weed seed banks with microorganisms. Ecol. Appl. 1993, 3, 42–52. [Google Scholar] [CrossRef]
  64. Hurtt, W.; Taylorson, R.B. 1986: Chemical manipulation of weed emergence. Weed Res. 1986, 26, 259–267. [Google Scholar] [CrossRef]
Figure 1. Scheme of the experimental treatment with three tillage systems. * Crops cultivated in the 2009/2010 season are marked in bold.
Agriculture 10 00186 g001
Figure 2. Winter wheat (I) fields under different tillage systems (fields No. 1, 4 and 7 according to Figure 1, date of sowing: 30 September 2010, date of observation: 16 November 2010).
Agriculture 10 00186 g002
Figure 3. Method of sampling for the determination of the soil seedbank. (A)—soil collection method using a cylinder, (B)—soil sample; (C)—seedling emergence method to assess the soil seed bank
Agriculture 10 00186 g003
Figure 4. Average number (plants m−2) and dry weight of weeds (g·m−2) in different tillage systems (average of all assessment terms in 3 growing seasons and crops in rotation); ns—no significant differences according to the Kruskal–Wallis test at p ≤ 0.05. Years × tillage system interaction not significant.
Agriculture 10 00186 g004
Figure 5. Weed abundance (A) and dry matter of weeds (B) in crops cultivated in different tillage systems (mean from the years 2010–2013). Within each crop, different letters indicate significant differences between tillage systems according to the Kruskal–Wallis test at p ≤ 0.05; ns—no significant differences. Years × tillage system interaction not significant.
Agriculture 10 00186 g005
Figure 6. The dynamics of weed abundance in winter wheat under different tillage systems. (A)—2010/2011 season; (B)—2011/2012 season; (C)—2012/2013 season. Terms of weed flora assessment: 1—before the crop harvest, 2—after the crop harvest and soil operations in the plough and reduced tillage systems, 3—before sowing of winter wheat, 4—late autumn, 5—spring.
Agriculture 10 00186 g006
Figure 7. Percentage of annual/biennial and perennial species in the total density of weed communities under different tillage systems.
Agriculture 10 00186 g007
Figure 8. Seed number in 0–20 cm soil layer in different tillage systems (mean from crop rotation and years 2010–2012). Different letters indicate significant differences between tillage systems according to the Kruskal–Wallis test at p ≤ 0.05.
Agriculture 10 00186 g008
Figure 9. Seed number in three soil layers: 0–5, 5–10, 10–20 cm in different tillage systems (mean from crop rotations and years 2010–2012).
Agriculture 10 00186 g009
Figure 10. Weed seedling emergence from the soil layer 0–5 cm in different tillage systems. (A)—direct sowing, (B)—reduced tillage, (C)—plough.
Agriculture 10 00186 g010
Figure 11. Seed number in the soil layer 0–20 cm in different tillage systems and years.
Agriculture 10 00186 g011
Table 1. Mean air temperature (°C) and sum of precipitation (mm) in experimental farm in Rogów.
MonthTemperature (°C)Precipitation (mm)
2010/20112011/20122012/2013Mean from the Long-Term Period2010/20112011/20122012/2013Mean from the Long-Term Period
IX12.014.914.713.2128.73.629.262.4
X5.57.38.28.613.528.254.829.1
XI6.51.74.93.365.62.322.221.8
XII−4.61.8−4.40.632.250.83.323.1
I−1.5−2.7−3.9−1.627.125.366.740.2
II−4.7−8.3−0.5−3.120.221.39.020.8
III1.73.9−2.63.113.029.632.635.4
IV9.79.38.59.230.251.854.335.3
V13.414.515.213.926.166.0118.888.5
VI17.717.518.417.383.7110.9106.782.4
VII18.720.818.619.1214.034.362.593.8
VIII18.518.718.718.846.071.433.165.0
Mean temperature—8.5 °CSum of precipitation—598 mm
Table 2. Mineral fertilization (kg ha−1) for wheat, peas and rapeseed.
Growing SeasonsWheat I and IIGrowing SeasonsPea/Rape
2009/2010 2010/2011pre-sowing: phosphorus (P2O5)—72, potassium (K2O)–72, nitrogen (NH4)–24, S (SO3)–27; top dressing with nitrogen (NH4NO3)–160, including: start of vegetation in spring–70, shooting at the blade–50, heading–40.2010Pea: pre-sowing: phosphorus (P2O5)—72; potassium (K2O)—72; nitrogen (NH4)—24; S (SO3)—27; in spring immediately before sowing pea—N (NH4NO3)—20.
2011Pea: pre-sowing: phosphorus (P2O5)—72; potassium (K2O)—72; nitrogen (NH4)—24; S (SO3)—27; in spring immediately before sowing pea—N (NH4NO3)—20.
2011/2012winter wheat froze out and was replaced by spring wheat.
pre-sowing: phosphorus (P2O5)—60, potassium (K2O)—60, nitrogen (NH4)—20, S (SO3)—23.5; top dressing with nitrogen (NH4NO3)—160, including: starting vegetation in spring—80, shooting at the blade—50, heading—40.
2011/2012Winter rape: pre-sowing: phosphorus (P2O5)—60; potassium (K2O)—60; nitrogen (NH4)—20; S (SO3)—23.5;
top dressing with nitrogen (NH4NO3)—160, including: starting vegetation in spring—100, budding phase—60.
2012/2013pre-sowing: phosphorus (P2O5)—60, potassium (K2O)—60, nitrogen (NH4)—20, S (SO3)—23.5; top dressing with nitrogen (NH4NO3)—140, including: starting vegetation in spring—80, shooting at the blade—60.2012/2013Winter rape: pre-sowing: phosphorus (P2O5)—60; potassium (K2O)—60; nitrogen (NH4)—20; S (SO3)—23.5;
top dressing with nitrogen (NH4NO3)—160, including: starting vegetation in spring—100, budding phase—60.
Table 3. Herbicides used to reduce weed infestation in wheat, pea and rape.
Growing SeasonsWheat I and IIGrowing SeasonsPea/Rape
2009/2010Roundup 360 SL (glyphosate 360 g l−1; 28.77%)—1 × 3.0 l ha−1
Lintur 70WG (dicamba 65.9%, triasulfuron 4.1%)—1 × 0, 15 l ha−1 + Axial 100EC (pinoxaden 100 g l−1)—1 × 0.3 l ha−1
2010Pea: Barox 460 SL (bentazone 400 g l−1; MCPA 60 g l−1)—1 × 2.5 l ha−1
Roundup 360 SL (glyphosate 360 g l−1; 28.77%)—1 × 4.0 l ha−1 (desiccation of peas)
2010/2011Roundup Energy 450 SL (glyphosate 450 g l−1; 34.5%)—1 × 3.0 l ha−1
Maraton 375 SC (pendimethalin 250 g l−1; isoproturon 125 g l−1)—1 × 2.5 l ha−1
Granstar 75 WG (methyl tribenuron 75%)—1 × 15 g ha−1 + Starane 250 EC (fluroxypyr 250 g l−1; 24.77%)—1 × 0.3 l ha−1
2011Pea: Basagran 480 SL (bentazone 480 g l−1)—1 × 2.5 l ha−1
Roundup 360 SL (glyphosate 360 g l−1; 28.7%)—1 × 4.0 l ha−1) (desiccation of peas)
2011/2012Puma Universal 069 EW (fenoxaprop-P-ethyl 69 g l−1)—1.0 l ha−1 + Mustang 306 SE (2,4-D 300 g l−1, florasulam 6.25 g l−1)—1 × 0.8 l ha−12011/2012Winter rape: Butisan Star 416 SC (metazachlor 333 g l−1; quinmerac 83 g l−1)—1 × 2.0 l ha−1 + Command 480 EC (clomazone 480 g l−1)—1 × 0.15 l ha−1
Targa Super 05 EC (quizalofop 5%)—1 × 0.7 l ha−1
2012/2013Roundup Energy 450 SL (glyphosate 450 g l−1; 51%)—1 × 3.0 l ha−1
Axial 100EC ((pinoxaden 100 g l−1)—1 × 0.4 l ha−1
Granstar 75 WG (methyl tribenuron 75%)—1 × 10 g ha−1 + Starane 250 EC ((2,4-D 300 g l−1, florasulam 6.25 g l−1)—1 × 0.2 l ha−1
2012/2013Winter rape: Roundup 360 SL (glyphosate 360 g l−1; 28.77%)—1 × 4.0 l ha−1
Targa Super 05 EC (quizalofop 5%)—1 × 0.7 l ha−1)—1 × 0.6 l ha−1
Butisan Star 416 SC (metazachlor 333 g l−1; quinmerac 83 g l−1—1 × 1.2 l ha−1 + Navigator 360 SL (clopyralid 240 g l−1 20.31%; picloram 80 g l−1, 6.77%, aminopyralid 40 g l−1 3.38%)—1 × 0.2 l ha−1
Table 4. Species composition and number of weeds (plants m−2) in different tillage systems (on average for rotation and study years 2010–2013).
Weed SpeciesA/P *Tillage SystemMean
Direct SowingReduced TillagePlough
1.Fallopia convolvulus (L.) Á. LöveA5.708.907.737.443
2.Viola arvensis MurrayA3.804.253.833.960
3.Galium aparine L.A6.142.601.483.406
4.Galeopsis tetrahit L.A1.502.264.032.597
5.Veronica persica Poir. IA4.85 I 1.10 I 0.10 I 2.011 I
6.Chenopodium album L.A0.843.050.781.555
7.Capsella bursa-pastoris (L.) MedikA2.740.420.501.219
8.Stellaria media (L.) Vill.A0.350.410.730.496
9.Fumaria officinalis L.A0.360.530.450.444
10.Tripleurospermum inodorum (L.) Schultz-Bip.A0.160.630.480.422
11.Brassica napus L.A0.040.060.700.267
12.Descurainia sophia (L.) Webb ex PrantlA0.310.370.080.250
13.Apera spica-venti L.A0.180.430.130.244
14.Galinsoga parviflora Cav. I A0.01 I 0.63 I 0.00 I 0.211 I
15.Thlaspi arvense L.A0.180.060.310.183
16.Erigeron annuus L. IIA0.14 II 0.19 II 0.19 II 0.175 II
17.Lamium purpureum L.A0.380.060.020.154
18.Echinochloa crus-galli (L.) P. Beauv. I A0.28 I 0.05 I 0.11 I 0.144 I
19.Geranium pussillum Burm. F. ex L.A0.350.040.000.128
20.Polygonum aviculare L.A0.040.130.050.072
21.Equisetum arvense L.P0.190.020.010.071
22.Setaria glauca (L.) P. Beauv. IA0.16 I 0.02 I 0.02 I 0.064 I
23.Consolida regalis S.F. GrayA0.030.160.010.064
24.Sinapis arvensis L.A0.000.070.120.061
25.Euphorbia helioscopia L.A0.160.000.010.056
26.Avena fatua L. I A0.01 I 0.08 I 0.01 I 0.033 I
27.Convolvulus arvensis L.P0.030.050.020.033
28.Sonchus arvensis L.P0.050.010.030.028
29.Paphaver rhoeas L.A0.060.010.020.028
30.Polygonum persicaria L.A0.000.000.080.025
31.Cirsium arvense (L.) Scop.P0.000.040.030.022
32.Plantago major L.P0.040.020.000.019
33.Anthemis arvensis L.A0.010.000.050.019
34.Erodium cicutarium (L.) L`HerA0.010.050.000.019
35.Mercurialis annua L.A0.010.000.050.019
36.Centaurea cyanus L.A0.000.010.030.014
37.Lamium amplexicaule L.A0.000.020.020.011
38.Taraxacum officinale WeberP0.010.010.010.008
39.Gnaphalium uliginosum L.A0.010.000.020.008
40.Poa annua L.A0.020.000.010.008
41.Plantago lanceolata L.P0.000.010.010.006
42.Anagallis arvensis L.A0.020.000.000.006
43.Veronica hederifolia L.A0.000.020.000.006
44.Raphanus raphanistrum L.A0.000.020.000.006
45.Senecio vulgaris L.A0.010.010.000.006
46.Rumex obtusifolius L.P0.000.000.020.006
47.Melandrium album (Mill.) GarckeA0.010.000.000.003
48.Lapsana communis L.A0.000.000.010.003
49.Arctium lappa L.A0.000.000.010.003
50.Sonchus oleraceus L.A0.010.000.000.003
Sum29.1726.7322.2226.04
Total number of species39384050
Shannon’s diversity index (H’)2.282.562.352.58
Simpson’s dominance index (SI)0.150.110.150.11
* A—annual or biennial; P—perennial. I–IV invasive species, category of invasiveness from I (the lowest invasiveness) to IV (the highest invasiveness) according to Tokarska-Guzik et al. [47].
Table 5. Dominant and characteristic species in weed communities under different tillage systems.
SpeciesDirect SowingReduced TillagePlough
DominantGalium aparine L
Fallopia convolvulus (L.) Á. Löve
Veronica persica Poir.
Capsella bursa-pastoris (L.) Medik
Fallopia convolvulus (L.) Á. Löve
Viola arvensis Murray
Fallopia convolvulus (L.) Á. Löve
Galeopsis tetrahit L.
Occurring more abundantly than in other tillage systemsLamium purpureum L.
Geranium pussillum Burm. F. ex L.
Echinochloa crus-galli (L.) P. Beauv.
Setaria glauca (L.) P. Beauv.
Equisetum arvense L.
Plantago major L.
Sonchus arvensis L.
Chenopodium album L.
Fumaria officinalis L.
Tripleurospermum inodorum (L.) Schultz-Bip.
Descurainia sophia (L.) Webb ex Prantl
Apera spica-venti L.
Galinsoga parviflora Cav
Consolida regalis S.F. Gray
Stellaria media (L.) Vill.
Thlaspi arvense L.
Sinapis arvensis L.
Anthemis arvensis L.
Brassica napus L. volunteers
Occurring only in a given tillage system (characteristic or incidental species)Sonchus oleraceus L.
Melandrium album (Mill.) GarckeAnagallis arvensis L.
Veronica hederifolia L.
Raphanus raphanistrum L.
Polygonum persicaria L.
Rumex obtusifolius L.
Lapsana communis L.
Arctium lappa L.
Table 6. Sorensen’s qualitative and quantitative similarity indices for weed communities in different tillage systems.
Sorensen’s Quantitative Similarity Index (%)Sorensen’s Qualitative Similarity Indices (%)
Direct SowingReduced TillagePlough
Direct sowing-8179
Reduced tillage55-80
Plough 4263-
Table 7. Species composition and number of weed seeds (seeds m−2) in the soil layer 0–20 cm in different tillage systems (average for the years of research and crops in rotation).
Weed SpeciesA/P *Tillage SystemMean
Direct SowingReduced TillagePlough
1.Viola arvensis MurrayA1160.01631.1342.21044.4
2.Apera spica-venti L.A1340.0720.0217.8759.3
3.Capsella bursa-pastoris (L.) MedikA1822.297.8208.9709.6
4.Veronica persica Poir. IA942.2 I293.3 I 31.1 I 422.2 I
5.Chenopodium album L.A173.3444.4208.9275.6
6.Fallopia convolvulus (L.) Á. LöveA102.2368.9226.7232.6
7.Tripleurospermum inodorum (L.) Schultz-Bip.A204.4164.4328.9232.6
8.Fumaria officinalis L.A351.1115.631.1165.9
9.Galeopsis tetrahit L.A40.0195.6142.2125.9
10.Stellaria media (L.) Vill.A115.6142.2115.6124.4
11.Thlaspi arvense L.A13.38.9128.950.4
12.Galium aparine L.A44.475.626.748.9
13.Consolida regalis S.F. GrayA26.797.80.041.5
14.Conyza canadensis (L.) Cronquist IVA31.1 IV 35.6 IV 22.2 IV 29.6 IV
15.Echinochloa crus-galli (L.) P. Beaur. I A8.9 I 26.7 I 4.4 I 13.3 I
16.Gnaphalium uliginosum L.A4.417.813.311.9
17.Sonchus arvensis L.P22.28.90.010.4
18.Plantago major L.P17.88.94.410.4
19.Paphaver rhoeas L.A13.34.44.47.4
20.Descurainia sophia (L.) Webb ex PrantlA13.34.40.05.9
21.Cirsium arvense (L.) Scop.P8.98.90.05.9
22.Erodium cicutarium (L.) L`HerA8.94.44.45.9
23.Lamium amplexicaule L.A8.90.04.44.4
24.Brassica napus L.A0.08.94.44.4
25.Spergula arvensis L.A8.94.40.04.4
26.Taraxacum officinale WeberP0.08.90.03.0
27.Myosotis arvensis (L.) HillA0.04.44.43.0
28.Amaranthus retroflexus L. I A8.9 I 0.0 I 0.0 I 3.0 I
29.Lapsana communis L.A4.40.04.43.0
30.Sinapis arvensis L.A8.90.00.03.0
31.Veronica arvensis L.A0.04.40.01.5
32.Geranium pussillum Burm. F. ex L.A4.40.00.01.5
33.Melandrium album (Mill.) GarckeA4.40.00.01.5
34.Galinsoga parviflora Cav. IA4.4 I 0.0 I 0.0 I 1.5 I
35.Plantago lanceolata L.P0.04.40.01.5
36.Euphorbia helioscopia L.A0.04.40.01.5
Sum6518451520804371
Total number of species30292236
Shannon’s diversity index (H’)2.042.182.412.32
Simpson’s dominance index (SI)0.180.180.110.14
* A—annual or biennial; P—perennial. I–IV invasive species, category of invasiveness from I (the lowest invasiveness) to IV (the highest invasiveness) according to Tokarska-Guzik et al. [47].
Table 8. Sorensen’s qualitative and quantitative similarity indices for soil seed bank communities in different tillage systems.
Sorensen’s Quantitative Similarity Index (%)Sorensen’s Qualitative Similarity Index (%)
Direct sowingReduced tillagePlough
Direct sowing-7877
Reduced tillage57-78
Plough3651-

