Article

Effects of Polyacrylamide-Based Super Absorbent Polymer and Corn Straw Biochar on the Arid and Semi-Arid Salinized Soil

1
School of Space and Environment, Beihang University, Beijing 100191, China
2
Beijing Advanced Innovation Center for Big Data-Based Precision Medicine, Beihang University, Beijing 100191, China
3
Department of Irrigation and Drainage, China Institute of Water Resources and Hydropower Research, Beijing 100089, China
4
State Key Laboratory of Environmental Criteria and Risk Assessment, Chinese Research Academy of Environmental Sciences, Beijing 100012, China
5
USDA-ARS, Southern Regional Research Center, New Orleans, LA 70124, USA
6
College of Architecture and Civil Engineering, Beijing University of Technology, Beijing 100124, China
7
College of Water Conservancy and Civil Engineering, Inner Mongolia Agricultural University, Hohhot 010018, China
*
Authors to whom correspondence should be addressed.
Submission received: 28 August 2020 / Revised: 23 October 2020 / Accepted: 31 October 2020 / Published: 3 November 2020

Abstract

:
Green approaches are much more appreciable during the present scenario. Soil amendments are frequently applied for improving water use efficiency, reducing soil salinity in arid and semi-arid areas, controlling the secondary salinization of cultivated soils, and increasing the carbon sequestration capacity of soils. Thus, lab soil column simulation experiments and field experiments were carried out to evaluate these functions of two separate amendments, polyacrylamide-based super absorbent polymer (SAP) and corn straw biochar at different application rates. The simulation experiments showed that both SAP and biochar inhibited the accumulation of soil salinity, with a reduced rate of 9.7–26.3% and 13.5–37.2%, respectively, dependent on the amendment application rates. The field experiments found different salt inhibition effects of the two amendments with growth stages of maize. Soil salinization was inhibited in the pre-germination and early jointing stages by SAP, but throughout the whole growth period by biochar. Both soil amendments reduced soil electrical conductivity, and biochar increased the soil contents of Ca2+, Mg2+, and K+. Our observations demonstrated that application of biochar and SAP played important roles in increasing soil fertility and inhibiting soil salt accumulation. It provided an effective method to potentially mitigate the environmental crisis and promote sustainable development in agriculture.

Graphical Abstract

1. Introduction

Saline soil is typical of arid and semi-arid areas, which account for 40% of the global land surface area [1,2]. Therefore, soil salinization is a serious concern during development and utilization of soil and water resources in arid and semi-arid areas [3,4]. High soil salinity has a negative impact on crop stomatal conductance, water use efficiency, and growth, and indicates a high likelihood of salinity stress in plant roots [5]. In other words, soil salinization leads to crop yield reduction, thus making it an important research topic pertaining to water-saving irrigation, sustainable agricultural development, and food security [6]. Furthermore, irrigation with high salinity groundwater causes salt to accumulate on the surface (i.e., the secondary salinization) with decline of soil quality and crop productivity in areas with high groundwater tables (1–3 m) and high rates of soil water evaporation [7,8].
Soil amendments are widely applied for the treatment of soil that has undergone secondary salinization. Two important soil amendments are superabsorbent polymer (SAP) [9,10] and biochar [11,12]. SAP is a type of polymers with strong water-absorbing capability, and is composed of a large number of hydrophilic functional groups, such as carbonyls, hydroxyls, and quaternary ammonium salts [13,14,15,16]. It is capable of repeatedly and rapidly absorbing water, and retain hundreds of times its weight in water. Under dry soil conditions, SAP can quickly release the water, making it available to crops, thus conserving water resources. In addition, the application of SAP can affect the physical and chemical properties of soil by promoting the formation of soil aggregates, improving soil structure, and influencing the development of crop roots, photosynthesis efficiency, emergence survival rate, and nutrient absorption [16,17,18,19]. Biochar is another important soil amendment, which is mainly derived from crop straw, branches, animal manure [12]. Biochar can reduce heavy metal activity in soil [20], increase soil organic matter content, regulate soil pH, improve soil microbial activity, and enhance crop emergence rate [21,22,23]. Thomas reported the effect of sawdust biochar on Abutilon theophrasti and Prunella vulgaris and found that an application of 50 t/hm2 biochar could ameliorate salt stress [24]. Straw biochar could increase soil fertility, enhance crop yield, improve the water holding capacity effectivity of salinized soil, reduce greenhouse gas emission, and mitigate climate change [23,24,25]. However, the effects of biochar or SAP on the salting mitigation of salinized soils are not very understood and warranted further research.
Hetao Irrigation District in Inner Mongolia is an arid and semi-arid area in northern China. Due to an insufficient supply of low-salinity irrigation water, the area of slightly salinized soil now accounts for 24% of the cultivated land, while the area of moderately to severely salinized soil has reached up to 31%. These poor soil conditions have seriously restricted the sustainable development of regional agriculture in the Yellow River Basin [25,26,27]. Thus, we carried out both lab soil column simulation experiments and field experiments to examine the ability of SAP and biochar on regulating the water-salt balance in these arid and semi-arid soils. Different doses of SAP and biochar were applied to salinize these soils. Variations in soil salinity and related factors were monitored continuously during the crop growth period, and changes in base ion contents (K+, Na+, Ca2+, and Mg2+) were analyzed at different depths in soil treated with biochar. The salt inhibition effects of SAP and biochar and the effect of biochar on the content of soil base ions were also discussed. The derived data would provide practical reference values for the improvement of the regional salinized soils, and be helpful in developing better decision guidelines regarding land management and the restoration of salt-affected areas.

2. Methods and Materials

2.1. Materials Collection and Preparation

The main chemical component of SAP is polyacrylamide [28], which has strong water absorption capability. SAP (product type BJ2101XM) was purchased from Beijing Hanlimiao New Technology Co., Ltd. (Beijing, China) in the experiment. It was the white powder with particle size of 0.01–2 mm. The water absorption ratio was 233.9 g/g in deionized water and 124.3 g/g in tap water.
Biochar was purchased from Liaoning Jinhefu Agricultural Development Co., Ltd. (Anshan, China) The raw material was corn straw, the biochar particle size was 0.001 mm–2.0 mm, pH was 7.84, slightly alkaline, and the nutrient mass content was nitrogen (N) 1.68%, phosphorus (P) 0.82%, and potassium (K) 1.55%, respectively.
The soil column experimental devices were cylindrical containers (90 cm high × 30 cm internal diameter) (Figure 1). Soil samples were collected from the study area, the organic matter content of weakly alkaline soil was 2.93 g·kg−1, the soil particle size distribution was 43.09%, 50.50%, and 6.41% in the ranges of 0.05–2.00 mm, 0.002–0.050 mm, and less than 0.002 mm, respectively. The soil bulk density was 1.48 ± 0.02 g·cm−3. The saturated soil conductivity was (1.41 ± 0.12) × 10−4 mm·min−1. The field water holding capacity was 24.91%, 0–40 cm porosity 44.03% in bulk of soil [29], and soil columns were layered every 5 cm (65 cm total height). A bulb (TCL 275 W) was provided with a lighting device 40 cm away from the top of the column barrel, and the irrigation layer was set 5 cm away from the top of the barrel. Three parallel sampling holes were set at intervals of 10 cm along the vertical direction of the column wall, with an angle of 120°. A 10xcm anti-filtration layer was set at the bottom of the column.

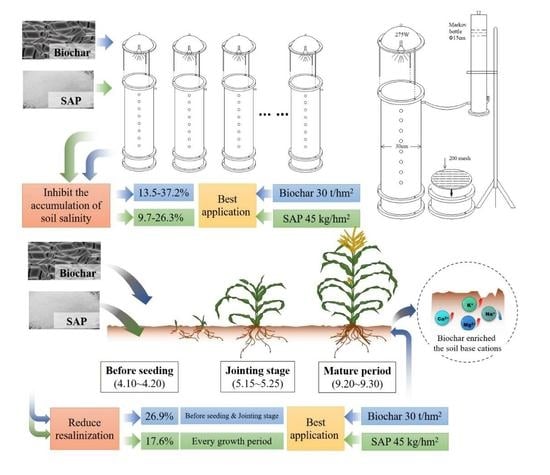
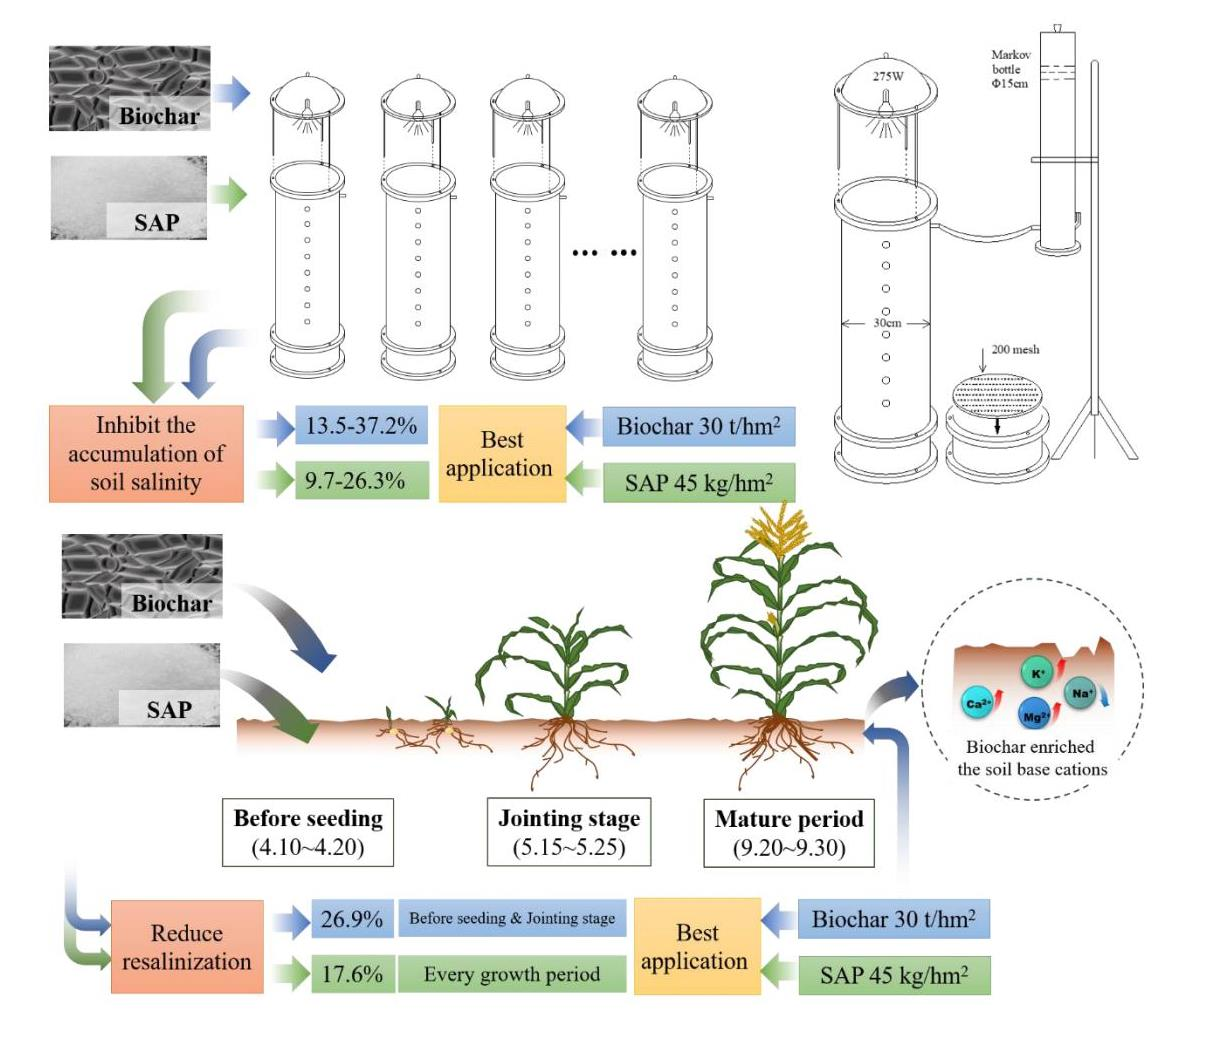
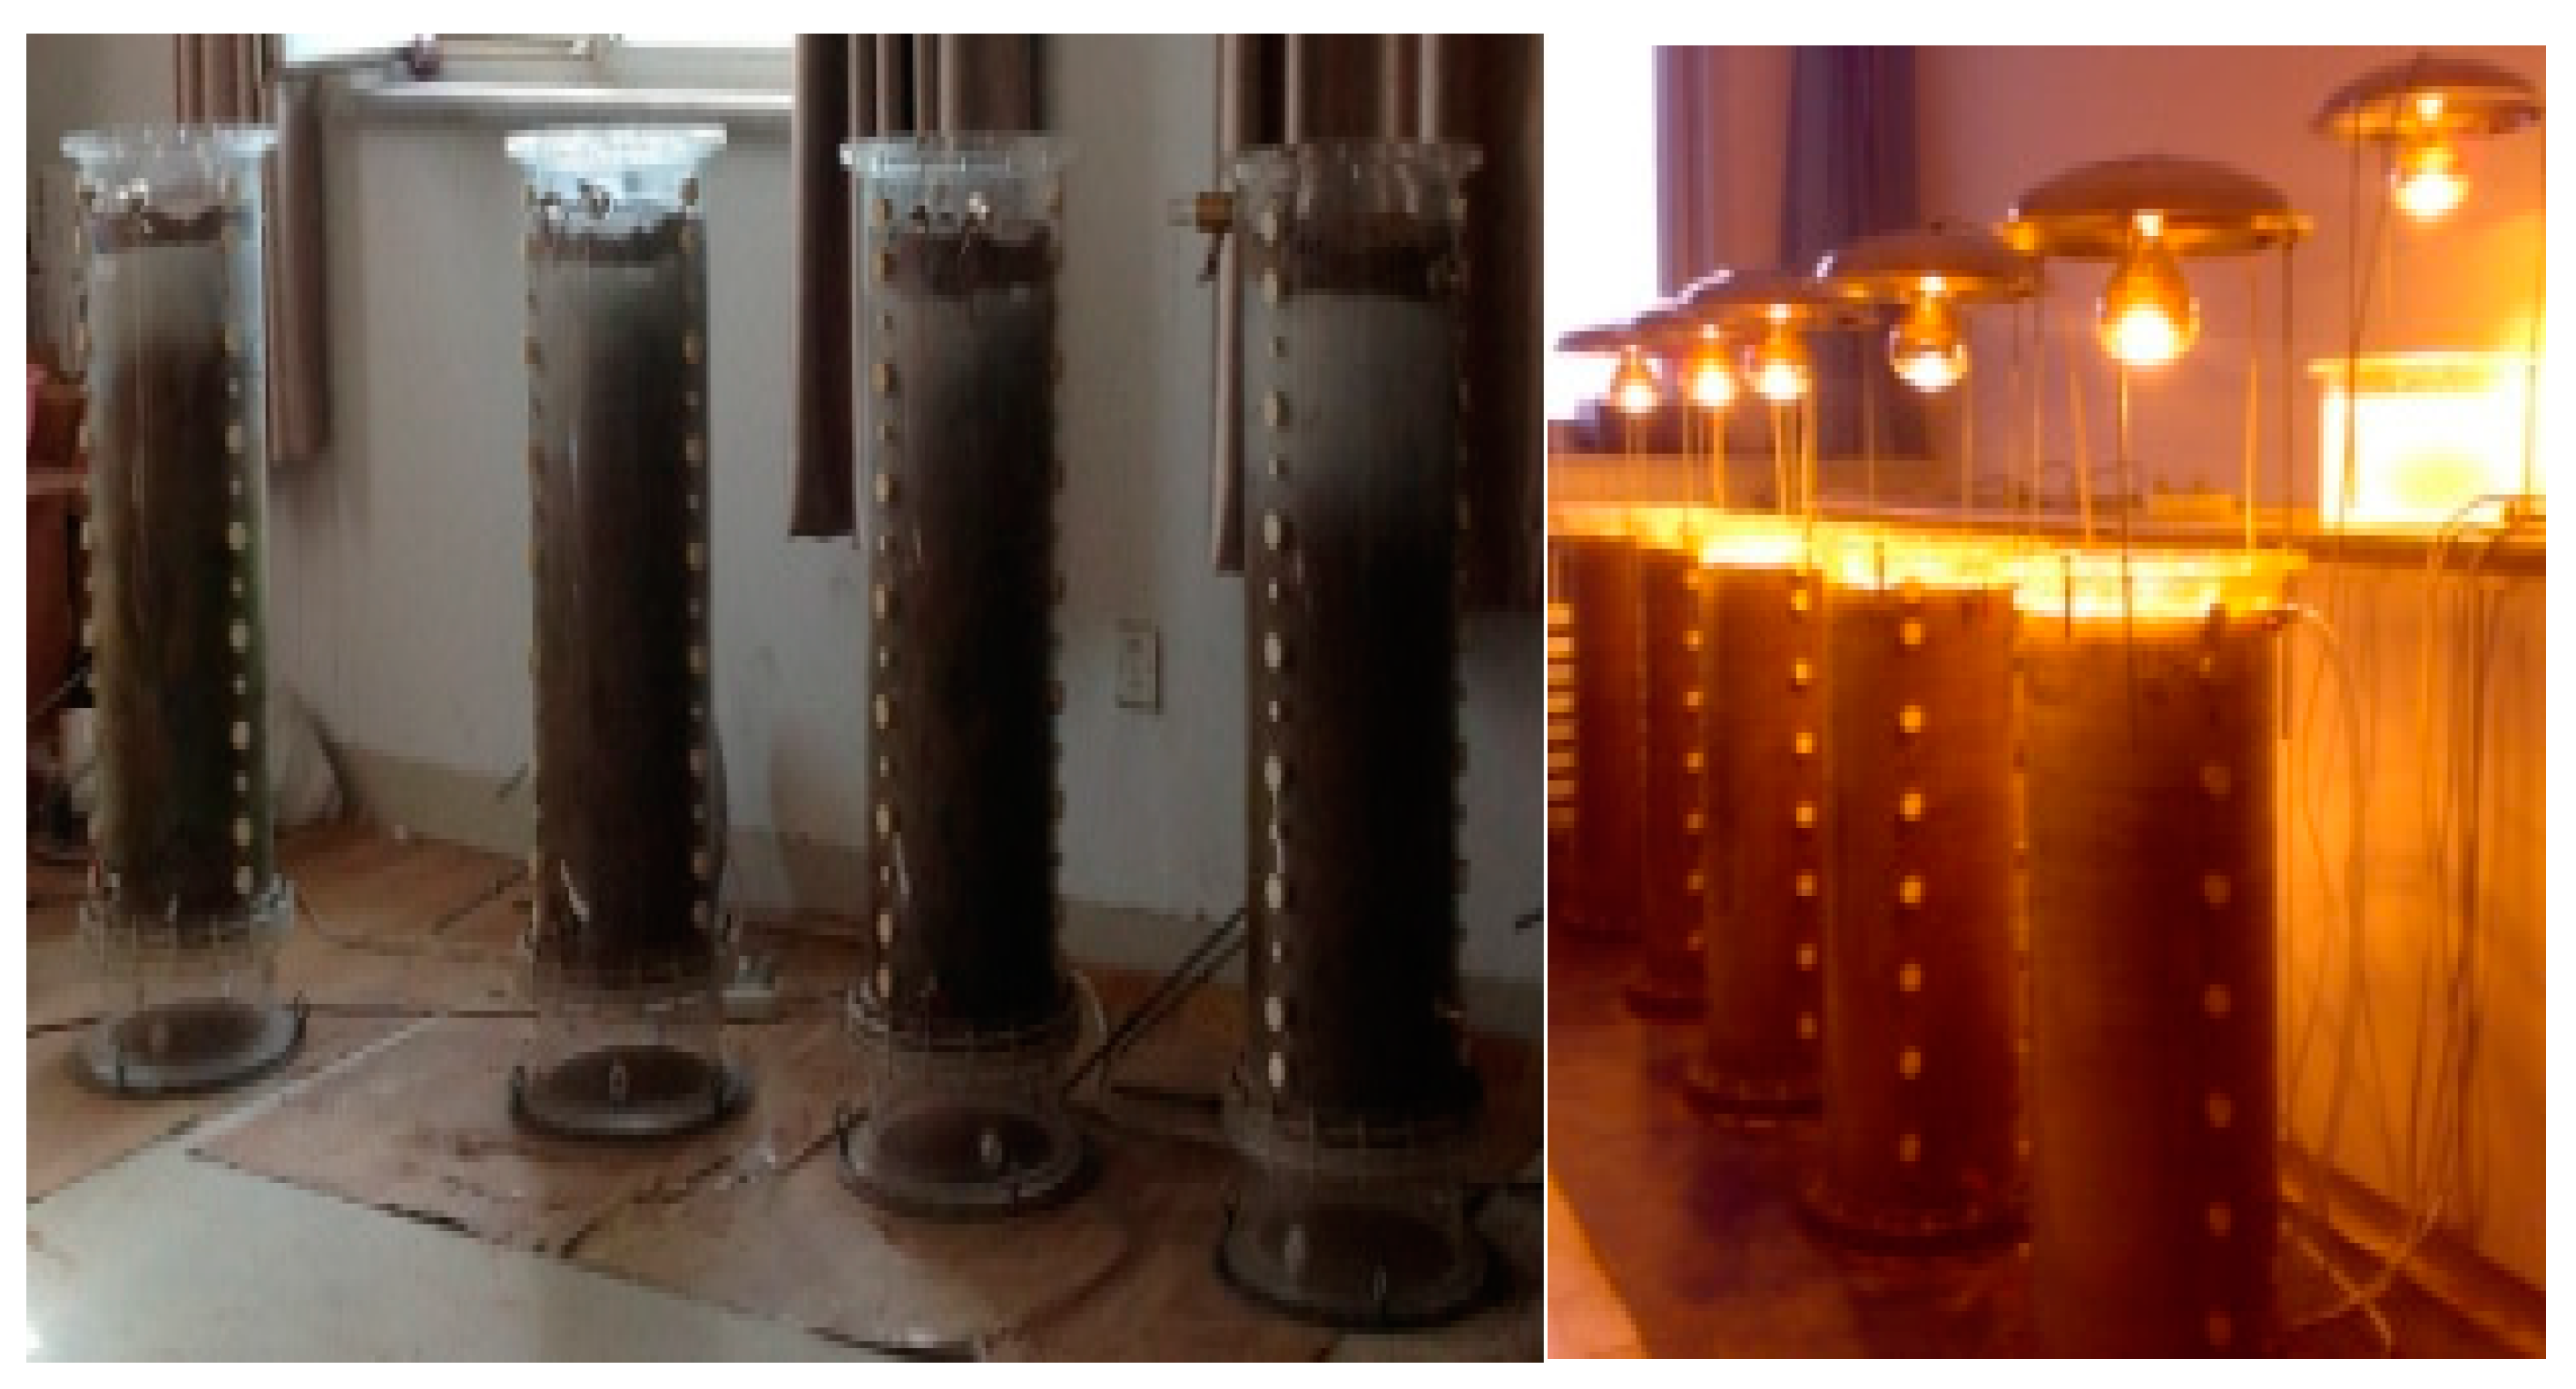
2.2. Lab Soil Simulation Column Experiment

The amendment (either SAP or biochar) was well mixed with a soil sample. There were four SAP treatments, i.e., control experiment (CK) and three SAP applications of 4.5 g/m2, 9.0 g/m2, and 13.5 g/m2 (S-3, S-6, and S-9, respectively). The four biochar treatments were CK and three biochar applications of 1.0 kg/m2, 3.0 kg/m2, and 5.0 kg/m2 (Bo-10, Bo-30, and Bo-50, respectively).
The soil columns were arranged randomly before irrigation (Figure 1). Soil columns were irrigated until water holding capacity was attained, and then the infiltration parameters and evaporation capacity of the layers were recorded. During the infiltration process, the water level change of mariotte flask and the change of the wetting front of the soil column were measured once every 2 min for 0–10 min, once every 5 min for next 10–60 min, and once every 10 min after more than 60 min. During water injection, the infiltration rate and cumulative infiltration amount were calculated according to the depth of wetting front and the water level of the flask. The columns were left for 48 h after water injection. When the soil gas emission was stable, an infrared lamp was turned on to simulate the evaporation process (Figure 1). The experimental temperature was maintained 33 ± 0.5 °C. An evaporating dish was used to measure the evaporation rate. Evaporation and electrical conductivity (EC) measurements were carried out at 0, 7, 14, and 21 days. The monitoring depths of the soil column were 2, 5, 15, 25, 35, 45, and 65 cm, with sampling performed in triplicates. The water–soil mass ratio of the EC test sample was 1:5.
An aluminum box was used to store the soil. The soil moisture content was measured by the gravimetric method, and the daily evaporation of the soil column was measured by the weighing method (with a weighing range of 180 kg, and an accuracy of 0.005 kg). The soil EC was measured with a magnetic conductivity meter (Shanghai Electronic Scientific Instrument Co., Ltd., Shanghai, China, DDSJ-308A) to characterize soil salinity changes.

2.3. Field Soil Column Experiment

The selected research area has a high groundwater level (3–8 m) and high salinity (0.8–1.5 g/L). Groundwater was used for irrigation (well depth: 70 m, salinity: 1.05 g/L). Each amendment was applied to a depth of 0–40 (±5) cm, and the change in salt content was measured to a depth of 0–100 cm. The sampling frequency was carried out in accordance with the growth period of maize, that is, during the pre-germination stage, jointing stage, and maturity stage. The sampling depths were 0–10 cm, 10–20 cm, 20–30 cm, 30–40 cm, 40–60 cm, 60–80 cm, and 80–100 cm. In addition, the soil base ion concentration (K+, Na+, Ca2+, and Mg2+) in the biochar test group was measured at the pre-germination, jointing, and maturity stages. The soil samples were mashed in an agate mortar through a 2.0 mm nylon sieve. Then, 2.0 g of soil was weighed in a 25 mL centrifuge tube, and added 20 mL of ultra-pure water. After 2 h of oscillation, ultrasound was used for 60 min. The supernatant was centrifuged and filtered through a 0.22 m filtration membrane for analysis. Four kinds of cations were determined by ion chromatograph (ICS-1100). The soil was sampled at depths of 0–20 cm, 20–40 cm, and 40–60 cm. The salinity value at a depth of 1 m was measured before and after irrigation, which was performed during each growth period of maize. For SAP treatments, one control experiment (CK) and four test experiments with SAP applications of 4.5 g/m2, 9.0 g/m2, 13.5 g/m2, and 18.0 g/m2 (S-3, S-6, S-9, and S-12, respectively) were used. For biochar treatments, one control experiment (CK) and four test experiments with biochar applications of 1.0 kg/m2, 2.0 kg/m2, 3.0 kg/m2, and 5.0 kg/m2 (Bo-10, Bo-20, Bo-30, and Bo-50, respectively) were used.

2.4. Data Analysis

One-way analysis of variance (ANOVA) was conducted using the SPSS statistical software (IBM, SPSS, Statistics 21). The statistical difference was considered significant if p < 0.05. Figures were processed using OriginPro 8.0 (OriginLab Corporporation).

3. Results

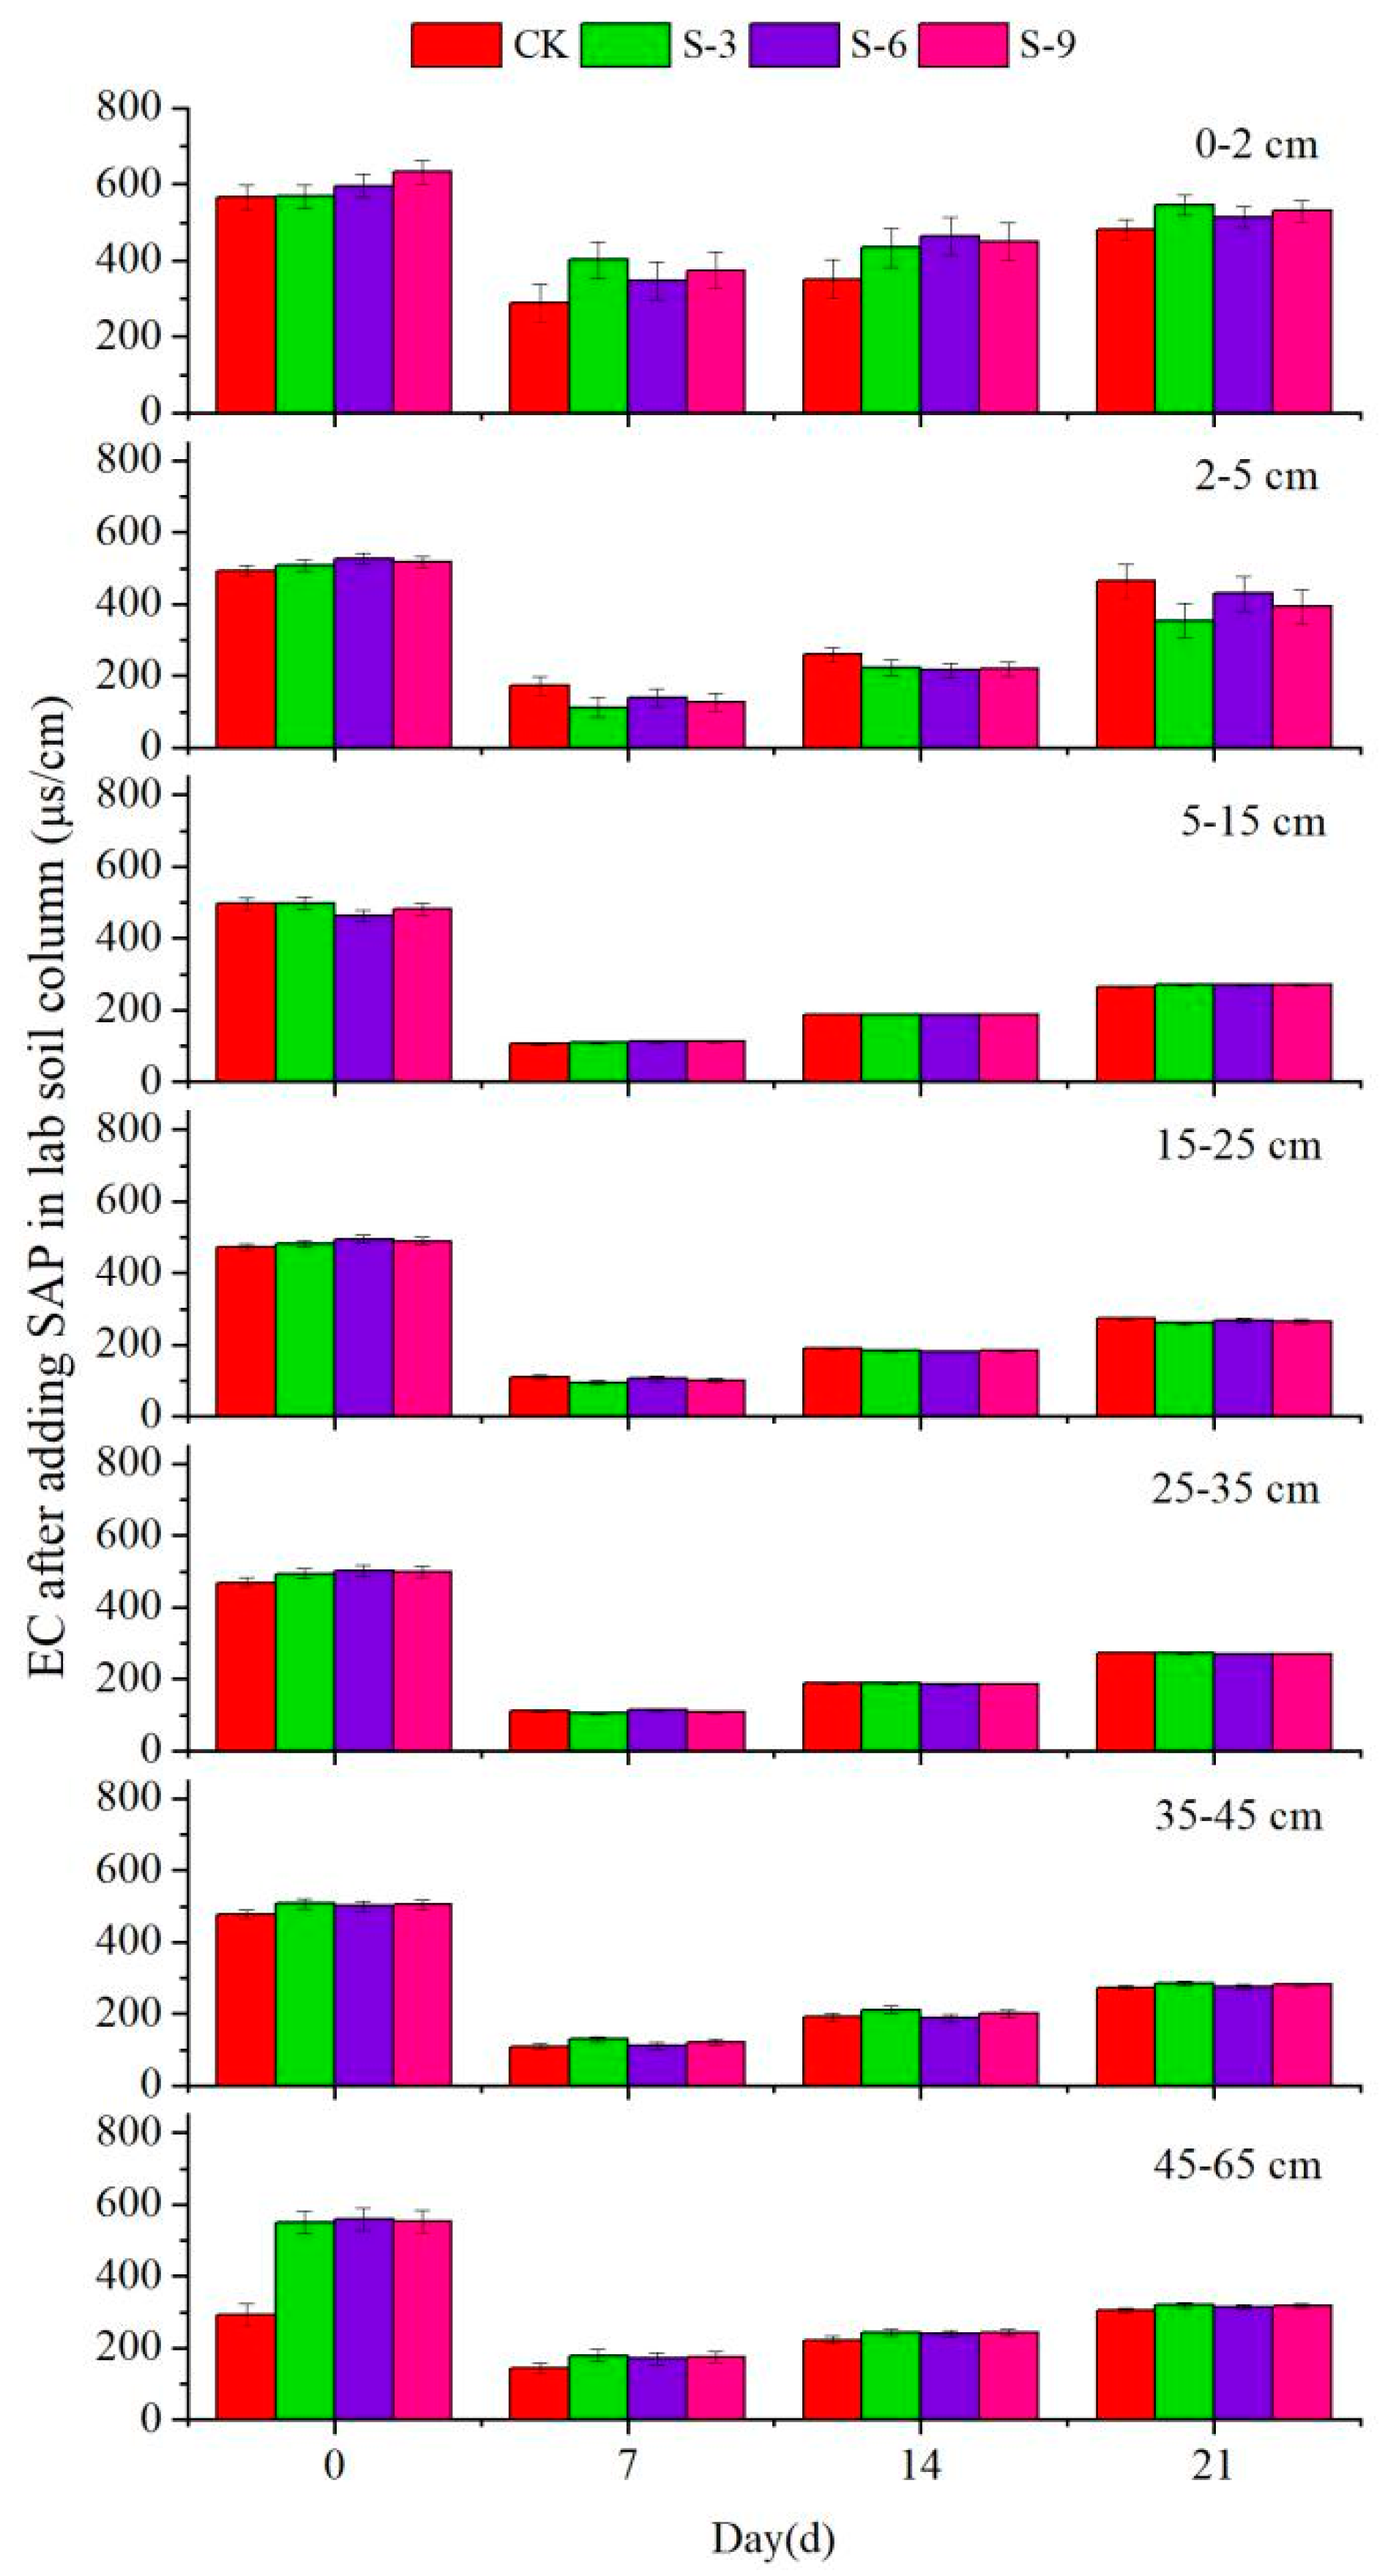
3.1. Lab Soil Column Simulation Observations

3.1.1. Effect of SAP on Soil Salinity in Simulated Infiltration Process

The effect of SAP on soil salinity was evaluated by the change of soil EC at different depths of the soil column during simulated infiltration (Figure 2). After irrigation, the amount of water on the soil surface decreased continuously with soil evaporation, and salt accumulated on the soil surface (0–2 cm). The EC range at a depth of 2–5 cm was 550–580 μs/cm before irrigation. After irrigation, the soil salinity gradually decreased with water leaching. The SAP test group had a strong water holding capacity, so its EC was generally lower than that of CK. As the evaporation simulation experiments progressed, water was continuously lost by capillary evaporation, and salt migrated to the surface with the water and accumulated there. Soil EC measurements on the 14th and 21st days showed that the application of SAP inhibited salt accumulation, although some accumulation was noted in the 0–2 cm soil layer on the 21st day. The soil EC at a depth of 0–20 cm was 26.28% (S-3), 9.71% (S-6), and 16.78% (S-90) higher than that of the CK group. The S-3 group (4.5 g/m2) showed the greatest ability to inhibit soil salt accumulation.

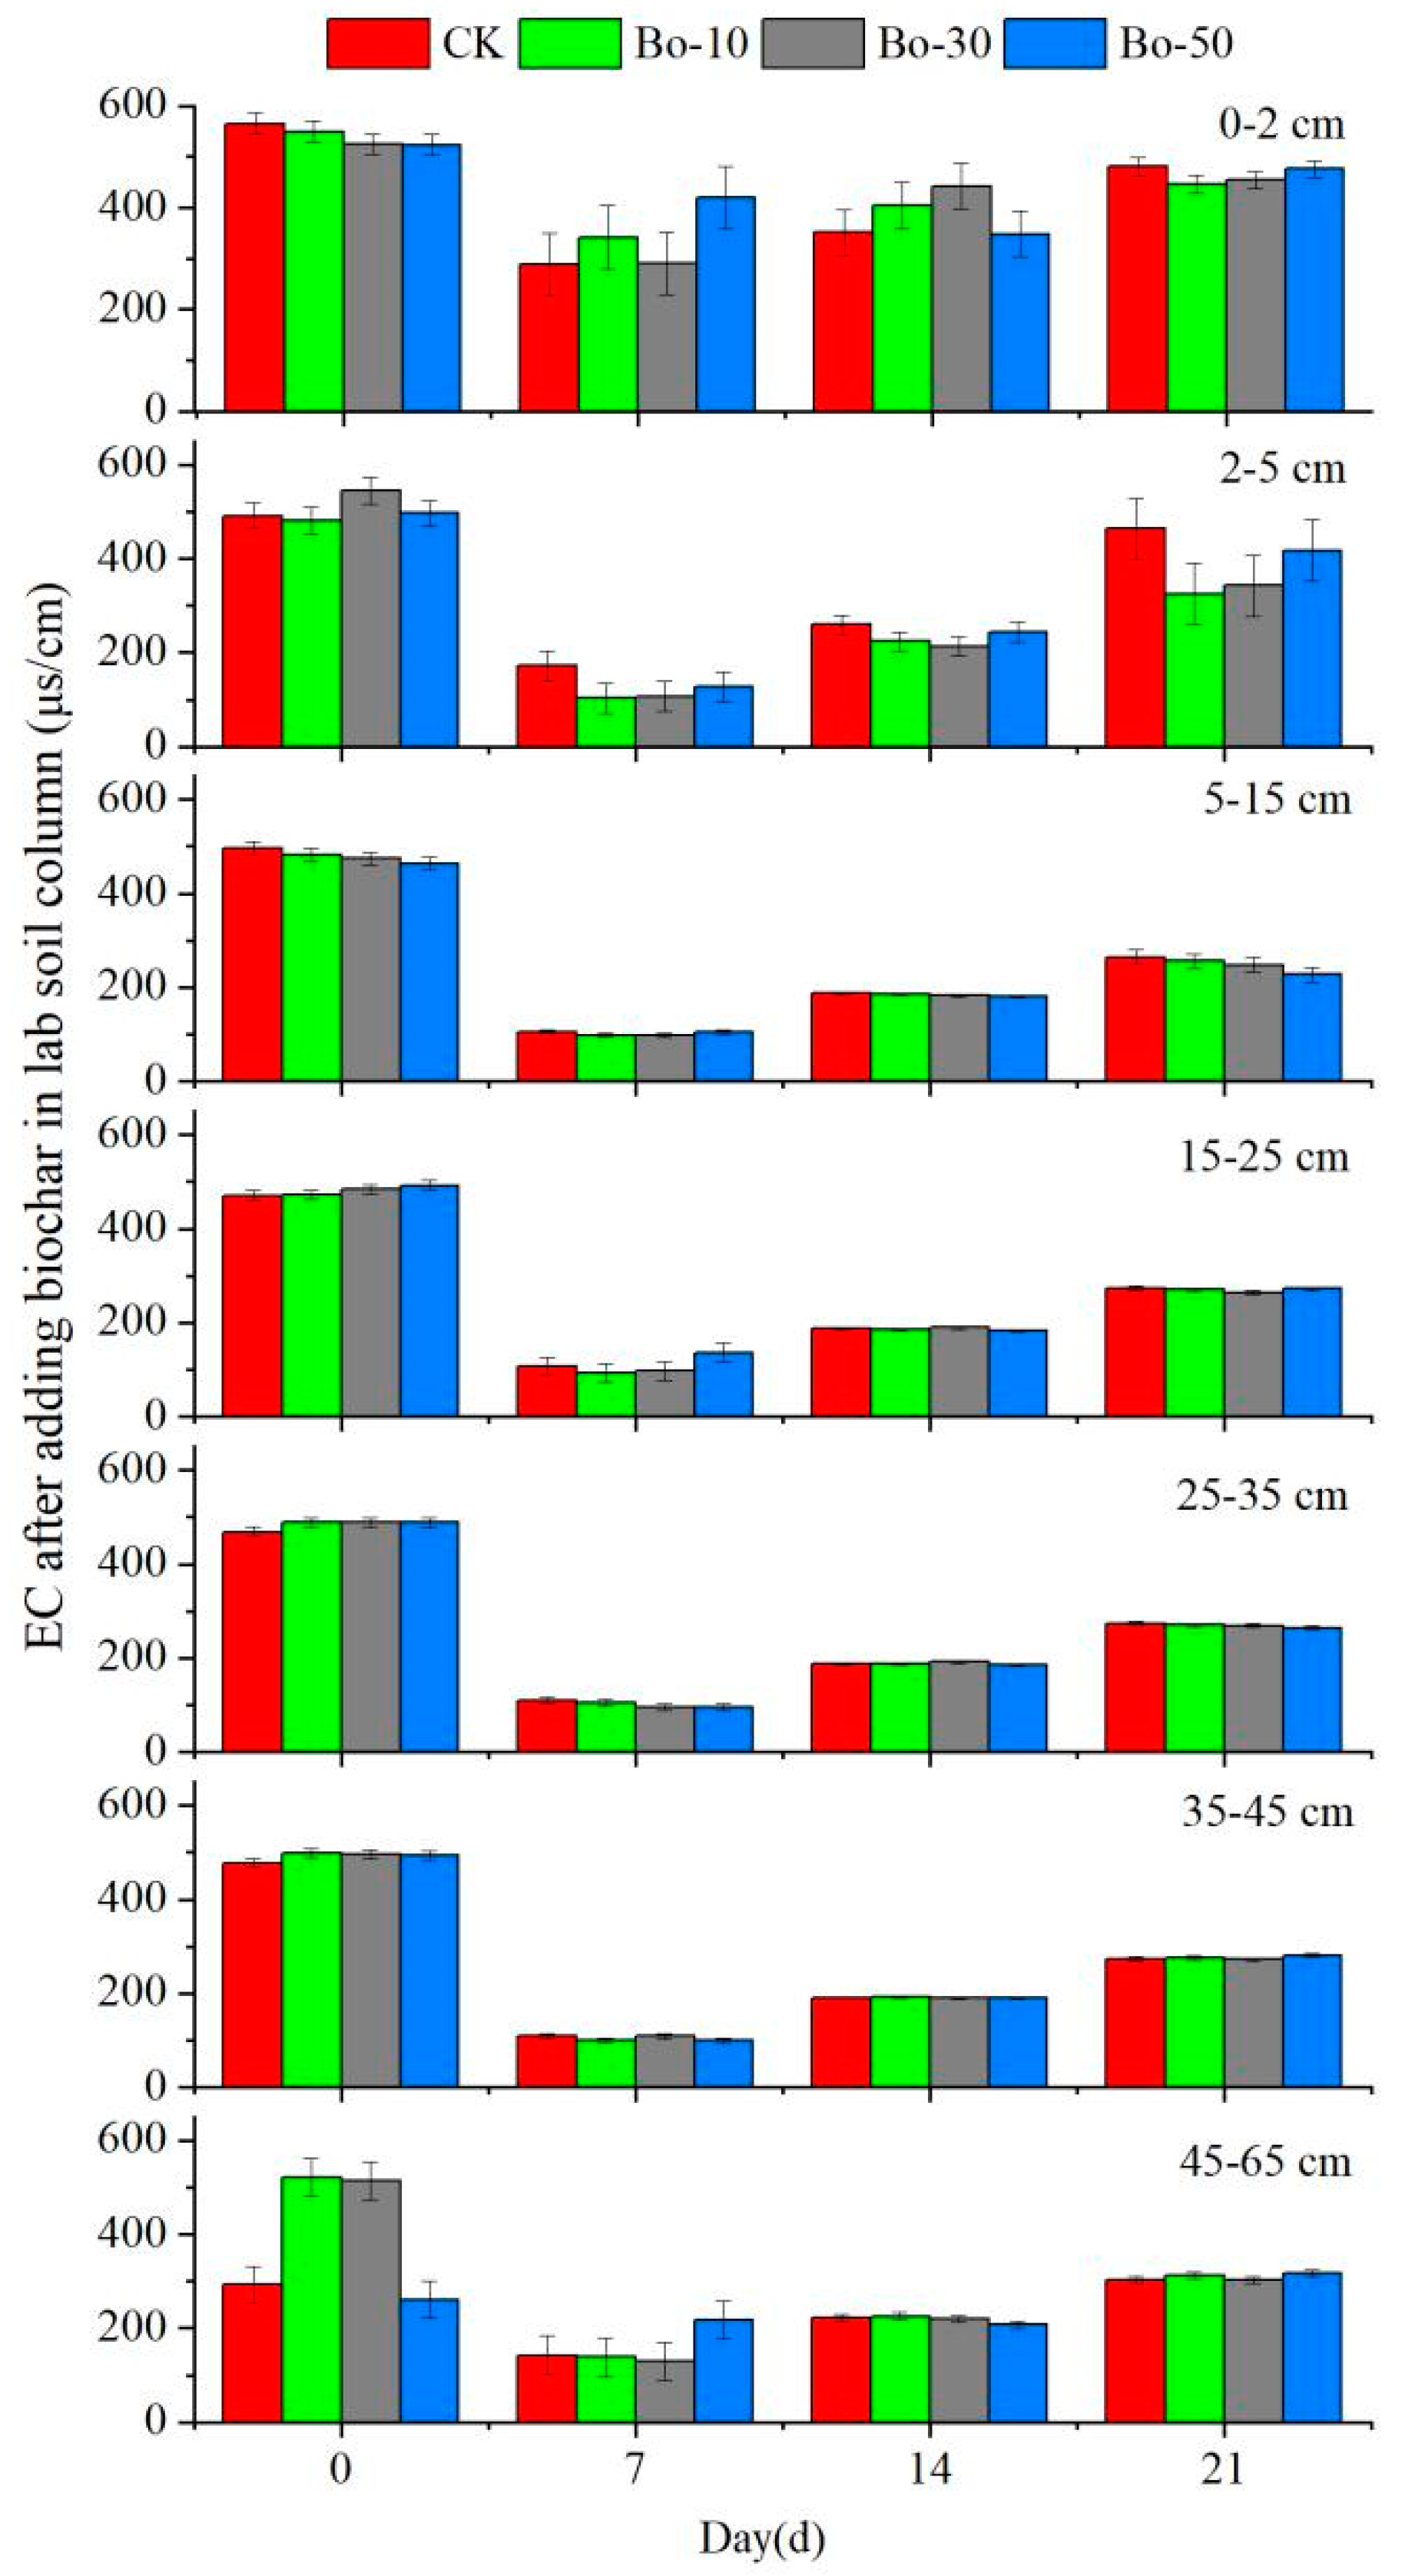
3.1.2. Effect of Biochar on Soil Salinity in Simulated Infiltration Process

The initial salinity range of the 2–5 cm soil layer was 490–560 μs/cm. After irrigation, the change of EC at different depths of the soil column with various biochar dosages was observed (Figure 3). Surface moisture decreased with evaporation, and salt accumulated in the surface layer of CK soil (0–2 cm). After irrigation (on the 7th day), the overall trend of the soil EC was in the order of CK > Bo-50 > Bo-30 > Bo-10. The EC in every biochar column was lower than that of CK on the 14th and 21st days, indicating that biochar could restrain the salt increase despite of ongoing evaporation. Soil salinity gradually increased along with capillary evaporation and soil water loss. In particular, the biochar treatments slowed the rate of salinization in the 5–15 cm soil layer. On the 21st day, the soil EC of each treatment group was lower than that of CK by 29.9% (Bo-10), 37.2% (Bo-30), and 13.5% (Bo-50). The data demonstrated the strongest ability to inhibit soil salinity increase with biochar application rates at 30 t/hm2 (p < 0.05).

3.2. Field Soil Column Investigation

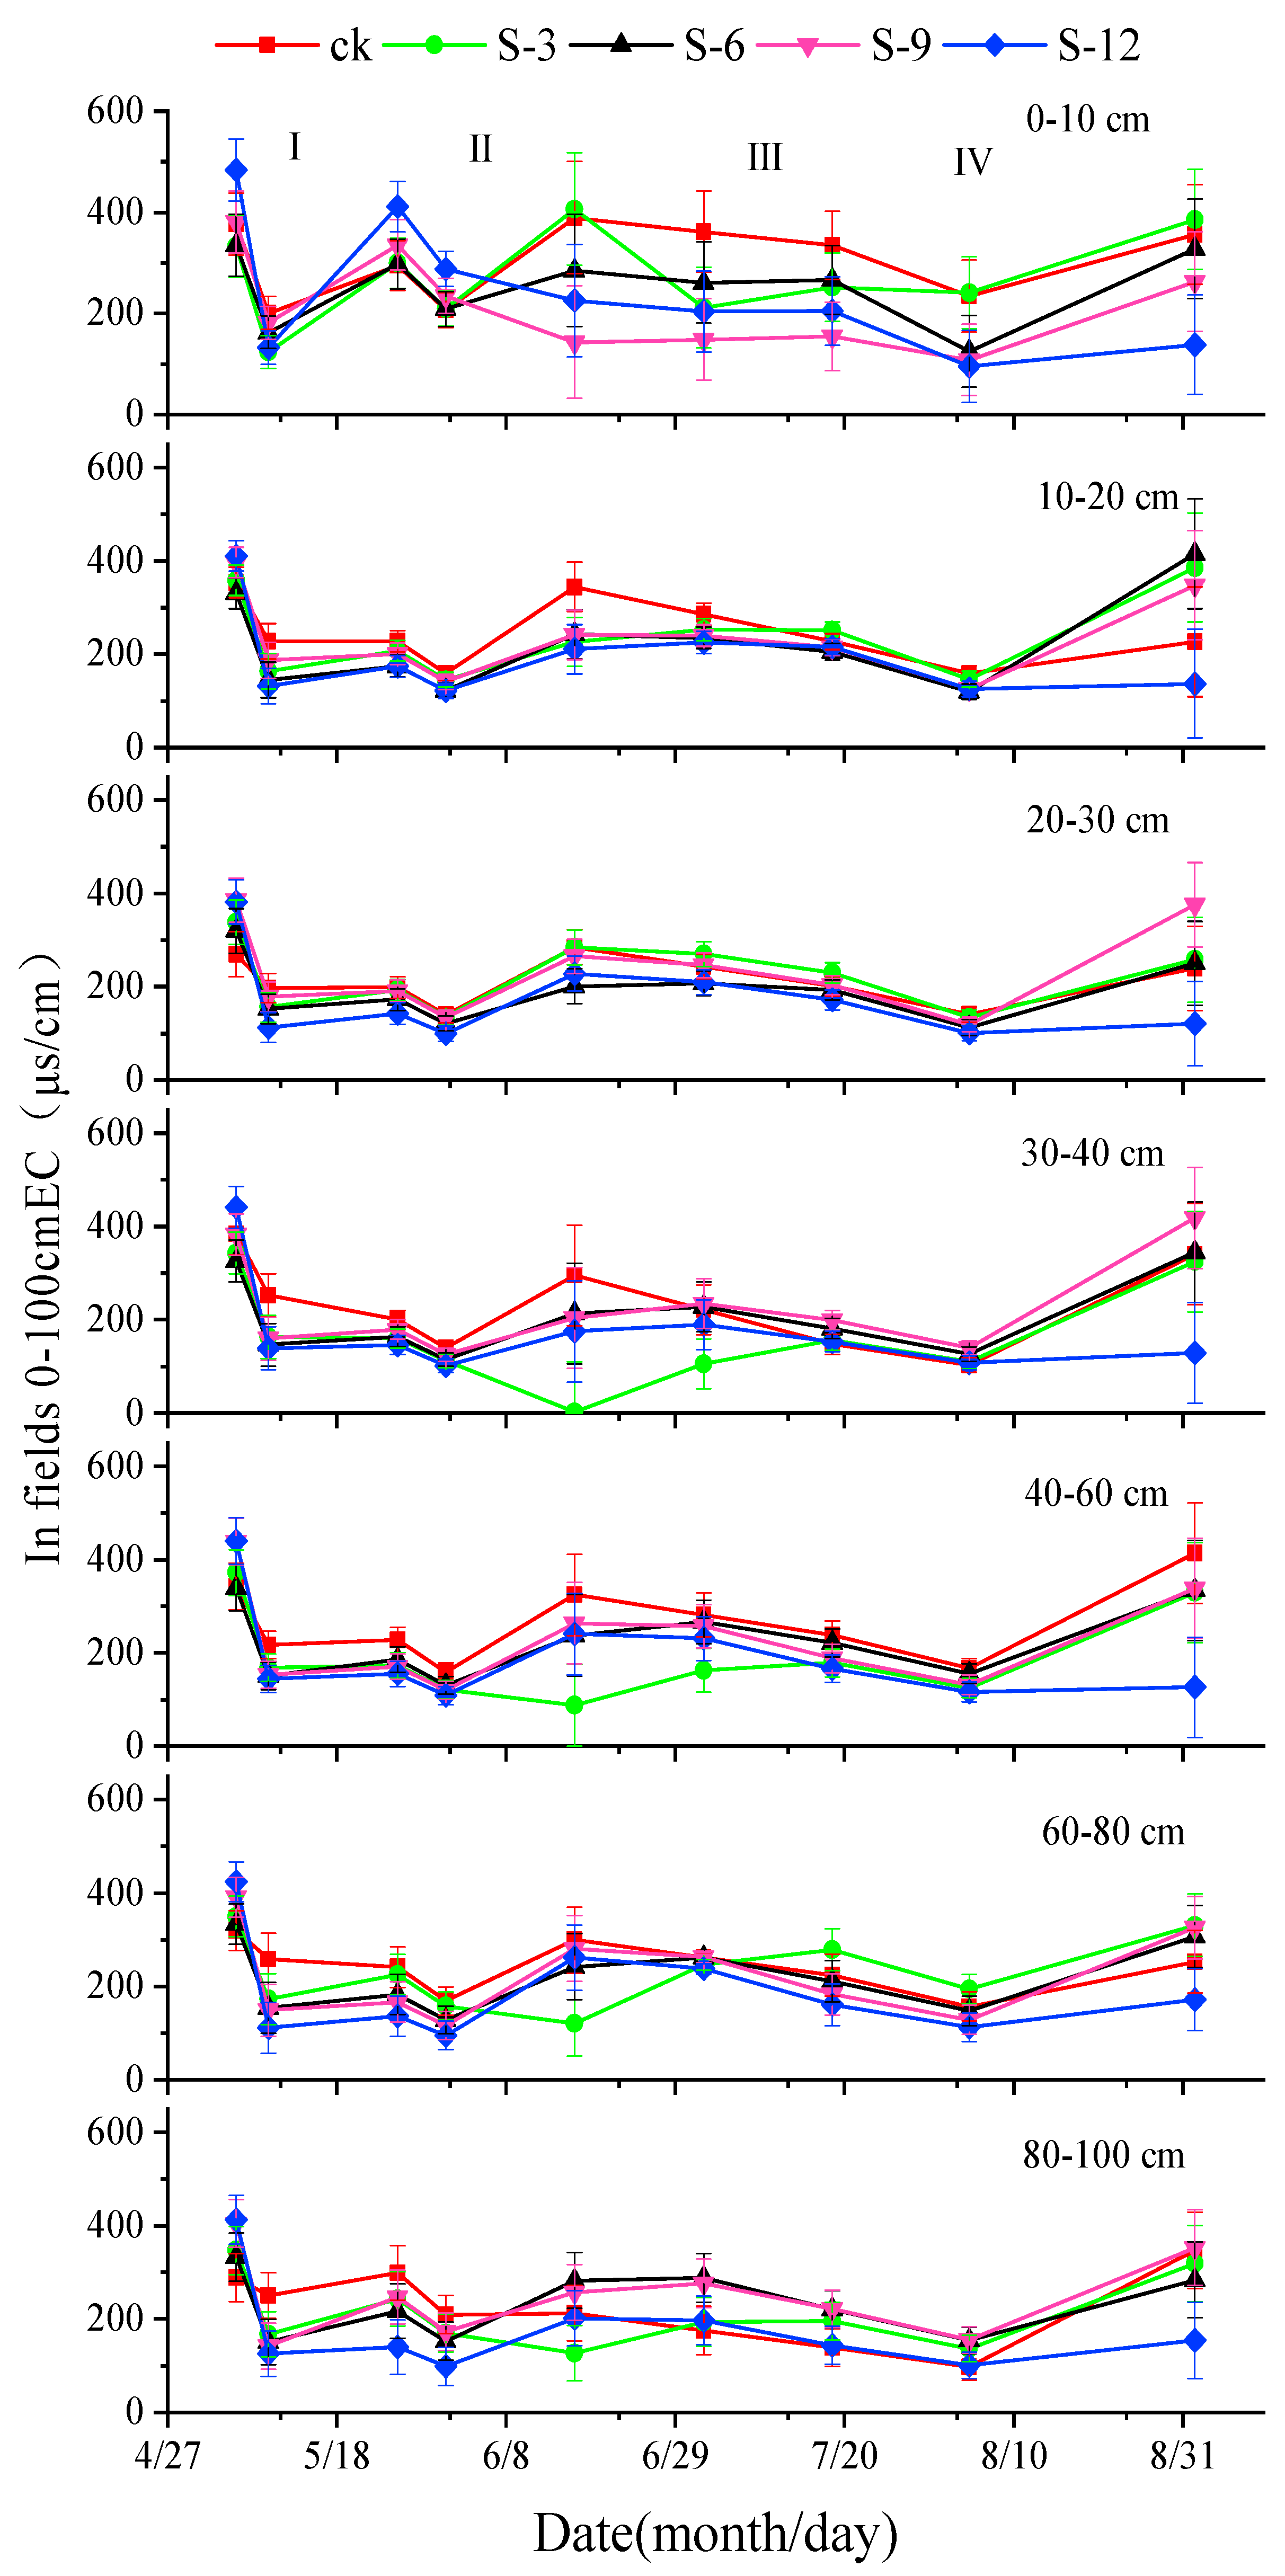
3.2.1. Effect of SAP on the Salt Content of Cultivated Soil

Based on the pattern of salt transport observed in the lab soil column simulation experiments, we considered the effects of different doses of SAP on salt transport in cultivated soil during the crop growth period and added an additional treatment group (S-12, 18.0 g/m2). Test plots were irrigated four times throughout the growth period. Soil EC was measured at different soil depths before and after each irrigation event in order to monitor salt leaching and the effect of SAP on salt accumulation (Figure 4).
After the first irrigation (10 May), the soil EC of the SAP treatment group was lower than that of CK in the 0–10 cm soil layer; after 22 days of evaporation, the salt accumulation rate of all SAP treatment groups was higher than that of CK. After the second irrigation (1 June), the salt content of each treatment group decreased. After 34 days of time, all SAP treatments except for S-3 and CK showed inhibited salt accumulation. After the third irrigation (3 July), the soil EC of each treatment group further decreased, with the following order: CK > S-6 > S-3 > S-12 > S-9. This decrease can be attributed the growing vegetation, which reduced evaporation from the soil surface by shielding the bare soil, thereby reducing the overall salt accumulation rate of each group. After the fourth irrigation (5 August), the soil EC of each group was reduced even further; the soil EC of every treatment group except S-3 was higher than that of CK. After the mature maize was harvested, the EC distribution order of the soil surface layer (0–10 cm) was: S-3 > CK > S-6 > S-9 > S-12 (Figure 4).
In the 10–20 cm soil layer, the EC value of each SAP treatment was lower than that of CK after the first irrigation during the early jointing stages of maize, which the soil showed salt inhibition characteristics. After the second irrigation, the EC value of S-3 and S-9 were higher than that of CK in the 20–30 cm soil layer, while the EC value of S-6 and S-12 were lower than that of CK. Similarly, the EC value of all SAP treatments were slightly higher than that of CK in the 30–40 cm soil layer. This is because the temperature, and therefore the daily evaporation, gradually increased after the second irrigation. At the same time, maize entered the middle jointing stage, which coincides with increased water demand, resulting in salt accumulation in the 20–60 cm soil layer. No SAP was applied to the 60–80 cm or 80–100 cm soil layers, which are part of the water supply layer; salt accumulation was therefore slightly delayed at these depths (Figure 4). With the increase in air temperature and evaporation intensity during the maturity period, the water–salt transport intensity increased, and the EC of each treatment was higher than that of CK (p < 0.05).
There is a definite SAP dose influence on the EC seasonal dynamics for most layers of the investigated soils (in Figure 4). For example, SAP applications of 18.0 g/m2 (S-12 experimental treatment), in 0–10 cm soil layer, EC value decreased by 71.6% from 483.8 μs/cm to 137.5 μs/cm; in 10–20 cm soil layer, EC value decreased by 66.7% from 410.8 μs/cm to 137.0 μs/cm; in 20–30 cm soil layer, EC value decreased by 68.3% from 381.8 μs/cm to 121.2 μs/cm; in 30–40 cm soil layer, EC value decreased by 70.7% from 441.2 μs/cm to 129.3 μs/cm; in 40–60 cm soil layer, EC value decreased by 71.3% from 439.8 μs/cm to 126.4 μs/cm; 60–80 cm soil layer, EC value decreased by 59.5% from 424.5 μs/cm to 172.0 μs/cm; 80–100 cm soil layer, EC value decreased by 62.6% from 412.6 μs/cm to154.3 μs/cm, in other words, EC value average decreased by 67.2% after SAP applications of 18.0 g/m2 (S-12 experimental treatment).
The field experiment verified the observations of the salt-inhibiting effect of SAP on cultivated land, and enabled quantitative evaluation of this effect according to application concentration and depth during the maize growth period. The 0–40 cm application layer played a role in inhibiting salt accumulation during the pre-germination and early jointing stages. However, the water and salt transport rates in other soil layers increased with the growth of maize and the corresponding increase in water demand. In the middle jointing stage, with the growth of the maize root system, salt accumulated in the soil root layer (40–80 cm), where no SAP was applied. This could be attributed to the dual effects of crop water absorption and soil evaporation loss.

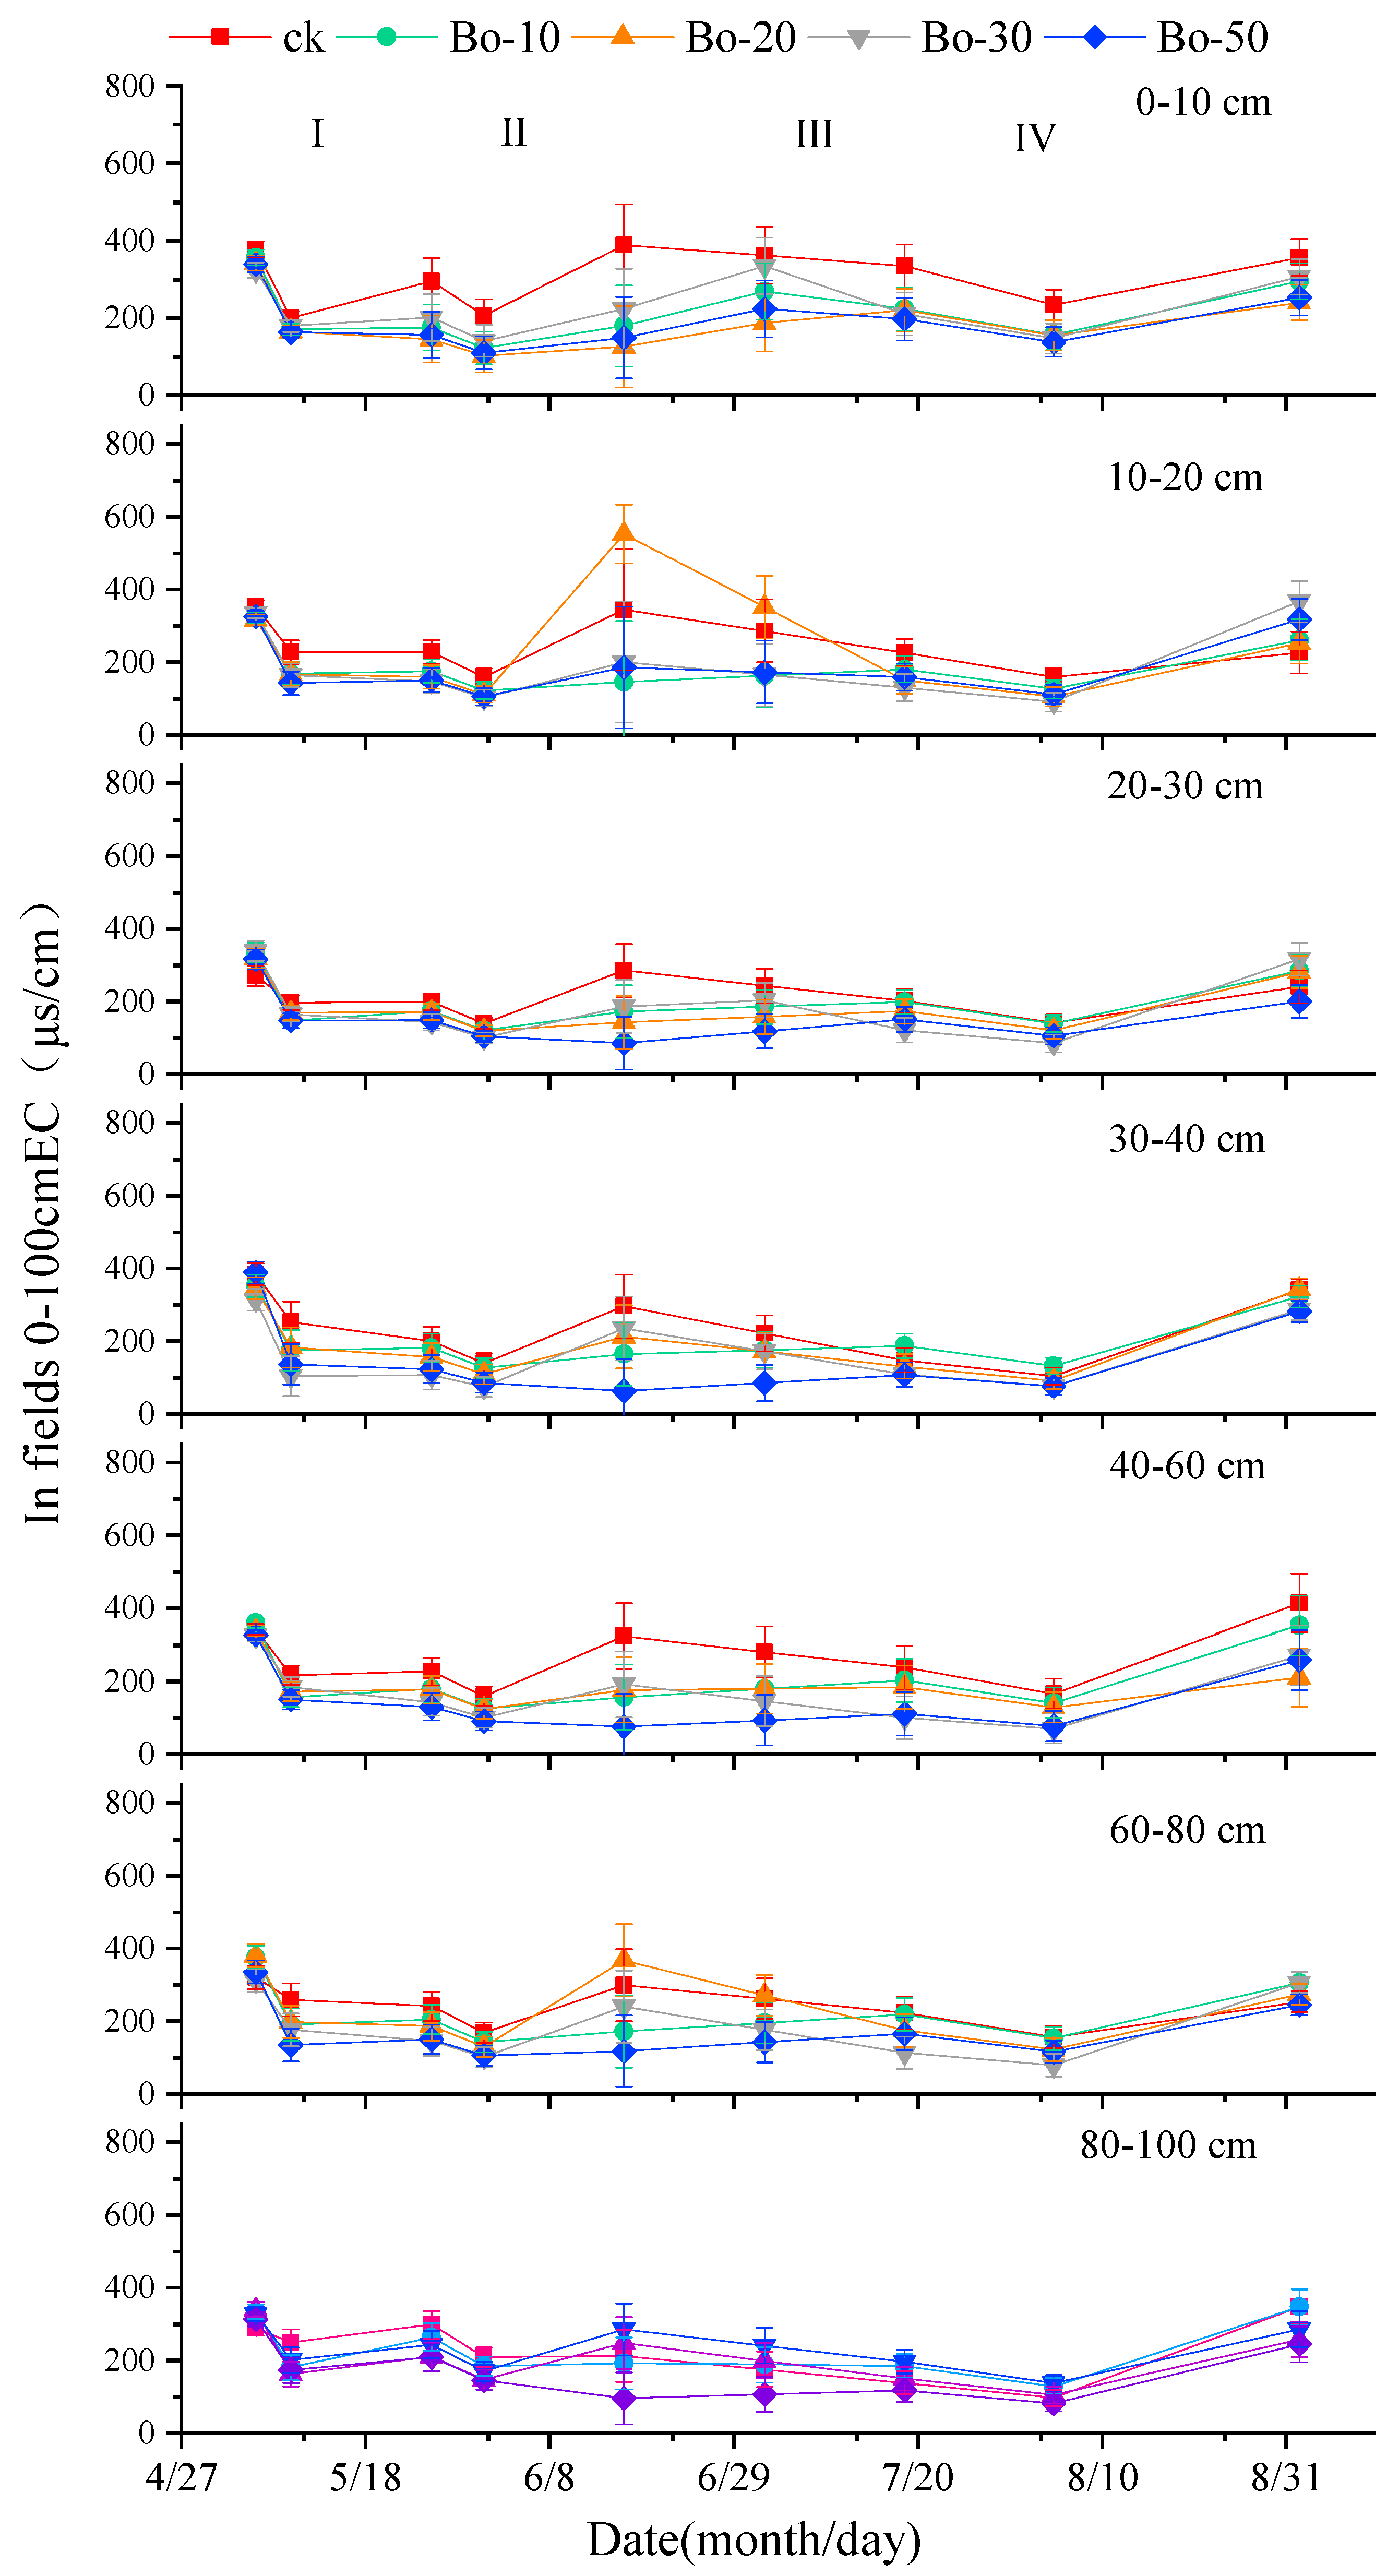
3.2.2. Effect of Biochar on the Salt Content of Cultivated Soil

Based on the results of the lab simulation experiments, Bo-20 (2.0 kg/m2) was added to the biochar treatment groups. In the field experiment, the biochar treatment group was irrigated four times throughout the growth period. The effect of biochar on soil salt accumulation was analyzed by the variation of EC at different soil depths prior to and after irrigation.
After the first irrigation (10 May), the EC in the 0–10 cm soil layer of each biochar treatment was lower than that of CK. After 22 days of evaporation, the salt accumulation rate of each biochar treatment remained lower than that of CK. After the second irrigation (1 June), the salt content of each treatment group decreased, and the salt accumulation rates were lower than that of CK. The overall soil EC distribution trend was: CK > Bo-30> Bo-10 > Bo-50 > Bo-20. After the third irrigation (3 July), the EC of each treatment group decreased further. With the shield of vegetation and reduced soil surface evaporation, the salt accumulation rate of each treatment plot remained low. After the fourth irrigation (5 August), the soil EC of each biochar treatment was lower than at the end of the third irrigation. However, after 26 days of time, significant salt accumulation was observed in Bo-30 and CK (Figure 5).
The distribution order of EC on the soil surface (0–10 cm) at the maturity stage was: CK > Bo-30 > Bo-10 > Bo-50 > Bo-20 (Figure 5). The EC of each biochar treatment was lower than that of CK in the 10–20 cm and 20–30 cm soil layers at all stages except at the maturity stage. From the middle and late jointing stages to the mature stage, there was very little difference in the EC values of the 30–40 cm soil layer between each biochar treatment and CK. The second irrigation was conducted at the middle jointing stage, when the water demand of crop increased along with the increasing air temperature and evaporation intensity. Such circumstance resulted in salt accumulation in the root layer (40–80 cm) of maize without biochar. In the 80–100 cm soil layer, salt accumulation occurred due to root water absorption and increased soil water potential. After the fourth irrigation, the ECs of Bo-30 and Bo-10 were higher than that of CK at this depth (p < 0.05).
There is a definite biochar dose influence on the EC seasonal dynamics for most layers of the investigated soils (in Figure 5). For example, biochar applications of 3.0 kg/m2 (Bo-30 experimental treatment) from 6th May to 5th August, in 0–10 cm soil layer, EC value decreased by 71.6% from 323.3 μs/cm to 147.0 μs/cm; in 10–20 cm soil layer, EC value decreased by 72.8% from 335.1 μs/cm to 91.0 μs/cm; in 20–30 cm soil layer, EC value decreased by 75.0% from 338.6 μs/cm to 84.7 μs/cm; in 30–40 cm soil layer, EC value decreased by 75.9% from 314.1 μs/cm to 75.7 μs/cm; in 40–60 cm soil layer, EC value decreased by 78.3% from 325.8 μs/cm to 70.6 μs/cm; 60–80 cm soil layer, EC value decreased by 74.5% from 311.7 μs/cm to 79.6 μs/cm; 80–100 cm soil layer, EC value decreased by 58.1% from 328.4 μs/cm to 137.6 μs/cm, in other words, EC value average decreased by 72.3% after biochar applications of 3.0 kg/m2 (Bo-30 experimental treatment).
In summary, the application of biochar inhibited the salt accumulation, particularly in the early stage of maize growth. However, from the middle jointing stage, as growth accelerates and the water demand increases, salt tended to accumulate. The soil below the application layer was appeared salt accumulation at later stages of growth due to increased root water absorption and soil water potential.

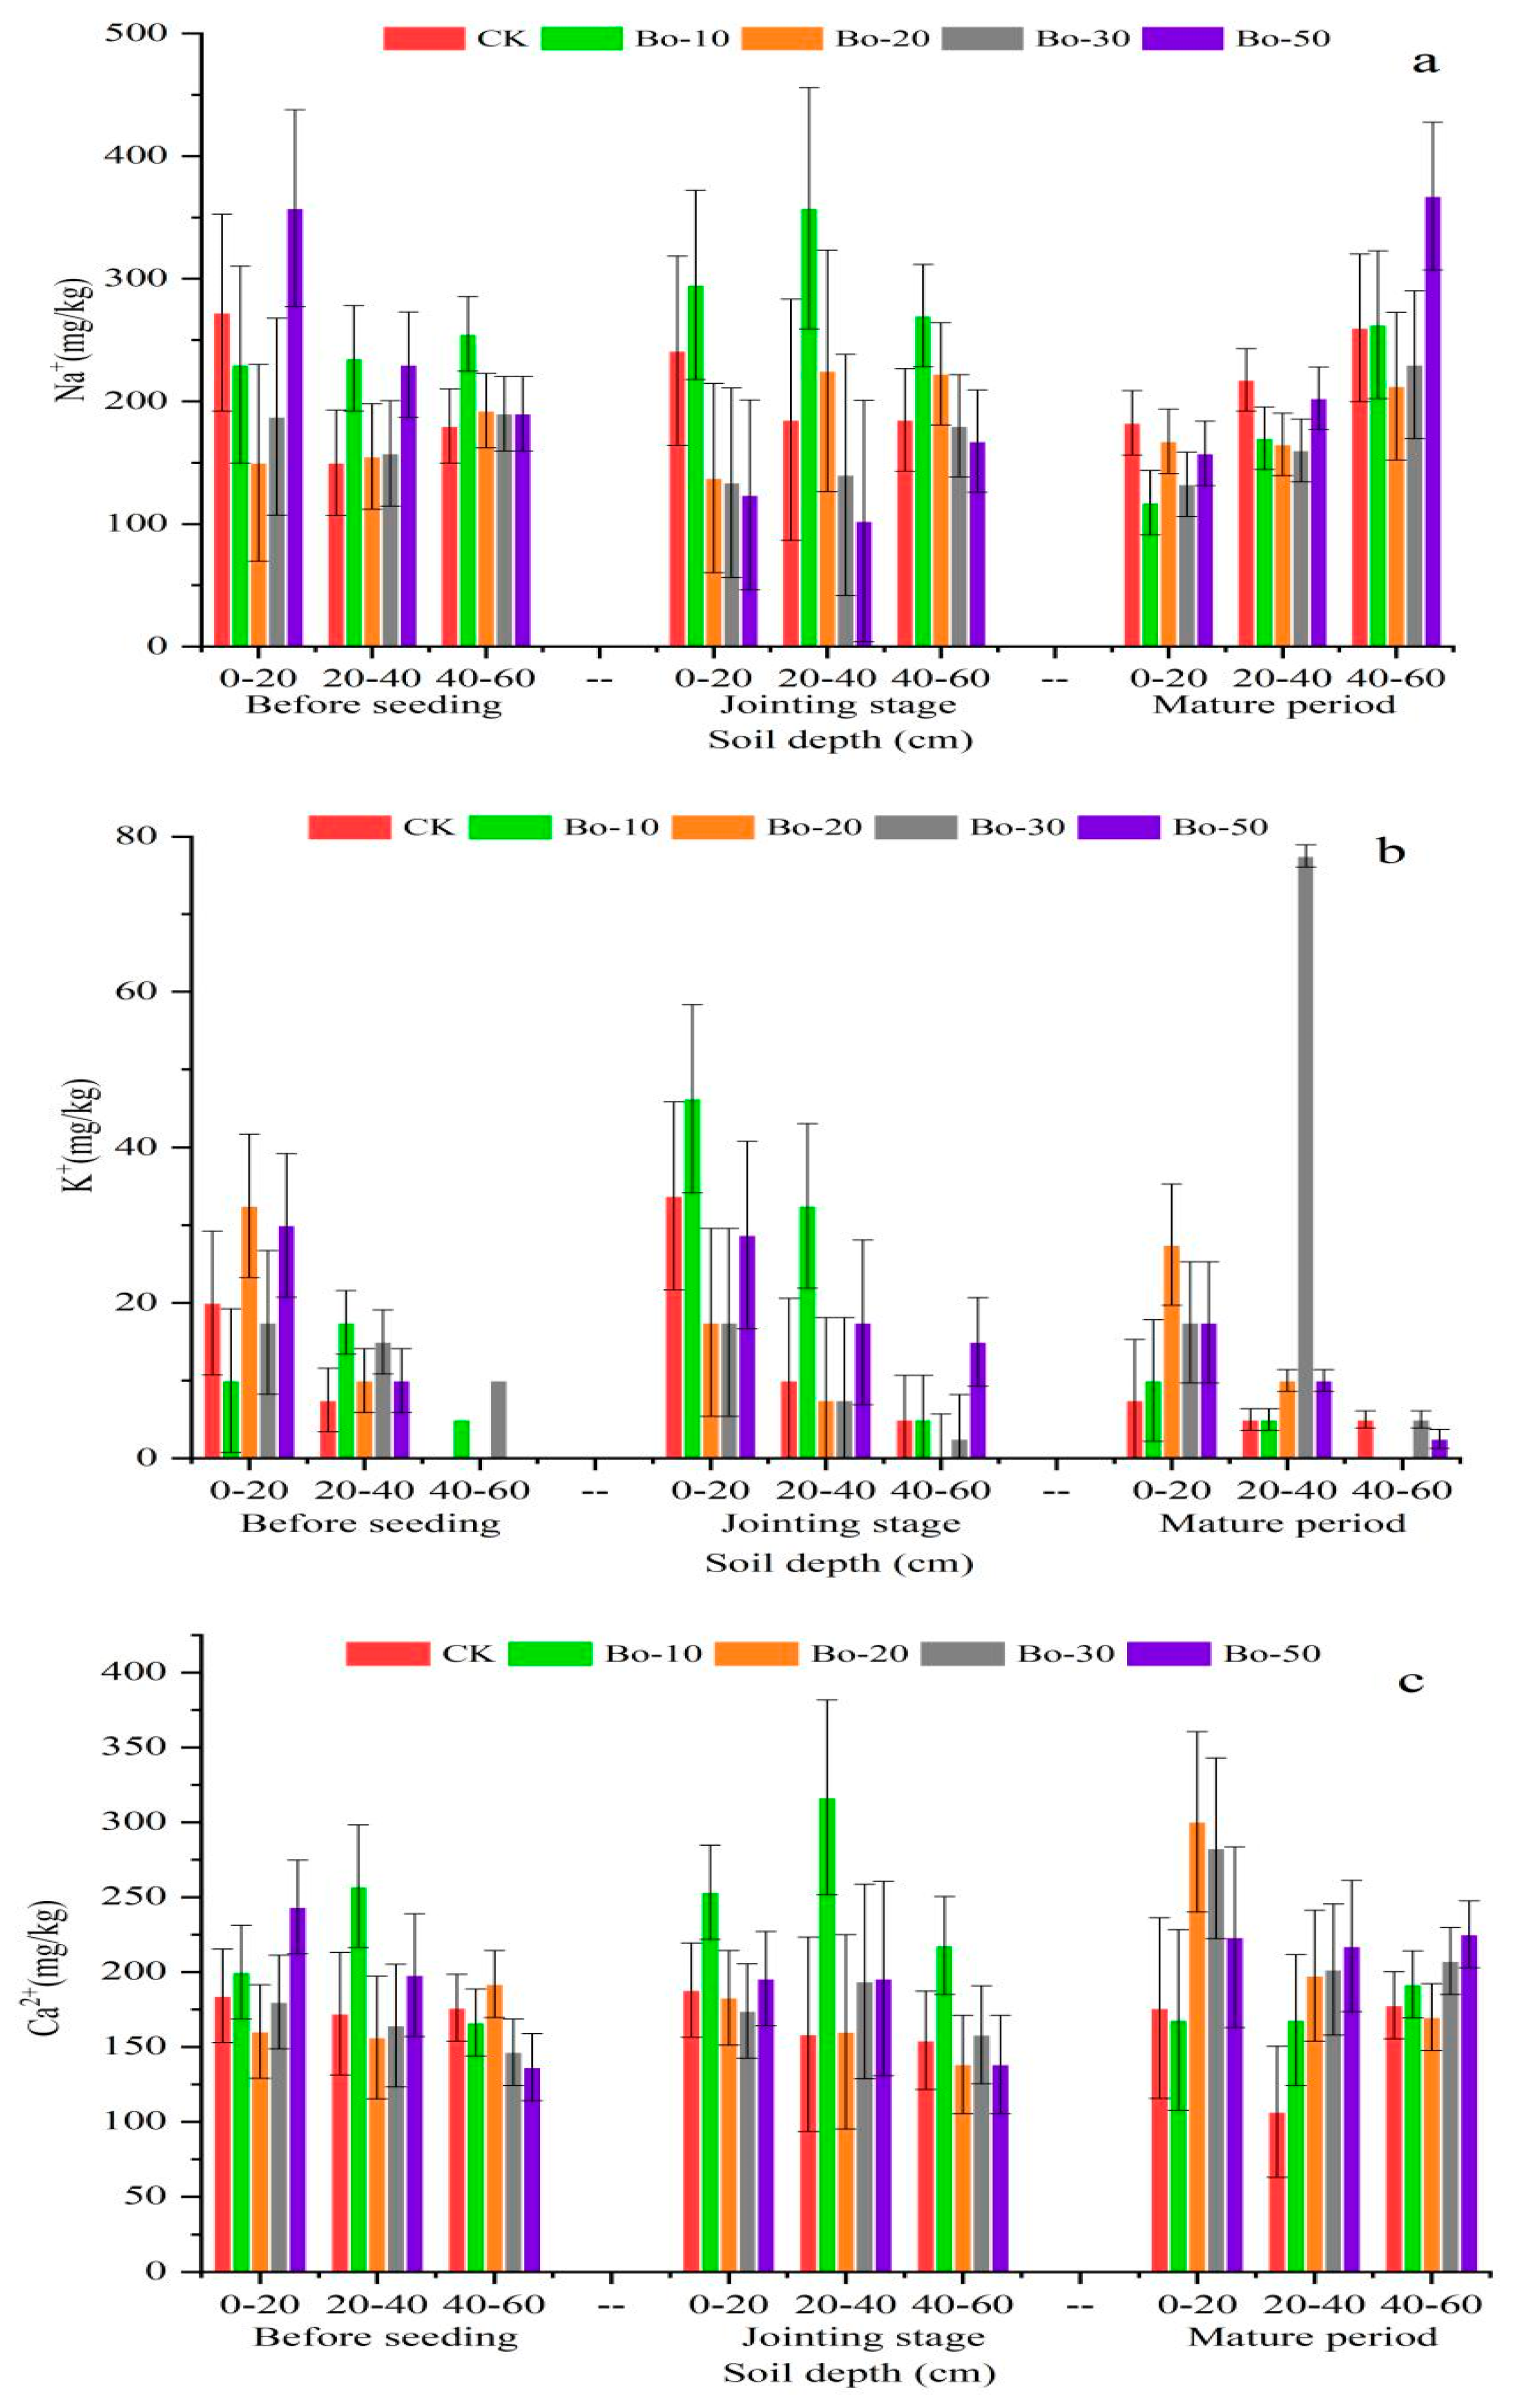
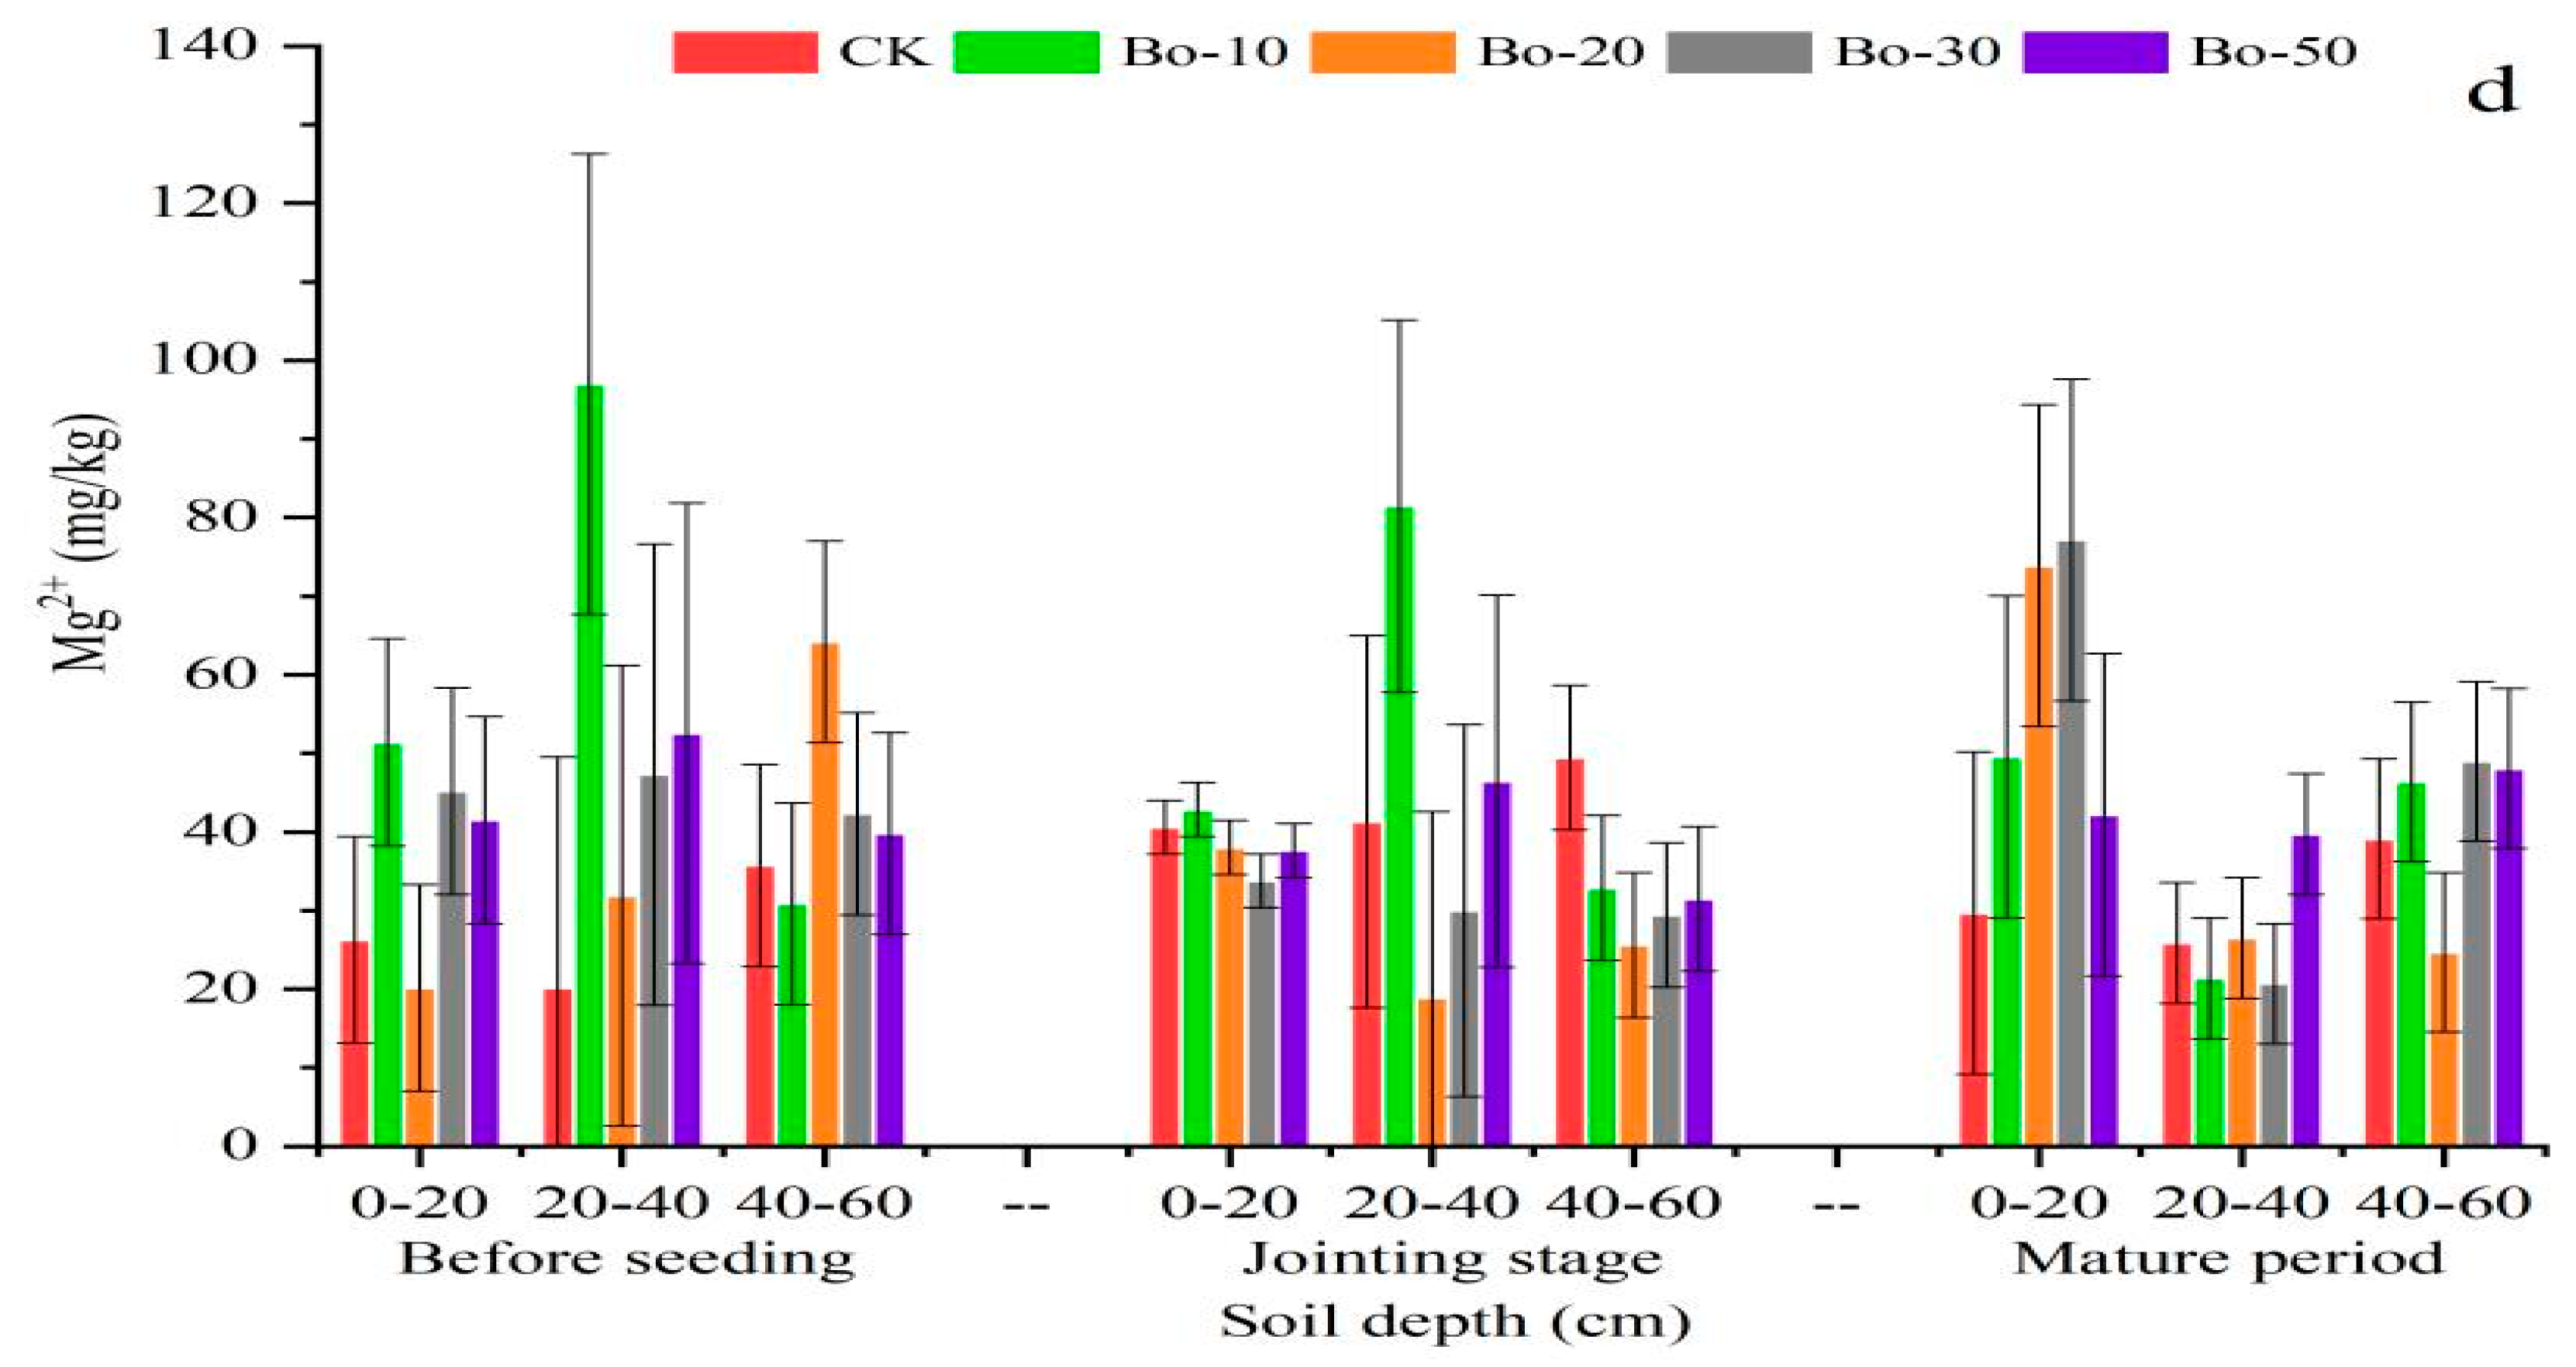
3.3. Effects of Biochar on Base Ion Concentrations in Soil Column

After biochar application (Figure 6a), Na+ content in the surface layer (0–20 cm) decreased by 16% (Bo-10), 45% (Bo-20), and 31% (Bo-30), while increasing by 31% in Bo-50 treatment compared with CK. The Na+ content in the middle layer (20–40 cm) and the lower layer (40–60 cm) increased in varying degrees compared with CK: 57% (Bo-10), 3% (Bo-20), 5% (Bo-30), and 53% (Bo-50). The Na+ content of the deepest layer increased by 42% (Bo-10), 7% (Bo-20), 6% (Bo-30), and 6% (Bo-50). Based on our observations, we suggest that these results reflect disturbance from the rotary cultivator, which mixed the high-salt-content surface soil into the middle and lower soil layers when mixing biochar evenly throughout the 0–40 cm (± 5 cm) soil layer. After the second irrigation, the maize entered the jointing stage. The Na+ in the surface layer (0–20 cm) decreased by 43% (Bo-20), 45% (Bo-30), and 49% (Bo-50) compared with CK. The Na+ content in the middle layer (20–40 cm) decreased by 24% (Bo-30) and 45% (Bo-50) compared with CK. In the deepest layer (40–60 cm), Na+ decreased by 3% (Bo-30) and 9% (Bo-50) compared with CK, while it increased in Bo-10 and Bo-20 by 46% and 20%, respectively. This may be due to the relatively high soil moisture in the application layer (0–40 cm) of the biochar treatment group. As the temperature and evaporation rate increased during the jointing period, the water and salt transport through soil capillaries increased, resulting in a positive correlation between biochar application and salt inhibition. A low biochar application dose had relatively little effect on these factors, and therefore led to Na+ accumulation. In the maturity stage, Na+ in the surface layer (0–20 cm) decreased by 36% (Bo-10), 43% (Bo-20), 45% (Bo-30), and 49% (Bo-50) compared with CK; the decrease in the middle layer (20–40 cm) was 22% (Bo-10), 24% (Bo-20), 26% (Bo-30), and 7% (Bo-50); and the decrease in the bottom layer (40–60 cm) was not significant compared with CK.
Analysis of K+ (Figure 6b) showed higher content in the surface layer (0–20 cm) in all biochar treatments than in CK throughout the entire maize growth period, with the exception of the Bo-10 treatment during the pre-germination and maturity periods. During the maturity stage, the K+ content of each treatment increased by 38.52% (Bo-20), 17.95% (Bo-30), and 16.76% (Bo-50), compared with CK. In the middle (20–40 cm) layer, the K+ content of the biochar treatment groups was higher than that of CK in the pre-germination and maturity stages. However, during the high-growth jointing stage when plants utilize K+ at the greatest rate to promote the growth of roots, stems, and leaves, the K+ content of all treatments except Bo-50 was lower than that of CK. This observation indicated that biochar provided K+ and promoted its absorption by plants. As the demand for K+ by crops declined in the maturity stage, the concentration of K+ increased in tandem with the salt-inhibiting effects of different biochar application dosages. The order of K+ concentration was Bo-20 > Bo-50 > Bo-30 > Bo-10 > CK. In the deepest layer (40–60 cm), the K+ content in most biochar treatment groups was higher than that of CK.
The variations of Ca2+ and Mg2+ were analyzed in the surface layer (0–20 cm) at different biochar application rates (Figure 6c,d). The Ca2+ content tended to be consistent with that of EC in each biochar treatment. In the pre-germination stage, there were no significant differences between any treatment plot and CK. At the jointing stage, the order of Ca2+ content was Bo-10 > Bo-20 > Bo-50 > Bo-30 > CK. At the maturity stage, biochar promoted water and salt transport, leading to salt accumulation in the soil. Compared with CK, the Ca2+ content of each treatment increased by 20.1% (Bo-10), 70.8% (Bo-20), 37.9% (Bo-30), and 21.2% (Bo-50). The Ca2+ content of the middle layer (20–40 cm) of each biochar treatment increased significantly in the jointing stage, especially in the Bo-10 treatment (p < 0.05). The Ca2+ content of each treatment increased in the maturity stage by 46.1–58.4% compared with CK. The trend of Mg2+ concentration in the surface layer (0–20 cm) of the biochar treatment groups was similarly to that of Ca2+ (Figure 6d). Although the Mg2+ content was higher in biochar treatment groups than in CK in the pre-germination and maturity stages, it increased significantly with the increases in water and salt transport rates in each treatment group during the jointing period. The Mg2+ content was elevated in the middle layer (20–40 cm) of the biochar treatments in the pre-germination stage but began to decrease at the jointing stage. Because of Mg2+ is the core element of plant chlorophyll, which is an important ion for maintaining plant photosynthesis. At the jointing stage, the Mg2+ content of each treatment plot was lower than that of CK due to the demand from rapidly growing plants. At the maturity stage, it increased slightly; in the bottom layer (40–60 cm), where no biochar was applied, we observed little change in Mg2+ content.

4. Discussion

4.1. Comparative Analysis of Biochar and SAP Effects on Soil Salinity

Changes in salinity were compared in soils treated with the two types of soil amendments in soil column simulation experiments, and through dynamic monitoring in field experiments. Both amendments inhibited soil salt accumulation even though with different degrees. The application of SAP inhibited salt in the pre-germination and jointing stages, however, salt gradually began to accumulate from the middle of jointing stage until maturity (Figure 4). In contrast, biochar had an inhibition effect on soil salt accumulation in the pre-germination, jointing, and maturity stages (Figure 5). Ion content analysis showed that the application of biochar reduces Na+ in the soil at the jointing and maturity stages of maize, and significantly increases the of K+ and Mg2+ contents required for crop growth, and promotes nutrient absorption and photosynthesis by crops (p < 0.05) (Figure 6). Therefore, biochar is superior to SAP in terms of salt control and nutrient supply.
The main chemical component of SAP is polyacrylamide [28], which has strong water absorption capability. When applied to soil, it can increase the moisture content, and improves the soil structure mainly via water absorption and expansion [10]. However, SAP has a very low ability to maintain stable soil structure [13], and its presence does not directly impact or improve soil organic matter and nutrient contents. Biochar is a kind of incompletely combusted biomass with structural features such as multi-porosity, high specific surface area, and low bulk density [11]. The organic functional groups carried by biochar can combine with soil particles to promote the formation of organic matter and soil aggregates, increase soil temperature, promote germination rate, and increase crop yield [30,31]. In contrast to SAP, biochar not only changes the original physical structure of the soil, but also enhances the biochemical characteristics of the soil. It affects nutrient cycling and transport properties and inhibits salt accumulation through physical and chemical mechanisms [32]. In addition, the structural characteristics of biochar make it highly adsorbent and enable it to easily adsorb heavy metal ions in the soil [20]. In this way, biochar can also play an important role in the remediation of heavy metal-contaminated soil.

4.2. Effect of Biochar on Soil Nutrients

Soil nutrients refer to nutrient elements that can be directly or indirectly absorbed and used by plants. They are not only the basis for soil fertility evaluation, but also constitute one of the soil quality index evaluation standards. According to the results of this study, the application of biochar can improve soil fertility by effectively increasing the content of nutrients such as K+, Ca2+, and Mg2+ (Figure 6). One of the important physiological functions of K+ is to help regulate cellular responses to environmental conditions and enhance plant tolerance to various adverse conditions, such as drought, low temperature, salinity, pest and disease hazards, and lodging [33,34]. In this study, the application of biochar improved the K+ content of the soil, providing a supply of K+ to the plants during a period of high growth (Figure 6b). Some researchers have pointed out that the K+ content increases at higher preparation temperatures in wheat straw biochar [35]. Study demonstrated that after an application of 1% biochar to yellow-brown and red soils, the K+ content in the soil increased significantly [36]. Another important nutrient is Ca2+, which is an important component of plant cell walls and plays an important role in plant life activities, such as cell elongation and division, regulation of enzyme activity, and metabolism [37,38]. In this study, Ca2+ content of treatment groups increased by 46.1–58.4% compared with CK in the maturity stage (Figure 6c). The lack of Ca2+ in plants leads to weakened cell function, changes in cell membrane fluidity and permeability, and the aging and necrosis of tissues [39]. As the core element of plant chlorophyll, Mg2+ (chlorophyll contains 2.7% Mg2+) plays an important role in maintaining plant photosynthesis and can promote the growth and development of crops [40,41]. In addition, Mg2+ is an important component of plant enzymes and also an activator of various plant enzymes (phosphorylase and phosphokinase) [42]. Biochar could enhance the exchangeable of Ca2+ and Mg2+ in soil solution by increasing soil moisture content, which can promote the formation of Ca-Mg-C complex in soil and improve the fungi growth and fungal mediated aggregation [43], and is conducive to the improvement of soil texture.
Biochar also has an effect on the soil fertilization [12]. Studies have shown that biochar can significantly improve the nitrogen fixation ability of legumes [44], inhibit the denitrification of wet soil, and promote the nitrate reduction reaction by increasing the soil pH, thereby reducing the emission of soil N2O to the atmosphere [45,46]. Soil salinization could not only affect the cation exchange capacity of soil, but also change the physical and chemical properties and microbial activities of soil, dissolve organic matter (DOM) content showed upward trend with the increase of soil salt content [47]. The unstable components of biochar supplement the soil carbon pool in the form of soluble organic matter. The large specific surface area and rich pore structure of biochar can also improve the adsorption and retention capacity of organic matter and reduce soil carbon loss [48]. When applied over an extended period, biochar particles in the soil have the ability to expand their own structure and increase their storage capacity of cations [49]. When biochar is combined with soil particles, surface oxidation occurs, providing negative surface charge for organic matter and mineral complexes, thus improving soil structure and salt regulation [5,50,51,52].
Thus, the application of corn straw biochar shown in our filed work might also increase organic matter and soil nutrient contents in addition to the potential to alleviate the expansion of secondary salinized land area in arid and semi-arid regions. This will be vigorously investigated in our future research work for its practical significance for the sustainable development of cultivated soil in arid and semi-arid climate areas.

5. Conclusions

Our lab soil column simulation and field experiments showed that the application of either the water-retaining agent polyacrylamide SAP or corn straw biochar inhibited soil salt accumulation. The SAP had a pronounced effect during the pre-germination and jointing stages. The inhibiting capability was strongest at the application of 45 kg/hm2 SAP under the circumstance of our project setup. Biochar had a remarkable effect on soil salt accumulation throughout the entire growth period of maize. The optimal application rate of 30 t/hm2 led to a 37.2% reduction in salt accumulation relative to CK. Our data indicated that the corn straw biochar seemed having brought its own Ca2+, Mg2+, and K+ into soil with its application. With this concern, the corn straw biochar would be superior to polyacrylamide SAP in remediating salinized soil in arid and semi-arid areas. Future field trial research with multiple sites and multiple years is needed to check the validity and applicability of these observations.

Author Contributions

W.F. analyzed the data and wrote the manuscipt; J.G. modified the manuscript; R.C. designed the research and carried out the experiments; F.Y. analyzed the data and wrote the manuscript. Z.H. modified and improved the language of the manuscript; J.W., Q.M., and H.L. analyzed the data and modified the manuscript. All the authors have read and agreed to the published version of the manuscript. Mention of trade names or commercial products in this publication is solely for the purpose of providing specific information and does not imply recommendation or endorsement by the U.S. Department of Agriculture. USDA is an equal opportunity provider and employer. All authors have read and agreed to the published version of the manuscript.

Funding

This research was in part supported by the National Natural Science Foundation of China (41907338, 41703115 and 2019YFC0409205), Postdoctoral Science Foundation of China (2019M660753) and Youth Top Talent Support Program of Beihang University (YWF-20-BJ-J-907).

Conflicts of Interest

The authors declare no conflict of interest.

References

  1. Walker, S.; Kumar, J.; Biswas, B. Assessment of different indices (vegetation, salinity) and salt effected area trend analysis using shannon entropy approach–a case study in a semi-arid region of india using rs/gis. Plant Arch. 2019, 19, 3457–3466. [Google Scholar]
  2. Minhas, P.S.; Ramos, T.B.; Ben-Gal, A.; Pereira, L.S. Coping with salinity in irrigated agriculture: Crop evapotranspiration and water management issues. Agric. Water Manag. 2020, 227, 105832. [Google Scholar] [CrossRef]
  3. Nachshon, U. Cropland soil salinization and associated hydrology: Trends, processes and examples. Water 2018, 10, 1030. [Google Scholar]
  4. Sahaar, S.A.; Niemann, J.D. Impact of regional characteristics on the estimation of root-zone soil moisture from the evaporative index or evaporative fraction. Agric. Water Manag. 2020, 2381, 106225. [Google Scholar] [CrossRef]
  5. Liu, A.; Qu, Z.; Nachshon, U. On the potential impact of root system size and density on salt distribution in the root zone. Agric. Water Manag. 2020, 234, 106118. [Google Scholar] [CrossRef]
  6. Chang, X.; Gao, Z.; Wang, S.; Chen, H. Modelling long-term soil salinity dynamics using SaltMod in Hetao Irrigation District, China. Comput. Electron. Agric. 2019, 156, 447–458. [Google Scholar] [CrossRef]
  7. Wang, X.; Zhang, D.; Qi, Q.; Tong, S.; An, Y.; Lu, X.; Liu, Y. The restoration feasibility of degraded Carex Tussock in soda-salinization area in arid region. Ecol. Indic. 2019, 98, 131–136. [Google Scholar] [CrossRef]
  8. Xiao, Y.; Zhao, G.; Li, T.; Zhou, X.; Li, J. Soil salinization of cultivated land in Shandong Province, China-Dynamics during the past 40 years. Land Degrad. Dev. 2019, 30, 426–436. [Google Scholar] [CrossRef]
  9. Guilherme, M.R.; Aouada, F.A.; Fajardo, A.R.; Martins, A.F.; Paulino, A.T.; Davi, M.F.; Rubira, A.F.; Muniz, E.C. Superabsorbent hydrogels based on polysaccharides for application in agriculture as soil conditioner and nutrient carrier: A review. Eur. Polym. J. 2015, 72, 365–385. [Google Scholar] [CrossRef] [Green Version]
  10. Yang, L.; Yang, Y.; Chen, Z.; Guo, C.; Li, S. Influence of super absorbent polymer on soil water retention, seed germination and plant survivals for rocky slopes eco-engineering. Ecol. Eng. 2014, 62, 27–32. [Google Scholar] [CrossRef]
  11. Herath, H.; Camps-Arbestain, M.; Hedley, M. Effect of biochar on soil physical properties in two contrasting soils: An Alfisol and an Andisol. Geoderma 2013, 209, 188–197. [Google Scholar] [CrossRef]
  12. Guo, M.; He, Z.; Uchimiya, S.M. (Eds.) Introduction to Biochar as an Agricultural and Environmental Amendment. In Agricultural and Environmental Applications of Biochar: Advances and Barriers; SSSA Special Publication 63; Soil Science Society of America, Inc.: Madison, WI, USA, 2016; pp. 1–14. [Google Scholar]
  13. Qiao, D.; Liu, H.; Yu, L.; Bao, X.; Simon, G.P.; Petinakis, E.; Chen, L. Preparation and characterization of slow-release fertilizer encapsulated by starch-based superabsorbent polymer. Carbohyd. Polym. 2016, 147, 146–154. [Google Scholar] [CrossRef]
  14. Khodadadi Dehkordi, D. Effect of superabsorbent polymer on soil and plants on steep surfaces. Water Environ. J. 2017, 32, 158–163. [Google Scholar] [CrossRef]
  15. Hou, X.; Li, R.; He, W.; Dai, X.; Ma, K.; Liang, Y. Superabsorbent polymers influence soil physical properties and increase potato tuber yield in a dry-farming region. J. Soil. Sediment. 2018, 18, 816–826. [Google Scholar] [CrossRef]
  16. Lejcuś, K.; Śpitalniak, M.; Dąbrowska, J. Swelling behaviour of superabsorbent polymers for soil amendment under different loads. Polymers. 2018, 10, 271. [Google Scholar] [CrossRef]
  17. Guo, J.; Shi, W.; Wen, L.; Shi, X.; Li, J. Effects of a super-absorbent polymer derived from poly-γ-glutamic acid on water infiltration, field water capacity, soil evaporation, and soil water-stable aggregates. Arch. Agron. Soil Sci. 2019. [Google Scholar] [CrossRef]
  18. Liao, R.; Yang, P.; Yu, H.; Wu, W.; Ren, S. Establishing and validating a root water uptake model under the effects of superabsorbent polymers. Land Degrad. Dev. 2018, 29, 1478–1488. [Google Scholar] [CrossRef]
  19. Satriani, A.; Catalano, M.; Scalcione, E. The role of superabsorbent hydrogel in bean crop cultivation under deficit irrigation conditions: A case-study in Southern Italy. Agric. Water Manag. 2018, 195, 114–119. [Google Scholar] [CrossRef]
  20. Yang, X.; Liu, J.; McGrouther, K.; Huang, H.; Lu, K.; Guo, X.; He, L.; Lin, X.; Che, L.; Ye, Z. Effect of biochar on the extractability of heavy metals (Cd, Cu, Pb, and Zn) and enzyme activity in soil. Environ. Sci. Pollut. R. 2016, 23, 974–984. [Google Scholar] [CrossRef]
  21. Nie, C.; Yang, X.; Niazi, N.K.; Xu, X.; Wen, Y.; Rinklebe, J.; Ok, Y.S.; Xu, S.; Wang, H. Impact of sugarcane bagasse-derived biochar on heavy metal availability and microbial activity: A field study. Chemosphere 2018, 200, 274–282. [Google Scholar] [CrossRef]
  22. Smebye, A.; Alling, V.; Vogt, R.D.; Gadmar, T.C.; Mulder, J.; Cornelissen, G.; Hale, S.E. Biochar amendment to soil changes dissolved organic matter content and composition. Chemosphere 2016, 142, 100–105. [Google Scholar] [CrossRef] [PubMed]
  23. Wu, D.; Senbayram, M.; Zang, H.; Ugurlar, F.; Aydemir, S.; Brüggemann, N.; Kuzyakov, Y.; Bol, R.; Blagodatskaya, E. Effect of biochar origin and soil pH on greenhouse gas emissions from sandy and clay soils. Appl. Soil Ecol. 2018, 129, 121–127. [Google Scholar] [CrossRef]
  24. Thomas, S.C.; Frye, S.; Gale, N.; Garmon, M.; Launchbury, R.; Machado, N.; Melamed, S.; Murray, J.; Petroff, A.; Winsborough, C. Biochar mitigates negative effects of salt additions on two herbaceous plant species. J. Environ. Manag. 2013, 129, 62–68. [Google Scholar] [CrossRef] [PubMed]
  25. Huang, Q.; Xu, X.; Lü, L.; Ren, D.; Ke, J.; Xiong, Y.; Huo, Z.; Huang, G. Soil salinity distribution based on remote sensing and its effect on crop growth in Hetao Irrigation District. Trans. Chin. Soc. Agric. Eng. 2018, 34, 102–109. (In Chinese) [Google Scholar]
  26. Lei, T.; Issac, S.; Yuan, P.; Huang, X.; Yang, P. Strategic considerations of efficient irrigation and salinity control on Hetao Plain in inner Mongolia. Trans. Chin. Soc. Agric. Eng. 2001, 17, 48–52. (In Chinese) [Google Scholar]
  27. Qi, Z.; Feng, H.; Zhao, Y.; Zhang, T.; Yang, A.; Zhang, Z. Spatial distribution and simulation of soil moisture and salinity under mulched drip irrigation combined with tillage in an arid saline irrigation district, northwest China. Agric. Water Manag. 2018, 201, 219–231. [Google Scholar] [CrossRef]
  28. Olson, G.; Walsh, J.F. Superabsorbent Polymer Seed Coatings and Associated Methods. U.S. Patents 10,021,824 B2, 17 July 2018. [Google Scholar]
  29. Feng, W.; Yang, F.; Cen, R.; Liu, J.; Qu, Z.; Miao, Q.; Chen, H. Effects of straw biochar application on soil temperature, available nitrogen and growth of corn. J. Environ. Manag. 2021, 277, 111331. [Google Scholar] [CrossRef]
  30. Paetsch, L.; Mueller, C.W.; Rumpel, C.; Angst, Š.; Wiesheu, A.C.; Girardin, C.; Ivleva, N.P.; Niessner, R.; Kögel-Knabner, I. A multi-technique approach to assess the fate of biochar in soil and to quantify its effect on soil organic matter composition. Org. Geochem. 2017, 112, 177–186. [Google Scholar] [CrossRef]
  31. Wang, D.; Fonte, S.J.; Parikh, S.J.; Six, J.; Scow, K.M. Biochar additions can enhance soil structure and the physical stabilization of C in aggregates. Geoderma 2017, 303, 110–117. [Google Scholar] [CrossRef] [Green Version]
  32. Tong, M.; Li, T.; Li, M.; He, L.; Ma, Z. Cotransport and deposition of biochar with different sized-plastic particles in saturated porous media. Sci. Total Environ. 2020, 713, 136387. [Google Scholar] [CrossRef]
  33. Egilla, J.N.; Daviesjr, F.T.; Drew, M.C. Effect of potassium on drought resistance of Hibiscus rosa-sinensis cv. Leprechaun: Plant growth, leaf macro- and micronutrient content and root longevity. Plant Soil. 2001, 229, 213–224. [Google Scholar] [CrossRef]
  34. Hasanuzzaman, M.; Bhuyan, M.; Nahar, K.; Hossain, M.Y.; Mahmud, J.A.; Hossen, M.S.; Masud, A.A.C.; Fujita, M. Potassium: A Vital Regulator of Plant Responses and Tolerance to Abiotic Stresses. Agronomy 2018, 8, 31. [Google Scholar] [CrossRef] [Green Version]
  35. Poormansour, S.; Razzaghi, F.; Sepaskhah, A.R. Wheat Straw Biochar Increases Potassium Concentration, Root Density, and Yield of Faba Bean in a Sandy Loam Soil. Commun. Soil Sci. Plan. 2019, 50, 1799–1810. [Google Scholar] [CrossRef]
  36. Mašek, O.; Buss, W.; Brownsort, P.; Rovere, M.; Tagliaferro, A.; Zhao, L.; Cao, X.; Xu, G. Potassium doping increases biochar carbon sequestration potential by 45%, facilitating decoupling of carbon sequestration from soil improvement. Sci. Rep. 2019, 9, 1–8. [Google Scholar] [CrossRef] [PubMed]
  37. Demidchik, V.; Shabala, S.; Isayenkov, S.; Cuin, T.A.; Pottosin, I. Calcium transport across plant membranes: Mechanisms and functions. New Phytol. 2018, 220, 49–69. [Google Scholar] [CrossRef] [Green Version]
  38. Hepler, P.K. Calcium: A Central Regulator of Plant Growth and Development. Plant Cell. 2005, 17, 2142–2155. [Google Scholar] [CrossRef]
  39. Farhangi-Abriz, S.; Torabian, S. Effect of biochar on growth and ion contents of bean plant under saline condition. Environ. Sci. Pollut. R. 2018, 25, 11556–11564. [Google Scholar] [CrossRef]
  40. Bhat, M.A.; Lone, H.A.; Mehraj, S.S. Nutrient Remobilization during Senescence. In Senescence Signalling and Control in Plants; Sarwat, M., Tuteja, N., Eds.; Academic Press: London, UK, 2019; pp. 227–237. [Google Scholar]
  41. Williams, W.D. Anthropogenic salinisation of inland waters. Hydrobiologia 2001, 466, 329–337. [Google Scholar] [CrossRef]
  42. Chen, Q.; Qin, J.; Cheng, Z.; Huang, L.; Sun, P.; Chen, L.; Shen, G. Synthesis of a stable magnesium-impregnated biochar and its reduction of phosphorus leaching from soil. Chemosphere 2018, 199, 402–408. [Google Scholar] [CrossRef]
  43. Bai, T.; Wang, P.; Hall, S.J.; Wang, F.; Ye, C.; Li, Z.; Li, S.; Zhou, L.; Qiu, Y.; Guo, J.; et al. Interactive global change factors mitigate soil aggregation and carbon change in a semi-arid grassland. Glob. Chang. Biol. 2020, 26, 5320–5332. [Google Scholar] [CrossRef]
  44. Rondon, M.A.; Lehmann, J.; Ramírez, J.; Hurtado, M. Biological nitrogen fixation by common beans (Phaseolus vulgaris L.) increases with bio-char additions. Biol. Fert. Soils. 2007, 43, 699–708. [Google Scholar] [CrossRef]
  45. Clough, T.J.; Condron, L.M. Biochar and the nitrogen cycle: Introduction. J. Environ. Qual. 2010, 39, 1218–1223. [Google Scholar] [CrossRef]
  46. Yanai, Y.; Toyota, K.; Okazaki, M. Effects of charcoal addition on N2O emissions from soil resulting from rewetting air-dried soil in short-term laboratory experiments. Soil Sci. Plant Nutr. 2007, 53, 181–188. [Google Scholar] [CrossRef]
  47. Zhu, M.; Kong, F.; Li, Y.; Li, M.; Zhang, J.; Xi, M. Effects of moisture and salinity on soil dissolved organic matter and ecological risk of coastal wetland. Environ. Res. 2020, 187, 109659. [Google Scholar] [CrossRef]
  48. Gaunt, J.; Cowie, A. Biochar, Greenhouse Gas Accounting and Emissions Trading. In Greenhouse Gas Accounting and Emissions Trading; Lehmann, J., Joseph, S., Eds.; Science and Technology Press: London, UK, 2009; pp. 317–340. [Google Scholar]
  49. Lehmann, J. Bio-energy in the black. Front. Ecol. Environ. 2007, 5, 381–387. [Google Scholar] [CrossRef] [Green Version]
  50. An, N.; Tang, C.-S.; Cheng, Q.; Wang, D.Y.; Shi, B. Application of electrical resistivity method in the characterization of 2D desiccation cracking process of clayey soil. Eng. Geol. 2020, 265, 105416. [Google Scholar] [CrossRef]
  51. Zhang, X.; Sun, P.; Wei, K.; Huang, X.; Zhang, X. Enhanced H2O2 activation and sulfamethoxazole degradation by Fe-impregnated biochar. Chem. Eng. J. 2020, 385, 123921. [Google Scholar] [CrossRef]
  52. Yang, F.; Cen, R.; Feng, W.; Liu, J.; Qu, Z.; Miao, M. Effects of Super-Absorbent Polymer on Soil Remediation and Crop Growth in Arid and Semi-arid Areas. Sustainability 2020, 12, 7825. [Google Scholar] [CrossRef]
Figure 1. Lab soil column simulation experiment of infiltration and evaporation.
Agriculture 10 00519 g001
Figure 2. Effect of super absorbent polymer on soil electrical conductivity (EC) parameters with different soil depths in lab soil column (0–65 cm) simulation experiment. CK is control. S-3, S-6, and S-9 represents the application rate of super absorbent polymer at 4.5, 9.0, and 13.5 g/m2, respectively. Data are presented in the average with standard error bars (n = 3).
Agriculture 10 00519 g002
Figure 3. Variations of EC after adding straw biochar from lab soil column (0–65 cm) simulation experiment. Data are presented in the average with standard error bars (n = 3).
Agriculture 10 00519 g003
Figure 4. Variations of EC after adding super absorbent polymer from the whole maize growth period in fields soil column (0–100 cm). Data are presented in the average with standard error bars (n = 3).
Agriculture 10 00519 g004
Figure 5. Variations of EC after adding straw biochar from the whole maize growth period in fields soil column (0–100 cm). Data are presented in the average with standard error bars (n = 3).
Agriculture 10 00519 g005
Figure 6. Effect of biochar on soil ions ((a) Na, (b) K, (c) Ca, (d) Mg) exchange capacity in three soil depths over growth stages. Data are presented in the average with standard error bars (n = 3) (CK: control experiment; Bo-10, Bo-20, Bo-30, and Bo-50: biochar applications of 1.0 kg/m2, 2.0 kg/m2, 3.0 kg/m2, and 5.0 kg/m2,respectively).
Agriculture 10 00519 g006aAgriculture 10 00519 g006b
Publisher’s Note: MDPI stays neutral with regard to jurisdictional claims in published maps and institutional affiliations.

