Article

Direct Measurement of Mass and Economic Harvest and Post-Harvest Losses in Spanish Persimmon Primary Production

by
Maria-Angeles Fernandez-Zamudio
1,*,
Héctor Barco
2 and
Felicitas Schneider
3
1
Centro para el Desarrollo de la Agricultura Sostenible, Instituto Valenciano de Investigaciones Agrarias, 46113 Moncada, Spain
2
Enraíza Derechos, 20012 San Sebastian, Spain
3
Thünen Institute of Market Analysis, 38116 Braunschweig, Germany
*
Author to whom correspondence should be addressed.
Submission received: 30 October 2020 / Revised: 20 November 2020 / Accepted: 22 November 2020 / Published: 25 November 2020
(This article belongs to the Special Issue Agricultural Food Marketing, Economics and Policies)

Abstract

:
Globally, one in every three produced kilograms is wasted at some point along the entire agri-food chain. Unfortunately, knowledge about losses and waste is not equally distributed along the food chain. In fact, in some stages the primary data required to properly estimate the magnitude of the problem are lacking. This is especially true for agricultural production, for which studies that have used on-site measurements are scarce. The present study analyses the mass losses and unpaid share that occur during the harvest process and persimmon storage in warehouses in the Valencia region, Spain. The study was carried out using on-site measurements and primary data from the harvest and storage phases. Losses were also classified according to their causes. The total mass and economic losses were estimated as either 29.5% for the total produced volume or 38.5% for the number of finally commercialised kilograms. This work aims to highlight the complex problem in primary production with the mass and economic losses that farmers bear and to show the potential of loss reduction measures.

1. Introduction

Widely referenced global food loss and waste figures are included in the Gustavsson et al. (2011) report a Food and Organization [1]. According to these estimations, one in every 3 kg produced in the world is wasted. This gives us an idea of the magnitude of this problem that must be addressed by humanity. Food loss and waste (FLW) are a global phenomenon with very relevant environmental, social, and economic consequences [2]. Thus, a growing interest in reducing this problem has appeared, and it has become one of the global challenges included in the Sustainable Development Goals [3]. More specifically, subobjective 12.3 points out the need to halve current food waste (FW) volumes per capita at retail and consumer levels and to reduce food loss (FL) in production and supply chains, including post-harvest losses. This goal implies reducing FLW along the entire agri-food chain, including primary production, manufacturing, distribution, and the final consumption phase.
The FLW reduction objective has been accepted by European Union authorities, as they have included this goal in their own European regulations [4,5]. Nevertheless, according to the European Court of Auditors [6] this reduction objective is still a weak one because a clear baseline year to monitor the goal achievement level is lacking.
In order to move forward, several initiatives have been launched to provide a quantification methodology and options to analyse FLW [7,8]. Quantification is a key aspect of literature reviews both globally [9] and in Europe. Corrado and Sala [10] and Corrado et al. [11] have highlighted that reliable information about the FLW issue is lacking, particularly when achieved by taking direct measurements. To date, the vast majority of studies have used literature reviews or another indirect measurement to obtain FLW data, which significantly constrains the reliability of the obtained information.
Moreover, data gaps are not homogeneously distributed among the different agri-food chain steps. Specifically, the primary production phase is one of the steps in which primary data is less available, and the reliability of available information is considered to be poor [9,10,11].
The lack of reliable data in the primary production step is a limiting factor to find ways to make the real FLW problem known in this agri-food chain step, which entails the risk of undervaluing compared to other phases. The non-consideration of quantifying FL in the pre-harvest and harvest steps to calculate the Food Loss Index, as regards goal 12.3 of the Sustainable Development Goals (SDG) [12], is clearly evidenced. FL measurement can also be included in the pre-harvest and harvest phases, but separately reported when information is already available or these amounts are considered relevant. This circumstance leads to a paradoxical situation, because a previous step to the quantification of both the pre-harvest and harvest phases is to consider it a relevant problem. Nevertheless, determination as a relevant problem does not seem feasible, with no prior data collection to be diagnosed as such.
This non-consideration of pre-harvest steps to quantify FW has occurred in Europe, where the European Parliament and Council have published a delegated decision for a common methodology and minimum quality requirements for the uniform measurement of FW levels [13]. The measurement of pre-harvest steps has been excluded from the delegated decision. This is due to the terminology of the food used, which is based on the European Food Security Law [14]. The provided food definition excludes the products that remain on trees or crops and non-harvested products, even though their maturity level renders them edible.
This is contrary to the codex established by the Food and Agriculture Organisation of the United Nations and the World Health Organization [15]. The definition adopted by the codex does not exclude these materials as food. This food concept established by the codex was also adopted by the European Project titled “Food Use for Social Innovation by Optimising Waste Prevention Strategies” (FUSIONS) [16], including those crops that are mature for harvest, but not finally harvested and included in FW measurements.
Weighing FLW is considered to achieve a high level of reliability. Baker [17] showed substantial differences between FLW quantifications in the primary production step if these measurements were carried out using farmers’ interviews in contrast to an applied weighing methodology. The latter method, estimated through weighing, achieved results that were 2.5-fold higher than the estimations provided by interviews. This comparison highlights producers’ misperception of the FL in their agricultural holdings. It also demonstrates the need to increase the FL quantification number by weighing, given the risk of underestimating the FL problem that occurs in the production step.
However, this method is one of the most costly ones in terms of time and budget [18]. On-site quantification in primary production is a very complex task because a wide variety of factors must be considered [19]. Despite the efforts made toward the standardisation of on-site FLW quantifications [19,20], very few initiatives have been followed to create a common protocol. Indeed, the few direct measurements made have used particular criteria—in other words, assumptions fixed by the persons responsible for FLW measurements.
A clear example of this lack of measurements by weighing is given by the most recent studies about the FLW issue in the different EU Member States [21]. Of the 48 analysed studies, only 19 measured primary production. Of these, only one study applied weighing methodology. In fact, the weighing measurement established by a Belgian study [22] was only carried out for a specific part of the production step, particularly for auctions.
The lack of information collected from weighing methods in the production step has also been highlighted by Xue et al. [9]. Of the 202 studies analysed in their work, which came from 84 different countries and covered the years 1933 to 2014, none has used the weighing method for FLW quantification in the primary production step, even in a mixed form with other quantification methodologies.
Thus, it happens that only a few FL weighing quantification initiatives cover primary production. Of the published works, Baker et al. [17], who measured 20 different horticultural crops, must be highlighted. Despite the fact that their results showed major differences among crops and even among the same vegetable species, an average harvest loss of around 11,299 kg per hectare was calculated.
Johnson et al. [23] implemented a similar work by measuring eight different food commodities. On average, the FL was 5115 kg per hectare. All the included food was edible, and the majority of this quantity was considered perfectly saleable. These FL averages accounted for approximately 42% of the total marketed production. These results represent a far higher figure than common national estimations, which are based on other quantification methodologies that represent a weaker level of reliability, which was also demonstrated by Baker et al. [17]. A similar conclusion was drawn in the work of Khader et al. [24], which measured 30 wheat fields. In the pre-harvest and harvest steps, a Food Loss Index of 280 kg per hectare was provided. Nevertheless, the need to increase sample size to obtain a higher level of statistical reliability for the resulting data was shown.
The main objectives of the present study are to generate knowledge on the FL volume in the first chain phases (harvest and storage). For this purpose, primary data obtained through on-site measurements are provided for persimmon trees located in the Spanish Mediterranean area. Thus, in contrast to already existing studies which focus on vegetable crops, the present study focuses on the unique area of tree fruit crops. The causes of losses are identified and the potentials for prevention are analysed. This work also seeks to estimate the additional fractions unpaid to producers, which is the case of the FL occurring in the storage phase. The estimation of total losses and unpaid fruit using, in this case, persimmons could help us to understand the current situation that producers face. The intention is to take advantage of already available approaches adapted for additional types of crops, allowing comparisons to be made and synergies to be generated among different FL studies. Adding experiences is a key aspect to facilitate future comparable data sets on FL in the earliest stages. Furthermore, this approach was carried out in line with the previously made initial attempts [19,20] to also complement the conclusions reached by those authors.
A scheme (Figure 1) was drawn to graphically and simply show the contributions sought herein and to indicate where the work area is located.
The first part of this study presents the results from the measurements taken during harvest. This information was collected by on-site measurements and concerns the harvest losses of persimmon fruits, which have been scarcely referenced in the literature to date. This study focused on persimmon crops, which are of socio-economic importance in the Valencia region, Spain.
By focusing on the quantification work in earlier agri-food chain steps, the FL concept used for this study follows the line taken by FUSIONS [16]. This concept includes all the products for which the final destination was initially human consumption, including the mature products that are not harvested for any reason.
The second part of the study focused on the dimension and reasons for the unpaid fraction during storage, for which the cooperative’s warehouse management data were used. Unpaid fruit is another problem which has to be added to the FL produced in fields. In this case, unpaid fruit appears in the storage phase, when it is separated during grading processes while the storage phase is underway. For this reason, and despite the fact that FL also appear in warehouses, this food might often be eaten by humans and, therefore, this volume is not compatible with the FL concept. Consequently, this information is not included in the FL quantifications of the study but is reported named as an unpaid fraction in order to distinguish it from the FL that occurred in fields during harvest. Nevertheless, in order to provide a broader picture of the total losses occurred during the first stages of the agri-food chain, the sum of both volumes is provided as the total mass and economic losses.

2. Materials and Methods

2.1. Persimmon Cultivation in the Valencian Region, Spain

Persimmon (Diospyros kaki Thunb) is a crop of Far East origin. This cultivation was introduced into Europe in the 17th century before it subsequently spread to the Mediterranean Region, whose agro-climate conditions are very favourable [25]. Currently, China covers 90% of the total persimmon crop surface in the world. The total cultivated area was 857,672 hectares in 2018 [26]. Nevertheless, China contributes only 67.3% of the world’s total persimmon production. The persimmon production in China is basically destined to its domestic market. Self-consumption also predominates in South Korea and Japan, countries with larger persimmon crop cultivation areas than Spain.
Spain is the most important European country to grow persimmon, with a total surface of 18,601 hectares and a production of 492,320 tonnes [26]. Nowadays, Spain is the second largest persimmon producer on the global scale, and it contributes 10.4% of the total persimmon production. In Spain, according to the 2017 Ministry of Agriculture of Spain data the Valencia region has 15,931 hectares of persimmon cultivation. This is 86% of the national surface and produces 384,785 tonnes of the total yield in Spain, which represents 95% of the total [27]. Thus, it should be noted that the region included in the present study is a Spanish and European reference for persimmon cultivation.
Although the persimmon crop has been a minority crop over the years, many plantations with a commercial orientation have appeared in the last few decades in the Valencia region. Evidence for this importance lies in the persimmon area having increased in general in Spain, and in the Valencia region in particular, especially in the last two decades (Figure 2). There are several reasons for this increase. The first one is related to the palpable lack of citrus fruit profitability in recent decades, which forces alternatives to be found [28,29,30]. The second is the agro-climate requirements for persimmon crops and the fact that agricultural holdings are managed similarly to those of orange or mandarin, which are the most extended fruit plantations in the Valencia region.
At the same time as the cultivation area has increased, the total persimmon production has rapidly grown (Figure 2). Persimmon is a very productive species that is optimally cultivated nowadays. Thus, the average produced yield can exceed 55,000 kg per hectare, which means an increase in the total Spanish persimmon production of a factor of four from 2010 to 2018.
In the current context, new persimmon plantations have slowed down due to the suspicion that production is reaching an overproduction state. One of the main pieces of evidence for this is the drop in prices in 2019. However, operators consider that there is still a wide margin for commercial growth in both Spain and the rest of Europe.
Another key reason for persimmon growth is the development of post-harvest technology to eliminate natural fruit astringency. Traditionally, fruit was stored to continue maturation until it become soft. Therefore, only small-scale trade in local markets was feasible. At the end of the 1990s, this technology improved thanks to the use of controlled atmosphere chambers and CO2 supplies. The resulting fruit are sweet and have a firm texture, which allow them to be transported to distant markets. This is a commercial opportunity that has keenly encouraged Spanish producers [26].
The most widespread persimmon variety is the so-called “Rojo Brillante” (bright red), which was previously cultivated traditionally in the Province of Valencia and can be marketed at a high value. The fruit appearance is very rounded, with a high calibre and a bright orange colour. Its plantations are very productive and are well adapted to the climate and soil of the Valencian municipalities. This is also the favourite variety of farmers in different agricultural areas of Spain. A high proportion is commercialised with the quality label “Denominación de Origen Caqui Rojo Brillante” (Designation of Origin of the Bright Red Persimmon).
Some key aspects of persimmon handling within the warehouse are that the entire persimmon volumes delivered from fields are stored in boxes of approximately 19 kg. Fruit handling starts within the first few hours of being harvested so as to avoid the fruit from being exposed to ambient temperatures for long periods. This exposure can increase the unpaid fraction percentage. The first stage to be performed in the warehouse is weighing the yields from parcels. Thus, fruits with plague symptoms, malformations, or other marks caused by fruit handling in fields are detected. Each head of a harvest crew is informed daily about the obtained results of how this task was carried out. If some inefficiencies are detected, new guidelines and recommendations are provided by cooperatives.
Then, the fruit is placed inside refrigerated rooms. In parallel, these fruits are transported to CO2 chambers to remove their astringency. After this step, the persimmons are cleaned and catalogued according to their mass, size, and other commercial criteria established by buyers. Full traceability exists to register the amounts for each parcel per commercial category. This is a key aspect to determine the final liquidation for each producer.
Naturally, the demanding quality requirements of the warehouse mean that this pressure is felt on the plots. However, it should also be noted that the effect of growing persimmon crops for the whole farming sector in the Valencian Region has been a very positive one. In fact, it has been called a miracle [31] and has become a real alternative to substitute citrus, because these cultivations are currently unprofitable. The persimmon crop has brought wealth and new job opportunities by reactivating the primary sector in many municipalities, particularly in the Province of Valencia. Nevertheless, two decades after the “boost” emerged, the ceiling in persimmon production seems to have been reached, despite agents thinking that the market can absorb larger supplies. However, the quantity of fruit left on the ground clearly evidence that, at present, additional amounts would have to fulfil strict visual performance requirements to be marketable. A further increase in the production amount should take different options into consideration, which are discussed further within Section 4.

2.2. The Persimmon Supply Chain

Valencian persimmon producers are characterised by small agricultural holdings, and 70% of all the farm holdings of fruit plants cover less than 5 hectares in this region. This percentage is higher (85%) if the crops are citrus [32]. There is a relevant percentage of part-time farmers, and their average age is quite old. The most positive aspects are their fertile soils with irrigation water and the favourable agro-climate conditions in the Valencia region. Furthermore, these farmers’ experience is very relevant because it is based on plenty of experience in cultivating different fruit and vegetable products destined for fresh consumption for decades and mainly for exports. From the very beginning, the best incentive for persimmon producers was the gradual increase in demand, because delivering fruit to new markets led to very affordable prices.
Despite the fact that astringency has been limited thanks to the use of controlled atmosphere chambers, this is a very demanding technology in economic investment terms, and one that cannot be applied by individual farmers. In practice, farmers are forced to sell all their production to cooperatives and other large trading companies because they cannot reach the final markets on their own. For this reason, cooperatives and other private storage firms play a determining role in commercialisation. In fact, the group named “Persimon” was created to commercialise the sweet persimmon, but with a firm consistency. The Persimon Group consists of 27 cooperatives that sell 50% of the total Spanish persimmon production; 60% of the total persimmon volume managed by this group is delivered by three Valencian cooperatives, one of which was included in the data collection of the present study.
Cooperative work is very diverse. On the one hand, many cooperatives offer producers the chance to take over different tasks in agricultural holdings. One example of this is phytosanitary treatments, which offer optimum work to producers despite owning small farm holdings. Furthermore, cooperatives have the facilities to eliminate fruit astringency, which is a key prerequisite to sell this product. On the other hand, some very crucial work is linked with FL. Hence, cooperatives are responsible for planning the harvest process throughout their partners’ cultivation area. Persimmon is a tree in which it is possible to advance or delay the ripening process by applying phytoregulators. Ethefon is used to advance, while gibberellic acid is employed to delay harvest. This fact has substantially extended the natural ripening and harvesting calendar of persimmon crops. Naturally, the whole harvest process concentrates in November, but the period can be extended from the beginning of October to the end of December using phytoregulators. The harvest process is followed on early agricultural holdings in two sequential stages. From November onward, the picking procedure is carried out in just one round. Harvest labour is not normally carried out by the owner of an agricultural farm; rather, the corresponding cooperatives provide their personnel to collect fruit. The staff have been previously trained to conduct this work. The producer pays for the cost of this process with the final settlement paid from the yield.
As for the commercial criteria used to harvest persimmon fruits, buyers (cooperatives or private traders) claim that they have to meet market demands. This implies adhering to the rules imposed by large supermarket companies, which centralise the entire demand. Other wholesalers and retail stores, such as groceries, local markets, neighbourhood shops, etc., may adopt slightly different commercial criteria. Nevertheless, it can be argued that normally wholesalers previously determine the fruit that is to be delivered to retail stores. Basically, very rounded fruits with a large calibre are frequently requested. Smaller fruits are requested from other markets, such as Eastern countries, but nowadays this market is limited by “Russia’s veto”. Another fruit characteristic which is highly demanded is the intense and uniform orange colour, apart from being a sweet and firm fruit. There are additional aesthetic requirements, such as not admitting fruit with physical defects, including slight marks on skin, bumps, or plague remains. Given these market requirements, the triage in the harvest process is highly demanding because buyers (cooperatives or private traders) intend to send only saleable fruit to warehouses. Undoubtedly, this leads to a large volume of yields not being harvested.

2.3. Procedure for the on-Site FL Quantification of Persimmon

With tree fruit plants, the amount of harvest produced in an agricultural parcel depends on the tree age, plantation framework, tree health status, and care taken to perform different agricultural works. Thus, the production variability could be very wide in the same agricultural area. In the present study, the data sample included 12 different agricultural parcels from the main producing region in Spain, “La Ribera Alta” in the Province of Valencia. This data sample represents 12 different producers, but they commercialise production through the same cooperative store. This cooperative is one of the three main cooperatives in terms of the volume of persimmon traded in Spain. The complete analysed persimmon volume came from the “Rojo Brillante” variety, cultivated and watered by drip irrigation. Preferably, these plantations were selected when they were 5 or 6 years old in order to collect information on mature trees. Although two agricultural sites have plantations with 4-year-old trees, these trees showed an excellent robustness and a high productivity level.
The most suitable unit by which to measure FL in tree crops is the tree itself. In the present study, 10 trees were measured in each parcel. It is true that a certain land area could be selected as a reference unit but, in this case, it would be necessary for all the trees to be planted within the same plantation framework, which is not the case of the Spanish persimmon. The on-site analysis of these 10 trees provided a total estimation of the fruit mass discarded per tree. Subsequently, this result was extrapolated to the total parcel surface to obtain an estimation of the harvest losses in kg per hectare. By this FL quantification approach, it is worth highlighting that only the fruit potentially suitable for human consumption at harvest time were measured/counted. It has to be clarified that all other fruits (immature, overripe, long-term damage with spoilage) were excluded from the FL quantification process.
Together with the quantification of the volume of discarded fruit, the main reasons for such losses were analysed. For this purpose, all the persimmon fruits that were left on treetops and on the ground beneath each treetop were monitored one by one. Fruits potentially suitable for human consumption were not picked from the treetop but inspected visually. The land in this region is quite flat and persimmons do not normally roll away. The choice of these 10 trees per parcel was discretionary, but the trees that could be representative for the entire parcel were selected. Data collection was carried out between 12 November and 12 December 2019.
All the parcels were harvested during only one round. Nevertheless, a potential bias was sought to avoid the parcels harvested in October due to the harvest process, which is carried out on 2 different days in this month. For this purpose, harvest loss measurements were taken on-site within 24–48 h of harvesting to ensure that the persimmons still retained a certain level of freshness and to facilitate analysing the main reasons why fruit was discarded. The general features of the 12 analysed parcels and the level of representativeness as a percentage of the 10 trees measured in relation to all the trees planted in each parcel are indicated in Table 1.
The process of measuring each selected tree started by grouping all the fruit that remained on treetops and on the ground beneath these treetops. These fruits were individually analysed and catalogued, and seven main classes were determined. These classes are described in Table 2. Fruits remaining on treetops were inspected according to their potential suitability for human consumption and—if applicable—classified into class 0.
The general characteristics of the fruits that were included in the different types of damage are described below.
Class 0 is formed by those fruit potentially suitable for human consumption that were left on treetops. Class 1 includes deformed fruit. This is a problem when the origin cannot be clearly identified. In fact, the proportion of deformed fruit widely varies according to parcel and year, but no technical consensus about it has yet been reached. Class 2 covers all the fruit with any kind of mark on their skin. The reasons here are diverse, but damage caused by chafing with leaves and branches predominated. This damage is very important when fruit grow, along with “sun blow” and other small scars and indented soft spots on surfaces. These marks are normally very superficial and do not tend to end in any form of rottenness. Class 3 refers to the presence of pests. This is a problem that has worsened with time according to increasing persimmon crops, which have been transformed into a monoculture in some areas. Today, one of the most relevant one is called the “cotonet” (the Spanish persimmon is affected by several species of the genus Pseudococcus) and another is the lepidoptera (Cryptoblabes gnidiella). This lepidoptera usually makes superficial holes on skin, which evolve to different types of rottenness. Class 4 covers the most important damage and includes fruit falling on the ground because of breaking branches. Class 5 includes indefinite causes. Due to the appearance or the type of flaw, it is very difficult to discern if a fall occurred due to a plague, wind, breaking branches, etc. Thus, this is a category which includes indefinite causes. Finally, class 6 contains all the fruit damaged during the harvest process. Usually, damage comes from blows from boxes and bearing marks from being scratched or pressed. In general, these fruits look fresh and their size is good and their shape suitable for commercialisation, but they have suffered a hard blow which has left them irreparable damage. This blow could be unintentional by, for example, rushing during the harvest process. Nevertheless, some fruit are discarded intentionally, perhaps because of the way they look, their size, or due to any kind of slight skin defect, which are all interpreted as sufficient reason to discard them for commercialisation.
In addition to the classification of the fruit according to the type of damage, the mass of an average persimmon fruit was determined. By counting the total number of fruits per tree that were left, it was possible to calculate the total mass of fruit that remained per tree and the loss volume according to the different damage typologies. It should be noted that, despite the possible differences in calibre and mass of the persimmon fruits in different parcels and in the same parcel, the fully developed fruit that remained on the same tree were reasonably uniform in size. Therefore, we believe that our estimation is realistic and reliable.
This work aims to determine data about harvest losses for a wide agricultural area. In 2019, the agronomic year in the study area region was average in yield terms. The sample was selected to represent the total area covered by the cooperative. In fact, the parcels with different situations as regards remaining persimmon fruit were selected to represent the entire agricultural campaign in the main producing areas of the Valencia region.

2.4. Procedure for the FL Quantification of Persimmon during Storage

For the present study, long-term management recordings of the warehouse have been provided by the cooperative together with the meta data information by staff members.

3. The Main Results Obtained from Measuring the Loss Mass in Fields, and Farmers’ Global Unpaid Share

Firstly, the harvest losses figures are provided from taking the on-site measurements for the 12 selected parcels. The importance of these losses could be shown differently. One of the main indicators is “potential yield”. This indicator is the maximum agronomic level that parcels can produce in a particular area. Table 3 shows the mass of the total fruits that had completely matured and were suitable for human consumption but were not harvested. The corresponding main reasons for these losses are presented in Table 4.
Secondly, the present study intends to inform about the situation that persimmon producers face. To do so, apart from indicating the total volume of direct harvest losses and their main reasons, this study has extended the analysis to post-harvest steps, including the unpaid fraction generated in the warehouses used for commercialisation. This unpaid fruit is the volume of persimmons delivered for storage but not finally liquidated. As the final destination of the total persimmon volume that is not liquidated remains unknown, and part of it can be used for human consumption, this amount of fruit cannot be catalogued as FL. The human consumption of one specific part of this volume is for industrial use, especially as juice. Despite the fact that this volume is not considered to be FL, it implies economic losses for farmers. Hence, this amount of persimmon can also be important to help to understand the current situation of persimmon producers in Spain.

3.1. Harvest Losses in Relation to a Parcel’s Potential Yield

By counting the number of fruits lost on the 10 trees sampled per parcel and their total mass, these harvest losses can be extrapolated to the total number of trees per parcel and per hectare with the same tree density for all 12 parcels. Obtaining the total mass per hectare allows different parcels to be compared, even if they have distinct dimensions or plantation frameworks (Table 3).
In the comparison to the kilograms discarded per hectare, the parcel with the lowest level of harvest losses was number IX, with 1648 kg/ha. Whereas, the parcel with the highest level was the parcel XI, with 12,670 kg/ha. Thus, the average loss was estimated to be 5980 kg/ha of persimmon that remained on treetops and on the ground during an optimum agricultural campaign, such as 2019.
Given the dispersion of this data sample, the median values were also calculated to determine the value in the middle of this dataset. It was observed that 50% of parcels had harvest losses above 6562 kg/ha.
The above data can be better contextualised by using the real production numbers for each parcel. This information can help to understand the magnitude of the harvest losses in this campaign in percentage terms. The problem lies in the fact that real production varies according to each parcel’s health state, the level of maintenance performed in them, and the specific conditions of each agronomic year. Moreover, farmers only register the amount of kilograms of fruit delivered to warehouses. For this reason, the total crop production is rarely known. Alternatively, comparing the harvest losses related to each parcel’s potential yield is a valid reference that becomes stable over time. This indicator has been employed in different works [17,20,24]. The use of potential yield offers the advantage of calculating in relation to the theoretical fruit volume produced by trees if they are optimally taken care of. This theoretical index can be determined thanks to expert technical staff supporting the present study who know what is happening exactly every year and have a global vision of the entire work area.
In the research area, the employed persimmon variety and the appropriateness of crop conditions produced high yield rates. These rates normally come very close to the agronomical potential of this species, which can yield 60,000 kg/ha in this region. Nevertheless, not all adult parcels have the same health status and similar level of maintenance. Therefore, the potential yield volume taken as the reference for this area was validated by technical staff who are experts in persimmon cultivation. According to them, the average agronomic potential or potential yield in this region ranges from 50,000 to 55,000 kg/ha for adult trees, which are trees older than 5 years. This agronomic potential can be maintained until trees reach the age of 30 years, in which the potential yield is lower than in younger trees.
The agronomic potential for an individual tree can overcome the volume of 100 kg/tree despite it still strongly depending on the plantation framework. Some producers prefer to work more intensively and to increase tree density per hectare. According to Table 1, it is possible to observe that a density of 650 trees per hectare is surpassed in parcels numbers I, VIII, XI, and XII in order to recoup the investments made as quickly as possible because they obtain more kilograms from the first years. However, trees start to compete for light and nutrients from soil once their treetops and roots have developed. For this reason, the increase in yield was not proportional to the number of trees but lowered. The opposite occurred when the plantation framework had a density ratio under 500 trees per hectare. In this case, the first important yields required more time, but subsequently there are more years with higher yields than for the trees in plantations with a higher plant density.
Everything concerning plantation frameworks was taken into account to determine the potential yield used as the reference for this region. Finally, 55,000 kg/ha was established for adult trees and 35,000 kg/ha for younger trees, which meant less than 4 years. Table 3 shows the harvest losses per arable area and in relation to potential yield. On average, 11.44% of all the fruit that was potentially suitable for human consumption was directly left in fields. The variability shown in the food loss data is what can be found in the field. In our study, two parcels had lower rates, which were numbers VII and IX, with approximately 3% losses. Two other parcels, numbers I and VI, exceeded 16%, while parcel number XI exceeded 23% of the fruit discarded in fields. The result of the median value can be used as a reference for the 12 parcels, which was 11.93% and came very close to the average value.

3.2. Classifying Damage Detected in Fields

Apart from knowing the volume of the total fruit that remained in fields, it is fundamental to understand the main causes of these losses. For this purpose, all the fruit collected from the total tree sample were analysed one by one. How many of them actually corresponded to the different damage typologies was determined. It was important that all the fruits with a suitable maturity level to be harvested were analysed and to exclude those still unfit for human consumption.
Despite the fact that 10 causes were determined when reviewing the status of these fruit, all these typologies were grouped into seven classes of frequent damage (Table 2). The main results obtained are shown in Table 4 and are described below.
Class 0: this is the smallest damage group, with only 1.45% of all the fruit lost on average. Class 1: this category had an average FL of 9.47% in fields. Class 2: this group had total losses of 4.57% on average. Class 3: this damage type covers 16% of the total FL volume in fields, although some parcels contain almost 30% of the total. Class 4: on average, this group covers 31.5% of the total FL, and markedly fluctuates among parcels. Class 5: on average, it obtained 14% of the total measured FL and widely varied among parcels. Class 6: this class is the second largest in FL terms after class 4, with 28% of the total losses.

3.3. Harvest and Storage Losses

Information about the fruit that directly remains in fields during the harvest process has been previously provided.
In this section, the volume of fruit delivered to warehouses, but not finally liquidated, was calculated and defined as unpaid fruit. These unpaid fractions have to be added to the quantity of FL generated in fields in order to shed light on total economic losses for farmers. The difference in naming is due to the difficulty to include the unpaid volume in the FLW concept because the final destination is unknown. Thus, despite this lack of knowledge, it is known that part of the volume of the unpaid fraction can be used for industrial purposes and, therefore, will be employed for human consumption. We should bear in mind that producers consider all the costs of watering, fertilisers, or phytosanitary products. They cover the cost of the total produced yield and not only the sold fruit. Thus, the estimation of the total discarded yield in relation to the finally sold volume can help us to finally visualise how all the efforts made by producers actually materialise. Furthermore, it could show the global problem beyond the generated FL.
This study had access to complete information about the entire process carried out in the warehouse of all production delivered from the 12 sampled parcels. By combining FL in fields and unpaid fruit produced in the warehouse, the final result was obtained, named the “total mass and economic losses” of producers. It is possible to obtain a first indicator of these mass and economic losses compared to the total kilograms lost in fields and the potential yield. It is also possible to generate a second indicator by comparing the mass and economic losses to the amounts of kilograms that producers were eventually paid. All this information is provided in Table 5.
On average, 29.45% of the totally produced kilograms in a parcel are directly discarded in fields (Table 5, index h, average). This volume matches the FLW concept. Additionally, on average it is estimated that 38.49% of the total production in parcel is the amount of fruit that is not actually paid to producers (Table 5, index i, average). Thus, this result combines FL and the unpaid fraction, with 41.5% being the median value for this latter indicator for the 12 analysed parcels (Table 5, index i, median).

3.4. Main Causes Related to the Unpaid Fraction in Warehouses

Earlier sections of this study indicate that, despite the demanding triage carried out in parcels, 16% of the total amount of fruit delivered to warehouses was unsuitable according to the quality parameters required by buyers (Table 6). Thus, it generates further loss for producers’ economic liquidation. This chapter explains the main causes for these percentages of fruit discarded in warehouses.
Table 6 shows the amounts of persimmons from each parcel delivered to the cooperative. From these volumes of kilograms, the percentages of the “First category” are known. This first category (Cat. 1st) is subsequently further broken down into eight calibres or subcategories with different prices. The fruit belonging to this first category are those only paid to the producer. Table 6 is supplemented by the inclusion of an additional column to include the unpaid fruit. These unpaid fractions are the percentages of the total amount of fruit delivered to warehouses in kilograms, which are finally considered a second category (Cat. 2nd) and a category for industrial uses (Cat. Ind.). Neither of these two categories is paid to producers. The cooperative argues that the final obtained price is not adequately compensated, not even by the warehouse handling cost. Fruit handling in the warehouse includes reception, eliminating astringency, classifying calibre, cold storage, etc. The main uses of these two categories are to produce juice or animal feed. On average, these unpaid fruits reflect 16.11% of the total yield transported to warehouses. Once again, it is an unpaid fraction that has to be assumed by farmers.
Table 6 shows the specific situation of the selected parcels for the 2019 campaign. It is worth highlighting that the unpaid fruits are catalogued in the cooperative. This situation could help to understand the reason why the cooperative allows large amounts of discarded fruit in fields. Figure 3 provides real historic data about this issue and shows a 10-year sequence. This sequence helps us to visualise how the commercial criteria have evolved with time. Information refers to the global situation of a cooperative that processes around 40 million kg of persimmon per year. The unpaid fractions in the warehouse are attributed to different damage, such as that caused by pests and diseases, other defects from fields (marks and scars on skin, damage caused by hailstones, overripe fruit, etc.), and finally other reasons related to handling during harvest (blows, wounds, lack of colour, etc.).
Thanks to Figure 3, we can see the evolution of the three main damage classes in the cooperative over the last decade. On the one hand, defects from fields have fluctuated annually because they depend on adverse weather conditions, such as stains caused by excessive sun exposure, the rubbing of branches by wind, dryness, hailstones, etc. These damage classes currently oscillate between 10% and 15% of the total fruit delivered to the warehouse. Regarding pest damage, a gradual increase is observed because they are practically non-existent during the period 2010–2013 and cover almost 5% of the total unpaid fruit. The difficulties for producers to treat pests are very important. Finally, the damage due to handling during harvest has increased from 11% in 2010 to almost 20% during the last campaign. It is worth highlighting that these damage types are also penalised in fields.

4. Discussion

4.1. On the Main Issues Addressed in the Study

In the present study, the volumes of persimmon FL were quantified during the harvest process. Persimmon is a fruit that is cultivated in the Valencian Region (Spain) for human consumption as a fresh product. These FL not only imply relevant economic losses for farmers but incur additional environmental and social costs that also damage land. In addition, unpaid fractions are generated in warehouses. These unpaid fruits are another crop volume that is not paid to producers, and they also generate additional negative economic, social and environmental impacts. In contrast, they have the potential to contribute to increased production amount with connected benefits to sustainability if they could be redirected to the intended market without additional need of arable land. Knowledge of the magnitude and the reasons behind this problem, which affect producers directly and land indirectly, was a clear motivation to conduct this work.
Persimmon is a very similar crop to other Mediterranean fruit plants as regards physiological and management issues, such as citrus fruit, pomegranates, or peaches. However, we understand that the methodology used means that this study can be very useful for other studies on food loss carried out anywhere in the world and for any type of fruit tree. For this reason, the approaches followed for this study could help to set up working patterns that better diagnose the FL problem in large agricultural areas which have no available information to date.
An average of 11.44% of persimmon losses remain in fields in relation to the potential yield of these areas (Table 3). Moreover, the main reasons associated with such losses were determined by revising all the sampled fruit one by one (Table 4), and the main options to reduce these volumes are described below.
Class 0: The reason for being left on trees was because they were hidden by foliage density or were found on inaccessible topmost branches. This is minor and almost unavoidable loss, except in those cases in which they are left by workers who rush during the harvest process. In order to reduce this category, major efforts need to be made to properly train workers and to reduce the time pressures during harvest. Although they are usually paid per hour worked, not per volume of fruit harvested, they must move quickly to complete their working day. Thus, it is necessary to encourage paying special attention and taking care to properly harvest crops and to raise awareness about the importance of their work to avoid FL.
Class 1: This problem is generally associated with poor flowering, which can lead to double fruit or irregularly looking fruit, which are completely undervalued by markets, even if they have a considerable calibre and are suitable for human consumption. Reducing this typology of damage is no easy task. There are different examples of good practice in large European supermarkets, which offer a commercial outlet of a fraction of these “ugly fruits”, which they are called given their singular character.
Class 2: Although they are considered purely aesthetic damage, these fruits are not collected. A change in marketing standards could reduce such losses, such as admitting fruits with certain aesthetic marks and informing consumers that they are fit for eating.
Class 3: In relation to pests, for example, “cotonet” is an insect that hides in the corolla and the rest of the skin are covered by molasses, which is a tacky dark fungus that proliferates. This fungus cannot be easily cleaned in the warehouse washing phase, and the fruit look unpleasant. Both damage types can evolve in a larger unpaid fruit fraction, which is why these fruit are rejected outright. Producers complain about it being impossible to more exhaustively control these pests because currently admitted chemicals are very limited. Then, there is also the difficulty of setting up effective biological control methods. The claim for a sanitary plan to facilitate pest control on fruit plantations, which is the case of persimmon, is a long-standing endeavour by Valencian producers. However, possible solutions are fully subordinated to strict phytosanitary legislation in both Spain and elsewhere in Europe.
Class 4: As a species, persimmon trees have very fragile and brittle wood, so branch breakage is very frequent. This is why producers tend to reinforce treetops with plastic tape to create a kind of mesh and to strengthen the tree’s main branches. It ought not to be forgotten that persimmon branches bear large amounts of fruit, and many have quite a large mass. Breaking branches spells FL for all the fruit left on the branches that have fallen to the ground, even if they present no additional defects or have not been marked by the blow. In order to solve this problem, more balanced pruning is recommended to gain more evenly distributed fruits. Increasing the reinforcement mechanisms of branches is also recommended and is currently carried out. In any case, manual work that is labour intensive does not seem viable with the current price circumstances.
Class 5: It is difficult to provide recommendations to reduce this problem because of the unknown causes involved.
Class 6: This demonstrates the triage in fields is only guided by purely commercial criteria and this necessity is translated to workers to deliver only the fruit that is completely optimal for selling to warehouses. Reduction options are more feasible in this class. Here, the commercial criteria must not be so harsh, and the collection and sale of all fruit susceptible for human consumption should be performed. Moreover, reducing this group is also possible by improving workers’ labour conditions, especially if it enables the period to collect fruit from each tree to be extended. As mentioned with class 0, another relevant good practice is to raise generally awareness among staff about the need to adequately use the whole yield thanks to the reduction in the generated FL.
Overall, not all FL are equally addressed or can be reduced by producers. In some classes, such as class 5, the main reasons remain unknown. Therefore, proposing a solution is no easy task. For classes 1, 2, and 3, and partially for classes 0 and 4, relevant reductions cannot be expected of producers because the main causes derive from climate conditions and the very nature of the crop. However, such damage types are precisely more acceptable by producers because they are related to agricultural activity. One very different case is class 6, which, apart from the losses generated when handling fruit, includes all the fruit discarded for commercial criteria. These losses account for the producers’ heaviest grievance, because they often feel powerless against buyers’ decisions and cannot collect this part of yields. This fact forces producers to intensify crops, because they need to produce many kilograms of perfect fruit in aesthetic terms if they are to achieve a minimum return.
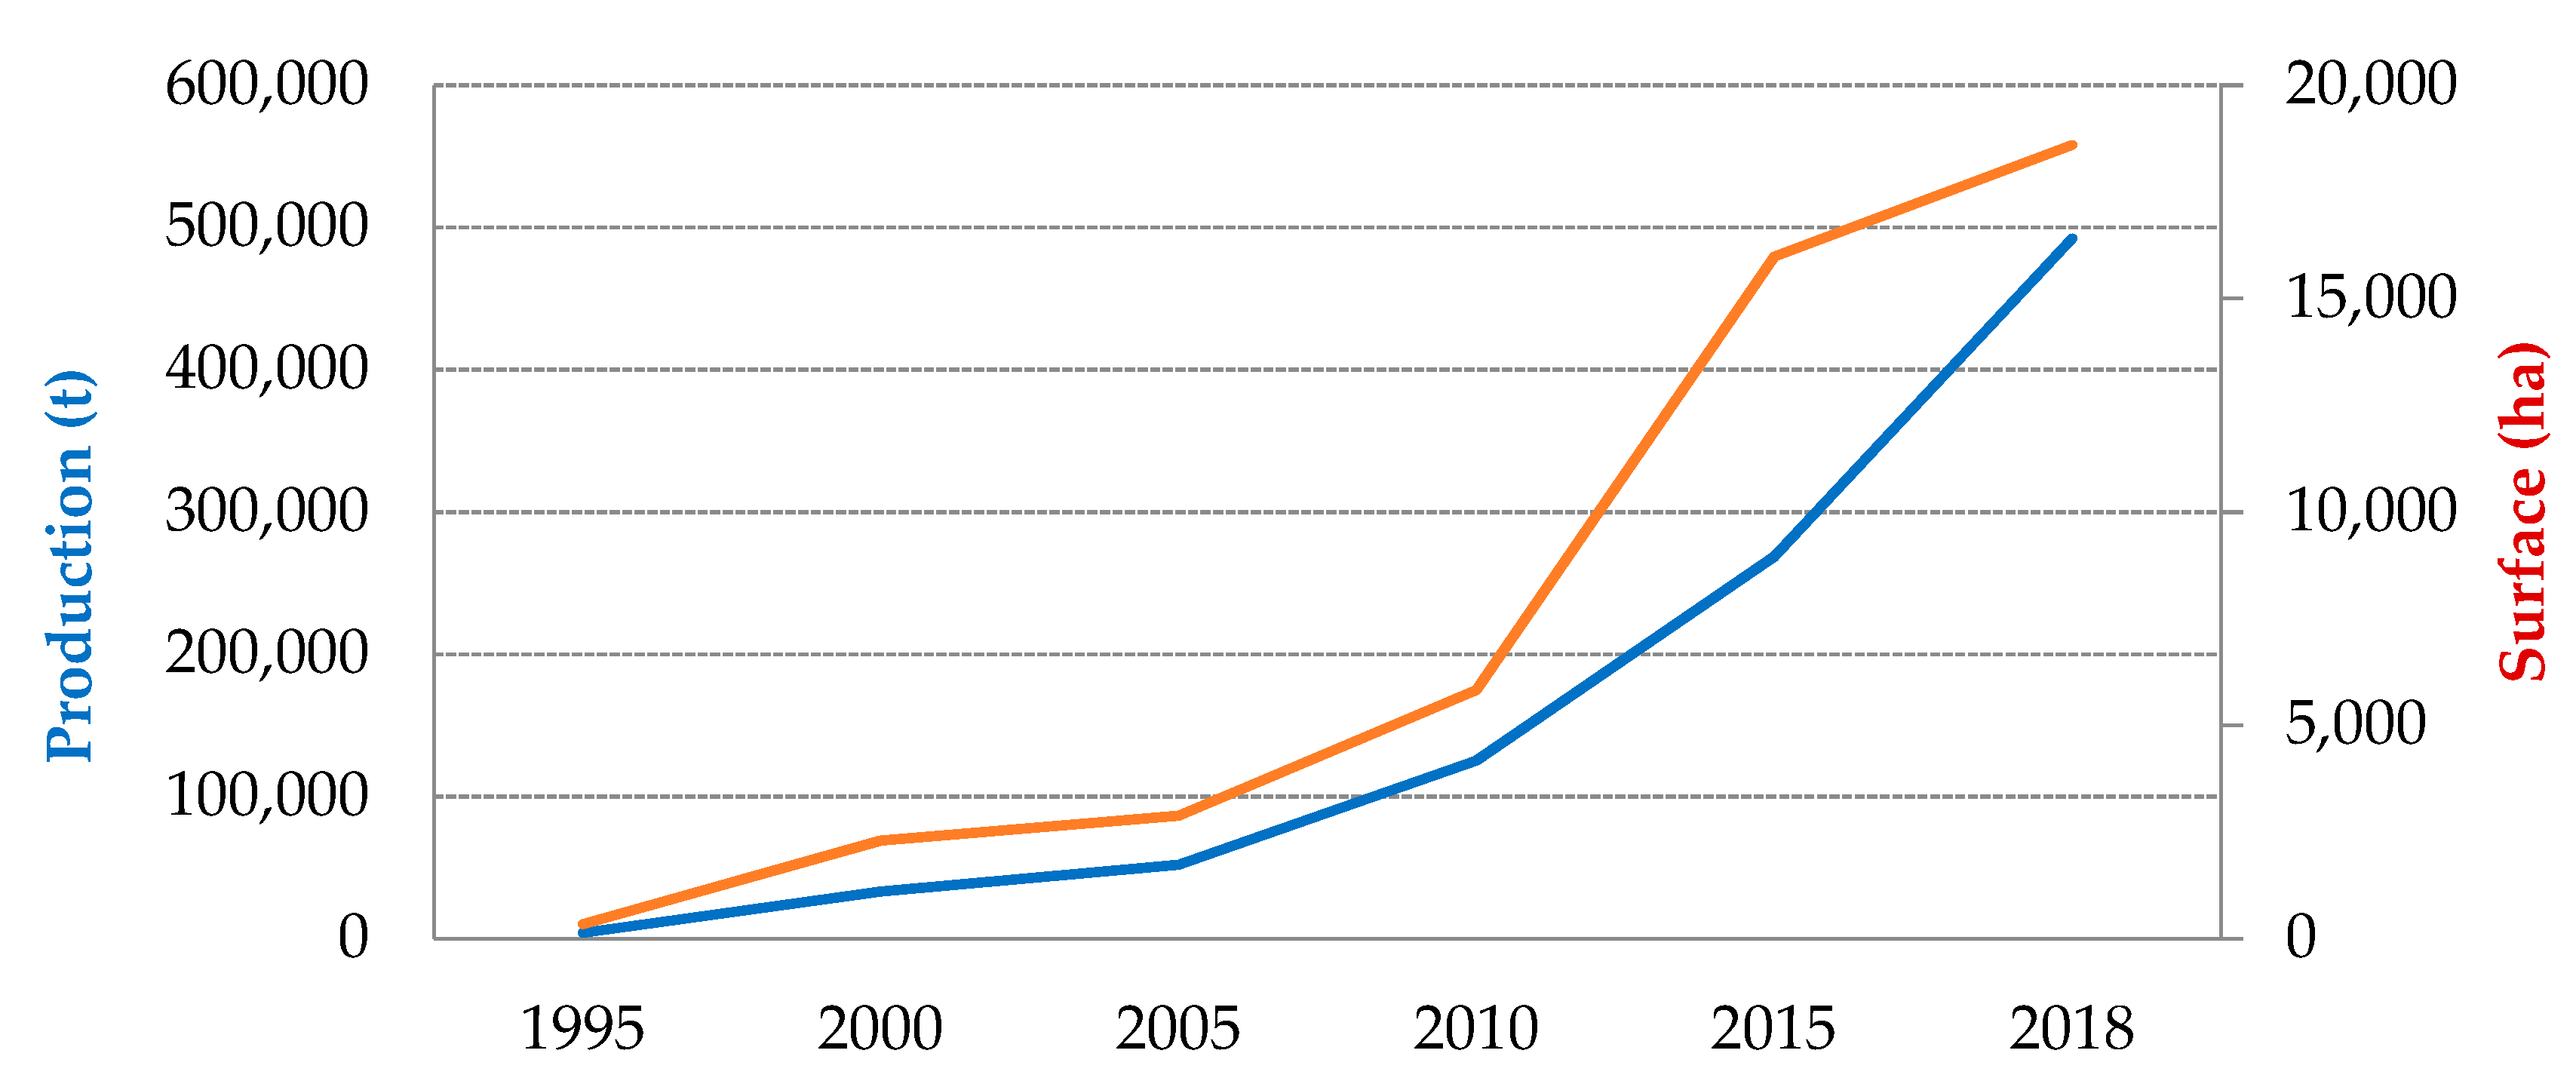
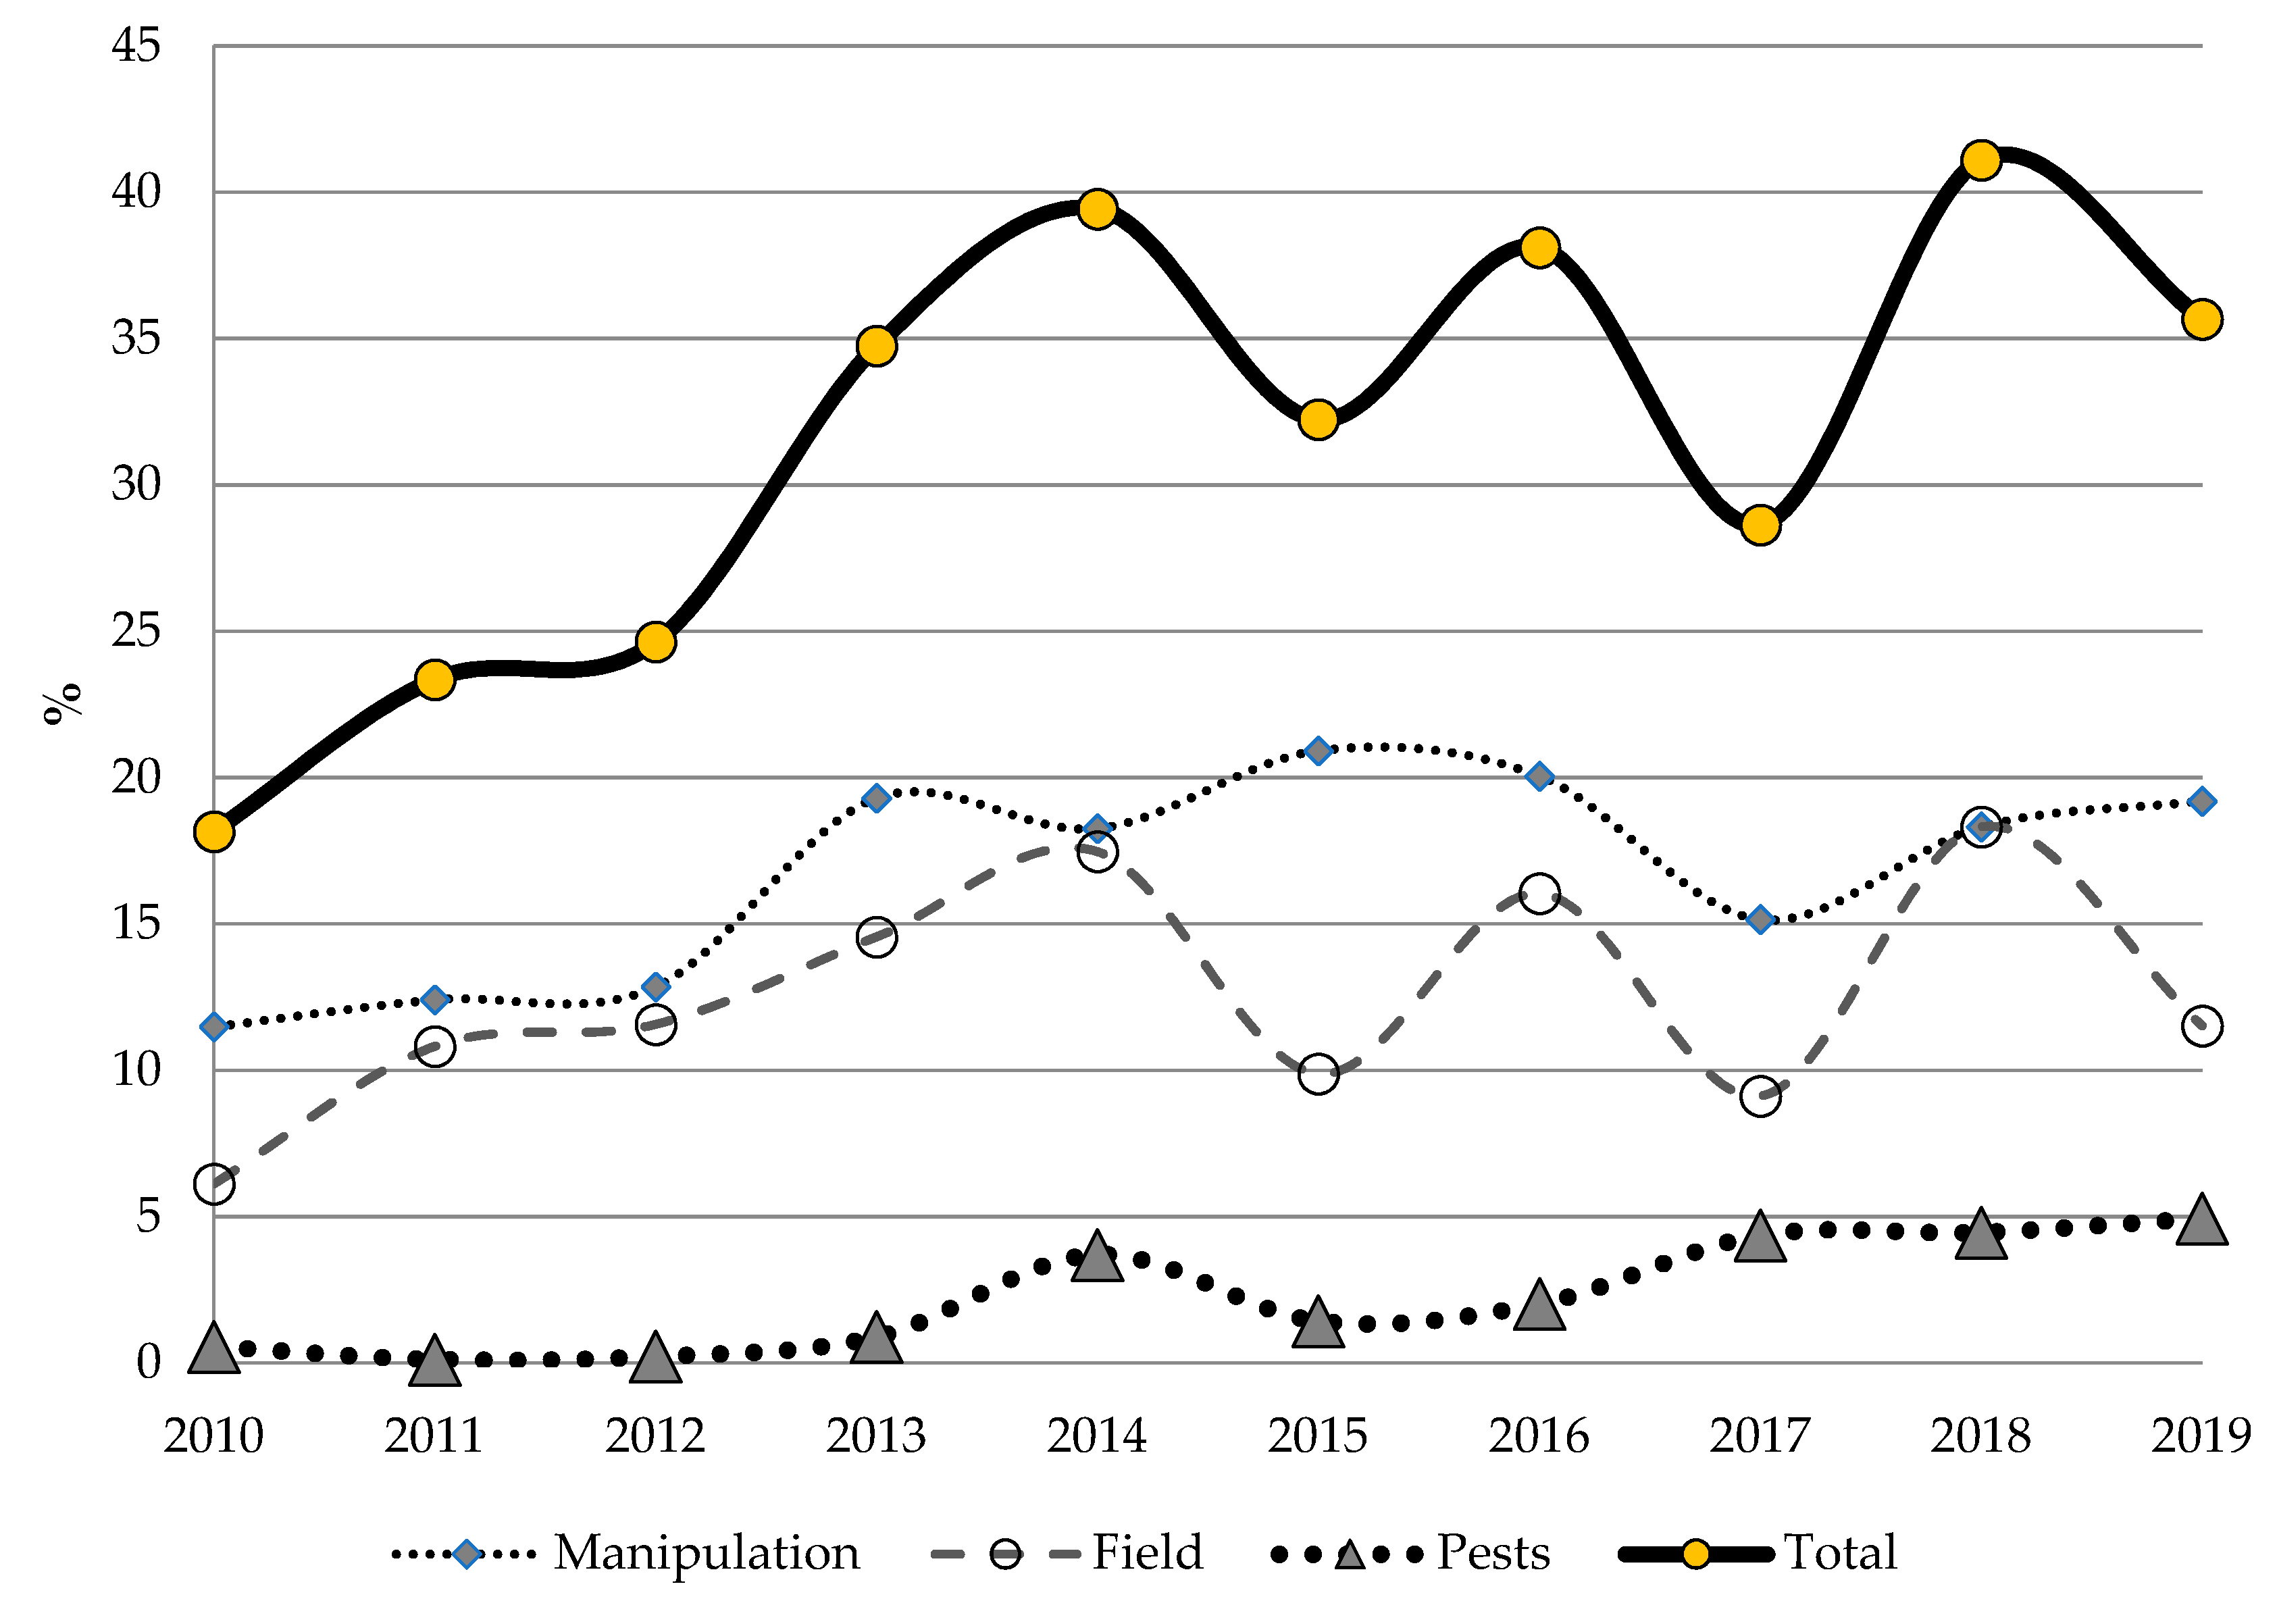
In addition, what can be observed is that all these damage groups have substantially increased with time. Some of these damage types are inherent to the crop, such as defects from fields that vary naturally every year. The warehouse staff provided the present study with information indicating that the penalties set by the retail have constantly increased. This fact forces warehouses to be equally strict when selecting fruit to be catalogued as the first category. This higher level of demand in aesthetic criteria terms seems to be in accordance with a bigger offer. For the last few years, the available persimmon volume on the market has increased. The main consequence of this was that the defects which were scarcely penalised before are not acceptable today. This explains the demanding triage undertaken in parcels. Moreover, an additional triage takes place with the fruit delivered to warehouses which are catalogued as a second category or for industrial uses due exclusively to aesthetic criteria.
This study attempts to bring about a significant change in current marketing approaches which govern agri-food chain functioning. The present study intends to highlight the key role of farmers as their work is the starting point for the entire agri-food chain. Nowadays, farmers have to face all the risks and implicit uncertainties of field production. They always have the least market power, and are usually forced to accept prices and commercial conditions that severely constrain their profitability and their options to continue with agrarian activity. The availability of studies that explain the reality of this production sector and show the fruit volume that is pointlessly lost on the ground should serve to initiate fundamental thinking about all this. Thus, the use of the indicators known as “unpaid fraction” and “total mass and economic losses” could be interesting to start detecting possible unfair trading practices in this agri-food chain step.
Given the importance of farmers’ work, it is necessary that the entire yield lead to economic profitability. Undoubtedly, the increased recognition of farmer’s work may result in their work being adequately paid. For this purpose, the incorporation of the entire yield suitable for human consumption into the commercial chain would be a promising alternative in order to promote economic justice. As farmers are not in a position to change the framework on their own, there is pressing need to adjust the trading system framework with each stakeholder on a level playing field. This would also entail reducing the environmental and social impacts associated with the FLW issue that indirectly affect rural territories.
The role of cooperatives is also essential. Firstly, the wide variety of direct services provided to producers is a key factor, because farmers cannot possibly render these services themselves, given their limited dimension. Secondly, the effort made to commercialise production and the volume of work generated in producing regions must be appropriately valued. The link between the demanding triage in parcels according to aesthetic criteria and the generated FL can come into play by visualising what work in the field is like and by knowing that those responsible for following the harvesting process are the personnel from cooperatives. Nevertheless, after observing the trend in the last few years, we should focus on thinking that these criteria have been forced from the next agri-food chain step.
Obviously, if production is higher, the sector must make many efforts to organise itself internally and to find new markets to provide this new volume commercial outflow. The first agri-food chain stages, including cooperatives and other warehouses, must invest in creative solutions to obtain new food products as an alternative to fresh consumption. Developing the persimmon industry offers a very high potential [33,34,35] by creating new products, such as dehydrated persimmon, marmalades, and drinks such as beers, all of which are already available on a small scale. Other products must be explored to exploit this raw material, where peptina and other components that can be used in, for example, the cosmetics industry.
This work closes by mentioning the commercialisation of fruit and vegetables that are not suitable according to the aesthetic standard and are also known as “ugly foods”. If we recognise the posed problem of pretending that only very uniform fruit and vegetables must be sold, then more and more people would be willing to consume food that falls beyond current quality standards. In fact, several initiatives are already underway to promote these ugly foods. A large amount of deformed fruit can be offered to commercial outlets if these initiatives are to extend. Deformed persimmons represent 9.47% of the total harvest losses and are included in the aforementioned damage class 1. Moreover, those fruits lost due to marks on the skin and scars, but that do not evolve to greater damage, can also be reduced. They represent 4.57% of the total persimmon losses and are included in damage class 2. The vast majority of the fruit that drops on the ground from breaking branches can be diminished and are covered by class 4, with 31.7% of the total losses in fields.
If these measures are coupled with the significant reduction in the triage undertaken in fields, and if fruit collection is carried out more carefully, the persimmon losses in class 6 could almost be eliminated. This class represents 27.92% of the total FL.
In practice, producers can barely reduce the majority of the damage classes catalogued in the different parcels herein included in a practical manner. There is therefore a need to maintain production support programmes and also to promote policies that enhance their work, all of which could help society at large to increase its awareness that humankind should make better use of the harvest. However, the role of the retail sector can be significant. It is also necessary that the initiatives which support more responsible consumer use become another key link to reduce the FL in fields. Thus, less intensive agriculture can be promoted if ugly fruit demand rises by paying farmers’ work more fairly. Therefore, profits would multiply at different levels, which could contribute not only to diverse SDGs but also to meeting the requirements of the recent European farm to fork strategy, which calls for a fair (better revenue for farmers), healthy (more persimmon fruit available to the consumer), and environmentally friendly (less environmental impact per unit due to reduced losses) food system.

4.2. Limitations and Further Research

The results of this study should be interpreted considering the limitations that emerged during the development of this study, and which could be common to other work on quantifying food loss.
First, one has to be aware of the final destination of products discarded at harvest and if those may be accounted for in food loss measurement or not.
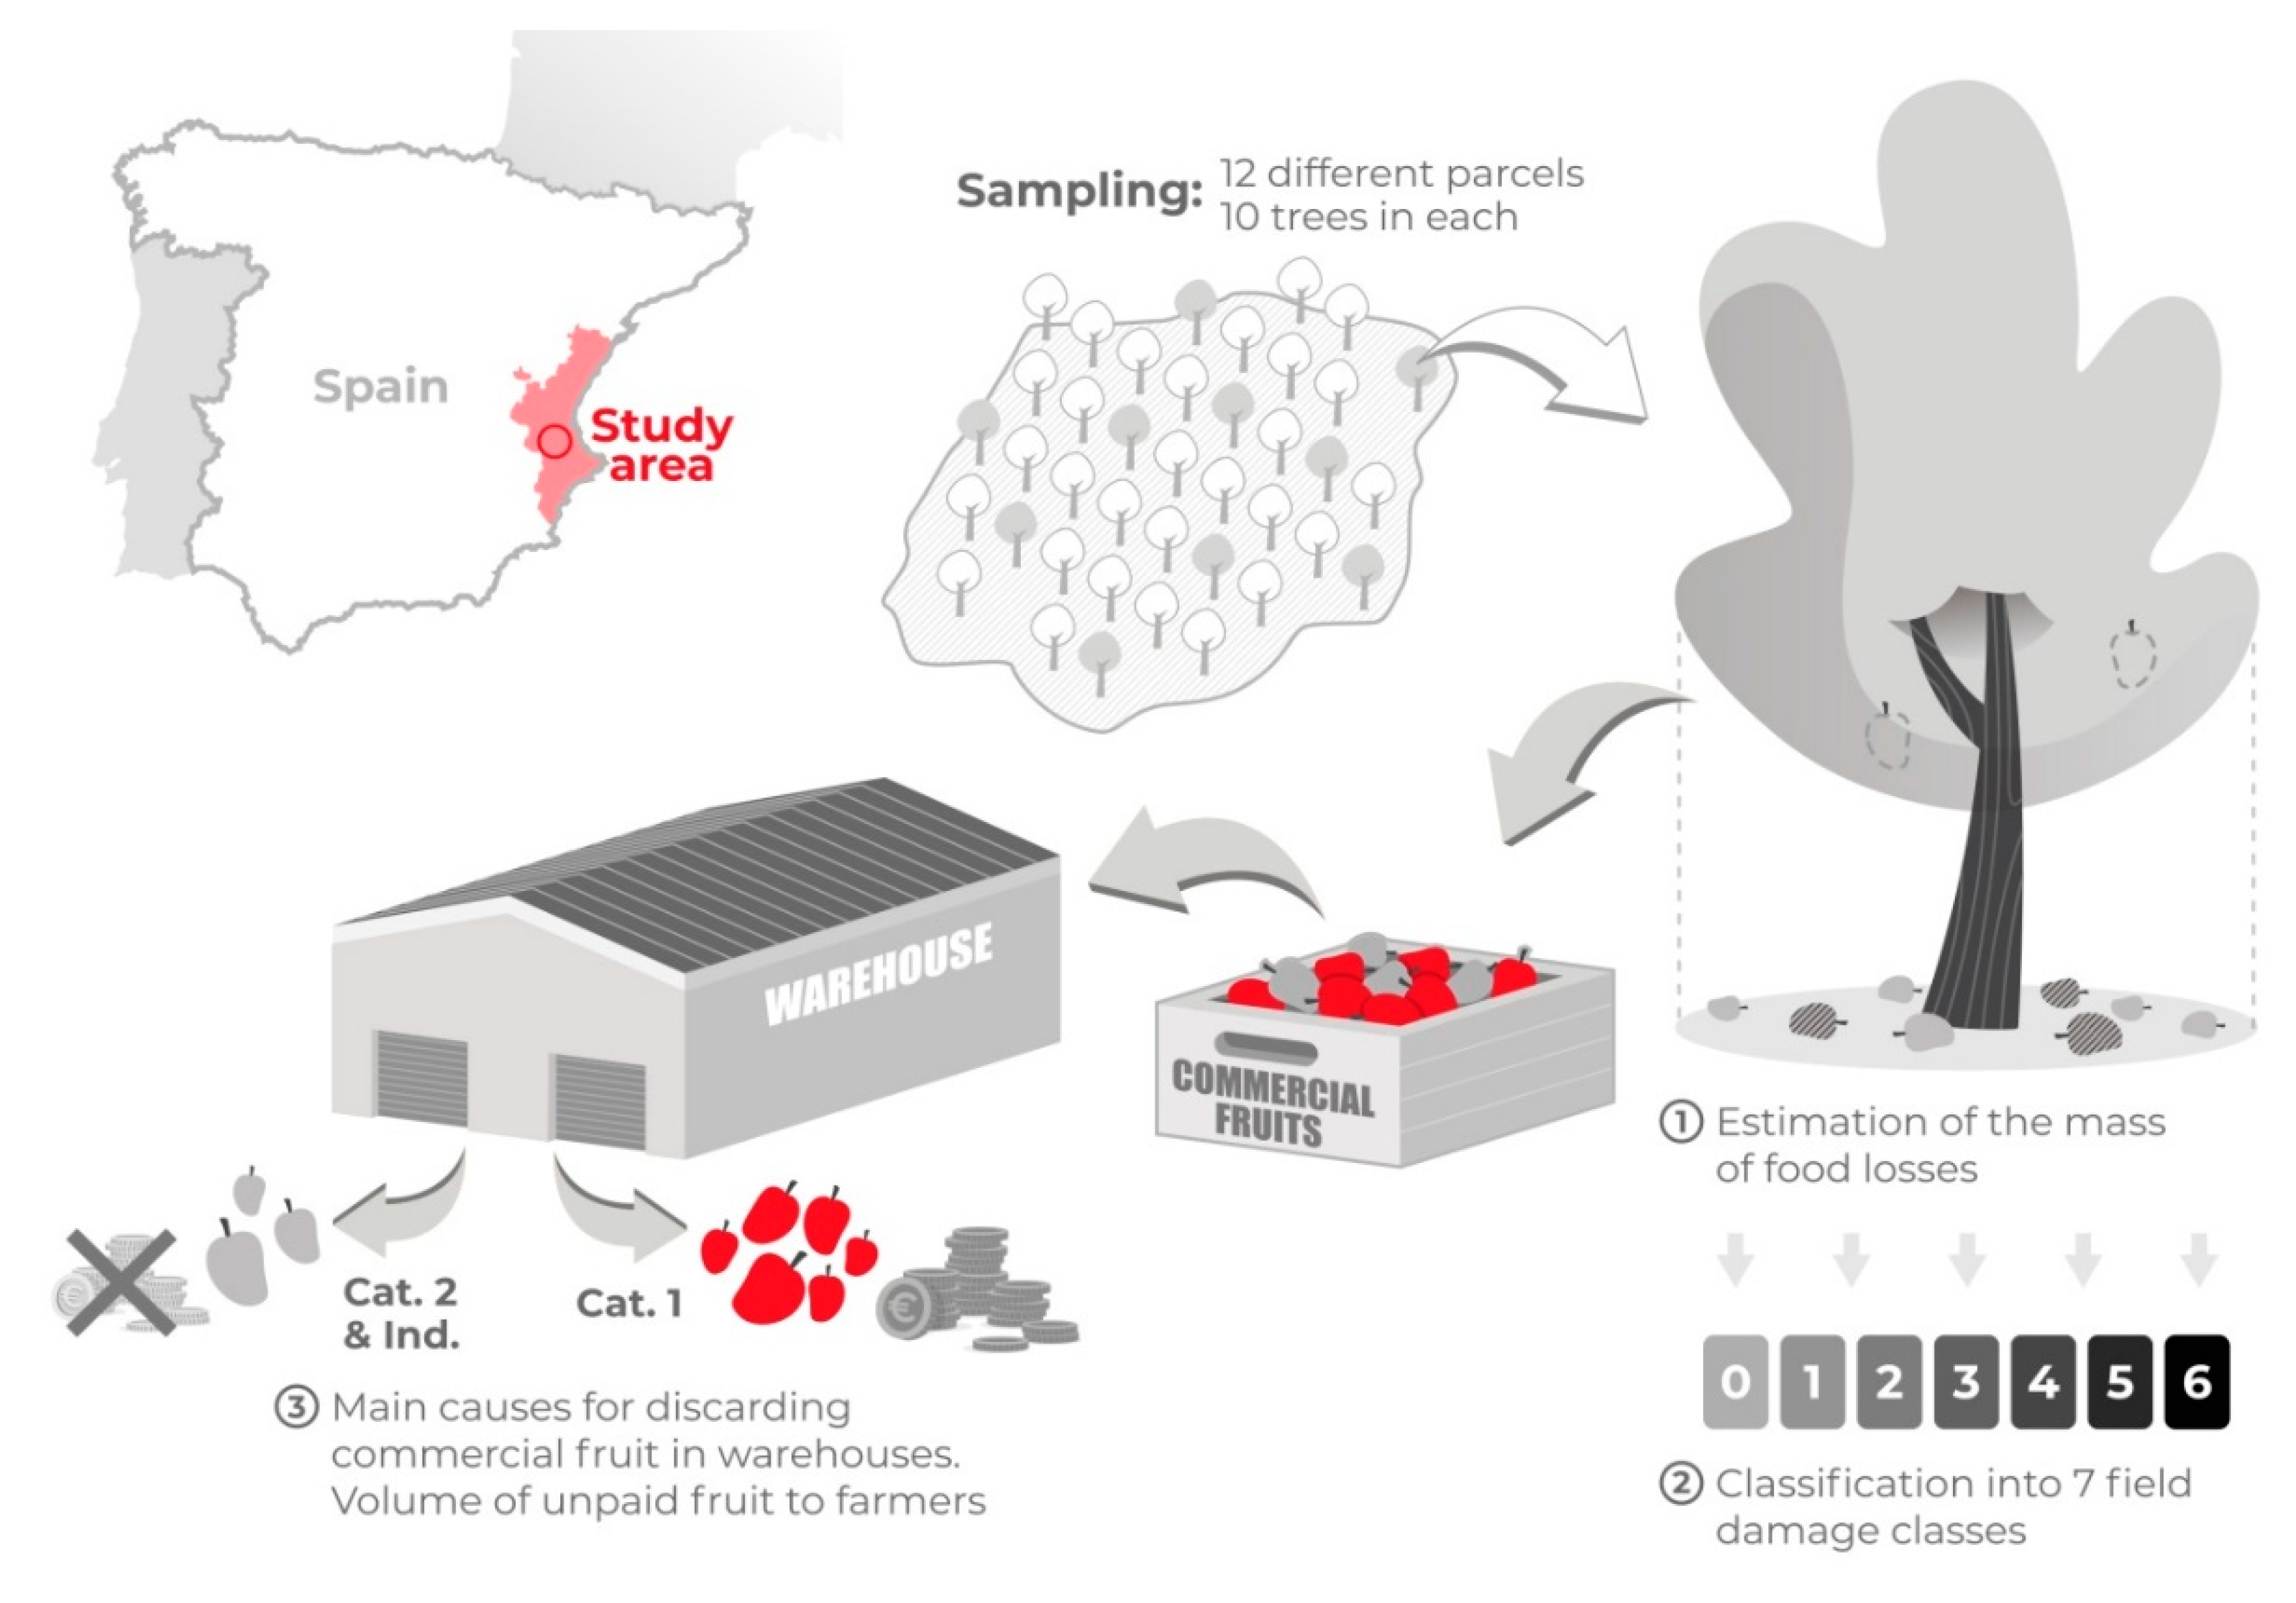
In operational terms, a series of limitations has been detected which should be considered by taking FL measurements of tree fruit plants. FL quantification should be undertaken a few hours after the harvest process due to the fruit deterioration caused by remaining in fields, which hampers the determination of the reasons for discarding fruit. Regarding the sampling type and number of analysed trees, it is always necessary to balance the quality of the information obtained with the operability and the cost deriving from fieldwork. It is very difficult to perfectly measure all the fruit lost in parcels, unless global weighing is carried out by collecting all these fruits quickly and mechanically. Even so, the measurement process herein undertaken is considered suitable for other tree fruit plants. Although the level of representativeness was subject to the size of the sample—which, in this study, is 10 trees that were taken on a discretionary basis—care must be taken to ensure that they are representative for all the trees on the parcel. In addition to this, the selection of parcels must also be as representative as possible for the territory to be analysed. In this work, this approach was taken, so the expected results can have a very acceptable validity.
In addition, sampling must also consider aspects such as the agent that decides the quality of the fruit that is discarded in the field, which, in the present case, has been the cooperative, which is also the one that organises the harvest. Accessing data from various cooperatives would undoubtedly increase the reliability of the data, but one has always take into account the restrictions caused by limited budget, time, and willingness for cooperation, which research faces in most cases.

5. Conclusions

The present study has determined the food loss of a very relevant fruit tree in the Spanish Mediterranean, the persimmon. There are hardly any works that have developed similar studies, and even less in the case of fruit trees, so it is thought that this paper can contribute favourably to this gap in the scientific literature.
The FLW figures have gradually become known in the rest of the agri-food chain, but very few works show the problem in a relevant part of total food production. This is the primary production generated by farmers, which they should be paid for on a fair basis. Despite this food being perfectly suitable for human consumption, it is finally not used and is left on the ground. This fact is a great injustice to the farmers, who cannot be made responsible for this volume of FL because it is mainly due to the way the commercial system currently operates.
Different indicators have been determined to express the losses observed in the 12 reference parcels (Table 5); to the data on field losses are added the actual information on the storage losses (unpaid) that are subtracted in the warehouse. In relation to the group of indicators shown in Table 5, these obtained figures are very high and show the pressure that markets place on producers. The final message is that producers are obliged to produce much bigger volumes of food, with all the associated negative impacts in environmental, social, and economic terms. Therefore, producers pursue persimmon cultivation profitability by increasing the number of kilograms sold. Financial profits are a key factor to maintain agrarian activity, but it is not always possible to make them by the average price per kilo that can be made for fruit.
In addition, it should be noted that these losses induce relevant impacts, starting with environmental issues such as misuses of irrigation water, fertilisers, phytosanitary products, and other inputs. The social impact involves a significant amount of labour wages being wasted, while all the discarded fruit is not used to feed humans. Moreover, there is an evident negative economic impact, because all these agricultural inputs entail costs, plus the physical invested assets are misused. In short, we face a problem that requires reflective discussion between the different involved parties and a change in the productive and commercial standards in order to facilitate the proper use of a larger volume of yield for the original purpose.
With the persimmon chain, this happens to be the retail sector that is centralised in large supermarket chains. In general, these companies are in a more favourable situation than farmers and their strength within the food chain is evident. Thus, the generation of imbalances compared to the other phases, such as the production step, is commonplace. For this reason, fairer trading practices for all sides should be collectively agreed on to lower the global FLW indices. This issue is currently being discussed in different official and business forums [36,37]. In the present work, the total mass and economic losses of producers were estimated to be either 29.5%, if referring to the total produced volume, or 38.5%, if referring to the number of finally commercialised kilograms on average (Table 5). Therefore, it can be conclusively stated that millions of kilograms of persimmon are potentially edible but wasted in Spain every year.
Any fruit that is struck, scratched, or presents an unsuitable colour or calibre is left on the ground. The fact that the same damage typology is penalised, firstly in the field and secondly in warehouses, only confirms the tendency of the retail sector to be increasingly more demanding with aesthetic criteria. The main consequence is the impossibility of offering fruit that is not uniform and aesthetically imperfect to commercial outlets. Claiming that agricultural holdings have to be transformed into factories that produce completely identical food with no kind of defect is considered unfair and unfeasible. Agricultural holdings produce food whose variability is determined by nature. An understanding of this by society as a whole would mean progress in achieving much more responsible production and consumption. Since agricultural output relies on natural framework conditions to a large extent, the recognition of this fact by society could contribute to the future improvement of food systems and food consumption towards increased sustainability.

Author Contributions

Conceptualisation, M.-A.F.-Z. and H.B.; methodology, M.-A.F.-Z. and H.B.; formal analysis, M.-A.F.-Z. and H.B.; writing—original draft preparation, M.-A.F.-Z., H.B., and F.S.; writing—review and editing, H.B., F.S., and M.-A.F.-Z.; supervision, F.S. All the authors have read and agreed to the published version of the manuscript.

Funding

This research received no external funding.

Acknowledgments

The results of the present study form part of a plan against food waste in the Comunitat Valenciana (BonProfit Plan), financed by the General CAP Agency (Conselleria de Agricultura, Desarrollo Rural, Emergencia Climática y Transición Ecológica, of the Generalitat Valenciana). The authors wish to thank the cooperative, farmers, and technicians who participated in the study. Special thanks to Pablo Fernández-Mejías for his good work in designing Figure 1.

Conflicts of Interest

The authors declare no conflict of interest.

References

  1. Gustavsson, J.; Cederberg, C.; Sonesson, U.; Meybeck, A. Global Food Losses and Food Waste-Extent, Causes and Prevention, 1st ed.; FAO: Gothenburg, Sweden, 2011; ISBN 9780786495566. [Google Scholar]
  2. FAO. Food Wastage Footprint: Impacts on Natural Resources (Technical Report); FAO: Rome, Italy, 2013. [Google Scholar]
  3. General, A. United Nations Transforming Our World: The 2030 Agenda for Sustainable Development; Division for Sustainable Development Goals: New York, NY, USA, 2015. [Google Scholar]
  4. European Commission. Communication from the Commission to the European Parliament, the Council, the European Economic and Social Committee and the Committee of the Regions Closing the Loop—An EU Action Plan for the Circular Economy; COM/2015/0614 final; European Commission: Brussels, Brussels, 2015. [Google Scholar]
  5. European Parliament European Parliament Resolution of 15 January 2020 on the European Green Deal (2019/2956(RSP)) 2020; European Parliament: Strasbourg, France, 2020.
  6. European Court of Auditors. European Court of Auditors Combating Food Waste: An Opportunity for the EU to Improve the Resource-Efficiency of the Food Supply Chain; European Court of Auditors: Luxembourg, 2016; Volume 34. [Google Scholar]
  7. World Resources Institute Food Loss and Waste Accounting and Reporting Standard; World Resources Institute: Washington, DC, USA, 2016.
  8. Tostivint, C.; Östergren, K.; Quested, T.; Soethoudt, J.M.; Stenmarck, A.; Svanes, E.; O’Connor, C. Food Waste Quantification Manual to Monitor Food Waste Amounts and Progression; FUSION EU Project: Paris, France, 2016. [Google Scholar]
  9. Xue, L.; Liu, G.; Parfitt, J.; Liu, X.; Van Herpen, E.; Stenmarck, Å.; O’Connor, C.; Östergren, K.; Cheng, S. Missing Food, Missing Data? A Critical Review of Global Food Losses and Food Waste Data. Environ. Sci. Technol. 2017, 51, 6618–6633. [Google Scholar] [CrossRef]
  10. Corrado, S.; Sala, S. Food waste accounting along global and European food supply chains: State of the art and outlook. Waste Manag. 2018, 79, 120–131. [Google Scholar] [CrossRef] [PubMed]
  11. Corrado, S.; Caldeira, C.; Eriksson, M.; Hanssen, O.J.; Hauser, H.E.; van Holsteijn, F.; Liu, G.; Östergren, K.; Parry, A.; Secondi, L.; et al. Food waste accounting methodologies: Challenges, opportunities, and further advancements. Glob. Food Secur. 2019, 20, 93–100. [Google Scholar] [CrossRef] [PubMed]
  12. Fabi, C.; English, A. Methodological proposal for monitoring SDG Target 12.3. In The Global Food Index Design, Data Collection Methods and Challenges; FAO: Rome, Italy, 2018. [Google Scholar]
  13. European Commission Commission Delegated Decision (EU). 2019/1597 of 3 May 2019 supplementing Directive 2008/98/EC of the European Parliament and of the Council as regards a common methodology and minimum quality requirements for the uniform measurement of levels of food wast 2019. Off. J. Eur. Union 2019, 77–85. [Google Scholar]
  14. European Parliament Regulation (EC). No. 178/2002 of the European Parliament and of the Council of 28 January 2002 laying down the general principles and requirements of food law, establishing the European Food Safety Authority and laying down procedures in matters of food safety. Off. J. Eur. Union 2002, 1–24. [Google Scholar]
  15. FAO/WHO. Report of the Twentieth Session of the Codex Committee on General Principles, Paris, France, 3–7 May 2004; ALINORM 04/27/33A, Appendix II; Food and Agricultural Organization of the United Nations and World Health Organization: Paris, France, 2004. [Google Scholar]
  16. Östergren, K.; Gustavsson, J.; Bos-Brouwers, H.; Timmermans, T.; Hansen, O.J.; Møller, H.; Anderson, G.; O’Connor, C.; Soethoudt, H.; Quested, T. FUSIONS Definitional Framework for Food Waste; FUSION EU Project; NameSIK—The Swedish Institute for Food and Biotechnology: Göteborg, Sweden, 2014. [Google Scholar]
  17. Baker, G.A.; Gray, L.C.; Harwood, M.J.; Osland, T.J.; Tooley, J.B.C. On-farm food loss in northern and central California: Results of field survey measurements. Resour. Conserv. Recycl. 2019. [Google Scholar] [CrossRef]
  18. Caldeira, C.; de Laurentiis, V.; Sala, S. Suggestions to Improve Data Coverage and Comparability in Food Waste Accounting Studies across the EU; Publications Office of the European Union: Luxembourg, 2019. [Google Scholar]
  19. Schneider, F.; Part, F.; Göbel, C.; Langen, N.; Gerhards, C.; Kraus, G.F.; Ritter, G. A methodological approach for the on-site quantification of food losses in primary production: Austrian and German case studies using the example of potato harvest. Waste Manag. 2019. [Google Scholar] [CrossRef] [PubMed]
  20. Johnson, L.K. How to Determine the Potential to Increase Vegetable Yield through Estimating and Reducing Field Losses; NC State Extension: Raleigh, NC, USA, 2018. [Google Scholar]
  21. Caldeira, C.; Barco, H.; De Laurentiis, V.; Sala, S. Review of Studies on Food Waste Accounting at Member State Level; Publications Office of the European Union: Luxembourg, 2019. [Google Scholar]
  22. Flemish Food Supply Chain Platform for Food Loss Food Waste and Food Losses: Prevention and Valorization; Monitoring Flanders 2015. Franders State Art 2017; Vlaams Ketenplatform Voedselverlies: Brussels, Belgum, 2017.
  23. Johnson, L.K.; Dunning, R.D.; Gunter, C.C.; Dara Bloom, J.; Boyette, M.D.; Creamer, N.G. Field measurement in vegetable crops indicates need for reevaluation of on-farm food loss estimates in North America. Agric. Syst. 2018. [Google Scholar] [CrossRef]
  24. Khader, B.F.Y.; Yigezu, Y.A.; Duwayri, M.A.; Niane, A.A.; Shideed, K. Where in the value chain are we losing the most food? The case of wheat in Jordan. Food Secur. 2019. [Google Scholar] [CrossRef] [PubMed] [Green Version]
  25. Badenes, M.; Salvador, A.; Vicent, A. El Cultivo del Caqui; GVA: Valencia, Spain, 2015; ISBN 978-84-482-6018-7. [Google Scholar]
  26. FAO (Food and Agriculture Organization of the United Nations) Faostat. Food and Agriculture Data. Available online: http://www.fao.org/faostat/es/#data/QC (accessed on 1 July 2020).
  27. MAPA (Ministerio de Agricultura Pesca y Alimentación) Estadísticas Agrarias. Available online: https://www.mapa.gob.es/es/estadistica/temas/publicaciones/anuario-de-estadistica/default.aspx (accessed on 1 July 2020).
  28. de-Miguel, M.D.; Caballero, P.; Fernández-Zamudio, M.A. Varietal Change Dominates Adoption of Technology in Spanish Citrus Production. Agronomy 2019, 9, 631. [Google Scholar] [CrossRef] [Green Version]
  29. Fernandez-Zamudio, M.A. Importancia de los costes fijos y de oportunidad en la rentabilidad de las explotaciones citrícolas. Levante Agrícola. Rev. Int. Cítricos 2016, 328, 212–221. [Google Scholar]
  30. Fernández-Zamudio, M.A.; De-Miguel, M.D.; Carmona, B.; Caballero, P. Análisis de los costes de producción de cítricos y posibles actuaciones empresariales. Vida Rural 2011, 328, 52–57. [Google Scholar]
  31. Vendrell, M. El “Milagro” del Caqui en Valencia. Un Caso de Innovación Abierta y Colaborativa de Liderazgo Cooperativo; Universitat Politècnica de València: Valencia, Spain, 2017. [Google Scholar]
  32. INE (Instituto Nacional de Estadística) Encuesta sobre la Estructura de las Explotaciones Agrícolas. Available online: https://www.ine.es/dyngs/INEbase/es/operacion.htm?c=Estadistica_C&cid=1254736176854&menu=resultados&idp=1254735727106#!tabs-1254736194989 (accessed on 1 July 2020).
  33. Hernández-Carrión, M.; Vázquez-Gutiérrez, J.L.; Hernando, I.; Quiles, A. Impact of High Hydrostatic Pressure and Pasteurization on the Structure and the Extractability of Bioactive Compounds of Persimmon “Rojo Brillante”. J. Food Sci. 2014, 79, C32–C38. [Google Scholar] [CrossRef] [PubMed] [Green Version]
  34. Testoni, A. Post-harvest and processing of persimmon fruit. In First Mediterranean Symposium on Persimmon; Bellini, E., Giordani, E., Eds.; Options Méditerranéennes: Série A; no. 51; CIHEAM-IAMZ: Zaragoza, Spain, 2002; pp. 53–70. [Google Scholar]
  35. Hidalgo, C.; Mateo, E.; Cerezo, A.B.; Torija, M.J.; Mas, A. Technological process for production of persimmon and strawberry vinegars. Int. J. Wine Res. 2010, 2, 55–61. [Google Scholar]
  36. Taylor, J.S.; Parfitt, J.; Jarosz, D. Regulating the Role of Unfair Trading Practices in Food Waste Generation; FUSIONS EU Project: Wageningen, Poland, 2019. [Google Scholar]
  37. European Parliament and of the Council of the European Union. Directive (EU) 2019/633 of the European Parliament and of the Council of 17 April 2019 on unfair trading practices in business-to-business relationships in the agricultural and food supply chain 2019. Off. J. Eur. Union 2019, 59–72. [Google Scholar]
Figure 1. Scheme of the study approach; Cat. 1 is the 1st category (saleable at a reasonable price), Cat. 2 & Ind. is the 2nd category and industrial use (not saleable at a reasonable price).
Agriculture 10 00581 g001
Figure 2. Persimmon production (t) and surface area (ha) in Spain. Source: [26].
Agriculture 10 00581 g002
Figure 3. Types of unpaid fraction evolution (in %) in persimmon warehouses. Source: internal information provided by the cooperative that collaborated in this study. Real data of the total volume of kilos processed by the cooperative every year.
Agriculture 10 00581 g003
Table 1. Characteristics of the analysed persimmon parcels.
Parcel IDAge (Years)Parcel (ha)No. Trees per ParcelTrees/ha% of Trees Sampled
I50.171106579.1
II270.186033816.7
III110.763003963.3
IV220.176034616.7
V140.271385057.2
VI290.251024149.8
VII60.593305573.0
VIII50.252399564.2
IX80.693154583.2
X40.321805555.6
XI130.251807275.6
XII40.423167583.2
Average12.30.361945567.3
Median9.50.261805305.6
Table 2. Classes of the damage observed in the analysed persimmon parcels.
ClassDescription
0Fruits potentially suitable for the human consumption but left in the treetops.
1Deformed fruits.
2Damaged by severe weather. Different types of superficial scars on the skin.
3Damaged by the presence of pests.
4Fruits that fell down due to breaking branches.
5Fruits that fell down due to undefined causes.
6Damaged caused by manipulation during the harvesting process or fruits that were directly discarded.
Source: Prepared by the authors on the basis of the most common damage observed in the discarded fruit in the field. Fruits of classes 1 to 6 are all collected on the ground under the tree.
Table 3. Different indicators to present food loss in the analysed persimmon parcels.
Parcel IDAverage Mass per Fruit (kg/ud) *No. of Fruits/Tree *kg/Tree *kg in the Parcel **kg/ha º% FL Respecting the Potential Yield ºº
I0.3553913.481483885516.10
II0.2647819.721201666612.12
III0.2616416.855055667412.13
IV0.2617118.661119645811.74
V0.275246.5390132965.99
VI0.2329722.272272921116.75
VII0.246153.78124721053.83
VIII0.269287.931894757713.78
IX0.212173.60113316483.00
X0.323155.0490727967.99
XI0.2447117.42313612,67023.04
XII0.252195.011584380110.86
Average0.2664511.691828598011.44
Median0.2613310.701365656211.93
Note: * the figure refers to the average obtained while sampling 10 trees per parcel; ** harvest losses refer to the parcel dimension; º harvest losses extrapolated to one hectare; and ºº 55,000 kg/ha was established for adult trees and 35,000 kg/ha for younger trees (parcels X and XII).
Table 4. Classes of characterised damage (in %) of the persimmon fruit that remained unharvested in the analysed parcels.
Class of Damage (%)
ParcelPotentially Suitable in Treetops (Class 0)Deformed (Class 1)Damages on the Skin (Class 2)Presence of Pest (Class 3)Breaking Branches (Class 4)Undefined Causes (Class 5)Harvesting Process or Directly Discarded (Class 6)Total Food Loss in Parcel (kg/ha)
I *1.0313.950.7837.73n/a46.51n/a8855
II0.001.391.7729.4526.6015.4025.396666
III0.9319.356.357.2822.1420.2823.686674
IV0.008.450.7013.3824.6528.8723.946458
V0.8313.752.083.7550.003.7525.833296
VI2.3712.967.3029.1232.724.3211.219211
VII3.181.915.100.6431.210.0057.962105
VIII1.751.402.4525.1738.110.0031.127577
IX2.310.5813.874.6264.160.0014.451648
X2.6021.430.6511.6911.0412.9939.612796
XI0.423.377.2923.9822.4414.7327.7712,670
XII2.0115.086.535.0323.6221.6126.133801
Average1.459.474.5715.9931.5214.0427.925980
Median1.3910.713.7712.5426.6013.8625.836562
* Note: n/a (not available) in the sample analysed in parcel I, damage classes 4, 5, and 6 were all classified for class 5 “Damages by undefined causes”.
Table 5. Measured food losses on the field and different indicators about values of the commercial yield and the total mass and economic losses (MEL) assumed by producers in the field and the warehouse.
(a)(b)(c)(d)(e)(f)(g)(h)(i)
Food Loss in the Field (kg)Yield Delivered to the Cooperative (kg)Commercial Production Remunerated (kg)Unpaid Fraction in Warehouses (kg)Unpaid Fraction in Warehouses (%)Total Mass and Economic Losses (MEL) (d + a) (kg)Total Produced in the Campaign (c + f) (kg) Total MEL (f) vs. Total Produced (g) (%)Total MEL (f) vs. Total Commercialised (c) (%)
Parcel
I14835375476061511.442098685830.5944.08
II12015303441588816.742089650432.1247.31
III505525,51321,216429716.84935230,56830.5944.08
IV11195942505089215.012011706128.4839.83
V90111,57410,355121910.53212012,47516.9920.47
VI227210,0138351166216.60393412,28532.0247.11
VII124723,39218,583480920.56605624,63924.5832.59
VIII189411,0859550153513.85343012,97926.4235.91
IX113317,59515,90216939.62282618,72815.0917.77
X9073316264766920.171576422337.3159.52
XI313675655998156720.71470310,70143.9578.41
XII158473065755155121.233135889035.2654.47
Average182811,1659382178316.11361112,99329.4538.49
Median136587897175154316.67298011,49330.5941.54
Note: compilation based on the values (b), (c), and (e) reported by the cooperative for each parcel, and the value (a) estimated in the previous quantification in the field.
Table 6. Commercial yield of the analysed parcels and % of the unpaid fraction in the cooperative.
ParcelYield Delivered to the CooperativeQuality Breakdown in the CooperativeUnpaid in the Cooperative *
(kg)Cat. 1st (%)Cat. 2nd (%)Cat. Ind. (%)(%)
I537588.5610.590.8511.44
II530383.2615.001.7416.74
III25,51383.1616.270.5716.84
IV594284.9914.070.9415.01
V11,57489.479.071.4610.53
VI10,01383.4015.141.4616.60
VII23,39279.4418.731.8320.56
VIII11,08586.1512.751.1013.85
IX17,59590.388.291.339.62
X331679.8318.911.2720.17
XI756579.2919.301.4120.71
XII730678.7720.191.0421.23
Average11,16583.8914.861.2516.11
Median878983.3315.071.3016.67
* Note: the only yield liquidated to the producer is the 1st category.
Publisher’s Note: MDPI stays neutral with regard to jurisdictional claims in published maps and institutional affiliations.

