
Linking Long-Term Changes in Soil Salinity to Paddy Land Abandonment in Jaffna Peninsula, Sri Lanka


Department of Ecosystem Management, School of Environmental and Rural Science, University of New England, Armidale, NSW 2351, Australia
*
Author to whom correspondence should be addressed.
Agriculture 2021, 11(3), 211; https://0-doi-org.brum.beds.ac.uk/10.3390/agriculture11030211
Submission received: 7 February 2021
/
Revised: 1 March 2021
/
Accepted: 2 March 2021
/
Published: 5 March 2021
Abstract
:Soil salinity is a serious threat to coastal agriculture and has resulted in a significant reduction in agricultural output in many regions. Jaffna Peninsula, a semi-arid region located in the northern-most part of Sri Lanka, is also a victim of the adverse effects of coastal salinity. This study investigated long-term soil salinity changes and their link with agricultural land use changes, especially paddy land. Two Landsat images from 1988 and 2019 were used to map soil salinity distribution and changes. Another set of images was analyzed at four temporal periods to map abandoned paddy lands. A comparison of changes in soil salinity with abandoned paddy lands showed that abandoned paddy lands had significantly higher salinity than active paddy lands, confirming that increasing salts owing to the high levels of sea water intrusion in the soils, as well as higher water salinity in wells used for irrigation, could be the major drivers of degradation of paddy lands. The results also showed that there was a dramatic increase in soil salinity (1.4-fold) in the coastal lowlands of Jaffna Peninsula. 64.6% of the salinity-affected land was identified as being in the extreme saline category. In addition to reducing net arable lands, soil salinization has serious implications for food security and the livelihoods of farmers, potentially impacting the regional and national economy.
1. Introduction
Soil salinization is one of the major environmental threats to soil degradation in coastal and arid regions of the world. High levels of salt in the soil adversely impact the agricultural productivity of the fertile coastal lands and have serious ecological and socio-economic implications. The latest global estimates suggest that over 1 billion ha of land are affected by varying degrees of soil salinization [1]. It is also estimated that, by 2050, 50% of arable lands will be affected by some degree of soil salinity [2].
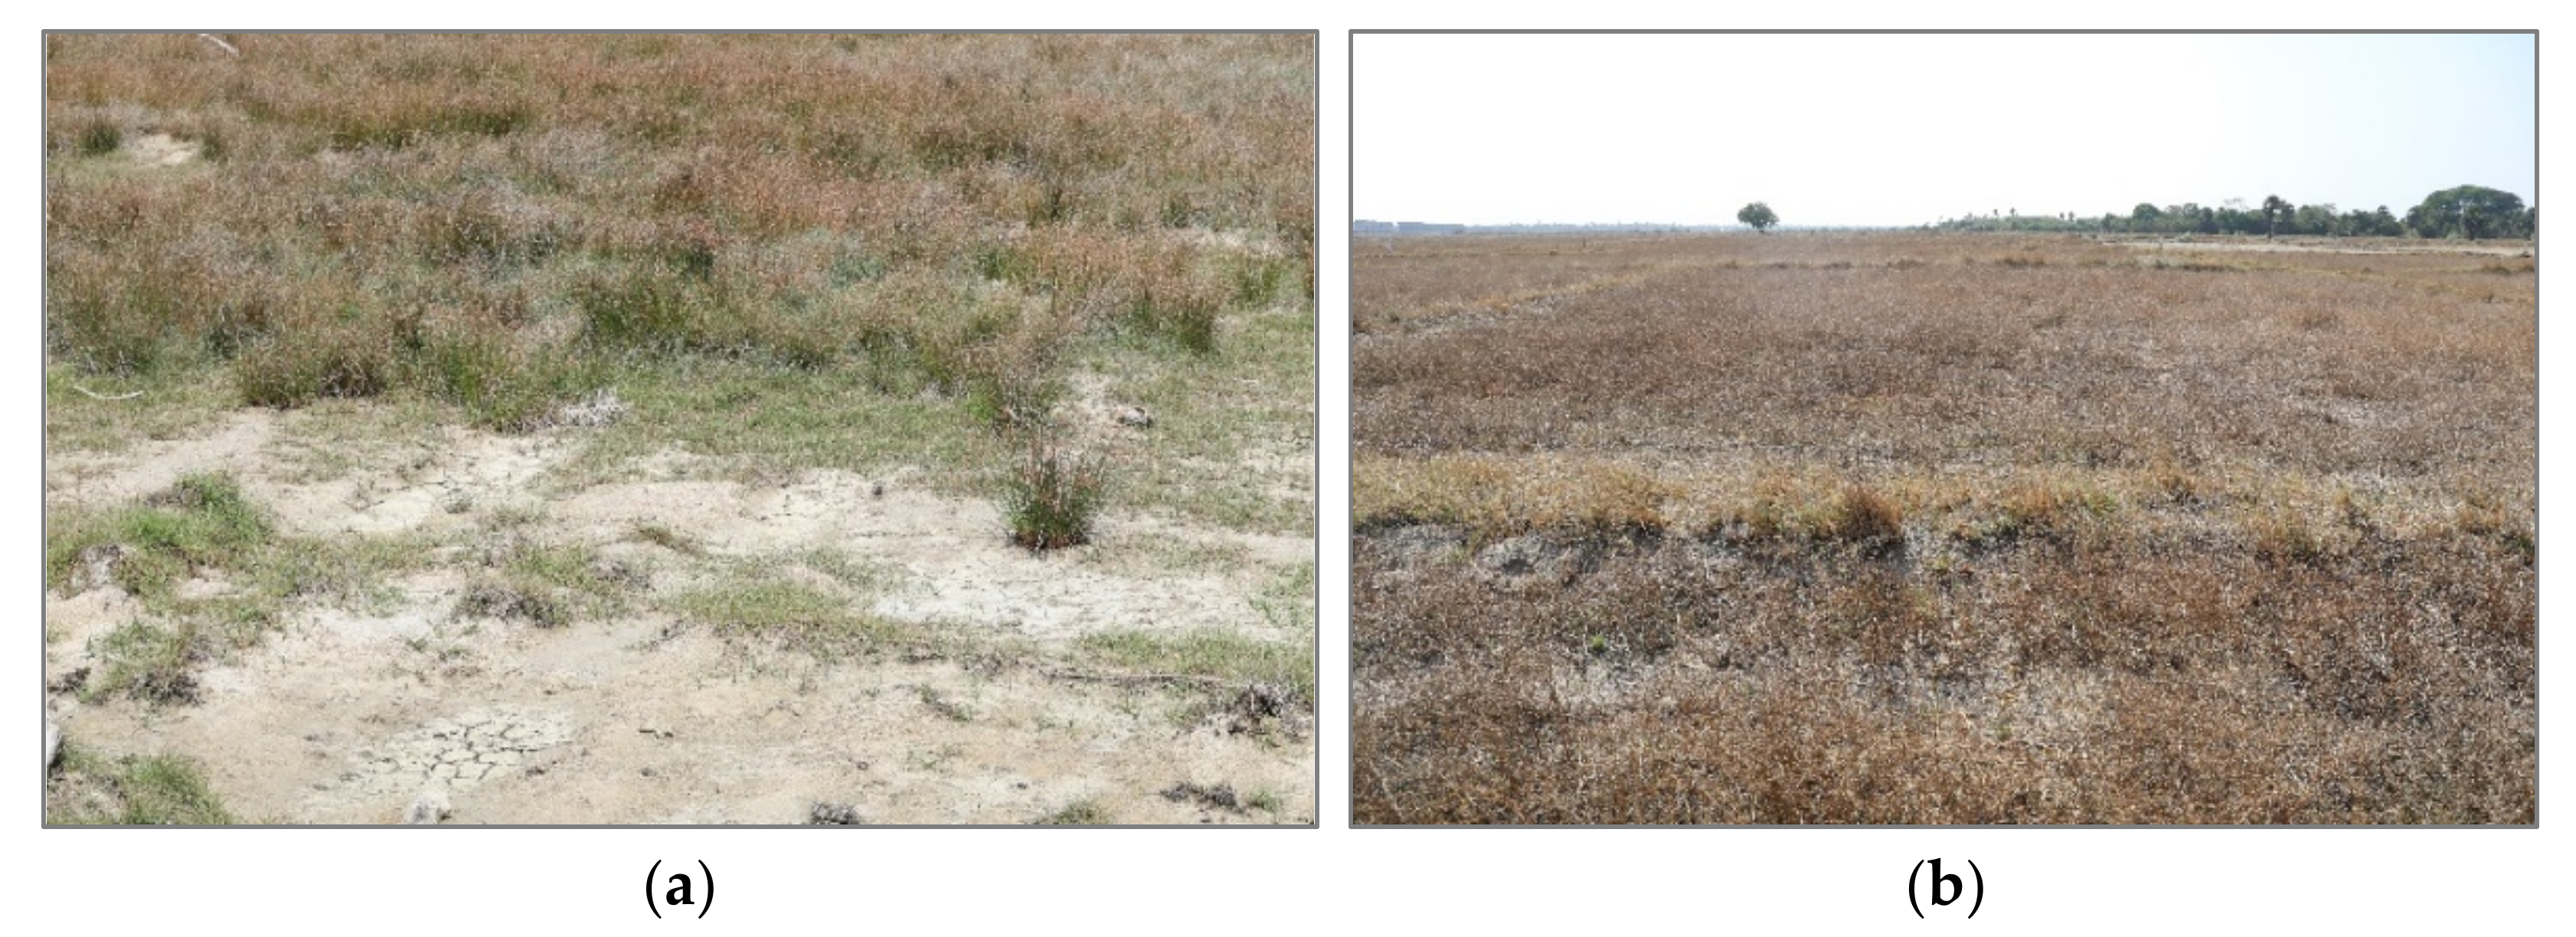
Owing to the dynamic nature of coastal areas, agriculture in the coastal zones is quite vulnerable to the unprecedented impacts of climate change. Nevertheless, coastal agriculture all over the world is also experiencing mounting pressure from non-climatic stressors [3,4], with Sri Lanka being no exception. Jaffna Peninsula, located in the northern coastal province of Sri Lanka, is one of the worst affected regions of the country, where increasing coastal salinization is being blamed for decreasing agricultural productivity and abandonment of previously cultivated lands. Paddy is the main agricultural crop of the region and soil salinization is one of the major concerns of the coastal paddy farmers of Jaffna Peninsula [5,6]. According to previous studies, about 32.8% of the lands in Jaffna Peninsula are affected by salinity [7], while groundwater salinity has increased 1.6-fold over last two decades [8]. The rice plant has been categorized as the most susceptible crop to salinity and growth, and the yield of rice is greatly affected by salinity [9,10]. Over the last 30 years, large areas of previously cultivated lands have been abandoned, and have now been overtaken by shrubs or are just lying bare (Figure 1). Some of this land abandonment has been due to the civil war, but most of the abandoned land is in coastal areas and has not been recultivated since the end of the civil war. Rising salinity also seems to be making paddy cultivation marginal in many previously productive land areas [8].
There are many factors that contribute to soil salinity in Jaffna Peninsula, including both natural and human factors. Jaffna Peninsula relies solely on groundwater for all its needs in the absence of perennial rivers and major water supply schemes. It has been estimated that there are 19,500 agro-wells in Jaffna Peninsula, ranging from 15 to 200 wells per sq km [11]. Most of these wells have high levels of water salinity, and extensive use of these for irrigation adds to the salt in the soil. Gopalakrishnan, Kumar and Mikunthan [8] have shown that most of the agro-wells (59%) in Jaffna Peninsula have a salinity level higher than 3 dS m−1, which is unsuitable for crop irrigation. In addition, Jaffna Peninsula is very low lying, with elevation ranging from −1.9 to 15 masl, and more than 89% of the land area is below 5 m elevation. The land is surrounded by the Indian Ocean on three sides and there is no area that is more than 10 km from the coast. Therefore, the region is highly exposed to climate change induced coastal hazards, including sea-level rise, flooding and coastal erosion, which increases the risk of soil and aquifer salinization [12,13,14]. Being a semi-arid region, short duration precipitation and high rates of evaporation exacerbate the salinization issue [6]. In addition, natural flushing of accumulated salts out of the root zone is becoming more difficult with insufficient rainfall and poor drainage. This situation is further aggravated by over-extraction of groundwater for daily needs and intensive agriculture [15].
Rice is the staple food and single most important crop, accounting for 34 percent of the total cultivated area in Sri Lanka [16]. Jaffna Peninsula has been an important contributor to Sri Lanka’s rice production, therefore it is of utmost importance to map and monitor the soil salinity changes in order to develop informed strategies to prevent further adverse consequences of soil salinity. It is also important to understand the scale of the soil salinity problem in Jaffna Peninsula and its impact on crop productivity.
Remote sensing has been advocated as a promising technology over conventional methods of soil salinity estimation and monitoring over large areas in terms of time and cost [17,18]. Landsat sensors have been widely used in soil salinity and land use land cover mapping due to long-term coverage [19,20,21]. The limitation in the use of Sentinel 2 multispectral images, which provide better spatial resolution (10 m) than Landsat (30 m), is that they have only been available from 2015 onwards. The comprehensive Landsat image archive offers data since 1982 for free and this offers unparalleled potential to study decadal changes in vegetation and land use/covers.
Over the last 30 to 40 years, a lot of paddy lands in Jaffna Peninsula have been abandoned and are currently shrub land. Some of the paddy lands abandoned have been due to the civil war but farmers are increasingly blaming rising salinity as a major cause of the abandonment. There has been no comprehensive study on the contribution of soil salinity to reduced agricultural productivity and abandonment of paddy lands in Jaffna Peninsula. Therefore, this study was undertaken to examine whether there is any linkage or relationship between changes in soil salinity in Jaffna Peninsula and the paddy lands that have been abandoned over the last 30 years. It is critical that the impacts of changes in soil salinity on agricultural crops, particularly paddy in Jaffna Peninsula, be understood so as to develop preventative and adaptive schemes that can sustain agricultural production and food security. With rising sea-levels leading to increased inundation and groundwater contamination, the issues related to soil salinity are going to become a critical factor in paddy cultivation in Jaffna Peninsula. Knowledge of the increase or changes in soil salinity and its relationship with paddy land abandonment can provide critical information to landholders and management on the seriousness and extent of the issue and enable them to plan accordingly. It is also of critical importance when dealing with the food security of Jaffna Peninsula, as well as for Sri Lanka as a whole.
2. Materials and Methods
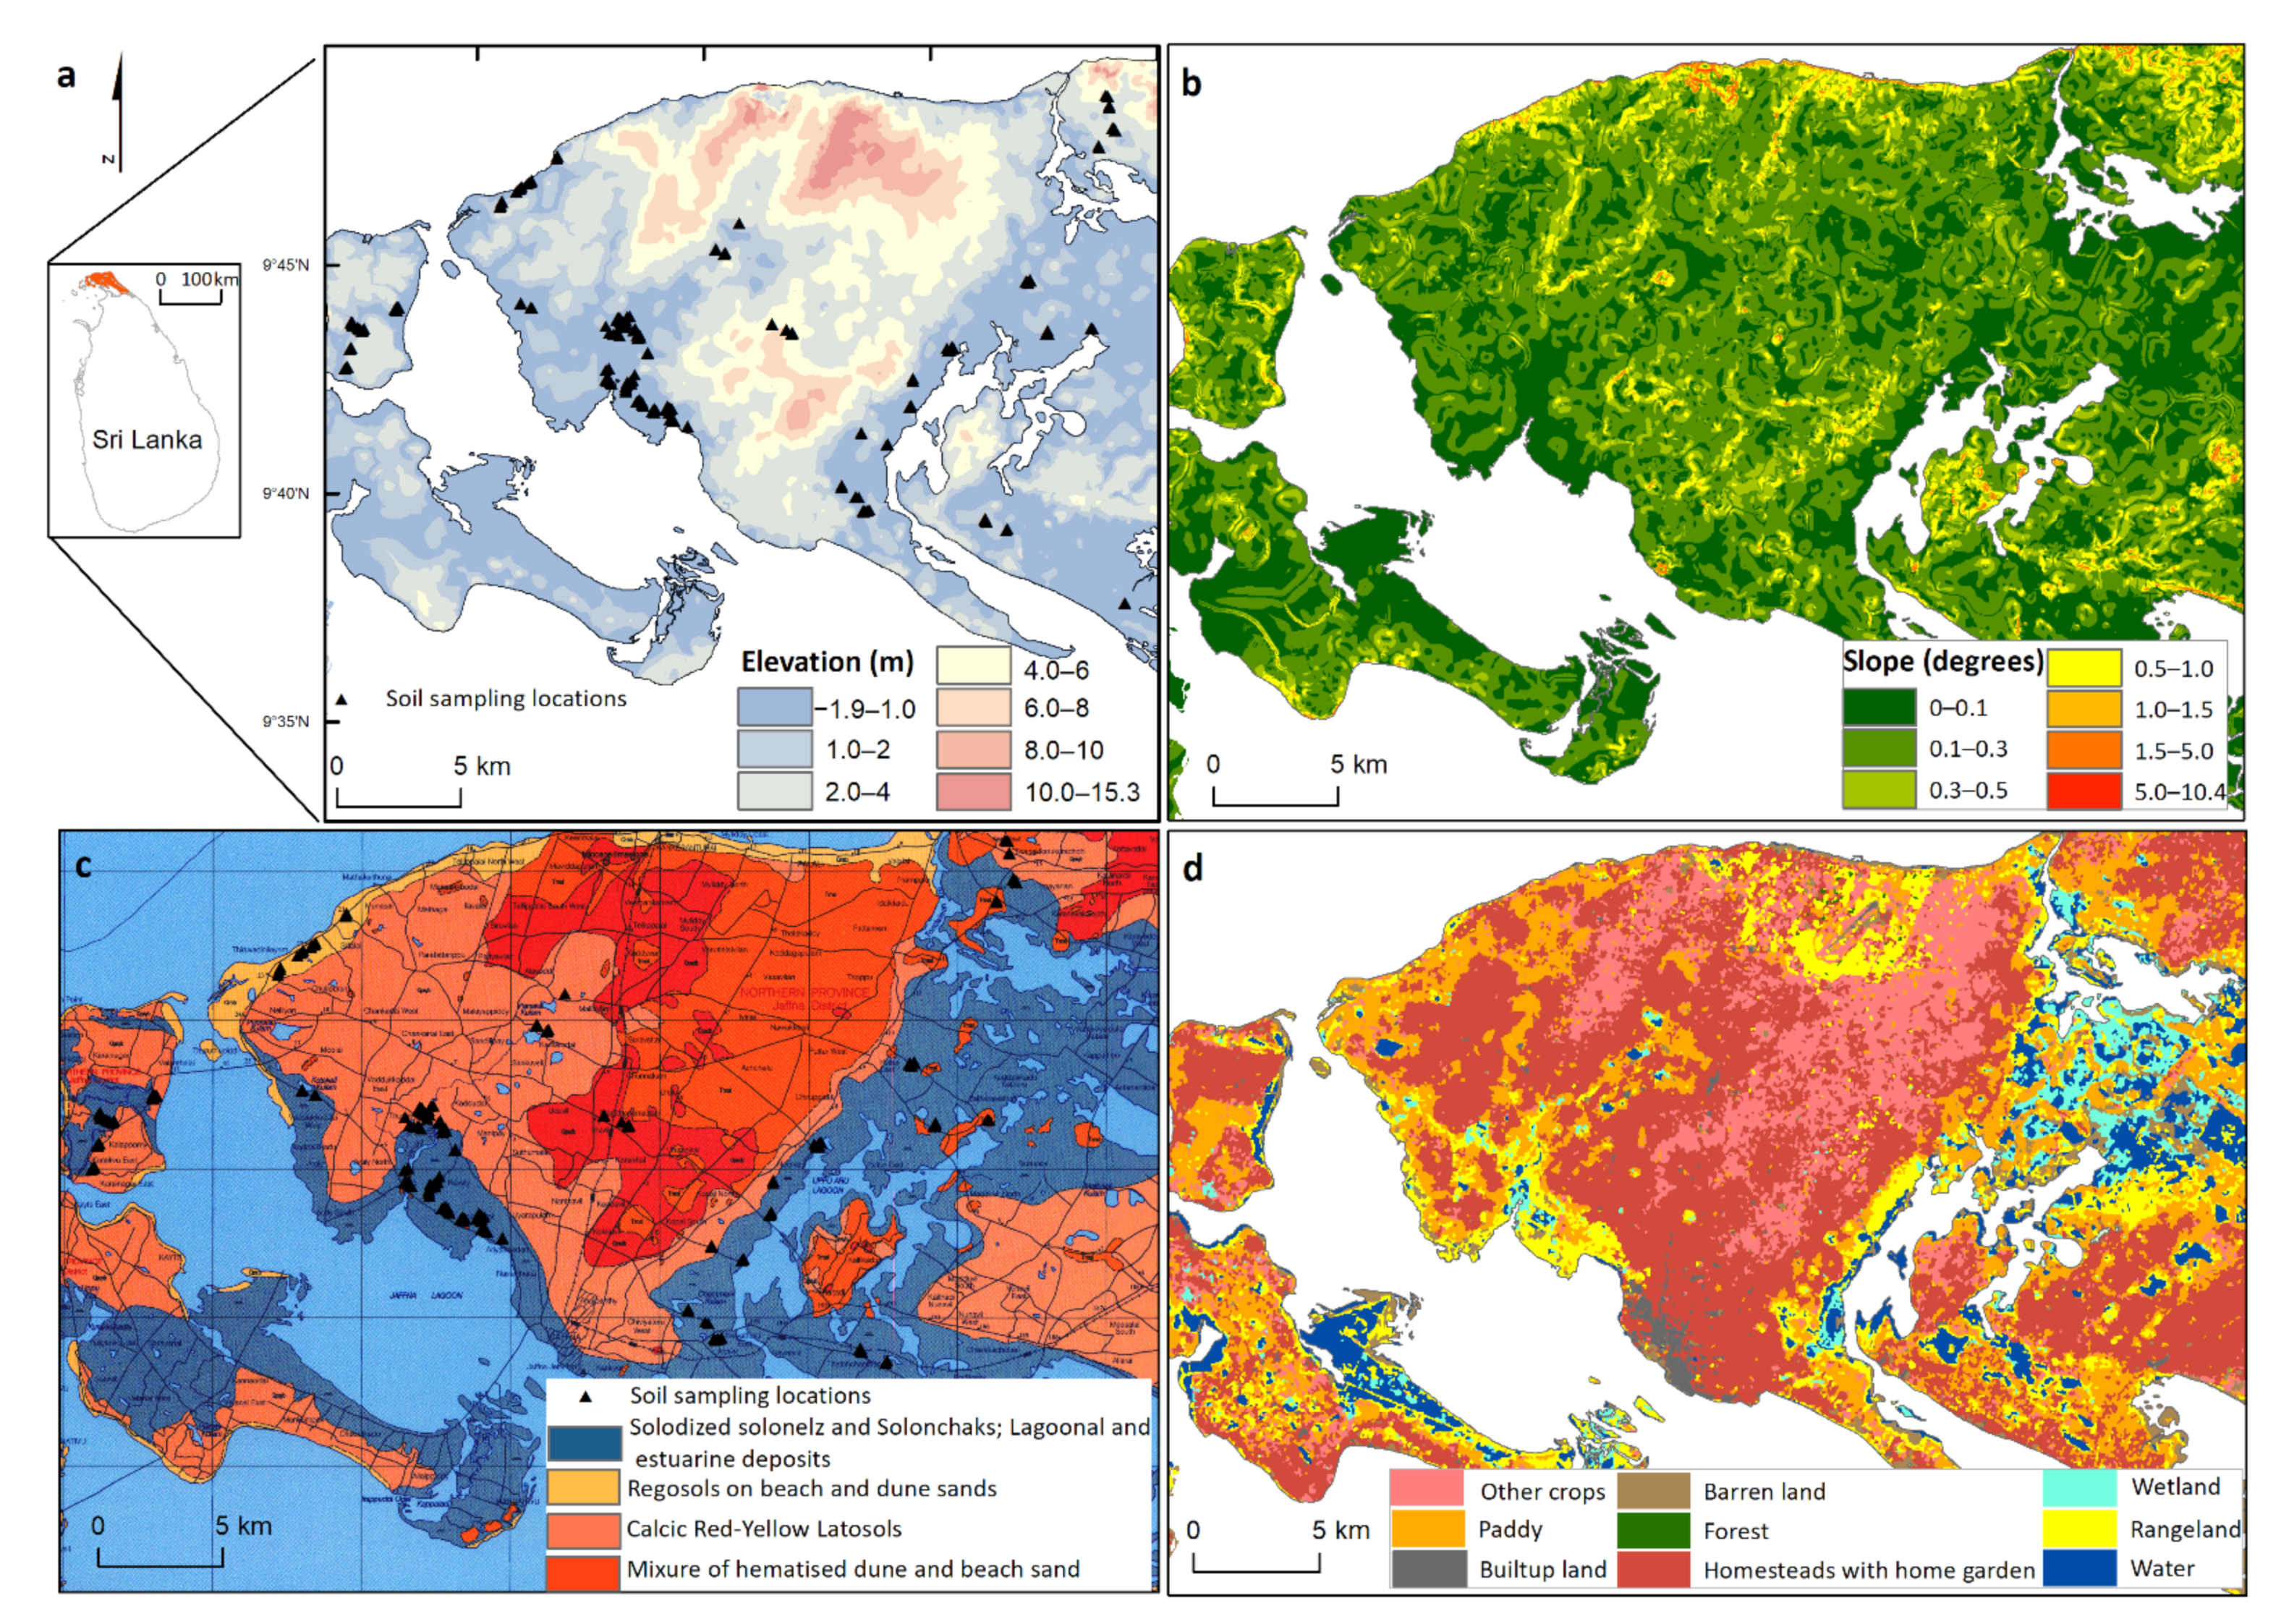
The study area (Figure 2) is located in the northern-most part of the country between the longitudes 79°38′4″ to 80°34′56″ E and latitudes from 9°49′17″ to 9°28′13″ N. It is characterized by low country dry zone with above-average ambient temperature (>29.5 °C). The average annual precipitation is 1290 mm [22], of which more than 90% occurs between October and March, and thereafter there is little or no rainfall during the rest of the year. The terrain is almost flat, with average elevation being 3.45 masl. Jaffna Peninsula is traditionally an agricultural area and is largely composed of Miocene limestone. Almost all the locations of the peninsula are less than 10 km from the sea, lagoon and other seawater inlets, hence the entire area is considered to be a low-elevation coastal zone. Agriculture is the principal source of income, with 33% of families solely dependent on agriculture [23]. Paddy is the most widely grown crop along the coastal lowlands. Rice is the staple diet of the people of this region. The coastal lowlands region is being affected by salinization, which is the most widespread problem in the region. Jaffna Peninsula has an increasing population density, estimated presently to be 606 persons per sq km [23]. Agriculture in Jaffna Peninsula is almost entirely dependent on rainwater, with groundwater the only source of irrigation. Apart from agriculture, well water is also used for domestic and industrial purposes at an increasing rate.
2.1. Soil Sampling and Analysis
A soil-sampling campaign was conducted during August 2019, the dry season and fallow period between rice crops. A total of 198 top-soil samples were collected to a depth of 10–15 cm using a hand auger. Each sample was a composite of five samples, one meter apart in the north, south, east and west directions. The locations of the samples were recorded with a portable GPS device. Soil samples were then analyzed for soil salinity in the laboratory. Soil salinity was measured by using electrical conductivity (EC) measurements following the 1:5 soil saturation extract method [24] using an electrical conductivity meter. Refer to Gopalakrishnan and Kumar [7] for more details on soil sampling and salinity determination.
2.2. Remotely Sensed Data Acquisition and Pre-Processing
Obtaining cloud-free images for the study area was a challenge due to its tropical location. There remains considerable cloud cover even during the dry season. The study was over a 32-year period, mainly due to the limitation of image availability. Multi-temporal level 1 (L1T) Landsat images downloaded from United States Geological Survey (USGS) web site (Table 1), which were precision and terrain corrected, which makes them suitable for pixel-level time series analysis [25]. Care was taken to acquire the images of the same period of the dry season, where the vegetation is sparse. Due to considerable cloud cover, cloud-free images for a single date were not available. Therefore, the image with the least cloud cover in the required month was obtained and the cloud-covered areas were then masked and replaced with sections from images for the closest time or from images for the following year or previous year for the same time period, whichever was available. The relevant sections were replaced after image processing and classification. Although Sentinel-2 had been used in an earlier study by the authors [7], here we used both Landsat sensor series images so that comparison could be better and we could have more confidence in our results, since the same model with same bands was being used for both the 1988 and 2019 maps. All Landsat satellite images were atmospherically corrected to top of atmosphere surface reflectance using the FLAASH (Fast Line-of-sight Atmospheric Analysis of Hypercubes) module in ENVI 5.5.
2.3. Soil Salinity Mapping and Validation
The efficiency of different soil salinity indices derived from Sentinel 2 imageries (multispectral 10 m) for detecting and mapping soil salinity for this study area has been reported in an earlier study [7]. The results showed that a partial least squares regression (PLSR) model in combination with salinity indices provided the best results compared to the other models investigated. Hence the PLSR model with the best combination of Landsat 8 OLE bands, salinity indices which are sensitive to salinity (Table 2) and elevation data was used to predict the salinity distribution for 2019. The 198 soil samples were divided into two subsets for PLSR modelling. The first set (158 samples—80%) was used for modelling and the second set (40 samples—20%) for validation. The best results were achieved with R2 values of 0.63. This model was then applied to the 1988 Landsat imagery to produce the salinity distribution map of 1988 as well.
2.4. Change Detection
In this study we used the pixel-based approach to detect the salinity change pattern, similar to that of Allbed, et al. [26]. The soil salinity difference image for the two periods 1988 and 2019 was generated by subtracting salinity values of the former date from the latter date. On the resultant difference image, positive values and negative values represented the increasing and decreasing salinity proportions and approximate zero values indicated no change of salinity between the two periods.
2.5. Permanently Abandoned Paddy Lands Mapping
Jaffna Peninsula has experienced a drastic agricultural land use and land cover change (LULC) over the past 30 years. The most influential underlying driver of this LULC change has been internal civil war, which lasted from 1983 to 2009. Internal migration, international migration of farm families and economic blockade had profound impacts on the Peninsula’s agriculture. Nevertheless, saline water intrusion has been identified as a constraint in agricultural productivity since the 1960s. Now, after 11 years of conflict, there have been rapid developments in all sectors, including agriculture. Therefore, in order to understand the long-term changes that have occurred in agricultural land use and to map the distribution of permanently abandoned paddy lands in Jaffna Peninsula, LULC mapping was performed using historical Landsat images. Landsat images of 1988, 2004 and 2018, with 14–16 year gaps, were initially selected. Two more images from 2009 and 2013 (Landsat 5 TM) were then included to identify and remove the changes that occurred during the civil war. All the images were acquired during the December to February paddy cultivation season to minimize the seasonal variations and better identify paddy farms. All the images had already been radiometrically corrected, therefore atmospheric corrections were applied using the FLAASH module in ENVI 5.5.
Satellite images were classified into six LULC classes (including paddy lands, other crops, rangeland, barren land, wetland and other (forest, water bodies)) using the supervised classification maximum likelihood algorithm in ENVI® software version 5.5. Post-classification smoothing was performed using a 3 × 3 kernel majority filter to reduce noise.
The ground reference data for each classified image were obtained from separate data sources, including high-resolution images from Google Earth Pro, the National LULC map of the Survey Department of Sri Lanka, and field work. Accuracy assessment was compared based on the overall accuracy and Kappa coefficient.
The abandoned paddy lands have converted to barren land, rangeland or wetland with time. Hence each of the changes of paddy lands to these other land use classes were identified using the post-classification change detection technique. The classified images were combined pairwise (1988–2004, 2004–2009, 2009–2013, and 2013–2018) and change classification images were produced that indicated the changes “from” and “to” classes. The abandoned paddy lands for each year were compared and intersected with the 2018 paddy land use/land cover. The overlapping paddy land use regions were identified as reconverted paddy land area and the rest were delineated as permanently abandoned paddy land areas. Initially, a pixel had to be paddy land and then in every subsequent time frame change to non-paddy and then remain non-paddy in 2018 for it to be graded as permanently abandoned. Initially, a pixel had to be paddy land, then in a subsequent time be changed to non-paddy and then revert to paddy land and remain paddy land in 2018 to be classified as reconverted paddy land. The overall accuracy of the permanently abandoned paddy land classification was verified with 140 random ground samples collected from part of the field survey in October 2018. Finally, the paddy land abandonment map was overlaid on the salinity difference map to determine the relationship between salinity changes and paddy land abandonment.
3. Results
The overall accuracies of the land use classifications were 81.6% (1988), 85.0% (2004), 83.4% (2009), 82.9% (2013) and 88.2% (2018). The Kappa coefficients for the 1988, 2004, 2009 and 2018 maps were 0.73, 0.79, 0.79, 0.78 and 0.87, respectively.
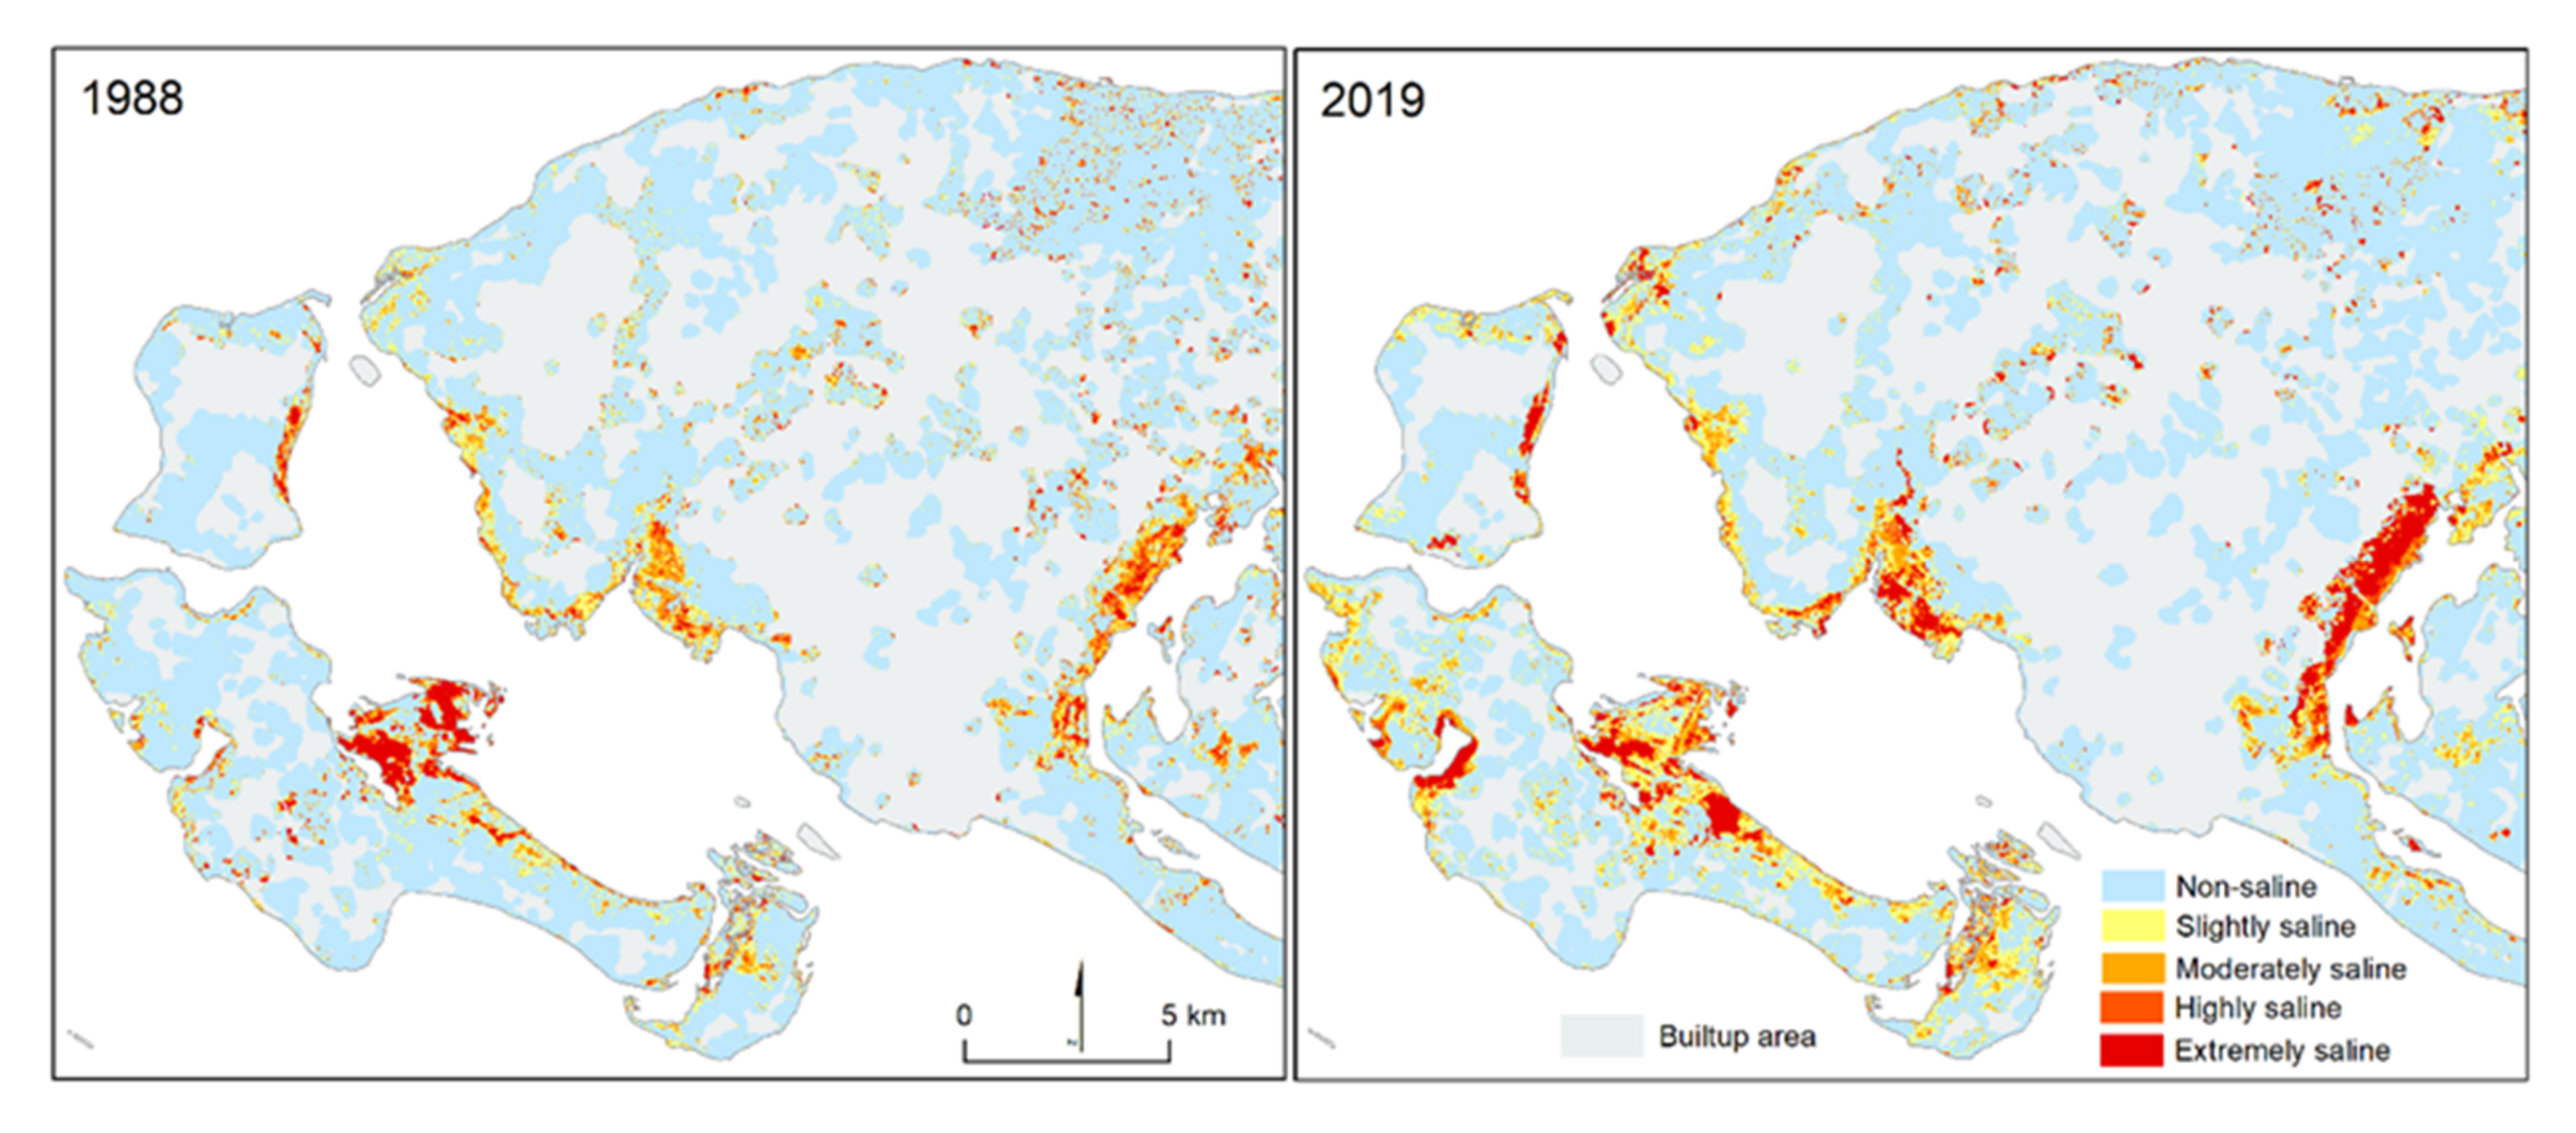
The salinity maps for 1988 and 2019 that were derived from the application of the PLSR model to the multispectral Landsat images are presented in Figure 3. Salinization was quantified and classified into 5 levels (Table 3) according to the general relationship between EC and plant growth [24].
From 1988 to 2019, the overall extent of salt-affected areas has significantly increased, by around 1.4-fold. For both time periods, it can be observed that the areas of the highest degree of salinity are located along the coastal fringe compared to inland; this is especially so on the eastern and western sides of the Jaffna mainland (Figure 3).
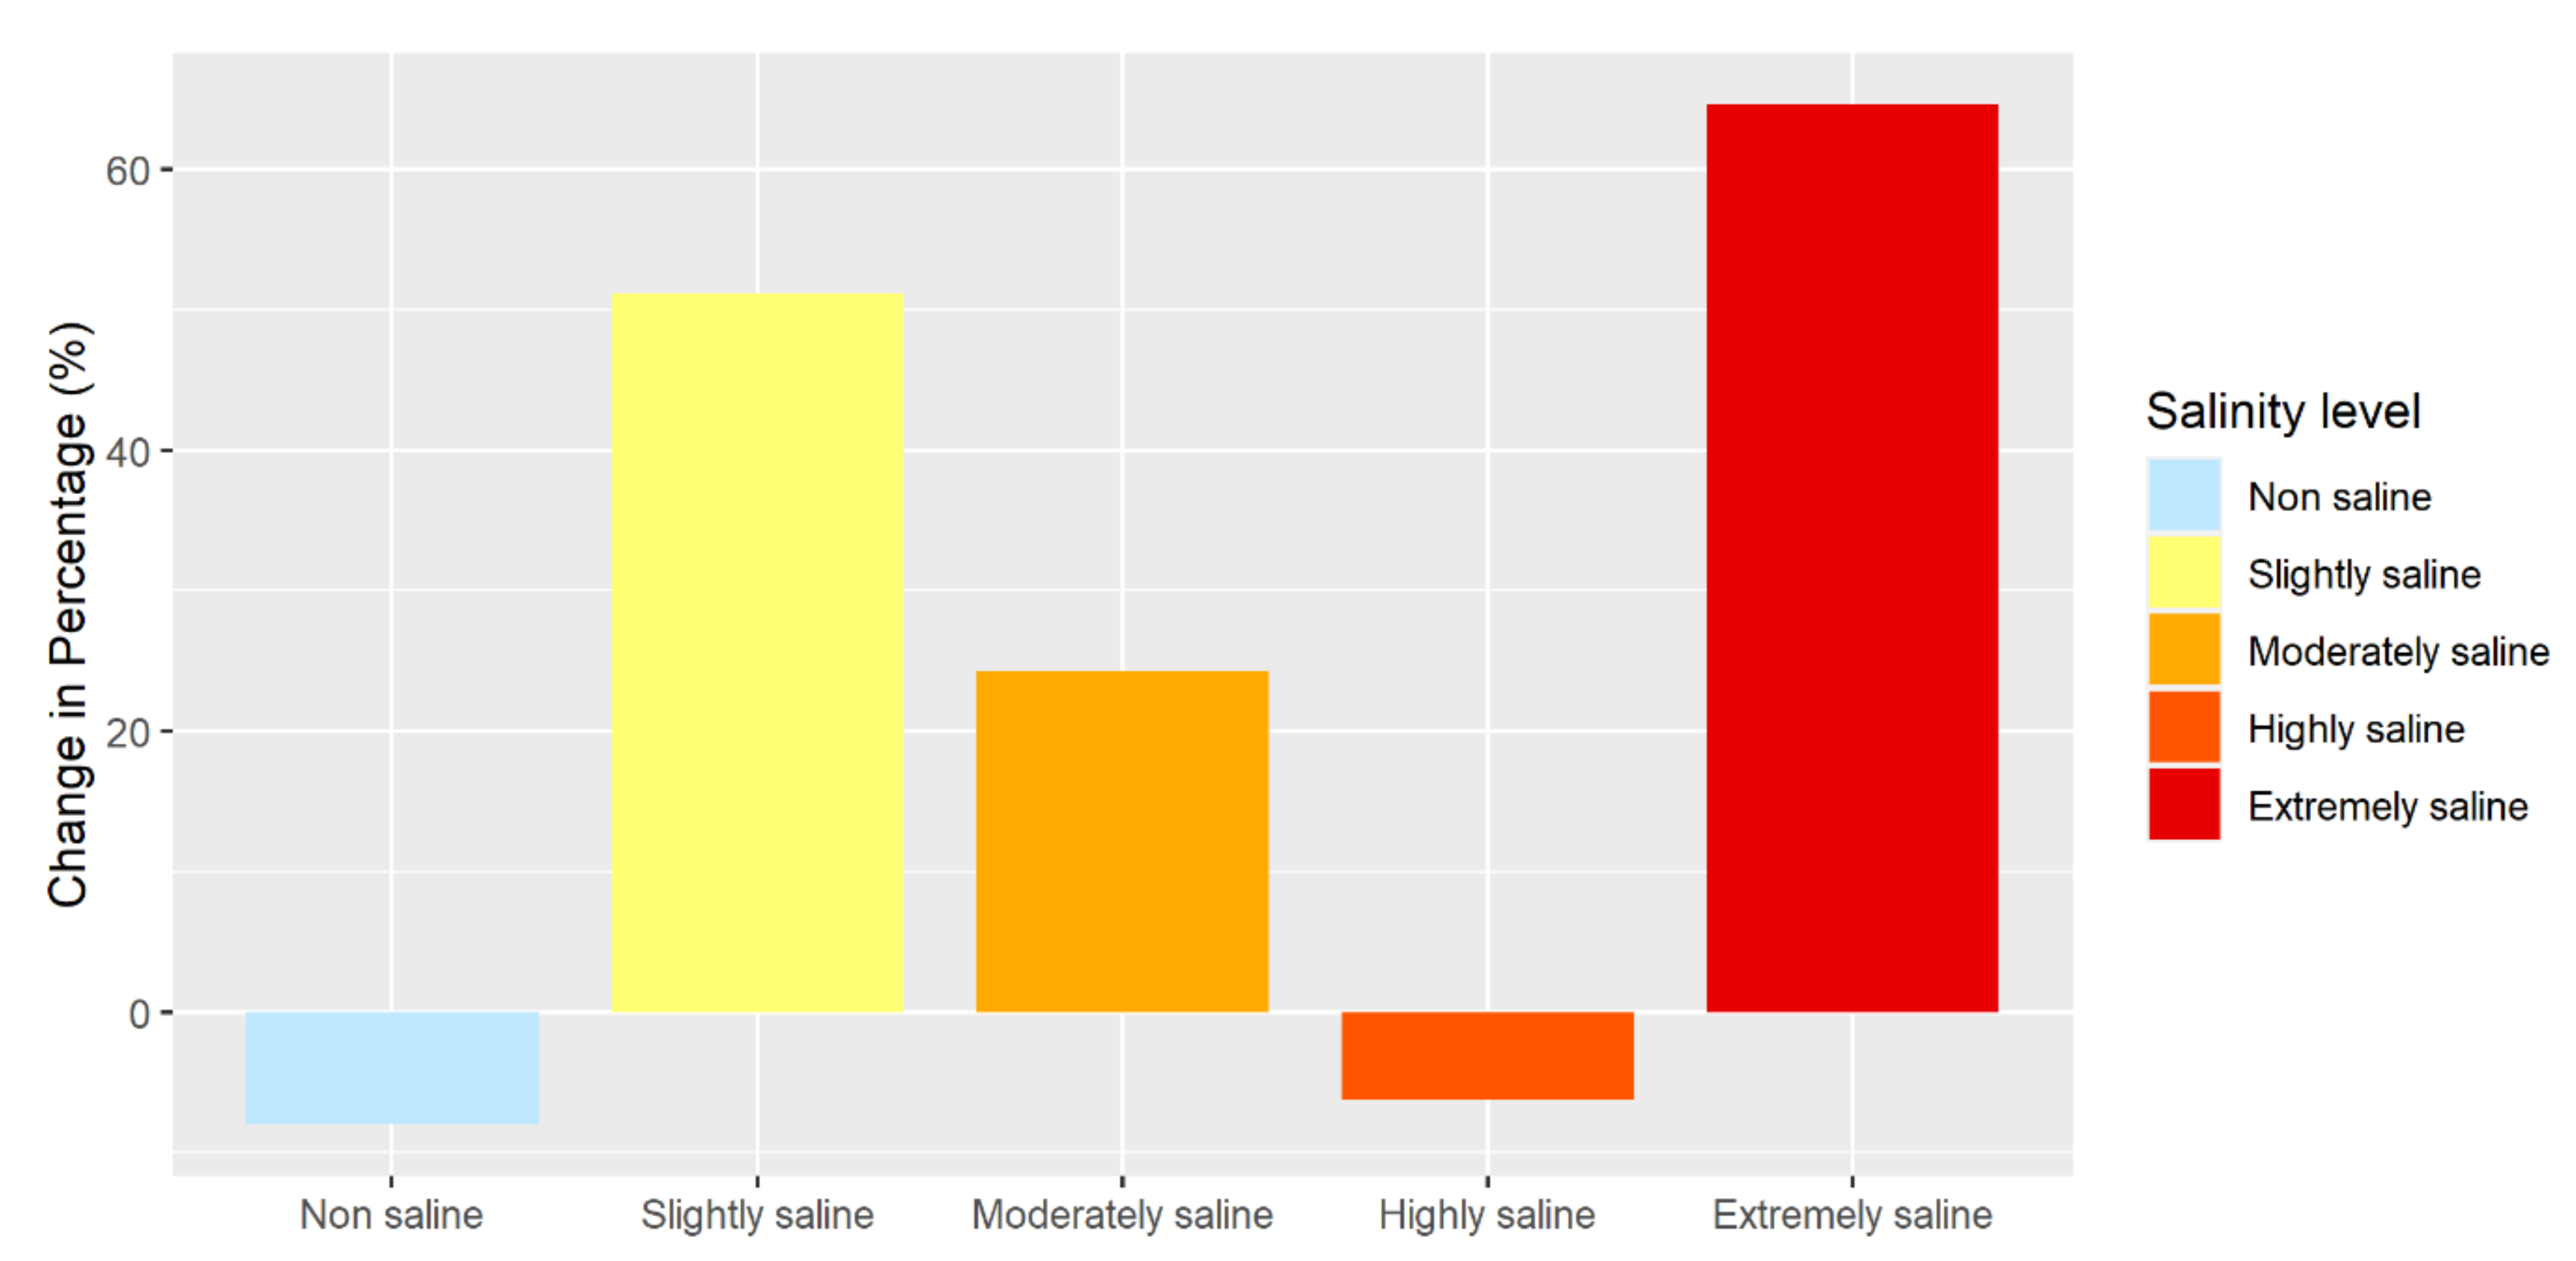
Slightly salinized, moderately salinized and extremely salinized land increased by 51% (898 ha), 24% (273 ha) and 65% (462 ha), respectively. The highly saline area was reduced by 6% (41 ha) and non-saline land was reduced by 8% (1591 ha), as expected (Figure 4).
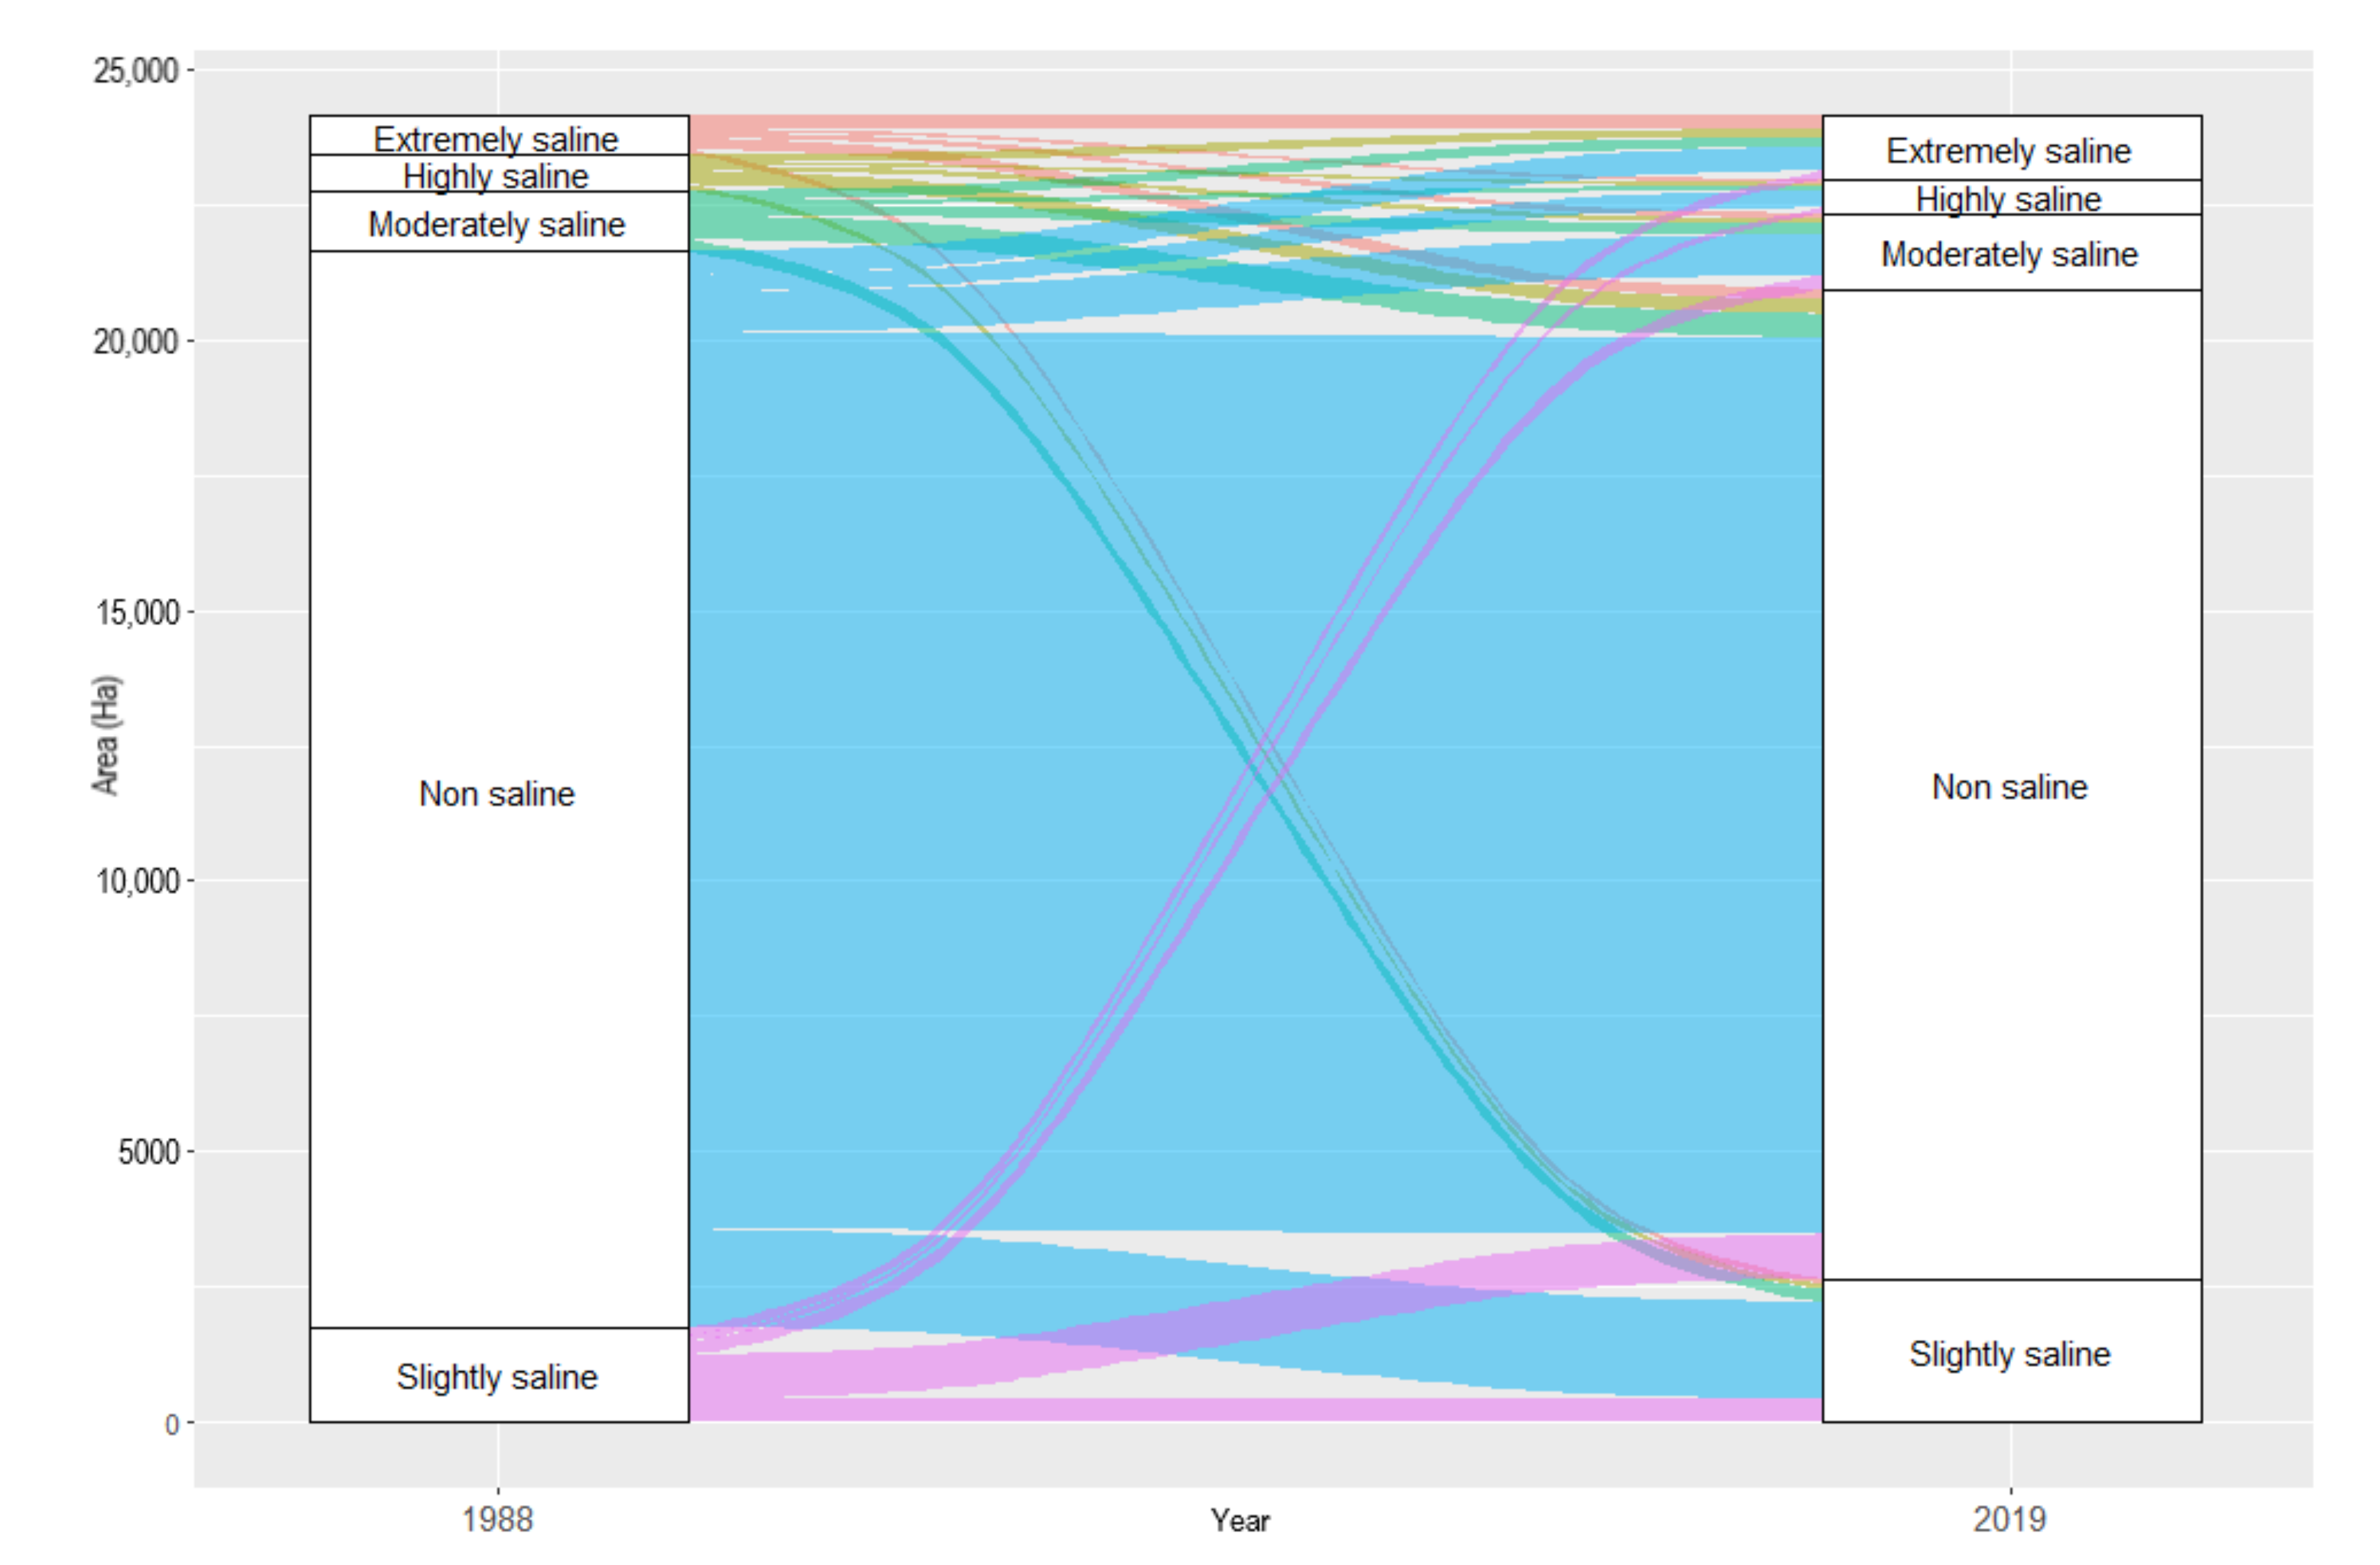
The dynamics of salinity category extent in Jaffna Peninsula over the 30 year period are presented in a Sankey diagram in Figure 5. The thicknesses of the stacked lines between two salinity classes are proportional to the magnitude of the changes in flows. The smaller the width, the less change occurred from one salinity class to other. The non-saline category is relatively stable through the 30 years. However, the substantial increase in the extremely saline soil salinity class can probably be largely attributed to conversion of non-saline (438 ha), followed by moderately saline (179 ha), slightly saline (162 ha) and highly saline (152 ha) classes. The conversion from non-saline soil to other salinity classes was prominent/most obvious, which led to the higher reduction of non-saline soil in 2019. Overall, salt-affected areas have increased significantly during the last 30 years in Jaffna Peninsula, largely due to expansion of extremely saline levels and associated reduction of non-saline and slightly saline classes.
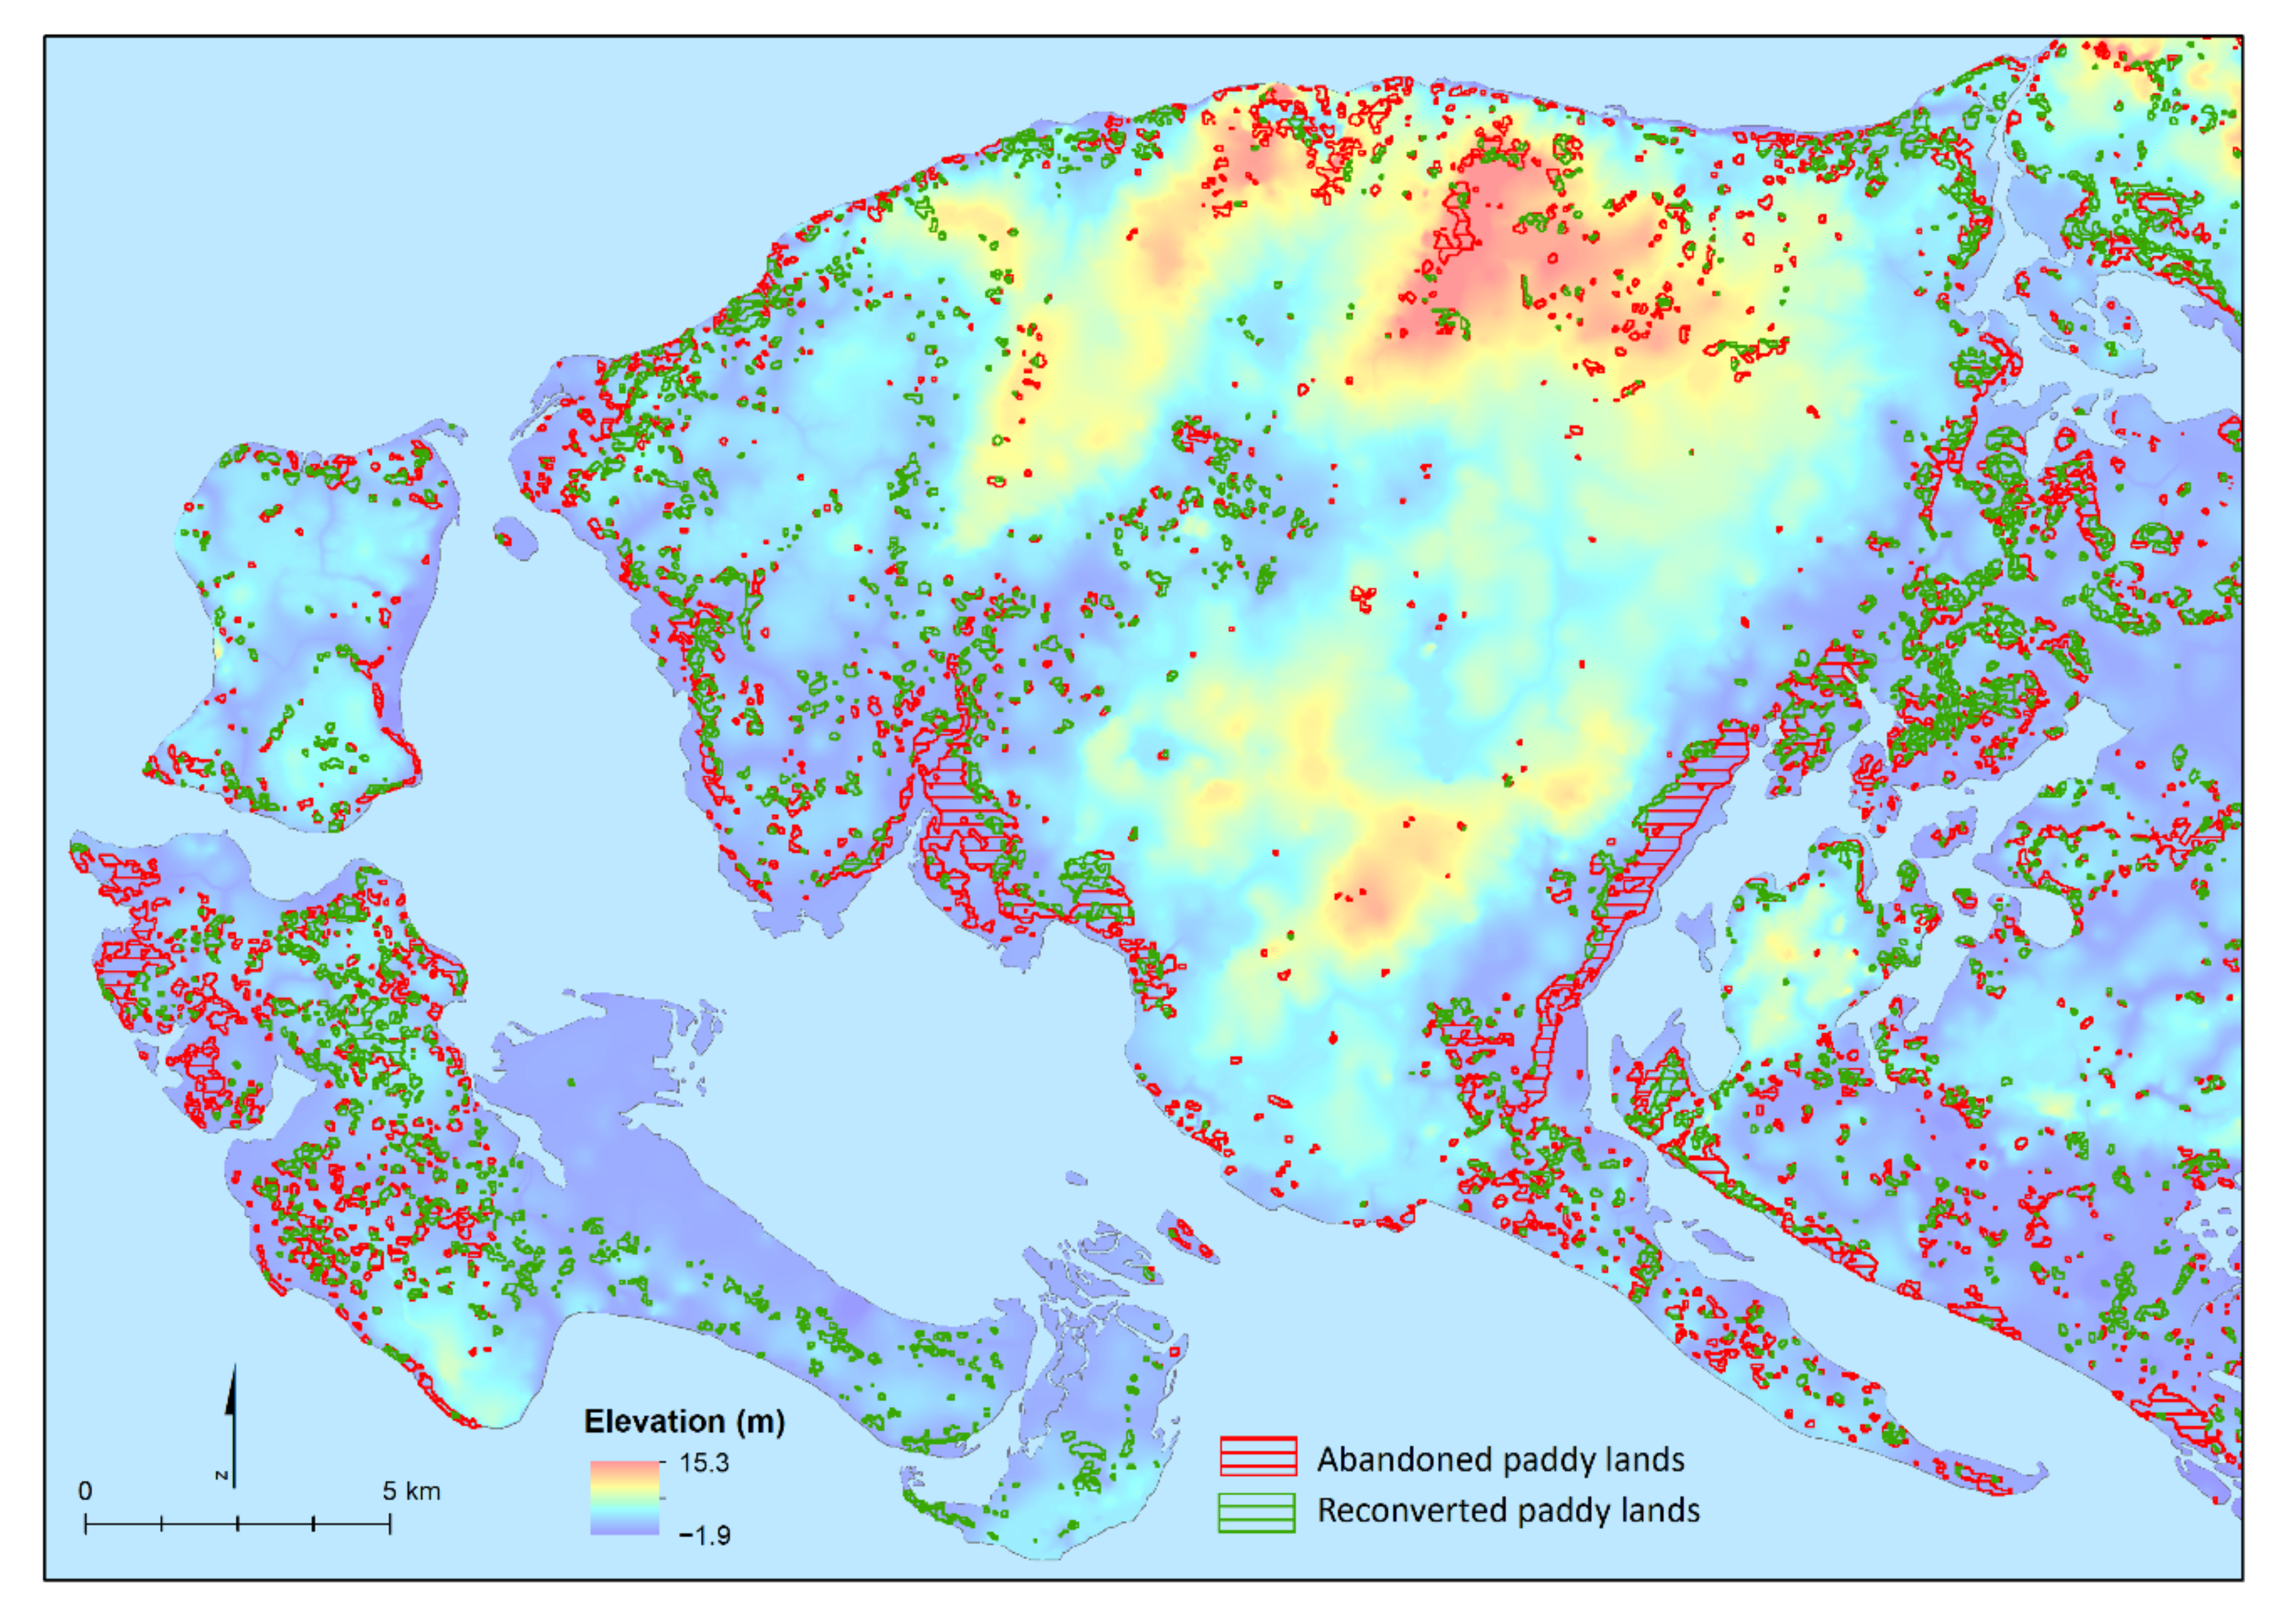
The permanently abandoned paddy land and reconverted paddy land were overlaid with the digital elevation model (DEM) of Jaffna Peninsula to understand the relationship between paddy land use change and elevation (Figure 6). Over the last three decades, nearly 8178 ha of paddy land has been permanently abandoned while 6036 ha of paddy land that was lost to other land uses was reconverted again to paddy subsequent to the civil war. Approximately 4961 ha (61%) of the permanent loss occurred in the paddy land distributed in the −1 to 1 masl elevation range, while 3160 ha (40%) paddy land has been lost permanently in the elevation range of −1 to 0.5 masl. The distribution of permanently abandoned paddy land shows a distinct pattern of decrease with elevation; however, no such clear trend can be observed with the reconverted paddy land distribution.
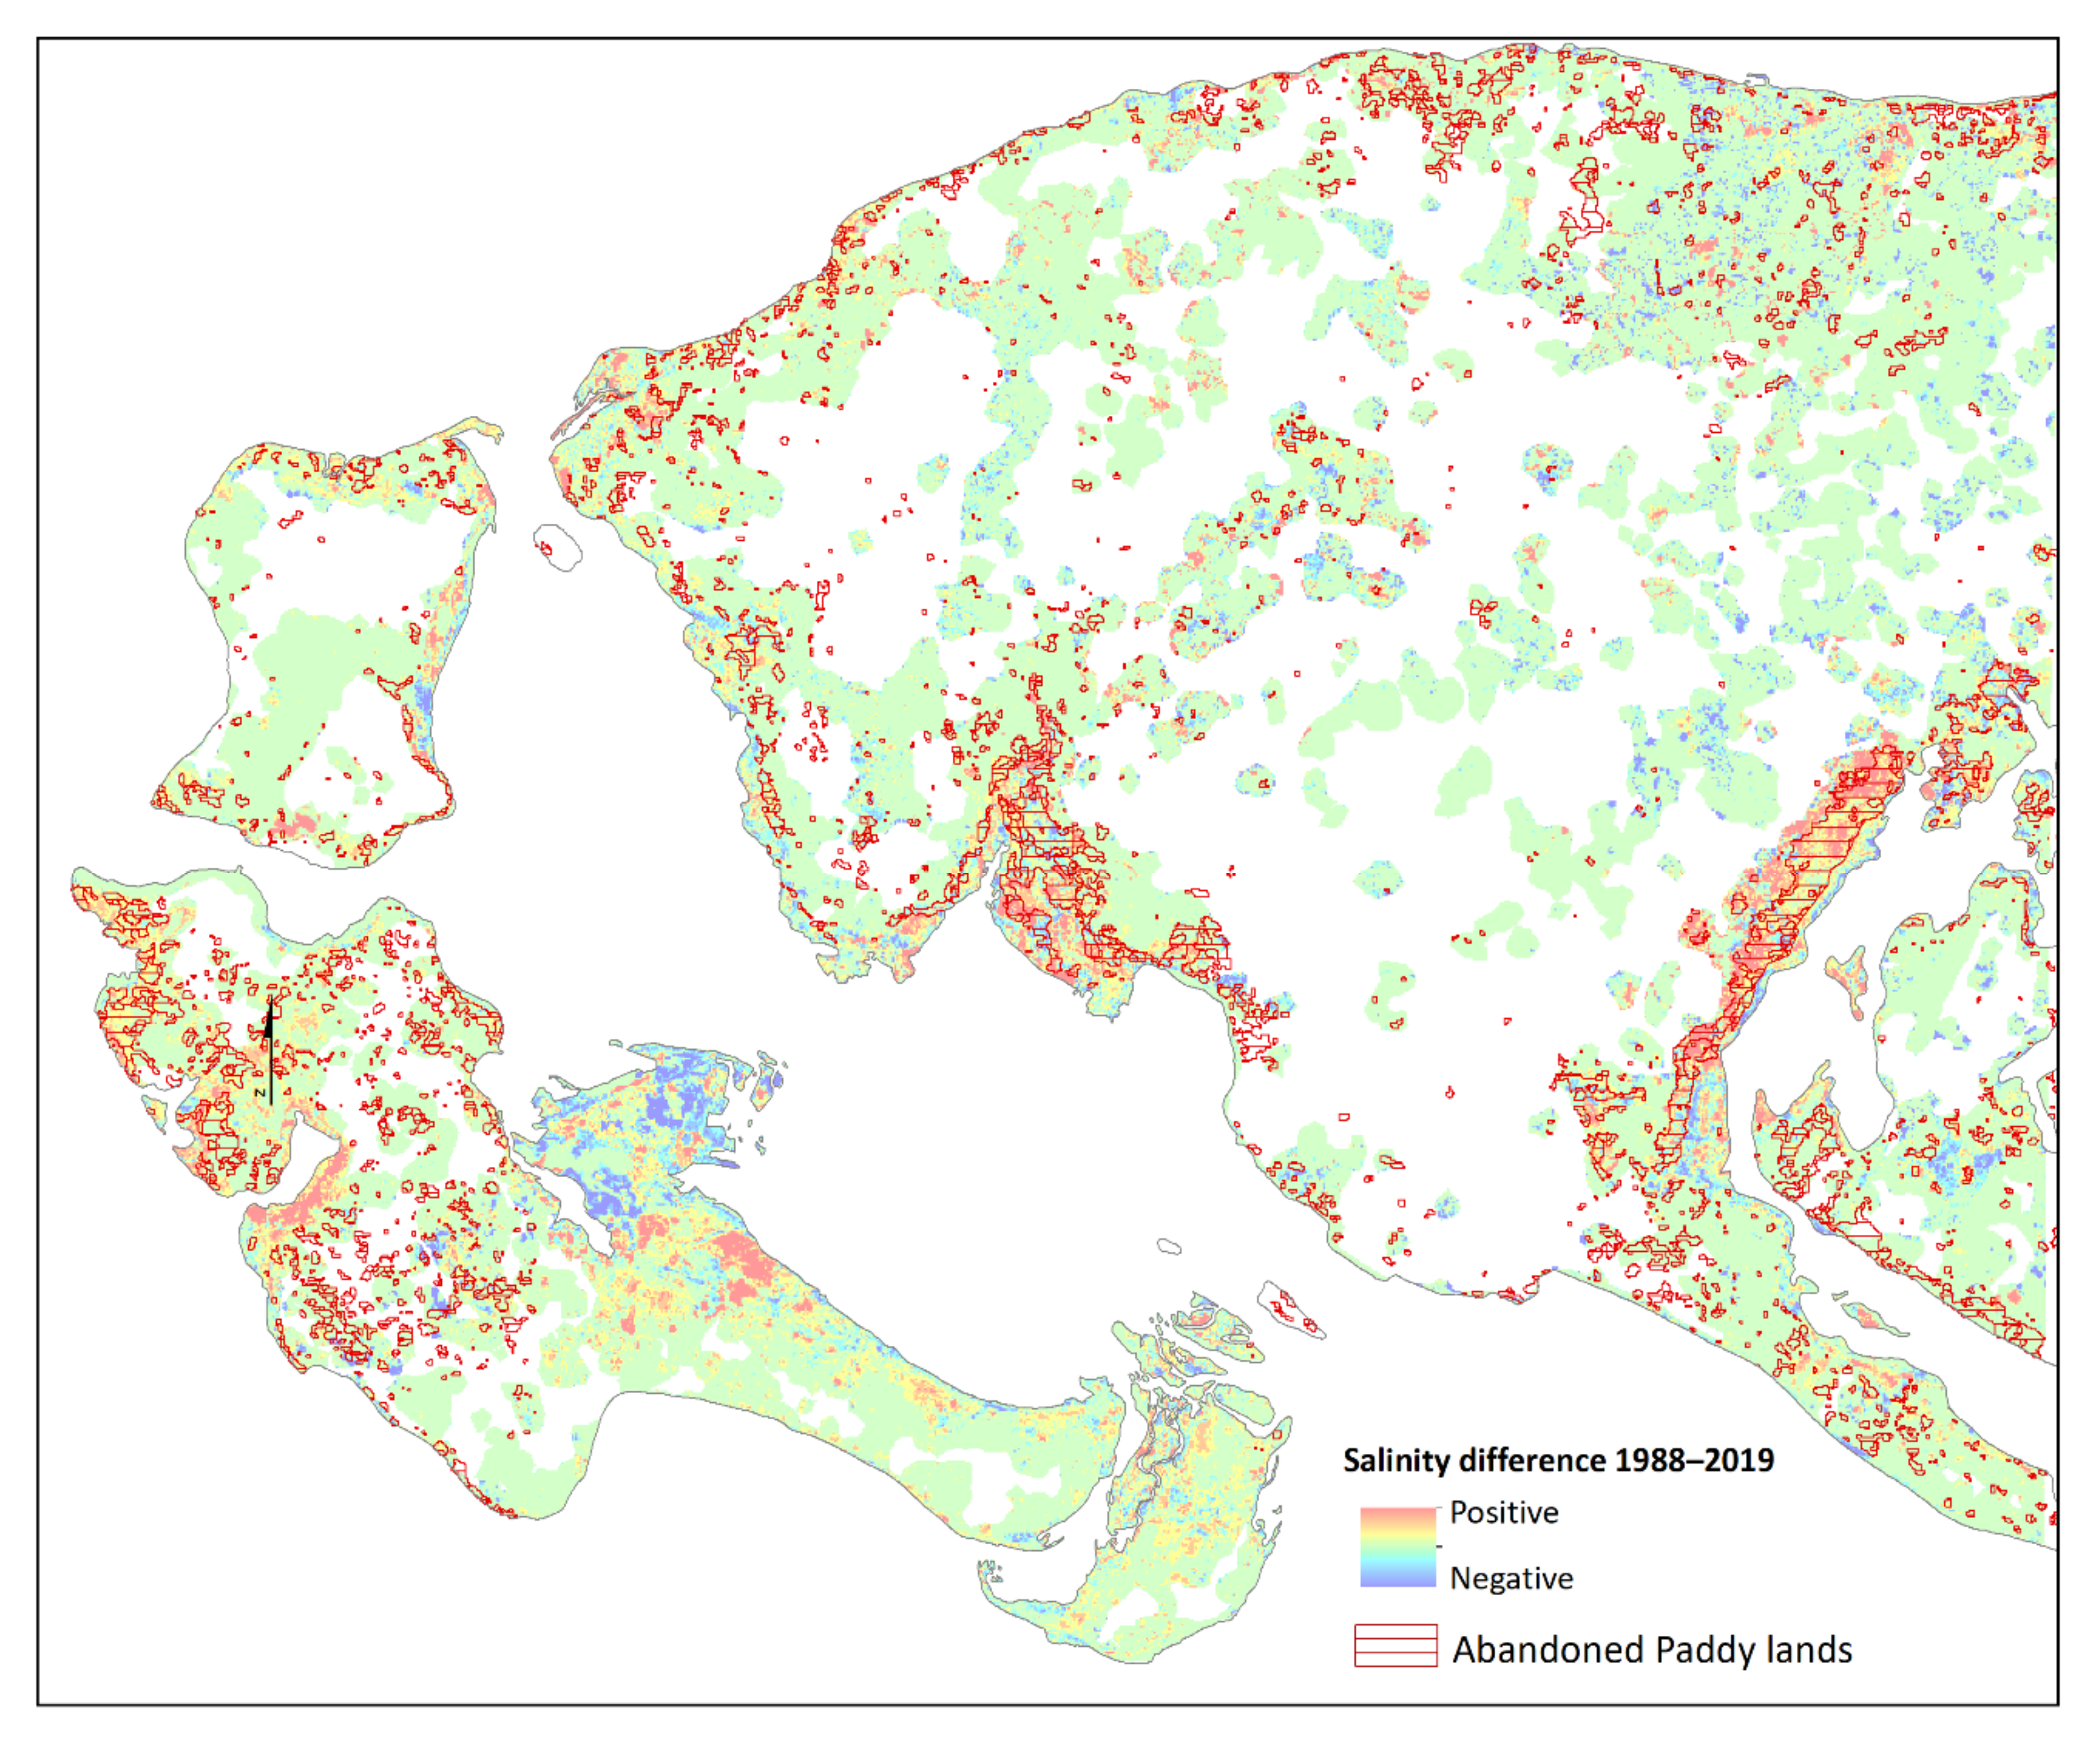
Figure 7 shows the difference image of salinity (EC) and the spatial distribution of permanently abandoned paddy lands. The results reveal a clear pattern of increased soil salinity coinciding with the permanent loss of paddy lands. Most of the permanently abandoned paddy lands are located in the areas showing an increase in salinity. This is further confirmed by performing an independent sample t-test between salinity (EC) values of 200 random points in each of the permanently abandoned paddy lands and active paddy lands. The results indicate that the soil salinity of permanently abandoned paddy lands (M = 2.71, SD =2.02) was significantly higher than the soil salinity of active paddy lands (M = 3.87, SD = 1.30), t (342.3) = 6.8, p < 0.01.
4. Discussion
This study was conducted to explore the soil salinity changes over the last 30 years and their link with permanently abandoned paddy lands in Jaffna Peninsula. Salinity dynamics of 1988 and 2019 of Jaffna Peninsula reveal that there has been a dramatic increase in salinity in terms of magnitude and extent. Salinity classes occupied areas of 82.3%, 7.3%, 4.7%, 2.8% and 3% for non-saline, slightly, moderate, high and extreme salinity levels, respectively, for 1988. These values for 2019 were 75.7%, 11%, 5.8%, 2.6% and 4.9%, respectively. The proportionally largest increase has occurred in the extremely saline category at the cost of non-saline (438 ha) and moderately saline (179 ha) classes. Non-saline soils also have been significantly attributed (1801 ha) to the increase of slightly saline soils. Such an extensive spread of salinity in soils, which were non-saline in 1988, requires urgent attention to prevent further land degradation due to salinity. Few inland regions of Jaffna Peninsula showed increased salinity. These localized pockets of salinity were observed in the low elevation areas (some below sea level) where accumulation of saline water in these regions increases the soil salinity quite rapidly.
Coastal regions, especially eastern and western lagoonal areas, tend to have more pervasively spread salinity. Salt-affected soils are located in all areas along the coastal lowlands with very low topography of below 2 masl and 0.3° slope. The majority of the land use class of these regions is paddy land. Significant changes have occurred in the Jaffna Peninsula over the last 30 years. In this period, a total of 8178 ha of paddy land has been permanently abandoned while 6036 ha paddy was temporarily abandoned (after 1988) but was later reconverted to paddy land. The majority of the reconverted paddy land was previously abandoned during 2004 to 2009, which was the last and peak phase of the civil war. The permanently abandoned paddy lands are mostly distributed within 1 km from the coast (60% of the total loss) and in low-lying areas below 1 m elevation (61% of loss). In addition, abandoned paddy lands overlaid on the salinity difference image show that there is a clear pattern of abandoned paddy lands concentrated more in the high salinity zones. Moreover, the t-test results for salinity also reaffirm that the salinity of abandoned paddy lands is significantly higher than the salinity of active paddy lands. Hence, these findings suggest that increased salinity in the paddy lands is the most likely factor that has resulted in the permanent loss of arable paddy lands. This result is supported by Allbed, Kumar and Aldakheel [26] and Bannari and Al-Ali [19] who found that a gradual increase in soil salinity significantly affects cultivation of agricultural crops.
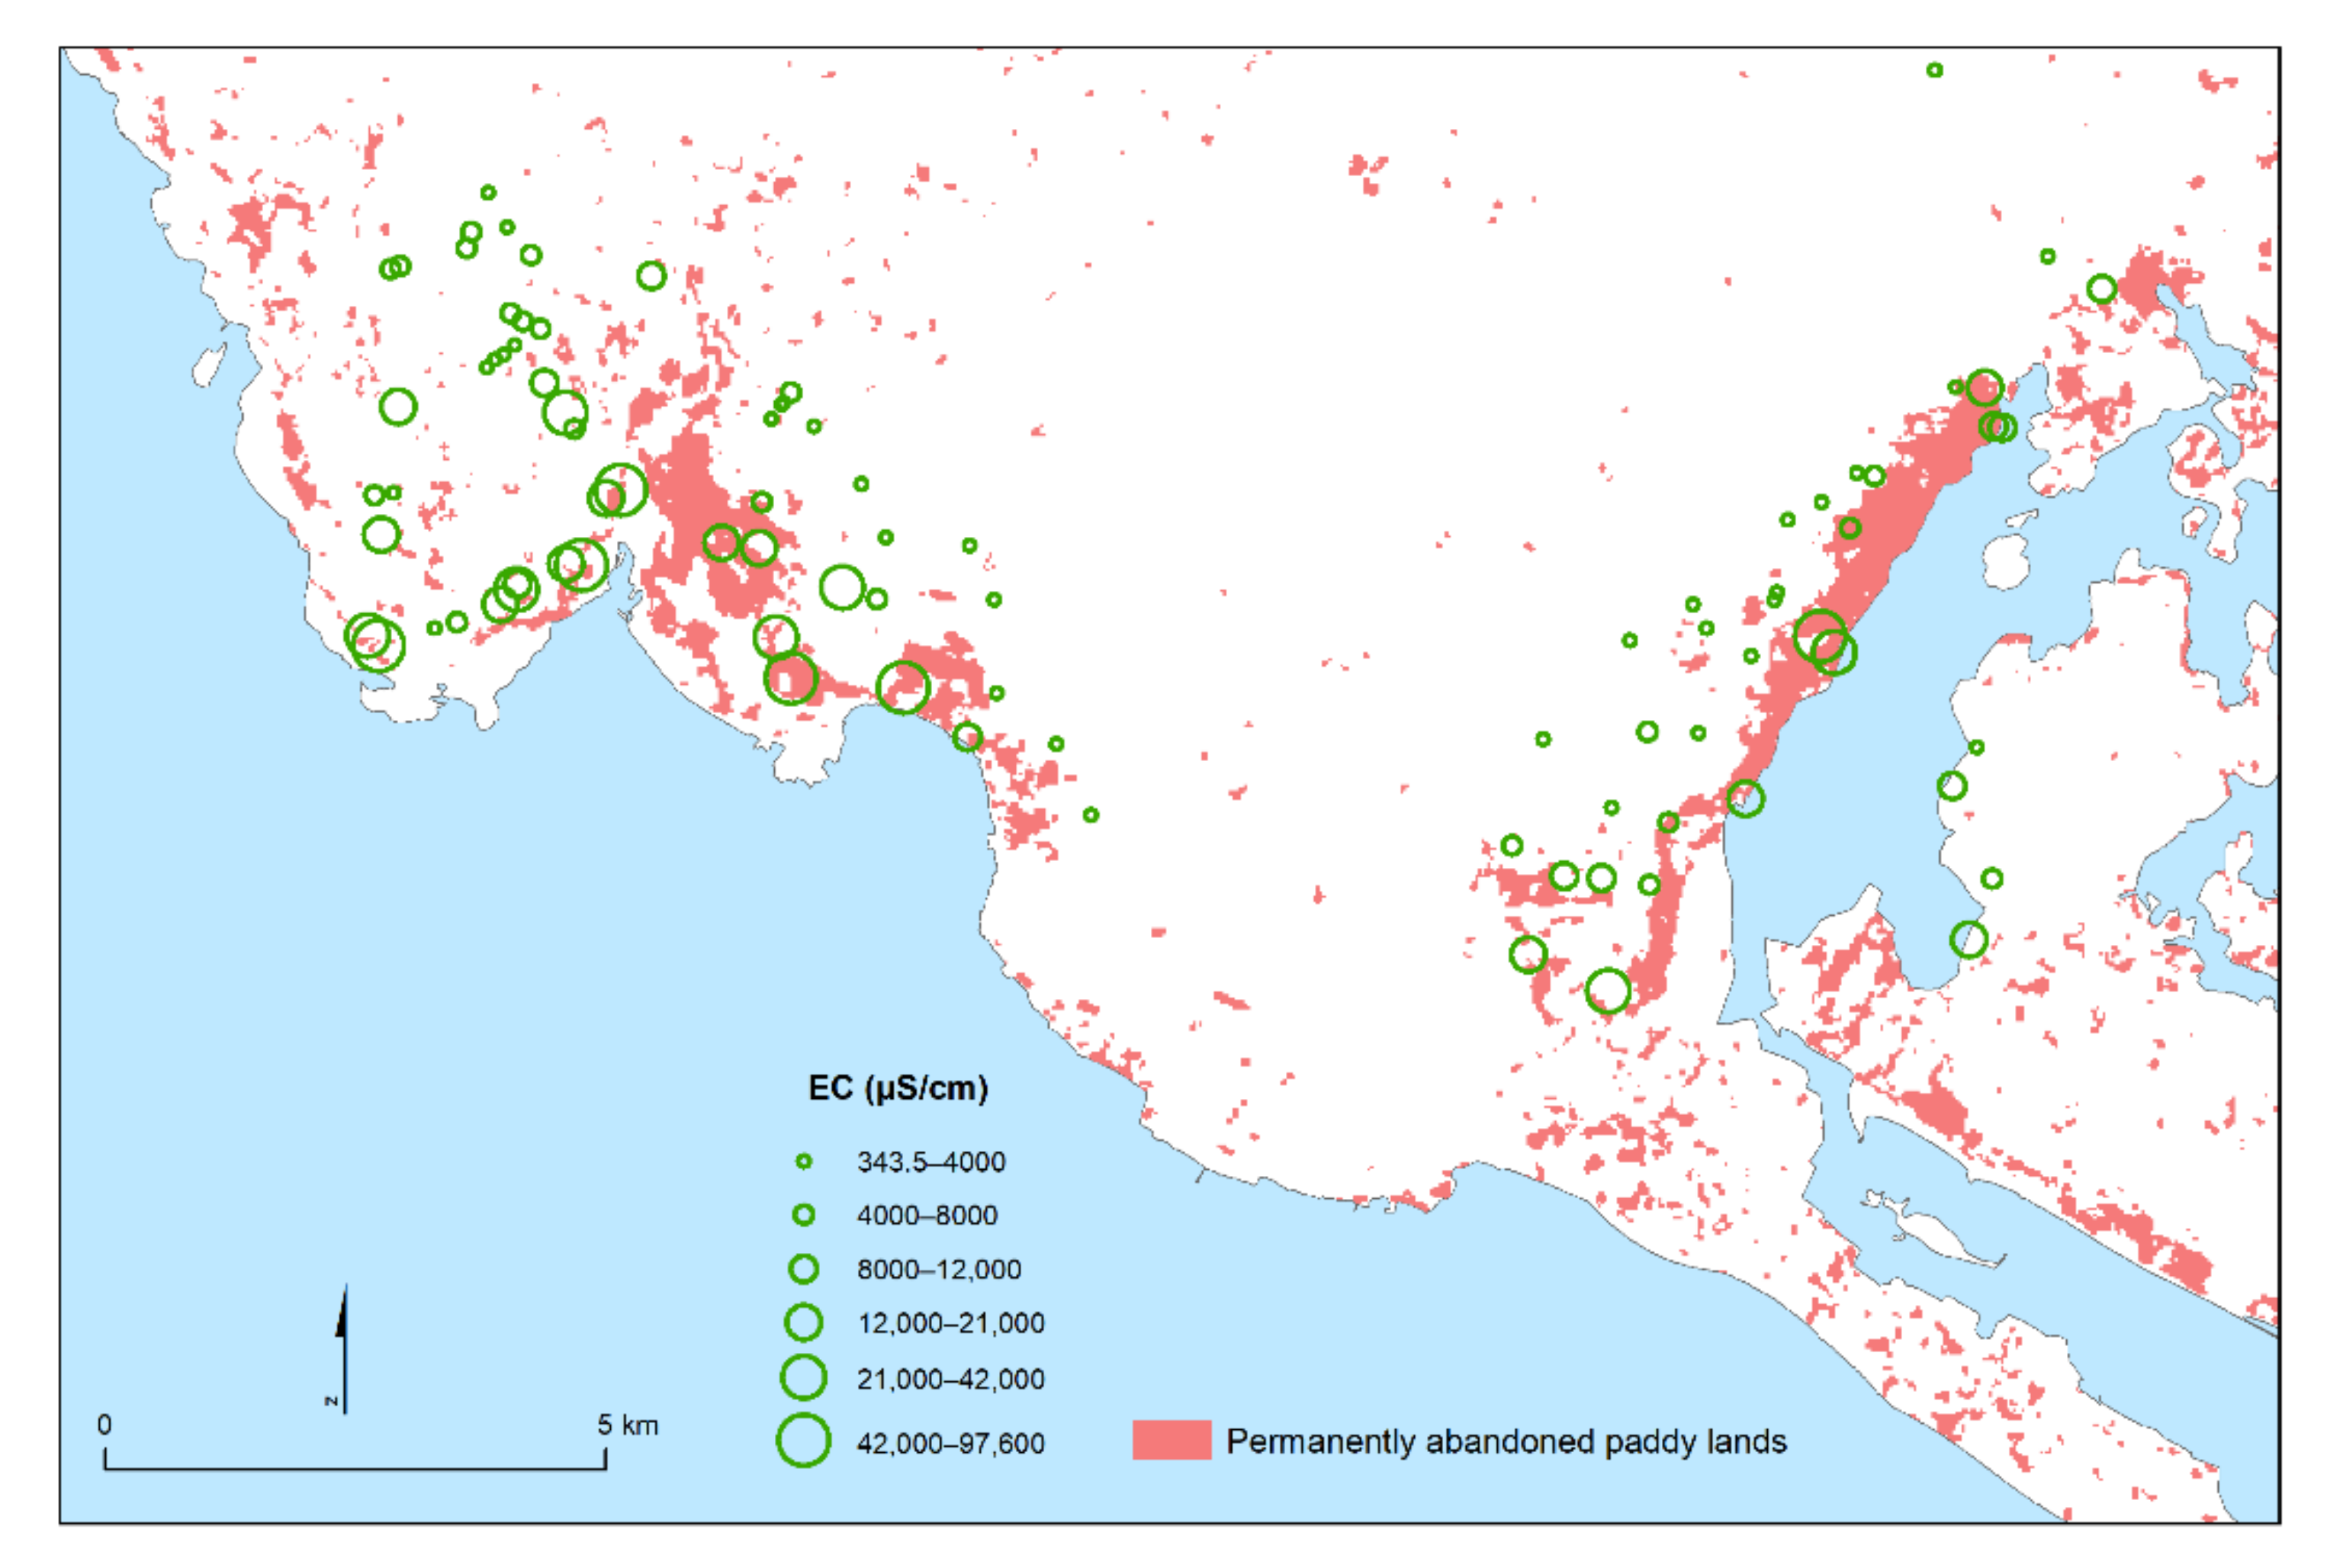
Our previous study Gopalakrishnan, Kumar and Mikunthan [8] analyzed the changes in coastal ground water salinity from 1999 to 2019. Those findings indicated that the groundwater salinity of Jaffna Peninsula had increased 1.6-fold over the last 20 years. A clear trend of increasing salinity was observed in the wells located close to the coastal shoreline and within or very adjacent to paddy lands that have been lost (Figure 8).
The increasing trend of soil salinity in Jaffna Peninsula is likely due to the combined aforementioned factors, such as seawater intrusion, inadequate drainage, excessive harvesting of groundwater and topography. Accumulation of salt could be induced by high evaporation due to hot and dry climate conditions in Jaffna Peninsula. Moreover, salt brought from the sea by local winds and tides also influences and accelerates salinization. The increasing coastal salinization issue is likely to get worse in future with unprecedented climate change and increasing population. In addition, Jaffna Peninsula, owing to its geographical location and topography, is already vulnerable to coastal hazards. The coastline on the eastern side of Jaffna Peninsula during the Northeast monsoon season is directly exposed to wave conditions [27]. The areas around the lagoons and the adjacent islands are classified as the most vulnerable to sea level rise in Sri Lanka. Based on sea level projections for 2100, a total of 10,630–36,786 ha of Jaffna Peninsula’s coastal paddy land area will be inundated across all four Representative Concentration Pathway (RCP) scenarios [12]. Hence, this research may underpin the spatial-temporal salinity mapping and the possible linkage between the salinity changes and agricultural land use change.
Although our previous PLSR model with Sentinel 2 imagery yielded relatively better accuracy due to its higher spatial resolution, the results of this study demonstrate that Landsat imagery also provides an acceptable degree of accuracy for estimation of soil salinity distribution with unparalleled advantages considering a multi-temporal study. The research presented here highlights the important role of soil salinization as a hindering factor in reconversion of land to paddy land. Sri Lanka has stringent land use policies in relation to the conversion of paddy land to other uses. Such policies protect against unplanned changes in paddy land use to promote agricultural sustainability and food security. Therefore, it is unlikely that urban expansion could be the driver of paddy land abandonment. We undertook a preliminary assessment of urban area extent changes using Google Earth Pro and concluded that the abandonment of paddy lands were not due to the minor changes in urban area expansion. While most of the paddy land abandoned permanently could be attributed to salinity issues, there could be other factors involved in this. Landowners may have migrated out of this region (either to other cities within Sri Lanka or overseas) and not returned after the war. However, one should note that in such circumstances the land is generally leased out to locals who farm it, so this factor would not be a large contributor.
5. Conclusions
Salinity is the most widespread degradation phenomenon in Jaffna Peninsula. The present study showed that the magnitude and extent of soil salinity in the coastal lowlands of Jaffna Peninsula have drastically increased over the last 30 years. Salinized soils have expanded by 1593 ha from 1988 to 2019. Approximately 8178 ha of arable paddy lands have been permanently lost over the last 30 years, mainly due to increasing soil salinity. Highly saline and extremely saline soils were most pronounced in the abandoned paddy areas. Salinity of these lost paddy areas was significantly higher than active paddy areas. Therefore, we can conclude that the major driving force of the paddy land abandonment is increasing accumulation of salts in the soil. The results of this study indicate that Landsat images have high potential for spatiotemporal monitoring of soil salinity for regional semi-arid regions like Jaffna Peninsula. The outcomes of this study are useful for land use planners and policy makers for identifying the areas at risk of salinization for land reclamation and to prevent further of loss of arable lands. The results are also a forewarning of potential food security issues in this region in the future if no preventative action is taken.
Author Contributions
Conceptualization, T.G. and L.K.; methodology, T.G. and L.K.; formal analysis, T.G.; data curation, T.G. and L.K.; writing—original draft preparation, T.G.; writing—review and editing, L.K.; supervision, L.K. Both authors have read and agreed to the published version of the manuscript.
Funding
This research received no external funding.
Data Availability Statement
Data is contained within the article.
Conflicts of Interest
The authors declare no conflict of interest.
References
- Shahid, S.A. Developments in soil salinity assessment, modeling, mapping, and monitoring from regional to submicroscopic scales. In Developments in Soil Salinity Assessment and Reclamation; Springer: Berlin/Heidelberg, Germany, 2013; pp. 3–43. [Google Scholar]
- Wang, W.; Vinocur, B.; Altman, A. Plant responses to drought, salinity and extreme temperatures: Towards genetic engineering for stress tolerance. Planta 2003, 218, 1–14. [Google Scholar] [CrossRef] [PubMed]
- Gopalakrishnan, T.; Hasan, M.K.; Haque, A.; Jayasinghe, S.L.; Kumar, L. Sustainability of Coastal Agriculture under Climate Change. Sustainability 2019, 11, 7200. [Google Scholar] [CrossRef] [Green Version]
- Tan, L.V.; Tran, T.; Loc, H.H. Soil and water quality indicators of diversified farming systems in a saline region of the Mekong Delta, Vietnam. Agriculture 2020, 10, 38. [Google Scholar] [CrossRef] [Green Version]
- Sutharsiny, A.; Pathmarajah, S.; Thushyanthy, M.; Meththika, M. Characterization of irrigation water quality of Chunnakam aquifer in Jaffna Peninsula. Trop. Agric. Res. 2012, 23, 237–248. [Google Scholar] [CrossRef] [Green Version]
- Mikunthan, T.; Vithanage, M.; Pathmarajah, S.; Ariyaratne, R.; Manthrithilake, H. Hydrogeochemical Characterization of Jaffna’s Aquifer Systems in Sri Lanka; International Water Management Institute (IWMI): Colombo, Sri Lanka, 2013; p. 69. [Google Scholar]
- Gopalakrishnan, T.; Kumar, L. Modeling and Mapping of Soil Salinity and its Impact on Paddy Lands in Jaffna Peninsula, Sri Lanka. Sustainability 2020, 12, 8317. [Google Scholar] [CrossRef]
- Gopalakrishnan, T.; Kumar, L.; Mikunthan, T. Assessment of Spatial and Temporal Trend of Groundwater Salinity in Jaffna Peninsula and Its Link to Paddy Land Abandonment. Sustainability 2020, 12, 3681. [Google Scholar] [CrossRef]
- Ghosh, B.; Md, N.A.; Gantait, S. Response of rice under salinity stress: A review update. Rice Res. Open Access 2016, 4, 1–8. [Google Scholar] [CrossRef] [Green Version]
- Castillo, E.G.; Tuong, T.P.; Ismail, A.M.; Inubushi, K. Response to salinity in rice: Comparative effects of osmotic and ionic stresses. Plant Prod. Sci. 2007, 10, 159–170. [Google Scholar] [CrossRef] [Green Version]
- Sood, A.; Manthrithilake, H.; Siddiqui, S.; Rajah, A.; Pathmarajah, S. Managing shallow aquifers in the dry zone of Sri Lanka. Environ. Monit. Assess. 2015, 187, 400. [Google Scholar] [CrossRef] [PubMed]
- Gopalakrishnan, T.; Kumar, L. Potential Impacts of Sea-Level Rise upon the Jaffna Peninsula, Sri Lanka: How Climate Change Can Adversely Affect the Coastal Zone. J. Coast. Res. 2020, 36, 951–960. [Google Scholar] [CrossRef]
- Gopalakrishnan, T.; Kumar, L.; Hasan, M.K. Coastal settlement patterns and exposure to sea-level rise in the Jaffna Peninsula, Sri Lanka. Popul. Environ. 2020, 42, 129–145. [Google Scholar] [CrossRef]
- Satyanarayana, B.; Van der Stocken, T.; Rans, G.; Kodikara, K.A.S.; Ronsmans, G.; Jayatissa, L.P.; Husain, M.-L.; Koedam, N.; Dahdouh-Guebas, F. Island-wide coastal vulnerability assessment of Sri Lanka reveals that sand dunes, planted trees and natural vegetation may play a role as potential barriers against ocean surges. Glob. Ecol. Conserv. 2017, 12, 144–157. [Google Scholar] [CrossRef]
- Mikunthan, G. Prospects on the Renewal of Agriculture-Driven Livelihood to Sustain Peace and Development in Northern Sri Lanka. In Post-War Recontruction in Sri Lanka: Prospects and Challenges; Herath, D., Hoglund, K., Schulz, M., Silva, K.T., Eds.; International Centre for Ethnic Studies: Kandy, Sri Lanka, 2010; pp. 183–206. [Google Scholar]
- Senanayake, S.; Premaratne, S. An analysis of the paddy/rice value chains in Sri Lanka. Asia-Pac. J. Rural Dev. 2016, 26, 105–126. [Google Scholar] [CrossRef] [Green Version]
- Nawar, S.; Buddenbaum, H.; Hill, J.; Kozak, J. Modeling and Mapping of Soil Salinity with Reflectance Spectroscopy and Landsat Data Using Two Quantitative Methods (PLSR and MARS). Remote Sens. 2014, 6, 10813–10834. [Google Scholar] [CrossRef] [Green Version]
- Nouri, H.; Chavoshi Borujeni, S.; Alaghmand, S.; Anderson, S.J.; Sutton, P.C.; Parvazian, S.; Beecham, S. Soil salinity mapping of urban greenery using remote sensing and proximal sensing techniques; the case of Veale Gardens within the Adelaide Parklands. Sustainability 2018, 10, 2826. [Google Scholar] [CrossRef] [Green Version]
- Bannari, A.; Al-Ali, Z.M. Assessing climate change impact on soil salinity dynamics between 1987–2017 in arid landscape using Landsat TM, ETM+ and OLI data. Remote Sens. 2020, 12, 2794. [Google Scholar] [CrossRef]
- Didi, S.; Housni, F.E.; del Toro, H.B.; Najine, A. Mapping of soil salinity using the Landsat 8 image and direct field measurements: A case study of the tadla plain, Morocco. J. Indian Soc. Remote Sens. 2019, 47, 1235–1243. [Google Scholar] [CrossRef]
- Abuelgasim, A.; Ammad, R. Mapping soil salinity in arid and semi-arid regions using Landsat 8 OLI satellite data. Remote Sens. Appl. Soc. Environ. 2019, 13, 415–425. [Google Scholar] [CrossRef]
- Punyawardena, R.; Dissanaike, T.; Mallawatantri, A. Spatial Variation of Climate Change Induced Vulnerability in Sri Lanka: An of the Components of Vulnerability at District Level; Department of Agriculture: Peradeniya, Sri Lanka, 2013. [Google Scholar]
- District Secretariat. Statistical Hand Book, Jaffna District 2018: Sri Lanka. 2019. Available online: http://103.11.32.18/jaffna/jaffna/images/download_applications/statistical-hand-book-2019-min.pdf (accessed on 1 January 2021).
- Brown, J.W.; Hayward, H.E.; Richards, A.; Bernstein, L.; Hatcher, J.T.; Reeve, R.C.; Richards, L.A. Diagnosis and Improvement of Saline and Alkali Soils; Handbook, No. 60; United States Department of Agriculture: Washington, DC, USA, 1954.
- USGS. Landsat Collection 1 Level 1 Product Definition; Department of the Interior U.S. Geological Survey: Sioux Falls, SD, USA, 2017.
- Allbed, A.; Kumar, L.; Aldakheel, Y.Y. Assessing soil salinity using soil salinity and vegetation indices derived from IKONOS high-spatial resolution imageries: Applications in a date palm dominated region. Geoderma 2014, 230, 1–8. [Google Scholar] [CrossRef]
- Ratnasooriya, A. Investigations on Coastal Environment and Fisheries Infrastructure in Jaffna Peninsula. In Proceedings of the Sri Lanka Association for the Advancement of Science Proceedings of the 71st Annual Sessions, Colombo, Sri Lanka, 30 November–4 December 2015. [Google Scholar]
Figure 1.
(a) Abandoned paddy lands in Jaffna Peninsula. (b) Whitish salt crust on the surfaces of paddy lands affected by salinity. The salt crust causes burning and death of rice crops.
Figure 1.
(a) Abandoned paddy lands in Jaffna Peninsula. (b) Whitish salt crust on the surfaces of paddy lands affected by salinity. The salt crust causes burning and death of rice crops.

Figure 2.
(a) Location of study area and spatial distribution of soil samples overlaid on digital elevation model (DEM); (b) slope map; (c) soil map; (d) land-use map of the study area.
Figure 2.
(a) Location of study area and spatial distribution of soil samples overlaid on digital elevation model (DEM); (b) slope map; (c) soil map; (d) land-use map of the study area.

Figure 3.
Salinity distribution maps for 1988 and 2019.

Figure 4.
Changes in salt-affected areas per salinity class from 1988 to 2019.

Figure 5.
Sankey diagram for comparison of salt-affected land dynamics from salinity distribution maps for the years 1988 and 2019 in Jaffna Peninsula.
Figure 5.
Sankey diagram for comparison of salt-affected land dynamics from salinity distribution maps for the years 1988 and 2019 in Jaffna Peninsula.

Figure 6.
Permanently abandoned paddy lands and reconverted paddy lands overlaid on DEM.

Figure 7.
Permanently abandoned paddy lands overlaid on salinity difference image.

Figure 8.
Groundwater salinity levels in selected wells overlaid on the permanently abandoned paddy lands for 2019 in Jaffna Peninsula. Adapted from Gopalakrishnan, Kumar and Mikunthan [8].
Figure 8.
Groundwater salinity levels in selected wells overlaid on the permanently abandoned paddy lands for 2019 in Jaffna Peninsula. Adapted from Gopalakrishnan, Kumar and Mikunthan [8].


Table 1.
Landsat data sources.
| Satellite | Sensor | Date of Acquisition |
|---|---|---|
| Landsat 5 | TM | 31 July 1988 |
| Landsat 8 | OLI | 9 October 2019 |
Table 2.
Covariates used for generating salinity maps.
| Covariates | Description |
|---|---|
| Blue band | For OLI data: 450–510 nm, for TM data: 450–520 nm) |
| Near-infrared band (NIR) | For OLI data: 850–880 nm, for TM data: 760–900 nm) |
| Short-wave infrared band 1 | For OLI data: 157–165 nm, for TM data: 155–175 nm) |
| Short-wave infrared band 2 | For OLI data: 211–229 nm, for TM data: 208–235 nm) |
| Salinity Index 3 | |
| Salinity Index 5 | |
| Salinity Index 6 | |
| Salinity Index 7 | |
| Salinity Index 9 | |
| Normalized Difference Salinity Index (NDSI) | |
| Elevation (m) | Digital elevation model (DEM) |
Table 3.
Classification of soil salinity based on electrical conductivity (EC) and crop responses.
| Salinity Level | EC (dS m−1) | Impact on Crops |
|---|---|---|
| Non-saline | ≤2 | Not affected |
| Slightly saline | 2–4 | Yields of sensitive crop affected |
| Moderately saline | 4–8 | Yields of many crops affected |
| Highly saline | 8–16 | Only tolerant crops yield satisfactorily |
| Extremely saline | >16 | Only very tolerant halophytes grow |
Publisher’s Note: MDPI stays neutral with regard to jurisdictional claims in published maps and institutional affiliations. |
© 2021 by the authors. Licensee MDPI, Basel, Switzerland. This article is an open access article distributed under the terms and conditions of the Creative Commons Attribution (CC BY) license (http://creativecommons.org/licenses/by/4.0/).
Share and Cite
MDPI and ACS Style
Gopalakrishnan, T.; Kumar, L. Linking Long-Term Changes in Soil Salinity to Paddy Land Abandonment in Jaffna Peninsula, Sri Lanka. Agriculture 2021, 11, 211. https://0-doi-org.brum.beds.ac.uk/10.3390/agriculture11030211
AMA Style
Gopalakrishnan T, Kumar L. Linking Long-Term Changes in Soil Salinity to Paddy Land Abandonment in Jaffna Peninsula, Sri Lanka. Agriculture. 2021; 11(3):211. https://0-doi-org.brum.beds.ac.uk/10.3390/agriculture11030211
Chicago/Turabian StyleGopalakrishnan, Tharani, and Lalit Kumar. 2021. "Linking Long-Term Changes in Soil Salinity to Paddy Land Abandonment in Jaffna Peninsula, Sri Lanka" Agriculture 11, no. 3: 211. https://0-doi-org.brum.beds.ac.uk/10.3390/agriculture11030211
Note that from the first issue of 2016, this journal uses article numbers instead of page numbers. See further details here.