Article

Regional Differences of Agricultural Land Market in Slovakia: A Challenge for Sustainable Agriculture

1
Department of Law, Slovak University of Agriculture in Nitra, 94976 Nitra, Slovakia
2
Department of European Policies, Slovak University of Agriculture in Nitra, 94976 Nitra, Slovakia
3
Laboratory of Economics and Agribusiness Advisory, Department of Agronomy, Faculty of Agriculture and Biotechnology, UTP University of Science and Technology in Bydgoszcz, 430 Fordońska St., 85-790 Bydgoszcz, Poland
4
Department of Environmental Management, Slovak University of Agriculture in Nitra, 94976 Nitra, Slovakia
*
Author to whom correspondence should be addressed.
Submission received: 27 February 2021 / Revised: 9 April 2021 / Accepted: 12 April 2021 / Published: 15 April 2021

Abstract

:
The agricultural land market and its legal and political limitations play an important role in sustainable agricultural production. This study analyzed the agricultural land market in particular regions of Slovakia in terms of the sustainability of agricultural production. We focused on the development of proposed land prices between 2014 and 2018 to find out whether the prices proposed by landowners align with administrative land prices reflecting the soil quality in particular regions of Slovakia, or whether they are influenced by the proposed land prices of neighboring regions. Moreover, we focused on the existence of regional differences in proposed land prices in Slovakia, including differences in supply prices of arable land and permanent grasslands in particular regions. Statistical induction tools, together with multiple range tests and spatial autocorrelation, were used to confirm or refuse our expectations. We confirmed statistically significant differences in proposed land prices between regions. Moreover, we found that landowners are only influenced by the proposed land prices of their neighboring regions to a slight degree. However, we found that the price scissors between proposed land prices and administrative land prices open towards smaller administrative land prices, meaning that land of poorer fertility is supplied at a higher price than land of the best soil quality. There is a risk that expensive and poorer land plots will be used by investors for non-agricultural purposes, and agricultural production will be crowded out from these regions. Therefore, we propose that changes to the prepared legislative measures are necessary in order to promote the sustainability of agricultural production in all regions of the country.

1. Introduction

Agricultural land is a limited natural resource and an increasingly valuable economic asset. It is an essential component of national sovereignty [1]. Land markets have implications for welfare and social issues [2]. An efficient and effective land market can improve the performance of a nation’s economy and increase prosperity [3]. However, the land market is not able to ensure land protection and land management [4]. Agricultural land cannot be left to market laws alone because land supply does not respond to prices like ordinary goods [1]. Therefore, the agricultural land market is subject to significant policy interventions related to ownership or tenure regulations, subsidy policies and environmental regulations [5]. Land regulations have a major impact on economic development, especially in agrarian societies, and they continue to affect the efficiency of the rural economy when economies develop further [6]. Land markets are generally regulated through land administration systems and land tenure [3], including land leasing [7]. In the absence of an in-depth understanding of land tenure arrangements, it will prove difficult, if not impossible, to identify the processes involved in the determination, recording and dissemination of information about tenure arrangements, which are required forprovision of the services needed to ensure the requisite security of tenure, markets, planning, taxation and management of resources [8].
In Slovakia, the agricultural land market has been developing since 2000 [9]. Land markets have been strongly affected by EU accession because when the new member states acceded to the EU, agricultural subsidies were significantly increased and were, at least partially, capitalized into land prices. Moreover, before EU accession, many new member states feared that when they opened their markets and integrated into the EU single market, farmers from the former EU-15 member states would benefit from the opportunity to buy cheap agricultural land in the new member states, crowding out all investment opportunities for local farmers [10]. Land reforms introduced in the 1990s during the transformation process led to land being restituted to the former (private) owners or their heirs [11]. However, extensive land fragmentation and non-transparent landownership were the main barriers to land market development [12]. Moreover, the period of socialism taught landowners that the land had to be cultivated only in agricultural cooperatives and state enterprises to benefit society. Still, private land ownership did not bring them any benefit, and land ownership was only a burden. After the year 2000, Slovakia began preparing to access the EC and EU. The agricultural land market was one of the questions related to the transition period, during which foreigners, including foreigners from the EU, were not allowed to buy agricultural land in Slovakia [13]. It became of interest to know the value of a land asset. Moreover, the Common Agricultural Policy motivated economically strong farms to strengthen their position in the agricultural market and extend their land area [14] because agricultural subsidies were significantly increased and were, at least partially, capitalized into land prices [10].The price of farmland in the EU is a significant factor in sustainable development of agriculture [15], although agricultural land sales represent only a small fraction of all land transactions in the EU [16], including the Slovak republic. However, agricultural land market research has developed slowly in Slovakia because of missing “transparent” data on land transactions. There are some publications related to land market transactions and land market prices [9,12,17]; however, these cover only 12 of the 79 districts in Slovakia. The deficit in land market data was partially eliminated by Act No. 140/2014 Coll. on the acquisition of ownership of agricultural land, amending and supplementing specific laws (hereinafter referred to as the act on land acquisition). This act introduced the obligation that anyone who wanted to sell their land must publish his or her supply in the register of land supplies held by the Ministry of Agriculture and Rural Development of the Slovak Republic. These land supplies were published in the register in the period 2014–2018. In 2019, the most crucial part of this act was abolished, including the obligation to publish land supplies in the register. However, the register enabled us to research land supplies across the whole country. An analysis of regional differences was necessary due to the different natural and biophysical parameters of particular regions in Slovakia. Such regional differences enabled us to find anomalies in the land market which would have been hidden if the analyses were carried out at country level and not at the level of smaller spatial units. The regional analysis enabled us to consider the needs of farmers in the agricultural land market across various regions, which need to be reflected in legislative instruments to ensure the sustainability of Slovak agriculture in the context of European agricultural policy. The need for a more in-depth analysis of the agricultural land market at regional level has been confirmed by various studies [18,19,20].
This study analyzed the agricultural land market in particular regions of Slovakia towards sustainability of agricultural production. We focused on the development of proposed land prices between 2014 and 2018, to find out whether the prices proposed by landowners align with administrative land prices reflecting the soil quality in particular regions of Slovakia, or whether they are influenced by the proposed land prices of neighboring regions. Moreover, we focused on the existence of regional differences in proposed land prices in Slovakia, including differences in the price of arable land and permanent grasslands in particular regions. In addition, we propose that changes to the prepared legislative measures are necessary in order to promote the sustainability of agricultural production in all regions of the country.

2. Materials and Methods

In 2014, the act on land acquisition was adopted, with the obligation to publish land supplies in the Ministry register. During the period 2014–2018, we found 28,078 transactions relating to the supply of land recorded in the register; of these, 27,567 land supplies related to arable land and permanent grasslands. The rest of the transactions relating to the supply of land were gardens, vineyards, hopgroves and fruitgroves. These only constituted 1.82% of all land supplies; therefore, they were excluded from further analysis.
We used general scientific methods to ascertain regional differences in agricultural land supplies (supply land quantity and proposed land prices). Descriptive statistics and parametric methods of statistical induction were used (mainly t-tests, such as paired two sample for means; two-sample tests assuming unequal or equal variances depended on the results of the F-test two sample for variances).
In addition, regional differences in the proposed land prices were considered. A non-parametric test was used to assess the statistically significant differences because we did not have a normal distribution for the dataset to use for analysis of variance. The Kruskal-Wallis test describes as follows:
H = ( 12 N ( N + 1 ) ·   j = 1 k R j 2 n j ) 3 · ( N + 1 ) .
where H is the Kruskal-Wallis test characteristics, N is the total number of land supplies (all regions combined), Rj is the rank total for each region, nj is the number of land supplies in each region and k is the number of regions
Additionally, identification of pairs of regions with statistically significant differences was conducted using the Duncan’s Multiple Range test, for comparison of the results included in the Statgraphics Plus program. Duncan’s Multiple Range test (DMRT) is a post hoc test to measure specific differences between pairs of means. It involves the computation of numerical boundaries that calculate the difference between any two observation means as significant or non-significant. This requires a calculation of a series of values, each corresponding to a specific set of pair comparisons. The Duncan test is based on arranging the averages by size and comparing the differences between the two average values of the objects included in the relevant group and confirms a statistically significant difference between the two values if the following relation applies:
| y ¯ i . y j . ¯ | D α s r 2 n
where Dα is the Duncan test’s critical value for a given number of differences and at the residual degree of freedom, n is the total number of observations, sr is the standard error of the mean difference   and   | y ¯ i . y j . ¯ | is the distance in rank between the pairs of treatment means to be compared; the means of the two groups being compared.
To evaluate the spatial autocorrelation, the global Moran I index and Moran scatter plots were used. Moran’s I index is calculated on a variable x for observations n at locations i and j:
I = n S 0 i i w i j ( x i x ¯ ) ( x j x ¯ ) i ( x i x ¯ ) 2 .
where x ¯ is the mean of the variable x, wij is the weight matrix elements and S0 is the sum of the weight matrix elements calculated as S0 = ΣiΣjwij.
The weight matrix defines relationships between locations where a measurement is made. We used the binary weights. Moran’s I index ranges from −1 to +1. Moran’s I index is near to zero when autocorrelation is missing. If Moran’s I index tends towards +1, it indicates positive spatial autocorrelation. If Moran’s I index is near to −1, negative autocorrelation is probably high [21]. Moran’s I index is preferable and is used more frequently than other spatial autocorrelation indexes [22,23,24].
This study also used agricultural land data by NUTS III region (Nomenclature of territorial units for statistics according to Regulation No. 1059/2003 of the European Parliament and of the Council of 26 May 2003 on the establishment of a common classification of territorial units for statistics) for the years 2014–2018 from the Geodesy, Cartography and Cadastre Authority of the Slovak Republic [25,26,27,28,29].

3. Results

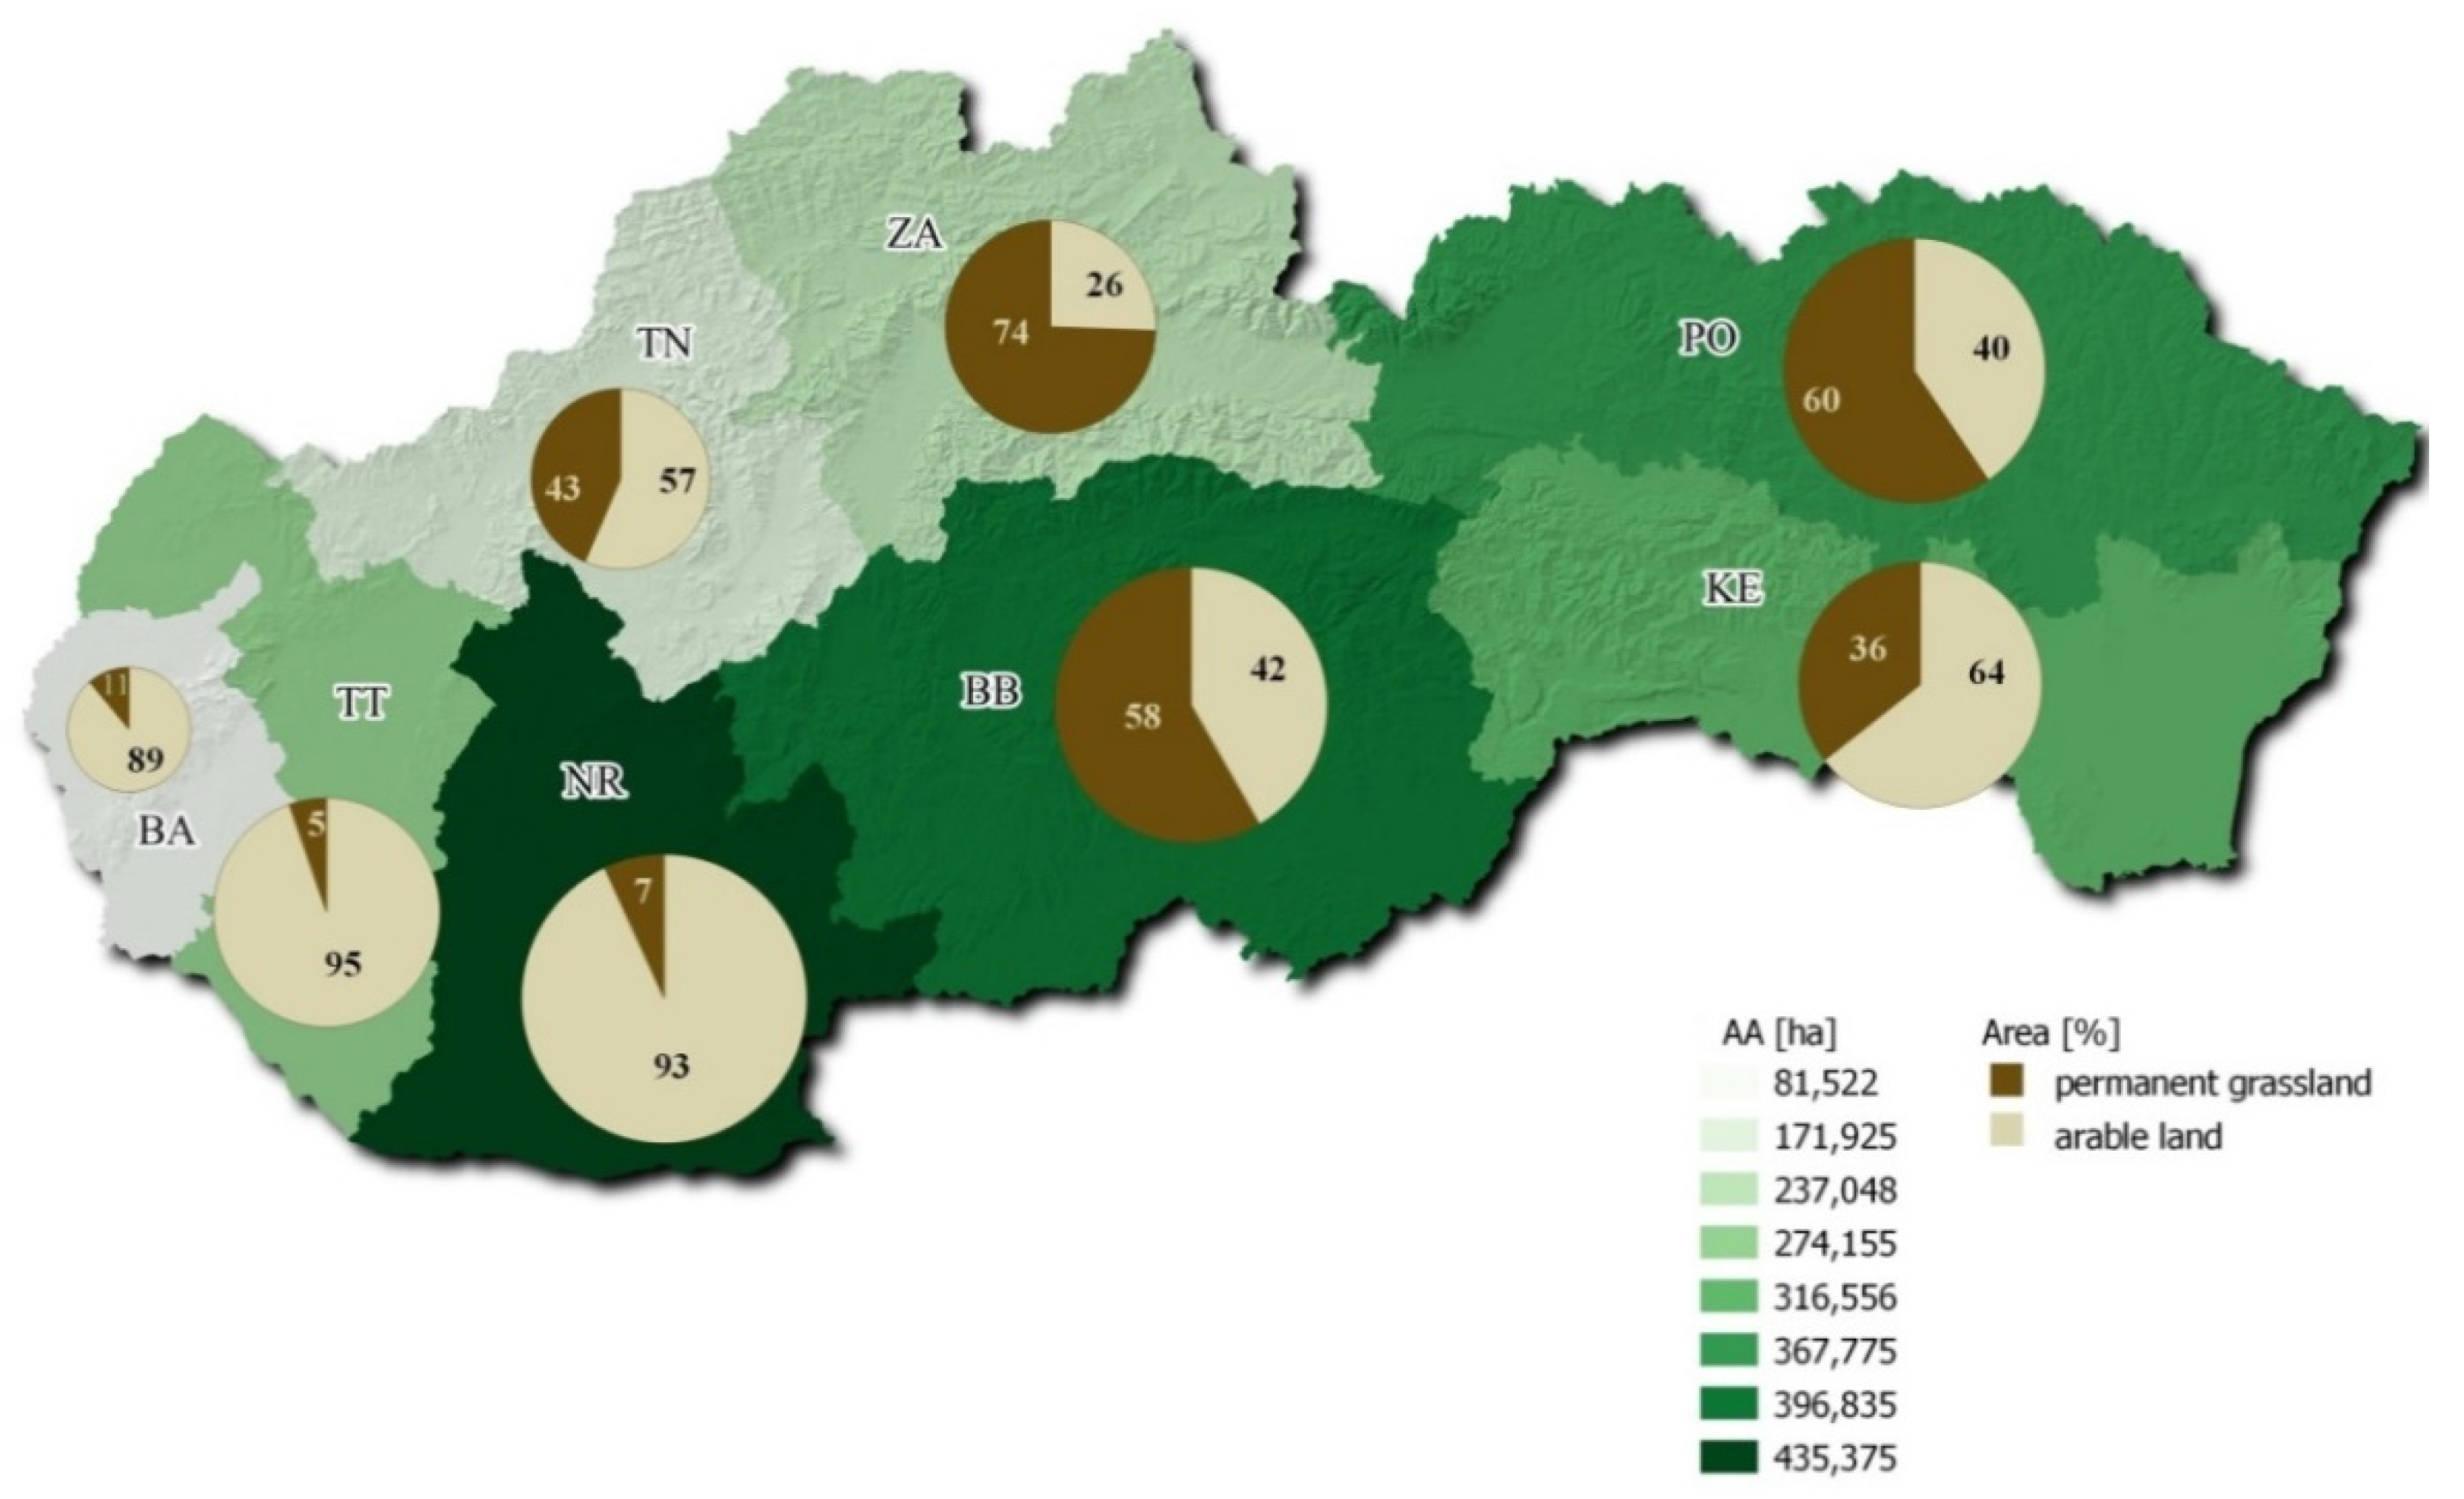
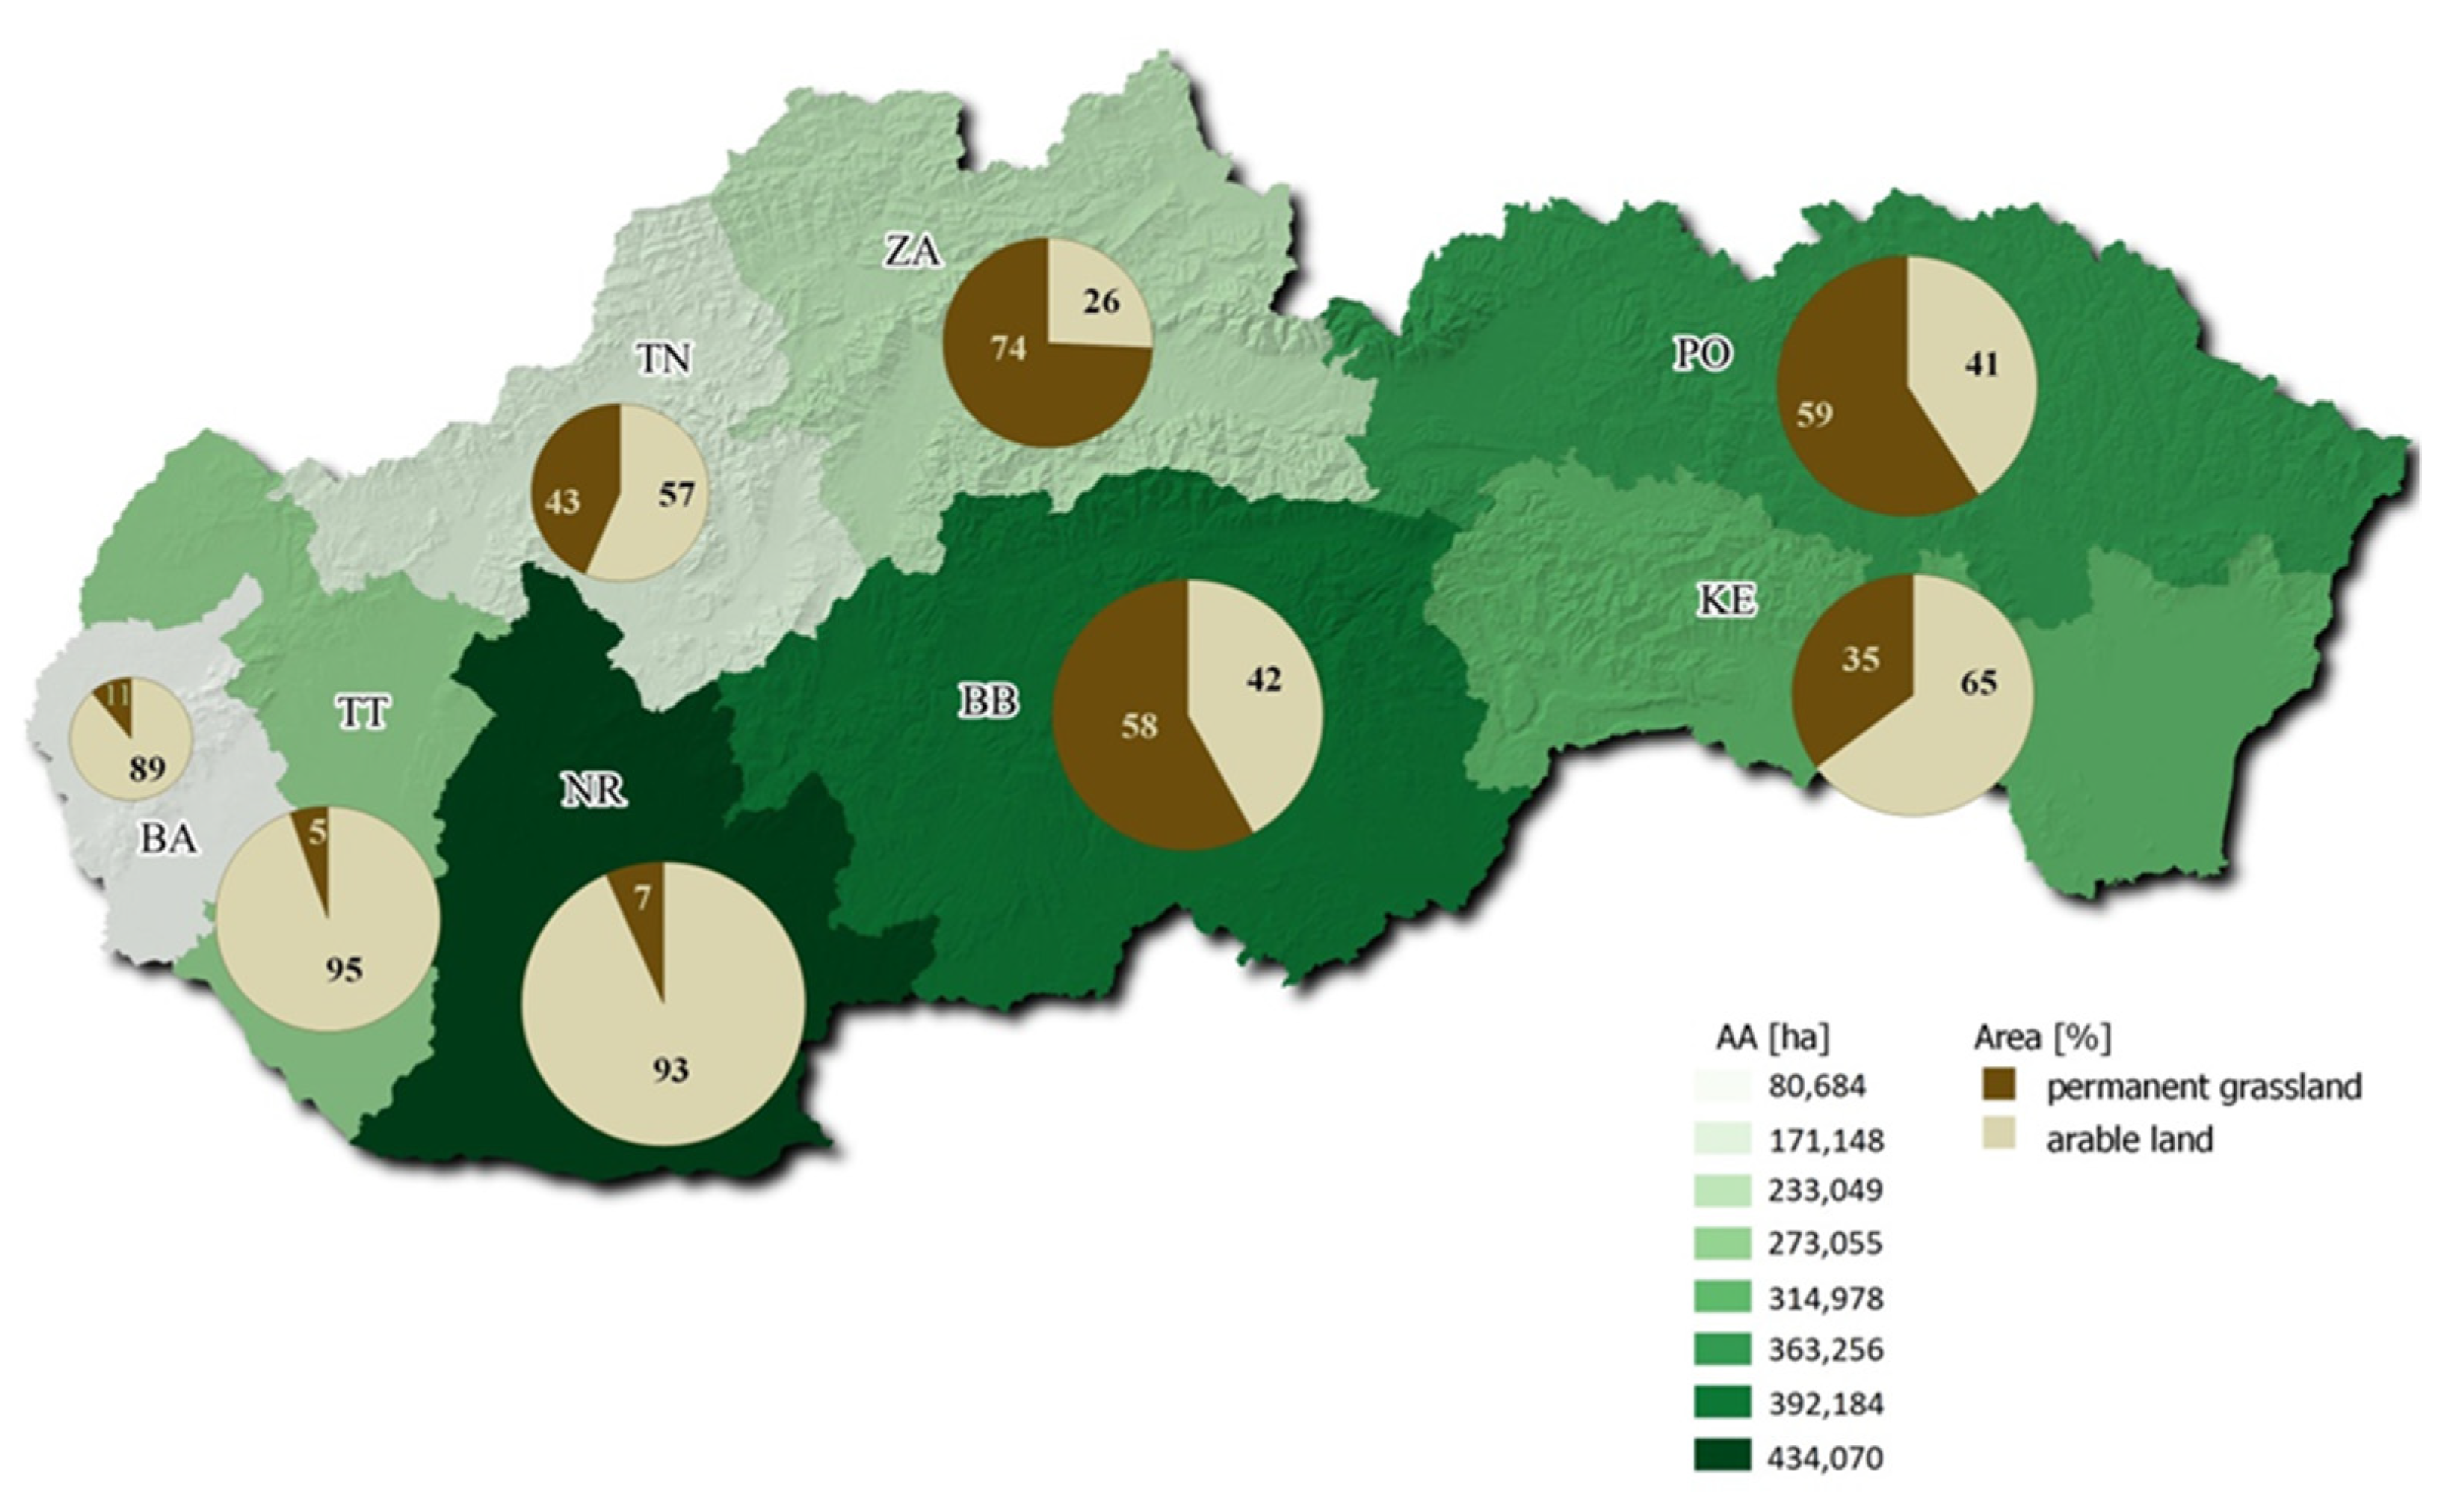
3.1. Landscape Diversity in Slovakia

The Slovak Republic area covers 4903.407 ha; agricultural land covers 46.4%, and forests cover 41.3% of this area. About 5% of agricultural land is given over to orchards, gardens, vineyards and hop gardens. The territory of Slovakia is located at an altitude ranging from 94 to 2655 m. At these different altitudes, with an altitude difference of 2561 m, the mountains alternate with basins, plains, uplands and highlands. Highlands cover 60% of the territory, and lowlands cover 40%. From a European point of view, Slovakia has the character of a foothill to a mountain landscape [30]. All NUTS III regions of Slovakia are diversified and feature a combination of lowlands and mountains. Most productive agricultural land is located in Southwestern and Southeastern Slovakia, as there is a higher proportion of lowlands than highlands, with high-quality agricultural land [31,32]. Since 2004, the agricultural land area has remained stable, with a year-to-year decrease of less than 1%. The greatest decline (up to 10%) was in the pre-accession period 2000–2004. Agricultural land areas in Slovakia as of 2014, according to particular NUTS III regions, are presented in Figure 1.
In 2014, the share of agricultural land per capita in Slovakia was 0.44 hectares, whereas the acreage of arable land was 0.26 hectares per capita. A regional comparison at the NUTS III level in 2014 shows that the highest proportion of agricultural and arable land was in the Nitra region (435 thousand hectares). Figure 1 shows the uneven distribution of arable land in regions of Slovakia. A higher proportion of arable land compared to agricultural land was evident in the Trnava region (95%) and in Bratislava (89%). Permanent grasslands dominated in the Banská Bystrica region (231 thousand hectares) and in the Prešov region (219 thousand hectares) [25].
The agricultural land in Slovakia in the year 2018 is documented in Figure 2, which presented the acreage of 2381.953 ha. In 2018, the share of agricultural land per capita decreased to 0.43 ha per capita and arable land to 0.25 ha per capita. The largest agricultural land share was by the arable land and presented 1408.660 ha in 2018 and by permanent grasslands 855,882 hectares. Based on the comparison of particular NUTS III regions, the highest acreage of agricultural land was in the region of Nitra, 434 thousand hectares.The region Nitra has the largest shares of arable land (405 thousand hectares) and is followed by Trnava region with 258 thousand hectares [29]. The regions Nitra and Trnava belong to the most productive agricultural regions in Slovakia. The region Banská Bystrica, with the second-largest agricultural land share, has the highest representation of permanent grasslands by 58% of total agricultural land among all Slovakia regions.
The comparison of 2014 and 2018 indicated a slight decrease in agricultural land. Still, the portion of arable land and permanent grasslands remained approximately the same during this period in terms of percentage shares among all NUTS III regions in Slovakia. A more detailed analysis of agricultural land development between 2014 and 2018 is shown in Figure 3. During the observed period (2014–2018), the agricultural land decrements were not significant; however, it was possible to observe a change of arable land to meadows and pastures. A trend towards stabilization of agricultural land also features on a global level [33]. Throughout the whole period observed, a decrease of less than 1% could be seen in the Bratislava and Košice regions. A decrease of 0.5% was evident in the Trnava region, and there was a 0.1% decrease in the Nitra region. The acreage of permanent grassland from the regional comparison also declined, and the highest decline was monitored in the Nitra region (3.5%), followed by Žilina (1.98%), Prešov (1.78%), Banská Bystrica (1.75%) and Bratislava (1.54%), with an increase only evident in the Trnava region (1.21%). The decline in agricultural land worked in favor of forest, non-agricultural and non-forest land. Decreases in agricultural land amounted to about 1000 ha year-on-year, and about 300 ha for arable land. The decline in agricultural land converted into non-agricultural and forest land was around 68%, and 32% was converted for construction (predominantly for civic buildings, housing and investment purposes). In terms of arable land, this decrease amounted to 66% for non-agricultural and forest land, and 34% for construction [29].
The decrease in arable land is a problem in Slovakia [34] and in other countries and regions. The amount of land used for agricultural purposes in the EU will continue to fall between now and 2030 due to increasing urbanization in Europe. The likely decrease in arable land in the EU is predicted to be around 3.3% [35]. Measures need to be taken to protect and stabilize agricultural land and forest land to ensure sustainability in agriculture, mainly to maintain agricultural land in order to ensure self-sufficiency in terms of food production. The price of agricultural land is also affected by construction and investment activities. These may affect the higher price of agricultural land in some regions of Slovakia and negatively affect farmers’ interest in buying agricultural land, thereby having a negative impact on agricultural sustainability in a given region. It is necessary to value agriculture not only from a business point of view but mostly from a sustainability point of view in terms of its function of ensuring nutrition for the population and ensuring sustainability for the country and the region.

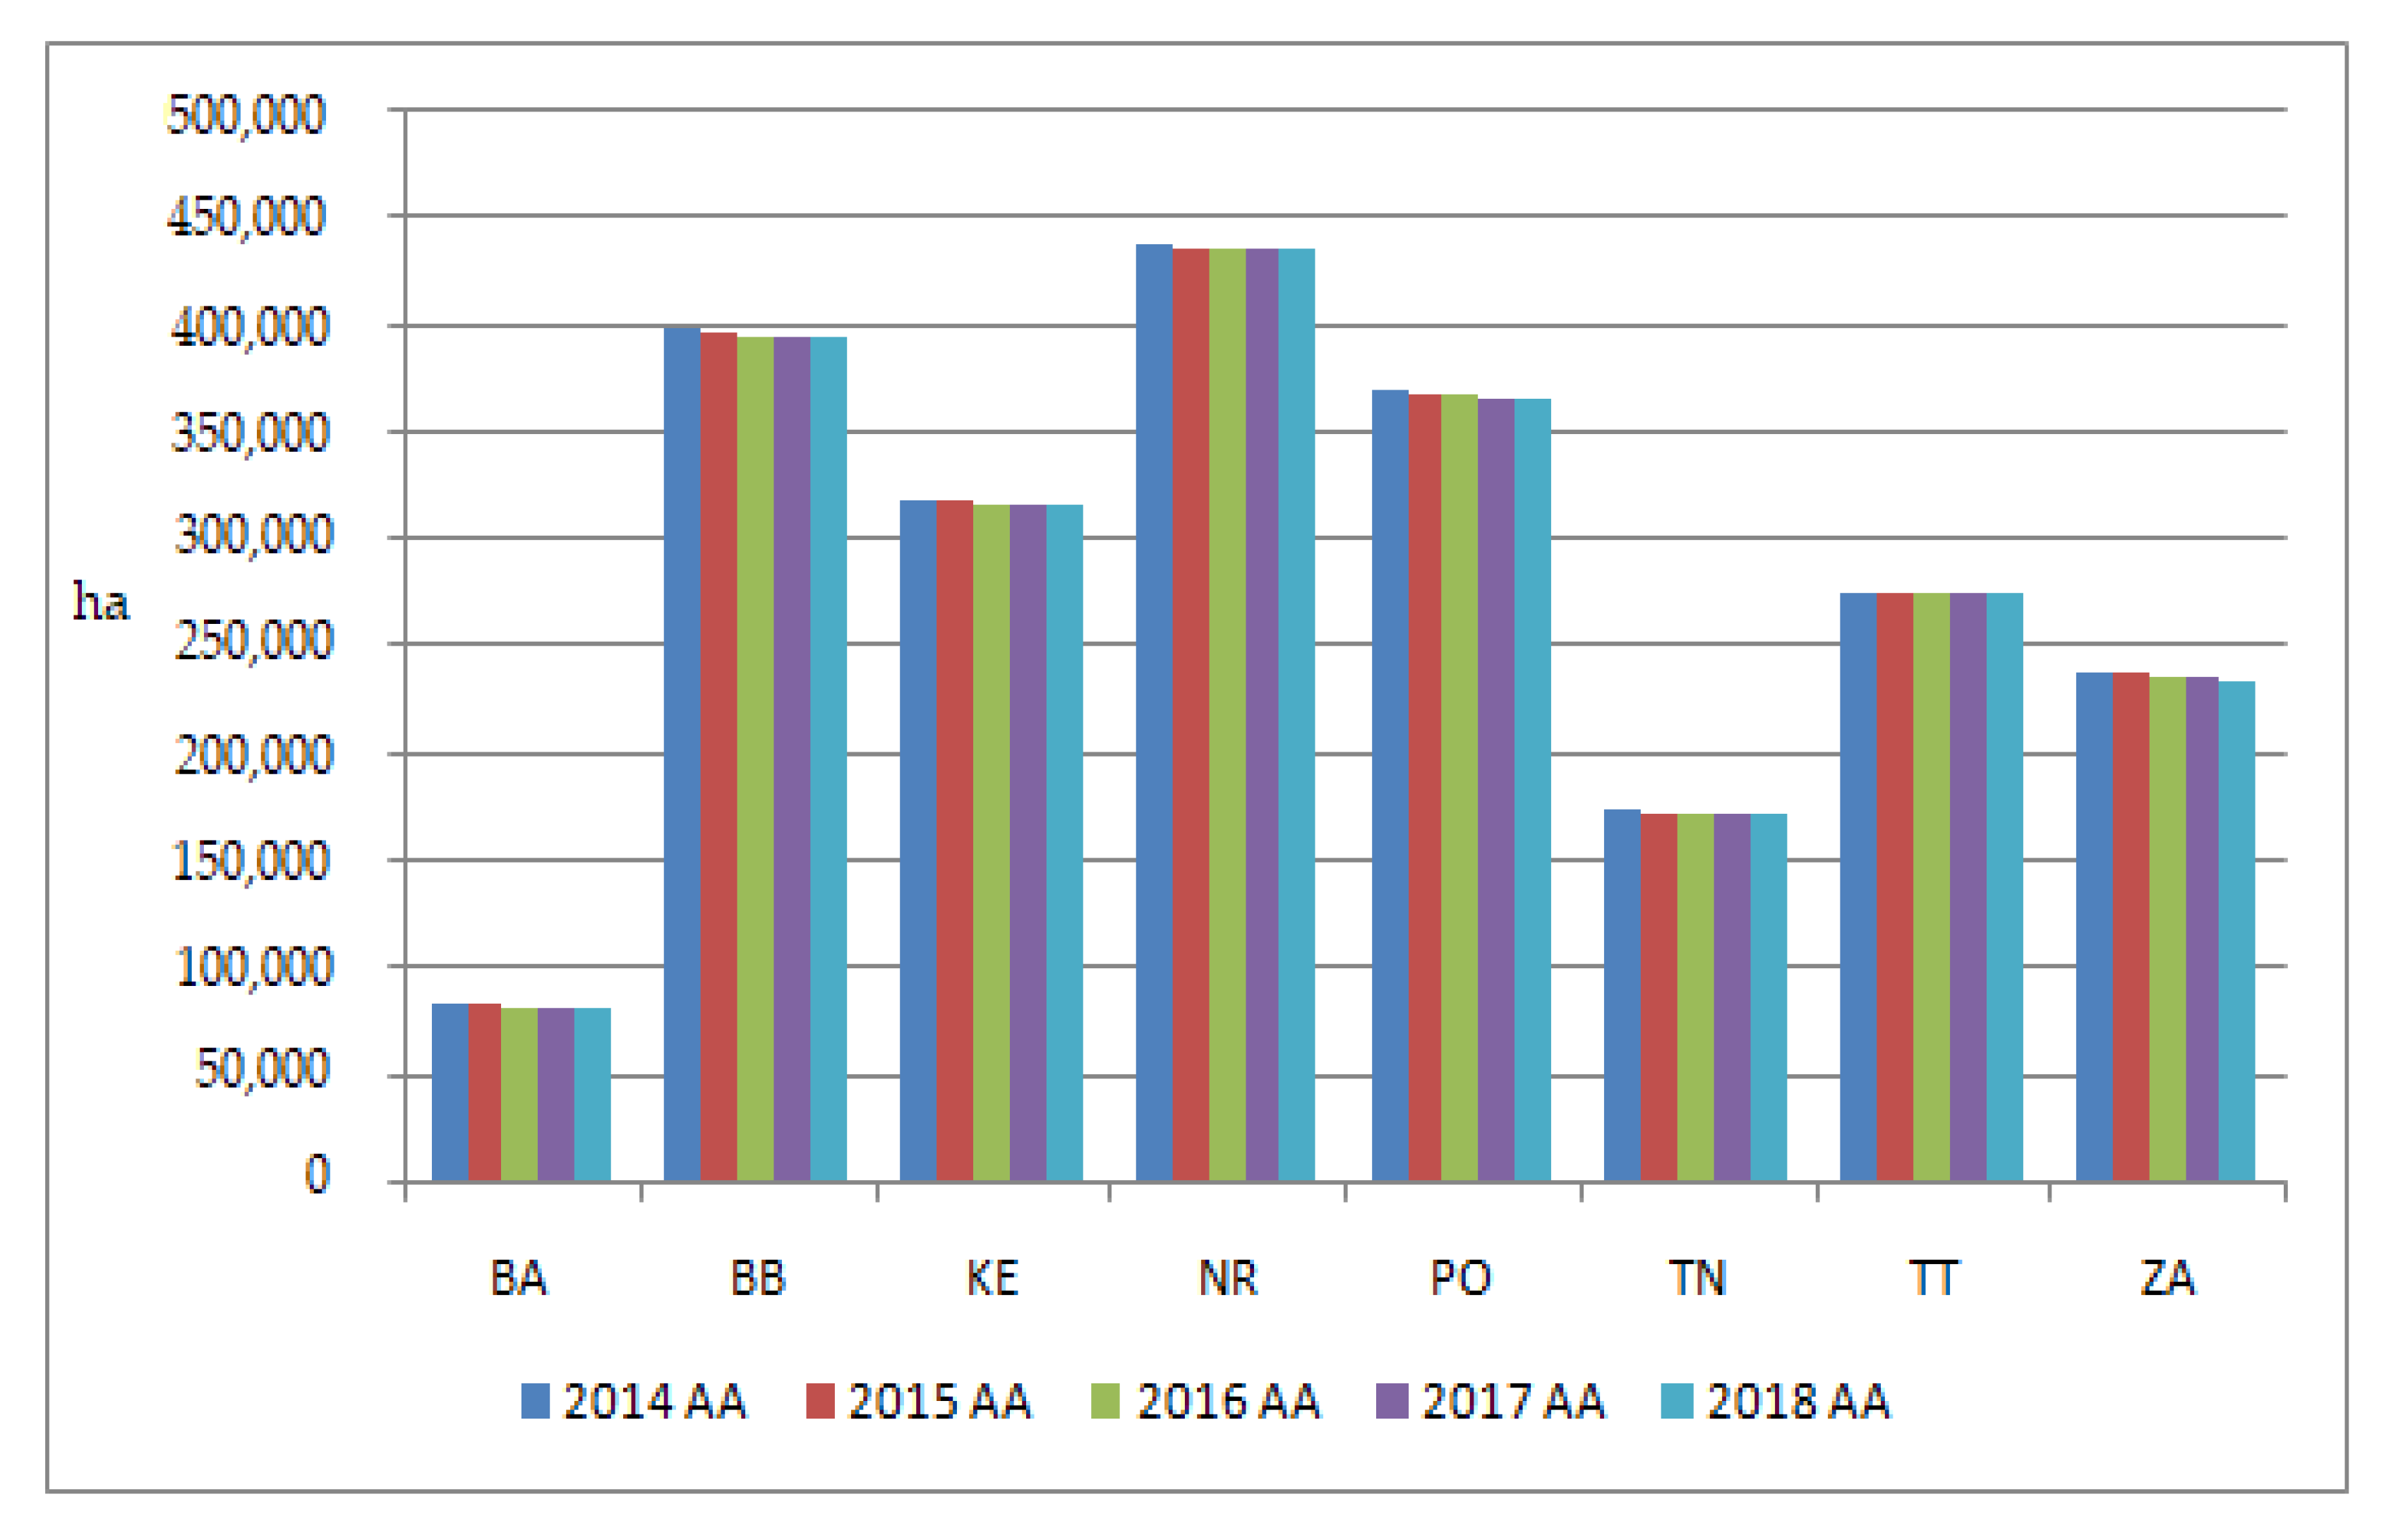
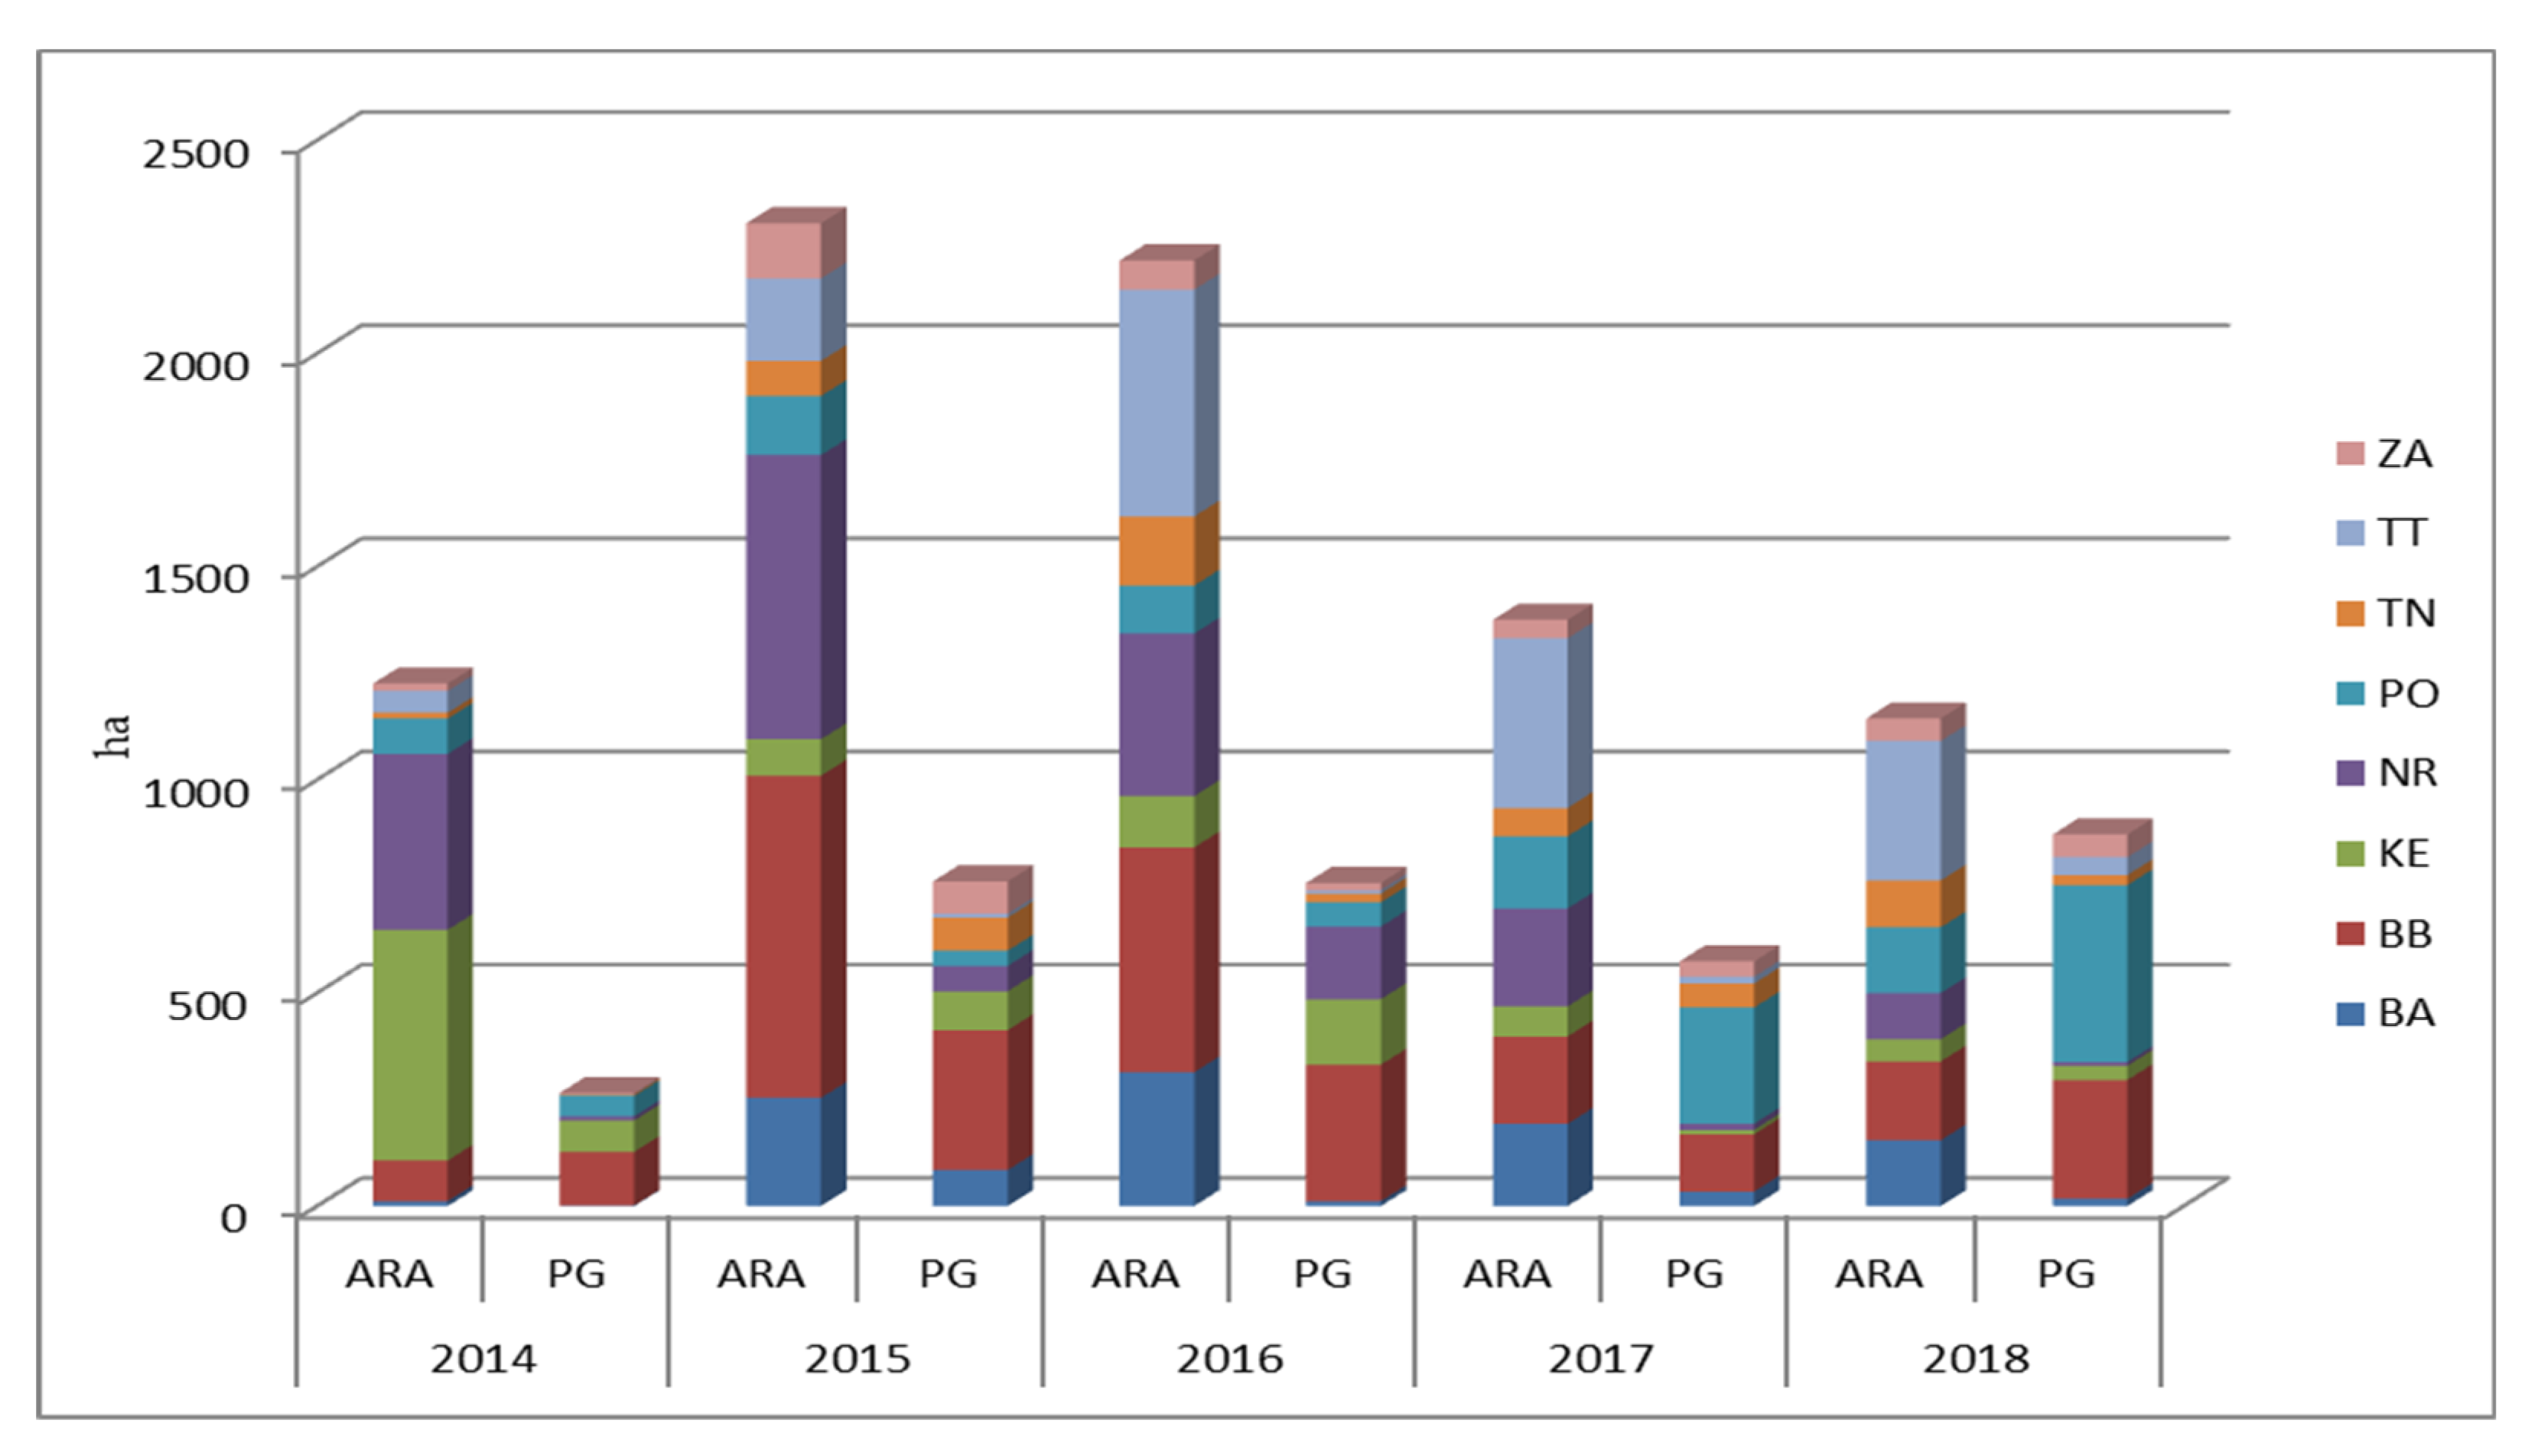
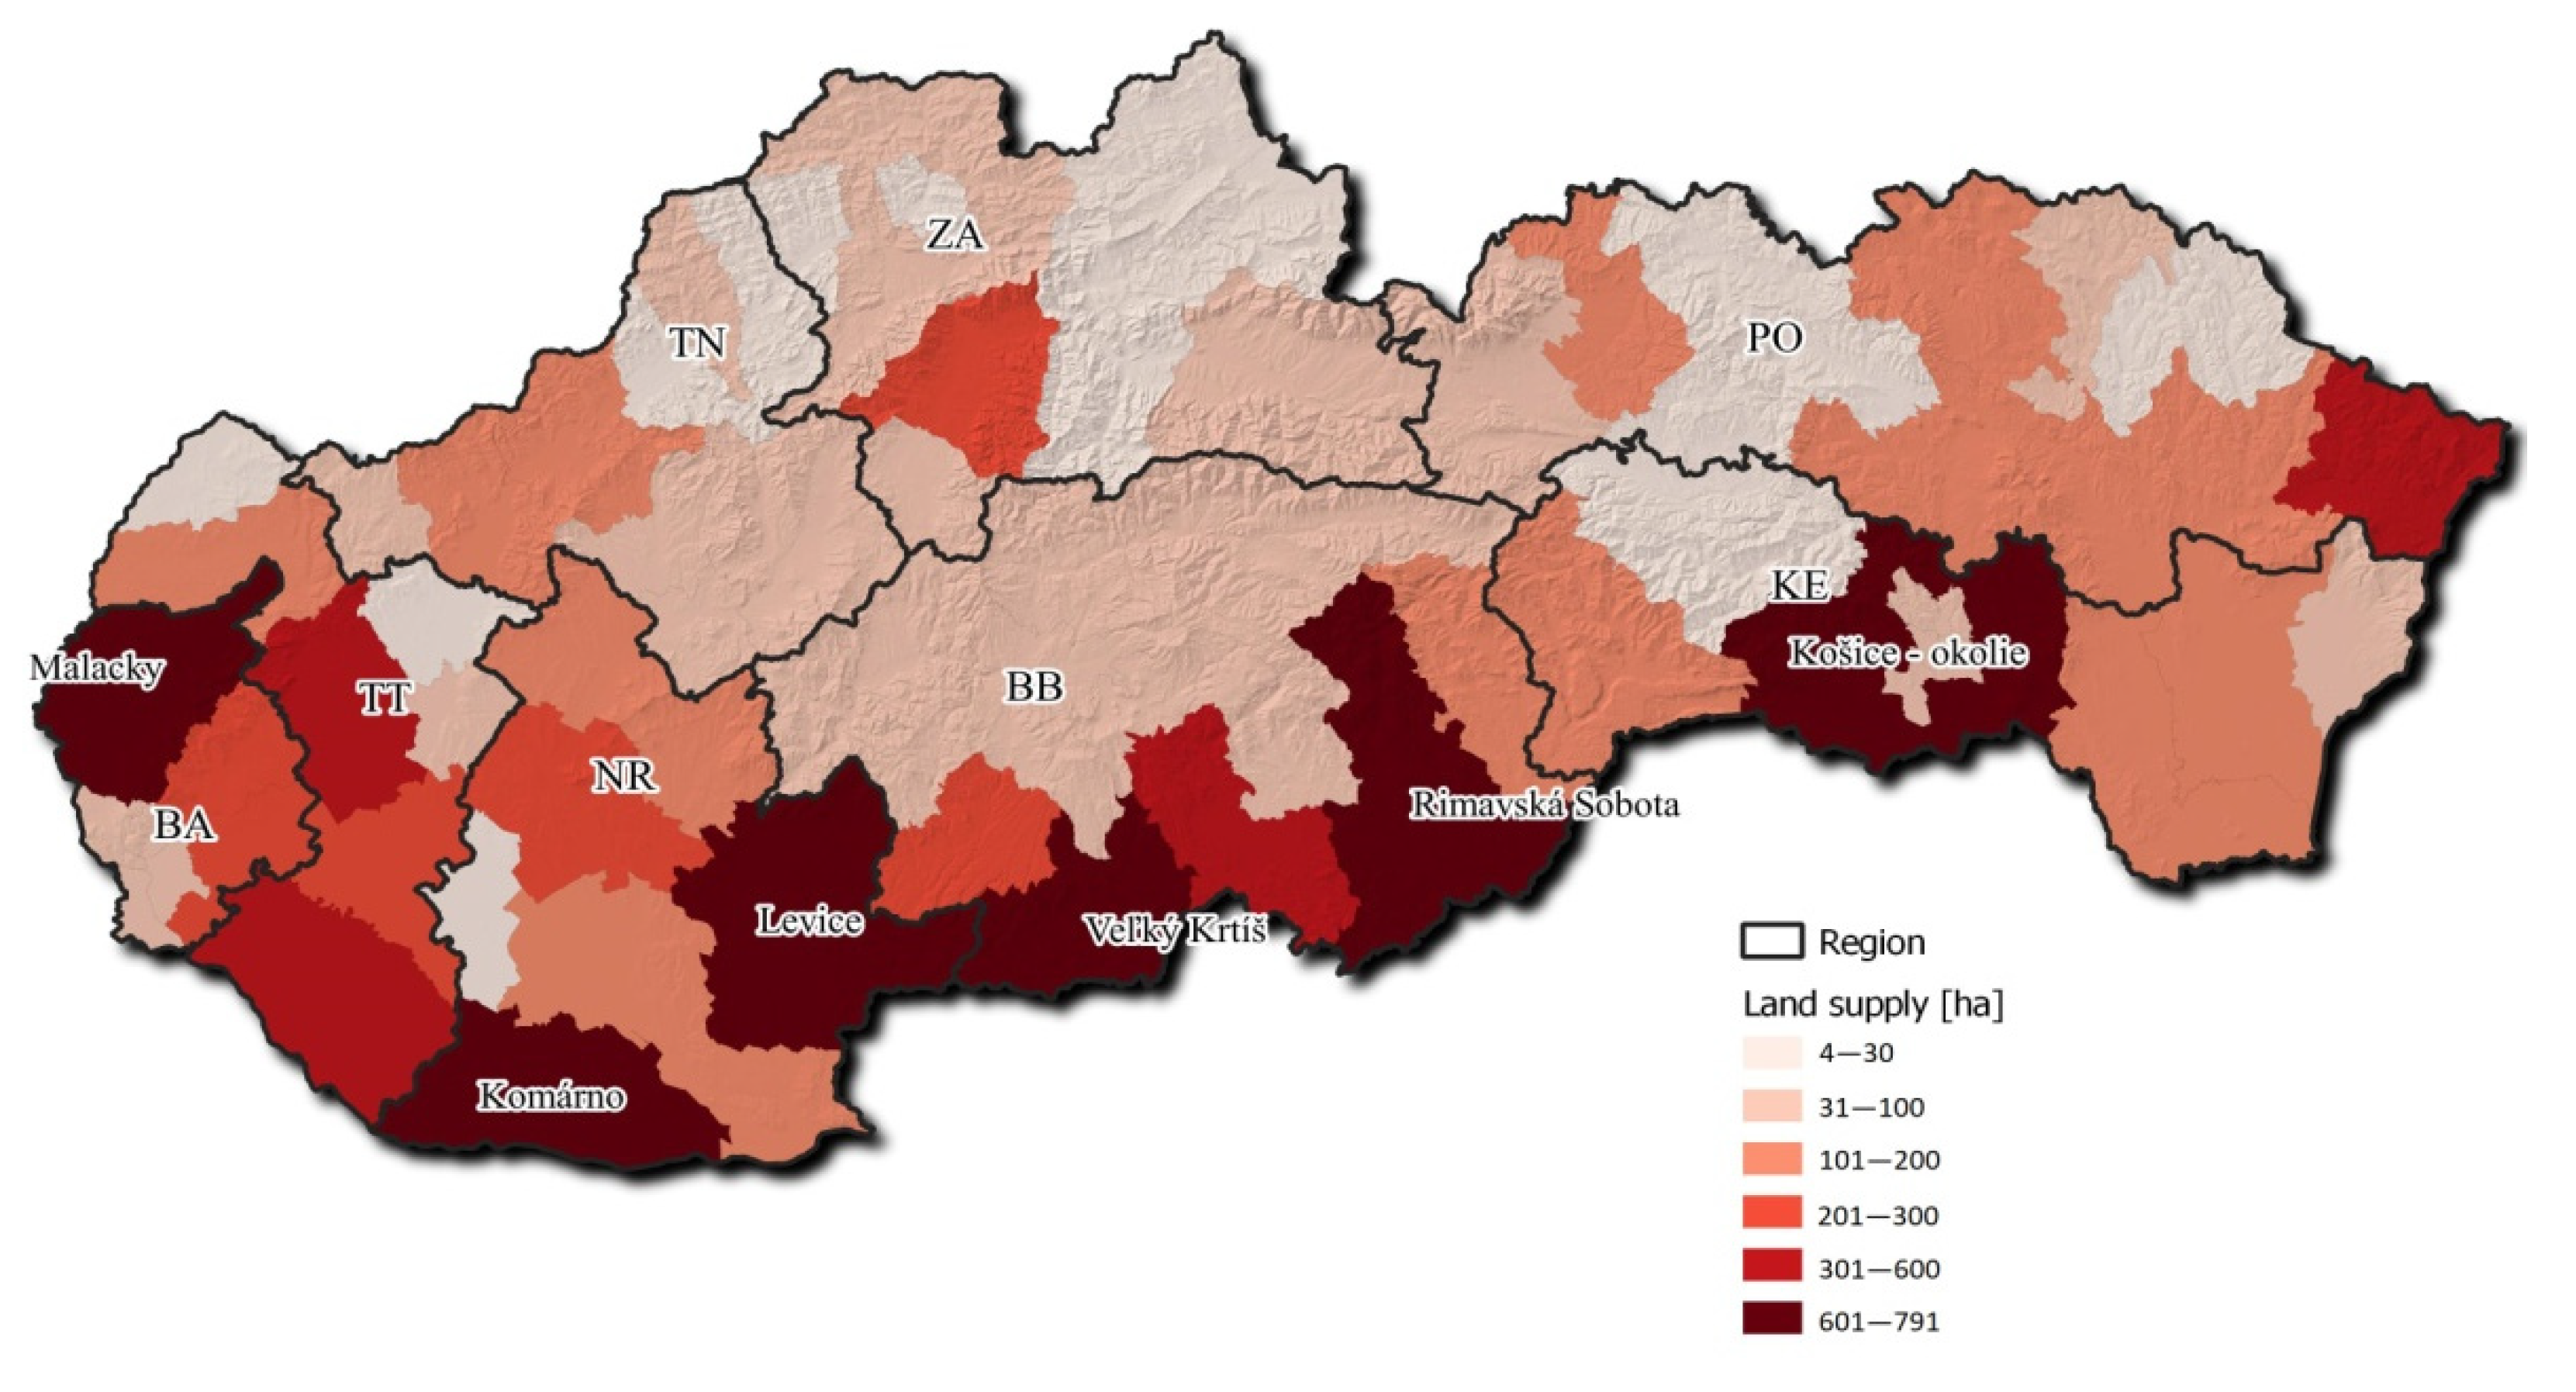
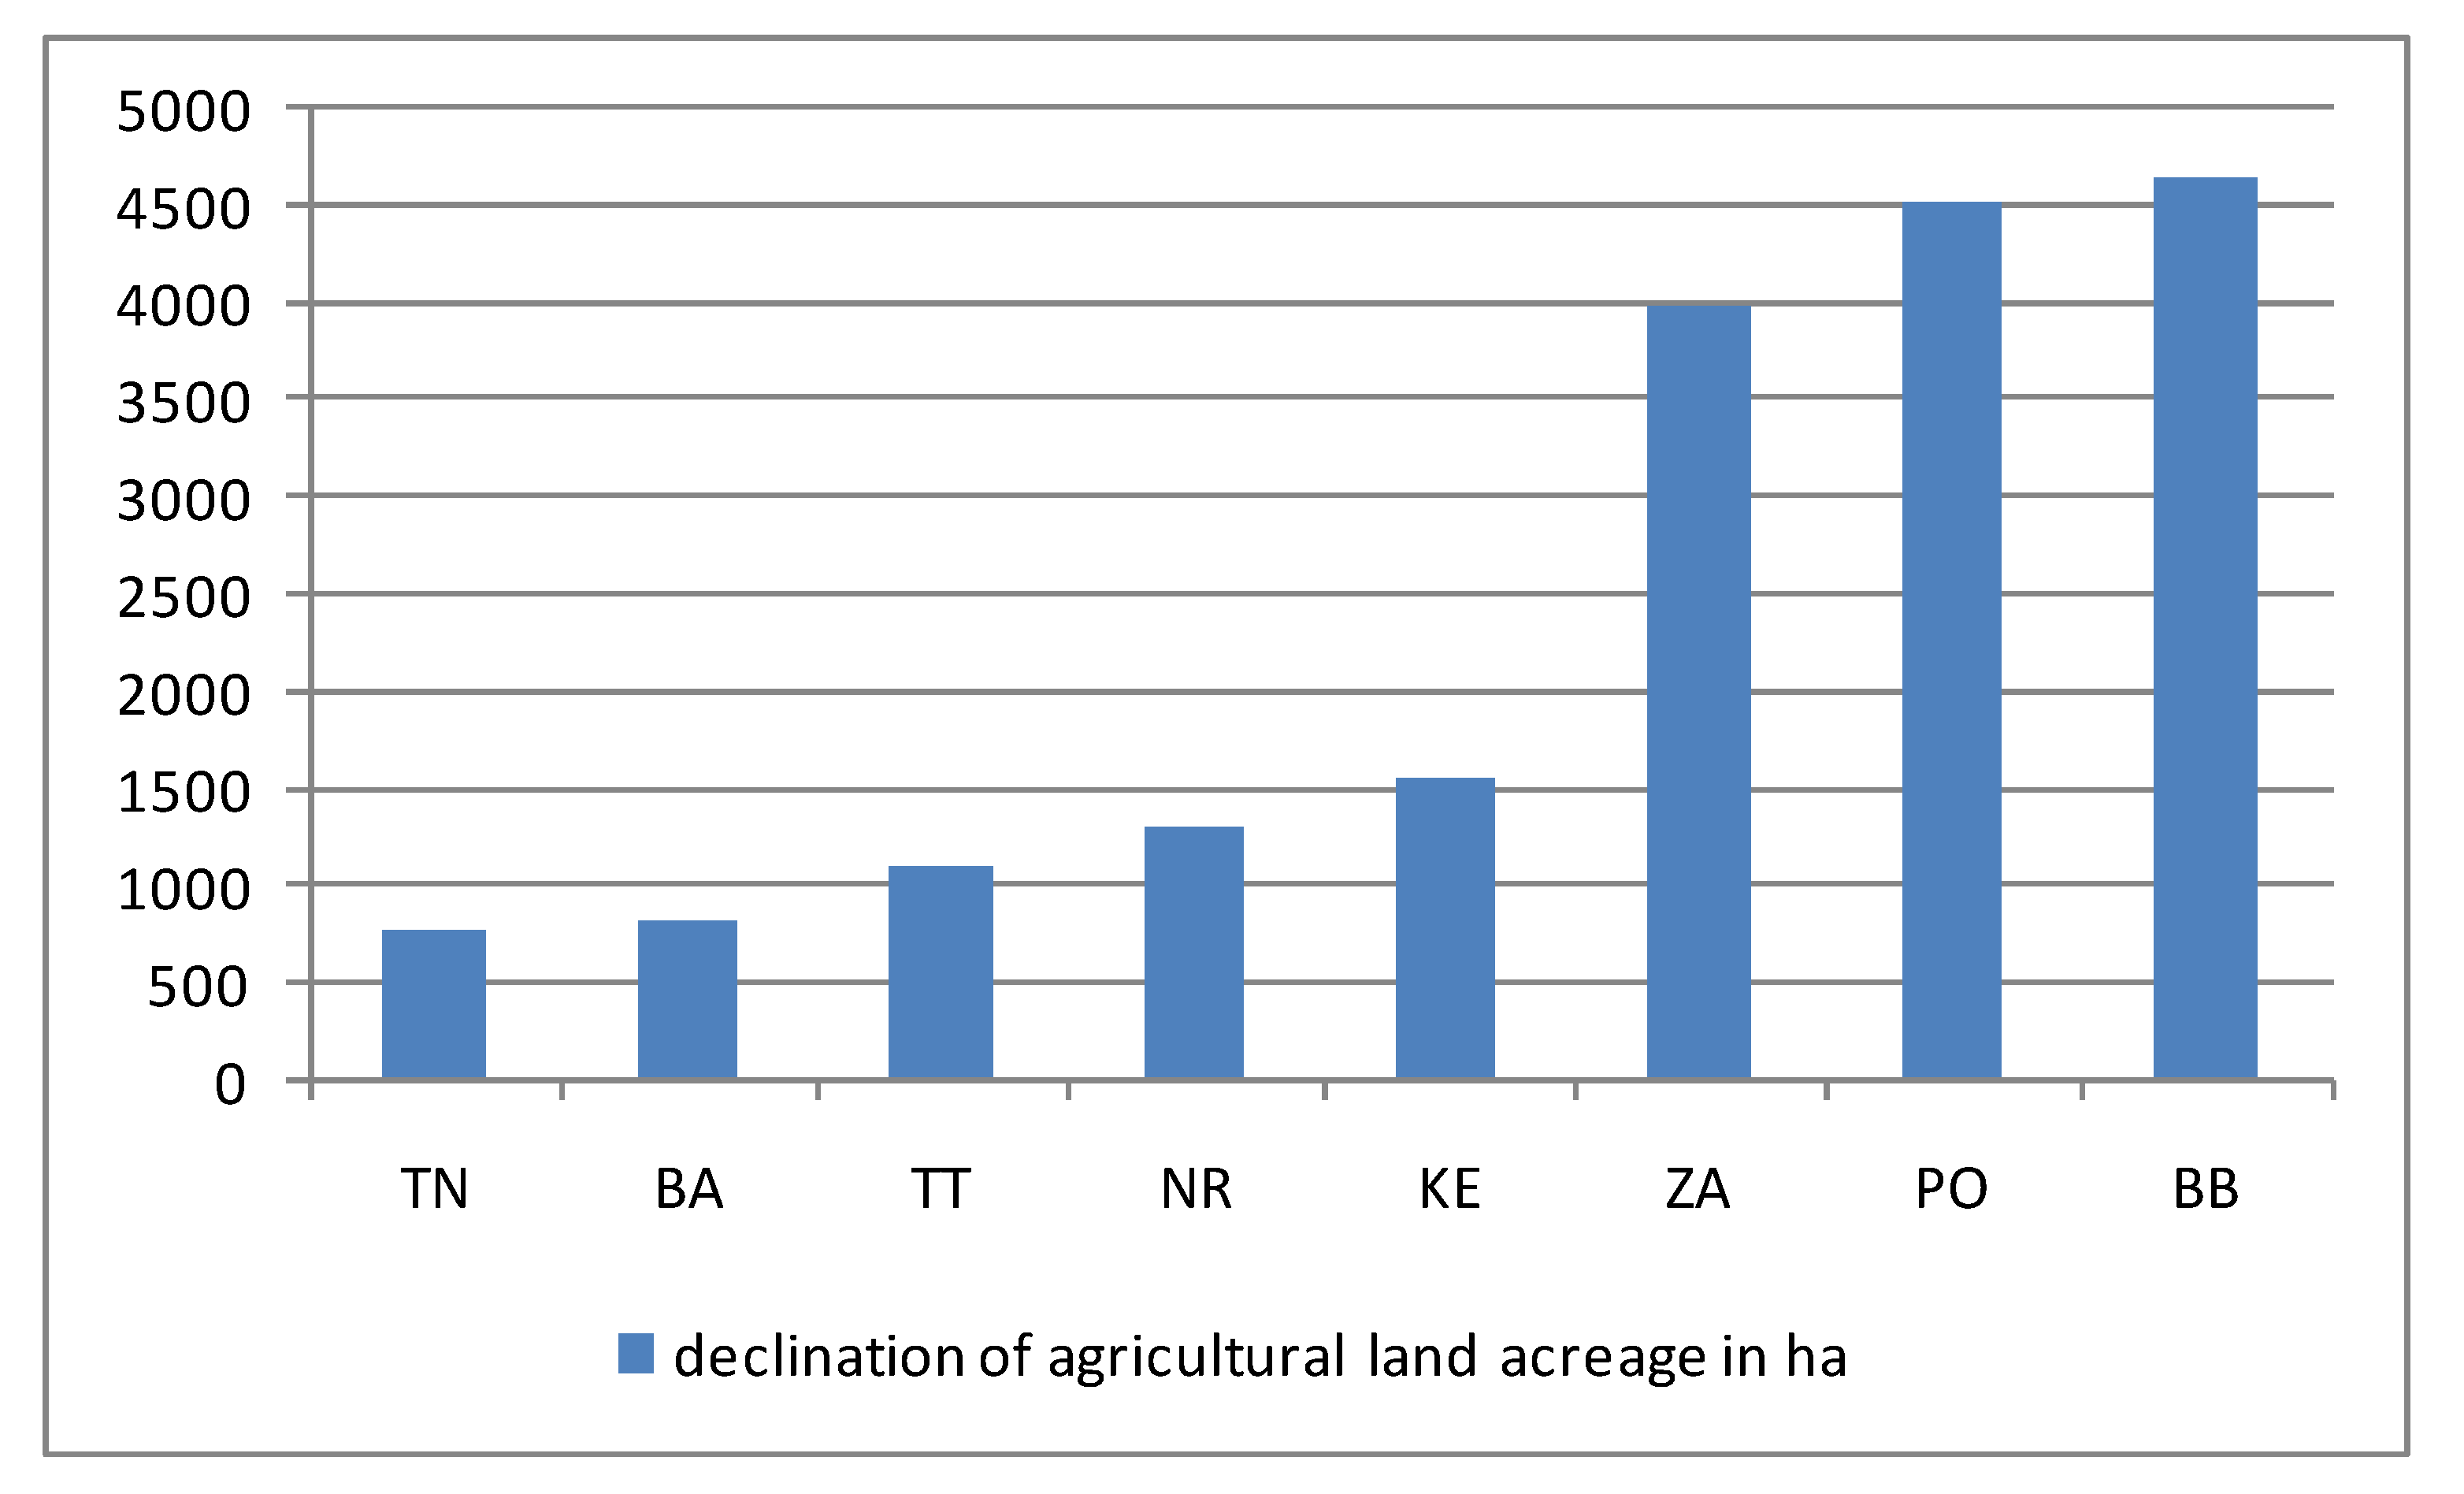
3.2. Agricultural Land Supply in the Period 2014–2018

Slovak lawmakers regulated land sales after the expiration of the negotiated transition period, during which Slovak agricultural land was excluded from the free movement of capital. In 2014, the act on land acquisition introduced a set of bureaucratic steps for when land ownership was transferred (regardless of whether this was by sale or donation), such as the following: publication of land supply in the register administrated by the Ministry of Agriculture and Rural Development of the Slovak Republic on its website, as well as on the official noticeboard of the municipality where the agricultural land is located; recording the interest of potential buyers regarding a special order of buyers stipulated by law; and verification of the fulfillment of all stipulated conditions by the District Office, including the conditions for entities entitled to acquire land ownership [36]. According to the explanatory report, the reason for adoption of this act was land protection. Moreover, this law should avoid speculative land transactions and prevent the misuse of ownership in relation to land users [4]. In 2016, the European Commission decided to demand clarification of the laws passed in Bulgaria, Hungary, Lithuania and Slovakia regarding acquisition of agricultural land, and the EU Commission’s official announcement letter marked the start of the proceedings, giving countries a two-month deadline to provide information on the case. Therefore, Slovak lawmakers began preparing an amendment to the act on land acquisition [37]. However, the amendment was not adopted because the Slovak Constitutional Court decided that some acts relating to land acquisition rules were not in compliance with the Slovak Constitution. The regulations relating to publication of land supply on the Ministry’s website and municipality notice boards in the order of new potential land purchasers and were cancelled in 2019 [37]. Therefore, we analyzed land transactions during the period 2014–2018.
The supply of arable and permanent grasslands between 2014 and 2018 is documented in Figure 4. Based on land-supply data obtained for the period 2014–2018, we can state that, in the year 2014, 0.065% of the total agricultural land in Slovakia was the subject of land supply, with the most extensive acreage of arable land supply in the Košice (541 ha) and Nitra (413 ha) regions. In terms of permanent grasslands, in 2014, the highest levels of land supplies were in the Banská Bystrica region (126 ha). The highest levels of land supplies across the whole period observed were realized in 2015. The land supply subject was 0.135% of the total agricultural land in Slovakia, with the dominant supply of arable land in the Banská Bystrica region (with acreage of 756 ha) and in the Nitra region (with acreage of 666 ha). The Banská Bystrica region also dominated in terms of the supply of permanent grasslands, with acreage of 328 ha. We observed that since 2016,a lower percentage (0.131%) of the total agricultural land area has been the subject of land supply. In 2017, the decreasing trend in land supply continued; about 35% less land was supplied than in the previous year (mainly arable land in the Banská Bystrica region). In terms of permanent grasslands, a smaller decrease was indicated (24%), but we observed an increase in permanent grassland supply in the Prešov region.
In 2018, in comparison to 2014, the amount of arable land supply was almost the same. An increase in permanent grassland supply is evident; in 2018, this tripled in comparison to 2014.
As documented in Figure 5, the regions with the largest land supply for the whole 2014–2018 period were mainly found to be located in the productive areas of Slovakia, in the Nitra region (Levice and Komárno districts), Trnava, and in the southern areas of the Banská Bystrica region (Veľký Krtíš and Rimavská Sobota districts) and Košice (Košice-okolie district).
Overall, in Slovakia, individual farmers and large farm holdings are interested in agricultural land, mainly due to the purchase of crucial plots in an effort to increase their share of land. The reasons for farmers’ interest in land are EU direct payments and EU project support, where land ownership is collateral for a loan. The share of EU subsidies on agriculture factor income in Slovakia for the period 2010–2014 amounted to more than 90% of total subsidies and around 45% of direct payments, while the average share of EU subsidies was more than 35%, and that of direct payments to farmers was 28% [38]. The EU’s agriculture support may increase farmers’ interest in land transactions and may be a factor that determines agricultural land sales and prices.
Ensuring a sustainable natural resource base is one of the challenges for further development trends in agriculture [33]. Land is a key asset for agricultural production; therefore, research in this area can contribute to sustainability in agriculture. Despite the fact that the agricultural sector’s development depends on many factors and regional variations in the sector, some key trends at the European level can be observed. The proportion of total land accounted for by agricultural land is shrinking, and the sector is affected by land take, i.e., transformation to artificial land. Independently of this, the number of farms is decreasing, and the average farm size is increasing. All three factors (landtake, intensification and extensification) lead to high-value farmland loss [39].

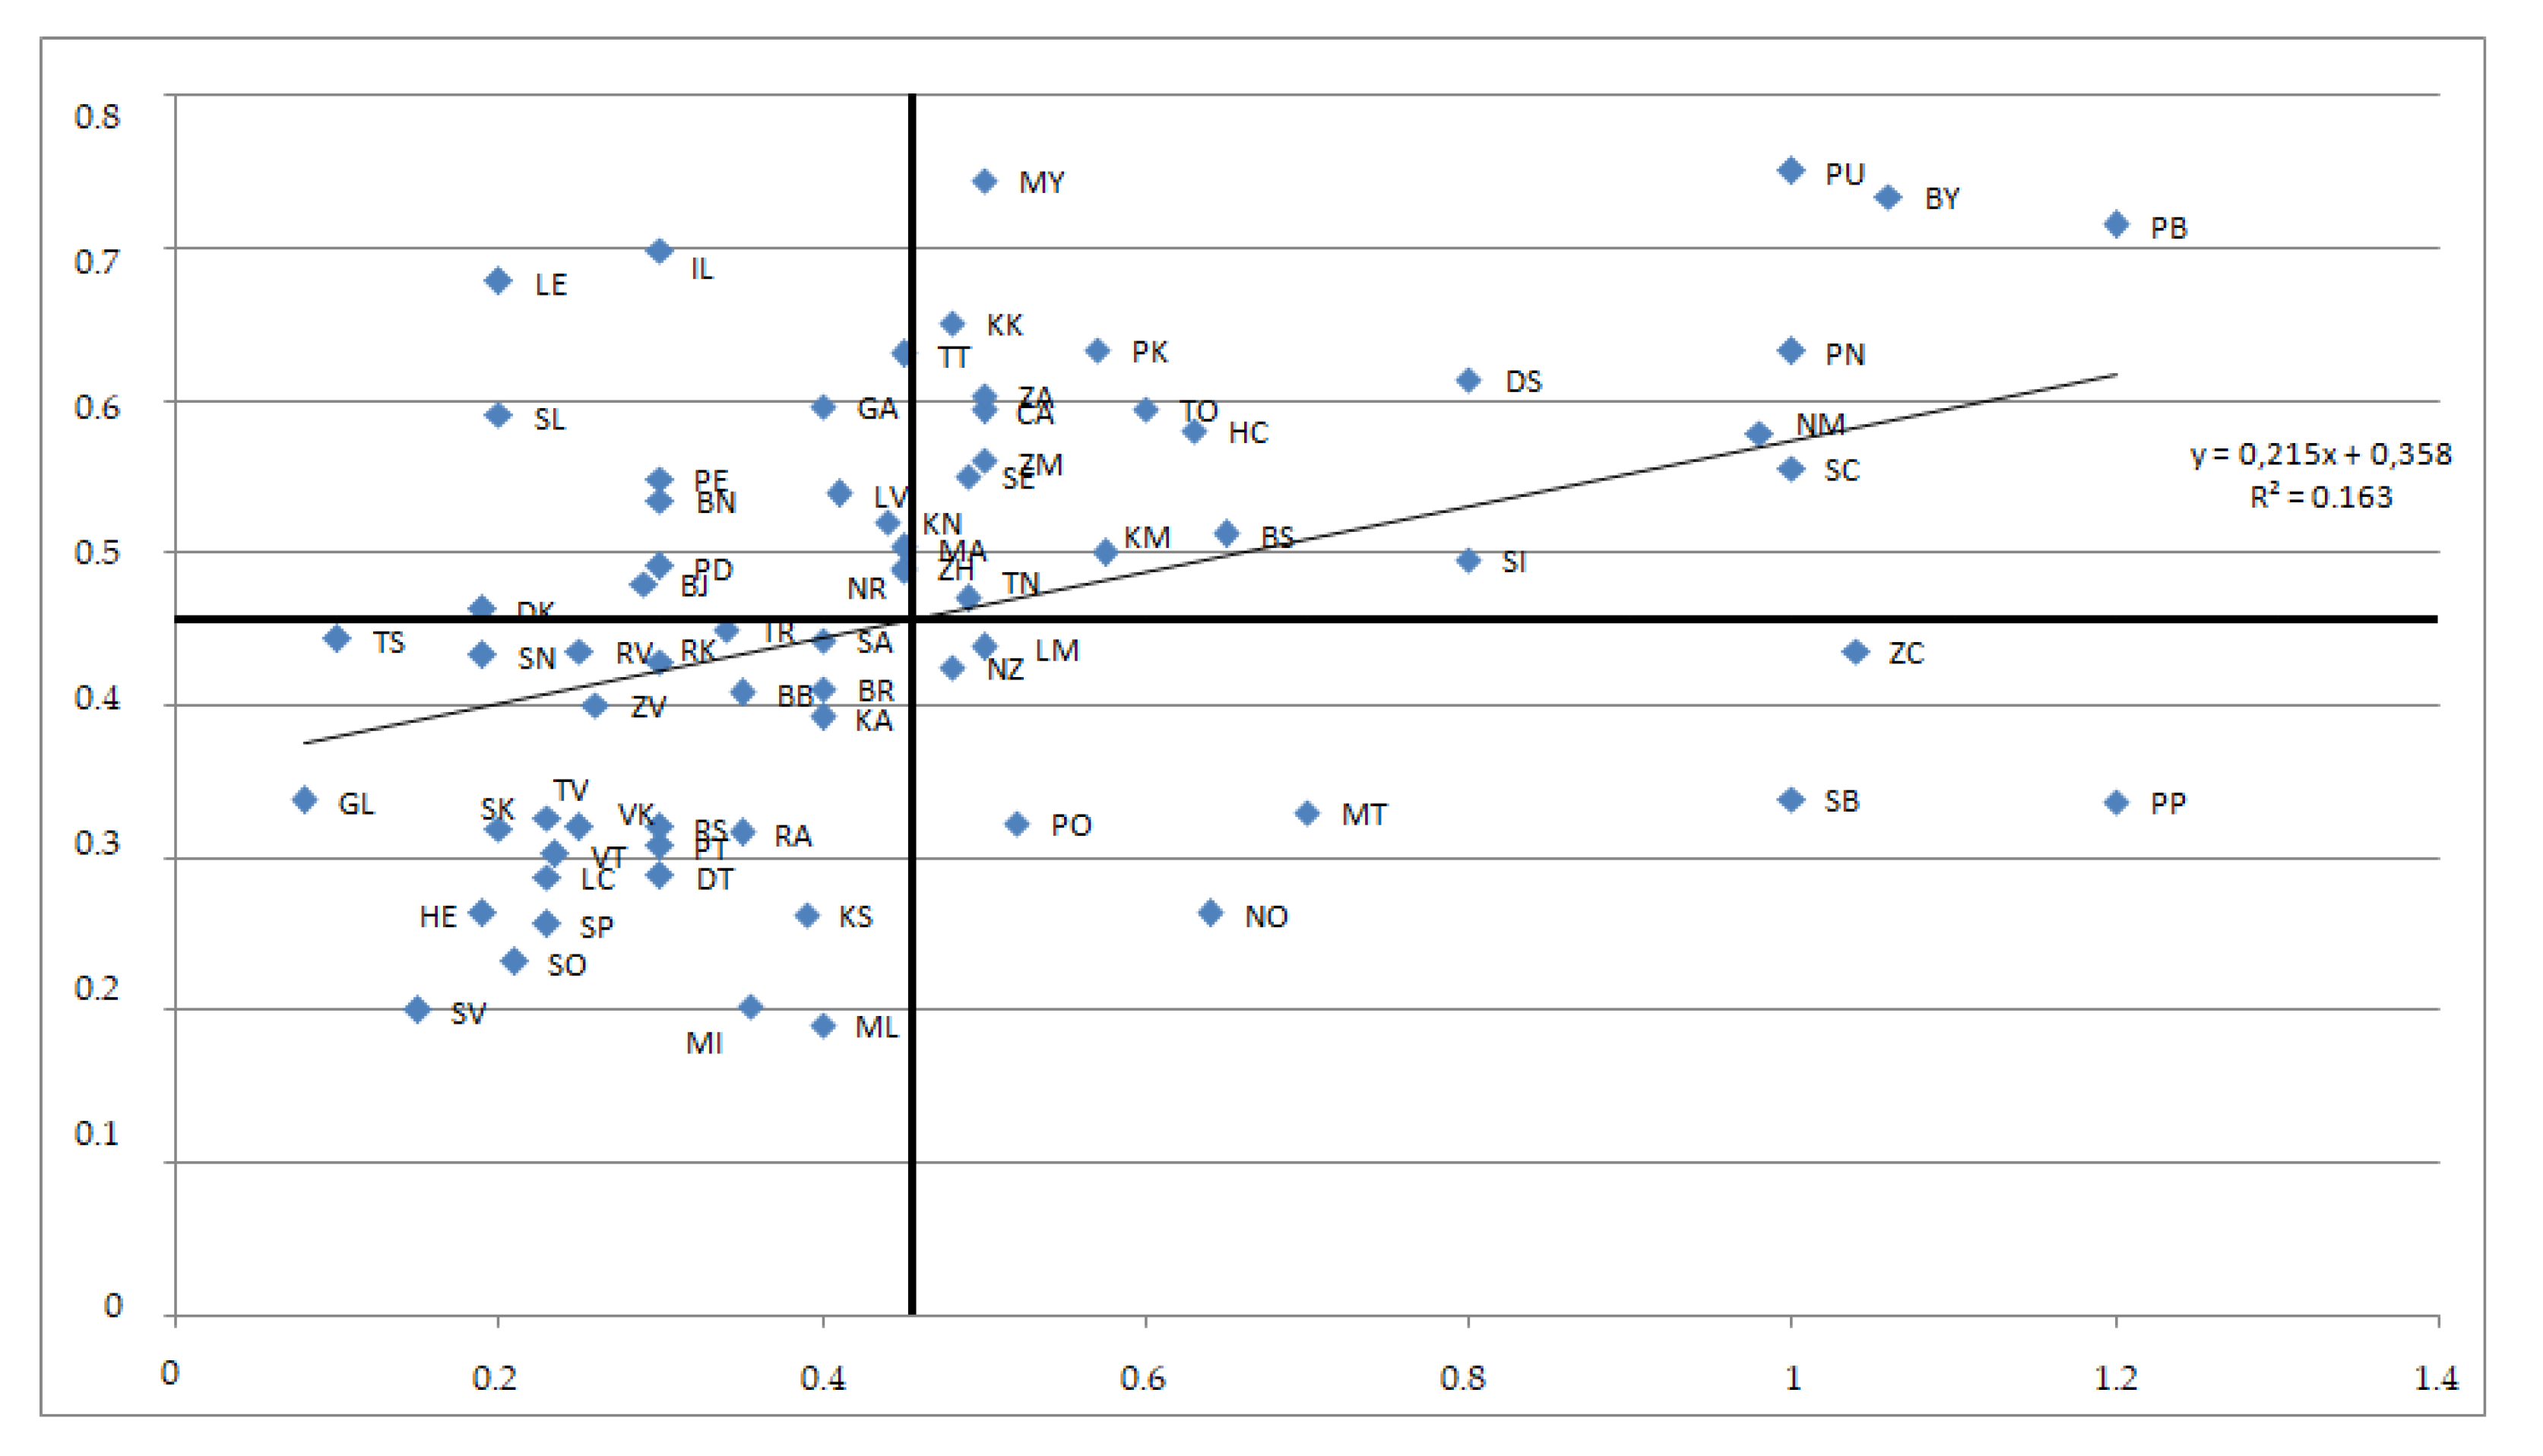
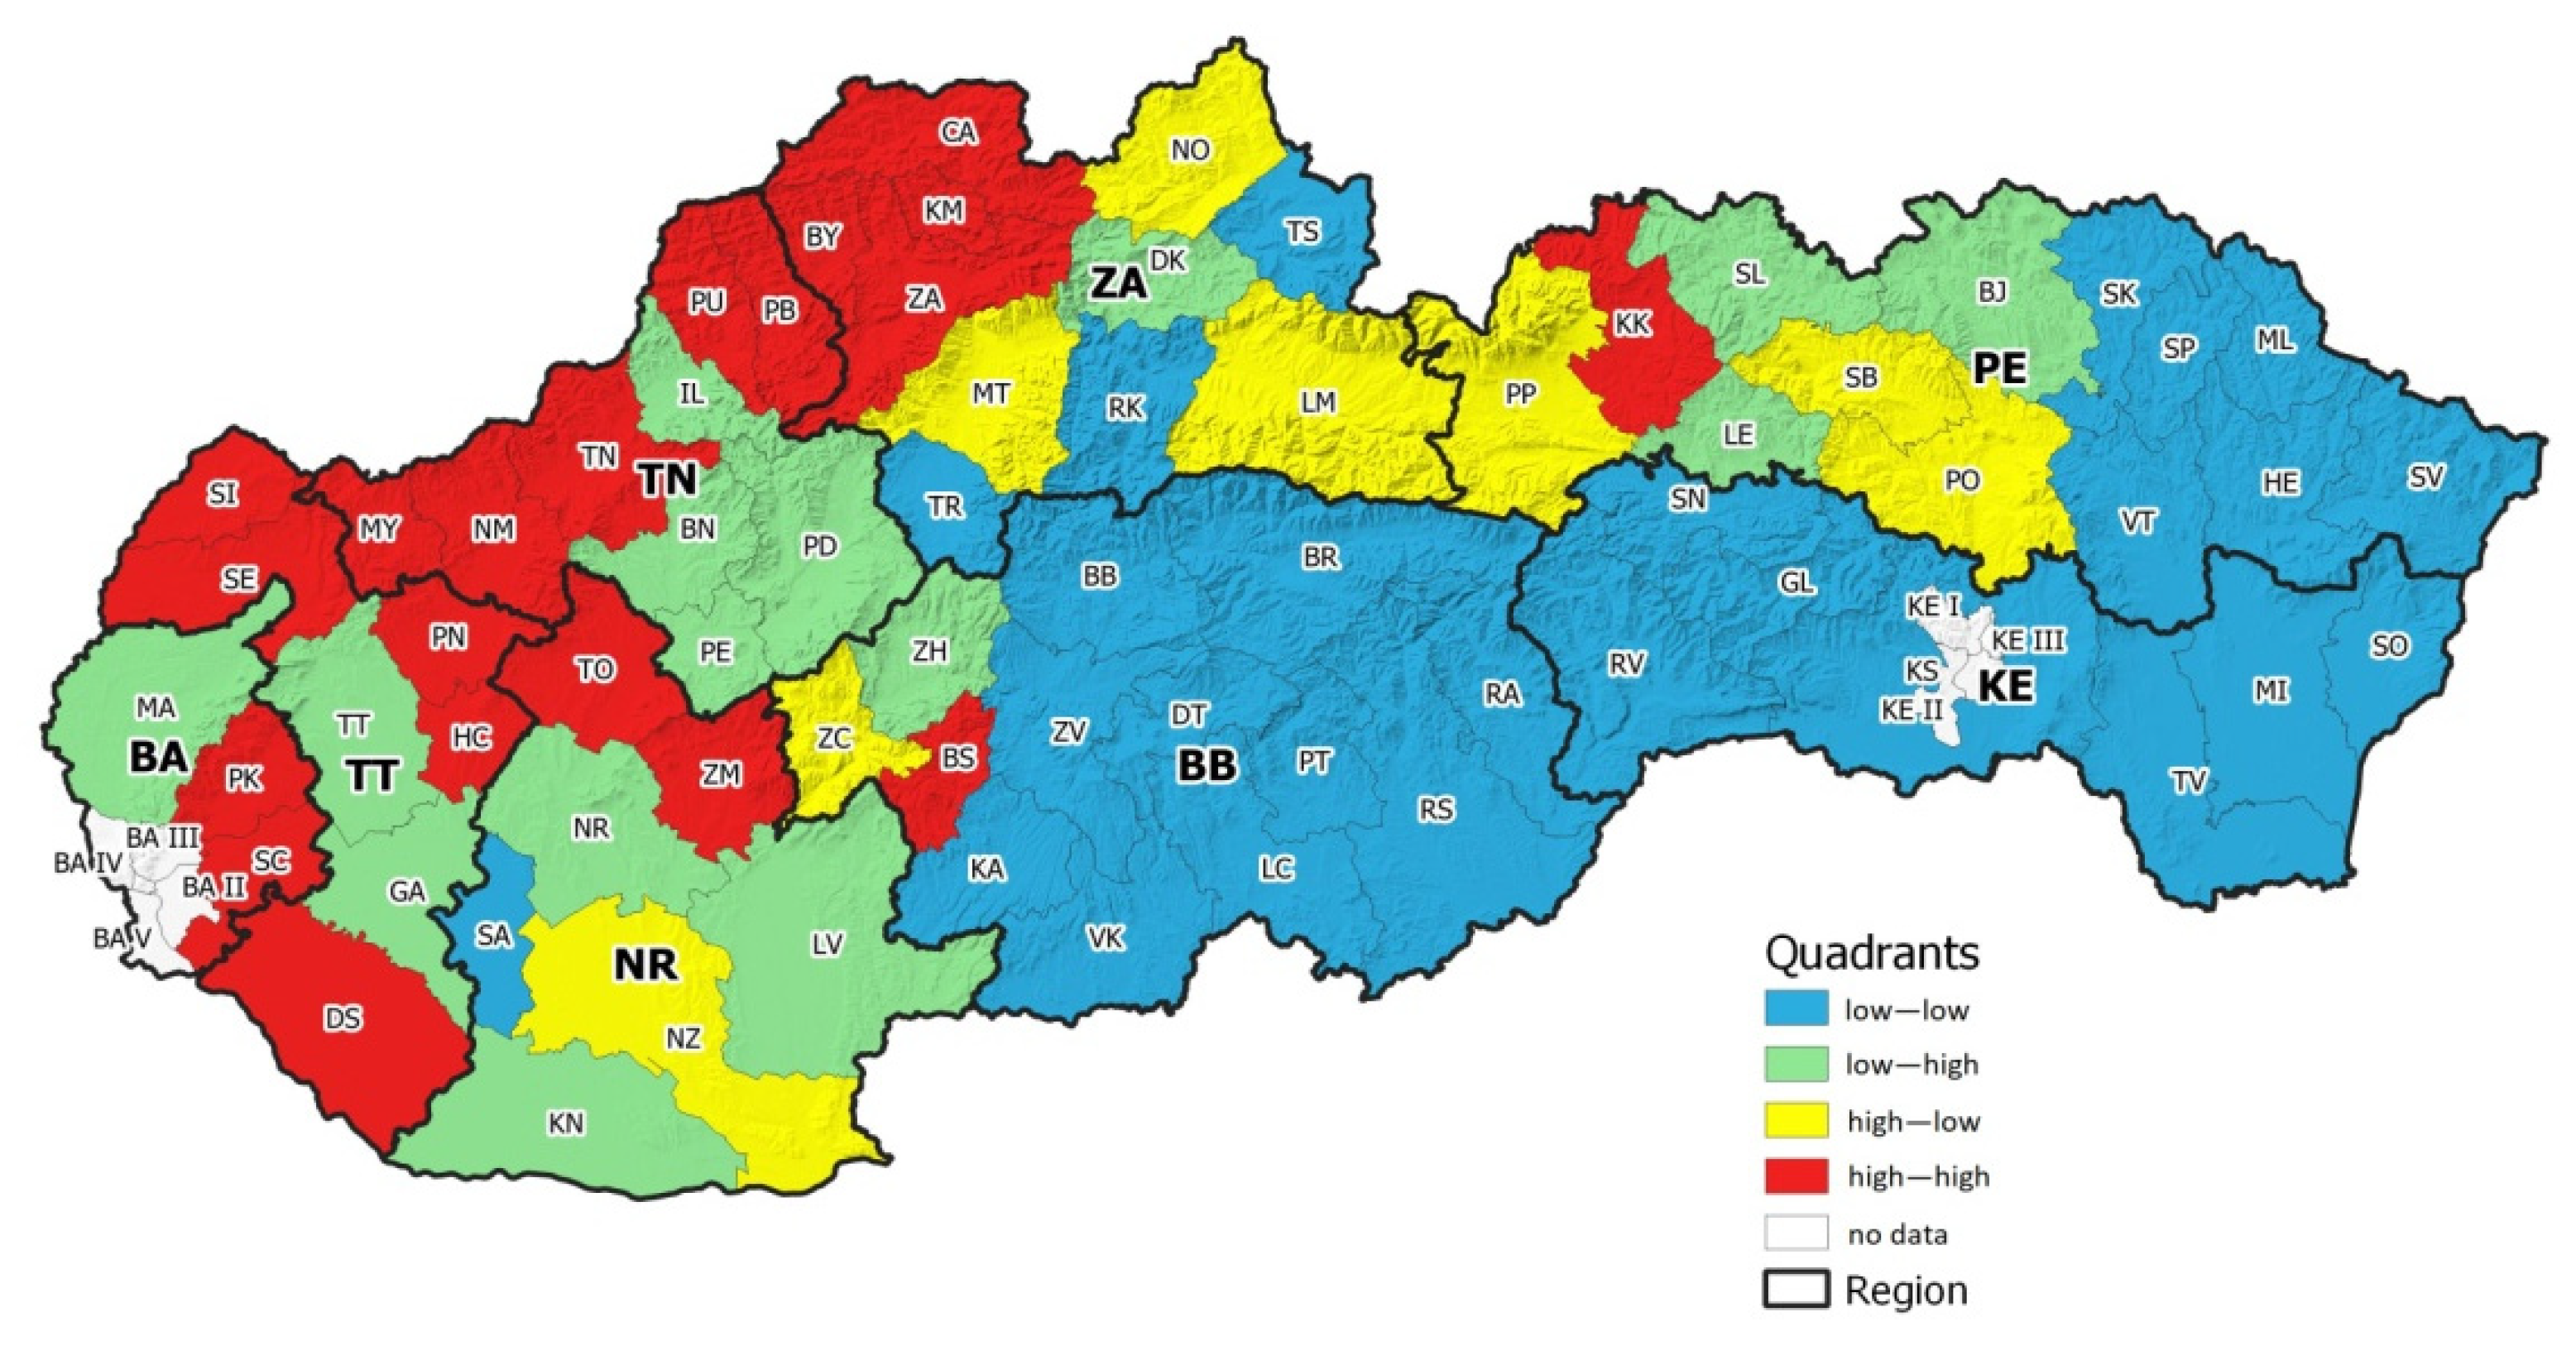
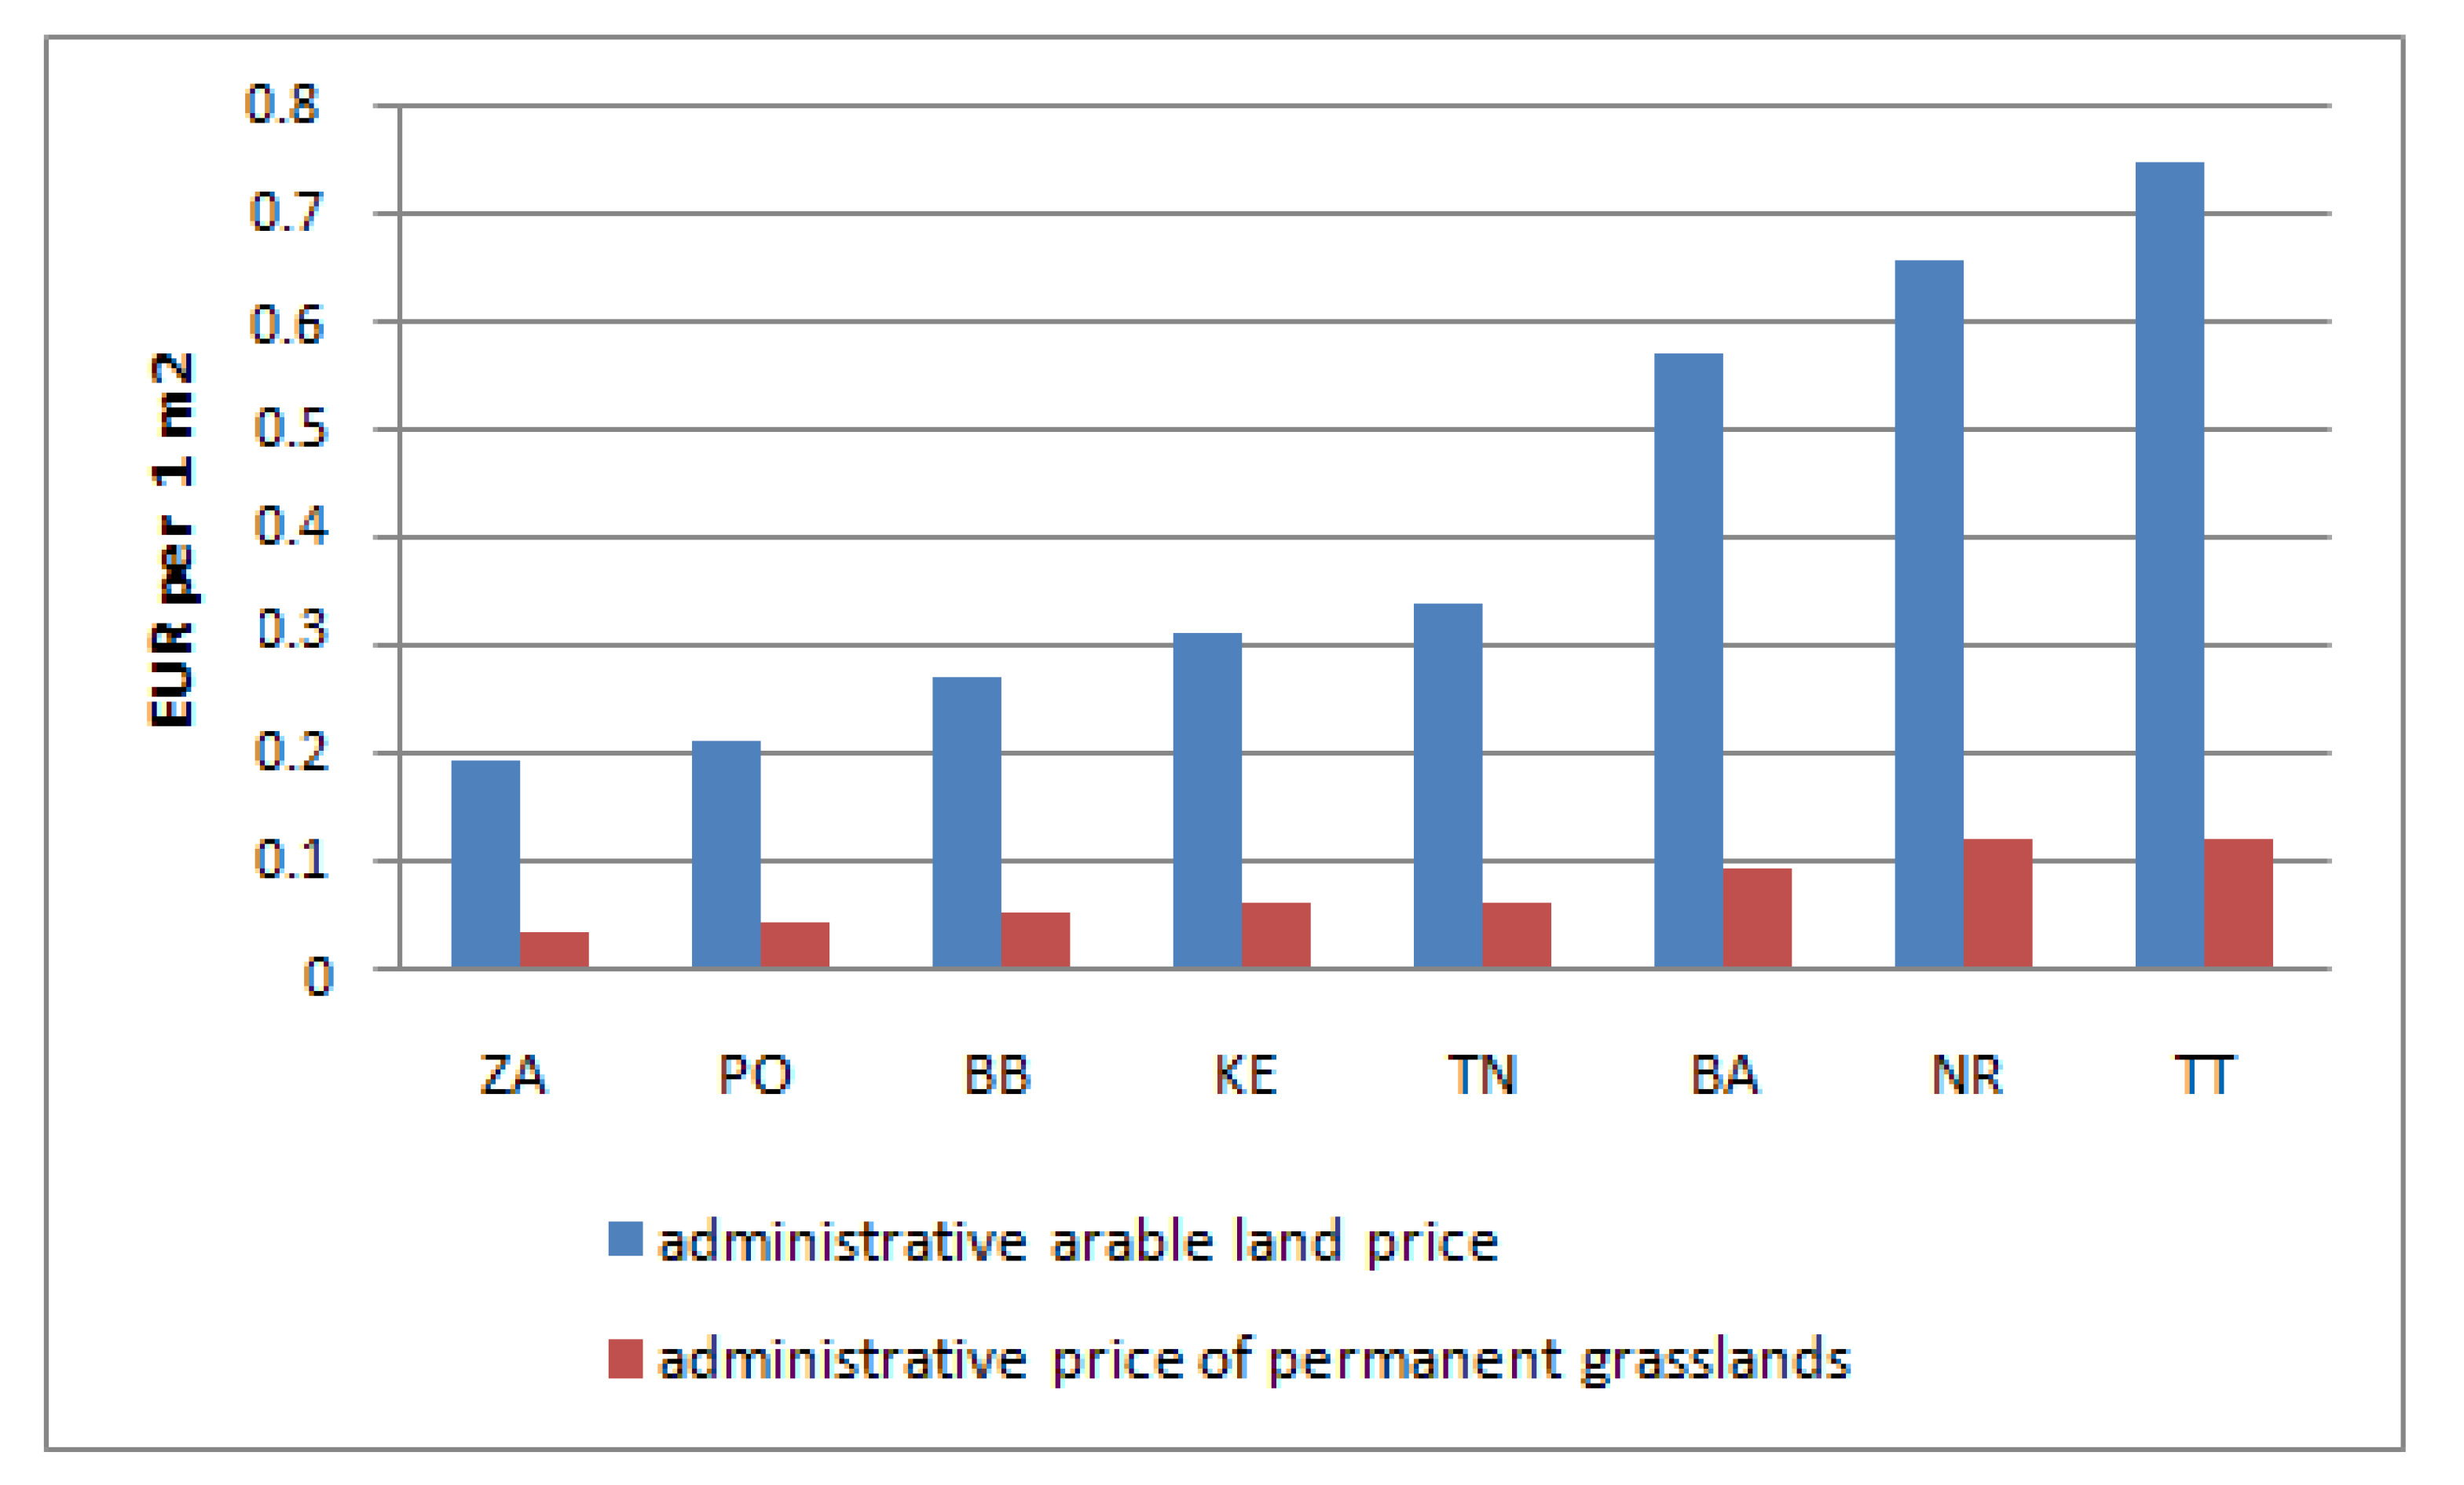
3.3. Regional Differences of Proposed Land Prices in Slovakia

Descriptive statistics for proposed land prices in particular regions (NUTS III) of Slovakia are shown in Table 1. We also show median and modus values, which are sometimes very different from the average proposed land prices due to a wide range of land prices in some regions. Therefore, these statistics provide a better and more realistic indication of proposed land prices.
Average proposed land prices in Slovakia increased between 2014 and 2018.The average price was 0.43 EUR per 1 m2 in 2014, 0.72 EUR per 1 m2 in 2016 and 1.11 EUR per 1 m2 in 2018. However, the average proposed land price did not regularly increase year to year in particular regions in line with inflation, but it increased and decreased irregularly. Therefore, it is very difficult or impossible to predict further development. The average proposed land prices were the highest in 2014 in most of the regions when land supplies started being published in the register on the website of the Ministry. During the following year, the proposed land prices decreased noticeably in these regions. Knowledge of the land market from the first year (2014) and a small database of proposed land prices in the Ministry register (after 2014) enabled landowners to supply their land at more realistic prices in the years that followed. This trend was due to a lack of information on land market prices and the lack of a land price information system in Slovakia. The market subjects had perceived information on market land prices as a trade secret [40]. This made the decision-making process of landowners more difficult when selling their land, mainly in 2014.
If there was a lack of information on the market, we presumed that landowners would use the proposed land prices of neighboring regions or the administrative land prices stipulated by law.
Firstly, we examined use of the proposed land prices of neighboring regions with the Moran I index and Moran scatter plots (Figure 6). Moran’s I index was 0.215, indicating a low positive autocorrelation between proposed land prices. The Z-score (3005) was higher than the expected value E (I) = abs(−0.015), meaning that the Moran I index was statistically significant. Therefore, we could refuse the hypothesis about the non-existence of spatial autocorrelation and about the accidental arrangement of proposed land prices in Slovak regions. In other words, proposed land prices had a positive spatial autocorrelation (the Z-score and Moran’s index were positive), and we could confirm that landowners were influenced by the proposed land prices of neighboring regions.
Moran’s diagram creates four quadrants; each of these charts a particular type of relation between the original values of indicators (localized on the horizontal axis) and average values of the neighbor indicators (localized on the vertical axis). The relations between values of indicators influence the regression slope that represents Moran’s I index (Figure 6).
Units localized in the upper right quadrant (hot spots) and bottom left quadrant (cold spots) indicate positive spatial autocorrelations. The upper left quadrant and bottom right quadrant signalize negative spatial autocorrelations. There are spatial outliers. The Moran diagram signalized that most units were concentrated in the bottom left quadrant and in the upper right quadrant, which proved the positive spatial autocorrelation of proposed land prices in Slovak regions. It confirmed that most proposed land prices during the period studied were positively influenced by the proposed land prices of neighboring regions. Figure 7 presents, in a more comprehensible way, the positive spatial autocorrelation of proposed land prices in Slovakia.
Secondly, we examined the administrative land prices stipulated by Act No. 582/2004 Coll. on local taxes and fees for communal waste, as a land price indicator for landowners. The annex of this act includes the administrative prices of arable land and permanent grasslands in the particular municipalities of Slovakia. We considered this to be a valuable indicator for landowners when they wanted to purchase their land plots and information on market prices was missing. Therefore, we analyzed the statistically significant differences between land prices proposed by landowners and administrative land prices included in the abovementioned act. The results are documented in Table 2.
According to these results, we can conclude that the administrative land prices did not influence landowners when supplying their land plots for purchase. There were statistically significant differences between proposed land prices and administrative land prices in most regions during the entire period observed. There were some exemptions, such as the Nitra region and the Trnava region. In the Nitra region, the proposed land prices were higher; however, they were not statistically significantly higher than the administrative land prices during the first three years. In the next period of time, the proposed land prices became statistically significantly higher than administrative land prices due to foreign investments in this region. There were statistically significant differences in the Trnava region in 2015; however, the administrative land prices were higher than the proposed land prices. Land plots with the best soil fertility were sold under the level of administrative land prices. There was a similar trend the following year, but the differences between the proposed land prices and administrative land prices were not statistically significant.
Soil fertility is reflected in the administrative land prices included in Act 582/2004 Coll. mentioned above. Administrative land prices are stipulated by natural indicators, including soil quality and fertility. The average administrative land prices (arable land prices and prices of permanent grasslands) of particular regions are documented in Figure 8.
If we consider the soil fertility of the land in particular regions, we can state that statistically significant differences increased during the period studied with decreasing soil fertility. Land plots with the most fertile soil are situated in the Trnava region, the Nitra region and the Bratislava region. Land plots with the poorest soil fertility are usually found in northern regions, such as the Žilina region and the Prešov region. If we compare the proposed land prices and the average administrative land prices representing soil fertility, the price scissors between proposed land prices and administrative land prices open towards smaller administrative land prices.
Figure 8 shows statistically significant differences between the administrative prices of arable land and permanent grasslands. Therefore, we were interested in the statistically significant differences between these in relation to proposed land prices in the particular regions studied. We usedthe F-test to determine the statistically significant differences in variance between two compared files in order to decide whether to use a t-test with unequal or equal variances. The results are documented in Table 3.
There were no statistically significant differences between the supply price of arable land and permanent grasslands in regions where one type of agricultural land predominates; e.g., in the Banská Bystrica region, permanent grassland predominates, and in the Trnava region, arable land predominates. In other regions, we found that there were usually statistically significant differences between the supply price of arable land and permanent grasslands. It follows that despite the fact that landowners do not stick to administrative prices, they are aware of differences in land prices depending on the type of agricultural land they supply for sale.
According to Table 1, which shows basic descriptive statistics, we can assume that there are statistically significant differences among the regions studied (NUTS III), relating to proposed land prices. However, only according to the multiple range tests can we confirm which regions have similar or different supply prices with statistical significance. We used the Kruskal–Wallis test with the multiple ranges tests. The results are documented in Table 4.
We can conclude that there were statistically significant differences in the proposed land prices among the NUTS III regions in Slovakia during the period studied. The lowest average proposed land prices were in the Košice region, and the highest average supply prices were usually recorded in the Trenčín region and the Žilina region. When we compare Figure 8 and Table 4, it can be seen that regions with the best soil fertility are not in the most expensive places, meaning that this land is not supplied at the highest average proposed land prices. Landowners in regions with poor soil fertility, such as the Žilina region and the Prešov region, supply their land plots at much higher prices. The largest differences between proposed land prices and administrative land prices can be seen in these regions. Of course, land prices are influenced by many other factors, such as the following: the price of agricultural commodities, infrastructural expansion, urban pressures, subsidies, farm size, informal institutions, interest rates, agricultural productivity, bioenergy, rural development policies, taxes, inflation, land-sale regulation and other forms of legislation [41], climate, and the acreage of agricultural land in a particular country and its economic scarcity [9]. However, suppose that the landowner does not consider the soil fertility of the supply land plots in the first place when deciding upon the proposed land price. In this case, we can assume that the land plots are not being purchased primarily for agricultural business purposes. These conclusions can be supported by the fact that agricultural land (arable land and permanent grasslands together) declined in each region between 2014 and 2018, as documented in Figure 9.
In addition, most of the decline in agricultural land was in regions with higher proposed land prices and the poorest soil fertility.

4. Discussion

Findings relating to regional differences point to two remarkable facts. Land market prices proposed by landowners were unstable during the observed period. Prices were not developed by a foreseeable trend that could be predicted by statistical methods. In the first year of land supplies being published in the register, proposed land prices were much higher than the prices during the next period of time in most regions. The main reason for this is the lack of information, at that time, on the land market in Slovakia. This caused uncertainty and confusion on the part of market participants and uneven development of the land market. Participants in agricultural land markets require comprehensive statistics in order to make informed decisions about agricultural land and associated production [42]. The act on land acquisition partially eliminated this lack of information by establishing the register of land supplies. We do not want to defend the whole act because it restricted the owners in their owner’s right; however, such a register of land supplies has been useful for land-market participants. Lawmakers should adopt legislative measures that ensure transparent information on land-market transactions, either at the conclusion of the contract or after the contract’s conclusion. Many EU countries have implemented price-monitoring systems to increase the transparency of price formation in farmland markets due to the recent land-price surge [19]. The land-market results that were observed in only 12 of Slovakia’s districts (and published in the green report [18]) are not sufficient. In spite of the lack of information, landowners were not found to have been influenced by administrative land prices stipulated by the law; however, they took into account the proposed land prices of neighboring regions when making decisions about the proposed land prices of their land plots.This proves the need to restore the evidence held by the Ministry in its register of land supplies.
The second fact emerging from the abovementioned analysis is that agricultural land is still increasingly being used for non-agricultural purposes. The price scissors between proposed land prices and administrative land prices open towards smaller administrative land prices. Moreover, poor-quality land is more expensive than land of a higher quality, which is clearly unfair on farmers. However, investors intending to use land for non-agricultural purposes are able to buy this land, and they can crowd out agricultural production from these regions. Agricultural land is a limited natural resource and, as a result of its decline, is becoming an increasingly valuable economic asset [43]. As with limited natural resources, land needs to be used primarily for agricultural purposes to ensure sufficient food for a country’s inhabitants. Therefore, lawmakers should adopt legislative measures that ensure that land stays in the hands of farmers in all regions of a country. Thus, knowledge of regional differences is important. There are also other reasons for this argument. Firstly, lawmakers could adopt support measures for the purchase of land by farmers, taking into account the needs of all farmers, including those from less productive areas with higher proposed land prices (e.g., the Prešov region or the Žilina region).If we were to rely only on average data representing the whole country, many farmers could remain outside the scope of such measures, as documented in Table 1 and the average data for the whole country that are shown below this table. Secondly, Slovakia is typical in its land diversity, with a higher proportion of lowlands in the south, and highlands in the middle and in the north of the country. Therefore, average data relating to the country as a whole are not sufficient for providing the right incentive for farmers to buy a land plot. Without the right support, farmers will not be able to participate in the land market, mainly due to high land prices in the regions with poorer soil quality; the land will be sold to other market participants, mainly for non-agricultural purposes, and agricultural production will be crowded out of these regions. Only knowledge of the needs of farmers in each region can enable lawmakers to set up the land market in such a way as to ensure the sustainability of agricultural production throughout the country and to ensure that land is not taken away for non-agricultural purposes.
The new amendment to the act on land acquisition has now been prepared, and one of the main aims of the amendment is to limit the amount of land that can be owned. Natural persons, including farmers, will no longer be allowed to own more than 300 hectares of agricultural land, and legal entities will not be permitted to own more than 1200 hectares of agricultural land. According to the explanatory report, these limits are intended to prevent single owners or a few owners from accumulating large swathes of agricultural land. However, the explanatory report does not include details on how the proposed limits have been set. The first step in projecting potential future changes in agricultural land use is to understand and represent, in models, both the socioeconomic and physical processes that control current land-use distributions [44]. We consider that the main objective should be to maintain agricultural land for agricultural production in all regions of Slovakia. It is necessary to ensure the pre-emption rights to buy a land plot in favor of farmers, primarily those with small or medium-sized farms. On the other hand, natural persons or legal entities entitled to pre-emption rights should have agricultural business as a main activity, not one of the additional activities registered in the business register. In addition, the abovementioned objective should be to provide support through financial measures, such as loans or subsidies, for agricultural land purchase, with the possibility of more advantageous conditions for farmers from regions with very high proposed land prices, in order for them to be more competitive in the agricultural land market. The proposed upper limits on land purchase size would be more appropriate and transparent in relation to such financial measures. Banks and other financial institutions’ ability and capacity to lend money are underpinned by an efficient land market, which, in turn, requires an efficient land administration system [3]. However, regional differences in land supplies related to prices, quantities and quality should be taken into account to ensure that the adopted measures are available to farmers from all regions of Slovakia, thereby maintaining sustainable agricultural production across the whole country.

5. Conclusions

Agricultural land is a limited natural resource with increasing value, given its importance for ensuring food security for a country’s inhabitants. However, the development of proposed land prices suggested by landowners threatens this trend in particular regions of Slovakia.
Fluctuations in proposed land prices reflect a lack of available information on the agricultural land market. This has been proven by the fact that average proposed land prices were highest in 2014 in most of the regions studied, when land supplies started being published in the register on the website of the Ministry. During the year that followed, proposed land prices decreased. Supply land trends in these particular regions show that the register of land supplies can eliminate the lack of information and its negative consequences for the land market. Furthermore, during the period studied, landowners clearly took into account the proposed land prices of neighboring regions when deciding to sell their land plots.
Moreover, in spite of the fact that land market prices were missing, administrative land prices reflecting soil fertility were not considered in proposed land prices. There were statistically significant differences between proposed land prices and administrative land prices in most regions during the whole period observed, with only two exemptions, i.e., the Nitra region and the Trnava region, the regions with the most fertile soil. Prices scissor between proposed land prices and administrative land prices open towards smaller administrative land prices. On the other hand, statistically significant differences were usually found between the supply price of arable land and permanent grasslands in most regions. It follows that despite the fact that landowners do not follow administrative prices, they are aware of differences in land prices depending on the type of agricultural land.
The statistical analysis confirmed statistically significant differences in the proposed land prices among regions in Slovakia. However, the regions with the best soil fertility were not found to be those in the most expensive places. Landowners from regions with poorer soil fertility supply their land plots at higher prices. If landowners do not consider the soil fertility of the supply land plots in the first place when setting the proposed land price, we can assume that the land plot is not primarily being purchased for the purposes of agricultural business. Therefore, legislative measures should aim to keep agricultural land for agricultural production.However, the Slovak government has proposed an amendment to the law, imposing upper limits on the amount of land that can be owned.These upper limits, without deeper analysis, will be discriminatory and will mainly exclude agricultural farms from the agricultural land market; they will not be able to draw on the benefits of economies of scale by purchasing additional units of land.
We consider that a system to provide transparent information on the land market will be more effective at meeting the objectives of lawmakers. Such a transparent informational system for the land market would be a challenge but a significant step towards securing sustainability in agriculture. On the other hand, to maintain land for agricultural purposes and for agricultural farmers, pre-emption rights for farmers would be a more appropriate legislative measure than upper limits on the size of land purchases. This measure could be used in relation to financial measures, such as loans for land purchases, with more advantageous conditions taken into account in terms of regional differences in the land market. However, favorable conditions should be guaranteed only for those who are active primarily in agriculture and not entities for whom agriculture is only an additional activity.

Author Contributions

Conceptualization, J.L. and Ľ.R.; methodology, J.L.; validation, J.L., Ľ.R. and I.T.; formal analysis, J.L. and Ľ.R.; investigation, J.L. and Ľ.R.; resources, J.L. and Ľ.R.; data curation, Ľ.R. and I.T.; writing—original draft preparation, J.L. and Ľ.R.; writing—review and editing, Ľ.R., I.T., P.P. and A.F.; visualization, A.F. and P.P.; supervision, A.F. and P.P.; project administration, J.L. and Ľ.R.; funding acquisition, J.L., P.P. and Ľ.R. All authors have read and agreed to the published version of the manuscript.

Funding

This research was funded by the Operational Program Integrated Infrastructure within the following project: Demand-driven research for the sustainable and innovative food, Drive4SIFood 313011V336, co-financed by the European Regional Development Fund and by the Grant Agency FESRD projects no. 7/2017, “The impact of CAP supportive mechanism on the market with agricultural land in Slovakia”.

Institutional Review Board Statement

Not applicable.

Informed Consent Statement

Not applicable.

Data Availability Statement

Not applicable.

Conflicts of Interest

The authors declare no conflict of interest.

References

  1. Courleux, F. Regulating Agricultural Land Markets: The Main Economic Arguments. Paris, Agriculture Stratégies. 2019. Available online: https://www.agriculture-strategies.eu/wp-content/uploads/2019/11/191127-R%C3%A9guler-les-march%C3%A9s-fonciers-agricoles-VFinale.pdf (accessed on 3 April 2021).
  2. Cheshire, P.; Sheppard, S. Land markets and land market regulation: Progress towards understanding. Reg. Sci. Urban Econ. 2004, 34, 619–637. [Google Scholar] [CrossRef] [Green Version]
  3. Mahoney, R.; Dale, P.; McLaren, R. Land Markets—Why are They Required and How Will They Develop? Strategic Integration of Surveying Services, FIG Working Week 2007, Hong Kong SAR, China. 2007. Available online: https://www.fig.net/resources/monthly_articles/2007/july_2007/july_2007_mahoney_dale_mclaren.pdf (accessed on 3 April 2021).
  4. Dirgasová, K.; Lazíková, J. Agricultural land ownership as Food sovereignty: The case of Slovakia. In Agricultural Law. Current Issues from a Global Perspective; Alabrese, M., Brunori, M., Rolandi, S., Salba, A., Eds.; Springer: Cham, Switzerland, 2017. [Google Scholar]
  5. Ciaian, P.; Kancs, D.; Drábik, D. Land Markets in Europe: Institutions and Market Outcomes; Working Paper; EERI Research Paper Series, No. 10/2016; Economics and Econometrics Research Institute (EERI): Brussels, Belgium, 2016. [Google Scholar]
  6. Swinnen, J.; Van Herck, K.; Vranken, L. Land Market Regulations in Europe; Discussion Paper 354/2014; LICOS Discussion Paper Series; LICOS Centre for Institutions and Economic Performance: Leuven, Belgium, 2014; Available online: https://www.econstor.eu/bitstream/10419/126507/1/797825487.pdf (accessed on 10 February 2021).
  7. Deininger, K.; Carletto, G.; Savastano, S. Land Market Development and Agricultural Production Efficiency in Albania. Paper Prepared for Presentation at the Joint IAAE—104th EAAE-Seminar Agricultural Economics and Transition: “What Was Expected, What We Observed, the Lessons Learned”, Corvinus University of Budapest, Budapest, Hungary, 5–8 September 2007. Available online: https://ideas.repec.org/p/ags/eaa104/7817.html (accessed on 26 April 2020).
  8. Van der Molen, P. Tenure and Tools, Two Aspects of Innovative land Administration. Background Paper ‘Evening Lecture’ RICS, London, UK. 2006. Available online: https://www.researchgate.net/publication/242153464_Tenure_and_Tools_two_aspects_of_innovative_land_administration (accessed on 10 January 2020).
  9. Buday, Š.; Bradáčová, K. Monitorovanie trhu S Pôdou, Prenájom A Renta Vo Vybraných Regiónoch SR A Jeho Multifaktorová Analýza Za Rok 2005. (Monitoring of The Agricultural Land Market, Land Lease and Land Rent in The Selected Regions of SR and Its Multi-Factorial Analysis in 2005); Research Institute of Agricultural and Food Economics: Bratislava, Slovakia, 2007. [Google Scholar]
  10. Ciaian, P.; Kancs, D.; Swinnen, J.F.M.; Van Herck, K.; Vranken, L. Institutional Factors Affecting Agricultural Land Markets; Working Paper No. 16; Centre for European Policy Studies: Brussels, Belgium, 2012; Available online: http://aei.pitt.edu/58519/1/Factor_Markets_16.pdf (accessed on 28 January 2021).
  11. Lerman, Z.; Csaki, C.; Feder, G. Land Policies and Evolving Farm Structures in Transition Countries; Policy Research Working Paper; The World Bank: Washington, DC, USA, 2002; Available online: http://documents1.worldbank.org/curated/en/885151468746704912/120520322_20041117152044/additional/multi0page.pdf (accessed on 28 January 2021).
  12. Buday, Š. Land market and agricultural land use after the EU enlargement. Agric. Econ. Czech. 2007, 53, 145. [Google Scholar] [CrossRef] [Green Version]
  13. Lazíková, J.; Bandlerová, A. NadobúdanieVlastníckehoPráva k PoľnohospodárskejPôdEcudzincaminaSlovensku/Acquisition of Ownership of Agricultural Land by Foreigners in Slovakia/. Výzvy a PerspektívyAgrárnehoPrávaEurópskejÚnie/Challenges and Perspectives of Agricultural Law of the European Union; Slovak University of Agriculture: Nitra, Slovakia, 2014; pp. 115–124. [Google Scholar]
  14. Sikorska, A.; Karwat-Woźniak, B.; Chmieliński, P. Changes in the Agricultural Land Market and Agrarian Structure of Individual Farms in Poland. Econ. Sociol. 2009, 2, 67–79. [Google Scholar] [CrossRef] [PubMed]
  15. Seeman, T.; Šrédl, K.; Prášilová, M.; Svoboda, R. The Price of Farmland as a Factor in the Sustainable Development of Czech Agriculture (A Case Study). Sustainability 2020, 12, 5622. [Google Scholar] [CrossRef]
  16. Ciaian, P.; Kancs, D.; Swinnen, J.F.M.; Van Herck, K.; Vranken, L. Sales Market Regulations for Agricultural Land in EU Member States and Candidate Countries; Working Paper No. 14; Centre for European Policy Studies: Brussels, Belgium, 2012; Available online: https://www.ceps.eu/download/publication/?id=7399&pdf=FM_WP14%20CEPS%20on%20Sales%20Market%20Regulations_D15.1_Final.pdf (accessed on 28 January 2021).
  17. Ministry of Agriculture and Rural Development of the Slovak Republic. Green Report on Agriculture and Food in the Slovak Republic for 2019. 2020. Available online: https://www.mpsr.sk/zelena-sprava-2020/122---16206/ (accessed on 28 February 2021).
  18. Ezcurra, R.; Iraizoz, B.; Pascual, P.; Rapún, M. Spatial disparities in the European agriculture: A regional analysis. Appl. Econ. 2008, 40, 1669–1684. [Google Scholar] [CrossRef] [Green Version]
  19. Yang, X.; Odening, M.; Ritter, M. The Spatial and Temporal Diffusion of Agricultural Land Prices. FOR Land-Working Paper, No. 01 (2018), Humboldt-Universität zu Berlin, DFG Research Unit 2569 FOR Land “Agricultural Land Markets-Efficiency and Regulation”, Berlin, Germamy. 2018. Available online: https://www.econstor.eu/bitstream/10419/213055/1/FORLand-2018-01.pdf (accessed on 31 January 2021).
  20. Meiyappan, P.; Dalton, M.; O’Neill, B.C.; Jain, A.K. Spatial modeling of agricultural land use change at global scale. Ecol. Model. 2014, 291, 152–174. [Google Scholar] [CrossRef] [Green Version]
  21. Moran, P.A.P. Notes on continuous stochastic phenomena. Biometrika 1950, 37, 17–23. [Google Scholar] [CrossRef] [PubMed]
  22. Cliff, A.D.; Ord, J.K. Spatial Autocorrelation; Pion: London, UK, 1973; 178p, ISBN 978-0850860375. [Google Scholar]
  23. Kusendová, D.; Solčianska, J. Testovanie priestorovej autokorelácie nezamestnanosti absolventov vysokých škôl okresov Slovenska. In Sborník referátov konference GIS Ostrava 2007; VŠB TU Ostrava: Ostrava, Czech Republic, 2007. [Google Scholar]
  24. Gunaratna, N.; Liu, Y.; Park, J. Spatial Autocorrelation. J. Recuperado 2013, 2, 1–14. [Google Scholar]
  25. Statistical Yearbook on Land Fund in the SR. 2015. Available online: http://www.skgeodesy.sk/files/slovensky/ugkk/kataster-nehnutelnosti/sumarne-udaje-katastra-podnom-fonde/statisticka-rocenka-2014.pdf (accessed on 15 January 2021).
  26. Statistical Yearbook on Land Fund in the SR. 2016. Available online: http://www.skgeodesy.sk/files/slovensky/ugkk/kataster-nehnutelnosti/sumarne-udaje-katastra-podnom-fonde/statisticka-rocenka-2015.pdf (accessed on 15 January 2021).
  27. Statistical Yearbook on Land Fund in the SR. 2017. Available online: http://www.skgeodesy.sk/files/slovensky/ugkk/kataster-nehnutelnosti/sumarne-udaje-katastra-podnom-fonde/statisticka-rocenka-2016.pdf (accessed on 15 January 2021).
  28. Statistical Yearbook on Land Fund in the SR. 2018. Available online: http://www.skgeodesy.sk/files/slovensky/ugkk/kataster-nehnutelnosti/sumarne-udaje-katastra-podnom-fonde/statisticka-rocenka-2017.pdf (accessed on 15 January 2021).
  29. Statistical Yearbook on Land Fund in the SR. 2019. Available online: http://www.skgeodesy.sk/files/slovensky/ugkk/kataster-nehnutelnosti/sumarne-udaje-katastra-podnom-fonde/statisticka-rocenka-2018.pdf (accessed on 15 January 2021).
  30. Ministry of Agriculture and Rural Development of Slovak Republic. Programme for Rural Development of SR 2007–2013. Available online: https://mpsr.sk/program-rozvoja-vidieka-sr-2007-2013-verzia-c-8-platna-od-12-08-2015/296-43-296-10133/ (accessed on 28 February 2021).
  31. Bielek, P. Compendium to Practically Oriented Soil Science, 1st ed.; SPU: Nitra, Slovakia, 2014; pp. 84–86. [Google Scholar]
  32. Environmental Regionalization of the Slovak Republic. 2016. Available online: https://www.enviroportal.sk/uploads/files/Regionalizacia/2016/4Poda.pdf (accessed on 1 February 2021).
  33. FAO. The future of Food and Agriculture—Trends and Challenges; FAO: Rome, Italy, 2017. [Google Scholar]
  34. Ministry of Agriculture and Rural Development of Slovak Republic. Development Trends and Prospects. Available online: https://www.mpsr.sk/en/index.php?navID=24ň (accessed on 11 November 2020).
  35. European Commission. EU Agricultural Outlook 2017–2030. Available online: https://ec.europa.eu/info/news/eu-agricultural-outlook-arable-land-area-continue-its-decline_en (accessed on 15 November 2020).
  36. Lazíková, J.; Takáč, I.; Schwarcz, P.; Bandlerová, A. Agricultural land market in Slovakia—Economic and legal impacts of the Law no. 140/2014 Coll. on the land acquisition. Agric. Econ. Czech. 2015, 61, 367–376. [Google Scholar] [CrossRef] [Green Version]
  37. Lazíková, J.; Bandlerová, A.; Lazíková, Z. Legislation on land protection in Slovakia. Ecocycle 2020, 6, 98–105. [Google Scholar] [CrossRef]
  38. McEldowney, J. Current Priorities and Challenges in EU Agricultural Policy. 2017. European Parliamentary Research Service. Available online: https://www.europarl.europa.eu/RegData/etudes/BRIE/2017/607262/EPRS_BRI(2017)607262_EN.pdf (accessed on 12 January 2021).
  39. European Environment Agency. Climate Change, Impacts and Vulnerability in Europe 2016 an Indicator-Based Report. Available online: https://www.eea.europa.eu/publications/climate-change-impacts-and-vulnerability-2016 (accessed on 31 August 2020).
  40. Lazíková, J.; Takáč, I.; Buday, Š. Economic and legal aspects of the agricultural land market. Agric. Econ. Czech. 2012, 58, 172–179. [Google Scholar] [CrossRef] [Green Version]
  41. Swinnen, J.; Ciaian, P.; Kancs, D. Study on the Functioning of Land Markets in the EU Member States under the Influence of Measures Applied under the Common Agricultural Policy. Final Report. Centre of European Policy Studies: Brussels, Belgium 2008. Available online: https://www.econstor.eu/handle/10419/142516 (accessed on 30 November 2020).
  42. Loughrey, J.; Donnellan, T.; Hanrahan, K. The Agricultural Land Market in the EU and the Case for Better Data Provision. EuroChoices 2020, 19, 41–47. [Google Scholar] [CrossRef]
  43. Takáč, I.; Lazíková, J.; Rumanovská, Ľ.; Bandlerová, A.; Lazíková, Z. The Factors Affecting Farmland Rental Prices in Slovakia. Land 2020, 9, 96. [Google Scholar] [CrossRef] [Green Version]
  44. Rounsevell, M.D.A.; Annetts, J.E.; Audsley, E.; Mayrc, T.; Reginster, I. Modelling the spatial distribution of agricultural land use at the regional scale. Agric. Ecosyst. Environ. 2003, 95, 465–479. [Google Scholar] [CrossRef]
Figure 1. The acreage (in ha) of agricultural land and shares of arable land and permanent grasslands (in %) in the Slovak Republic, by region (NUTS III), in 2014.Source: own calculation based on data from Geodesy, Cartography, and Cadastre Authority of Slovak Republic, 2015(abbreviations:agricultural land (AA), the Bratislava region (BA), the Trnava region (TT), the Trenčín region (TN), the Nitra region (NR), the Žilina region (ZA), the Banská Bystrica region (BB), the Prešov region (PO), the Košice region (KE)).
Agriculture 11 00353 g001
Figure 2. The acreage (in ha) of agricultural land and shares of arable land and permanent grasslands (in %) in the Slovak Republic, by region (NUTS III), in 2018.Source: own calculation based on data from Geodesy, Cartography, and Cadastre Authority of Slovak Republic, 2019 (abbreviations: agricultural land (AA), the Bratislava region (BA), the Trnava region (TT), the Trenčín region (TN), the Nitra region (NR), the Žilina region (ZA), the Banská Bystrica region (BB), the Prešov region (PO), the Košice region (KE)).
Agriculture 11 00353 g002
Figure 3. Share of agricultural land (ha) by region (NUTS III) for 2014–2018. Source: own calculation based on data from Geodesy, Cartography, and Cadastre Authority of Slovak Republic, 2015, 2016, 2017, 2018 and 2019(abbreviations: agricultural land (AA), permanent grasslands (PG), the Bratislava region (BA), the Trnava region (TT), the Trenčín region (TN), the Nitra region (NR), the Žilina region (ZA), the Banská Bystrica region (BB), the Prešov region (PO), the Košice region (KE)).
Agriculture 11 00353 g003
Figure 4. Arable land (ha) and permanent grasslands (ha) supply during the period 2014–2018. Source: own calculation based on data from Ministry of Agriculture and Rural Development of the Slovak Republic(abbreviations: arable land (ARA), permanent grasslands (PG), the Bratislava region (BA), the Trnava region (TT), the Trenčín region (TN), the Nitra region (NR), the Žilina region (ZA), the Banská Bystrica region (BB), the Prešov region (PO), the Košice region (KE)).
Agriculture 11 00353 g004
Figure 5. Total land supply by region (NUTS III). Source: own calculation based on data from Ministry of Agriculture and Rural Development of the Slovak Republic(abbreviations: the Bratislava region (BA), the Trnava region (TT), the Trenčín region (TN), the Nitra region (NR), the Žilina region (ZA), the Banská Bystrica region (BB), the Prešov region (PO), the Košice region (KE)).
Agriculture 11 00353 g005
Figure 6. Moran scatter plot of proposed land prices in the particular districts (Local administrative units (LAU)1 by the Regulation No. 1059/2003 mentioned in the Material and Methods section). Source: own calculation (abbreviations: there are official shortcuts of all districts LAU 1 of Slovakia excluding the districts Bratislava I, II, III, IV and V and Košice I, II, III and IV; for more about the shortcut, visithttps://sk.wikipedia.org/wiki/Zoznam_okresov_na_Slovensku, accessed on 1 April 2021).
Agriculture 11 00353 g006
Figure 7. Spatial autocorrelation of proposed land prices in Slovakia(abbreviations: the Bratislava region (BA), the Trnava region (TT), the Trenčín region (TN), the Nitra region (NR), the Žilina region (ZA), the Banská Bystrica region (BB), the Prešov region (PO), the Košice region (KE)).
Agriculture 11 00353 g007
Figure 8. Average administrative arable land prices and administrative price of permanent grasslands in particular regions of Slovakia based on data from Act No. 528/2004 Coll. on local taxes and fees for communal waste (abbreviations: the Bratislava region (BA), the Trnava region (TT), the Trenčín region (TN), the Nitra region (NR), the Žilina region (ZA), the Banská Bystrica region (BB), the Prešov region (PO), the Košice region (KE)).
Agriculture 11 00353 g008
Figure 9. Land (arable land and permanent grasslands) declination in particular regions of Slovakia during the period 2014–2018 (abbreviations: the Bratislava region (BA), the Trnava region (TT), the Trenčín region (TN), the Nitra region (NR), the Žilina region (ZA), the Banská Bystrica region (BB), the Prešov region (PO), the Košice region (KE)).
Agriculture 11 00353 g009
Table 1. Descriptive statistics of proposed land prices in the particular regions (NUTS III) of Slovakia in 2014–2018.
Regions (NUTS III)Descriptive Statistics in EUR/m220142015201620172018
The Bratislava regionAverage1.750.661.540.681.03
Median1.000.351.000.500.50
Modus1.000.351.000.500.50
Standard deviation1.250.891.971.081.33
The Banská Bystrica regionAverage0.241.070.360.680.92
Median0.250.400.300.220.36
Modus0.122.000.300.220.40
Standard deviation0.180.880.611.251.68
The Košice regionAverage0.340.350.460.400.45
Median0.350.250.360.250.15
Modus0.520.350.390.300.08
Standard deviation0.290.430.560.590.73
The Nitra regionAverage0.580.490.651.051.02
Median0.410.410.450.680.84
Modus0.410.300.401.000.30
Standard deviation0.520.340.791.571.06
The Prešov regionAverage0.420.810.650.591.30
Median0.330.20.190.210.50
Modus0.330.20.150.201.00
Standard deviation0.371.551.051.031.97
The Trenčín regionAverage1.210.611.691.051.29
Median0.300.300.500.300.50
Modus0.300.200.490.300.22
Standard deviation1.691.131.991.751.65
The Trnava regionAverage0.680.500.650.961.20
Median0.420.350.450.550.70
Modus0.420.350.450.500.50
Standard deviation0.780.670.781.241.79
The Žilina regionAverage1.050.500.831.881.25
Median1.250.300.320.500.51
Modus1.250.190.350.200.10
Standard deviation0.360.631.372.911.94
Table 2. Statistical significant differences between proposed land prices and administrative land prices in the particular regions (NUTS III) of Slovakia, in 2014–2018, realized by paired t-test.
Region20142015201620172018
The Bratislava region4.102 ***
(0.000)
9.224 ***
(0.000)
11.041 ***
(0.000)
10.303 ***
(0.000)
8.321 ***
(0.000)
The Banská Bystrica region14.154 ***
(0.000)
55.372 ***
(0.000)
12.161 ***
(0.000)
12.007 ***
(0.000)
13.787 ***
(0.000)
The Košice region8.949 ***
(0.000)
7.054 ***
(0.000)
8.849 ***
(0.000)
3.120 ***
(0.002)
4.805 ***
(0.000)
The Nitra region1.937 *
(0.054)
2.487 **
(0.013)
2.374 **
(0.018)
7.879 ***
(0.000)
6.876 ***
(0.000)
The Prešov region7.494 ***
(0.0000)
12.209 ***
(0.000)
14.835 ***
(0.000)
14.059 ***
(0.000)
15.746 ***
(0.000)
The Trenčín region1.288 ***
(0.005)
9.150 ***
(0.000)
16.746 ***
(0.000)
14.755 ***
(0.000)
12.684 ***
(0.000)
The Trnava region2.171 **
(0.032)
−6.148 ***
(0.000)
−1.167
(0.244)
6.078 ***
(0.000)
5.587 ***
(0.000)
The Žilina region30.859 ***
(0.000)
15.290 ***
(0.000)
9.450 ***
(0.000)
10.183 ***
(0.000)
12.546 ***
(0.000)
Notes: *, ** and *** represent the level of significance on 10%, 5% and 1%.
Table 3. Statistical significant differences between supply prices of arable land and permanent grasslands in the particular regions (NUTS III) of Slovakia, in 2014–2018.
RegionTest Characteristics20142015201620172018
The Bratislava regionF-test-1.524 ***
(0.000)
1.207
(0.254)
34.005
(0.000)
1.773 ***
(0.000)
t-test-2.417 **
(0.016)
1.679
(0.094)
3.745 ***
(0.000)
0.871
(0.386)
The Banská Bystrica regionF-test1.196 **
(0.017)
1.036
(0.249)
1.242 ***
(0.000)
1.966 ***
(0.000)
1.333 ***
(0.001)
t-test−0.783
(0.434)
8.137 ***
(0.000)
1.459)
(0.145)
1.360
(0.174)
1.082
(0.280)
The Košice regionF-test2.142 ***
(0.000)
4.396 ***
(0.000)
1.691 ***
(0.000)
5.283 ***
(0.000)
3.766 ***
(0.000)
t-test2.277 **
(0.024)
3.817 ***
(0.000)
−1.679
(0.094)
1.556
(0.122)
2.311 **
(0.026)
The Nitra regionF-test2.550 ***
(0.000)
2.594 ***
(0.000)
5.205 ***
(0.000)
1.302 **
(0.038)
1.712 ***
(0.003)
t-test2.674 **
(0.010)
6.084 ***
(0.000)
3.354 ***
(0.001)
−0.884
(0.378)
1.347
(0.183)
The Prešov regionF-test4.461 ***
(0.000)
5.188 ***
(0.000)
1.204 **
(0.012)
2.422 ***
(0.000)
1.126
(0.122)
t-test2.682 ***
(0.009)
7.478 ***
(0.000)
2.131 **
(0.033)
1.727
(0.085)
0.679
(0.497)
The Trenčín regionF-test-3.632 ***
(0.000)
1.720 ***
(0.000)
2.653 ***
(0.000)
2.447 ***
(0.000)
t-test-4.828 ***
(0.000)
4.305 ***
(0.000)
6.980 ***
(0.000)
4.438 ***
(0.000)
The Trnava regionF-test-8.486 ***
(0.000)
1.583 ***
(0.006)
2.012 ***
(0.000)
1.019
(0.442)
t-test-1.297
(0.198)
1.084
(0.283)
−3.403 ***
(0.001)
0.641
(0.522)
The Žilina regionF-test-1.087
(0.245)
1.208
(0.125)
1.735 ***
(0.001)
1.258 **
(0.044)
t-test-4.765 ***
(0.000)
0.697
(0.486)
2.089 **
(0.038)
2.393 **
(0.017)
Notes: ** and *** represent the level of significance on 10%, 5% and 1%; (-) means that the tests were not possible to realize due to lack of observation in a particular group of supplies.
Table 4. Statistical significant differences of the proposed land prices among the particular regions (NUTS III), in 2014–2018.
Period of TimeKruskal-Wallis t-StatisticsMultiple Range Tests Results—Orders of the Regions
2014848.618 ***
(0.000)
1. BB
2. KE, PO
3.TT, NR
4. TN, ZA
5. BA
20151165.36 ***
(0.000)
1. KE
2. NR, ZA, TT
3. TN, BA
4. PO
5. BB
20162201.65 ***
(0.000)
1. BB, KE
2. TT, PO, NR
3. ZA
4. BA, TN
20171135.48 ***
(0.0000)
1. KE
2. BB, PO, BA
3. TT, TN, NR
4. ZA
2018360.38 ***
(0.000)
1. KE
2. BB, NR, BA
3. TT, ZA
4. TN, PO
2014–20183007.23 ***
(0.000)
1. KE
2. BB, NR
3. PO, TT, BA
4. ZA
5. TN
Notes: *** represents the level of significance on 10%, 5% and 1%. Abbreviations: the Bratislava region (BA), the Trnava region (TT), the Trenčín region (TN), the Nitra region (NR), the Žilina region (ZA), the Banská Bystrica region (BB), the Prešov region (PO), the Košice region (KE); the number 1 to 5 or 1 to 4 are groups of regions with the similar proposed land prices, where the first group presents the smallest proposed land prices, and the last group presents the highest proposed land prices.
Publisher’s Note: MDPI stays neutral with regard to jurisdictional claims in published maps and institutional affiliations.

