
You Say You Want a Data Revolution? Taking on Food Systems Accountability
by

Quinn Marshall
1,*, 
Alexandra L. Bellows
1,
Rebecca McLaren
2,
Andrew D. Jones
3 and
Jessica Fanzo
1,2,4 1
Bloomberg School of Public Health, Johns Hopkins University, Baltimore, MD 21205, USA
2
Berman Institute of Bioethics, Johns Hopkins University, Baltimore, MD 21205, USA
3
School of Public Health, University of Michigan, Ann Arbor, MI 48109, USA
4
Nitze School of Advanced International Studies, Johns Hopkins University, Washington, DC 20036, USA
*
Author to whom correspondence should be addressed.
Agriculture 2021, 11(5), 422; https://0-doi-org.brum.beds.ac.uk/10.3390/agriculture11050422
Submission received: 7 April 2021
/
Revised: 22 April 2021
/
Accepted: 1 May 2021
/
Published: 7 May 2021
(This article belongs to the Special Issue Agriculture and Food Systems – Global and Local Comparisons)
Abstract
:Dramatic improvements in data availability and quality are needed to meet the challenge of monitoring and analyzing food systems, so that appropriate policies and actions to improve human and planetary health can be identified and data-informed accountability mechanisms put in place to strengthen food systems governance. Studying food systems is complex due to diverse actors and interlinking processes that operate on multiple spatial and temporal scales, and their multiple outcomes, which may be subject to hidden feedback mechanisms and tradeoffs. However, descriptive research to characterize food system components and make comparisons across geography, income groups, and population groups is an important foundation. The first part of this article details a series of critical data gaps and limitations that are currently hindering food systems learning and accountability, also comparing these gaps across regions and income groups. The second part of the article introduces the Food Systems Dashboard, a new data visualization tool that aims to improve access to and usage of food systems-related data, thus strengthening the data value chain and better informing policies and actions intended to improve diets, nutrition, livelihoods, and environmental sustainability.
1. Introduction
Food systems are under pressure not only to deliver safe, nutritious food in adequate quantities and in a sustainable way, but also to help address poverty by creating jobs and decent livelihoods in an equitable manner [1,2,3,4]. Several recent landmark reports focusing on food systems have amplified the message that if we do not address the stark food insecurity and multiple forms of malnutrition that many people, especially the most marginalized, experience, the world will face significant challenges in moving sustainably and equitably forward [5,6]. The resilience of food systems has also been called into question, with disturbances, conflicts, and shocks—including the COVID-19 pandemic—demonstrating the interlinkages that exist between food systems and human and ecological systems, and further underscoring that progress towards food security and nutrition goals may be even more hard-fought during times of instability [6,7,8,9,10].
The environmental pressures exerted by food systems have increasingly dominated the research agenda on food security, focusing on agricultural, livestock and fishery production practices and related sustainability and welfare considerations. Along with the increased attention to climate change and the momentum of the Convention of Parties (COP), more integrated views of food systems have been featured in the reports produced by the Intergovernmental Panel on Climate Change (IPCC, Geneva, Switzerland) and the EAT-Lancet Commission on Healthy Diets from Sustainable Food Systems, as well as in the Food and Land Use Coalition’s (London, UK) Growing Better and the World Resource Institute’s (Washington, DC, USA) Creating a Sustainable Food Future reports [7,8,11,12]. Each of these recognizes the need to transform food systems holistically, addressing all forms of malnutrition without transgressing vital planetary boundaries. Environmental sustainability is now seen as critical to ensuring the long-term food security, nutrition and health of populations as well as wildlife, biodiversity and ecosystems, and essential to achieving the Paris Agreement’s emissions targets. The upcoming United Nations Food Systems Summit (New York, USA) at the end of 2021 is a signal of growing international attention to food systems issues, with a call for consensus on food systems approaches.
It is difficult though to fully comprehend food systems because of their myriad components, actors and processes. Food systems are constantly changing in ways that are often difficult to predict. In order to better characterize food systems, descriptive analysis of a comprehensive set of variables is an essential step, including diet, nutrition, livelihood, and environment-related outcomes as well as potential food system determinants. Comparisons of outcomes should be made across countries as well as within countries, including among different population sub-groups. Upstream food supply chain and food environment variables can also be compared across countries, sub-regions, and different commodities. While broad narratives of change exist, e.g., the nutrition transition, structural transformation, the supermarket revolution, there is less precision in how these trends play out at finer geographic scales or for certain population groups, e.g., dietary intake of specific food groups across socio-economic strata or the sub-national distribution of modern food retail outlets, including over the urban-rural continuum. These initial analyses may help generate hypotheses to test regarding the nature of relationships between food system determinants and multi-dimensional outcomes, as well as more complex analyses, such as modeling and systems science, and most critically, the implementation and evaluation of policy responses. Relationships between individual food system components, food and nutrition security, and environmental outcomes are difficult to establish and may change as broader food systems transform; however, measurement and descriptive analysis provide an essential foundation.
This paper will focus on current limitations of food systems data, especially gaps in data availability, which inhibit descriptive analyses and comparisons of food systems. It will then describe the development of the Food Systems Dashboard (FSD, Geneva, Switzerland) (https://foodsystemsdashboard.org/), a tool that brings together over 200 indicators from over 40 data sources across food systems, with the aim of facilitating food systems analysis and geographic comparisons. The tool is continually being expanded and improved. However, the dashboard is only as good as the data available and there is an enormous need for more and better data. In essence, food systems need a data revolution if the world wants to hold governments and the range of food system actors accountable. What cannot be measured, cannot be governed.
2. Data Availability and Gaps across Regions and Income Groups
Significant strides have been made in improving the availability of food system-related data, but gaps persist across all components of the food system, including supply chains (especially post-farmgate), food environments, diets, and diverse health, livelihood, and sustainability related outcomes. Data availability varies across geographic areas and income groups. Differences relate not only to varying levels of resources available to invest in large, potentially expensive data collection and surveillance efforts, but also the different priorities that countries may have with regards to their food systems.
Surveillance of diet quality through nationally representative dietary data collected at the individual-level remains absent in the vast majority of countries, despite rapid increases in diet-related noncommunicable diseases (NCDs) and expanding knowledge of the environment footprint of current dietary patterns [13]. High quality surveys, such as 24-h dietary recalls and food frequency questionnaires, are most common in high-income countries (HICs), but less available in sub-Saharan Africa and South Asia [14]. Sub-Saharan Africa has tended to collect dietary data through Demographic and Health Surveys (DHS), focusing on a narrower range of foods and targeting infants and young children, their mothers, and women of reproductive age [14]. This reflects the need for cost-efficiency (by integrating dietary data within already existing national data surveillance efforts like DHS), in addition to the prioritization of preventing undernutrition among vulnerable groups in the first 1000 days of life, through better monitoring of diet diversity measures. As multiple forms of malnutrition are now present in most countries, more dietary recalls and food frequency questionnaires in low-income countries would enhance national capacity to assess other relevant dimensions of diet quality beyond diversity, such as intake adequacy, balance, and moderation [13,15].
Data to characterize food environments are also geographically concentrated and most studies occur in HICs, especially the United States [16,17,18]. A recent scoping review limited to low and middle-income countries (LMICs) identified 70 food environment-related studies published between 2009 and 2017, though only 26% of these were in lower middle-income countries and none were in low-income countries. Regional gaps exist, particularly in sub-Saharan Africa (excluding South Africa), South Asia, and the Europe and Central Asia region [19]. This is partially due to the prevailing goal of linking food environments with overweight and obesity in the literature, however, it is also due to the underrepresentation of informal markets. While formal markets within the built food environment may be the most relevant food environment typology for HIC settings, in many LMIC settings, informal markets within the built food environment and natural food environments are important sources of food [20].
Food environment data is most typically gathered at the city, neighborhood, or school-level, and is not nationally representative. Studies accessing retail sales data have been able to document macro-level trends in the rise of supermarkets in LMICs, among other changes to the retail sector and broader food system, though national surveillance efforts to document the types of outlets and types of foods offered, especially at sub-national levels are still lacking [21,22,23]. A notable exception are food price data, which are commonly gathered by national statistical agencies with the intention of monitoring market conditions and living standards, often across sub-regions of the country [24]. The 2020 State of Food Insecurity and Nutrition in the World Report utilized price data reported by these agencies to the World Bank’s International Comparison Program to compare the affordability of a healthy diet across 170 countries [9].
Upstream from food environments, critical data gaps also limit our understanding of food production and supply chains. Gathering data along food supply chains is a complex endeavor due to the need for consistency, correct geographic scales, and sampling strategies that account for the different nodes of supply chains, not to mention different commodities [25]. Supply chains have been referred to as the “missing middle” in reference to the lack of coordination and disconnect between food production and consumption [26]. Food loss and waste data have received increased attention due to global targets within the Sustainable Development Goals (SDGs). While new indicators are being developed, the Food and Agriculture Organization (FAO, Rome, Italy) has noted that only 39 countries have reported official estimates of annual food losses between 1990 and 2017 as part of the compilation of its Food Balance Sheets (FBS). A meta-analysis conducted by FAO found that government-sponsored studies of food losses were most common in Latin America and the Caribbean, followed by North America and Europe, and mostly focused on fruits and vegetables, while unofficial studies were concentrated in Central and Southern Asia [27]. Another review of studies on food loss and waste found that data was also skewed towards the household and retail levels (i.e., waste), though this was particularly scarce among lower income countries [27].
Data to systematically describe most post-farmgate stages of supply chains are unavailable in sufficient quantity and quality. Though frameworks have emerged to classify types of processed foods and value chain transformations, these are relatively stylized, and quantitative data is not available to establish the extent of different types of food processing (including nutrition value-adding processing, such as fortification), food transformations along supply chains, nor the geographic distribution of manufacturing facilities and different types of foods within countries [28,29]. Due to the concentration of survey data at the household-level, which does not include commercial enterprises, knowledge of many key economic aspects of supply chains is also limited to a handful of countries where data exist; these aspects include post-farmgate productivity, value addition, prices, and margins captured by different supply chain actors, which collectively influence not only food sector-related livelihoods, but also drive retail prices paid by consumers [30].
3. Other Limitations in Food Systems Data
In addition to gaps in data availability, poor quality data and other data-related challenges can also impact the ability to monitor food systems, assess needs, design and implement appropriate policies and actions, and finally, improve accountability among those responsible for food systems governance [31,32,33,34]. Five additional limitations are highlighted.
First, data quality is often sub-optimal. In some cases, indicators on an important aspect of the food system are available, but only based on modeled estimates. As previously noted, the majority of countries do not have frequent dietary surveillance surveys [13]. Therefore, global dietary estimates utilize Bayesian or spatiotemporal Gaussian statistical analysis to generate dietary intake estimates from a variety of non-harmonized secondary data sources. In cases where a country does not have a recent dietary intake survey (or no nationally representative dietary intake surveys), modeled estimates rely heavily on data from subnational dietary surveys, household budget or income and expenditure surveys, retail sales data, and FAO FBS, each of which have shortcomings in their ability to capture dietary intake [13,35,36,37]. While these estimates provide a better understanding of dietary intake than the absence of data, their uncertainty may have a profound impact on prioritization of policies and programs to improve diets, and improving the quality of underlying data, through globally standardized individual-level diet surveys, would enhance their accuracy.
Second, data is often available only in highly aggregated form. It is particularly challenging to disaggregate data by geographic location at the subnational level. Recently, the Institute for Health Metrics (University of Washington, Seattle, WA, USA) and Evaluation released local burden of disease estimates for childhood nutritional status, where prevalences are estimated for 5 by 5- kilometer areas [38,39,40,41]. To better understand why nutritional status varies spatially within a country or among subgroups of a population, similar granularity in data and estimates for other components of the food system is needed. Currently, measures such as dietary intake, food availability, supermarket density, and sales in processed foods are available at the national level.
Third, the frequency of data collection is limiting and there is very little real-time data available across food system components [42]. Food systems are highly dynamic, constantly changing, and evolving. Yet, most data on food systems are collected using cross-sectional surveys, which are repeated infrequently, if at all. While updates to data on a yearly (or every couple years) basis may be satisfactory for certain indicators, like supermarket density, real-time data for more dynamic indicators such as food prices (for all food groups) and food availability may be quite useful for policymakers to identify trends quickly.
Fourth, the interconnectedness and multidisciplinary nature of food systems data makes exploring the relationships between food system inputs, processes, outputs, and outcomes a challenging endeavor. Food systems contain multiple feedback loops, which add a temporal dimension to causal relationships. Advanced statistics and systems-level modeling may provide valuable insight into these relationships, however, the data they require may not exist on the same time scales. Similarly, the spatial scales of data may be misaligned; for example, local data on the environmental impact of food production and consumption is scarce, making it difficult to assess the relationships between local farming systems, dietary patterns, and environmental health [43]. Examples of data compatibility challenges are common in food systems analysis due to the diverse disciplines, stakeholders, and priorities involved collecting data.
Finally, some data is not open-access or resides behind paywalls. Private sector market research firms collect and model data on critical components of the food environment and consumer behavior, but these data are behind paywalls, which may make it financially impossible for some researchers or policymakers to access this data, particularly in low resource settings. Additionally, other key data on consumers, including their preferences and situational factors that may influence dietary choices, are collected by many private sector food and marketing companies, but it is unlikely at this moment that these companies would be willing to make this data openly accessible.
4. A Visual Tool to Improve Data Usage
Data visualization consists of showing data in graphical form and it is one of the fundamental tools of modern data science [44]. Graphics should convey complex ideas with clarity, precision, and efficiency, enabling users to make comparisons and recognize patterns in the data [45]. They can take the form of charts, maps, or trendlines, among others; in comparison with showing raw data in table form, these provide a visual context that tells a story, displaying information more persuasively and impactfully.
While data visualization cannot directly address all of the limitations articulated in the previous section—particularly those related to data gaps—it plays an essential role in synthesizing and packaging the available data in a way that facilitates analysis and translation of information into action [31]. The role of visualization in food systems research is particularly valuable to decision-makers, as food systems research and analysis involves pulling data from multiple disciplines to describe system structures and features.
Various efforts have been undertaken to improve access to quality food systems data. Global databases that provide data on several components of the food system are constantly being expanded, such as the FAO’s FAOSTAT (http://www.fao.org/faostat/en), International Food Policy Research Institute’s (IFPRI) Global Food Security Portal (https://www.foodsecurityportal.org), and World Bank’s DataBank (https://databank.worldbank.org) among others. FAO’s Hand-in-Hand Initiative (http://www.fao.org/hand-in-hand/en) is working directly with countries to translate cutting-edge geospatial data into actions that will improve incomes and nutrition among the rural poor. There are also examples of indexes that attempt to consolidate diverse food systems data into a summary indicator, such as the Food Sustainability Index and the Sustainable Food Systems Global Index, which assess food systems across health, environmental, and economic outcomes [46,47].
Still, none of these tools provide a means for decision-makers and researchers to easily visualize and analyze food systems comprehensively, including their various components as well as their performance towards multiple outcomes, across many countries. Several databases focus on specific domains of expertise (e.g., agriculture production and food supply), which precludes users from viewing this data alongside the diet, nutrition, and environmental outcome indicators that may be impacted. In other cases, data on supply and demand-side factors are present, but are not placed within a food systems context.
Adding a “systems lens” to data that describe distinct, yet related components of a food system is part of the data curation function that data visualization tools can provide. This includes the selection and prioritization of indicators that will advance understanding of key aspects of the food system, but also the aggregation and framing of those indicators in a way that will advance understanding of the food system as a whole.
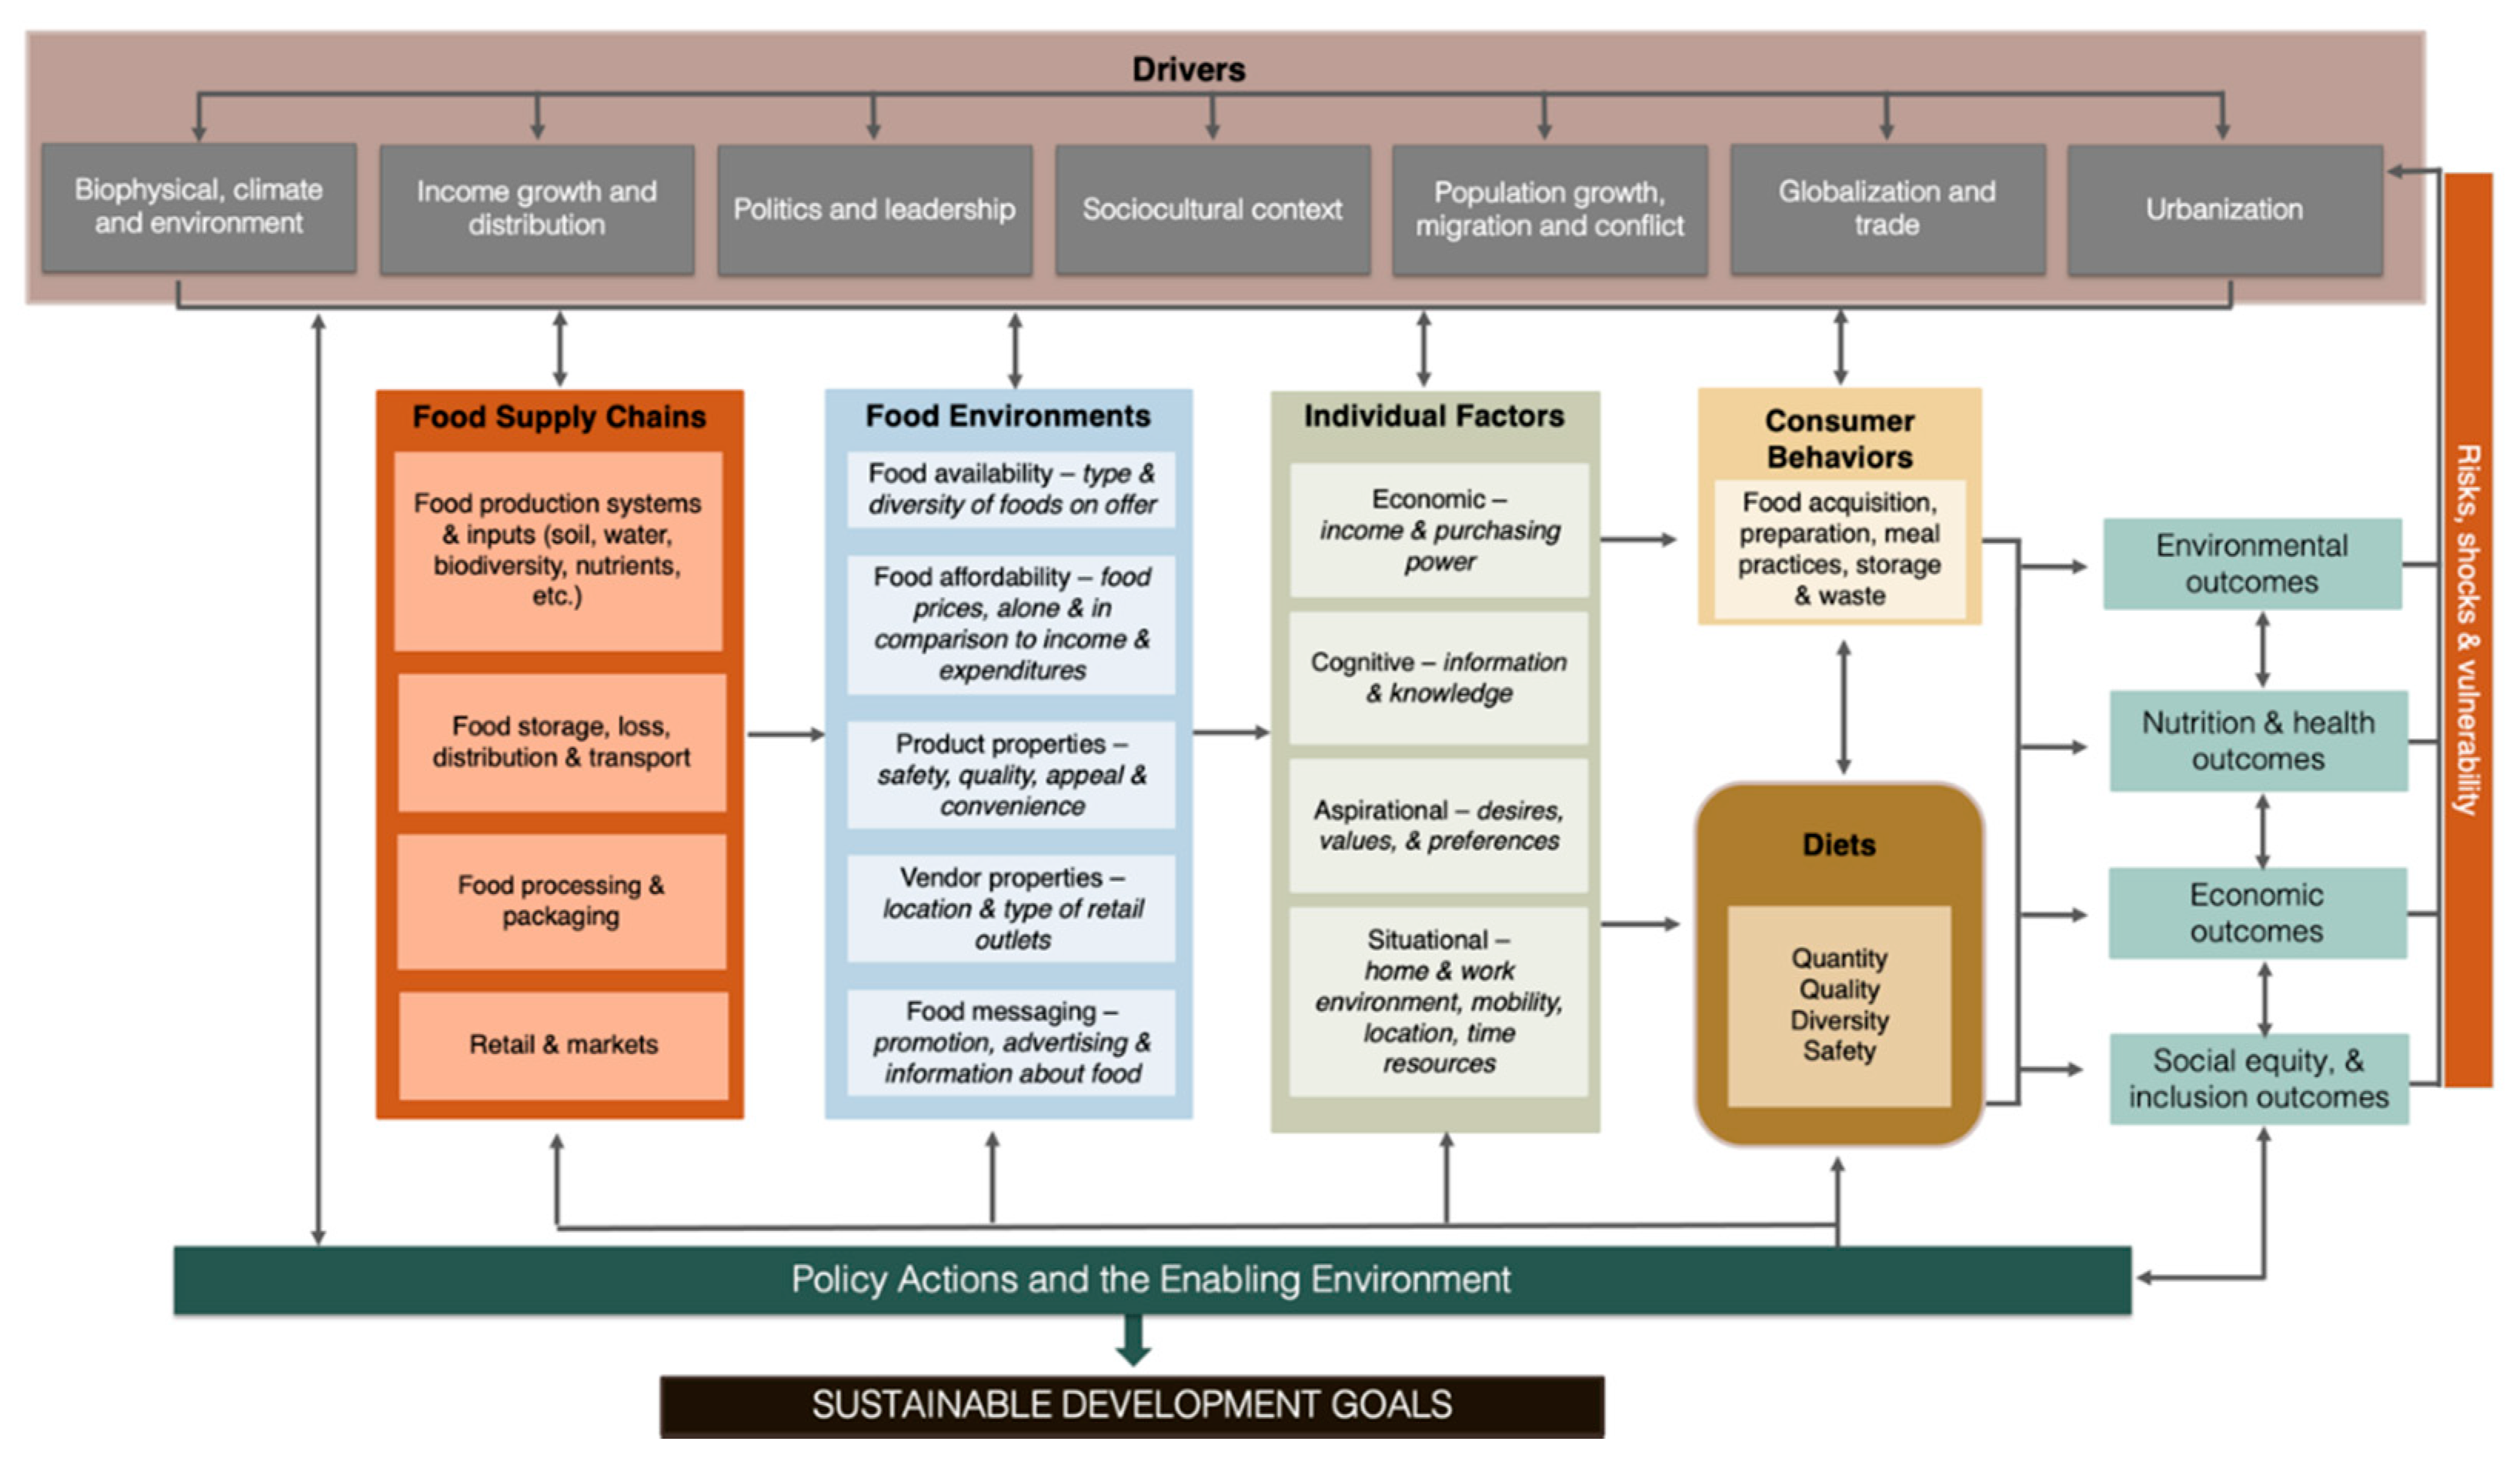
The Food Systems Dashboard (FSD) is a new tool, developed by a multi-disciplinary team of researchers, including the authors of this paper, that intends to fulfill some of these key systems-related data needs [48]. The FSD describes food systems by bringing together extant data across over 200 indicators from over 40 sources in a visually appealing, easy-to-navigate platform. These sources, which are both public and private, include United Nations agencies, the World Bank, Consultative Group for International Agriculture Research (CGIAR, Montpellier, France), Euromonitor, and cross-country project-based datasets. The indicators are organized using a conceptual framework, shown in Figure 1, which was developed by the authors and other FSD collaborators, and adapted from an earlier framework from the High Level Panel of Experts (HLPE, Rome, Italy) on Food Security and Nutrition of the Committee on World Food Security (Rome, Italy) [6]. The framework describes the components of the entire food system, including: food supply chains; food environments; individual factors; consumer behavior; diets and nutrition and environmental outcomes; and environmental, social, political and economic drivers, which push or pull the system in different directions. The data provide insights into different aspects of food systems that are not commonly included together in other food systems data visualization tools, thus allowing users to understand food systems in a more comprehensive way.
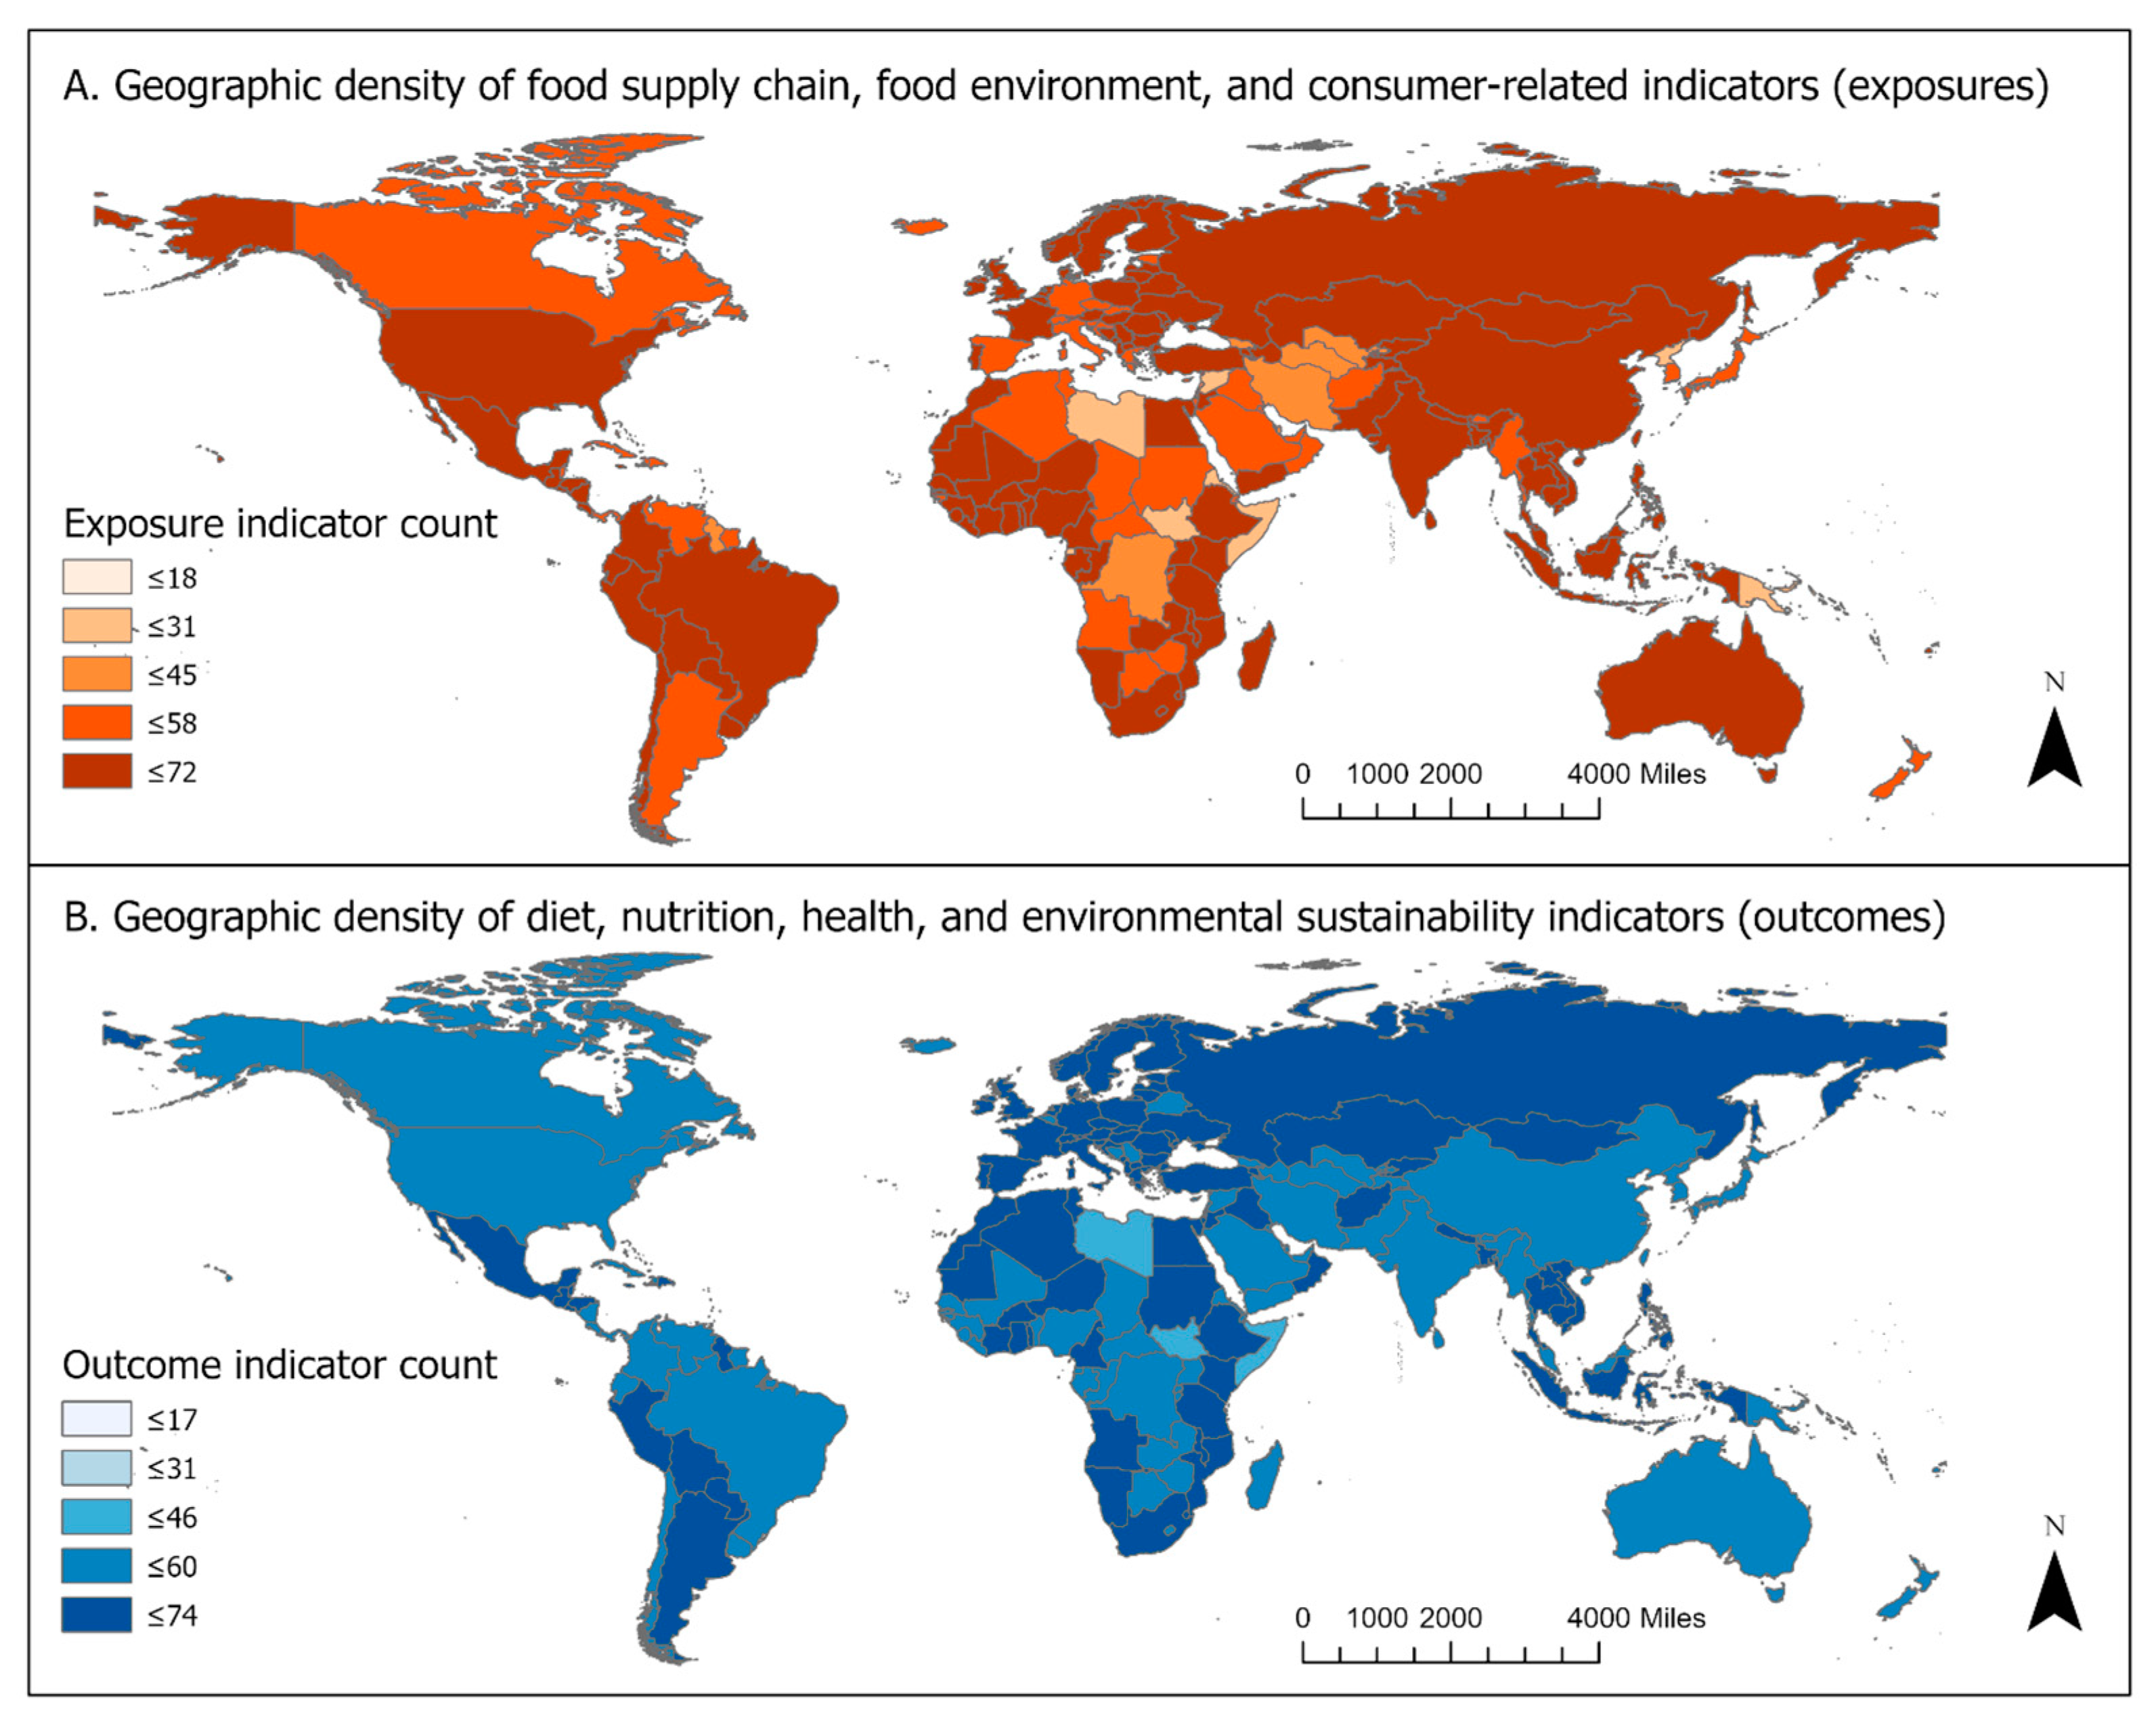
As it does not engage in primary data collection, the FSD is unable to directly address the data gaps previously mentioned, however, it prioritizes indicators with broad country and regional coverage, that are likely to be collected on a regular basis. The FSD also utilizes application data interfaces (APIs) to integrate with primary data sources, ensuring that data will be updated on a continual basis. Figure 2 shows the geographic density of indicator availability in the FSD, for (a) food supply chain, food environments, and consumer-related exposures and (b) diet, nutrition, health, and environmental sustainability outcomes. The number of data points available in the dashboard does not vary substantially by region, however, in several conflict-affected countries, data is sparser, particularly in the case of food system exposures.
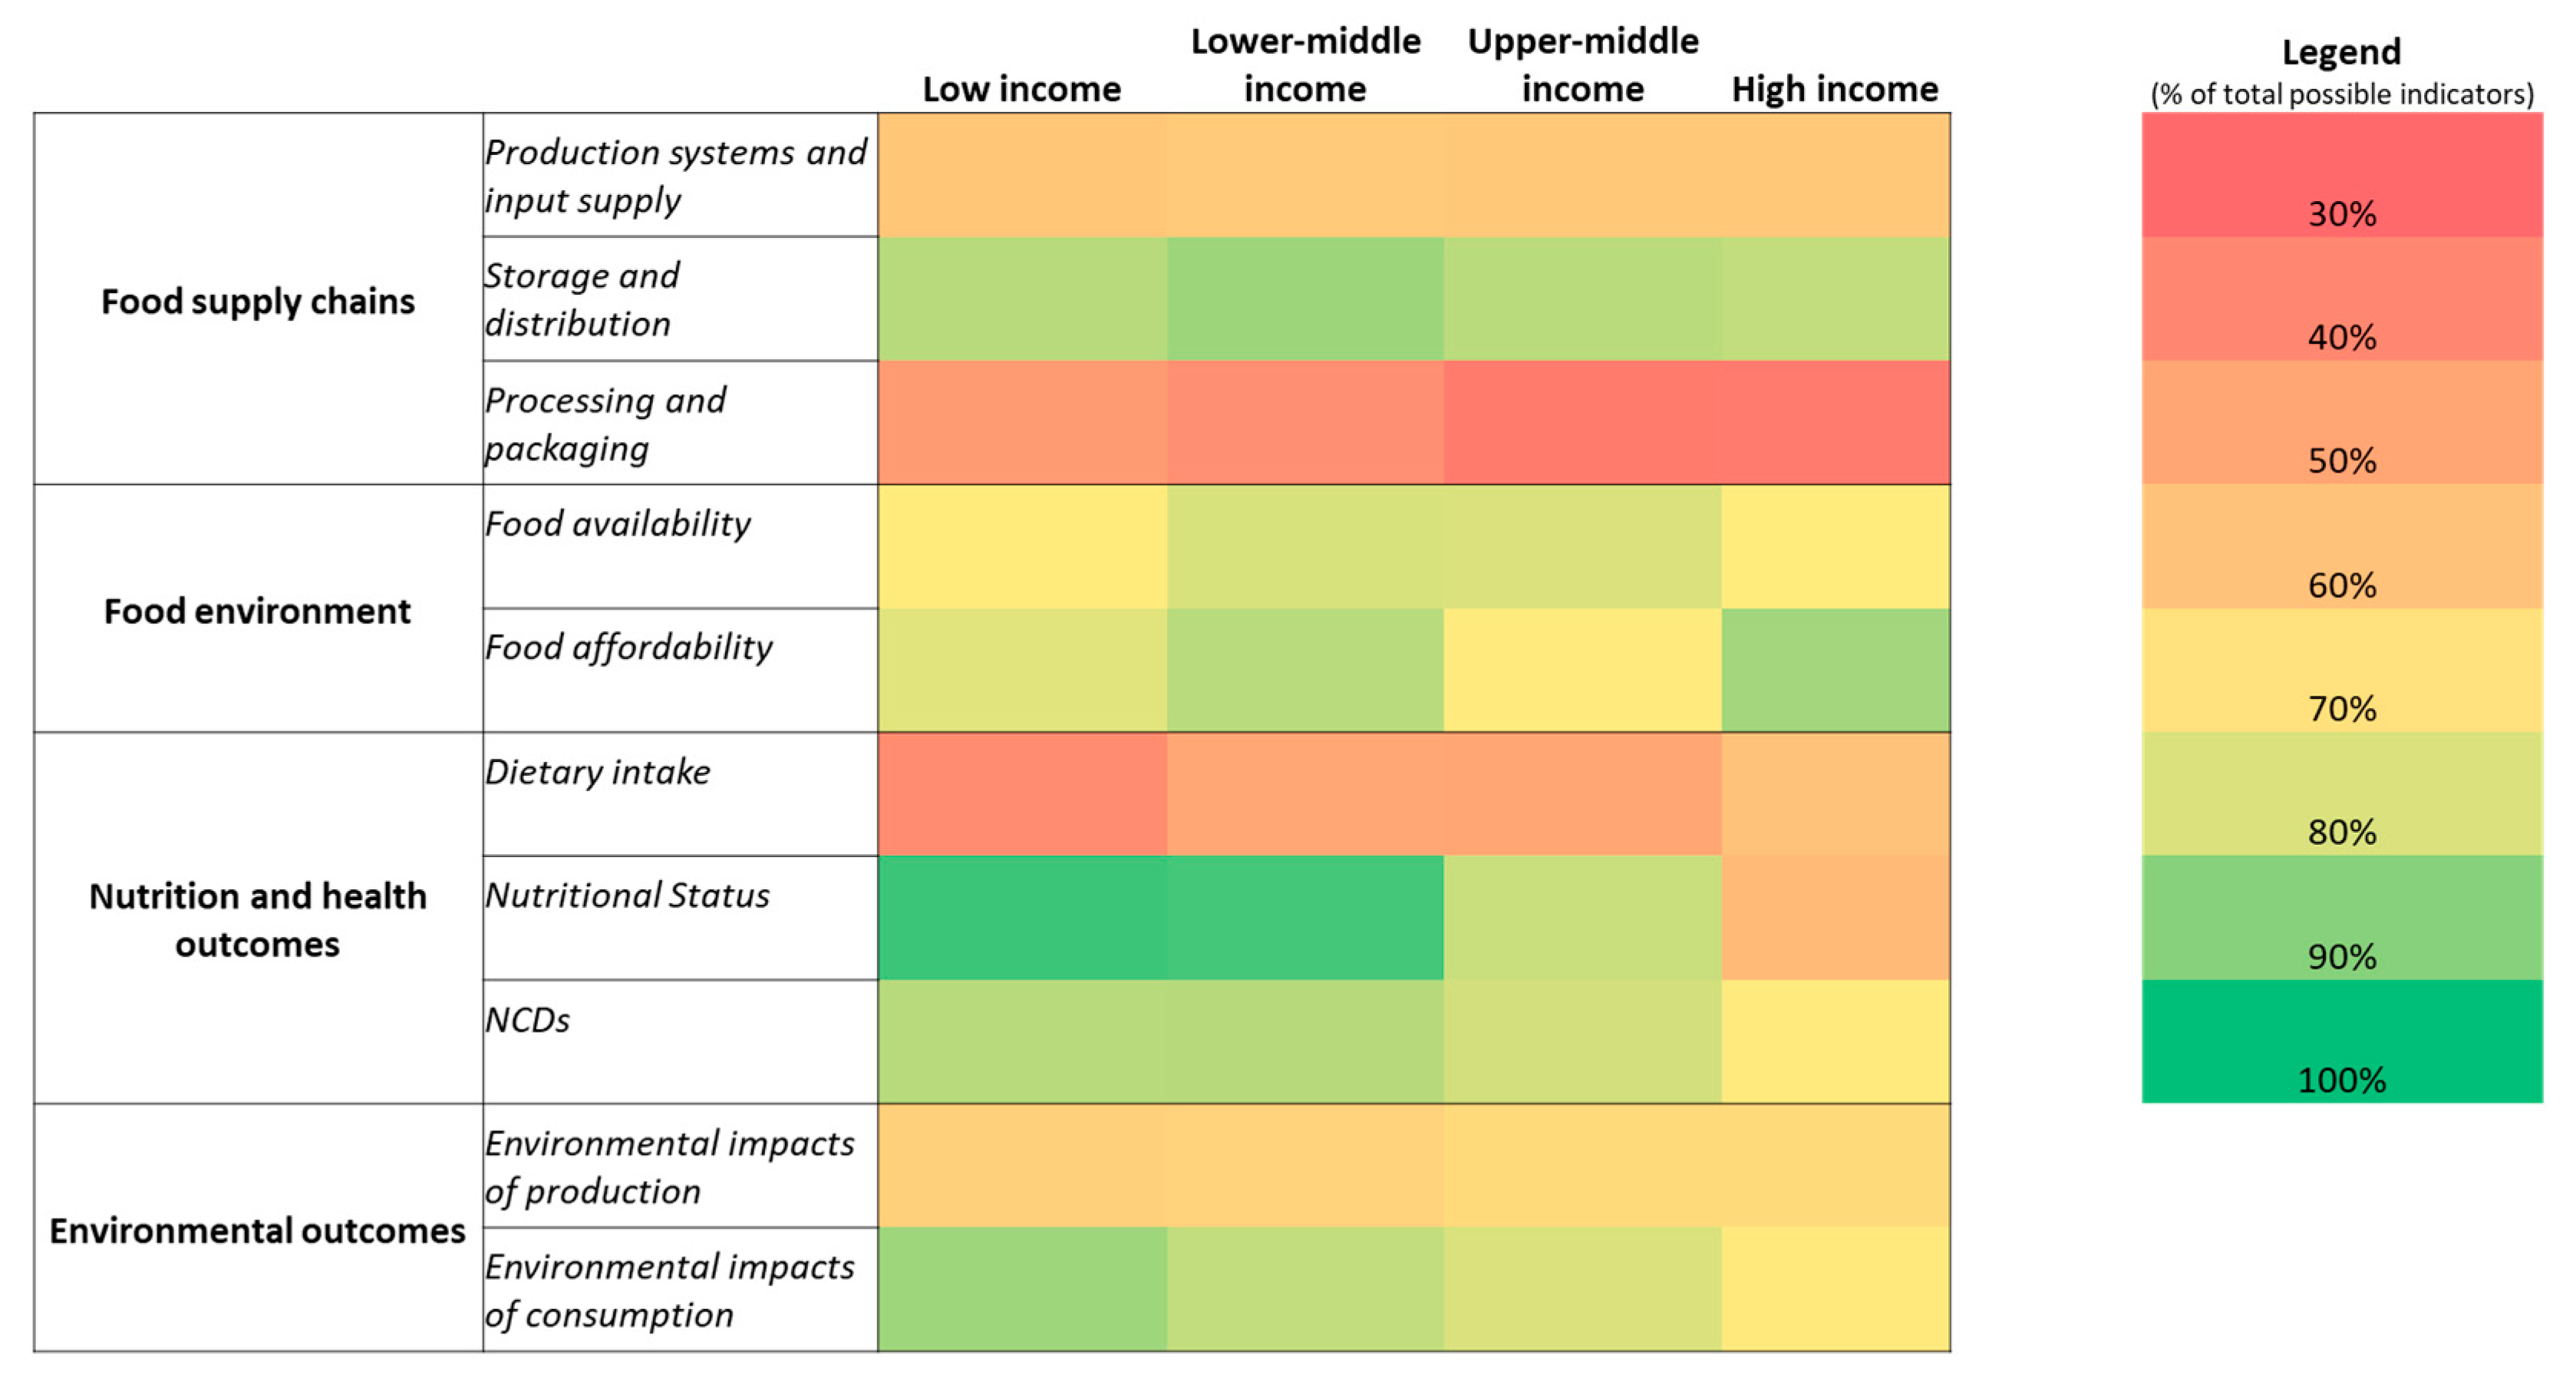
Indicator coverage in the FSD varies by income group. Figure 3 displays the percent of the total possible data points (i.e., number of indicators multiplied by number of countries—excluding territories, which are less likely to have robust data collection systems) that there are observations for in the FSD, by income group. This should not be confused with overall data availability by income group; it is well documented that richer food systems-related data is available in HICs, however, for the FSD, primary data sources are disproportionately represented by open-access, United Nations-sponsored datasets which are likely to have broad coverage among LMICs and likely to be updated more frequently. The figure only includes a selection of key sub-sectors included in the FSD, but it shows that indicators to describe processing and packaging, and dietary intake, are more prone to data gaps.
The FSD addresses several other previously mentioned data limitations. First, quality control of indicators is carried out by a team of experts, ensuring that those featured in the dashboard use the best available methods to ensure estimates are valid and reliable. This quality control often involves collaboration with data collectors and subject matter experts.
Second, the FSD annotates data, by including a detailed set of metadata along with its visualizations. While it is said that “a picture is worth a thousand words”, good practice in data visualization is to ensure that viewers are aided in the contextualization of the information they are digesting, and that accompanying text is used to remove uncertainty relating to the meaning of the indicator, how it was collected, or calculated. The FSD metadata provides concise definitions of each indicator, explanations of the methods used, and a description of the relevance of the indicator for food systems analysis, including its possible linkages with outcomes.
Finally, while many data gaps in the food system remain, the FSD will continue to feature the latest developed, most innovative metrics as these become available. As examples, the FSD recently added a set of indicators that describe the environmental footprint of food consumption from the World Wildlife Foundation (WWF, Gland, Switzerland) and will soon add several of the food affordability indicators featured in the 2020 State of Food Security and Nutrition in the World Report [9,49]. Using the FSD to further disseminate this data will draw more attention to these issues, which have been major priorities among food systems researchers and policymakers in recent years. Indicators still in the pipeline, such as the global food loss and global food waste indices, will also find a home in the FSD and specific attention will be given to other indicators that are relevant for SDG targets.
5. Examples of FSD Data Visualizations
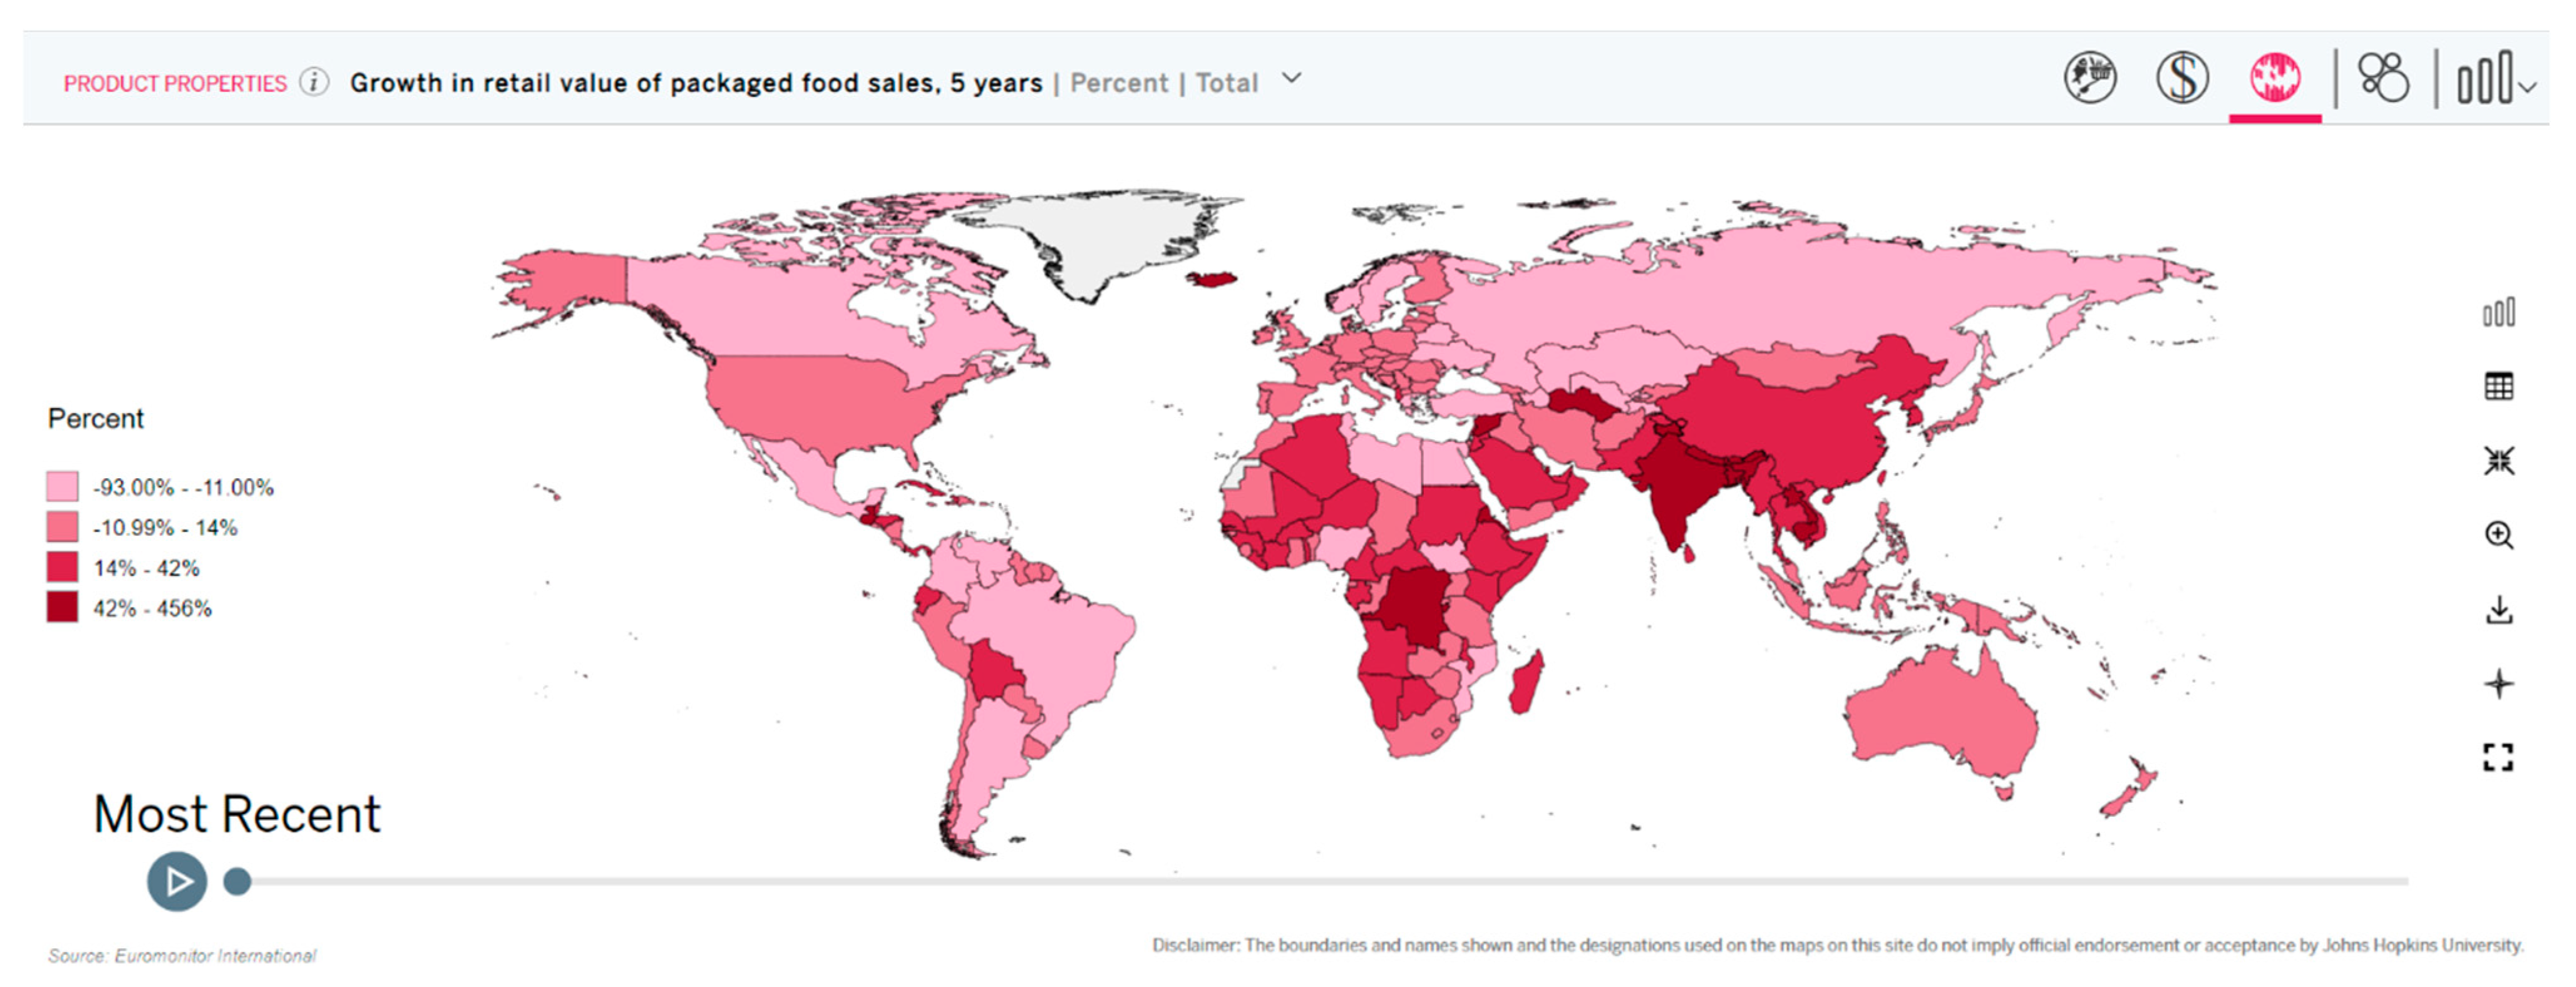
Countries are currently the primary unit of analysis in the FSD. By featuring a large number of countries, users can easily make country comparisons and examine patterns by geographic regions. The default in the FSD’s “Compare and Analyze” tool is to display data in map form; however, users also have the option to view bar graphs. Figure 4 is a global map of growth in packaged food sales, as displayed on the FSD.
This map enables users to easily identify Africa and South Asia as the regions that have on average experienced the fastest growth in packaged food sales from 2013 to 2018. However, some variation within Africa is still present, with countries in Northern Africa, Nigeria, South Sudan, and Mozambique all experiencing decreases in packaged food sales. Follow-up analyses could seek to explore potential causes of this variation, or whether the variation is also evident in nutrition or health outcomes.
The FSD also allows users to center their visualizations and analysis on an individual country of interest. The “Compare and Analyze” tool includes time trends for any country for each year that the data is available. Country profiles are also available, which display data for a select group of indicators in various chart and graph forms, often containing comparisons with regional or global averages.
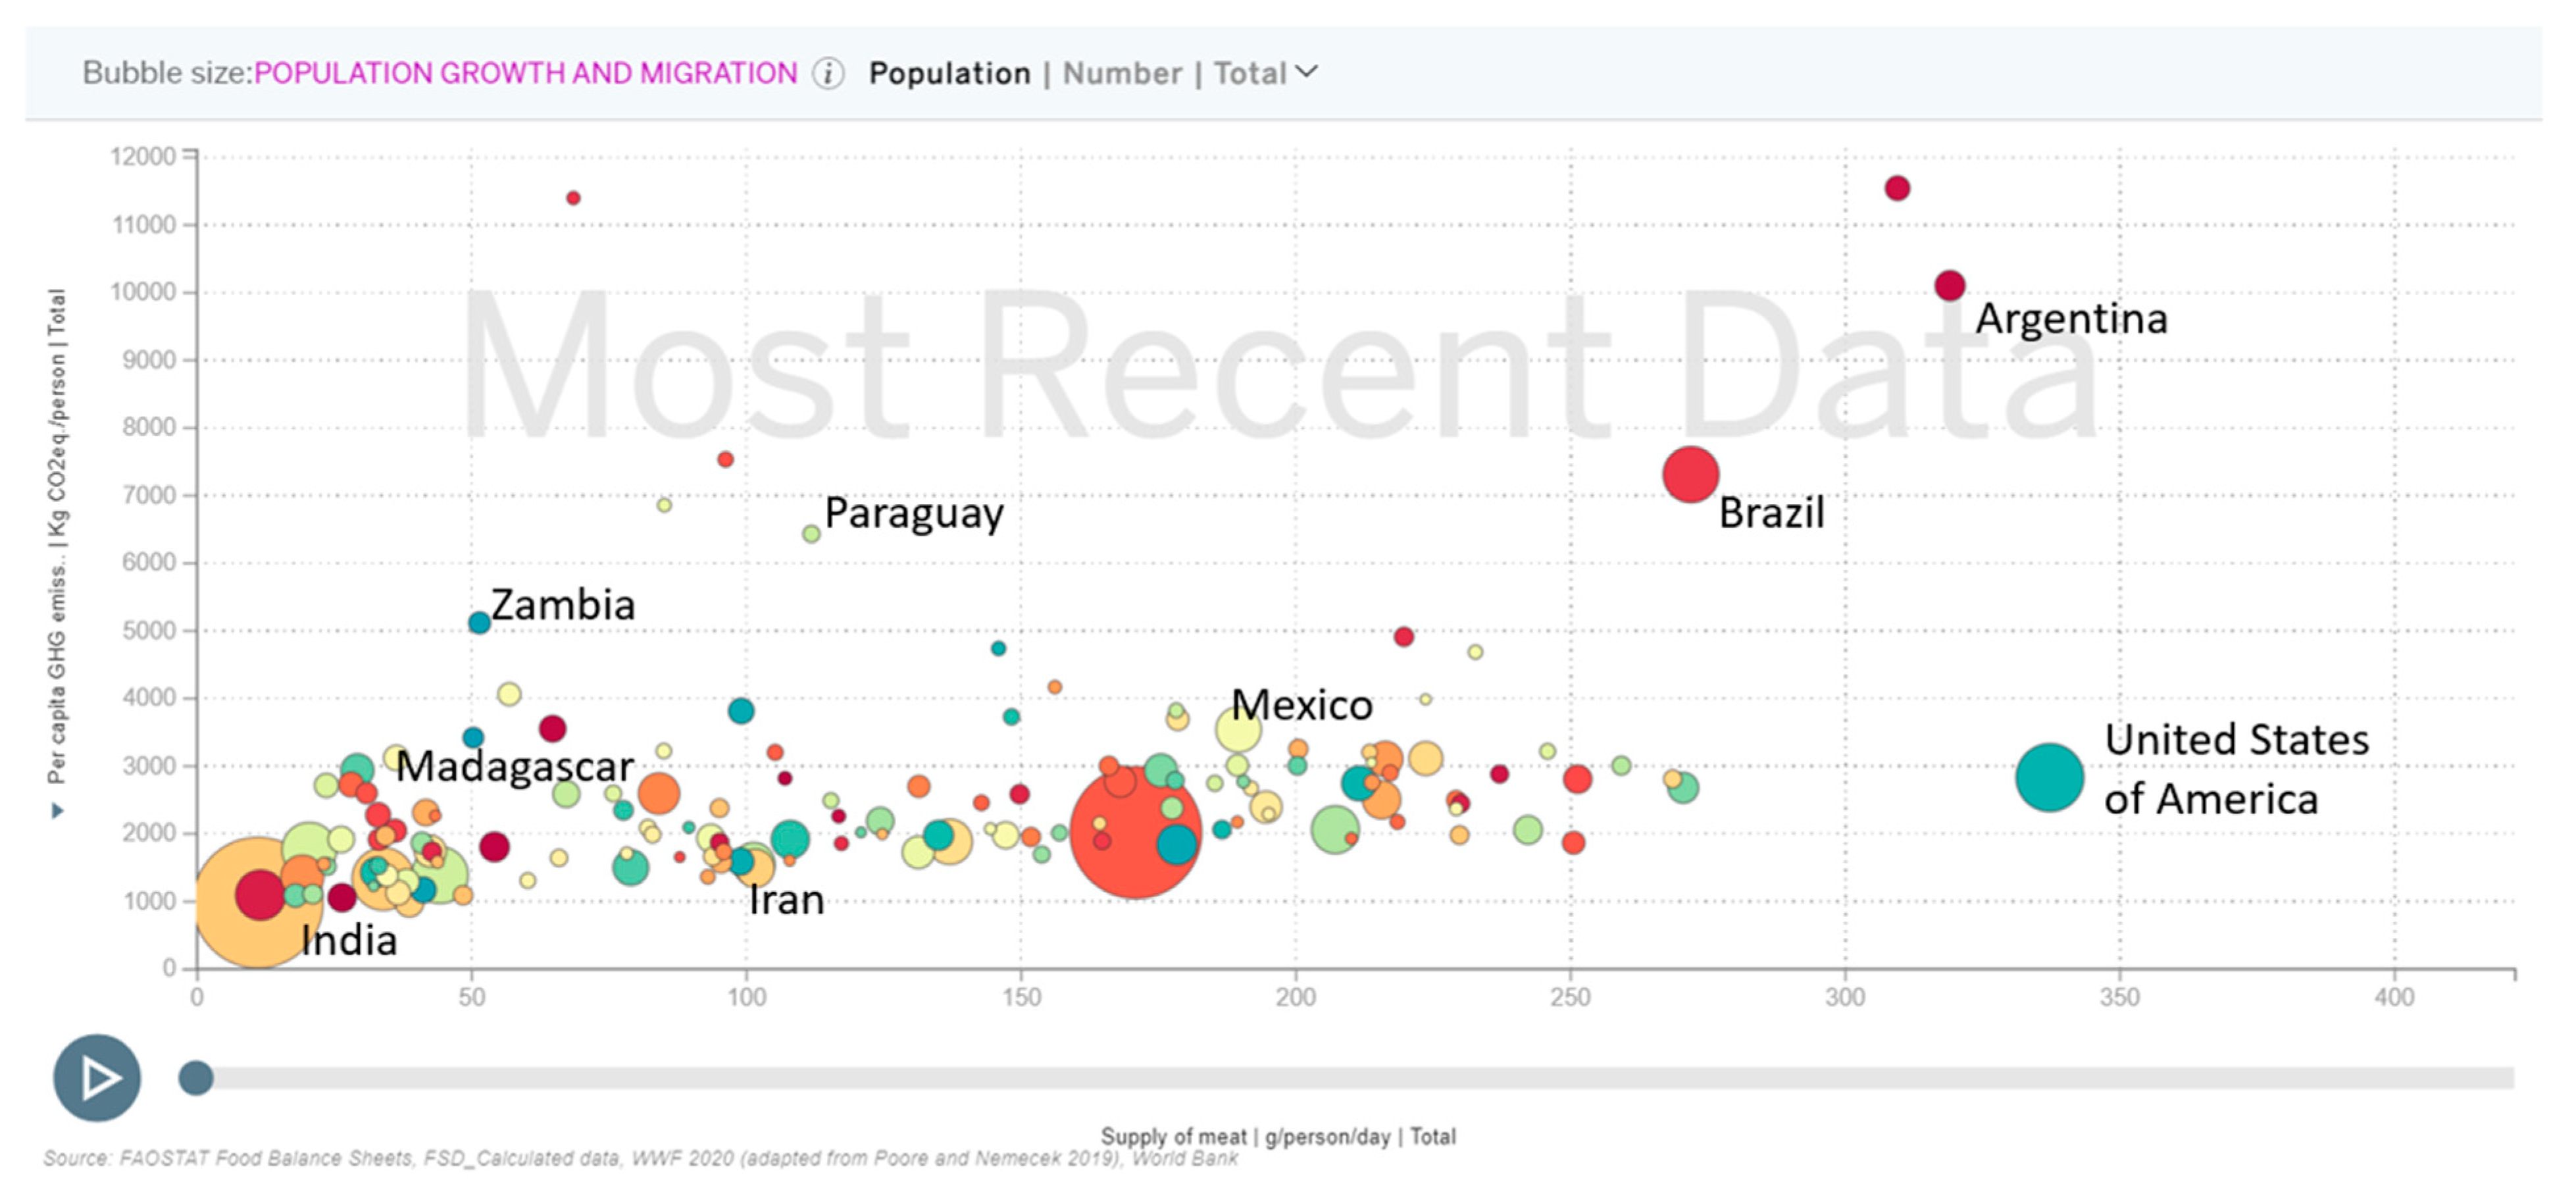
Users of the FSD may also conduct basic explorations of the correlation between multiple food system characteristics or outcomes using bubble charts. This may serve as an initial step towards understanding some of the tradeoffs and interactions among food production and supply chains, food environments, and human and planetary health outcomes. For example, Figure 5 below plots countries according to per capita GHG emissions from food consumption and per capita supply of meat. There is a positive correlation, however, substantial variation in GHG emissions exists among countries with similar levels of meat availability. For example, Iran and Paraguay both have 100–115 g of meat per person per day, but Paraguay’s per capita GHG emissions from consumption are quadruple that of Iran. Subsequent analysis could begin to explore the factors that cause countries with a similar supply of meat per capita to vary in their production efficiency and environmental impacts, or other food groups that could be contributing to high GHG emissions.
Data can also be aggregated and compared at the regional level, by income groups, or by food system type, using a typology developed by the authors and other FSD collaborators, building on previous food system typologies presented in the HLPE Nutrition and Food Systems Report and the 2015 Global Nutrition Report [6,52]. Typologies are useful in food systems analysis because they reduce complexity; rather than comparing all countries on each individual indicator, typologies identify clusters of countries that are broadly similar, enabling users to learn lessons from comparisons across those clusters. When applied to national food systems, a typology can help to identify countries that may be more likely to share common drivers of dietary, economic and environmental change and be responsive to similar policy actions.
The FSD typology classifies 155 countries into five food system types: (1) rural and traditional, (2) informal and expanding, (3) emerging and diversifying, (4) modernizing and formalizing, and (5) industrialized and consolidated. This classification is based on four indicators (agriculture value added per worker; share of dietary energy from cereal, roots, and tubers; number of supermarkets per 100,000 inhabitants; and urban population as percent of total population), which were chosen to reflect the different components of food systems as articulated in Figure 1 and prioritized based on evidence associating them with food systems transitions and country coverage. The methodology for developing the dashboard and more detailed descriptions of the food system types can be found on the Dashboard and in a forthcoming article [6,52,53].
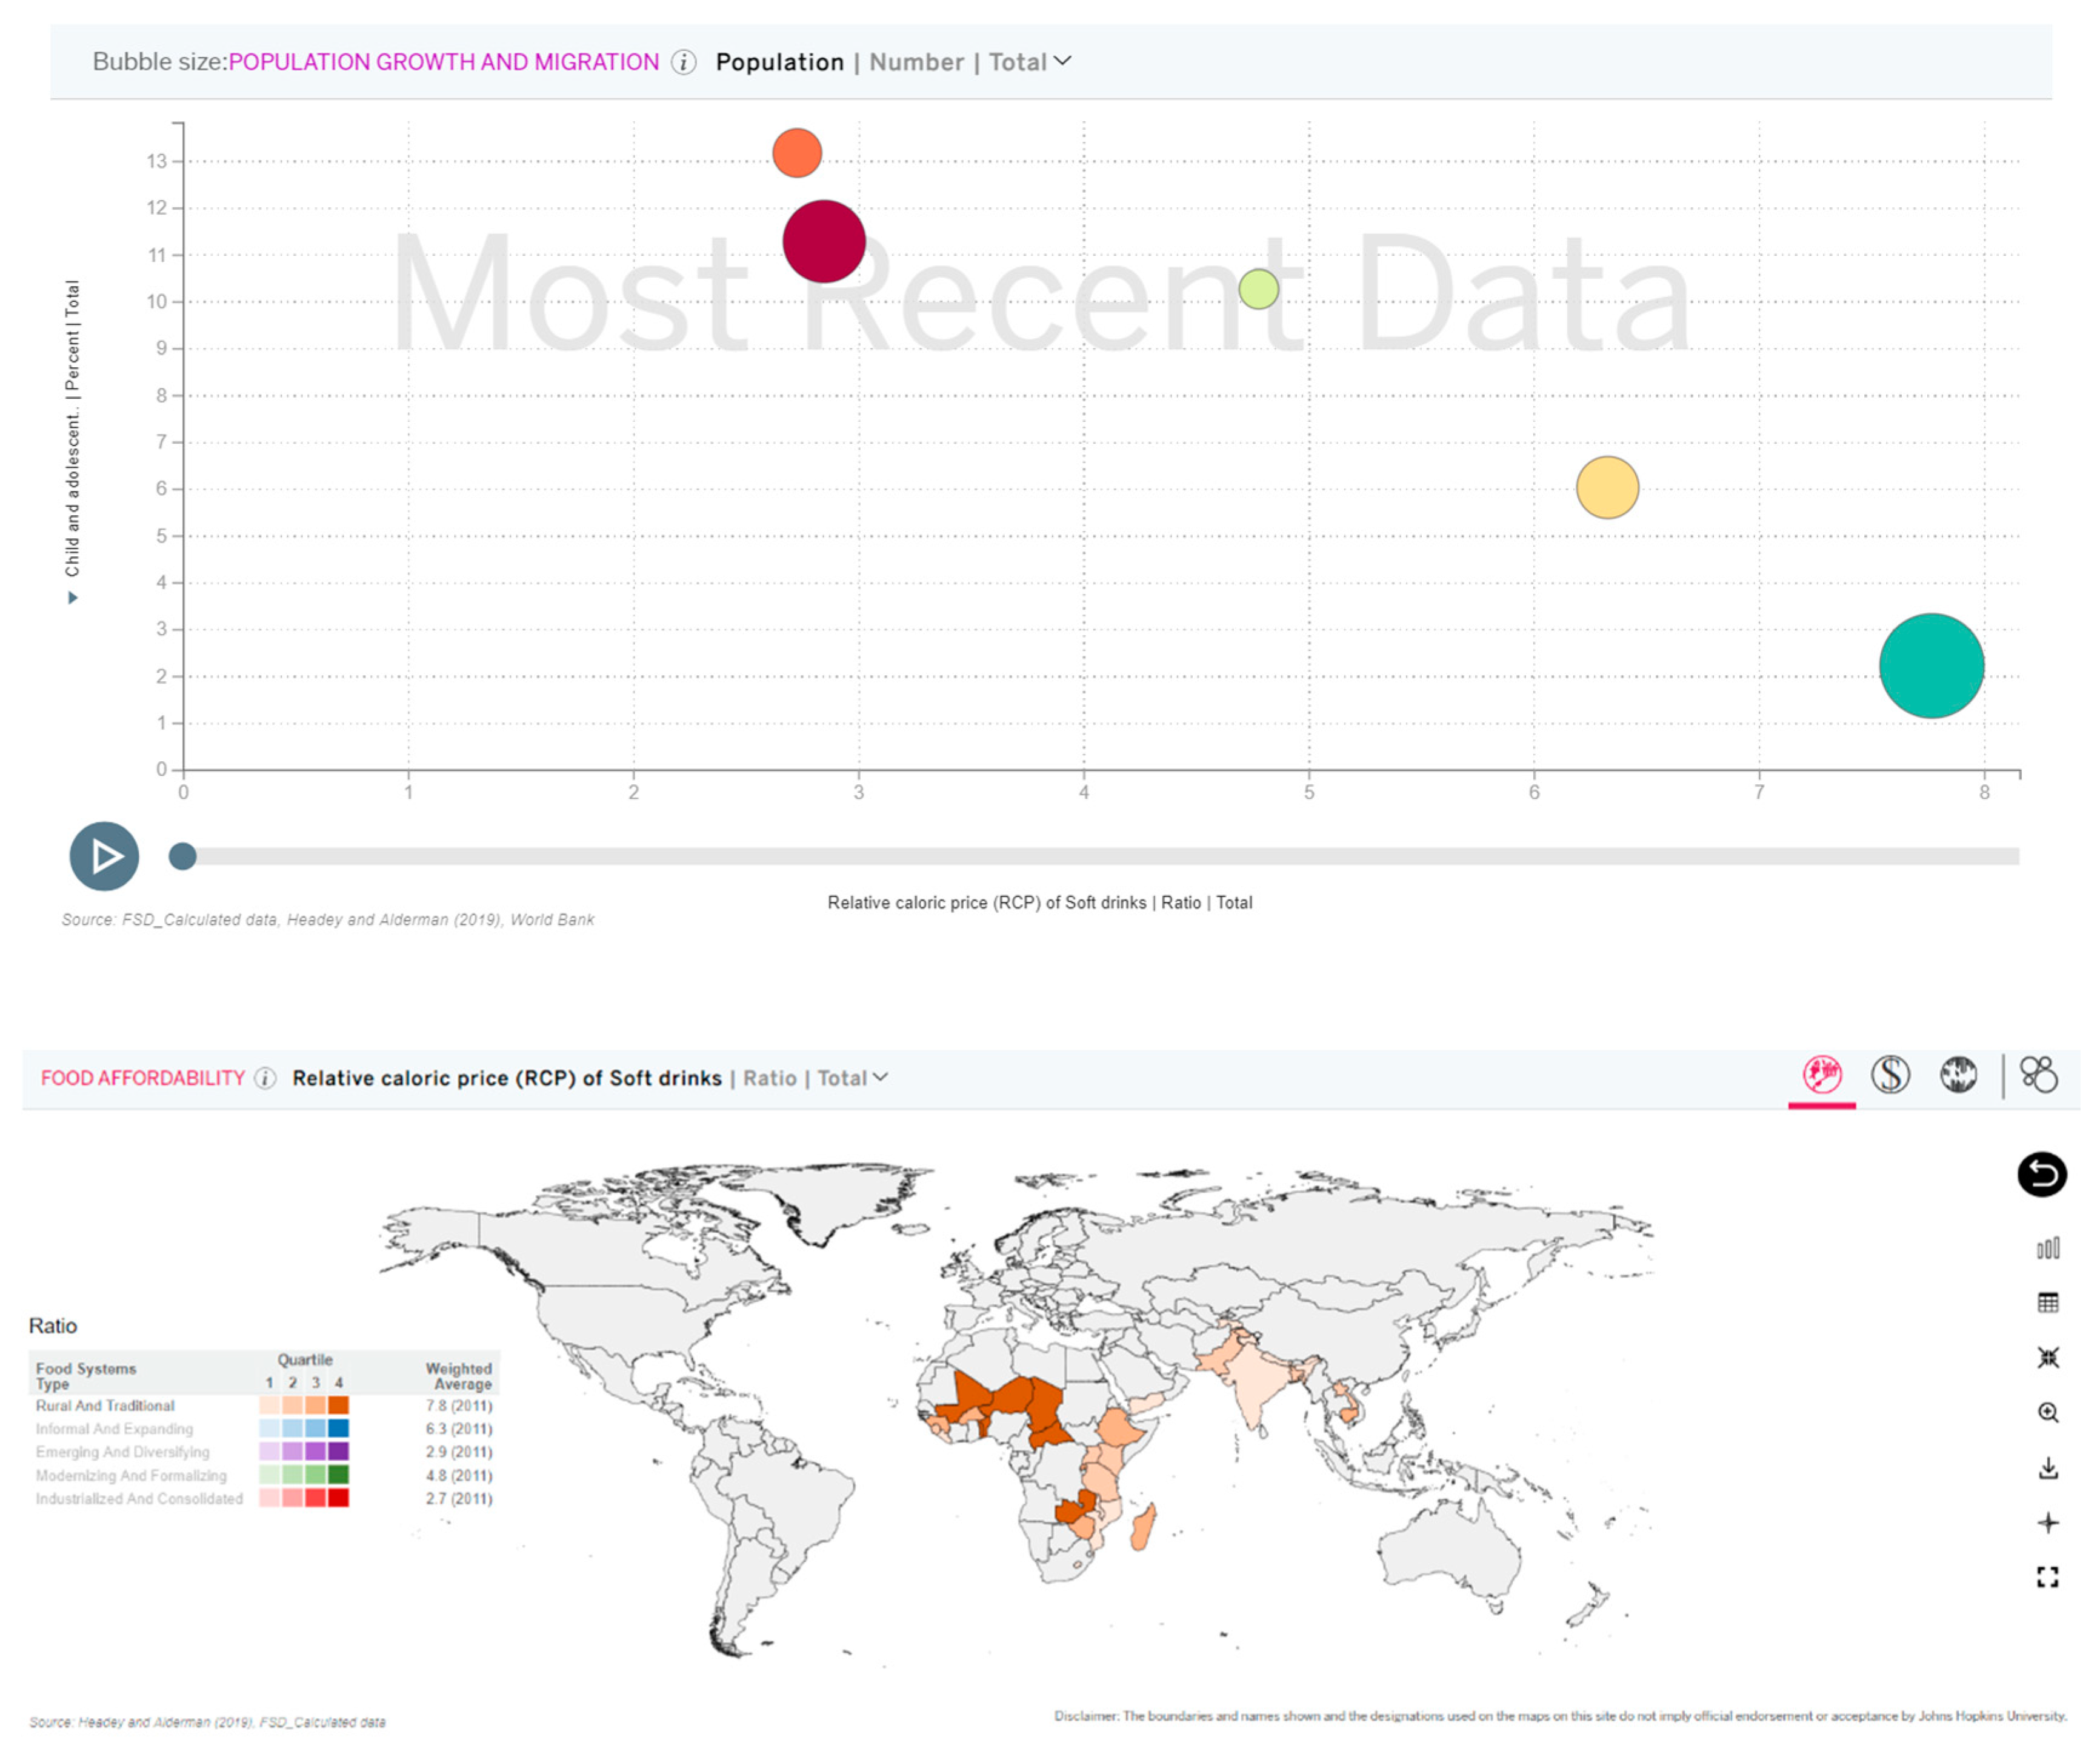
Data can be compared across food system types using bubble charts or maps. In the upper panel of Figure 6, food system types are plotted by average prevalence of child and adolescent obesity and relative caloric price of soft drinks. The graph shows that the relative price of soft drinks is inversely correlated with the child and adolescent obesity. This also aligns with the nutrition and food systems transitions literature, which identify income growth, urbanization, and globalization as common drivers of obesity and structural changes to food supply chains and consumer preferences, which may lower the price of energy-dense processed foods [15,22,23,54,55]. In the lower panel, the relative caloric price of soft drinks is compared among countries within the rural and traditional food system type. The highest relative prices are found in West Africa, while East African and South Asian rural and traditional food system types are lower. Weighted averages in the legend also allow users to compare between food system types.
These same tools are also available to make comparisons between and within income groups. Within group comparisons may be used to identify benchmarks, i.e., countries who over-perform on a certain health or environmental outcome in comparison with other countries with a relatively similar food system type, or countries within the same income group classification.
6. Limits of the Food Systems Dashboard and Future Directions
The FSD platform does not deliver several important services for researchers and decision-makers. First, it offers only basic tools for analysis, which mainly focus on descriptive comparisons rather than statistical inference. While scatter plots, bubble charts, and maps are useful, identifying risk factors for poor diet, nutrition, health, or environmental outcomes in the presence of confounders requires statistical software and consultation with food systems actors. In the examples above, follow-up analyses are suggested to illustrate how FSD visualizations could be used for hypothesis generation.
Future work on the FSD will attempt to present data in a more synthetic and integrated way. For example: How do food system processes interact? What are the positive and negative feedback loops? What are the trade-offs if one part of the system is more heavily emphasized than another, and what are the weights of those trade-offs across elements and outcomes of the food system? The FSD plans to develop features that show these dynamic relationships and interactions across the food systems.
More advanced statistical tools are also needed to project trends into the future and model the potential impact of different policies and actions, especially when these impacts are felt across multiple outcomes and trade-offs need to be weighed (e.g., between food security and environmental sustainability objectives). A future area of expansion for the FSD may include case studies related to the transition pathways countries have undergone and the food system-related decisions that have been made along the way, or how countries have grappled with different types of shocks.
Second, there is a clear need for more detailed, subnational food systems data that are reconciled and harmonized with national statistics. Food systems are incredibly diverse within countries and require nuanced assessments using local data to adequately characterize their dynamics and local characteristics. For instance, there are many types of agricultural landscapes, vendor groups, supply chains and sets of drivers that are influencing food systems. This more detailed data facilitates comparisons across districts or states, as well as across different population groups, which are often the types of comparisons that are more useful for setting policy and deciding where to invest limited national resources. Moving forward, the FSD aims to engage with a limited number of pilot countries to develop subnational dashboards, which will draw on innovative data collection methods, such as real-time, crowd-sourced data and geospatial data at fine resolutions. For example, a recent study in Nigeria demonstrated how a digital crowdsourcing tool was able to generate a spatially-rich dataset of food prices and track price changes in real-time, following the COVID-19 outbreak and subsequent lockdowns [56]. Such rapid-assessment approaches could be powerful tools for policymakers to use in designing and targeting appropriate responses to shocks.
Third, the FSD currently only describes food systems with the data it has on hand. Key gaps remain, particularly related to food processing and distribution, food advertising, consumer knowledge and preferences, and intra-household dynamics. Some of these features can only be described through qualitative research involving small sample sizes, which do not lend themselves to tools such as the Dashboard. Some quantitative aspects, such as price or income elasticities, lack adequate coverage and frequency of data collection. Others do not yet have widely accepted metrics that are ready to be scaled up across a large number of countries. For example, the level of market access, competition, integration, and overall functionality are features of interest to FSD, but indicators are only recently being piloted [57]. Coverage data is also lacking for programs and interventions that could improve diets, nutrition, or environmental sustainability. Health interventions and health service delivery, in contrast, are more closely monitored, for example through the DHS Program; however, food system-related actions are not concentrated in health centers, but rather dispersed throughout extensive networks of farms, supply chains, and food environments.
Lastly, the FSD is currently lacking a full range of diagnostic tools and policy recommendations. While policymakers can benefit from descriptive data visualizations, the FSD can go further in illuminating the path from raw data to information, analysis, and action, by identifying which areas of countries’ food systems are experiencing problems and which policies or actions could be important to consider. These functions are currently being developed and will integrate with the 42 Policies and Actions [58]. It is envisioned that for indicators that are likely to influence diet, nutrition, and health outcomes in a clear direction, a system of cutoffs will be established, with traffic lights indicating the components of countries’ food systems that are likely to be causing health or environment-related risks.
7. Data Revolution for Food Systems Accountability
The 2017 Global Nutrition Report called for revolutionizing efforts across the “nutrition data value chain”—a conceptualization of a data and information system wherein data is positioned as a value product to address hard problems such as ending the multiple forms of malnutrition [59]. This chain includes data priority-setting, creation and collection, curation, analysis, interpretation and use of information by decision-makers. The FSD platform is one tool that can contribute to strengthening this data value chain across several of its links. Yet, broader investments in the capacity of this value chain are needed to fulfil the potential for information to inform evidence-based policymaking in service of achieving the SDGs. In particular, investments are needed in several key areas as outlined in the 2017 Global Nutrition Report.
First, in-country mechanisms are needed for national priority-setting and data coordination. Sub-national data in particular are a priority. As discussed above, there is a dearth of such data despite enormous food system heterogeneity within countries that requires policy informed by context-specific information. The COVID-19 Dashboard developed by the Center for Systems Science and Engineering at Johns Hopkins University (Baltimore, MD, USA) provides a compelling example of a real-time data tracking dashboard that uses data disaggregated at the state and county level (in the United States). Such high data collection frequency and resolution may not be feasible for many of the indicators currently in the FSD, however, there is considerable scope for improving the food systems data landscape with regularly collected subnational data. Consistent and reliable national surveys that collect data on key indicators every 3–4 years, for example, would offer a fundamental advance in current nutrition data systems [59]. Such food systems surveys should be incorporated into routine management information systems with costed data plans and should include sufficiently robust samples so as to be able to derive subnational statistics [59]. Guidance is also needed for prioritizing indicators for regular data collection. The FSD can inform such guidance by indicating for which indicators a given country is lacking data within each of the domains described (e.g., food supply chains, food environments, diets and nutrition).
Second, tools are needed for capacity development at multiple levels. It is not sufficient simply to make data available to decision-makers. Rather, there must be awareness of the utility of the data and the capacity to transform it into useful information. As part of the FSD development, a series of country engagements are being carried out to learn how best to design the FSD so as to facilitate its use and also to learn how potential users across diverse sectors (e.g., business leaders, civil society stakeholders, academics) might use the dashboard, and which decisions or challenges that they face might be informed by the data provided in the dashboard. Such consultations are essential for understanding the kinds of data to prioritize, how best to engage with users of the data, and where capacity strengthening is needed.
Third, there must be efforts to disseminate the tacit knowledge and experiences of decision-makers and actors across the food supply chain. Food systems are complex and it is challenging to gain a comprehensive understanding of an entire system with data on disparate indicators alone. Such data are the essential building blocks needed to construct a foundation for policy action, but these blocks must be reinforced by an understanding of the knowledge and experiences of diverse stakeholders that are often difficult to capture and communicate. Therefore, investments in collecting and disseminating this knowledge is crucial for transforming food systems data into information and information into action.
Fourth, innovation is needed across the data value chain. The FSD represents one such innovation, aggregating data on more than 200 indicators in a user-friendly platform, informed by an evidence-based theoretical food systems framework, and allowing for diverse descriptive analyses using its mapping tool, country profiles, and complementary data on income classifications and food system types. Crowdsourced information offers another important opportunity for innovation along the data value chain. Whether using mobile apps, observations, or disseminated sensor data or providing real-time monitoring of food price data [56], tracking food safety concerns [60], estimating the size of smallholder farmers’ fields [61] or numerous other potential applications (e.g., soil, crop phenology, weather or yield data) [62], crowdsourcing is an emerging frontier of innovation for food systems data.
Finally, there must be enhanced efforts to foster a culture of data use and sharing. Food systems data often reside in sectoral silos that prevent such data from reaching the analysts and decision-makers best positioned to use such data to inform planning and action [63]. Government agencies often do not have the incentives or capacities to partner across sectors within or outside the government [64]. This is especially problematic in many LMICs wherein the data collection efforts of non-governmental entities are often carried out independent of public sector efforts [65]. An enormous body of data on consumer food products, prices, purchases, and commercial food industries more broadly are also collected and managed by private entities. For example, scanner data (e.g., point-of-sale retail food records, and food used by consumers in homes), household food consumption surveys (e.g., online surveys of consumers’ purchases of prepared foods), and other data on commercial food environments are regularly collected by market research firms [66]. These proprietary data hold considerable potential to strengthen the entire data value chain yet are inaccessible to many potential data users. Public-private partnerships may be one mechanism to facilitate expanded access to these data for strategic analyses aimed at informing sensible food and nutrition policy.
8. Conclusions
Policymakers, practitioners, and researchers have embraced the importance of viewing food, nutrition, health, and environmental sustainability challenges through a food systems lens. This ‘systems-thinking’ has been aided by frameworks that better articulate the related components of a food system and how they influence a diverse set of outcomes; however, these frameworks must now be complemented by enhanced systems measurement and analysis. A data revolution will facilitate this next phase, which could begin with improved descriptive analysis, aimed at comparing food systems characteristics and outcomes across geography, income groups, food system types, and over time, using high-quality, standardized indicators. In addition to addressing the current regional, subnational, and thematic gaps in data availability discussed in this article, the revolution must strengthen the entire data value chain, including improving the curation, interpretation, and use of data, which will ultimately enable accountability mechanisms for food systems. Promising innovations are already underway, which should be expanded upon and continuously improved with the input of stakeholders, as will be the case with the FSD.
Author Contributions
Conceptualization, J.F., Q.M., and A.L.B.; data curation, A.L.B.; writing—original draft preparation, R.M., Q.M., and A.L.B.; writing—review and editing, Q.M., A.L.B., J.F., and A.D.J.; visualization, Q.M.; supervision, J.F. All authors have read and agreed to the published version of the manuscript.
Funding
This research received support from the Children’s Investment Fund Foundation (CIFF). Q.M. is supported by the Center for a Livable Future-Lerner Fellowship Program.
Institutional Review Board Statement
Not applicable.
Informed Consent Statement
Not applicable.
Data Availability Statement
Data discussed in this article can be found at the Food Systems Dashboard website (https://foodsystemsdashboard.org/).
Conflicts of Interest
The authors declare no conflict of interest.
References
- Fanzo, J.; Covic, N.; Dobermann, A.; Henson, S.; Herrero, M.; Pingali, P.; Staal, S. A research vision for food systems in the 2020s: Defying the status quo. Global Food Secur. 2020, 26, 100397. [Google Scholar] [CrossRef] [PubMed]
- Vanham, D.; Leip, A. Sustainable food system policies need to address environmental pressures and impacts: The example of water use and water stress. Sci. Total Environ. 2020, 730, 139151. [Google Scholar] [CrossRef]
- Smith, P. Delivering food security without increasing pressure on land. Global Food Secur. 2013, 2, 18–23. [Google Scholar] [CrossRef]
- Tomich, T.P.; Lidder, P.; Coley, M.; Gollin, D.; Meinzen-Dick, R.; Webb, P.; Carberry, P. Food and agricultural innovation pathways for prosperity. Agric. Syst. 2019, 172, 1–15. [Google Scholar] [CrossRef]
- Haddad, L.; Hawkes, C.; Waage, J.; Webb, P.; Godfray, C.; Toulmin, C. Food Systems and Diets: Facing the Challenges of the 21st Century; Global Panel on Agriculture and Food Systems for Nutrition: London, UK, 2016; ISBN 9-7809-9562-2807. [Google Scholar]
- HLPE Nutrition and food systems: A report by the High Level Panel of Experts on Food Security and Nutrition of the Commitee on World Food Security; FAO: Rome, Italy, 2017.
- Watson, R.T.; Noble, I.R.; Bolin, B.; Ravindranath, N.H.; Verardo, D.J.; Dokken, D.J. IPCC Special Report on Land Use, Land-Use Change, and Forestry; WMO: Geneva, Switzerland, 2000. [Google Scholar]
- Willett, W.; Rockström, J.; Loken, B.; Springmann, M. Food in the Anthropocene: The EAT–Lancet Commission on healthy diets from sustainable food systems. Lancet 2019, 393. [Google Scholar] [CrossRef]
- FAO; IFAD; UNICEF; WFP; WFP. The State of Food Security and Nutrition in the World 2020: Transforming Food Systems for Affordable Healthy Diets; FAO: Rome, Italy, 2020; ISBN 9-7892-5132-9016. [Google Scholar]
- Global Panel on Agriculture and Food Systems for Nutrition. Future Food Systems: For People, Our Planet, and Prosperity; Global Panel on Agriculture and Food Systems for Nutrition: London, UK, 2020. [Google Scholar]
- Food and Land Use Coalition. Growing Better: Ten Critical Transitions to Transform Food and Land Use. The Food and Land Use Coalition. 2019. Available online: https://www.foodandlandusecoalition.org/global-report/ (accessed on 15 December 2020).
- Searchinger, T.; Waite, R.; Hanson, C.; Ranganathan, J.; Dumas, P.; Matthews, E. Creating a Sustainable Food Future: A Menu of Solutions to Feed Nearly 10 Billion People by 2050; World Resources Institute: Washington, DC, USA, 2019. [Google Scholar]
- Micha, R.; Coates, J.; Leclercq, C.; Ruth Charrondiere, U.; Mozaffarian, D. Global Dietary Surveillance: Data Gaps and Challenges. Food Nutr. Bull. 2018, 39, 175–205. [Google Scholar] [CrossRef] [PubMed]
- Miller, V.; Singh, G.M.; Onopa, J.; Reedy, J.; Shi, P.; Zhang, J.; Tahira, A.; Shulkin Morris, M.L.; Marsden, D.P.; Kranz, S.; et al. Global Dietary Database 2017: Data availability and gaps on 54 major foods, beverages and nutrients among 5.6 million children and adults from 1220 surveys worldwide. BMJ Glob. Health 2021, 6, 003585. [Google Scholar] [CrossRef]
- Popkin, B.M.; Corvalan, C.; Grummer-Strawn, L.M. Dynamics of the double burden of malnutrition and the changing nutrition reality. Lancet 2020, 395, 65–74. [Google Scholar] [CrossRef]
- Caspi, C.E.; Sorensen, G.; Subramanian, S.V.; Kawachi, I. The local food environment and diet: A systematic review. Health Place 2012, 18, 1172–1187. [Google Scholar] [CrossRef] [Green Version]
- Engler-Stringer, R.; Le, H.; Gerrard, A.; Muhajarine, N. The community and consumer food environment and children’s diet: A systematic review. BMC Public Health 2014, 14, 522. [Google Scholar] [CrossRef] [Green Version]
- Gustafson, A.; Hankins, S.; Jilcott, S. Measures of the consumer food store environment: A systematic review of the evidence 2000-2011. J. Commun. Health 2012, 37, 897–911. [Google Scholar] [CrossRef] [Green Version]
- Turner, C.; Kalamatianou, S.; Drewnowski, A.; Kulkarni, B.; Kinra, S.; Kadiyala, S. Food Environment Research in Low–And Middle-Income Countries: A Systematic Scoping Review. Adv. Nutr. 2019. [Google Scholar] [CrossRef]
- Downs, S.M.; Ahmed, S.; Fanzo, J.; Herforth, A. Food Environment Typology: Advancing an Expanded Definition, Framework, and Methodological Approach for Improved Characterization of Wild, Cultivated, and Built Foods Environments toward Sustainable Diets. Foods 2020, 9, 532. [Google Scholar] [CrossRef] [PubMed] [Green Version]
- Reardon, T.; Timmer, C.P.; Minten, B. Supermarket revolution in Asia and emerging development strategies to include small farmers. Proc. Natl. Acad. Sci. USA 2012, 109, 12332–12337. [Google Scholar] [CrossRef] [PubMed] [Green Version]
- Popkin, B.M.; Reardon, T. Obesity and the food system transformation in Latin America. Obes. Rev. 2018, 19, 1028–1064. [Google Scholar] [CrossRef] [PubMed]
- Reardon, T.; Tschirley, D.; Liverpool-Tasie, L.S.O.; Awokuse, T.; Fanzo, J.; Minten, B.; Vos, R.; Dolislager, M.; Sauer, C.; Dhar, R.; et al. The processed food revolution in African food systems and the double burden of malnutrition. Glob. Food Secur. 2021, 28, 100466. [Google Scholar] [CrossRef] [PubMed]
- Masters, W.A.; Bai, Y.; Herforth, A.; Sarpong, D.B.; Mishili, F.; Kinabo, J.; Coates, J.C. Measuring the Affordability of Nutritious Diets in Africa: Price Indexes for Diet Diversity and the Cost of Nutrient Adequacy. Am. J. Agric. Econ. 2018, 100, 1285–1301. [Google Scholar] [CrossRef] [Green Version]
- FAO. The State of Food and Agriculture 2019: Moving Forward on Food Loss and Waste Reduction; FAO: Rome, Italy, 2019. [Google Scholar]
- Veldhuizen, L.J.L.; Giller, K.E.; Oosterveer, P.; Brouwer, I.D.; Janssen, S.; van Zanten, H.H.E.; Slingerland, M.A. The Missing Middle: Connected action on agriculture and nutrition across global, national and local levels to achieve Sustainable Development Goal 2. Glob. Food Sec. 2020, 24, 100336. [Google Scholar] [CrossRef]
- Xue, L.; Liu, G.; Parfitt, J.; Liu, X.; Van Herpen, E.; Stenmarck, Å.; O’Connor, C.; Östergren, K.; Cheng, S. Missing food, missing data? A critical review of global food losses and food waste data. Environ. Sci. Technol. 2017, 51, 6618–6633. [Google Scholar] [CrossRef]
- Monteiro, C.A.; Cannon, G.; Moubarac, J.-C.; Levy, R.B.; Louzada, M.L.C.; Jaime, P.C. The UN Decade of Nutrition, the NOVA food classification and the trouble with ultra-processing. Public Health Nutr. 2018, 21, 5–17. [Google Scholar] [CrossRef] [Green Version]
- Gómez, M.I.; Ricketts, K.D. Food value chain transformations in developing countries: Selected hypotheses on nutritional implications. Food Policy 2013, 42, 139–150. [Google Scholar] [CrossRef] [Green Version]
- Barrett, C.B.; Reardon, T.; Swinnen, J.; Zilberman, D. Agri-food value chain revolutions in low-and middle-income countries. J. Econ. Lit. 2020. Available online: https://www.aeaweb.org/articles?id=10.1257/jel.20201539&&from=f (accessed on 15 December 2020).
- Piwoz, E.; Rawat, R.; Fracassi, P.; Kim, D. Strengthening the Nutrition Data Value Chain for Accountability and Action. Sight Life 2019, 33, 38–43. [Google Scholar]
- Ahn, P.D.; Wickramasinghe, D. Pushing the limits of accountability: Big data analytics containing and controlling COVID-19 in South Korea. Account. Audit. Account. J. 2021. [Google Scholar] [CrossRef]
- Heidkamp, R.A.; Piwoz, E.; Gillespie, S.; Keats, E.C.; D’Alimonte, M.R.; Menon, P.; Das, J.K.; Flory, A.; Clift, J.W.; Ruel, M.T.; et al. Mobilising evidence, data, and resources to achieve global maternal and child undernutrition targets and the Sustainable Development Goals: An agenda for action. Lancet 2021. [Google Scholar] [CrossRef]
- Gillespie, S.; Haddad, L.; Mannar, V.; Menon, P.; Nisbett, N.; Maternal and Child Nutrition Study Group. The politics of reducing malnutrition: Building commitment and accelerating progress. Lancet 2013, 382, 552–569. [Google Scholar] [CrossRef] [Green Version]
- Afshin, A.; Sur, P.J.; Fay, K.A.; Cornaby, L.; Ferrara, G.; Salama, J.S.; Mullany, E.C.; Abate, K.H.; Abbafati, C.; Abebe, Z.; et al. Health effects of dietary risks in 195 countries, 1990–2017: A systematic analysis for the Global Burden of Disease Study 2017. Lancet 2019. [Google Scholar] [CrossRef] [Green Version]
- Imamura, F.; Micha, R.; Khatibzadeh, S.; Fahimi, S.; Shi, P.; Powles, J.; Mozaffarian, D.; Global Burden of Diseases Nutrition and Chronic Diseases Expert Group (NutriCoDE). Dietary quality among men and women in 187 countries in 1990 and 2010: A systematic assessment. Lancet Glob. Health 2015, 3, 132–142. [Google Scholar] [CrossRef] [Green Version]
- Micha, R.; Khatibzadeh, S.; Shi, P.; Andrews, K.G.; Engell, R.E.; Mozaffarian, D.; Global Burden of Diseases Nutrition and Chronic Diseases Expert Group (NutriCoDE). Global, regional and national consumption of major food groups in 1990 and 2010: A systematic analysis including 266 country-specific nutrition surveys worldwide. BMJ Open 2015, 5, 008705. [Google Scholar] [CrossRef] [Green Version]
- Stunting in Africa’s children mapped town by town. Nature 2018. [CrossRef]
- Hemalatha, R.; Pandey, A.; Kinyoki, D.; Ramji, S.; Lodha, R.; Kumar, G.A.; Kassebaum, N.J.; Borghi, E.; Agrawal, D.; Gupta, S.S.; et al. Mapping of variations in child stunting, wasting and underweight within the states of India: The Global Burden of Disease Study 2000–2017. EClinicalMedicine 2020, 22, 100317. [Google Scholar] [CrossRef]
- Local Burden of Disease Child Growth Failure Collaborators Mapping child growth failure across low- and middle-income countries. Nature 2020, 577, 231–234. [CrossRef] [Green Version]
- Osgood-Zimmerman, A.; Millear, A.I.; Stubbs, R.W.; Shields, C.; Pickering, B.V.; Earl, L.; Graetz, N.; Kinyoki, D.K.; Ray, S.E.; Bhatt, S.; et al. Mapping child growth failure in Africa between 2000 and 2015. Nature 2018, 555, 41–47. [Google Scholar] [CrossRef] [Green Version]
- Galanakis, C.M. The food systems in the era of the Coronavirus (COVID-19) pandemic crisis. Foods 2020, 9, 523. [Google Scholar] [CrossRef] [PubMed]
- Drewnowski, A.; Ecosystem Inception Team. The Chicago consensus on sustainable food systems science. Front Nutr. 2017, 4, 74. [Google Scholar] [CrossRef] [PubMed]
- Unwin, A. Why is Data Visualization Important? What is Important in Data Visualization? Harv. Data Sci. Rev. 2020, 2. [Google Scholar] [CrossRef]
- Tufte, E. The visual display of quantitative information. In Diagrammatik-Reader; Schneider, B., Ernst, C., Wöpking, J., Eds.; De Gruyter (A): Berlin, Germany, 2016; pp. 219–230. ISBN 9-7830-5005-7996. [Google Scholar]
- Béné, C.; Prager, S.D.; Achicanoy, H.A.E.; Toro, P.A.; Lamotte, L.; Bonilla, C.; Mapes, B.R. Global map and indicators of food system sustainability. Sci. Data 2019, 6, 279. [Google Scholar] [CrossRef] [PubMed] [Green Version]
- Fiedler, B.A. Food Sustainability Index Report on the United States: The Good, the Bad, and the Ugly. In Translating National Policy to Improve Environmental Conditions Impacting Public Health Through Community Planning; Fiedler, B.A., Ed.; Springer International Publishing: Cham, Germany, 2018; pp. 41–49. ISBN 9-7833-1975-3614. [Google Scholar]
- Fanzo, J.; Haddad, L.; McLaren, R.; Marshall, Q.; Davis, C.; Herforth, A.; Jones, A.; Beal, T.; Tschirley, D.; Bellows, A.; et al. The Food Systems Dashboard is a new tool to inform better food policy. Nat. Food 2020, 1, 243–246. [Google Scholar] [CrossRef]
- WWF; Loken, B. Bending the Curve: The Restorative Power of Planet-Based Diets; World Wildlife Fund: Washington, DC, USA, 2020. [Google Scholar]
- Euromonitor International. Passport Database; Euromonitor International: London, UK, 2020; Available online: https://go.euromonitor.com/passport.html (accessed on 15 December 2020).
- “Food Systems Dashboard.” 2020. 2020. Available online: https://foodsystemsdashboard.org/ (accessed on 15 December 2020).
- International Food Policy Research Institute. Global Nutrition Report 2015: Actions and Accountability to Advance Nutrition and Sustainable Development; International Food Policy Research Institute: Washington, DC, USA, 2015; ISBN 9-7808-9629-8835. [Google Scholar]
- Marshall, Q.; Fanzo, J.; Barrett, C. Building a global food system typology: A new tool for reducing complexity in food systems analysis. Frontiers 2021, in press. [Google Scholar]
- Popkin, B.M. Urbanization, lifestyle changes and the nutrition transition. World Dev. 1999, 27, 1905–1916. [Google Scholar] [CrossRef]
- Reardon, T.; Peter Timmer, C.; Barrett, C.B.; Berdegué, J. The Rise of Supermarkets in Africa, Asia, and Latin America. Am. J. Agric. Econ. 2003, 85, 1140–1146. [Google Scholar] [CrossRef]
- Adewopo, J.B.; Solano-Hermosilla, G.; Colen, L.; Micale, F. Using crowd-sourced data for real-time monitoring of food prices during the COVID-19 pandemic: Insights from a pilot project in northern Nigeria. Glob. Food Sec. 2021, 29, 100523. [Google Scholar] [CrossRef]
- WFP. Market Functionality Index: Technical Guidance; World Food Programme: Rome, Italy, 2020. [Google Scholar]
- Hawkes, C.; Walton, S.; Haddad, L.; Fanzo, J. 42 Policies and Actions to Orient Food Systems Towards Healthier Diets for All; Centre for Food Policy Research Brief: Washington, DC, USA, 2020. [Google Scholar]
- Development Initiatives. Global Nutrition Report 2017: Nourishing the SDGs; Development Initiatives: Bristol, UK, 2017. [Google Scholar]
- Quade, P.; Nsoesie, E.O. A platform for crowdsourced foodborne illness surveillance: Description of users and reports. JMIR Public Health Surveill. 2017, 3, 42. [Google Scholar] [CrossRef]
- Lesiv, M.; Laso Bayas, J.C.; See, L.; Duerauer, M.; Dahlia, D.; Durando, N.; Hazarika, R.; Kumar Sahariah, P.; Vakolyuk, M.; Blyshchyk, V.; et al. Estimating the global distribution of field size using crowdsourcing. Glob. Chang. Biol. 2019, 25, 174–186. [Google Scholar] [CrossRef] [PubMed]
- Minet, J.; Curnel, Y.; Gobin, A.; Goffart, J.-P.; Mélard, F.; Tychon, B.; Wellens, J.; Defourny, P. Crowdsourcing for agricultural applications: A review of uses and opportunities for a farmsourcing approach. Comput. Electron. Agric. 2017, 142, 126–138. [Google Scholar] [CrossRef] [Green Version]
- Dorninger, C.; Abson, D.J.; Apetrei, C.I.; Derwort, P.; Ives, C.D.; Klaniecki, K.; Lam, D.P.M.; Langsenlehner, M.; Riechers, M.; Spittler, N.; et al. Leverage points for sustainability transformation: A review on interventions in food and energy systems. Ecol. Econ. 2020, 171, 106570. [Google Scholar] [CrossRef]
- Pelletier, D.; Gervais, S.; Hafeez-ur-Rehman, H.; Sanou, D.; Tumwine, J. Boundary-spanning actors in complex adaptive governance systems: The case of multisectoral nutrition. Int. J. Health Plann. Manag. 2018, 33, 293–319. [Google Scholar] [CrossRef] [PubMed] [Green Version]
- Fløgstad, C.; Hagen, R.J. Aid dispersion: Measurement in principle and practice. World Dev. 2017, 97, 232–250. [Google Scholar] [CrossRef]
- Improving Data to Analyze Food and Nutrition Policies; National Academies Press: Washington, DC, USA, 2005; ISBN 9-7803-0910-0052.
Figure 1.
A food systems framework. Source: [48].
Figure 1.
A food systems framework. Source: [48].

Figure 2.
Food system-related indicator availability in the FSD.

Figure 3.
FSD data availability by income group. Note that Figure 3 does not include all sectors and sub-sectors included in the FSD.
Figure 3.
FSD data availability by income group. Note that Figure 3 does not include all sectors and sub-sectors included in the FSD.

Figure 4.
FSD visualization example—5-year growth in retail value of packaged foods. Source: (Euromonitor International 2020 [50]; “Food Systems Dashboard” 2020 [48,51]).

Figure 5.
Per capita GHG emissions from food consumption versus the supply of meat, by country. Source: (“Food Systems Dashboard” 2020 [48,51])


Publisher’s Note: MDPI stays neutral with regard to jurisdictional claims in published maps and institutional affiliations. |
© 2021 by the authors. Licensee MDPI, Basel, Switzerland. This article is an open access article distributed under the terms and conditions of the Creative Commons Attribution (CC BY) license (https://creativecommons.org/licenses/by/4.0/).
Share and Cite
MDPI and ACS Style
Marshall, Q.; Bellows, A.L.; McLaren, R.; Jones, A.D.; Fanzo, J. You Say You Want a Data Revolution? Taking on Food Systems Accountability. Agriculture 2021, 11, 422. https://0-doi-org.brum.beds.ac.uk/10.3390/agriculture11050422
AMA Style
Marshall Q, Bellows AL, McLaren R, Jones AD, Fanzo J. You Say You Want a Data Revolution? Taking on Food Systems Accountability. Agriculture. 2021; 11(5):422. https://0-doi-org.brum.beds.ac.uk/10.3390/agriculture11050422
Chicago/Turabian StyleMarshall, Quinn, Alexandra L. Bellows, Rebecca McLaren, Andrew D. Jones, and Jessica Fanzo. 2021. "You Say You Want a Data Revolution? Taking on Food Systems Accountability" Agriculture 11, no. 5: 422. https://0-doi-org.brum.beds.ac.uk/10.3390/agriculture11050422
Note that from the first issue of 2016, this journal uses article numbers instead of page numbers. See further details here.