Article

Allelic Variation of Soybean Maturity Genes E1E4 in the Huang-Huai-Hai River Valley and the Northwest China

National Soybean Industry Technology R & D Center, Institute of Crop Science, The Chinese Academy of Agricultural Sciences, Beijing 100081, China
*
Author to whom correspondence should be addressed.
Submission received: 22 March 2021 / Revised: 14 May 2021 / Accepted: 20 May 2021 / Published: 22 May 2021
(This article belongs to the Section Genotype Evaluation and Breeding)

Abstract

:
Soybean is planted in a wide span of the world, and flowering and maturity time is an important trait determining soybean yield formation and adaptation. Maturity loci E1, E2, E3 and E4 were frequently reported as the most influential genetic loci for soybean flowering and maturity. To understand the allelic variation and assess the phenological traits of cultivars with different E allelic combinations in natural environments, 251 cultivars of maturity group (MG) I–V were field tested in 42 locations across four sub-regions in the Huang-Huai-Hai and Northwest region of China and genotyped with KASP markers for E1E4 loci. The results indicated that mutant alleles were only found in the E1 and E2 locus, all of the cultivars carried functional alleles in the E3 and E4 loci in this area, with the frequency of mutant allele to be higher in early maturity groups (MGs) than late MGs. Among nine E allelic combinations in this area, one photoperiodic insensitive mutation in E2 loci (E1/e2-ns/E3-Ha/E4 and E1/e2-ns/E3-Mi/E4) made up the largest proportion (25.10 and 18.33%), while two photoperiodic insensitive mutations in both E1 and E2 loci (e1-as/e2-ns/E3-Ha/E4) (1.20%) occupied the lowest proportion in this panel. The major combinations of E locus for MGI, MGII and MG III in this area were E1/E2-dl/E3-Mi/E4, E1/e2-ns/E3-Mi/E4 and E1/e2-ns/E3-Ha/E4, respectively. Cultivars carrying e1-as/e2-ns/E3-Ha/E4 genotype flowered earliest (34 days) on average, 7.6 days earlier than the latest-flowering E haplotype (E1/e2-ns/E3-Ha/E4). This study provided an opportunity to detect the E allelic combinations in the Huang-Huai-Hai River Valley and the Northwest China, which would facilitate the improvement of soybean adaptation in the future.

1. Introduction

Soybean was originated from the Southeastern Asia and expanded to the tropical and high latitude zones [1,2]. Flowering time and maturity are the key traits determining the adaptation zone of soybean varieties. Soybean cultivars with different photo-thermal sensitivity adapt to different geographic zones [3]. Understanding the adaptive performance of soybean cultivars plays an important role in breeding.
Soybean flowering and maturity are regulated by the maturity genes, E1E9 [4,5,6,7,8,9,10], although more than 100 genes were involved in the process. Among them, E1 [11], E2 [12], E3 [13] and E4 [14] were identified and characterized. Cultivars carrying dominant alleles of E1, E2, E3, E4 genes showed a delay in flowering and maturity. Allelic variations in each of E1, E2, E3, E4 loci were identified to have different functions on flowering and maturity. E1 is a legume-specific transcription factor containing a B3 domain. e1-fs, a single base deletion caused by frame-shift mutation, and e1-nl, a deletion of the entire gene, are non-functional, while e1-as, a missense mutation, is not fully functional [11]. E2 is highly homologous to Arabidopsis GIGANTEA protein, which is participating in the circadian clock of the flowering pathway. e2-ns, an SNP caused a nonsense mutation, is non-functional [12]. Both E3 and E4 are phytochrome A genes. E3-Mi and E3-Ha are functional, while e3-ns, e3-tr, e3-fs and e3-Mo are nonfunctional [13,15]. e4 (SORE-1), a retrotransposon caused truncated protein with 237 amino acids, and e4-oto, e4-tsu, e4-kam and e4-kes, single base-pair deletions caused truncated proteins with different length, respectively, are non-functional [14].
Allelic variations of E1 to E4 genes in cultivar from different geographic zones and maturity groups were studied in China [16,17,18], Europe [19] and North America [20]. Allelic variation of E1 to E4 genes can explain 62–66% of variations in soybean flowering, indicating that allelic combinations of E genes play major roles in determining soybean flowering and adaptation zone [21]. Functional makers in E1E4 were developed in our previous study to genotype unknown variants in E1E4 maturity genes, which were useful for germplasm screening and molecular marker-assisted selection [15,18,21,22,23]. Competitive allele-specific PCR (KASP) genotyping with high throughput and low cost was extensively used for identifying SNPs [24,25].
Huang-Huai-Hai River Valley is the second largest production region in China and is a very important place of high-protein soybean production. The Northwest China is the place of creating national soybean high-yield records. In the current study, 251 soybean cultivars of MG I to MG V with nine E allelic combinations were planted in four sub-regions. The aims of our study are to (1) analyze the allelic variation of E1 to E4 in the collection of cultivars in the Huang-Huai-Hai and Northwest China and (2) analyze the phenological performance of cultivars with different E combinations.

2. Material and Methods

2.1. Plant Material and Locations

The experiment consists of 251 soybean (Glycine max (L.) Merr.) cultivars from five maturity groups (MG) MGI (5), MG II (42), MG III (193), MG IV (10) and MG V (1). It originates from four sub-regions. Forty-seven cultivars were from the north sub-region, 64 were from the middle sub-region, 82 were from the south sub-region, and 25 were from the northwest sub-region, and 33 cultivars were in the tests of multiple sub-regions (Table S1). The soybean seeds were obtained from the breeders.

2.2. Experimental Design and Data Collection

The data were downloaded from the report of multiple-site soybean variety test in the Huang-Huai-Hai region in 2017–2018, which did not include the replication data (http://www.soybreeding.com/download/download.php?lang=cn&class2=77, accessed on 15 May 2019). The experiment was carried out in 42 locations in four sub-regions, with 11, 12, 11 and 11 locations in the north, middle, south and northwest sub-regions, respectively. Among them, 3 locations, Fenyang, Zhengzhou and Taiyuan, carried out the tests of two sub-regions. The latitude and longitude of locations were ranged from 32°93′ N to 40°17′ N, from 102°61′ E to 119°15′ E, respectively (Table S2). Cultivars originating from each sub-region were planted in the locations of the corresponding region. One hundred and 95 cultivars were tested in 2017 and 2018, respectively, and 56 were tested in both years. The experiment was arranged in a complete randomized block design with three replications. Each plot consisted of 6 rows that were 6 m long with an inter-row spacing of 0.5 m. The plants were thinned to a uniform stand of 22 and 18 plants m−2 after emergence in the north and middle, south and northwest sub-regions, respectively. A basal fertilizer was applied (150 kg ha−1 (NH4)H2PO4, 75 kg ha−1 urea, and 40 kg ha−1 K2SO4) prior to planting. Weeds and pests were controlled normally. The phenological stages of emergence (VE), beginning bloom (R1) and full maturity (R8) were recorded according to soybean growth stages described by Fehr and Caviness [26]. The days to flowering (DTF) and days to maturity (DTM) were calculated as the period from VE to R1 and from VE to R8, respectively. Two other derived variables were calculated as follows: reproductive period (RP) is the difference between DTM and DTF; R/V is the ratio of the reproductive period (the period from R1 to R8) to the vegetative period (the period from VE to R1). Soybean varieties with the same maturity time may have different growth structure, namely, the R/V ratio, which indicates the comparison of the pre-flowering to the post-flowering duration.

2.3. Genotyping of Maturity Loci

The SNPs between different alleles of E1, E2, E3 and E4 were described in our previous study [18]. KASP allele-specific primers were designed to genotype SNP variants in E1 and E2, or an InDel in E3 locus (Supplementary Table S3). Primers sequences are shown in Table S3. Genomic DNA was extracted from fresh trifoliate leaves of each cultivar with a modified cetyl trimethyl ammonium bromide (CTAB) method. KASP assays and InDel assays were developed and conducted to genotype E1E3 in this panel.

2.4. Statistical Analysis

Analyses of variance for DTF, DTM, RP and R/V were calculated across sub-regions and in each sub-region separately, and it was conducted with a linear mixed-effect model (lme) in the nlme package in R software (Version 3.6.1). The genotypes in E1, E2 and E3 loci (only one genotype of E4, the dominant E4, is found; E4 locus is exclusive in the ANOVA analysis), locations, the interactions between genotypes of E1, E2, E3 loci and location were fixed effects, and year was a random effect, given its lack of replication data. Best linear unbiased estimates (BLUEs) of DTF, DTM, RP and R/V of varieties across locations in each sub-region were calculated and used as the mean phenotype in each sub-region.

3. Results

3.1. Genotyping of E1–E4 in the Huang-Huai-Hai River Valley and the Northwest China

Among the 251 cultivars, 84% carried wild type allele (E1), and 16% carried the mutant allele (e1-as). At the E2 locus, three allelic variations were found with the frequency of 28, 28 and 44% for E2-dl, E2-in and e2-ns alleles, respectively. At the E3 locus, E3-Ha was identified in 58% of cultivars, and E3-Mi was identified in 42% of cultivars. Only one dominant allele (E4) was found in the E4 locus.
A total of nine allelic combinations of these four E genes were identified across 251 cultivars. Among them, the most abundant E haplotypes were E1/e2-ns/E3-Ha/E4 (25.10%) and E1/e2-ns/E3-Mi/E4 (18.33%), which contained one recessive photoperiodic insensitive allele in E2 loci, while e1-as/e2-ns/E3-Ha/E4 (1.20%) occupied the least proportion in this panel, which carried recessive photoperiodic insensitive alleles in both E1 and E2 loci (Figure 1).

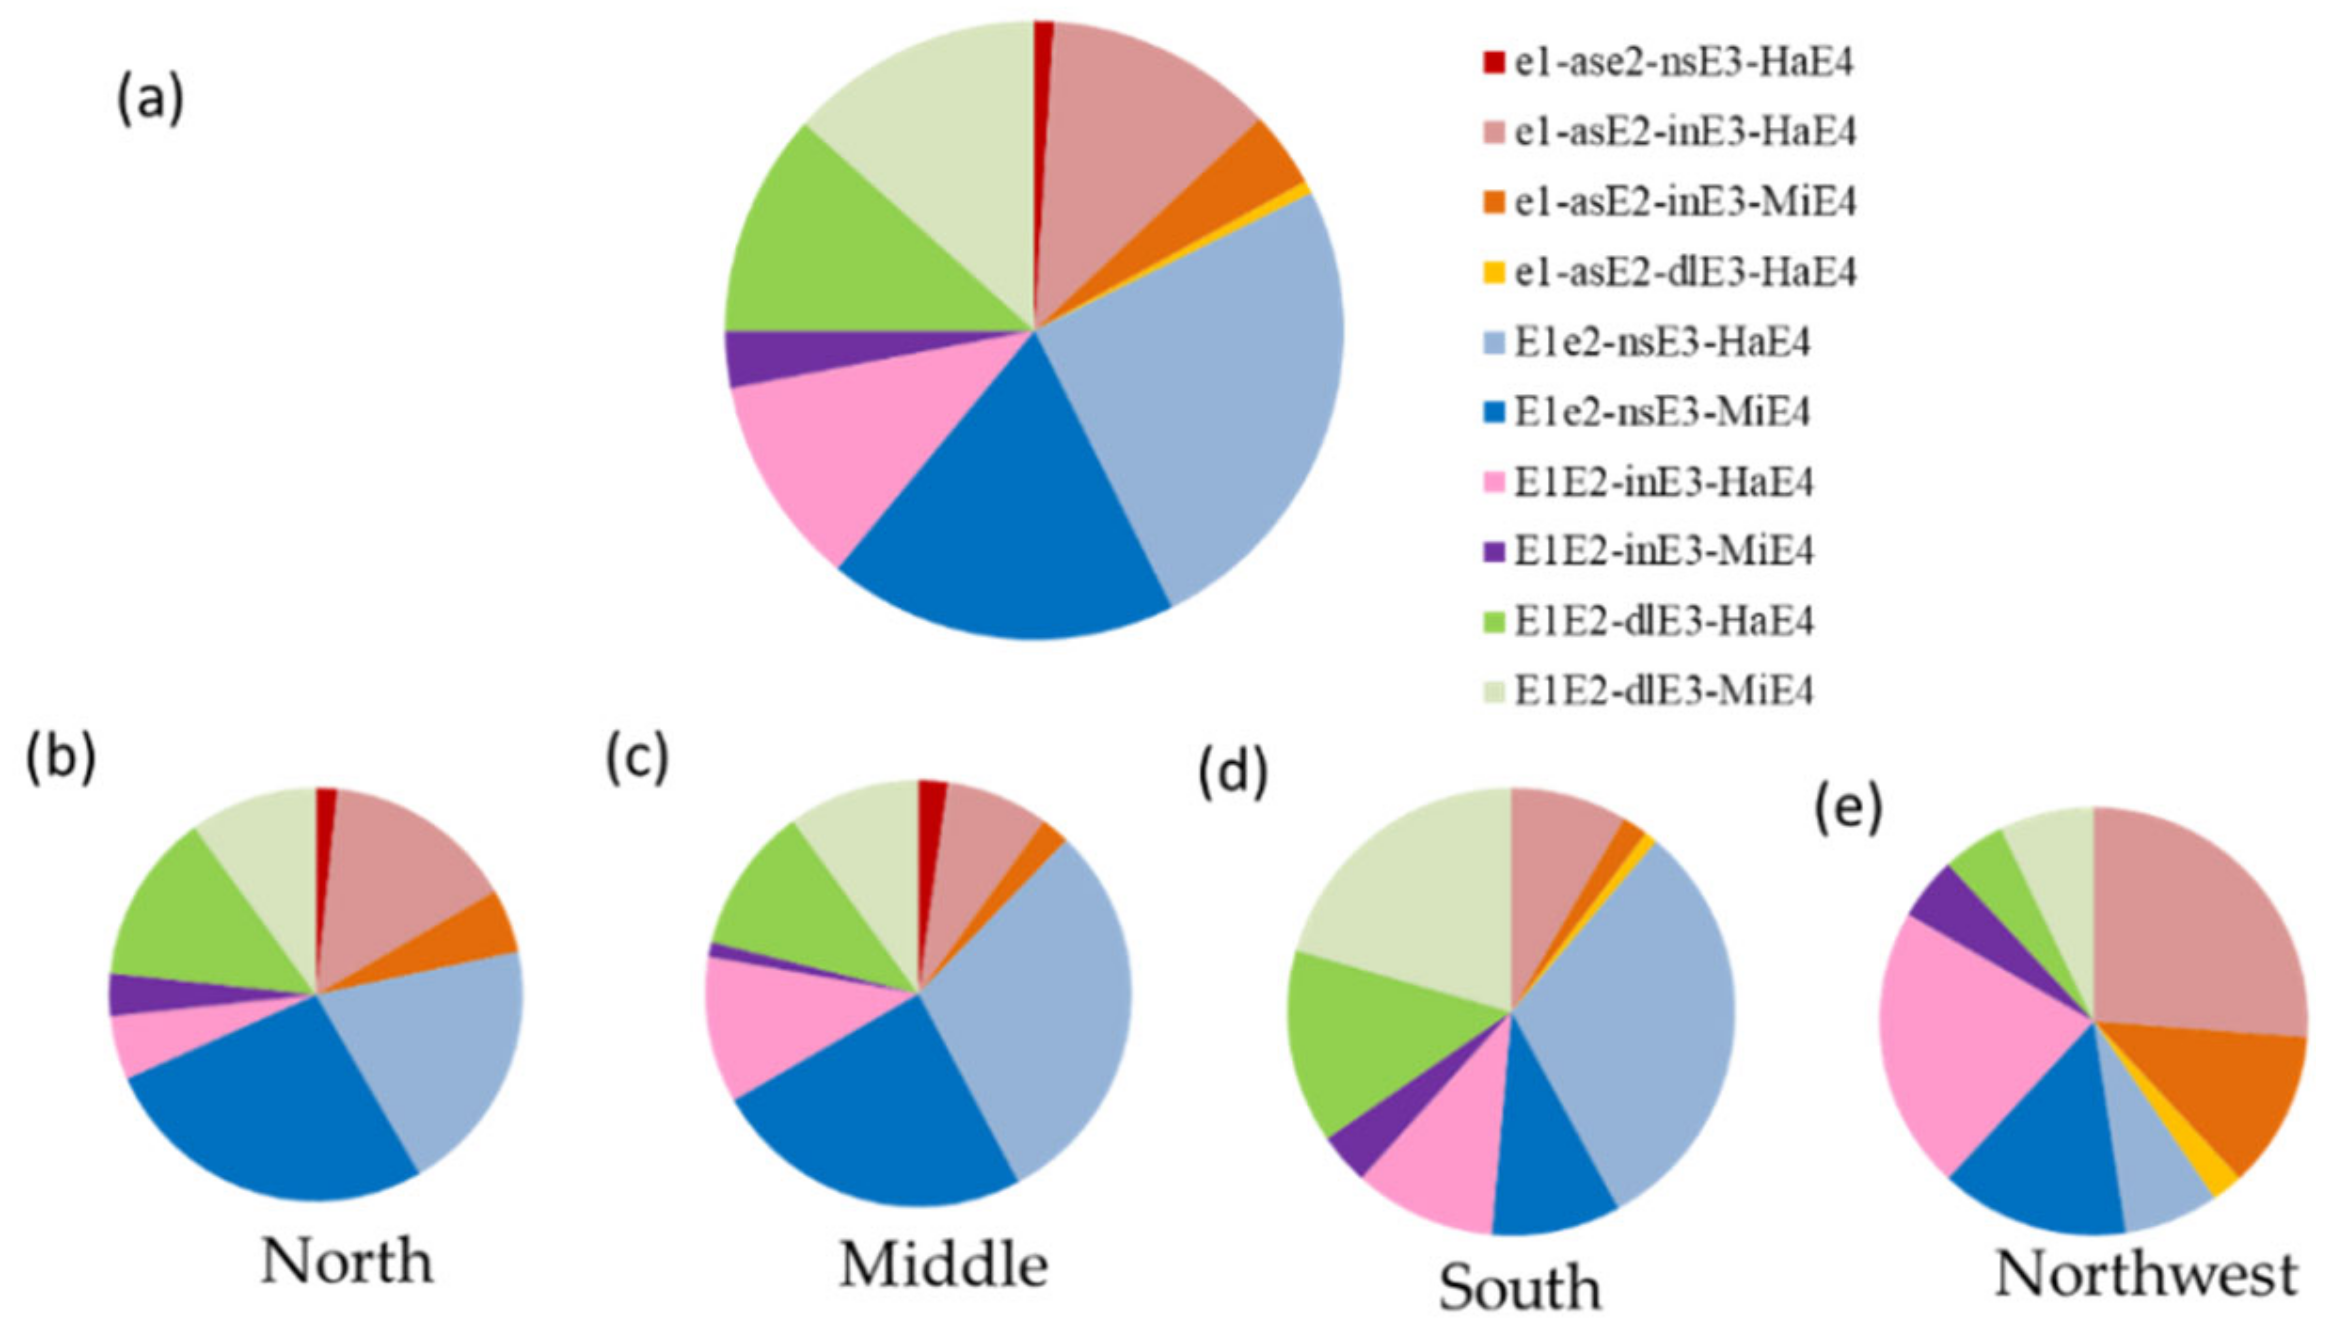
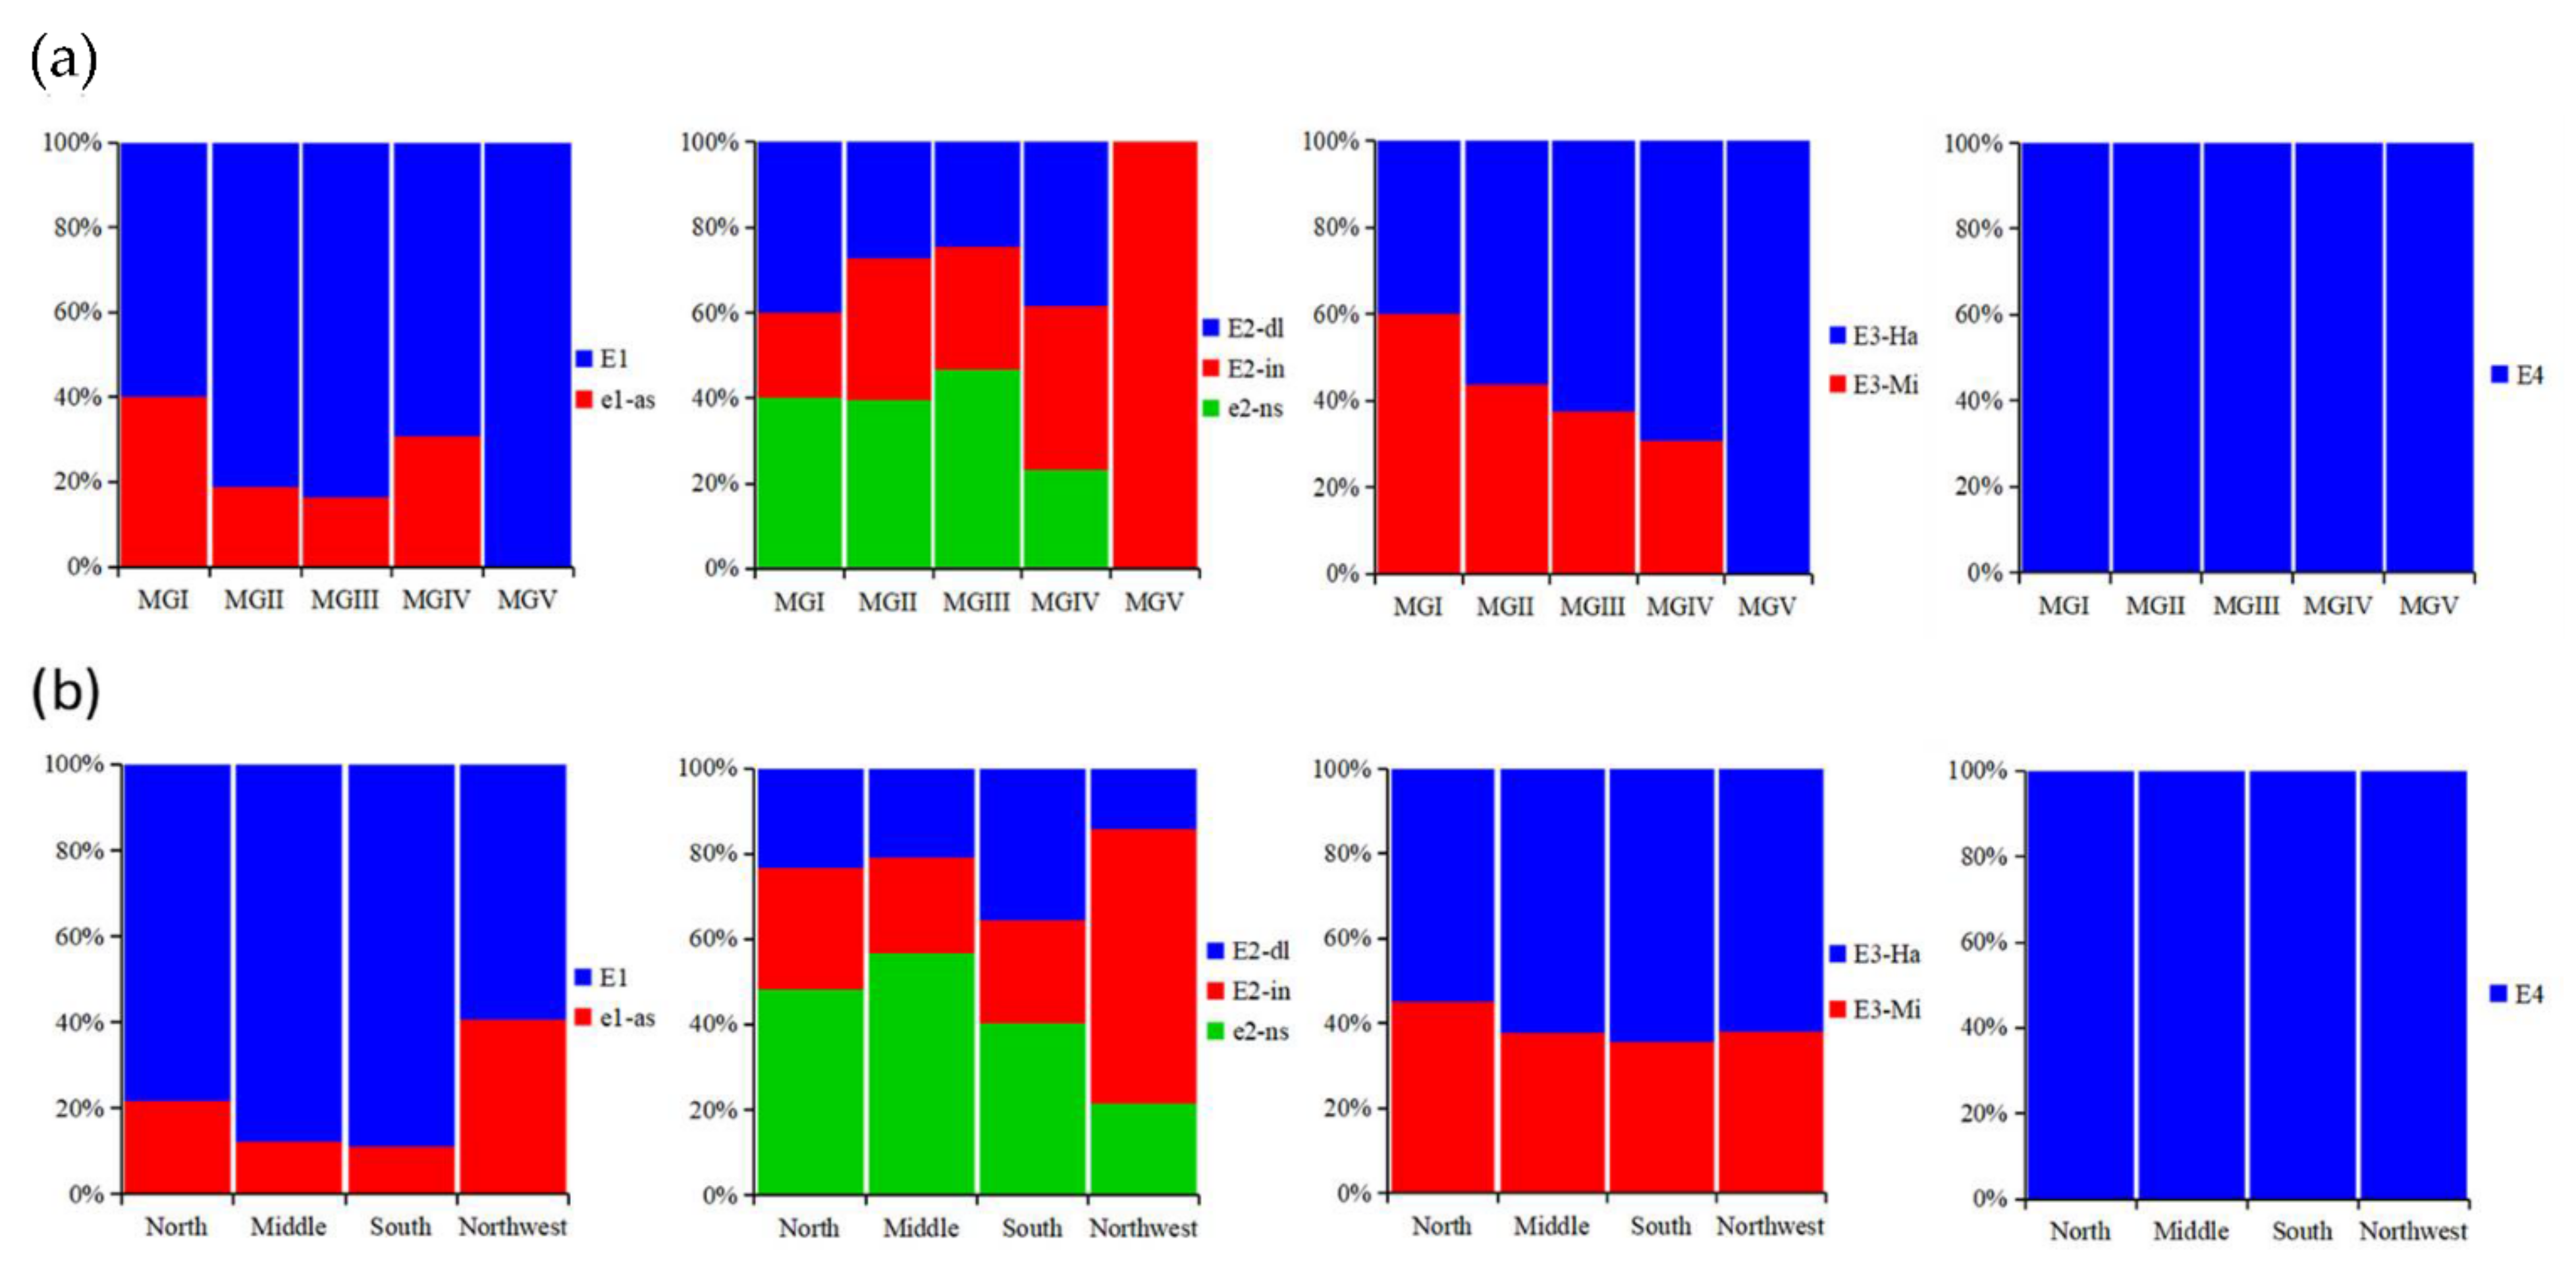
3.2. Distribution of E Genotypes in Different Maturity Groups and Sub-Regions

In the Huang-Huai-Hai River Valley and the Northwest China, the soybean cultivars with mutant E1E4 alleles would have early flowering and maturity. Mutant allele (e1-as) occupied 40.0, 18.8, 16.4, 30.8 and 0.0% of cultivars in the MGI, MG II, MG III, MG IV and MG V, respectively, which showed an approximately decreased trend from early to late MGs. The highest percentage for E2-dl, e2-ns and E2-in alleles were in cultivars of MGI (40.0%), MG III (46.6%) and MGIV (38.5%), respectively (Figure 2a). The frequency of e2-ns was higher in early MGs (MG I-III) than late MGs (MG IV-V); to the contrary, the frequency of E2-in was higher in late MGs (MG IV-V) than early MGs (MG I-III). The proportion of E3-Ha became larger from early MGs to late MGs, whereas the proportion of E3-Mi showed an opposite trend. The major combinations of E locus for MGI, MGII and MG III were E1/E2-dl/E3-Mi/E4, E1/e2-ns/E3-Mi/E4 and E1/e2-ns/E3-Ha/E4 with the proportion of 40.0, 23.8 and 28.0%, respectively. Three E genotypes, E1/E2-dl/E3-Ha/E4, E1/E2-in/E3-Mi/E4 and E1/e2-ns/E3-Ha/E4, occupied the highest proportion in MG IV in this region (Table 1).
The distribution of E alleles was different across different sub-regions. E1 allele presented a higher frequency than e1-as allele in the cultivars across four sub-regions. With regards to E2 locus, E2-in played a dominant role in the northwest cultivars (64.3%), while e2-ns played dominant roles in the north (48.3%), middle (56.7%) and south (40.2%) cultivars, respectively. E3-Ha was identified at a higher frequency than E3-Mi across four sub-regions. E1/e2-ns/E3-Mi/E4, E1/e2-ns/E3-Ha/E4, E1/e2-ns/E3-Ha/E4 and E1/E2-in/E3-Ha/E4 made up the largest proportion of cultivars in the north, middle, south and northwest sub-regions, which were 29.2, 33.3, 38.7 and 34.8%, respectively, indicating that E1/e2-ns/E3-Ha/E4 is the most dominant E combination in the Huang-Huai-Hai River Valley and the Northwest China (Figure 2b).

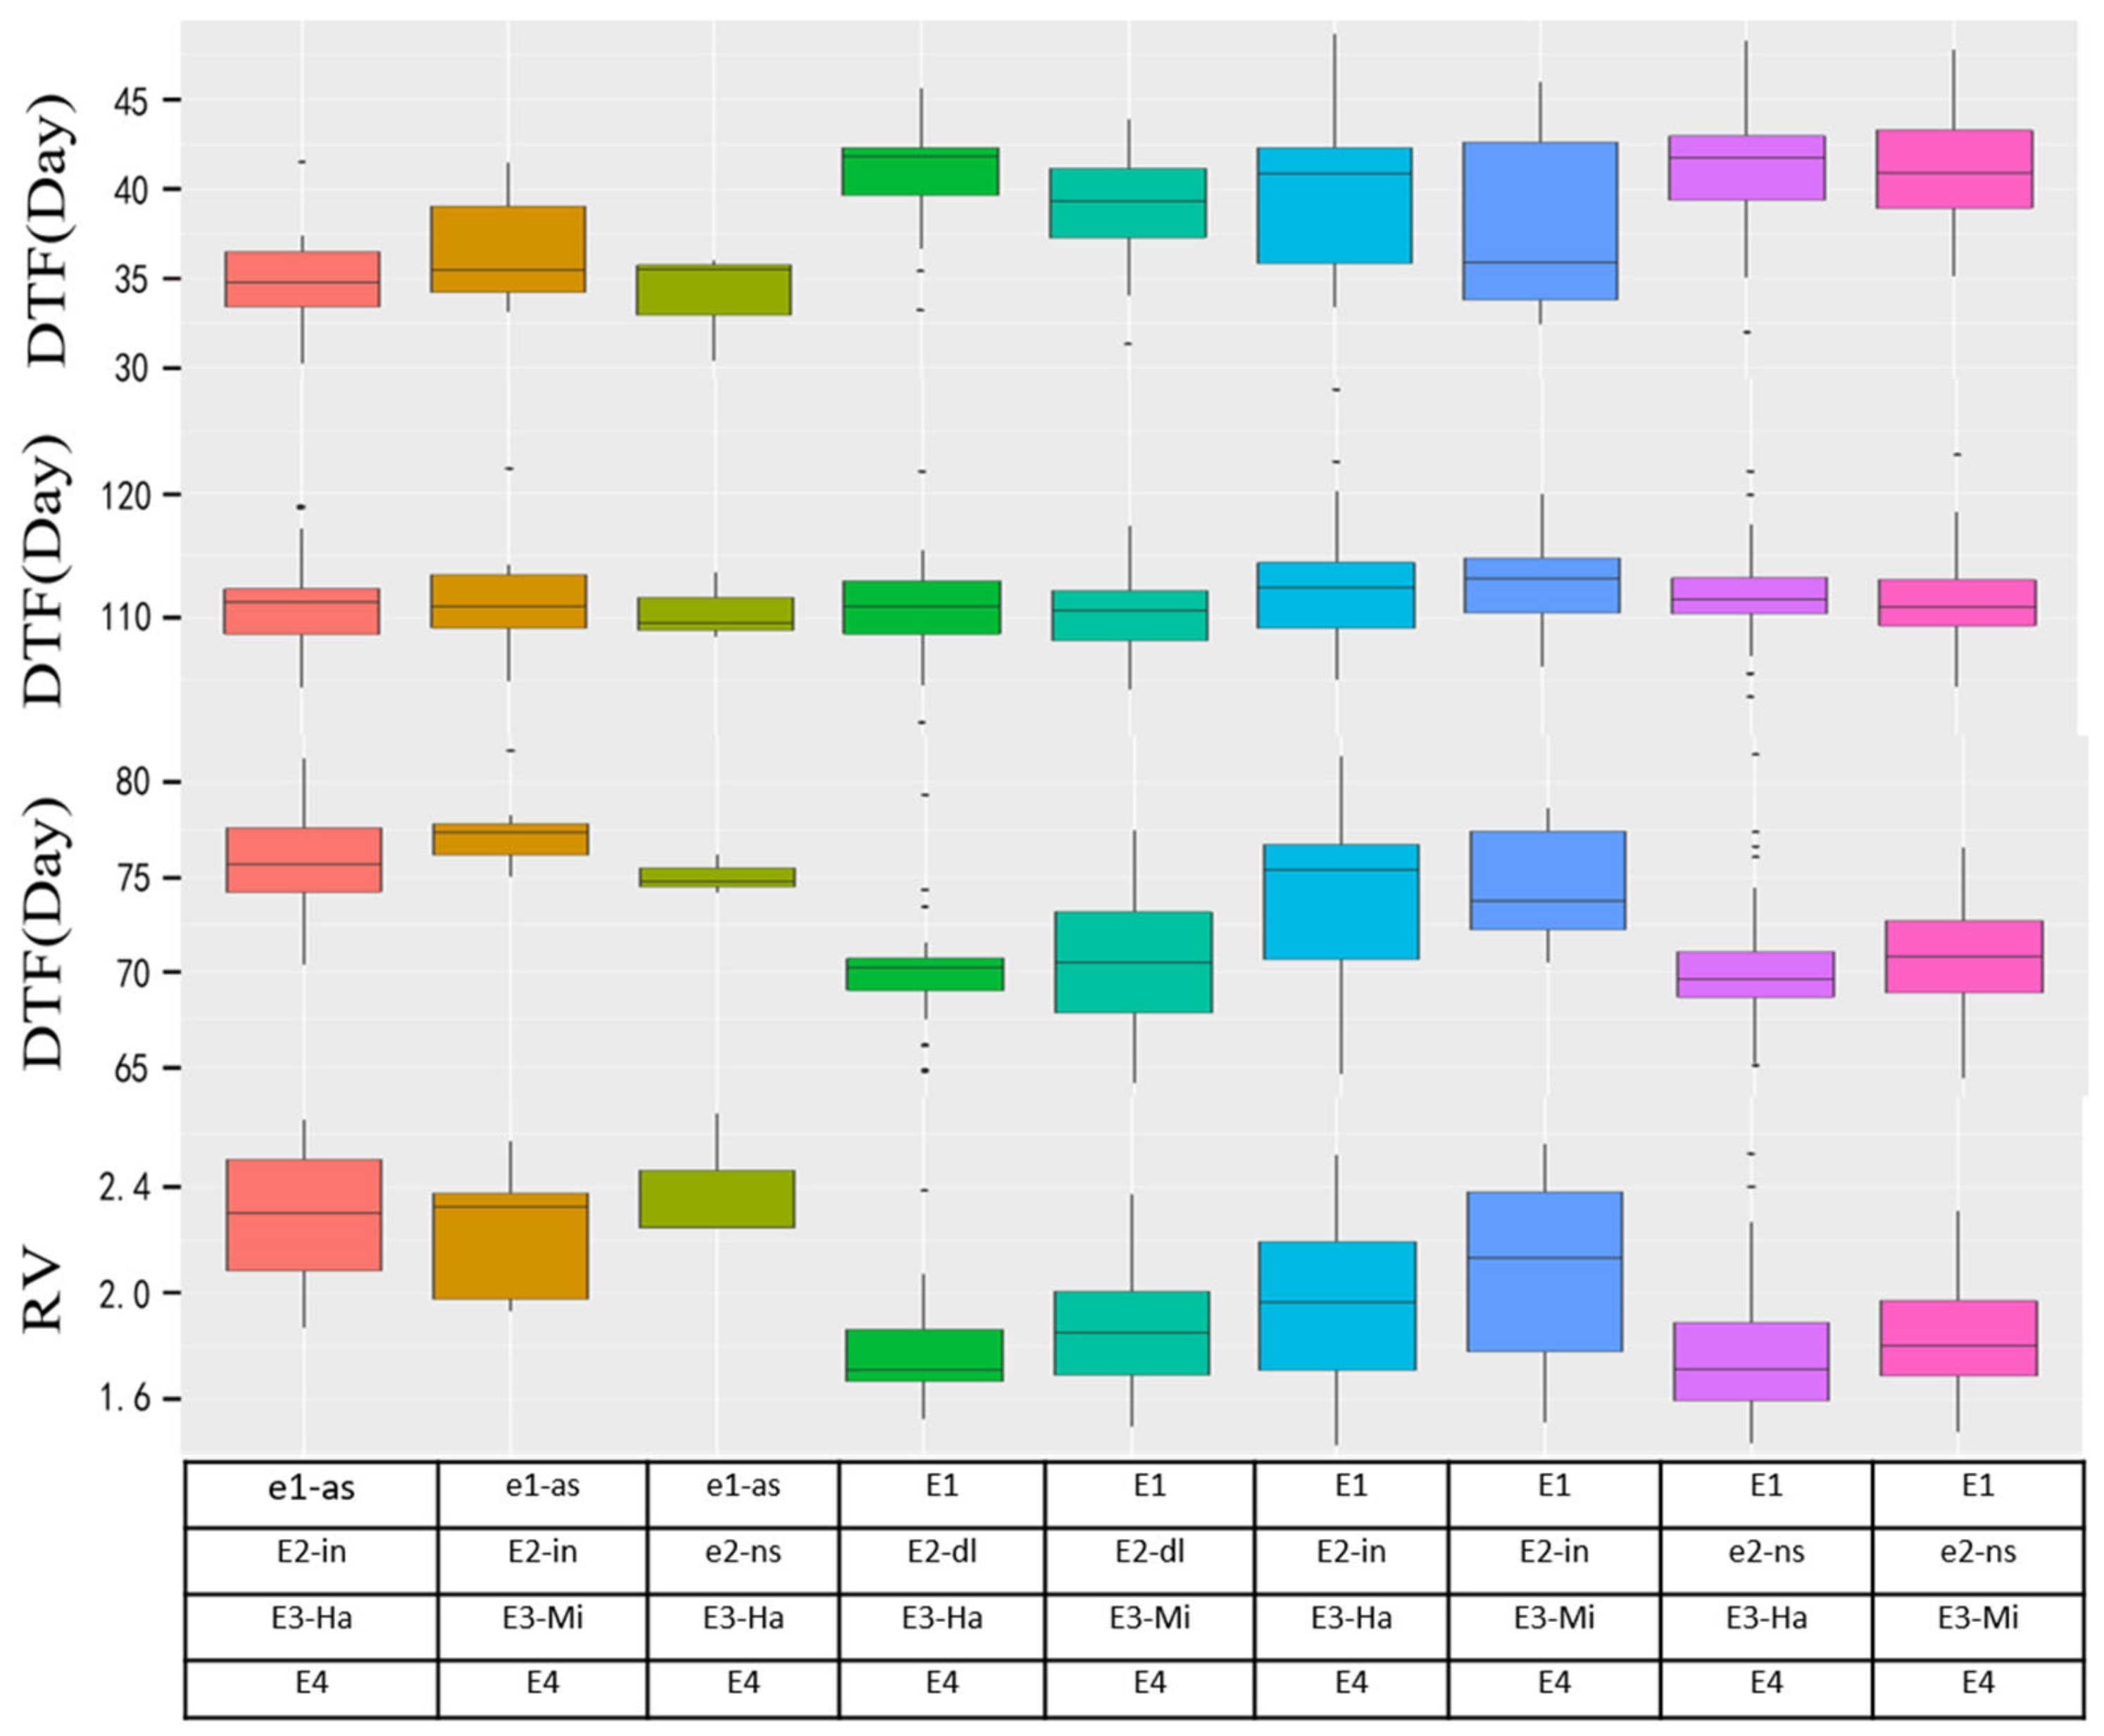
3.3. The Performance of Flowering and Maturity Time with Different E Allelic Combinations

Analyses of variation showed that E genotype, location and their interaction were significant for all phenological traits (DTF, DTM, RP and RV), with the exception of E3 locus suggesting that E genotype, environment and E genotype by environment interaction contributed to the phenotypic variation. Location is the largest contributor to the phenotypic variation, which is 4.53 to 49.29 times of that of E genotype effect, and E genotype by environment interaction is the least important source of variation; this may be due to the large number of locations (42 locations) in the current study and the variation contributed by the flowering genes other than E1 to E4. Analyses of variation in each sub-region were conducted and demonstrated that E3 × Loc interaction and E3 were non-significant across all sub-regions, with the exception of E3 genotype in the south sub-region. E genotype and location interaction was non-significant in most sub-regions (Table 2). E1 contributed a larger effect to the variation of DTF, DTM, RP and RV compared with E2 and E3.
To compare the duration of the vegetative growth, reproductive growth, total growth phase as well as the ratio of the reproductive to the vegetative growth phase of cultivars with different E combinations, we calculated the BLUEs of cultivars across locations with the same E combinations regarding DTF, DTM, RP and RV. The haplotype with both mutations in E1 and E2 locus (e1-as/e2-ns/E3-Ha/E4) reached the earliest flowering (34.0 days), 7.6 days earlier than the latest-flowering E haplotype (E1/e2-ns/E3-Ha/E4). However, the haplotype of e1-ase2-nsE3-HaE4 has a relatively long reproductive stage (75.06 days), which is 5.25 days longer than the shortest haplotype (E1/E2-dl/E3-Ha/E4) (69.81 days) (Figure 3). The cultivars with similar maturity may have different growth period structures; for instance, Andou109 (E1/e2-ns/E3-Ha/E4) (R/V = 1.7) have a 7-day longer pre-flowering phase and a 7-day shorter post-flowering period than Cangdou 09Y1 (e1-as/E2-in/E3-Ha/E4) (R/V = 2.4), but they have a similar growth period (109 days). We also observed variations within the same E haplotype for flowering and maturity, indicating that additional loci also participate in regulating flowering and maturity.

4. Discussion

Huang-Huai-Hai region is the second largest soybean production region, which was the origin of the domesticated soybean [27]. The Northwest China is the place of creating soybean national high-yield records. To expand to a wider geographic range, artificial selections in maturity genes were made to match the natural photo-thermal conditions [3]. Natural variations of E1 to E4 genes were found to be limited in the cultivars of MG I-V in the Huang-Huai-Hai and the Northwest region in the current study; only partial non-functional mutations were identified in E1 and E2 loci, and no significant mutations were in E3 and E4 loci, indicating that E3 and E4 loci were fixed in this zone. The results were consistent with a previous report in America and in China of double mutant e1-as/e2 (MG I-III), single mutant e1-as/E2 (MG II-IV) and E1/e2 (MG II-V) and wild type E1/E2 (MG III-VIII) given that no mutations occurred in E3 and E4 loci [16,18,20]. Cultivars carrying allelic combinations of E1/e2-ns/E3/E4 occupied the highest proportion in the Huang-Huai-Hai River Valley, which is a mostly summer-planting soybean, and this agrees with other studies [18]. The cultivars with E1/e2-ns/E3/E4 occupied 45.8% cultivars of MGs I-VI, indicating that it played an important role in adjusting to wide ranges of geographical region and multiple cropping systems.
The cultivars with the combination of both mutations in E1 and E2 loci had the earliest flowering time compared with cultivars of other E combinations, which is consistent with the result of another study on 308 Chinese cultivars with 12 maturity groups [18]. The effect of E1 is different among different E2E4 genetic backgrounds. Cultivars carrying E1/e2-ns/e3-tr/E4 reached flowering and maturity very early, which is similar to e1-as/e2-ns/e3-tr/E4, whereas cultivars carrying E1/e2-ns/E3/E4 showed delayed flowering and maturity compared with e1-as/e2-ns/E3/E4 [18].
With early-maturing “Harosoy” near-isogenic lines, Cober et al. [28] found that E1 allele delayed both flowering and maturity by 16 days under the natural day length compared with early-maturing alleles. The flowering and maturity of lines with the E1 allele did not show much difference under long-day conditions compared with that under natural day length. Under the 12 h short-day condition, there are no differences in flowering and maturity between different near-isogenic lines, indicating that E genes inhibit flowering in the natural and long-day conditions. Compared with wild-type alleles, mutation alleles reduce the photoperiod sensitivity and shorten the growth period. However, in the current study, the effect of E genes cannot be identified in the cultivars with different and unknown genetic backgrounds, rather than near-isogenic lines with consistent genetic background besides the target loci in Cober’s study; therefore, genetic effect and gene by environment interaction were not studied in the current study.
Phenotypic plasticity determines the adaptability of plants to environmental stimuli, particularly in the context of climate change. For instance, in the current study, the e1-as/E2-in/E3-Ha/E4 genotype in the genetic background of Ji1708 and Lu0126 showed different rankings with different traits across different sub-regions, demonstrating that genetic background besides E loci also affects the phenotypic variation and contributes to genetic and environmental interaction (GEI). This study provides knowledge for germplasm evaluation as well as lays the foundation for selecting and designing elite cultivars of E combinations in the Huang-Huai-Hai River Valley and Northwest China.

5. Conclusions

Nine E allelic combinations were identified in the Huang-Huai-Hai River Valley and Northwest China, one photoperiodic insensitive mutation in E1 or E2 loci were the most frequent genotypes, while two photoperiodic insensitive mutations in both E1 and E2 loci were the least frequent genotypes, which flowered earliest on average. This study provided an opportunity to detect the adaptable E allelic combinations in the Huang-Huai-Hai River Valley and the Northwest China, which would facilitate the improvement of soybean adaptation in the future.

Supplementary Materials

The following are available online at https://0-www-mdpi-com.brum.beds.ac.uk/article/10.3390/agriculture11060478/s1. Table S1: Soybean cultivars analyzed in the current study and their Maturity Groups (MG), regions, E allele combinations and the tested year, Table S2: The latitude and longitude of locations in the current study, Table S3: Primers for E1–E3 genotyping.

Author Contributions

Conceptualization, S.S., T.H. and C.W.; methodology, X.Z. and T.W.; software, X.Z. and T.W.; validation, S.S., T.H. and C.W.; formal analysis, X.Z., T.W. and H.W.; investigation, X.Z. and T.W.; resources, S.S., T.H. and C.W.; data curation, T.W., W.S. and C.X.; writing—original draft preparation, T.W.; writing—review and editing, T.W. and H.W.; visualization, C.X. and W.S.; supervision, S.S., T.H. and C.W.; project administration, S.S., T.H. and C.W.; funding acquisition, S.S., T.H. and C.W. All authors have read and agreed to the published version of the manuscript.

Funding

This work was funded by the National Key R&D Program of China (2017YFD0101400), China Agriculture Research System (CARS-04), the CAAS Agricultural Science and Technology Innovation Project and National Natural Science Foundation of China Project No.31601239. We thank the researchers at all of the experimental stations for taking measurements.

Institutional Review Board Statement

Not applicable.

Informed Consent Statement

Not applicable.

Data Availability Statement

All the data supporting the findings of this study are included in this article.

Conflicts of Interest

The authors declare no conflict of interest.

References

  1. Badole, S.L.; Bodhankar, S.L. Chapter 8—Glycine max (Soybean) Treatment for diabetes. In Bioactive Food as Dietary Interventions for Diabetes; Watson, R.R., Preedy, V.R., Eds.; Academic Press: Cambridge, MA, USA, 2013; pp. 77–82. [Google Scholar]
  2. Wilson, R.F. Soybean: Market driven research needs. In Genetics and Genomics of Soybean; Stacey, G., Ed.; Springer: New York, NY, USA, 2008; pp. 3–15. [Google Scholar]
  3. Langewisch, T.; Lenis, J.; Jiang, G.L.; Wang, D. The development and use of a molecular model for soybean maturity groups. BMC Plant Biol. 2017, 17, 91. [Google Scholar] [CrossRef]
  4. Bernard, R.L. Two major genes for time of flowering and maturity in soybeans. Crop Sci. 1971, 11, 242–244. [Google Scholar] [CrossRef]
  5. Buzzell, R.I. Inheritance of a soybean flowering response to fluorescentdaylength conditions. Can. J. Genet. Cytol. 1971, 13, 703–707. [Google Scholar] [CrossRef]
  6. Buzzell, R.I.; Voldeng, H.D. Inheritance of insensitivity to long daylength. Soyb. Genet. Newsl. 1980, 7, 26–29. [Google Scholar]
  7. McBlain, B.A.; Bernard, R.L. A new gene affecting the time of flowering and matuirty in soybean. J. Hered. 1987, 78, 160–162. [Google Scholar] [CrossRef]
  8. Bonato, E.R.; Vello, N.A. E6, a dominant gene conditioning early flowering and maturity in soybeans. Genet. Mol. Biol. 1999, 22, 229–232. [Google Scholar] [CrossRef] [Green Version]
  9. Cober, E.R.; Voldeng, H.D. A new soybean maturity and photoperiod-sensitivity locus linked to E1 and T. Crop Sci. 2001, 41, 698–701. [Google Scholar] [CrossRef]
  10. Kong, F.; Nan, H.; Cao, D.; Li, Y.; Wu, F.; Wang, J.; Lu, S.; Yuan, X.; Cober, E.R.; Abe, J.; et al. A new dominant gene E9 conditions early flowering and maturity in soybean. Crop Sci. 2014, 54, 2529–2535. [Google Scholar] [CrossRef]
  11. Xia, Z.; Watanabe, S.; Yamada, T.; Tsubokura, Y.; Nakashima, H.; Zhai, H.; Anai, T.; Sato, S.; Yamazaki, T.; Lü, S.; et al. Positional cloning and characterization reveal the molecular basis for soybean maturity locus E1 that regulates photoperiodic flowering. PNAS 2012, 109, 12852–12853. [Google Scholar] [CrossRef] [Green Version]
  12. Watanabe, S.; Xia, Z.; Hideshima, R.; Tsubokura, Y.; Sato, S.; Yamanaka, N.; Takahashi, R.; Anai, T.; Tabata, S.; Kitamura, K.; et al. A map-based cloning strategy employing a residual heterozygous line reveals that the GIGANTEA gene is involved in soybean maturity and flowering. Genetics 2011, 188, 395–407. [Google Scholar] [CrossRef] [Green Version]
  13. Watanabe, S.; Hideshima, R.; Xia, Z.; Tsubokura, Y.; Sato, S.; Nakamoto, Y.; Yamanaka, N.; Takahashi, R.; Ishimoto, M.; Anai, T.; et al. Map-based cloning of the gene associated with the soybean maturity locus E3. Genetics 2009, 182, 1251–1262. [Google Scholar] [CrossRef] [PubMed] [Green Version]
  14. Liu, B.; Kanazawa, A.; Matsumura, H.; Takahashi, R.; Harada, K.; Abe, J. Genetic redundancy in soybean photoresponses associated with duplication of the phytochrome A gene. Genetics 2008, 180, 995–1007. [Google Scholar] [CrossRef] [PubMed] [Green Version]
  15. Xu, M.; Xu, Z.; Liu, B.; Kong, F.; Jun, A. Genetic variation in four maturity genes affects photoperiod insensitivity and PHYA-regulated post-flowering responses of soybean. BMC Plant Biol. 2013, 13, 1–14. [Google Scholar] [CrossRef] [Green Version]
  16. Jiang, B.; Nan, H.; Gao, Y.; Tang, L.; Yue, Y. Allelic combinations of soybean maturity loci E1, E2, E3 and E4 result in diversity of maturity and adaptation to different latitudes. PLoS ONE 2014, 9, e106042. [Google Scholar]
  17. Li, J.; Wang, X.; Song, W.; Huang, X.; Qiu, L. Genetic variation of maturity groups and four E genes in the Chinese soybean mini core collection. PLoS ONE 2017, 12, e0172106. [Google Scholar] [CrossRef]
  18. Liu, L.; Song, W.; Wang, L.; Sun, X.; Han, T. Allele combinations of maturity genes E1-E4 affect adaptation of soybean to diverse geographic regions and farming systems in China. PLoS ONE 2020, 15, e0235397. [Google Scholar] [CrossRef]
  19. Kurasch, A.K.; Hahn, V.; Leiser, W.L.; Vollmann, J.; Schori, A.; Bétrix, C.-A.; Mayr, B.; Winkler, J.; Mechtler, K.; Aper, J.; et al. Identification of mega-environments in Europe and effect of allelic variation at maturity E loci on adaptation of European soybean. Plant Cell Environ. 2017, 40, 765–778. [Google Scholar] [CrossRef]
  20. Wolfgang, G.; An, Y.C. Genetic separation of southern and northern soybean breeding programs in North America and their associated allelic variation at four maturity loci. Mol. Breeding. 2017, 37, 1–9. [Google Scholar] [CrossRef] [Green Version]
  21. Tsubokura, Y.; Watanabe, S.; Xia, Z.; Kanamori, H.; Yamagata, H.; Kaga, A.; Katayose, Y.; Abe, J.; Ishimoto, M.; Harada, K. Natural variation in the genes responsible for maturity loci E1, E2, E3 and E4 in soybean. Ann. Bot. 2014, 113, 429–441. [Google Scholar] [CrossRef] [PubMed] [Green Version]
  22. Tsubokura, Y.; Matsumura, H.; Xu, M.; Liu, B.; Nakashima, H.; Anai, T.; Kong, F.; Yuan, X.; Kanamori, H.; Katayose, Y.; et al. Genetic variation in soybean at the maturity locus E4 is involved in adaptation to long days at high latitudes. Agron. J. 2013, 3, 117–134. [Google Scholar] [CrossRef] [Green Version]
  23. Zhai, H.; Lü, S.; Wu, H.; Zhang, Y.; Zhang, X.; Yang, J.; Wang, Y.; Yang, G.; Qiu, H.; Cui, T.; et al. Diurnal expression pattern, allelic variation, and association analysis reveal functional features of the e1 gene in control of photoperiodic flowering in soybean. PLoS ONE 2015, 10, e0135909. [Google Scholar] [CrossRef] [Green Version]
  24. Semagn, K.; Babu, R.; Hearne, S.; Olsen, M. Single nucleotide polymorphism genotyping using Kompetitive Allele Specific PCR (KASP): Overview of the technology and its application in crop improvement. Mol. Breeding. 2014, 33, 1–14. [Google Scholar] [CrossRef]
  25. Thomson, M.J. High-Throughput SNP genotyping to accelerate crop improvement. Plant Breed Biotech. 2014, 2, 195–212. [Google Scholar] [CrossRef]
  26. Fehr, W.R.; Caviness, C.E.; Burmood, D.T.; Pennington, J.S. Stage of development descriptions for soybeans, Glycine max (L.) Merrill. Crop Sci. 1971, 11, 929–931. [Google Scholar] [CrossRef]
  27. Sedivy, E.J.; Wu, F.; Hanzawa, Y. Soybean domestication: The origin, genetic architecture and molecular bases. N. Phytol. 2017, 214, 539–553. [Google Scholar] [CrossRef] [PubMed] [Green Version]
  28. Cober, E.R.; Tanner, J.W.; Voldeng, H.D. Genetic control of photoperiod response in early-maturing, near-isogenic soybean lines. Crop Sci. 1996, 36, 601–605. [Google Scholar] [CrossRef]
Figure 1. Frequency of E1E4 combinations (a) in four sub-regions; (b) north sub-region; (c) middle sub-region; (d) south sub-region; (e) northwest sub-region. Different colors represent different E genotypes.
Agriculture 11 00478 g001
Figure 2. Distribution of E1E4 alleles among different (a) maturity groups (MGs) and (b) sub-regions. Columns with different colors represent different E alleles.
Agriculture 11 00478 g002
Figure 3. DTF, DTM, RP and R/V of 9 different E genotypes. DTF, days from emergence (VE) to beginning bloom (R1); DTM, days from emergence (VE) to maturity (R8); RP, days from beginning bloom (R1) to maturity (R8); R/V, the ratio of the reproductive period to the vegetative period.
Agriculture 11 00478 g003
Table 1. The number of varieties with different E allelic combinations in different maturity groups (MG).
MGE allele CombinationsNo. of Variety
Ie1-as/E2-in/E3-Ha/E41
e1-as/e2-ns/E3-Ha/E41
E1E2-dl/E3-Mi/E42
E1/e2-ns/E3-Mi/E41
IIe1-as/E2-in/E3-Ha/E47
e1-as/e2-ns/E3-Ha/E41
E1/E2-dl/E3-Ha/E44
E1/E2-dl/E3-Mi/E48
E1/E2-in/E3-Ha/E43
E1/E2-in/E3-Mi/E42
E1/e2-ns/E3-Ha/E47
E1/e2-ns/E3-Mi/E410
IIIe1-asE2-in/E3-Ha/E417
e1-as/E2-in/E3-Mi/E49
e1-as/e2-ns/E3-Ha/E41
E1/E2-dl/E3-Ha/E427
MGE allele combinationsNo. of Variety
IIIE1/E2-dl/E3-Mi/E427
E1/E2-in/E3-Ha/E418
E1/E2-in/E3-Mi/E46
E1/e2-ns/E3-Ha/E454
E1/e2-ns/E3-Mi/E434
IVe1-as/E2-in/E3-Ha/E41
e1-as/E2-in/E3-Mi/E41
E1/E2-dl/E3-Ha/E42
E1/E2-in/E3-Ha/E41
E1/E2-in/E3-Mi/E42
E1/e2-ns/E3-Ha/E42
E1/e2-ns/E3-Mi/E41
VE1/E2-in/E3-Ha/E41
MG, maturity group.
Table 2. Analysis of variance of E genes with days to flowering, days to maturity, reproductive period and R/V across all regions and in each region.
All Regions
DFDTF aDTM aRP aR/V a
E1153.50 ***b358.1 ***655.1 **425.71 ***
E2229.24 ***313.6 ***241.6 ***61.17 ***
E3110.87 ***31.3 ***6.0 *c0.29
Loc42144.13 ***227.7 ***86.1 ***58.30 ***
E1 × Loc423.26 ***2.6 ***2.6 ***5.74 ***
E2 × Loc842.78 ***3.1 ***2.0 ***1.85 ***
E3 × Loc420.991.01.00.83
North Region
E11129.62 ***0.3693.39 **181.55 ***
E2210.49 ***2.818.49 **c12.73 ***
E310.031.111.461.46
Loc1139.35 ***55.52 ***52.71 ***57.01 ***
E1 × Loc111.731.131.90*3.49 ***
E2 × Loc221.020.730.801.18
E3 × Loc110.520.900.820.88
Middle Region
E11241.55 ***11.6 ***143.73 **278.22 ***
E2276.05 ***15.1 ***80.19 ***81.46 ***
E310.560.90.010.58
Loc1246.68 ***87.6 ***120.49 ***64.35 ***
E1 × Loc122.84 ***0.91.95 *4.22 ***
E2 × Loc241.252.3 ***1.58 *1.53
E3 × Loc120.320.70.460.52
South Region
E11276.50 ***0.7142.38 ***378.75 ***
E2216.55 ***3.8 *18.70 ***36.51 ***
E3145.46 ***16.0 ***0.9324.33 ***
Loc1110.05 ***80.1 ***43.18 ***7.16 ***
E1 × Loc112.12 *d0.60.913.36 ***
E2 × Loc220.600.60.950.94
E3 × Loc110.660.50.690.57
Northwest Region
E1139.62 ***12.02 ***1.6617.31 ***
E2216.38 ***8.32 ***5.09 **8.78 ***
E310.201.440.910.007
Loc1125.06 ***37.98 ***33.00 ***23.84 ***
E1 × Loc111.320.871.371.46
E2 × Loc221.471.151.64 *1.64 *
E3 × Loc110.646.671.020.62
a DTF, the days to flowering; DTM, days to maturity. RP, the duratiion from R1 to R8. RV, the ratio between reproductive phase to vegetative phase. b *** indicates that it is significant at the 0.001 level; c ** indicates that it is significant at the 0.01 level; d * indicates that it is significant at the 0.05 level; Loc represents the factor of location.
Publisher’s Note: MDPI stays neutral with regard to jurisdictional claims in published maps and institutional affiliations.

