Article

Nitrogen Fertilizer Efficiency Determined by the 15N Dilution Technique in Maize Followed or Not by a Cover Crop in Mediterranean Chile

1
Departamento de Ingeniería y Suelos, Facultad de Ciencias Agronómicas, Universidad de Chile, Santiago 8820808, Chile
2
Programa de Magíster en Manejo de Suelos y Aguas, Facultad de Ciencias Agronómicas, Universidad de Chile, Santiago 8820808, Chile
3
Comisión Chilena de Energía Nuclear, La Reina, Santiago 7600713, Chile
4
Departamento de Suelo y Agua, Estación Experimental de Aula Dei, Consejo Superior de Investigaciones Científicas (EEAD-CSIC), P.O. Box 13034, 50080 Zaragoza, Spain
5
Departamento Producción Agraria, Universidad Politécnica de Madrid & CEIGRAM, 28040 Madrid, Spain
*
Author to whom correspondence should be addressed.
Submission received: 30 June 2021 / Revised: 25 July 2021 / Accepted: 27 July 2021 / Published: 29 July 2021
(This article belongs to the Special Issue Effects of Fertilizer and Irrigation on Crop Production)

Abstract

:
Nitrogen (N) in a maize crop is a determining yield factor, but its negative impact on the environment is also known. Therefore, it is necessary to propose mitigation strategies that allow an improvement in the N fertilizer efficiency (NFE), such as the use of cover crops (CC) and the adjustment of the fertilizer dose. The objective of the study was to determine NFE using 15N isotopic techniques and nitrate (NO3) leaching in a maize–fallow versus a maize–CC rotation with optimal and excessive doses of N in the Mediterranean area of Chile. The treatments were a combination of crop rotation (maize–fallow versus maize–CC of Lolium multiflorum) with the optimal dose of N (250 kg ha−1) or excessive dose (400 kg ha−1). We found that the optimal dose of maize–CC rotation contributed to reducing the losses of N by leaching and improving the NFE. Using the optimal dose decreased the dissolved inorganic N (DIN) emission intensity by 50% compared to the excessive doses. Even if grain yield was higher (19 t ha−1) when applying the excessive N dose, the NFE (28%) was lower than when applying the optimal dose (40%). In the maize–CC rotation with optimal dose, yield was 17 Mg ha−1. The excessive N dose generated higher DIN content at the end of the maize season (177 kg N ha−1). In conclusion, replacing the traditional autumn–winter fallow in the maize monoculture with a CC with optimal N dose contributed to improving NFE and reducing N leaching in a Mediterranean agricultural system. Consequently, it is a strategy to consider as it has positive advantages in soil and N management, helping to reduce diffuse pollution of surface and groundwater bodies.

1. Introduction

Agriculture in the XXI century faces multiple challenges: (i) it must produce more food for a growing population, with less land and labor availability, and incorporate greater efficiency in the use of resources to contribute to the global development of many developing countries, and (ii) it must employ more efficient and sustainable production methods, associated with climate change adaptation and mitigation strategies, increasing the environmental sustainability of agricultural systems [1,2]. Maize (Zea mays L.) is a leading staple crop worldwide, whose production has been controversial in most producing countries, as its high demand for inputs is frequently linked to a high environmental impact [3]. Therefore, it is necessary to develop local production strategies that allow the defining of sustainable intensification of agriculture and minimizing environmental impact through integrated soil–water–nutrient management [4].
In Chile, maize is of great importance in agricultural cropping, covering an approximate area of 74,000 ha, with a production of 955,000 t, and an average yield of 13.3 t ha−1 during the 2018–2019 season [5]. It is the most important crop for small producers, who associate maximum performance with the nitrogen (N) fertilizer application. Therefore, it is common to apply excessive N doses based on maize production guidelines, where it is indicated that for a monoculture of maize with yields between 10 and 20 t ha−1, doses around 400 kg N ha−1 are recommended [6,7].
Indeed, globally more than half of the N added to cropland is lost into the environment, producing negative impacts to air, water, soil, and biodiversity, and generating greenhouse gas emissions such as N oxide (N2O) [8]. A strategy to maintain the production and reduce the environmental damage is to improve N management that requires a proper understanding of the N cycle, which is summarized in three components: demand (absorption), supply (mineralization), and possible N losses, such as nitrate (NO3) leaching, N2O denitrification, and ammonia (NH3) volatilization during the crop cycle [9].
In the maize fields in central Chile, one of the major sources of N losses is the leached NO3, which generates a risk of diffuse N pollution [10,11]. In this context, several authors state that one way to counteract these N losses is by improving the N fertilizer efficiency (NFE), which is a quantitative measure of the actual absorption of the nutrient by the crop, in relation to the amount of nutrient added to the soil as fertilizer [8,12,13]. It is important to note that NFE values in an area show a wide variation that is mainly related to differences in farming systems and management [14].
The 15N microplot research technique has been successfully used to study NFE under different agroecosystems [15]. The N use efficiency determined for cereals using the 15N methodology generally varies between 40 and 65% [16]. For the case of maize, NFE values range from 28 to 52 [17,18]. Recently maize field 15N tracer studies reported regional differences in N use efficiency values in China (33%), North America (42%), and the European Union (54%) [19].
The establishment of cover crops (CC) in replacement of the traditional fallow in annual rotations during the period between crops, has proven to be a valid strategy to increase sustainability in many agricultural systems [12,20,21,22], and has been pointed out as an efficient tool for climate change adaptation and mitigation [23]. Cover crops can improve soil physical properties, and enhance N recycling as they reduce N leaching losses and increase N availability through N mineralization [24]. The CC can help reduce harmful greenhouse gas (GHG) emissions and NO3 water pollution, without affecting the yields of commercial crops [11,25]. Therefore, it can be considered that the introduction of CC such as ryegrass (Lolium sp.) in maize monoculture may increase the potential for soil quality improvement and provide multiple ecosystem services [26,27].
The general goal of this study was to assess the impact of replacing fallow by a cover crop under different N fertilizer doses in an intensive grain maize production system located in the Mediterranean area of Chile. Specific objectives were: (i) to determine NFE using 15N isotopic techniques; (ii) to determine NO3 leaching; and (iii) to determine dissolved inorganic N (DIN) emission intensity.

2. Materials and Methods

2.1. Site Description

The present study was carried out between October 2018 and April 2019 in an experimental site whose soil was subject to the same agricultural management since 2016 (maize–CC rotation). The site belongs to the Faculty of Agronomic Sciences at the University of Chile, located in Santiago (33°34′13″ S 70°38′5″ W), at an altitude of 625 m above sea level.
The climate is semi-arid Mediterranean, which is characterized as a supra-thermal warm temperate type with a semi-arid humidity regime, with maximum temperatures of 30 °C in January and minimum temperatures of 4 °C in June. Annual precipitation is 372 mm and annual potential evapotranspiration reaches 1474 mm, with a dry season lasting 8 months and a wet period of 2 months [28].
The soil is of alluvial origin and belongs to the Santiago Soil Series, a member of the coarse loam family on skeletal, mixed, thermal sand of the Entic Haploxerolls [29]. Table 1 summarizes the physio-chemical properties of the soil at the field experiment. Soil samples were analyzed following Chilean standard methods for soil chemical [30] and physical analyses [31], including: soil pHwater (1:2.5, by potentiometry and pH meter), electrical conductivity (ECe, in soil extract with a conductivity meter), soil organic matter (SOM, by chromic acid wet oxidation), soil texture (Bouyoucos method), bulk density (Db, with cylinder), and soil water retention (−33 and −1500 kPa, with pressure devices) to estimate the available water capacity (AWC) of the soil.
The study included two factors, with two treatments each, with 3 replicates set in plots of 4 m × 2.65 m. The first factor was the crop rotation. The two studied and established crop rotations were: fallow followed by maize, and CC of Lolium multiflorum L. followed by maize. The second factor was the N rate: the treatments consisted of two different rates of inorganic N fertilizer applications: the optimal dose of 250 kg N ha−1; and an excessive rate of 400 kg N ha−1, which is a common practice by farmers in Central Chile [6].
The treatments with maize and fallow (Zm–F) had bare soil during autumn–winter (April–September), while maize was cultivated during spring–summer (October–March). In the treatments with maize and CC (Zm–Lm), CC were growing during autumn–winter (April–September), while maize was cultivated during spring–summer (October–March).

2.2. Experiment Management

In Zm–Lm treatments, all the ryegrass stubble (Lolium multiflorum L., var. Winter Star II, ANASAC) that was previously sown (April 2018) with a dose of seed equivalent to 35 kg ha−1 was incorporated, whereas in the Zm–F treatments a traditional fallow (bare soil) was carried out. The CC was ground under rainfed conditions and without N fertilization during the autumn–winter season. In treatments with maize, Pioneer maize seed 33Y74 was sown at a dose of 9 seeds per linear meter and a distance between rows of 0.7 m in October 2018. Prior to sowing, a manual soil preparation of the plots was carried out at a depth of 10 cm. In all the treatments, the maize stubble from the previous season was incorporated.
The experimental site had an automated drip irrigation system, with emitters of 1.4 L h−1 and frame of emitters of 0.20 × 0.65 m. FullStop Wetting front detectors were installed in the middle of each microplot at a depth of 50 cm. Irrigation began in October 2018, together with the sowing of the maize crop and the application of N fertilizer, and ended in April 2019, at maize physiological maturity (R6). The water applied to the crop with a drip irrigation system was calculated based on the reference evapotranspiration (ET0) and the crop coefficient value (kc) [32], considering an irrigation efficiency of 90%. The ET0 was calculated through the Penman–Monteith equation, using the variables obtained from the meteorological station installed at the study site. Moreover, four simulated irrigation events were performed: a water load of 15 mm day−1 was applied at maize stages V7, V9, VT, and R5 (Figure 1).

2.3. Crop Fertilization

To calculate the optimum N dose, a Stanford’s classic approach was used that included a mass N balance for assessing maize N fertilizer needs by considering N uptake at a specific dry matter yield level and N contributions from non-fertilizer sources [6].
In treatments with an optimum N rate (Zm250–F and Zm250–Lm) the maize crop was fertilized with 250 kg N ha−1 using urea (46% of N) at V8 stage in December 2018; whereas in treatments with an excessive rate of N (Zm400–F and Zm400–Lm) the maize crop was supplied with 150 kg N ha−1 at planting in October 2018 and additionally 250 kg N ha−1 at V8 stage in December 2018 giving a total N dose of 400 kg N ha−1 using urea (46% of N).
In each plot, a microplot (1 m2) was established in which urea enriched to 5% of atoms in excess of 15N was added at 10 cm maize plants [33]. Triple super phosphate (46% of P2O5) and KCl (60% of K2O) were applied in the plot at a rate calculated according to the characteristics of the available P and K on the soil, respectively.

2.4. Plant Analysis

The maize plants in the microplots were harvested at physiological maturity (April 2018), by cutting the plants at ground level. The plants were separated into components (root, stem and leaf, crown and grain), mashed, and dried in an oven at 70 °C. The dry matter (t ha−1) was calculated for each fraction. A subsample of each fraction was ground (<250 µm) to measure the total N (Kjeldahl) [34]. The 15N/14N isotope ratio was determined by optical emission spectrometry (NOI6-e-PC, 15N Analyzer System, Germany) [35]. With the data obtained, the percentage of N derived from the fertilizer (Nddf) was calculated using Equation (1) [36].
Nddf   % = N 15 ep N 15 ef × 100
where N15ep refers to the percentage of excess 15N atoms in the sample of plant material; and N15ef refers to the percentage of excess 15N atoms applied in the marked fertilizer [33].
Thus, N fertilizer efficiency (NFE) was determined using Equation (2):
NFE   ( % ) = Nddf   Np ( Dry   matter ) N   rate × 100
where Np is the percentage of N in the plant material, the dry matter (kg ha−1) of each fraction has been previously determined, and the N rate (kg N ha−1) is the total fertilizer applied in each microplot.
The percentage of N derived from the soil (Ndds) was determined, using Equation (3):
Ndds (%) = 100 − Nddf (%)
To determine the N uptake by the plant, Equations (4) and (5) were used for the N uptake from the fertilizer (Nadf) and soil (Nads).
Nadf   ( kg   ha 1 ) = N - p   ( kg   ha 1 )   ×   Nddf   ( % ) 100
Nads   ( kg   ha 1 ) = N - p   ( kg   ha 1 ) Nadf   kg   ha 1
where N-p is the N (kg ha−1) in each of the plant components. These variables were calculated for each plant component and added up to obtain the total N uptake by the plant.

2.5. Analysis of Residual Nitrogen in the Soil

After the maize harvest, soil samples were collected from the central part of the microplots where the 15N was applied, at 15 cm from where the FullStop was set. The samples were taken in the depth intervals of 0–10, 10–20, 20–30, 30–40, and 40–50 cm, in the same soil profile. The sampling was carried out with an auger and a composite sample of approximately 50 g was collected. They were placed in properly coded boxes and dried for 48h at room temperature (28 °C). Subsequently, subsamples were taken and the total N content was determined [30] to then calculate the residual 15N at each depth and for the maize season between October 2018 and April 2019.
The unrecovered 15N was calculated using the following formula:
15N recovered = 15N uptake (kg ha−1) + 15N soil (kg ha−1)
15N unrecovered = 15N total (kg ha−1) − 15N recovered (kg ha−1)

2.6. Nitrogen Leaching Analysis

The N leaching sampling was determined at four phenological stages of maize: V6, V9, VT, and R5 that corresponded to 47, 92, 122, and 158 days after sowing. It was carried out with a 50 mL syringe with which percolates were sucked from the collection chamber of the FullStop. To have a sufficient volume of N leachate in the microplots, four precipitation events (irrigations) greater than 15 mm were simulated, proceeding to collect leachates after 24 h of irrigation. After collecting the leachates, 30 mL samples were taken for the analysis of total N (NT) and dissolved inorganic N (DIN) to obtain the dissolved fraction of the soil solution. Samples were filtered with 0.45 µm filters. The DIN concentrations were determined by colorimetry, using chromotropic acid (for NO3) and ammonium silicate (for NH4+) methods. In the same leachates, the concentrations of NT and atoms in excess of 15N were measured by optical emission spectrometry.

2.7. Nitrogen Emission Intensity

Emission intensity is a metric variable related to the environmental impact of the agricultural system and its usefulness has been highlighted in several studies [37]. Although in the studies of N2O emissions the N emission intensity is commonly expressed as a function of the N fertilizer application rate, and that N emissions should be a function to productivity due to global demand for agricultural products [38]. Similarly, N losses are considered a form of N emission, since this N is lost from the soil plant system [14]. Therefore, in this study, the DIN emission intensity was determined as a function of maize grain yield using Equation (8):
Emission   intensity   = DIN   ( kg   ha 1 ) Yield   ( t   ha 1 )

2.8. Experimental Design and Statistical Analysis

Two trials were considered in this experiment. Trial 1 corresponded to the analysis of plant and soil samples at the end of the growing season, when the maize reached the harvest point (stage R6) in autumn 2019, with the factors being the crop rotation and N rate. Therefore, the response variable for Trial 1 was obtained using the following mixed linear model (MLM):
Yijk = μ+ Ri + Nj + (RN)ij + βil + εijk
where:
Y = response variable; μ = mean; R = crop rotation factor; N = N rate factor; RN = interaction crop rotation and N rate; β = block effect; ε = experimental error, which is assumed to be normally distributed.
For the analysis of the residual N variable on the soil, the same MLM applied in Trial 1 was used.
Trial 2 corresponded to the N leaching measurements, after each rain or irrigation event between October 2018 and April 2019. The statistical design used consisted of completely randomized blocks with a divided plot structure. Factors included crop rotation, N dose, and time. The response variable for Trial 2 was obtained using the following MLM:
Yijk = μ+ Ri + Nj + Tk + (RN)ij + (RT)ik + (NT)jk + (RNT) ijk + βil + Pi(1)+ εijkl
where:
Y = response variable; μ = mean; R = crop rotation factor; N = N rate factor; T = time factor; RN = interaction crop rotation and N rate; RT = interaction crop rotation and time; NT = interaction N rate and time; RNT = interaction crop rotation, N rate and time; B = block effect; p = plot effect; ε = experimental error, which is assumed to be normally distributed.
The data were analyzed using MLM, performing Fisher’s multiple comparison test (α = 0.05). For this, statistically significant differences were considered, for the interaction of the factors or for the factors independently.

3. Results

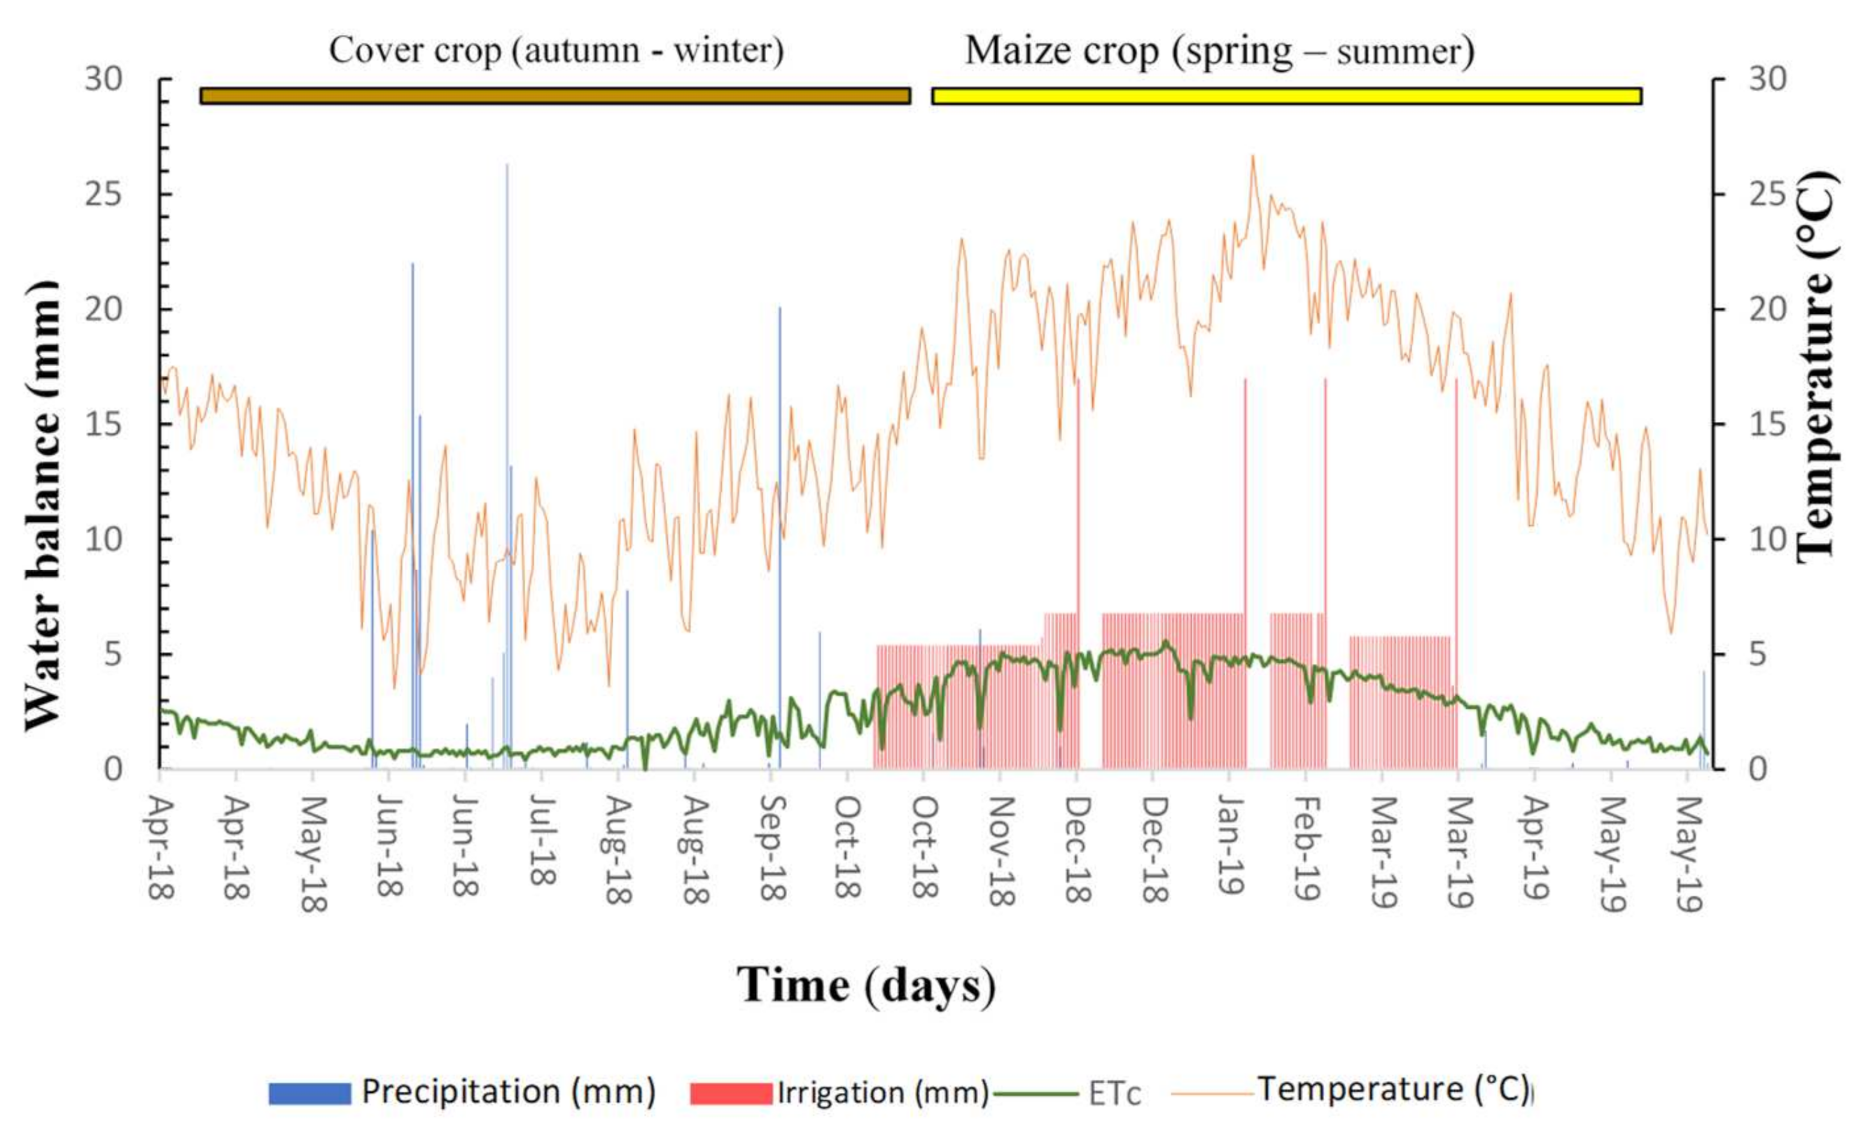
3.1. Environmental Measurements and Irrigation

Precipitation during the experimental period was 225 mm, being 85% of the precipitation collected during the autumn–winter (Figure 1). The highest precipitation event occurred in winter and was 26.3 mm. The temperature followed a Mediterranean pattern, with minimum values of 5 °C in winter and maximum 25 °C in summer. The crop evapotranspiration was higher during the period of growth and development of the maize crop (5 mm day−1) than during the cover crop period (1 mm day−1).

3.2. Yield, Biomass, and Total N

At the maize harvest, a significant interaction between the crop rotation and N rate factors (p < 0.02) was observed for the grain yield (Table 2). The treatments that received excessive N rates (Zm400–F and Zm400–Lm) obtained higher yields, without significant differences between them. Meanwhile, the maize–CC treatment with an optimal N rate (Zm250–Lm) obtained a higher yield than that obtained with the Zm250–F rotation.
For the case of aboveground dry biomass and N content (both in the grain fraction and in the aboveground), only the N rate factor was significant (p < 0.01), being the treatments with excessive N rates and those that had higher values than those with an optimal N dose (Table 2).
Root biomass presented a significant interaction (p < 0.03) between crop rotation and N dose factors (Table 2). Although Zm250–Lm treatment showed a greater amount of accumulated biomass at the end of the maize season compared to the other treatments, statistically significant differences were only observed with Zm250–F.

3.3. Nitrogen Uptake from Fertilizer (Nadf) and Soil (Nads)

When analyzing the Nadf for the grain fraction, a significant interaction (p < 0.04) was observed between the crop rotation factor and N rate (Table 3). Thus, the Zm250–F treatment uptakes the least amount of Nddf compared to the other treatments. Additionally, for the aboveground biomass, only the N rate factor was significant (p < 0.02). The treatments with N rates of 400 kg N ha−1 application had a higher uptake of Nddf compared to the optimal N rate.
Regarding Nads, the impact of the N rate factor was significant for both aboveground and grain (Table 3). In treatments with excessive N rates, the maize crop took up greater amounts of Nads, whereas no significant differences were observed for the root fraction.
For the case of Nadf and total Nads for the aboveground biomass, it was observed that only the N rate factor was significant (p < 0.05). In addition, for the Nads, the treatments with high N rates uptake greater amounts from the soil. Similarly, those associated with a maize–fallow crop rotation.

3.4. Nitrogen Fertilizer Efficiency

For the NFE in the grain fraction, a significant interaction (p < 0.012) was observed between the crop rotation and N rate factors (Table 4). The rotation including a CC and fertilized with the optimal N rate showed a higher NFE than the other treatments and was followed by the treatment with the optimal N rate (Zm250–F). Furthermore, the treatments with excessive N rates had lower NFE values, without differences between the crop rotation treatments (Table 5).
For the root fraction, only the N rate factor was significant (p < 0.05). The treatments with rates of 250 kg N ha−1 had higher NFE compared to those with excessive N rates. For the NFE of the total crop obtained in the maize season, a significant interaction was observed between the factors under study (Table 5).
The treatments with an optimal N rate showed the lowest total N uptake from fertilizer and soil (Figure 2A). However, in relation to the crop rotation factor these treatments had the highest total accumulated NFE (Figure 2B).

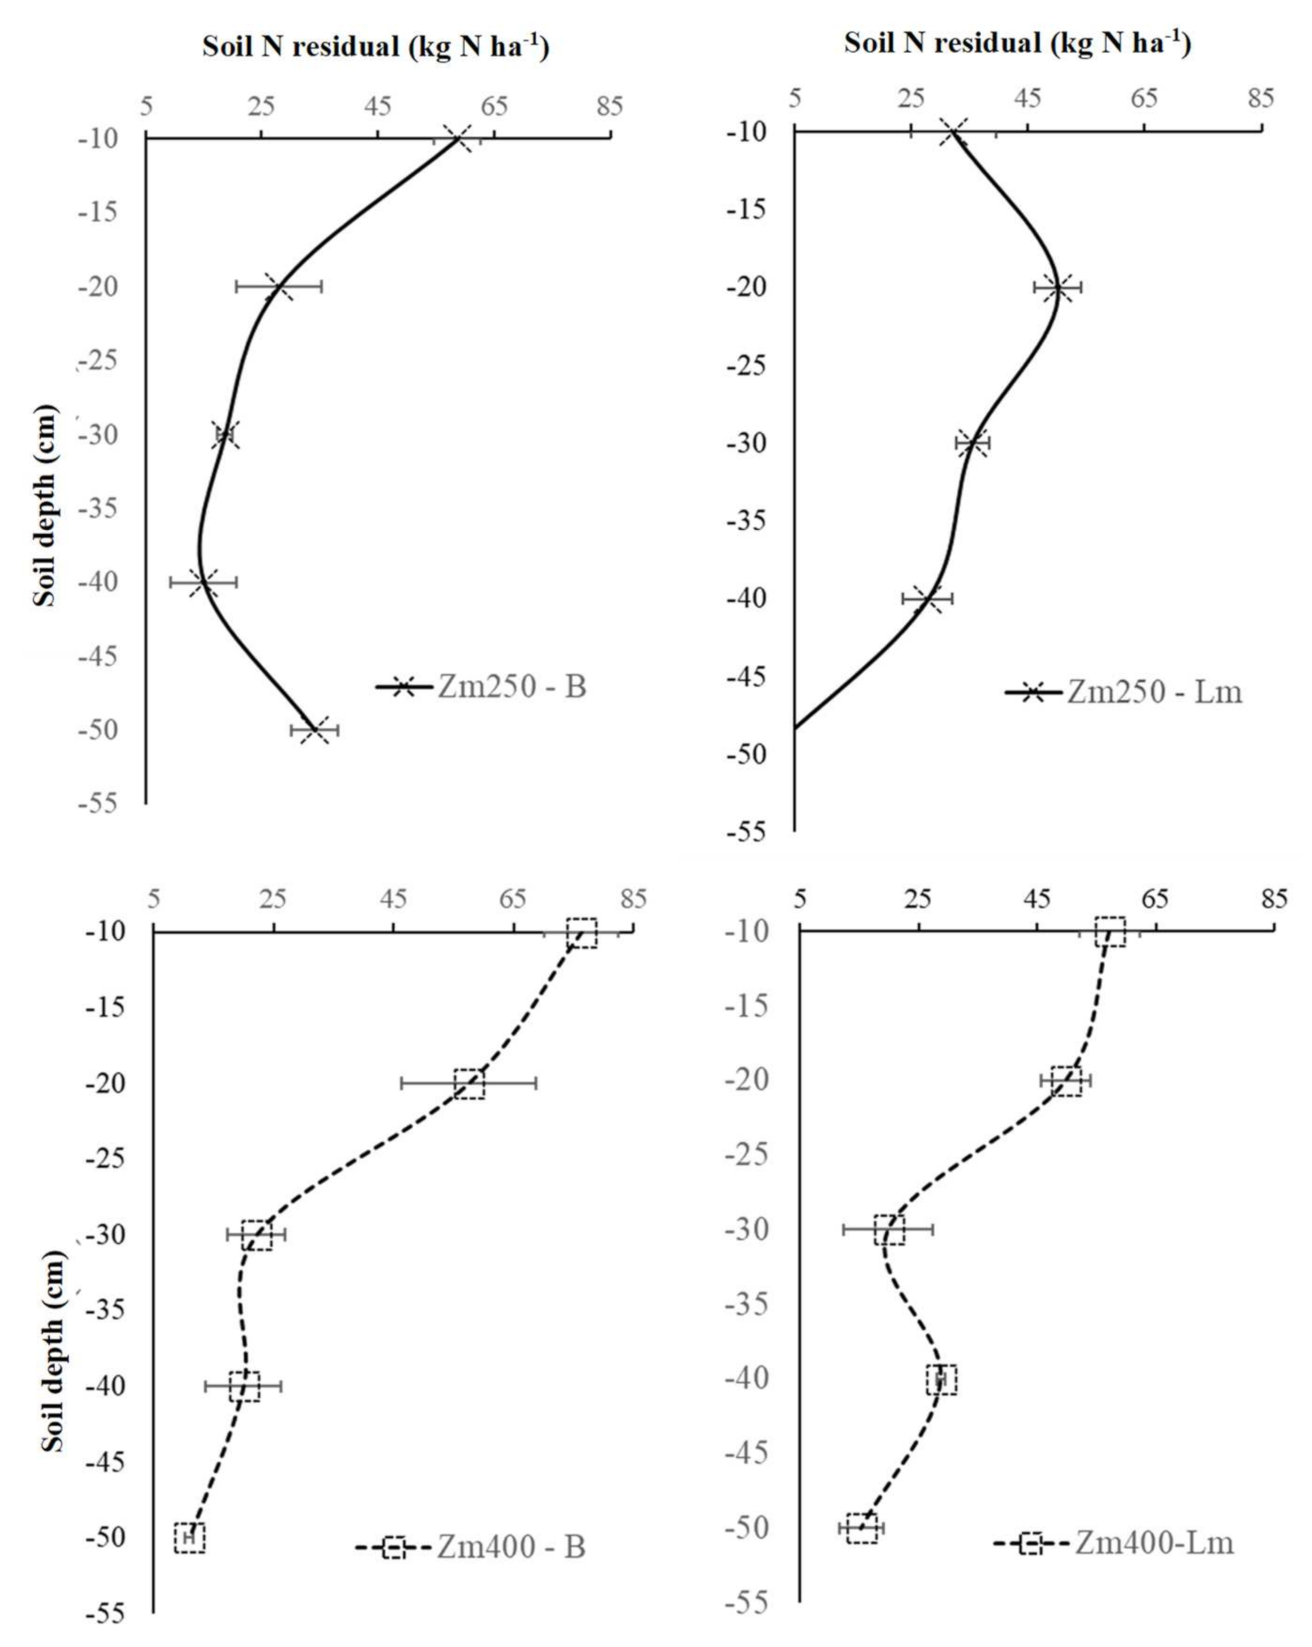
3.5. Residual N on the Soil, Recovered and Uncovered by the Crop

When analyzing the destination of the 15N fertilizer after the maize harvest, it was observed that the N rate factor was statistically significant for Nadf, Nads, and NT (Table 6). Figure 3 shows the destination of the 15N of the fertilizer at the end of the maize growing season. In the treatments with an excessive N rate, the N unrecovered was 113 kg N ha−1, whereas with optimal N rates, the values were significantly lower (12 kg N ha−1). Therefore, this unrecovered N expressed the losses of fertilizer N during the maize growing season.
When analyzing the residual N in the soil at the five depth intervals, it was observed that the highest amount of N was present in the upper soil layer (0–10 cm), except for treatment Zm250–Lm (Figure 4).

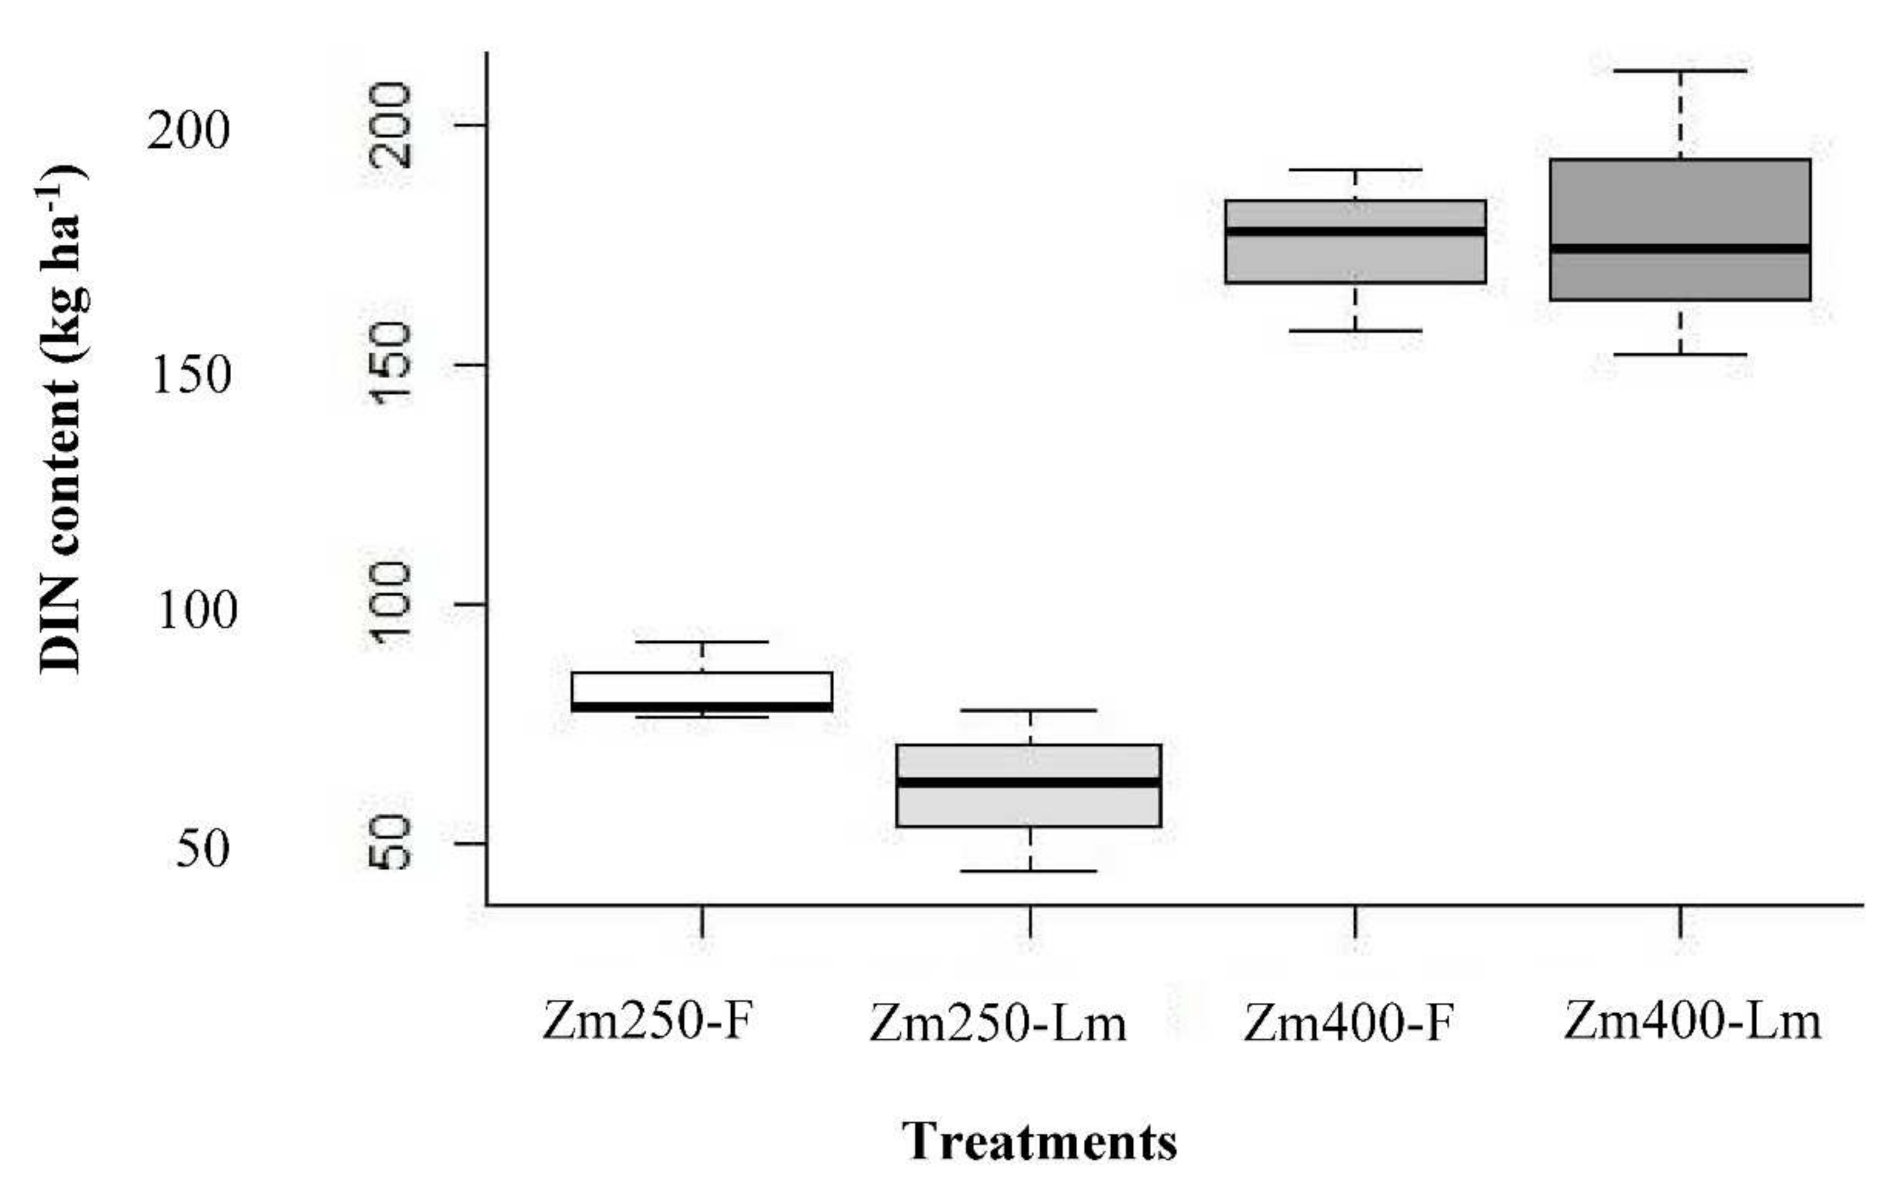
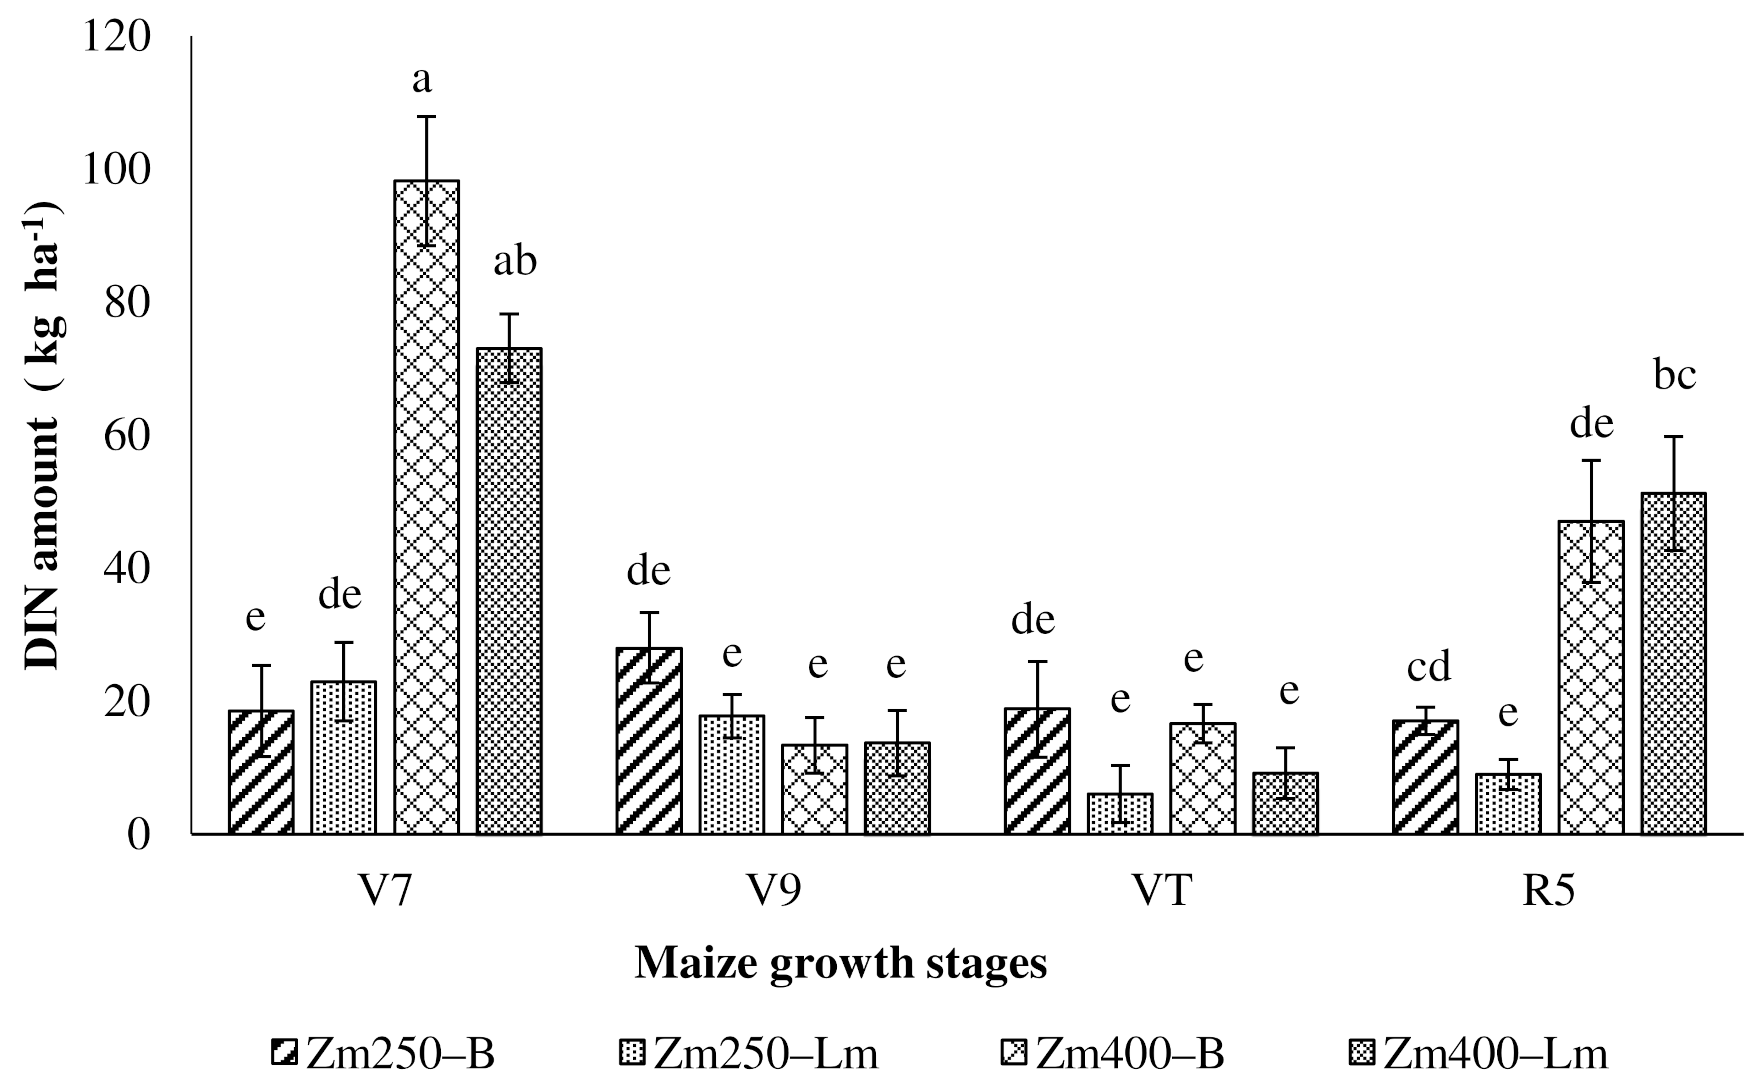
3.6. Dissolved Inorganic Nitrogen Leaching

On the one hand, at the end of the maize growing season, the treatments with excessive N rates presented the highest amounts of DIN (177 kg N ha−1), significantly higher than the treatments that received the optimal N rate (72 kg N ha−1) (Figure 5). On the other hand, when analyzing at each sampling date, significant differences were observed for the interaction between the factors time and N rate (p < 0.001). Therefore, it was decided to analyze the N rate plus the effect of crop rotation as a single factor (treatment) and time as a second factor.
For the NO3 present in the leachate during the maize crop season, a significant interaction (p < 0.002) between the treatment and time factors was observed, whereas for the NH4+, the factors were significant separately (Table 7). Regarding the DIN amount, a strong interaction between the treatment and time factors (p < 0.005) was observed (Table 7, Figure 6).
The treatments with excessive doses of N reported the highest amounts of DIN, standing out in the stages V7 and R5 (Figure 6). Instead, the treatments with optimal N doses showed the lowest amounts of DIN during the study period. At V7 stage (time 1), the Zm400–F treatment presented the highest amount of DIN (95 kg N ha−1), significantly greater than the treatments with the optimal N rate (Zm250–F and Zm250–Lm). At V9 and VT, the losses due to N leaching decreased considerably, particularly those of the treatments with the excessive N rate, but they increase again at R5 exceeding 47 kg N ha−1. The Zm250–Lm treatment showed DIN values ranging from 6 to 23 kg N ha−1 at the different phenological stages, with the lowest DIN losses during the maize growing season.

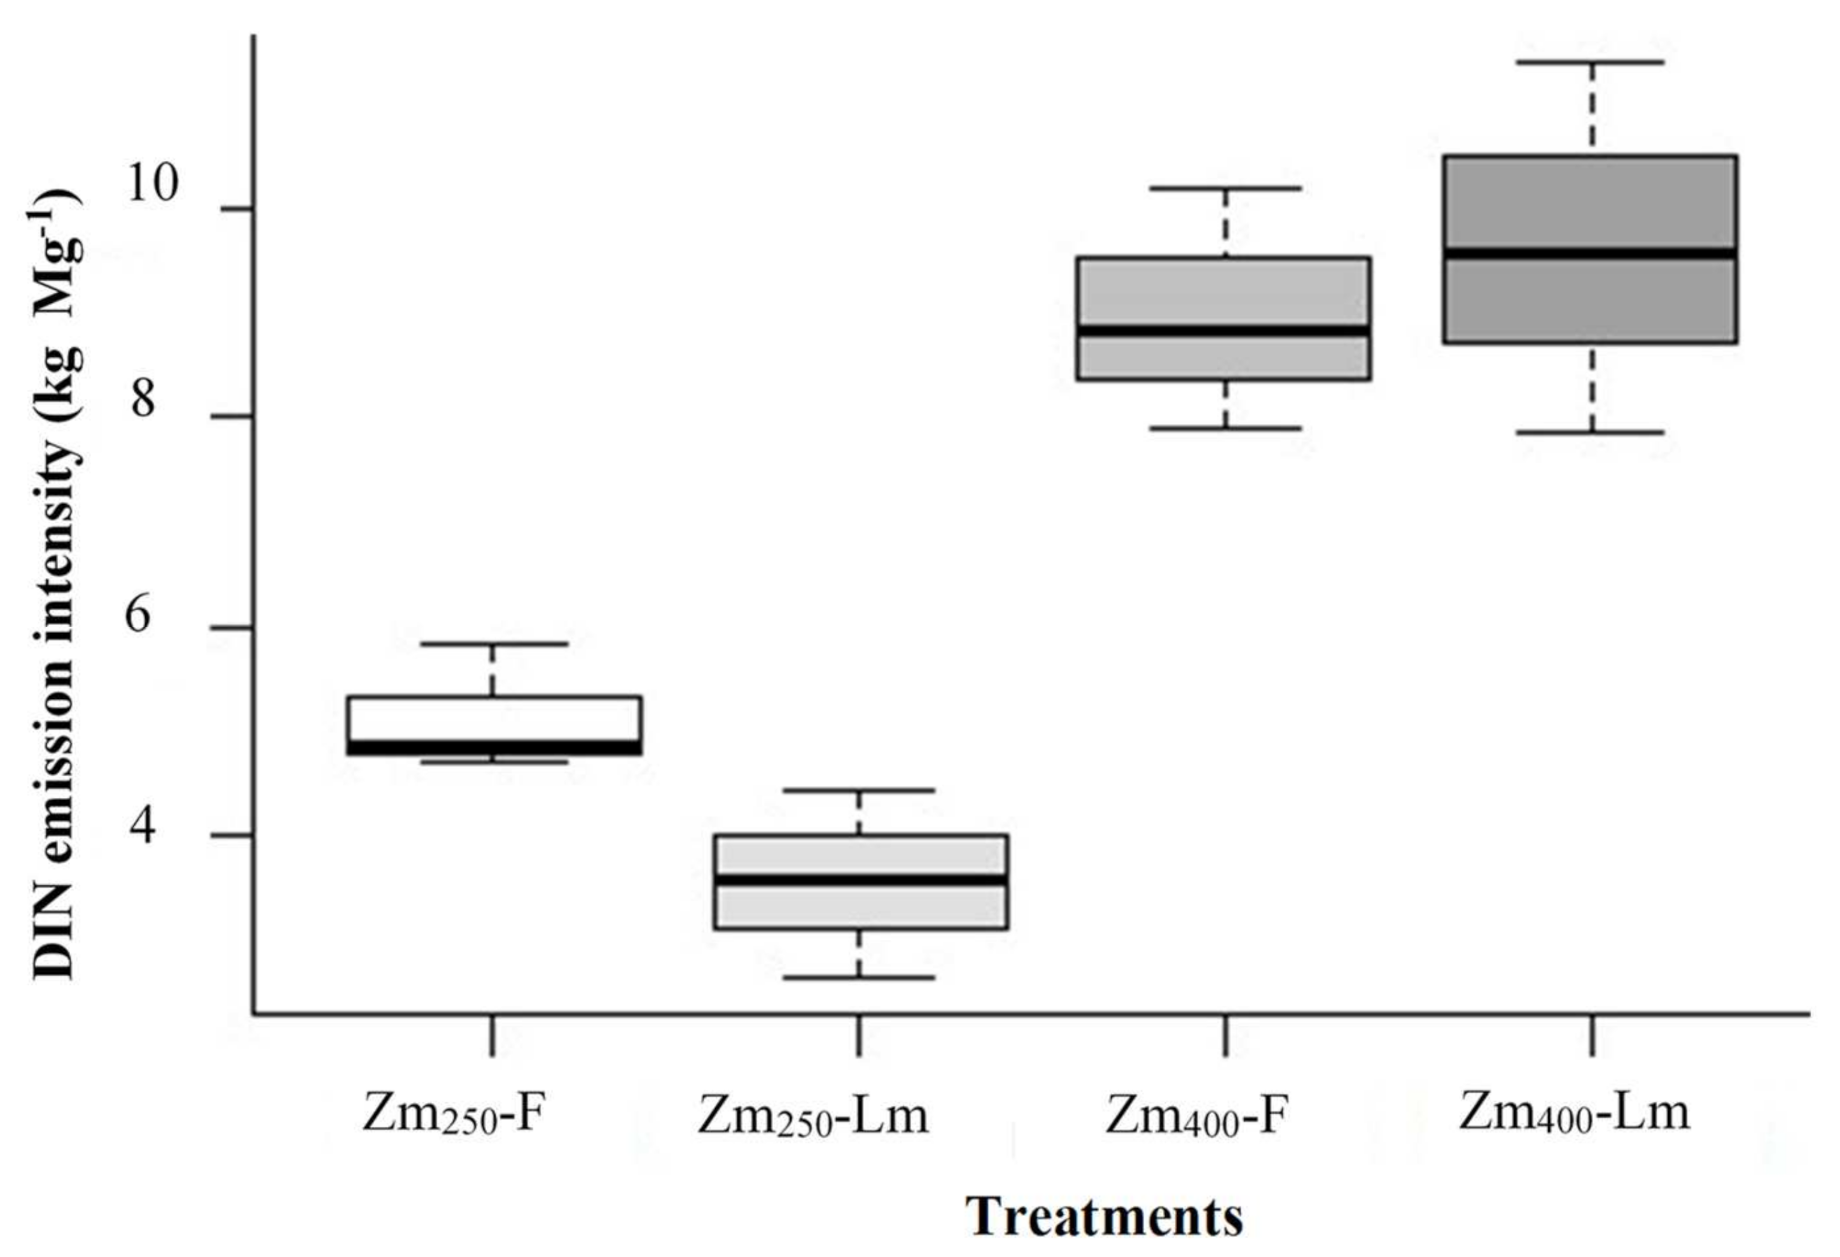
3.7. Dissolved Inorganic N Emission Intensity

For the dissolved inorganic N emission intensity, it was observed that the N rate factor was significant (p < 0.0001). Treatments with high N doses (400 kg N ha−1), regardless of crop rotation, showed a higher emission intensity (9 kg of N ha−1) for each ton of maize produced. When the optimal N rates were applied, a lower intensity was observed per ton of maize grain produced. However, it is important to highlight the treatment of the optimal N rate combined with a CC–maize rotation, which had the lowest emission intensity with <4 kg N ha−1 per ton of maize produced (Figure 7).

3.8. Discussion

The treatment with optimal N dose (250 kg N ha−1) combined with a rotation of maize–CC (ryegrass) had the highest NFE. This increase in NFE is relevant and could be directly associated with the implementation of CC in the autumn–winter season during three seasons of crop rotation. The CC contributed to the N recycling and reduced the N losses by N leaching, increasing the N content in the soil that was taken up by the maize crop [39]. However, it is relevant to consider the contribution of N due to the mineralization of maize stubble [40]. Moreover, when the CC residues and maize stubble are incorporated into the soil, an increase in the N mineralization rate is expected due to soil aeration that enhances favorable conditions for microbial activity [41]. Therefore, when calculating the contribution of N by maize stubble, considering a harvest index (IC = 0.48) and a yield of 15 t ha−1 in the previous season (2017/2018), it was determined an addition of N of 50 kg ha−1, which is around 20% of the N inputs in the production systems studied. Therefore, this amount of N was sufficient to supply the initial demand for maize. Likewise, soil aeration facilitated greater root development, which is inferred by the value of the root biomass of maize (5.02 ± 0.82 t ha−1). This result could explain the higher N assimilation by the treatments that received the optimal N dose at V8. Consequently, the NFE increases and competitive yields could be maintained [42].
Comparing the present study with a similar one using 15N isotopic techniques in a dry Mediterranean climate in Chile, where a dose of 390 kg N ha−1 was applied, similarities were observed in the yield of the maize grain when excessive N rates were applied [43]. These yields were high according to those indicated for the hybrid maize used in this experiment. It is evident that when applying higher N doses an increase in yield is generated, but this increase was not too different when it is compared to the optimal rate in which a ryegrass CC was included in the rotation (17 t ha−1). These yields are reasonable due to the temperature and solar radiation conditions of central Chile. However, N management should be considered, especially when it is associated with CC and the incorporation of residues (maize stalk and rye straw), which, supplemented with an optimal N rate, could help improve the N uptake and with this, they improve maize yields and generate environmental benefits [44,45]. This is important considering that about 26% of the total cost of maize production is associated with fertilizer [5]. In this study, it was observed that around 60% of the Nadf was accumulated in the grain, with values ranging from 50 to 65 kg N ha−1, which are consistent with other studies [46]. This is due to the N accumulated in the plant parts after the R1 stage is remobilized towards the grains. In addition, the amount of N uptake in post-flowering is determined by the development of the grain [46]. It is important to note that to obtain high yields of maize grain, the farmers must have high NFE and adequate irrigation management to avoid losses due to N leaching and thus reduce the risk of NO3 contamination of groundwater, particularly in Mediterranean climates [47,48].
At the end of the maize season, it was observed that in the two agricultural systems under study, regardless of the amount of N applied, the N uptake by the maize during the periods of growth and grain development varied between 370 and 433 kg N ha−1 (Table 8). These values were high since the maize crop accumulated smaller amounts in its biomass (from 150 to 300 kg N ha−1) when there were grain yields between 14 and 16 t ha−1. However, these high amounts of N uptake were consistent with the grain and biomass yields reported due to the relationship of N with performance up to a certain threshold [46].
The amounts of N uptake from the soil of 285 and 329 kg N ha−1 for the treatments with optimal and excessive N doses, respectively, were very high (Table 8). The soil contributed a greater amount of N throughout the maize season and the N uptake from the fertilizer was presented in a lesser quantity as a result of the immobilization and/or N leaching.
These amounts of Nads could be related to the contribution of N from maize stubble and straw from CC, due to the high mineralization rate that occurs in neutral–alkaline soils and Mediterranean climates, as is the case in our study. Likewise, the effect of soil management practices is added, such as manual tillage, where stubble burning was not carried out, which according to several authors increases soil fertility due to N recycling [49,50]. In contrast, in a study carried out in a volcanic soil (Typic Melanoxerand) with a 4-year rotation of maize–wheat crops, the authors concluded that maize residues did not constitute an important source of N for the following crops, where extra addition of C did not lead to a higher retention of N in the system [51]. In our study, it was observed that when high doses of N (400 kg ha−1) were applied, the maize absorbed 107 kg N ha−1 from the fertilizer, whereas if the optimal N dose was applied, the maize absorbed 88 kg N ha−1 (Table 8). Although the absorption of fertilizer N is low, this was due to the high concentrations of residual N in the soil (0.17–0.20%), a product of the agricultural management of the plots since spring 2016. On the other hand, we must consider the N of the maize stubble, that can make a contribution of between 50 and 55 kg N ha−1. For this reason, it is clear that the soil N residual and the N addition of the maize stubble supplied the initial demand of the maize crop [46,52].
The results obtained on the N uptake by the maize, regardless of whether they come from the source of the N fertilizer or soil, suggest that the N uptake was related to the N application time and rate, since when applying 250 kg N ha−1 in the V8 phase, a greater accumulation of Nadf was observed.
In this study, higher NFE was expected considering the management of the maize crop, irrigation, and climatic conditions. However, the efficiencies obtained were low (range 27–38%) compared to other similar studies using 15N isotopic techniques, where efficiencies of a range between 40 and 65% are attributed for cereals [16]. However, the obtained values were consistent with those observed in a maize–fallow rotation under furrow irrigation management in Mediterranean central Chile [43]. The NFE obtained for the treatments with excessive doses of N (400 kg N ha−1), regardless of the crop rotation, had a lower NFE of 27%. However, when optimal N doses were combined with a maize–fallow rotation, the NFE was 33%. Therefore, the N optimal dose should be applied in the times of greatest demand of the crop to contribute to increasing the NFE [53].
As mentioned, this low NFE could also be influenced by the soil type and crop management, such as the incorporation of maize stubble, tillage, and doses of N from previous years [54]. The influence of the high soil pH (pH = 8.99) must also be highlighted, which could have been a limiting factor in the N uptake from the fertilizer and therefore could reduce the NFE, since the optimum pH for the N uptake by the crop is in a range of 6 to 7 [6]. Irrigation management should be also considered, when the higher N efficiency in maize cultivation is associated to irrigation systems with high water use efficiency [55]. Clearly, in a furrow irrigation system, a temporary water deficit is caused, and greater N losses are found by leaching and denitrification that reduces NFE [11]. In this study, irrigation was carried out using drip irrigation and adjusted to the needs of the crop. However, irrigation simulations were performed using the same irrigation volume applied by Chilean farmers (Figure 1). After these simulations, it was observed that the greatest N losses were generated by leaching and were directly related to the treatments that received high N doses. It is important to consider irrigation as part of the results, because under furrow irrigation systems most farmers apply irrigation amounts greater than 10,000 m3 per maize season [6,7]. This common practice is essential when analyzing NFE in monoculture agricultural systems, which is consistent with the fact that low NFE is directly related to poor irrigation management [55].
The NFE was higher in the treatments with 250 kg N ha−1 compared to those that received 400 kg N ha−1. This effect could be due to the time of application of N that was carried out at the vegetative stage (V8), since at the first stages, the N from the soil supplies the initial demands of maize and the highest N uptake occurs between stages V3 and flowering. For this reason, several authors recommended that the application of N at sowing should be minimal or null [46,56]. Therefore, the 150 kg N ha−1 applied at sowing are not largely taken up by the plant but could be lost from the soil–plant system to a large extent by N leaching. When analyzing the residual 15N at 50 cm soil depth (Figure 4), it was observed that in the treatments where high N doses were applied (400 kg N ha−1), an average of 123 kg N ha−1 was lost, which suggests N losses due to N leaching.
Therefore, when performing the simulation of rain events in spring 2018 (greater than 15 mm day−1), the amount of N obtained in stage V7 was the sum of the N applied in sowing, the residual N of the accumulated soil from previous seasons, and N from the mineralization of incorporated maize stubble. In summary, the high amounts of DIN close to 177 kg N ha−1 obtained throughout the season could be related to the low evapotranspiration that occurs in the first stages of the crop, in which the soil is more exposed and greater percolation, where the highest deep percolation occurred in bare soils in the autumn–winter season [57]. The treatments with excessive N doses lost more N by leaching, with NO3 being the most common form (58%) in line with the usual practice of farmers in Chile [6]. In the same way, this information allows us to infer that these losses due to N leaching are directly related to the low NFE of the maize crop and to the practices of agricultural soil and irrigation [58].
Additionally, it is evident that the DIN contents in the V9 and VT stages were the lowest of the season. However, during the maize crop season DIN losses increased again, especially in treatments with excessive doses of N, even exceeding 47 kg N ha−1. This is directly related to maize phenology, when the crop enters senescence and the requirements of nutrients and water are low and only the remobilization of nutrients occurs [46,56].
Considering the results obtained from NO3 and NH4+ soil measurements, it is suggested that the amount of DIN in the soil was related to irrigation management. The initial irrigations were abundant and caused N losses due to leaching of the DIN accumulated on the soil. Similarly, this has also been reported in a study that evaluated the efficiency of fertilizer N with urea labeled at 5% of atoms in excess of 15N in coffee cultivation under tropical climate conditions in Brazil [59]. In another study under Mediterranean climate conditions, it was found that 80% of the N leaching during a drip-irrigated tomato crop occurred during the 4 weeks after planting, due to excessive irrigation and a low demand for water and N by the crop seedlings [58]. However, the installation of CC in winter reduced N leaching when the reference NO3 loads were high in well-drained soils and/or when the availability of residual and mineralized N was high due to the agricultural practices of the crop. In summary, with the N rate applied at sowing (150 kg ha−1), as done by farmers in Chile, 75 to 95 kg N ha−1 could be lost due to NO3 leaching, which is enhanced if large volumes of water are applied by furrow irrigation.
The treatment with the optimal N rate (250 kg N ha−1) combined with a CC rotation management (ryegrass) improved N use in cropping systems (Figure 8A). When performing the balance of all the 15N applied, the crop uptakes 88 kg N ha−1, 150 kg N ha−1 remained in the soil, and only 12 kg N ha−1 was reported as N loss. The introduction of CC recycled the N by retaining soil N, diminishing losses and later releasing nutrients to the following maize [60]. In summary, the implementation of CC (ryegrass) in the autumn–winter season compared to a traditional maize monoculture with an optimal N rate, contributes to improving N management since it helps to improve NFE by reducing the processes of N leaching in Mediterranean agricultural systems [61].
When analyzing the general balance of 15N in the maize–fallow crop system with excessive N rate applied (Figure 8B), it was observed a crop N uptake of 108 kg N ha−1, whereas in the soil remained 178 N ha−1 and the N not recovered was 113 kg N ha−1. This amount of unrecovered N can be attributed to N losses due to leaching, denitrification, and volatilization. In this study, an attempt was made to measure the excess of 15N atoms in the leachates, but this was not achieved due to the difficulty of making the determination in the liquid samples. Consequently, the amount of 15N lost through leaching was not calculated. However, considering the high amounts of DIN in the leachates (177 kg N ha−1) during the maize season, it is suggested that most of the 15N may have been lost by NO3 leaching. In general, it is estimated that volatilization does not exceed the range of between 5 and 6.5% of total N losses [62]. In addition, the applications of N were covered at the time of sowing and hilling the maize, so this form of N loss turns out to be not significant at the time of making the 15N balance. On the other hand, the nitrification and denitrification processes, although they are mainly responsible for the emission of nitrous oxide (N2O) in cereal crops, in this test could have low values, due to soil physical and hydraulic conditions (well-drained soils), added to the conditions of a Mediterranean climate [62,63]. In consequence, when excessive N rates are applied in relation to the crop demand, the N losses due to leaching are high and the NFE low, and therefore the risk of N contamination of surface and groundwater increases.
The study evidenced the need to continue researching the N fertilization management strategies, which contribute to improve NFE and reduce the negative impacts of NO3 leaching. For instance, strategies such as the use of urease inhibitors (N- (n-butyl) thiophosphoric triamide (nBTPT)) or the use of zeolites that, due to their high cation exchange capacity, favor the retention of cations such as NH4+ [64]. However, in this study, we observed that the highest NFE and N losses were related to the time of fertilizer application, irrigation management, and the added application of excessive doses of N. For this reason, it is necessary to adapt fertilization management under 4R fertilization strategies, which implies fertilizing considering the correct source, dose, time, and place [52]. In addition to the fertilizer management strategies, CC and irrigation management should be included [12].

4. Conclusions

Replacing the traditional fall–winter fallow in maize monoculture with a cover crop (Lolium multiflorum) with an optimal N rate contributed to improve NFE and reduce N leaching in a Mediterranean agricultural system. Therefore, it is a strategy to consider as it helped to reduce N diffuse contamination processes in surface and groundwater.
The highest N uptake derived from the fertilizer was evidenced in the treatments with excessive N rates. However, the highest amount of accumulated N was provided by the soil, regardless of the N rate and the crop rotation system.
Although the results coming from the application of 15N-labeled fertilizer showed that the excessive N rate increased the maize grain yield, the NFE decreased up to 28%, with no statistical differences between the crop rotation treatments. Meanwhile, by using the optimal N dose of 250 kg N ha−1 in a maize–cover crop rotation (ryegrass), a 40% of NFE was achieved.
The highest N leaching losses occurred in the treatments with excessive N rates, particularly in the maize–fallow crop rotation system in which 150 kg N ha−1 were applied at sowing. By replacing the fallow by a cover crop during the winter season, accompanied by optimal N rates, the intensity of emission of inorganic N dissolved in leachates was reduced by half with respect to the excessive N rate.

Author Contributions

Conceptualization: O.S. and A.N.; methodology: O.S., R.D., X.V. and A.N.; formal analysis: A.N., X.V. and R.D.; investigation: O.S., A.N., X.V. and R.D.; writing: O.S., A.N., M.A.-A. and M.Q.; supervision: O.S., A.N., M.A.-A. and M.Q. All authors have read and agreed to the published version of the manuscript.

Funding

This research was funded by the International Atomic Energy Agency (IAEA), project: Enhancing Livelihood through Improving Water Use Efficiency Associated with Adaptation Strategies and Climate Change Mitigation in Agriculture (ARCAL CLVIII) grant no. RLA5077. This research was partially funded by FONDECYT Regular 2020 grant no. 1201497 and Comunidad de Madrid, Spain under Grant AGRISOST-CM S2018/BAA-4330 and European Structural Funds.

Institutional Review Board Statement

Not applicable.

Informed Consent Statement

Not applicable.

Data Availability Statement

Not applicable.

Acknowledgments

This study was supported by the Master Program in Soil and Water Management at the University of Chile, in cooperation with the Chilean Agency of Atomic Energy and the Polytechnic University of Madrid.

Conflicts of Interest

The authors declare no conflict of interest.

References

  1. FAO. The Future of Food and Agriculture: Trends and Challenges; FAO: Rome, Italy, 2014. [Google Scholar]
  2. Salazar, O.; Rojas, C.; Baginsky, C.; Boza, S.; Lankin, G.; Muñoz-Sáez, A.; Pérez-Quezada, J.F.; Pertuzé, R.; Renwick, L.L.; Székács, A.; et al. Challenges for agroecology development for the building of sustainable agri-food systems. Int. J. Agric. Nat. Resour. 2020, 47, 152–158. [Google Scholar] [CrossRef]
  3. FAO. Save and Grow in Practice: Maize, Rice and Wheat. A Guide to Sustainable; FAO: Rome, Italy, 2016. [Google Scholar]
  4. Struik, P.C.; Kuyper, T.W. Sustainable intensification in agriculture: The richer shade of green. A review. Agron. Sustain. Dev. 2017, 37, 39. [Google Scholar] [CrossRef]
  5. ODEPA. Boletín de Cereales; ODEPA: Santiago, Chile, 2021. [Google Scholar]
  6. Najera, F.; Tapia, Y.; Baginsky, C.; Figueroa, V.; Cabeza, R.; Salazar, O. Evaluation of soil fertility and fertilisation practices for irrigated maize (Zea mays L.) under Mediterranean conditions in Central Chile. J. Soil Sci. Plant Nutr. 2015, 15, 84–97. [Google Scholar] [CrossRef] [Green Version]
  7. Salazar, O.; Balboa, L.; Peralta, K.; Rossi, M.; Casanova, M.; Tapia, Y.; Singh, R.; Quemada, M. Effect of cover crops on leaching of dissolved organic nitrogen and carbon in a maize-cover crop rotation in Mediterranean Central Chile. Agric. Water Manag. 2019, 212, 399–406. [Google Scholar] [CrossRef]
  8. Lassaletta, L.; Billen, G.; Grizzetti, B.; Anglade, J.; Garnier, J. 50 year trends in nitrogen use efficiency of world cropping systems: The relationship between yield and nitrogen input to cropland. Environ. Res. Lett. 2014, 9, 105011. [Google Scholar] [CrossRef]
  9. Mahmud, K.; Panday, D.; Mergoum, A.; Missaoui, A. Nitrogen Losses and Potential Mitigation Strategies for a Sustainable Agroecosystem. Sustainability 2021, 13, 2400. [Google Scholar] [CrossRef]
  10. Salazar, O.; Fuentes, I.; Seguel, O.; Nájera, F.; Casanova, M. Assessment of Nitrogen and Phosphorus Pathways at the Profile of Over-fertilised Alluvial Soils. Implications for Best Management Practices. Water. Air. Soil Pollut. 2018, 229, 223. [Google Scholar] [CrossRef]
  11. Salazar, O.; Nájera, F.; Tapia, W.; Casanova, M. Evaluation of the DAISY model for predicting nitrogen leaching in coarse-textured soils cropped with maize in the Mediterranean zone of Chile. Agric. Water Manag. 2017, 182, 77–86. [Google Scholar] [CrossRef]
  12. Gabriel, J.; Alonso-Ayuso, M.; Gonzalez, I.G.; Hontoria, C.; Quemada, M. Nitrogen use efficiency and fertiliser fate in a long-term experiment with winter cover crops. Eur. J. Agron. 2016, 79, 14–22. [Google Scholar] [CrossRef] [Green Version]
  13. Zhang, C.; Rees, R.M.; Ju, X. Cropping system design can improve nitrogen use efficiency in intensively managed agriculture. Environ. Pollut. 2021, 280, 116967. [Google Scholar] [CrossRef]
  14. Quemada, M.; Lassaletta, L.; Jensen, L.; Godinot, O.; Brentrup, F.; Buckley, C.; Foray, S.; Hvid, S.; Oenema, J.; Richards, K.; et al. Exploring nitrogen indicators of farm performance among farm types across several European case studies. Agric. Syst. 2020, 177, 102689. [Google Scholar] [CrossRef]
  15. Follett, R.F. Innovative15n microplot research techniques to study nitrogen use efficiency under different ecosystems. Commun. Soil Sci. Plant Anal. 2001, 32, 951–979. [Google Scholar] [CrossRef] [Green Version]
  16. Ladha, J.K. Contributions of Fertilizer Nitrogen in Global Cereal Production, Soil Organic Matter Status and Nitrogen Balance. In International Symposium on Managing Soils for Food Security and Climate Change Adaptation and Mitigation; FAO—IAEA: Rome, Italy, 2014; pp. 21–25. [Google Scholar]
  17. Quan, Z.; Li, S.; Zhang, X.; Zhu, F.; Li, P.; Sheng, R.; Chen, X.; Zhang, L.-M.; He, J.-Z.; Wei, W.; et al. Fertilizer nitrogen use efficiency and fates in maize cropping systems across China: Field 15N tracer studies. Soil Tillage Res. 2020, 197, 104498. [Google Scholar] [CrossRef]
  18. Grahmann, K.; Dittert, K.; Verhulst, N.; Govaerts, B.; Buerkert, A. 15 N Fertilizer recovery in different tillage–straw systems on a Vertisol in north-west Mexico. Soil Use Manag. 2019, 35, 482–491. [Google Scholar] [CrossRef]
  19. Quan, Z.; Zhang, X.; Davidson, E.A.; Zhu, F.; Li, S.; Zhao, X.; Chen, X.; Zhang, L.; He, J.; Wei, W.; et al. Fates and Use Efficiency of Nitrogen Fertilizer in Maize Cropping Systems and Their Responses to Technologies and Management Practices: A Global Analysis on Field 15 N Tracer Studies. Earth’s Fut. 2021, 9, e2020EF001514. [Google Scholar] [CrossRef]
  20. Radicetti, E.; Mancinelli, R.; Moscetti, R.; Campiglia, E. Management of winter cover crop residues under different tillage conditions affects nitrogen utilization efficiency and yield of eggplant (Solanum melanogena L.) in Mediterranean environment. Soil Tillage Res. 2016, 155, 329–338. [Google Scholar] [CrossRef]
  21. Muscas, E.; Cocco, A.; Mercenaro, L.; Cabras, M.; Lentini, A.; Porqueddu, C.; Nieddu, G. Effects of vineyard floor cover crops on grapevine vigor, yield, and fruit quality, and the development of the vine mealybug under a Mediterranean climate. Agric. Ecosyst. Environ. 2017, 237, 203–212. [Google Scholar] [CrossRef]
  22. Novara, A.; Cerda, A.; Barone, E.; Gristina, L. Cover crop management and water conservation in vineyard and olive orchards. Soil Tillage Res. 2021, 208, 104896. [Google Scholar] [CrossRef]
  23. Kaye, J.P.; Quemada, M. Using cover crops to mitigate and adapt to climate change. A review. Agron. Sustain. Dev. 2017, 37, 4. [Google Scholar] [CrossRef]
  24. Salazar, O.; Casanova, M.; Nájera, F.; Contreras, A.; Tapia, Y. Net Nitrogen Mineralisation in Maize-Cover Crop Rotations in Mediterranean Central Chile. J. Soil Sci. Plant Nutr. 2020, 20, 1042–1050. [Google Scholar] [CrossRef]
  25. Behnke, G.; Villamil, M.B. Cover crop rotations affect greenhouse gas emissions and crop production in Illinois, USA. Field Crop. Res. 2019, 241, 107580. [Google Scholar] [CrossRef]
  26. Salazar, O.; Rojas, C.; Avendaño, F.; Realini, P.; Nájera, F.; Tapia, Y. Inorganic nitrogen losses from irrigated maize fields with narrow buffer strips. Nutr. Cycl. Agroecosyst. 2015, 102, 359–370. [Google Scholar] [CrossRef]
  27. Daryanto, S.; Fu, B.; Wang, L.; Jacinthe, P.-A.; Zhao, W. Quantitative synthesis on the ecosystem services of cover crops. Earth Sci. Rev. 2018, 185, 357–373. [Google Scholar] [CrossRef]
  28. Santibáñez, F.; Santibáñez, P.; Caroca, C.; González, P. Atlas Agroclimático de Chile. Tomo III: Regiones de Valparaíso, Metropolitana; O’Higgins y Del Maule; AGRIMED y FIA: Santiago, Chile, 2017. [Google Scholar]
  29. Casanova, M.; Salazar, O.; Seguel, O.; Luzio, W. The Soils of Chile; Hartemink, A.E., Ed.; Springer Netherlands: Dordrecht, The Netherlands, 2013. [Google Scholar]
  30. Sadzawka, A.; Carrasco, M.A.; Grez, R.; Mora, M. Métodos de Análisis Recomendados para los Suelos Chilenos; Comisión de Normalización y Acreditación, Sociedad Chilena de la Ciencia del Suelo: Santiago, Chile, 2004. [Google Scholar]
  31. Sandoval, M.; Dörner, J.; Seguel, O.; Cuevas, J.; Rivera, D. Métodos de Análisis Físico de Suelos; Sociedad Chilena de las Ciencias del Suelo: Santiago, Chile, 2011. [Google Scholar]
  32. Allen, R.G.; Pereira, L.S.; Raes, D.; Smith, M. Crop Evapotranspiration—Guidelines for Computing Crop Water Requirements; FAO Irrigation and Drainage Paper 56: Rome, Italy, 1998. [Google Scholar]
  33. IAEA. Applications of Nuclear Techniques in Soil Fertility and Plant Nutrition Studies. In Applications of Nuclear Techniques in Soil Fertility and Plant Nutrition Studies; International Atomic Energy Agency (IAEA): Vienna, Austria, 2001; pp. 21–103. [Google Scholar]
  34. Sadzawka, A.; Carrasco, A.; Grez, R.; Mora, M.; Flores, H.; Neaman, A. Métodos de Análsis de Tejidos Vegetales, Serie Acta; Instituto de Investigaciones Agropecuarias (INIA): Santiago, Chile, 2007. [Google Scholar]
  35. Reinhardt, R.; Russow, R. Use of the 15N Isotope Dilution Technique to Study the Effect of Mineral Nitrogen on Biological Nitrogen Fixation in Red Clover. In Stable Isotopes in Plant Nutrition, Soil Fertility and Environmental Studies; IAEA: Vienna, Austria, 1990; pp. 193–200. [Google Scholar]
  36. Gabriel, J.L.; Quemada, M. Replacing bare fallow with cover crops in a maize cropping system: Yield, N uptake and fertiliser fate. Eur. J. Agron. 2011, 34, 133–143. [Google Scholar] [CrossRef]
  37. Snyder, C.; Bruulsema, T.; Jensen, T.; Fixen, P. Review of greenhouse gas emissions from crop production systems and fertilizer management effects. Agric. Ecosyst. Environ. 2009, 133, 247–266. [Google Scholar] [CrossRef]
  38. Van Groenigen, J.W.; Velthof, G.; Oenema, O.; van Groenigen, K.J.; Van Kessel, C. Towards an agronomic assessment of N2O emissions: A case study for arable crops. Eur. J. Soil Sci. 2010, 61, 903–913. [Google Scholar] [CrossRef]
  39. O’Reilly, K.A.; Lauzon, J.D.; Vyn, R.J.; Van Eerd, L.L. Nitrogen cycling, profit margins and sweet corn yield under fall cover crop systems. Can. J. Soil Sci. 2012, 92, 353–365. [Google Scholar] [CrossRef] [Green Version]
  40. Paré, T.; Gregorich, E.G.; Nelson, S.D. Mineralization of Nitrogen from Crop Residues and N Recovery by Maize Inocu-lated with Vesicular-Arbuscular Mycorrhizal Fungi. Plant Soil 2000, 218, 11–20. [Google Scholar] [CrossRef]
  41. Havlin, J.L.; Tisdale, S.L.; Nelson, W.L.; Beaton, J.D. Soil Fertility and Nutrient Management: An Introduction to Nutrient Management; Pearson: Upper Saddle River, NJ, USA, 2014. [Google Scholar]
  42. Coombs, C.; Lauzon, J.D.; Deen, B.; Van Eerd, L.L. Legume cover crop management on nitrogen dynamics and yield in grain corn systems. Field Crop. Res. 2017, 201, 75–85. [Google Scholar] [CrossRef]
  43. Nario, A.; Parada, A.M.; Videla, X.; Casanova, M.; Seguel, O. 15N Fertilizer Efficiency in Maize Cropped by Small Farmers at the VI Region of Chile. In International Symposium on Managing Soils for Food Security and Climate Change Adaptation and mit-igation; FAO—IAEA: Vienna, Aystria, 2012; pp. 89–90. [Google Scholar]
  44. Alonso-Ayuso, M.; Gabriel, J.L.; Quemada, M. The Kill Date as a Management Tool for Cover Cropping Success. PLoS ONE 2014, 9, e109587. [Google Scholar] [CrossRef]
  45. Snapp, S.; Surapur, S. Rye cover crop retains nitrogen and doesn’t reduce corn yields. Soil Tillage Res. 2018, 180, 107–115. [Google Scholar] [CrossRef]
  46. Ciampitti, I.A.; Murrell, T.; Camberato, J.J.; Tuinstra, M.; Xia, Y.; Friedemann, P.; Vyn, T.J. Physiological Dynamics of Maize Nitrogen Uptake and Partitioning in Response to Plant Density and Nitrogen Stress Factors: II. Reproductive Phase. Crop. Sci. 2013, 53, 2588–2602. [Google Scholar] [CrossRef]
  47. Di Paolo, E.; Rinaldi, M. Yield response of corn to irrigation and nitrogen fertilization in a Mediterranean environment. Field Crop. Res. 2008, 105, 202–210. [Google Scholar] [CrossRef]
  48. Corradini, F.; Nájera, F.; Casanova, M.; Tapia, Y.; Singh, R.; Salazar, O.D. Effects of maize cultivation on nitrogen and phosphorus loadings to drainage channels in Central Chile. Environ. Monit. Assess. 2015, 187, 697. [Google Scholar] [CrossRef]
  49. Pino, I.; Rouanet, J.L.; Zapata, F.; Parada, A.M.; Nario, A. Eficiencia de recuperación del nitrógeno en el sistema planta- suelo en un cultivo de trigo bajo manejos de suelo alternativos en un ultisol de la ix región. Agric. Técnica 2002, 62, 275–283. [Google Scholar] [CrossRef]
  50. Teasdale, J.R.; Abdul-Baki, A.A.; Park, Y.B. Sweet corn production and efficiency of nitrogen use in high cover crop residue. Agron. Sustain. Dev. 2008, 28, 559–565. [Google Scholar] [CrossRef] [Green Version]
  51. Zagal, E.; Rodríguez, N.; Vidal, I.; Hofmann, G. Eficiencia de uso y dinamica del nitrógeno en una rotacion con y sin uso de residuos. Agric. Técnica 2003, 63, 298–310. [Google Scholar] [CrossRef]
  52. Johnston, A.; Bruulsema, T. 4R Nutrient Stewardship for Improved Nutrient Use Efficiency. Procedia Eng. 2014, 83, 365–370. [Google Scholar] [CrossRef] [Green Version]
  53. Quemada, M.; Alonso-Ayuso, M.; Castellano-Hinojosa, A.; Bedmar, E.J.; Gabriel, J.L.; González, I.G.; Valentín, F.; Calvo, M. Residual effect of synthetic nitrogen fertilizers and impact on Soil Nitrifiers. Eur. J. Agron. 2019, 109, 125917. [Google Scholar] [CrossRef]
  54. Basir, A.; Jan, M.T.; Alam, M.; Shah, A.S.; Afridi, K.; Adnan, M.; Ali, K.; Mian, I.A. Impacts of tillage, stubble management and nitrogen on wheat production and soil properties. Can. J. Soil Sci. 2016, 97, 133–140. [Google Scholar] [CrossRef] [Green Version]
  55. Quemada, M.; Baranski, M.; Lange, M.N.-D.; Vallejo, A.; Cooper, J. Meta-analysis of strategies to control nitrate leaching in irrigated agricultural systems and their effects on crop yield. Agric. Ecosyst. Environ. 2013, 174, 1–10. [Google Scholar] [CrossRef] [Green Version]
  56. Lindquist, J.L.; Evans, S.P.; Shapiro, C.A.; Knezevic, S.Z. Effect of Nitrogen Addition and Weed Interference on Soil Nitrogen and Corn Nitrogen Nutrition. Weed Technol. 2010, 24, 50–58. [Google Scholar] [CrossRef] [Green Version]
  57. Salazar, O.; Wesström, I.; Youssef, M.A.; Skaggs, R.W.; Joel, A. Evaluation of the DRAINMOD–N II model for predicting nitrogen losses in a loamy sand under cultivation in south-east Sweden. Agric. Water Manag. 2009, 96, 267–281. [Google Scholar] [CrossRef]
  58. Vázquez, N.; Pardo, A.; Suso, M.; Quemada, M. Drainage and nitrate leaching under processing tomato growth with drip irrigation and plastic mulching. Agric. Ecosyst. Environ. 2006, 112, 313–323. [Google Scholar] [CrossRef]
  59. Bortolotto, R.P.; Bruno, I.P.; Reichardt, K.; Timm, L.C.; Amado, T.J.C.; Ferreira, A.D.O. Nitrogen fertilizer (15N) leaching in a central pivot fertigated coffee crop. Rev. Ceres 2012, 59, 466–475. [Google Scholar] [CrossRef] [Green Version]
  60. Quemada, M.; Cabrera, M.L.; McCracken, D.V. Nitrogen Release from Surface-Applied Cover Crop Residues: Evaluating the CERES-N Submodel. Agron. J. 1997, 89, 723–729. [Google Scholar] [CrossRef]
  61. Alonso-Ayuso, M.; Gabriel, J.L.; Pancorbo, J.L.; Quemada, M. Interseeding cover crops into maize: Characterization of species performance under Mediterranean conditions. Field Crop. Res. 2020, 249, 107762. [Google Scholar] [CrossRef]
  62. Terrada, M.M.; Benavides, L.; López, S.C. Ammonia Volatilization Losses from Urea Fertilizer Applied on Wheat. In International Symposium on Managing Soils for Food Security and Climate Change Adaptation and Mitigation; FAO—IAEA: Rome, Italy, 2014; pp. 25–29. [Google Scholar]
  63. Fuentes, I.; Casanova, M.; Seguel, O.; Padarian, J.; Nájera, F.; Salazar, O. Preferential flow paths in two alluvial soils with long-term additions of pig slurry in the Mediterranean zone of Chile. Soil Res. 2015, 53, 433–447. [Google Scholar] [CrossRef]
  64. Civeira, G.; Rodríguez, M.B. Residual and leached nitrogen in soil plant zeolite systems nitrógeno residual y lixivia-do del fertilizante en el sistema suelo-planta-zeolitas. Cienc. Suelo 2011, 29, 2. [Google Scholar]
Figure 1. Daily mean of the precipitation, crop evapotranspiration (ETc), irrigation, and air temperature registered during the crop rotation (maize–cover crop) between April 2018 and May 2019.
Agriculture 11 00721 g001
Figure 2. (A) Total N uptake from fertilizer and soil. (B) Total accumulated nitrogen fertilizer efficiency (NFE) of all fractions of the maize crop. Different letters in the bars indicate statistically significant differences between the treatments based on multiple LSD Fisher comparisons (α ≤ 0.05), including standard deviation error bars.
Agriculture 11 00721 g002
Figure 3. Final forms of nitrogen (N) recovered in the crop, residual on the soil, or unrecovered at the end of the maize growing season.
Agriculture 11 00721 g003
Figure 4. Soil residual N in the treatments at different soil depths, including standard deviation error bars.
Agriculture 11 00721 g004
Figure 5. Dissolved inorganic nitrogen content (DIN) at the end of the maize season.
Agriculture 11 00721 g005
Figure 6. Amounts of dissolved inorganic N (DIN) present in leachates at the V7, V9, VT, and R5 stages of the maize crop. Different letters in the bars indicate statistically significant differences between the treatments based on multiple LSD Fisher comparisons (α ≤ 0.05), including standard deviation error bars.
Agriculture 11 00721 g006
Figure 7. Dissolved inorganic nitrogen emission intensity (kg ha−1) for each Mg of grain produced at the end of the maize growing season.
Agriculture 11 00721 g007
Figure 8. Nitrogen balance in the production system: (A) maize–cover crop rotation with optimal N fertilization dose; (B) maize–fallow rotation with excessive fertilization N dose, derived from the present study.
Agriculture 11 00721 g008
Table 1. Chemical and physical properties of the soil used in the column experiments.
Horizon (Depth)Soil Properties 1
pHwaterECeSOMDbAWCClaySiltSandTextural Class
-dS m−1%t m−3----------------------% -----------------------
Ap (0–42 cm)8.990.971.121.421520.944.734.4Loam
C (42–50 cm)8.101.100.191.38145.326.977.8Loamy sand
1 ECe, extract electrical conductivity; SOM, soil organic matter; Db, bulk density; AWC, gravimetric available water content.
Table 2. Grain yield, biomass, and nitrogen (N) content in the aboveground biomass, root, and grain of the maize crop.
FactorBiomass 1Yield 1N Content 1
AbovegroundRootGrainAbovegroundRootGrain
----------- t ha−1 ---------------------- kg ha−1 -----------
Crop rotationZm–Lm25.02 ± 1.274.19 ± 0.5117.98 ± 0.28141.31 ± 7.3622.70 ± 3.34232.32 ± 11.05
Zm–F25.26 ± 1.364.04 ± 0.5817.82 ± 0.89151.67 ± 9.0721.90 ± 2.31239.32 ± 11.98
N rate
(kg N ha−1)
40027.54 ± 1.05 a4.24 ± 0.5019.14 ± 0.53161.48 ± 6.38 a22.62 ± 2.59253.04 ± 9.32 a
25022.74 ± 0.57 b3.99 ± 0.5816.66 ± 0.41131.50 ± 3.89 b21.98 ± 3.13218.87 ± 8.62 b
Crop rotation 20.8630.8020.6440.2350.8310.283
N rate 20.0110.6990.0010.0060.8640.002
Crop rotation × N rate 20.9720.0280.0200.4250.0720.124
1 Average values of each variable ± standard error. Different letters in the column indicate statistically significant differences between the levels of each factor, based on multiple LSD Fisher comparisons (α ≤ 0.05). 2p value (<0.05) corresponds to the effect of the crop rotation and N dose factors and the interaction of the factors.
Table 3. Nitrogen uptake from fertilizer (Nadf) and soil (Nads) for the aboveground biomass, root, and grain of maize.
Factor Nadf 1Nads 1
AbovegroundRootGrainAbovegroundRootGrain
kg ha−1
Crop rotationZm–Lm34.33 ± 2.034.47 ± 0.4762.17 ± 2.20118.76 ± 5.9617.44 ± 2.93170.14 ± 9.32
Zm–F32.55 ± 3.224.81 ± 0.5957.49 ± 3.67107.34 ± 6.0417.90 ± 1.72182.10 ± 8.48
N rate
(kg N ha−1)
40037.69 ± 1.96 a4.89 ± 0.6165.17 ± 1.42123.79 ± 5.27 a18.24 ± 2.00187.87 ± 8.51 a
25029.19 ± 1.94 b4.39 ± 0.4354.49 ± 2.69102.31± 3.33 b17.10 ± 2.72164.37 ± 7.03 b
Crop rotation 20.5580.6320.0360.0850.8830.076
N rate 20.0260.4900.0010.0080.7150.006
Crop rotation × N rate 20.4000.0990.0360.5360.0720.298
1 Average values of each variable ± standard error. Different letters in the column indicate statistically significant differences between the levels of each factor, based on multiple LSD Fisher comparisons (α ≤ 0.05). 2 p value (<0.05) corresponds to the effect of the crop rotation and N dose factors and the interaction of the factors.
Table 4. Nitrogen fertilizer efficiency (NFE) in the aboveground, root, grain, and total maize plant.
Factor NFE 1
AbovegroundRootGrainTotal
(%)
Crop rotationZm–Lm10.94 ± 0.881.49 ± 0.26 a19.98 ± 1.8132.40 ± 2.70
Zm–F10.16 ± 0.721.49 ± 0.12 a18.11 ± 1.7229.77 ± 1.28
N rate
(kg N ha−1)
40011.68 ± 0.491.22 ± 0.15 b16.29 ± 2.0026.94 ± 0.83
2509.42 ± 0.781.76 ± 0.17 a21.80 ± 2.7235.23 ± 1.45
Crop rotation 20.4370.9700.0120.075
N rate 20.0510.0460.0010.005
Crop rotation × N rate 20.3300.1050.0120.037
1 Average values for the variable ± standard error. Different letters in each column indicate statistically significant differences between the levels of each factor. Based on multiple comparisons of LSD Fisher (α ≤ 0.05). 2 p value (<0.05) corresponds to the effect of the crop rotation and N dose factors and the interaction of the factors.
Table 5. Comparison of means for the interactions in the yield variables, nitrogen uptake from fertilizer (Nadf), and nitrogen fertilizer efficiency (NFE) in the grain fraction and root biomass.
TreatmentsGrain 1Root 1
YieldNadfNFEDry Biomass
t ha−1kg ha−1%t ha−1
Zm400–F19.42 ± 0.75 a65.17 ± 2.23 a16.30 ± 0.56 c4.93 ± 0.75 a
Zm400–Lm18.72 ± 0.71 a65.16 ± 2.17 a16.29 ± 0.54 c3.45 ± 0.25 a
Zm250–Lm17.24 ± 0.56 b59.18 ± 3.60 a23.68 ± 1.44 a5.02 ± 0.82 a
Zm250–F16.08 ± 0.40 c49.80 ± 0.92 b19.92 ± 0.37 b3.05 ±0.37 b
p value0.0200.0360.0120.028
1 Average values of the interacting variables ± standard error. Different letters in each column indicate statistically significant differences between the treatments. Based on multiple LSD Fisher comparisons (α ≤ 0.05).
Table 6. Total nitrogen content (NT) and uptake from both the fertilizer (Nadf) and the soil (Nads) in the maize crop.
Factor NT 1
NadfNadsNT
kg ha−1
Crop rotationZm–Lm100.98 ± 3.30294.92 ± 10.38 b391.96 ± 12.16
Zm–F94.84 ± 6.89318.76 ± 14.84 a410.88 ± 21.66
N rate
(kg N ha−1)
400107.45 ± 3.30 a328.76 ± 13.47 a432.78 ± 15.27 a
25088.07 ± 3.62 b284.92 ± 4.32 b370.05 ± 5.13 b
Crop rotation 2 0.2020.0220.119
N rate 2 0.0040.0010.001
Crop rotation × N rate 2 0.0900.0770.055
1 Average values for the variables ± standard error. Different letters in the column indicate statistically significant differences between the levels of each factor based on multiple LSD Fisher comparisons (α ≤ 0.05). 2 p value (<0.05) corresponds to the effect of the crop rotation and N dose factors and the interaction of the factors.
Table 7. Amount of ammonium (NH4+), nitrate (NO3), and dissolved inorganic N present in leachate during the maize crop season.
Factor N Forms 1
NH4+NO3DIN
kg N ha−1
N rate + crop rotationZm400–Lm7.68 ± 2.11 ab32.42 ± 7.52 a44.88 ± 8.39 a
Zm400–F14.21 ± 7.63 a23.35 ± 7.28 ab43.00 ± 10.70 a
Zm250–F5.78 ± 2.15 b14.81 ± 2.72 bc20.58 ± 2.77 b
Zm250–Lm1.83 ± 0.68 b13.53 ± 2.82 c15.36 ± 2.56 b
TimeI V76.29 ± 6.29 b41.23 ± 7.93 a52.96 ± 10.59 a
II V95.48 ± 5.48 b19.62 ± 2.51 b18.20 ± 5.74 c
III VT2.88 ± 2.88 b15.32 ± 2.29 bc18.21 ± 3.66 c
IV R614.85 ± 14.85 a7.94 ± 3.78 c34.46 ± 2.61 b
Treatment 20.0100.0070.001
Time 20.0070.0010.001
Treatment × Time 20.1670.0020.005
1 Average values of the variables ± error. Different letters in the column indicate statistically significant differences between the treatments based on multiple LSD Fisher comparisons (α ≤ 0.05). 2 p value (<0.05) corresponds to the dose factor plus the effect of crop rotation vs. time.
Table 8. Nitrogen recovered in the soil (residual), in the maize crop, or unrecovered by the end of the growing season.
Fraction Residual 1Crop Recovered 1Unrecovered 1
kg ha−1
Crop rotationLm158.48 ± 6.67100.97 ± 3.9465.55 ± 26.10
B170.64 ± 11.1894.84 ± 6.7359.51 ± 21.46
N rate
(kg ha−1)
400179.00 ± 9.45 a107.75 ± 3.37 a113.25 ± 9.97 a
250150.12 ± 8.34 b88.07 ± 9.33 b11.81 ± 9.95 b
Crop rotation 20.2270.2020.477
N rate 20.0190.0040.001
Crop rotation × N rate 20.7110.0900.178
1 Average values at the levels of each factor ± standard error. Different letters in the column indicate statistically significant differences between the dose factor levels based on multiple LSD Fisher comparisons (α ≤ 0.05). 2 p value (<0.05) corresponds to the effect of the crop rotation and N dose factors and the interaction of the factors.
Publisher’s Note: MDPI stays neutral with regard to jurisdictional claims in published maps and institutional affiliations.

