Article

Genome-Wide Association Study Reveals Genetic Basis of Trace Elements Accumulation in Maize Kernels

1
Institute of Maize and Featured Upland Crops, Zhejiang Academy of Agricultural Sciences, Dongyang 322100, China
2
Institute of Crop Sciences, Chinese Academy of Agricultural Sciences, Beijing 100081, China
3
The Key Laboratory for Quality Improvement of Agricultural Products of Zhejiang Province, College of Advanced Agricultural Science, Zhejiang Agriculture and Forestry University, Hangzhou 311300, China
4
Jiangsu Co-Innovation Center for Modern Production Technology of Grain Crops, Agricultural College of Yangzhou University, Yangzhou 225009, China
*
Authors to whom correspondence should be addressed.
Submission received: 17 December 2021 / Revised: 1 February 2022 / Accepted: 8 February 2022 / Published: 11 February 2022

Abstract

:
Clarifying the genetic basis of trace element accumulation is of great significance to breed new maize varieties with high quality. In this study, an integrated variant map with 1.25 million (M) SNPs and 489 inbred lines was used for a genome-wide association study on the accumulation of iron (Fe), manganese (Mn), copper (Cu), zinc (Zn), cadmium (Cd) and Arsenic (As) in maize kernels. Seventeen SNPs linked with six genes were overlapped by different trace elements. After further analysis, 65 SNPs located in 28 genes with a p-value lower than 10−10 were associated with Cd content by genome-wide association studies (GWAS). There was a 3.1-fold difference in Cd content between different groups, which was divided by SNP haplotype in chr2.S_160782359, chr2.S_161045498 and chr2.S_161273716. The amino acid sequences of GRMZM2G150608 and GRMZM2G051367 only shared 68.85% and 88.16% similarity between B73 and Mo17, and the Cd content of Mo17 was 2.2-fold that of B73. In addition, 19 lines with higher contents of Fe, Zn, Cu, Mn and fewer contents of As and Cd were screened from GWAS associated populations. This study will lay a foundation for revealing the molecular mechanism of trace element accumulation in maize kernels and provide candidate genes for breeding new maize varieties with high nutritional quality.

1. Introduction

More than one-third of the world’s population suffers from nutritional trace element deficiency [1]. Meanwhile, heavy metal elements are enriched in the human body, which leads to various diseases [2]. Micronutrient malnutrition, referenced as hidden hunger, is a serious threat to people’s health in developing countries, by which about 40% of the world’s population is affected [3]. Among mineral nutrients, Zn (zinc) and Fe (iron) deficiency are the most prevalent. It was recently found that 27% of children under five years old and 41% of pregnant women could not absorb enough Fe from food, while 89% of children could not absorb enough Zn from their diet. In plants, Fe and Zn deficiency leads to the abnormal development of young leaves and stunted plant growth, while Cu (copper) deficiency leads to dark greenish leaves and Mn (manganese) deficiency leads to defects in glycolysis and the tricarboxylic acid cycle. As for toxicity metals, Cd (cadmium) and As (arsenic) are difficult to decompose, and they could damage human health by enrichment in the food chain. It was reported that 70% of Cd intake in humans was from crops. During plant development, the toxic phenotype, such as root growth retardation and water and nutrients absorption deficiency, was presented when Cd excessive accumulations [4]. Therefore, high-quality maize varieties with highly beneficial elements and less harmful elements will be necessary for human dietary safety.
Maize is the crop with the largest planting area and the highest yield, and it is also widely used as the staple food in the world [5]. The absorptions of beneficial trace elements, such as Fe, Zn, Mn, Cd and Cu, in maize varied largely in different varieties [6]. In addition, the distribution of harmful element pollution in China is highly consistent with that in maize planting areas [7]. The contents of Cd and As in maize kernels not only affect the quality of maize but also human health. Furthermore, the absorption and accumulation of Cd and As in different cultivars are greatly different [8]. Therefore, maize may be the ideal material that can reduce food risk and supply nutrients by increasing the contents of beneficial trace elements meanwhile reducing harmful ones [5]. In previous studies, the key genes controlling the absorption of trace elements were widely located in the plant. In rice, a larger number of QTLs controlling mineral concentration were identified using biparental populations [9,10,11,12,13,14]. There are hundreds of genes identified in many different plant species as key regulators of metal ion content [15,16,17,18,19,20,21]. In maize, one, two and two QTL were identified for the Cu, Fe and Mg concentration of ear-leaves in an intermated B73 × Mo17 maize population (IBM) [22]. Due to the limitation of materials and technology, only a few key genes regulating metal ion content were studied, in which Os-HKT1;5 (or SKC1) for sodium (Na), Os-HMA3 for Cd and Os-HMA4 for copper (Cu) were included [23,24,25,26,27].
Genome-wide association study (GWAS), in which the natural populations were utilized, was widely used for the detection of variants associated with complex quantitative traits in different plants [6,28]. In the past decade, the loci related to different mineral accumulation was detected by GWAS. In Arabidopsis, several loci/genes related to mineral accumulation were identified, such as HAC1 for As [29], HMA3 for Cd [30] and MOLYBDATE TRANSPORTER1 (MOT1) for molybdenum (Mo) [31,32]. In rice, GWAS was used to analyze the accumulation of As, Cu, Mo and Zn in grain [33] and Zn, Fe, Mn, Cu, P, Ca, K and Mg in brown rice [34]. In other studies, 72 loci associated with 17 mineral elements were identified by GWAS in rice, and the function of three candidate genes, such as Os-HKT1;5 for sodium, Os-MOLYBDATE TRANSPORTER1;1 for Mo and heading date7 for nitrogen (N), were studied [35]. In maize leaves, qLCd2 and GRMZM2G175576 were identified by combination analysis between GWAS and QTL mapping [6]. In maize kernels, 11 (for Zn) and 11 (for Fe) SNPs were found by GWAS using 923 lines constructed by bi-parent, but the key genes for controlling the accumulation of Fe and Zn were not fully mined [15]. Limited by the divergence of populations and SNPs density, the regulatory network of the accumulation of trace metal ions in maize kernels was not fully uncovered.
In maize, the integrated variant map with 1.25 M SNPs and 489 inbred lines reconstructed by Yan’s lab was applied in re-mapping the eQTL landscape for maize kernels [36]. In this study, the genetic map created by Yan’s lab was used for the genome-wide association study of Fe, Mn, Cu, Zn, Cd and As accumulation in maize kernels. These results will lay a foundation for revealing the genetic basis of trace element accumulation and provide key genes for breeding new maize varieties beneficial to human dietary health.

2. Materials and Methods

2.1. Plant Materials

A set of 489 maize lines from 513 inbred lines, including temperate and tropical/subtropical elite inbred lines, were collected and sequenced as described previously [36]. The association population was planted in 2017 at three locations, Sanya, Hainan (HN, 18°14′ N, 109°31′ E), Dongyang, Zhejiang (DY, 28°59′ N, 120°05′ E) and Xinxiang, Henan (XX, 35°18′ N, 113°54′ E) of China. Approximately 185 out of 490 inbred lines are shared by the three locations; Hainan and Dongyang shared 440 inbred lines, Hainan and Xinxiang shared 193 inbred lines; Dongyang and Xinxiang shared 188 inbred lines; 13 inbred lines were unique in Hainan; 2 inbred lines were unique in Dongyang; 10 inbred lines were unique in Xinxiang. The Randomized block experiment design was used in the field, and two replicates were set. Each inbred line was planted in a single row with 17 plants in each row with a spacing of 55 cm × 40 cm. The final plant density was 45,000 plants per hectare. The field management was the same as the general style. Each maize inbred line was self-pollinated and harvested individually.

2.2. Trace Element Contents Detected in Maize Kernels and Soil

The association population was harvested at the dough stage (R4) to determine the content of trace elements in maize kernels. Fifty kernels of each inbred line, dried at 70 °C for 24 h, were ground to a powder using agate mortar without contacting any element’s products. The soil samples of each location were taken from 20 cm-depth fields by an evenly distributed five-point sampling method. The samples (0.5 g dry kernel powder or soil per sample) were digested with 3 mL HNO3 (Analytical Reagent) and 3 mL 30% (v/v) H2O2 on a heating block for 200 °C (kernels) or 240 °C (soil) for 8 h. The digestion solution was filtered by quantitative filter paper and diluted the volume to 50 mL. The content of Fe, Zn, Cu, Mn, As and Cd of each inbred line was determined by Inductively Coupled Plasma Mass Spectrometry (ICP-MS) (Nippon Jarrell-Ash, Tokyo, Japan). Three technical replicates were performed for each digestion.

2.3. Phenotypic and Genotypes Analysis

The Performance Analytics package in R software was used to calculate the correlation of traits in each location. Analysis of variance (ANOVA) and heritability (h2) of concentrations of trace elements in leaves was performed using SPSS statistics 21.0 as per the methods described by Holland et al. [37]. The best linear unbiased prediction (BLUP) value of six trace element contents in each location was calculated using the lem4 package (R software). The screening of inbred lines which exhibited higher beneficial elements and less harmful elements were analyzed using the online software (http://www.interactivenn.net/ (accessed on 12 December 2021)).
Four hundred eighty-nine inbred lines were genotyped using genotyping-by-sequencing (GBS). After screening with minor allele frequency (MAF) > 0.05, SNP calling rate > 5% and Heterozygosity rate < 0.05, the remaining 1,195,349 high-quality SNPs were used for subsequent analysis. In total, 1.25 M of high-density SNP type for the data was obtained from the Maizego website (http://maizego.org/Resources.html (accessed on 12 December 2021)) [38].

2.4. Genome-Wide Association Analysis

The mixed linear model (principal component analysis (PCA) + kinship (K) matrix) in the Tassel 5.0 software [39] was used for genome-wide association analysis. Kinship matrix (kinship, K) was calculated by Tassel. The PCA between inbred lines was calculated using the SNP Relate packet in R software. A p-value threshold less than 10−4 or 10−5 was considered to be significantly associated with different traits. Further, the SNPs associated with Cd, of which the p-value was less than 10−10, was used for the next analysis. The Quantile–Quantile (Q-Q) Plots and Manhattan Plots were created using the qqman package (R language).

2.5. Prediction of Candidate Genes

The candidate SNPs associated with each trace elements in the maize kernels were mapped to the B73 genome (RefGen_v2) sequence, and then the candidate genes were located. The gene annotation information in the B73 genome was obtained from maizeGDB (https://chinese.maizegdb.org/ (accessed on 13 December 2021)) or the National Center for Biotechnology Information (NCBI, https://0-www-ncbi-nlm-nih-gov.brum.beds.ac.uk/ (accessed on 13 December 2021)). The amino acid sequences of candidate genes in B73 and Mo17 were downloaded from the maizeGDB website. The amino sequences were compared and analyzed using DNAMAN software (version 6.3.3.99, Lynnon Corp., Vaudreuil-Dorion, QC, Canada).

2.6. Statistical Analysis

The collected data were subjected to analysis of variance (ANOVA) using IBM SPSS Statistics 19 (IBM Crop., Armonk, NY, USA). The means were separated by Tukey’s test for trace element contents at different locations, while Student’s t-test was used to determine the Cd concentration of different groups.

3. Results

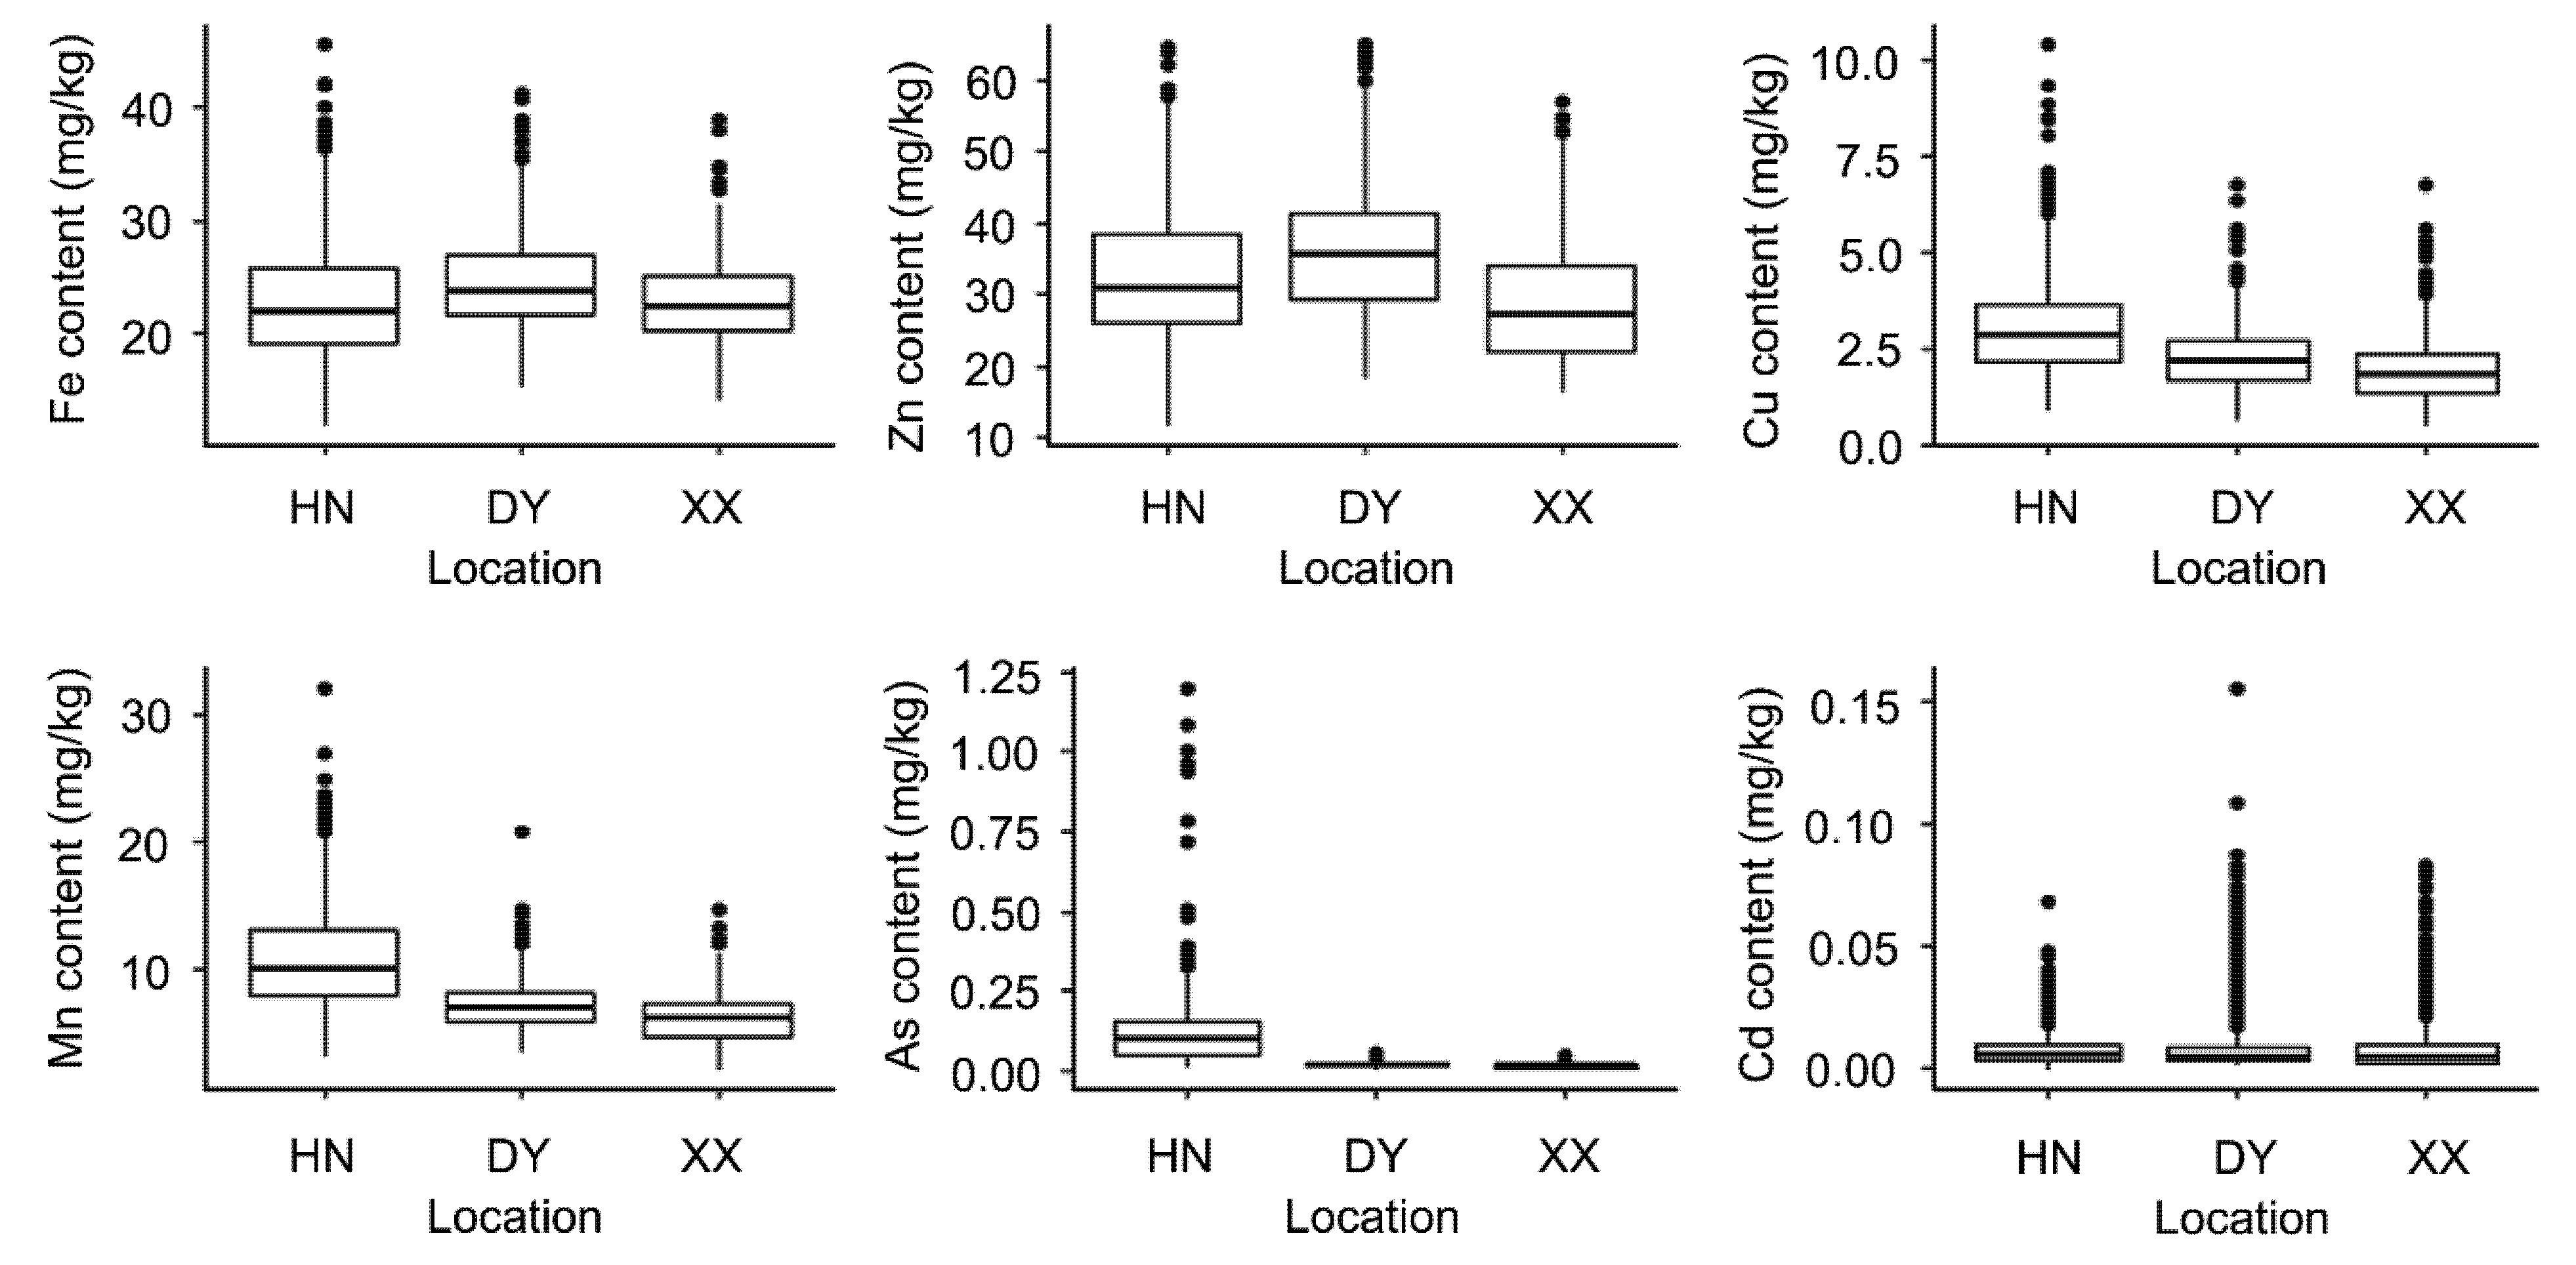
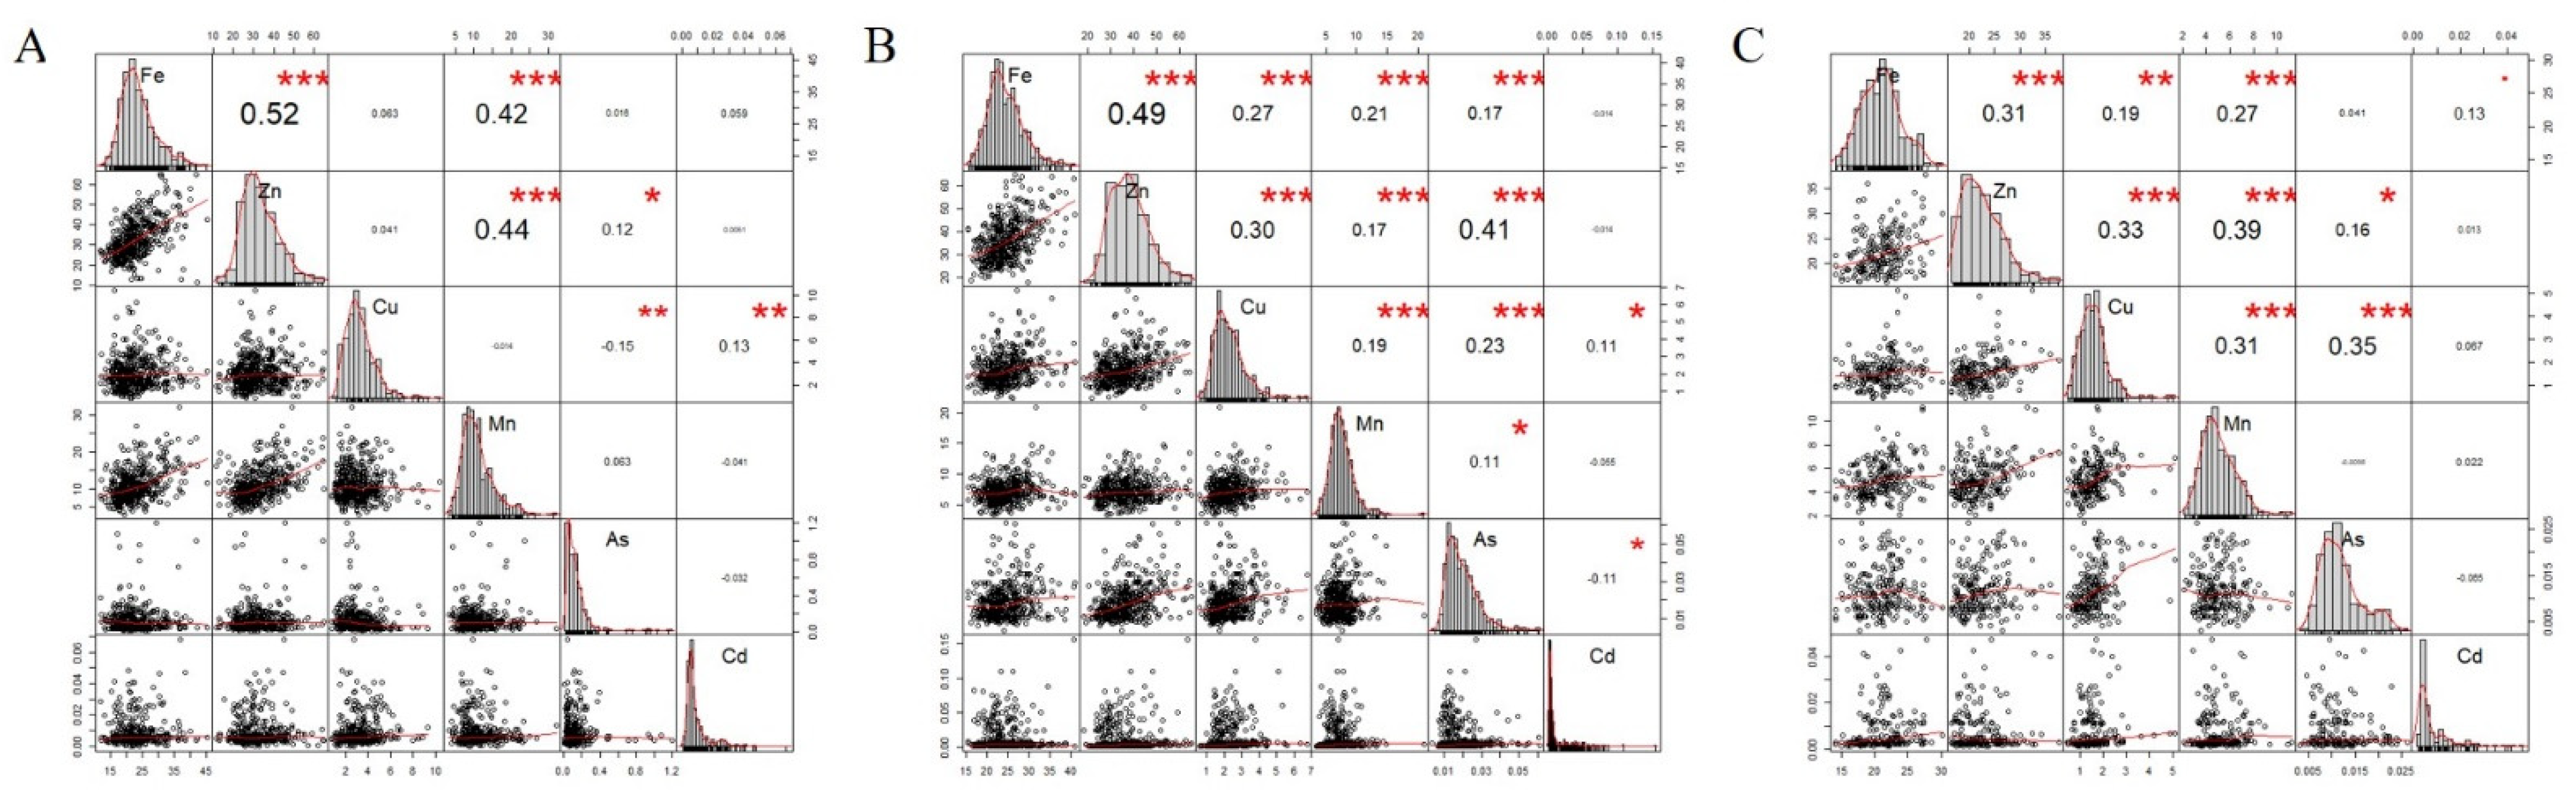
3.1. Phenotypic Analysis for Trace Elements’ Content of Maize Kernel in Different Locations

The characteristics and composition of mineral elements were slightly different among soil from Hainan, Dongyang and Xinxiang (Table 1). The soil sample results from Dongyang, with the contents of total Fe (14,760.52 mg/kg), Cu (24.74 mg/kg), As (19.4 mg/kg) and Cd (0.31 mg/kg), were higher than that of Hainan and Xinxiang. The Zn (29.96 mg/kg) and Mn (125.11 mg/kg) contents of Hainan soil were lower than those of Dongyang and Xinxiang (Table 1). The average contents of Fe, Zn, Cd, Cu, Mn and As in Xinxiang soil were the lowest in three detected locations, while Dongyang exhibited the highest content of Fe (24.54 mg/kg), Zn (36.38 mg/kg) and Cd (0.0121 mg/kg). The content of Cu (3.08 mg/kg), Mn (11.00 mg/kg) and As (0.13 mg/kg) of Hainan soil were highest (Figure 1). Further analysis revealed that there was no obvious correlation in the contents of trace elements between maize kernel and soil.
The average contents of Fe, Zn, Cd, Cu, Mn and As in Xinxiang soil were the lowest among the three locations, while Dongyang exhibited the highest content of Fe (24.54 mg/kg), Zn (36.38 mg/kg) and Cd (0.0121 mg/kg). The content of Cu (3.08 mg/kg), Mn (11.00 mg/kg) and As (0.13 mg/kg) of Hainan soil were highest. The broad-sense heritability (h2) of six mineral contents across all measured environments ranged from 0.87 to 0.99 (Table 2), which suggested the high repeatability in three locations and the key role of genetic factors in mineral accumulation. In Hainan and Dongyang, the Cu, As and Cd contents of maize kernels in the natural population had a large variation with the variation coefficient (CV) ranging from 14.32% to 61.71%, while the Fe, Zn and Mn contents exhibited a small variation with the variation coefficient (CV) only ranging from 3.75% to 7.58% (Table 2).
The frequency of Fe, Zn, Cu and Mn contents of maize kernels among three locations occurred in a normal distribution (Figure 2), while the skewed distributions were presented in the frequency distribution histograms of As and Cd in Hainan, Dongyang and Xinxiang. A high correlation between Fe, Zn and Mn was detected in all three locations. Additionally, a high correlation between Cu and Cd (correlation coefficient (r) = 0.13), meanwhile a weak negative correlation between Cu and As (r = 0.15), was uniquely present in Hainan (Figure 2). In Dongyang, a significantly (p < 0.01) positive correlation was observed among Fe, Zn, Mn, Cu and As, while Cd only had a weakly positive correlation with Cu and As. In Xinxiang, a significantly (p < 0.01) positive correlation was presented among Fe, Zn, Mn and Cu, and As only had a positive correlation with Zn (r = 0.15) and Cu (r = 0.35). At the same time, there was no correlation between Cd with other trace elements (Figure 2).
In order to eliminate the differences of trace element content in different places, BLUP was used for analyzing the contents of Fe, Zn, Cu, Mn, As and Cd (Supplemental Table S1). There were 219, 221, 227 and 201 lines for the content of Fe, Zn, Cu and Mn, respectively, of which the content was higher than average (Supplemental Table S1). Meanwhile, there were 311 (for As) and 358 (for Cd) lines, respectively, of which the content was lower than average (Supplemental Table S1). Further analysis revealed 19 lines with higher contents of Fe, Zn, Cu and Mn and lower contents of As and Cd (Supplemental Figure S1), such as CIMBL66, CML114, Gy462, D047, MN, 04K5702, GEMS65, CML225, CML170, CIMBL135, TX5, Gy220, GEMS61, TY9, CIMBL146, CML20, CML451, CML28 and GEMS6 (Supplemental Table S2).

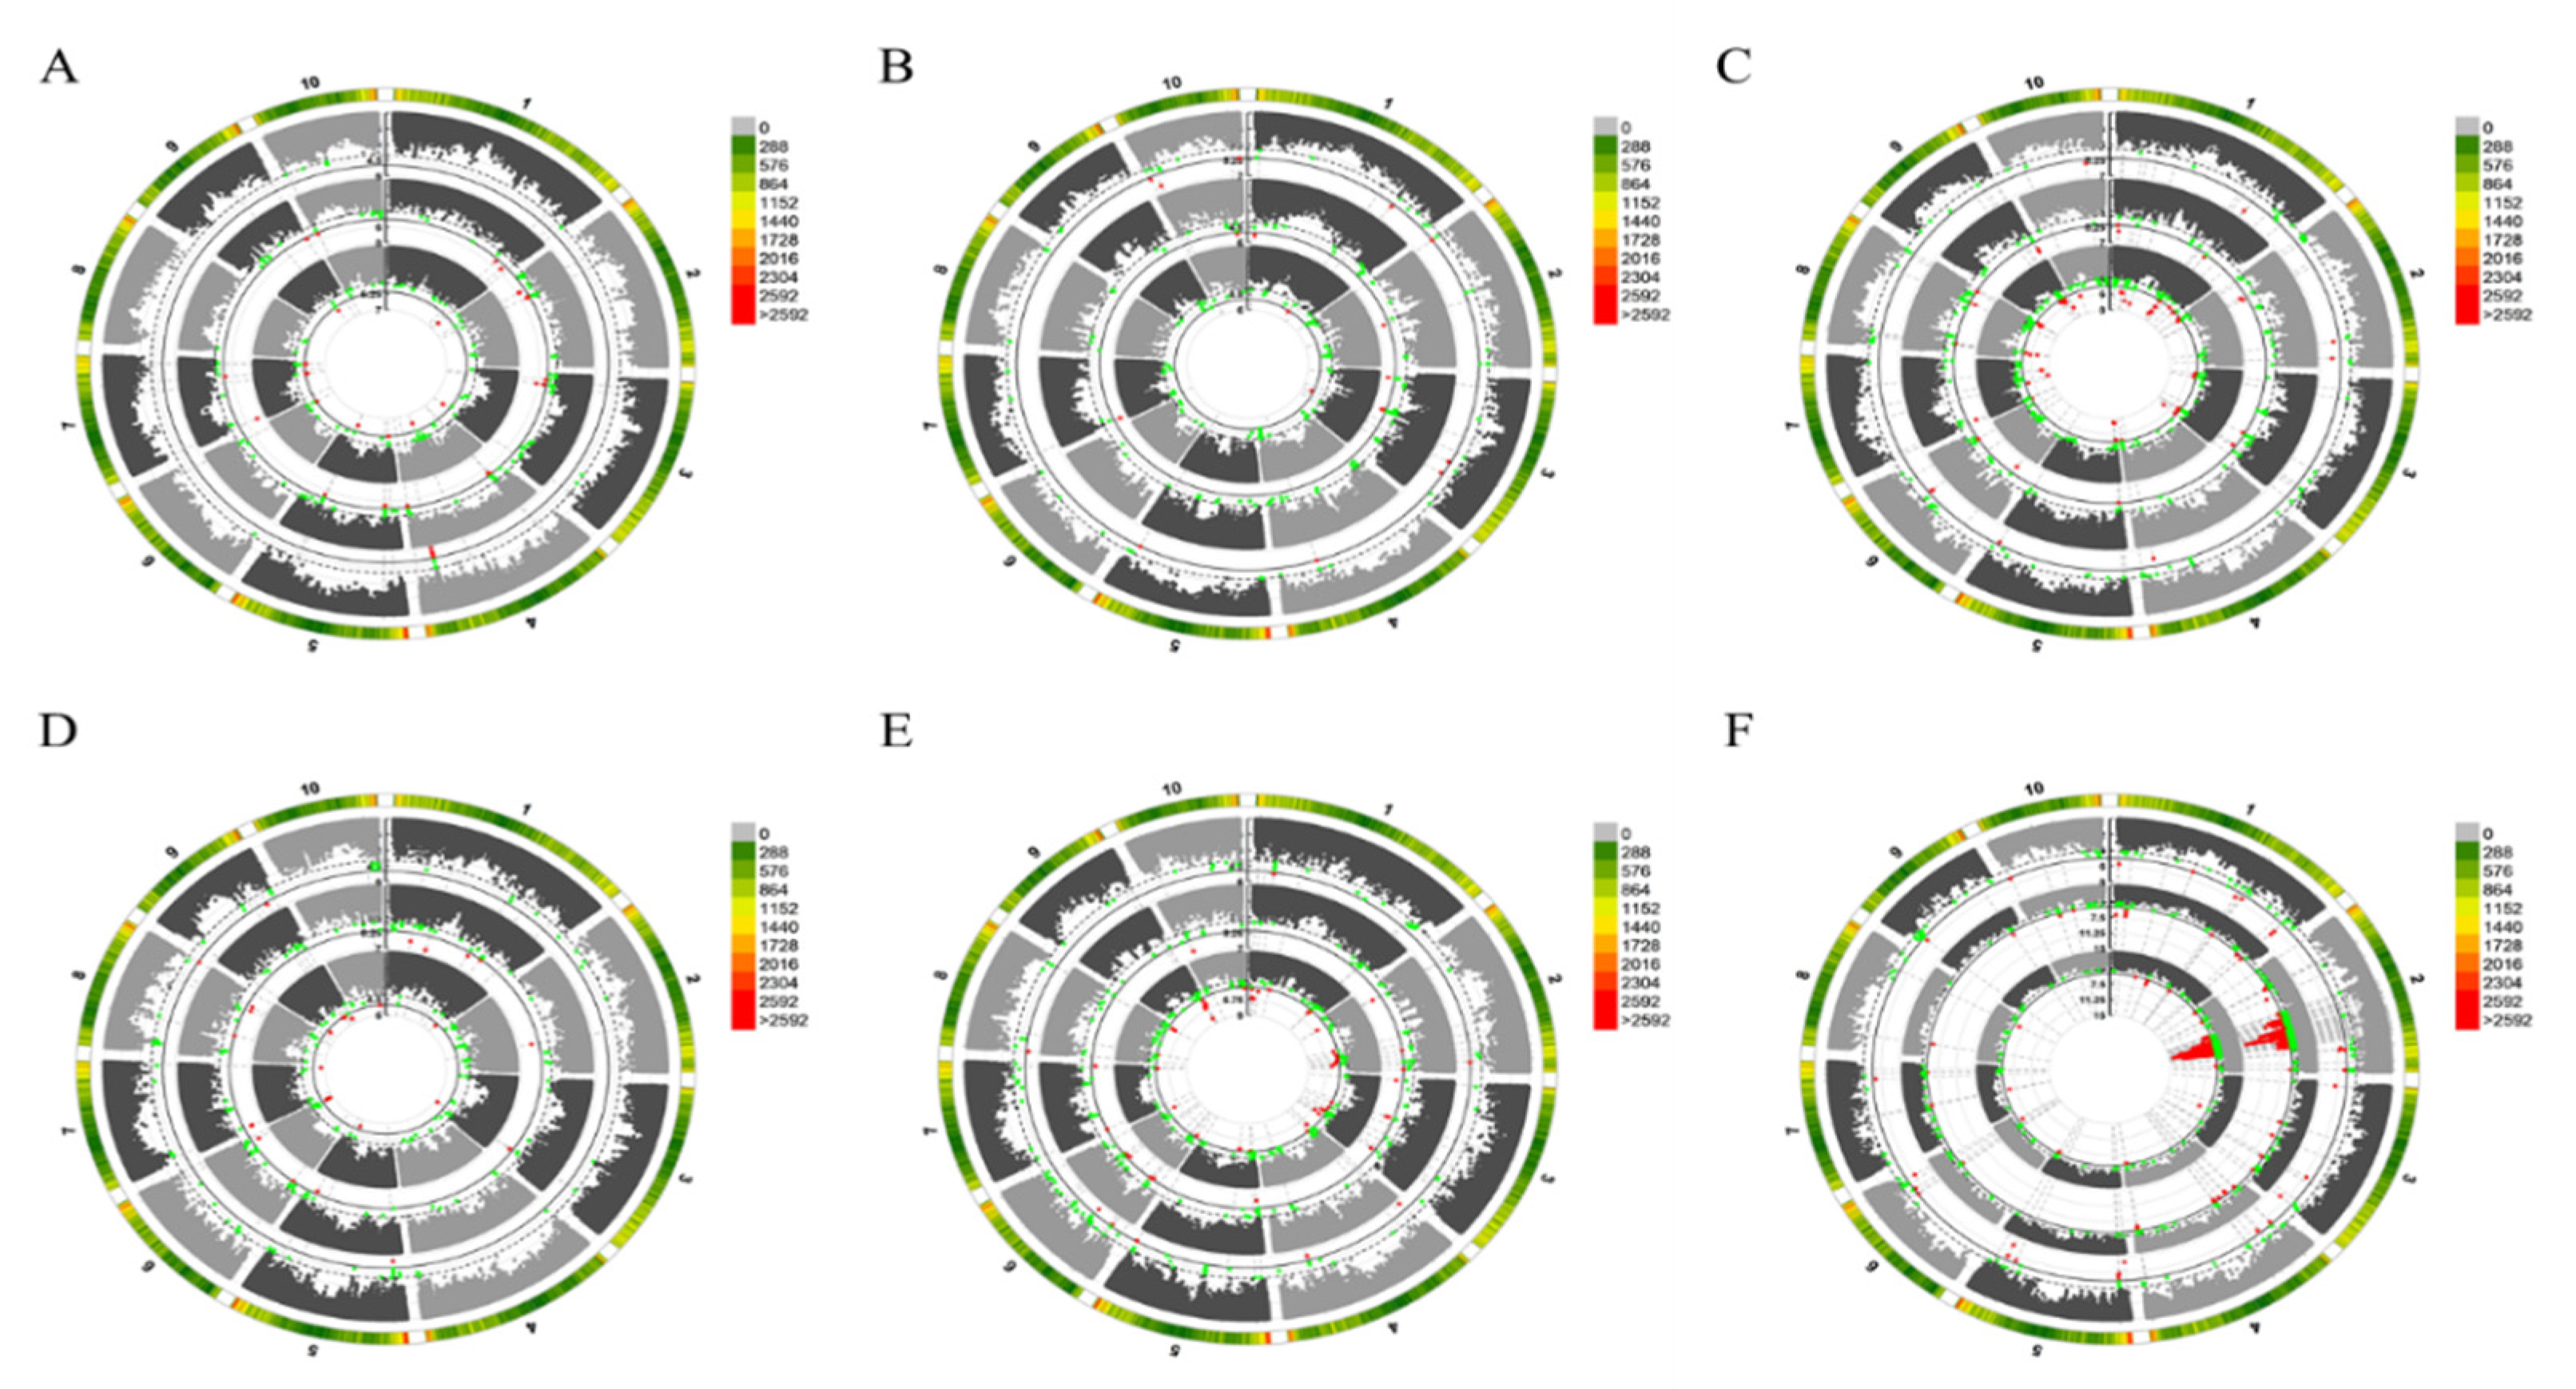
3.2. Genome-Wide Association Analysis of Trace Elements Accumulation in Kernels

Based on the mineral contents and SNPs data of 489 maize lines, genome-wide association analysis of Fe, Zn, Cd, Cu, Mn and As in Hainan, Dongyang and Xinxiang were performed by the mixed linear model (MLM, PCA+K). In order to mine the key genes related to mineral accumulation, p = 10−5 was set as the threshold (Figure 3). A total of 1603 significant loci were identified at p = 10−5, each explaining an average of 9.23% of the phenotypic variation. Seven hundred and ten loci were detected in Hainan, accounting for 9.83% of the phenotypic variation on average. Eight hundred and eleven loci were detected in Dongyang region, explaining 7.16% of the phenotypic variation on average. In Xinxiang, 82 loci were detected, explaining 12.76% of the phenotypic variation on average. Seventeen SNPs were overlapped by different elements simultaneously (Table 3). Five SNPs, chr3.s_28354214 (GRMZM2G375197), chr4.s_240465668 (GRMZM2G384293), chr4.s_240465753 (GRMZM2G384293), chr7.s_4960091 (GRMZM2G039922) and chr10.s_110087144 (GRMZM2G034206) located on chromosomes 3, 4, 7 and 10 were associated with Fe and Zn, which explained a 7.07% variation of Fe content and 5.62% variation of Zn content (Table 3). Four SNPs were located on GRMZM2G123257 of chromosome 4, chr4.s_38571269, chr4.s_38571275, chr4.s_38571287 and chr4.s_38571537, were correlated with Fe and Cd content, which explained the 5.71% variation of Fe content and the 6.00% variation of Cd. Three SNPs on chromosome 3, chr3.s_106959180, chr3.s_107012870 and chr3.s_107015045, were correlated with Zn and As content, which explained the 4.87% variation of Zn content and 5.58% variation of As content on average (Table 3). Two SNPs located on GRMZM2G018820 of chromosome 5, chr5.s_164728663 and chr5.s_164728686, were correlated with Fe and Mn content, which explains the 6.05% variation of Fe content and the 5.24% variation of Mn content on average (Table 3). chr5.s_13803855 and chr10.s_139994623 were correlated with As and Cd, which explained the 6.30% variation of As content and 9.55% variation of Cd content (Table 3). chr2.s_121584444 was correlated with Zn and Cd content, explaining 6.74% of Fe content and 14.71% of Cd content (Table 3). The correlated SNPs of Fe, Zn, Cu, Mn and As in different locations presented no overlap with each other, suggesting the accumulation of these elements was greatly affected by the environment.

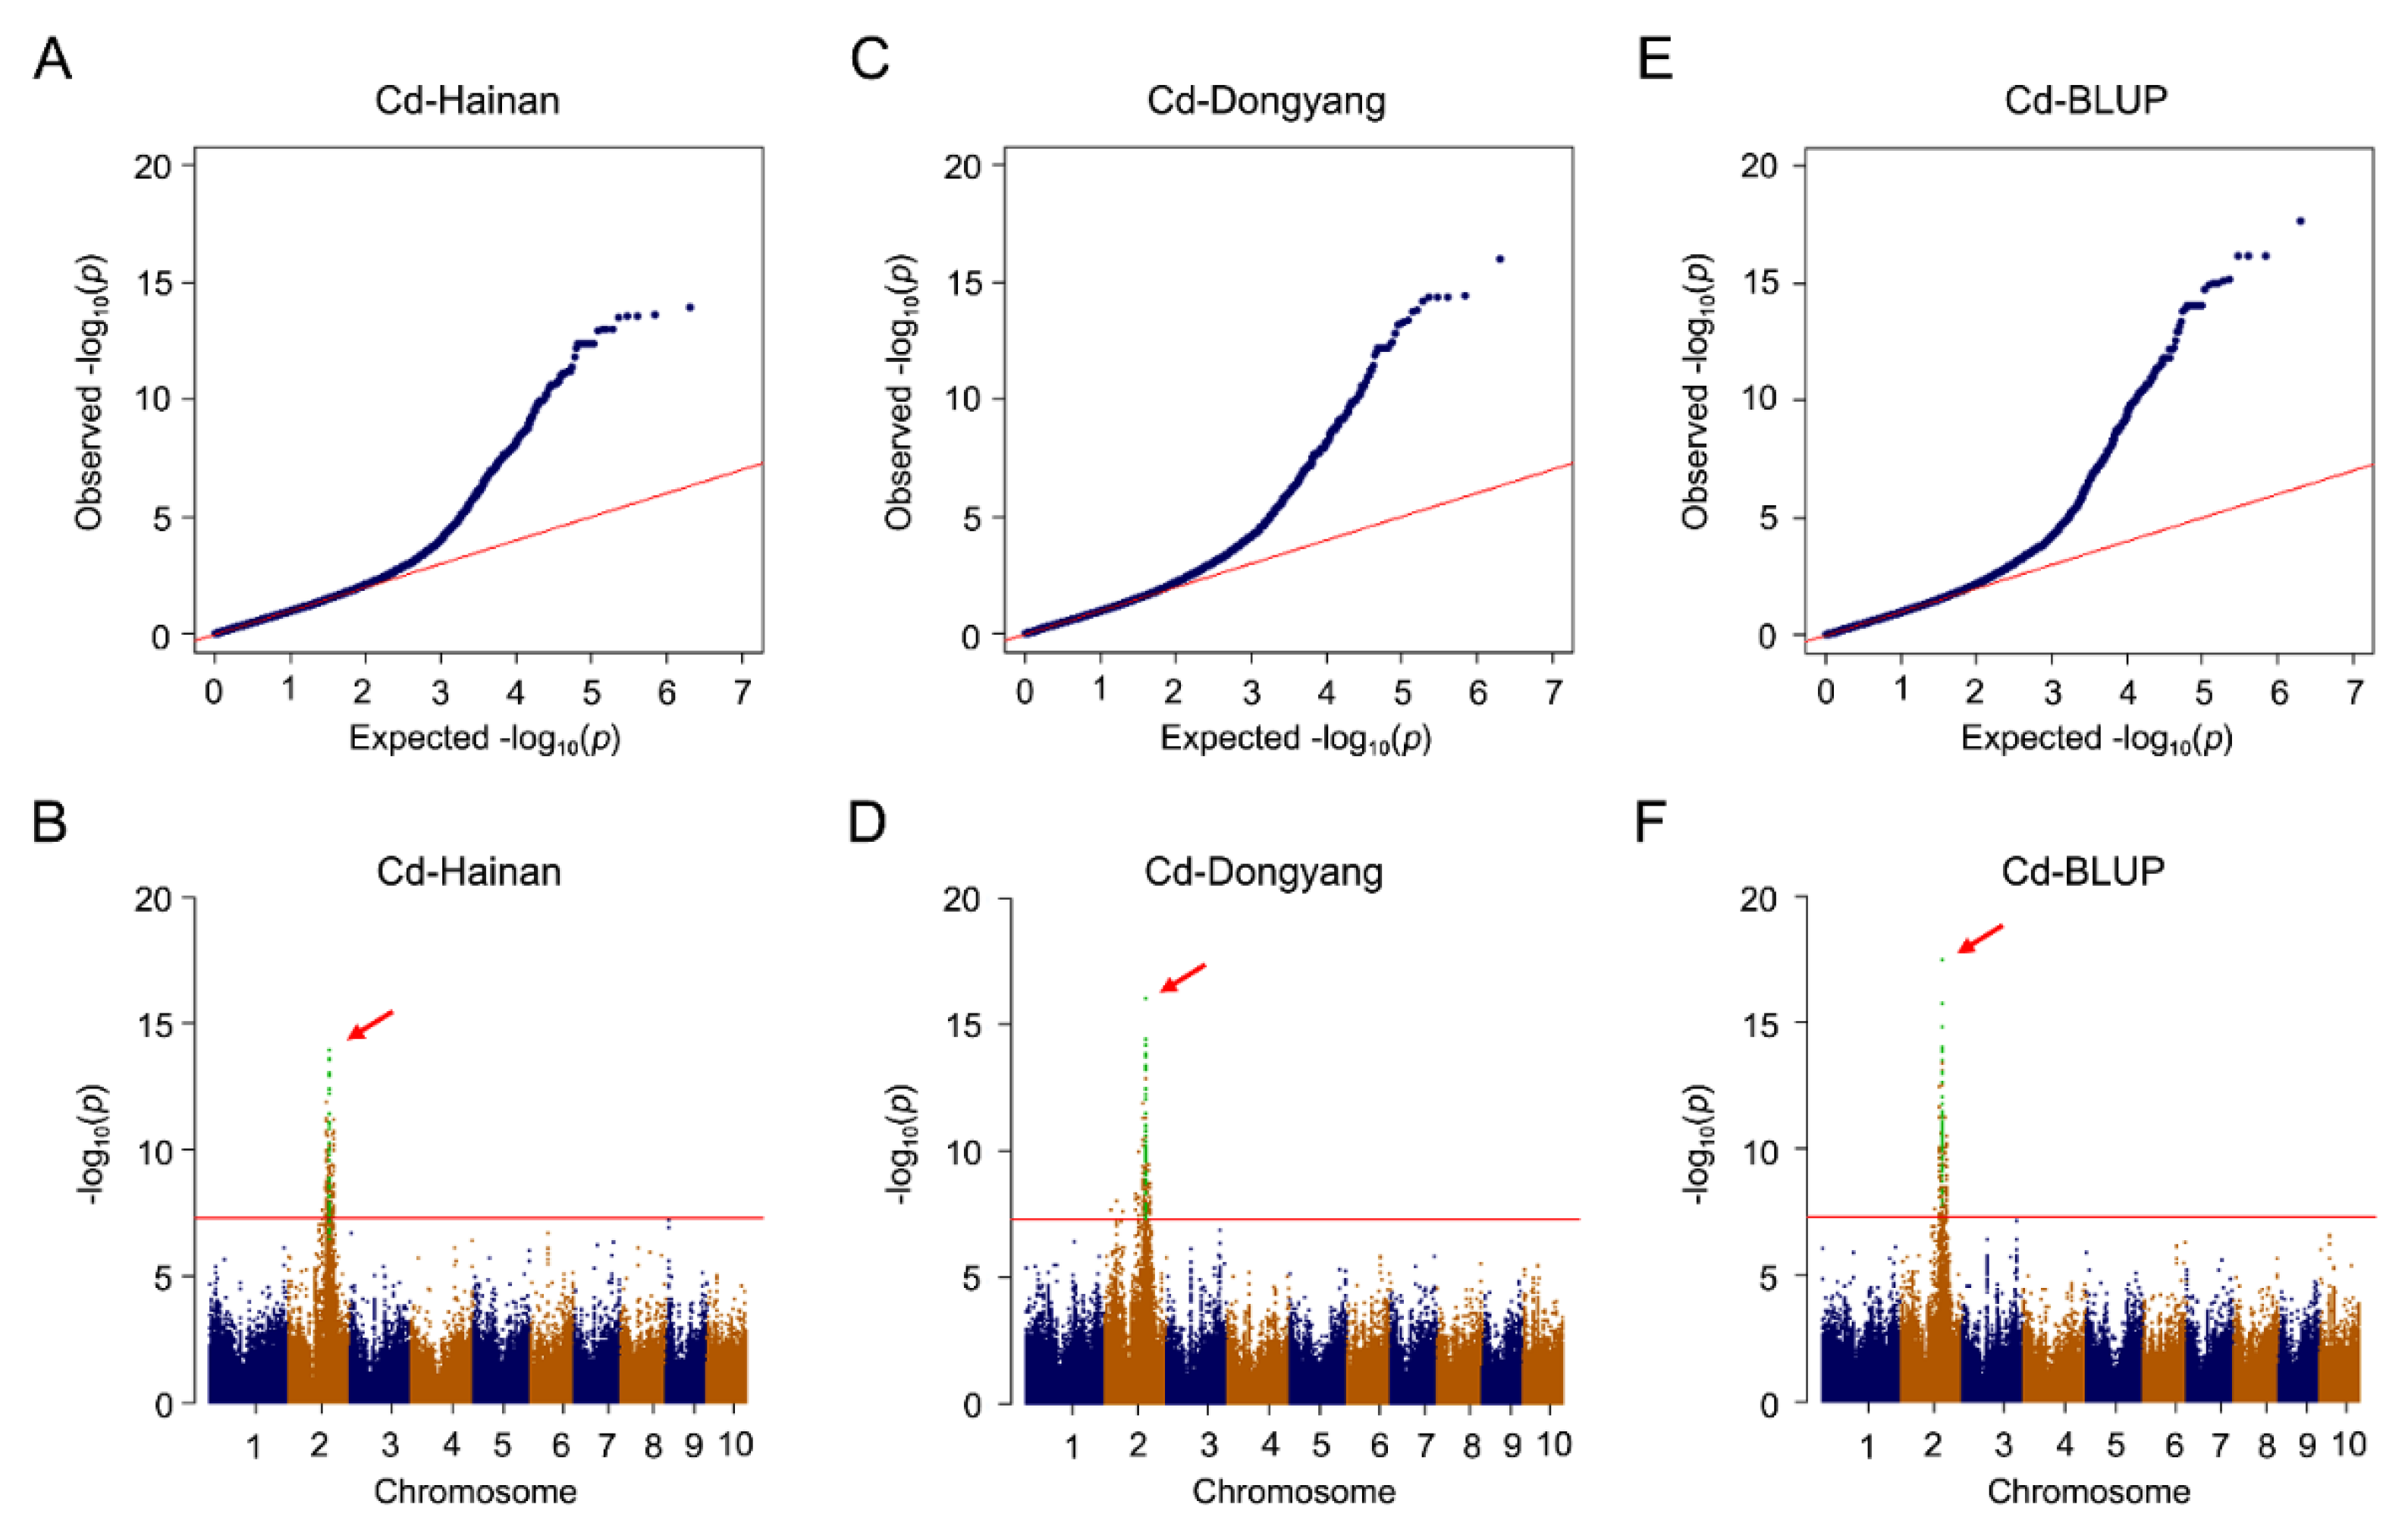
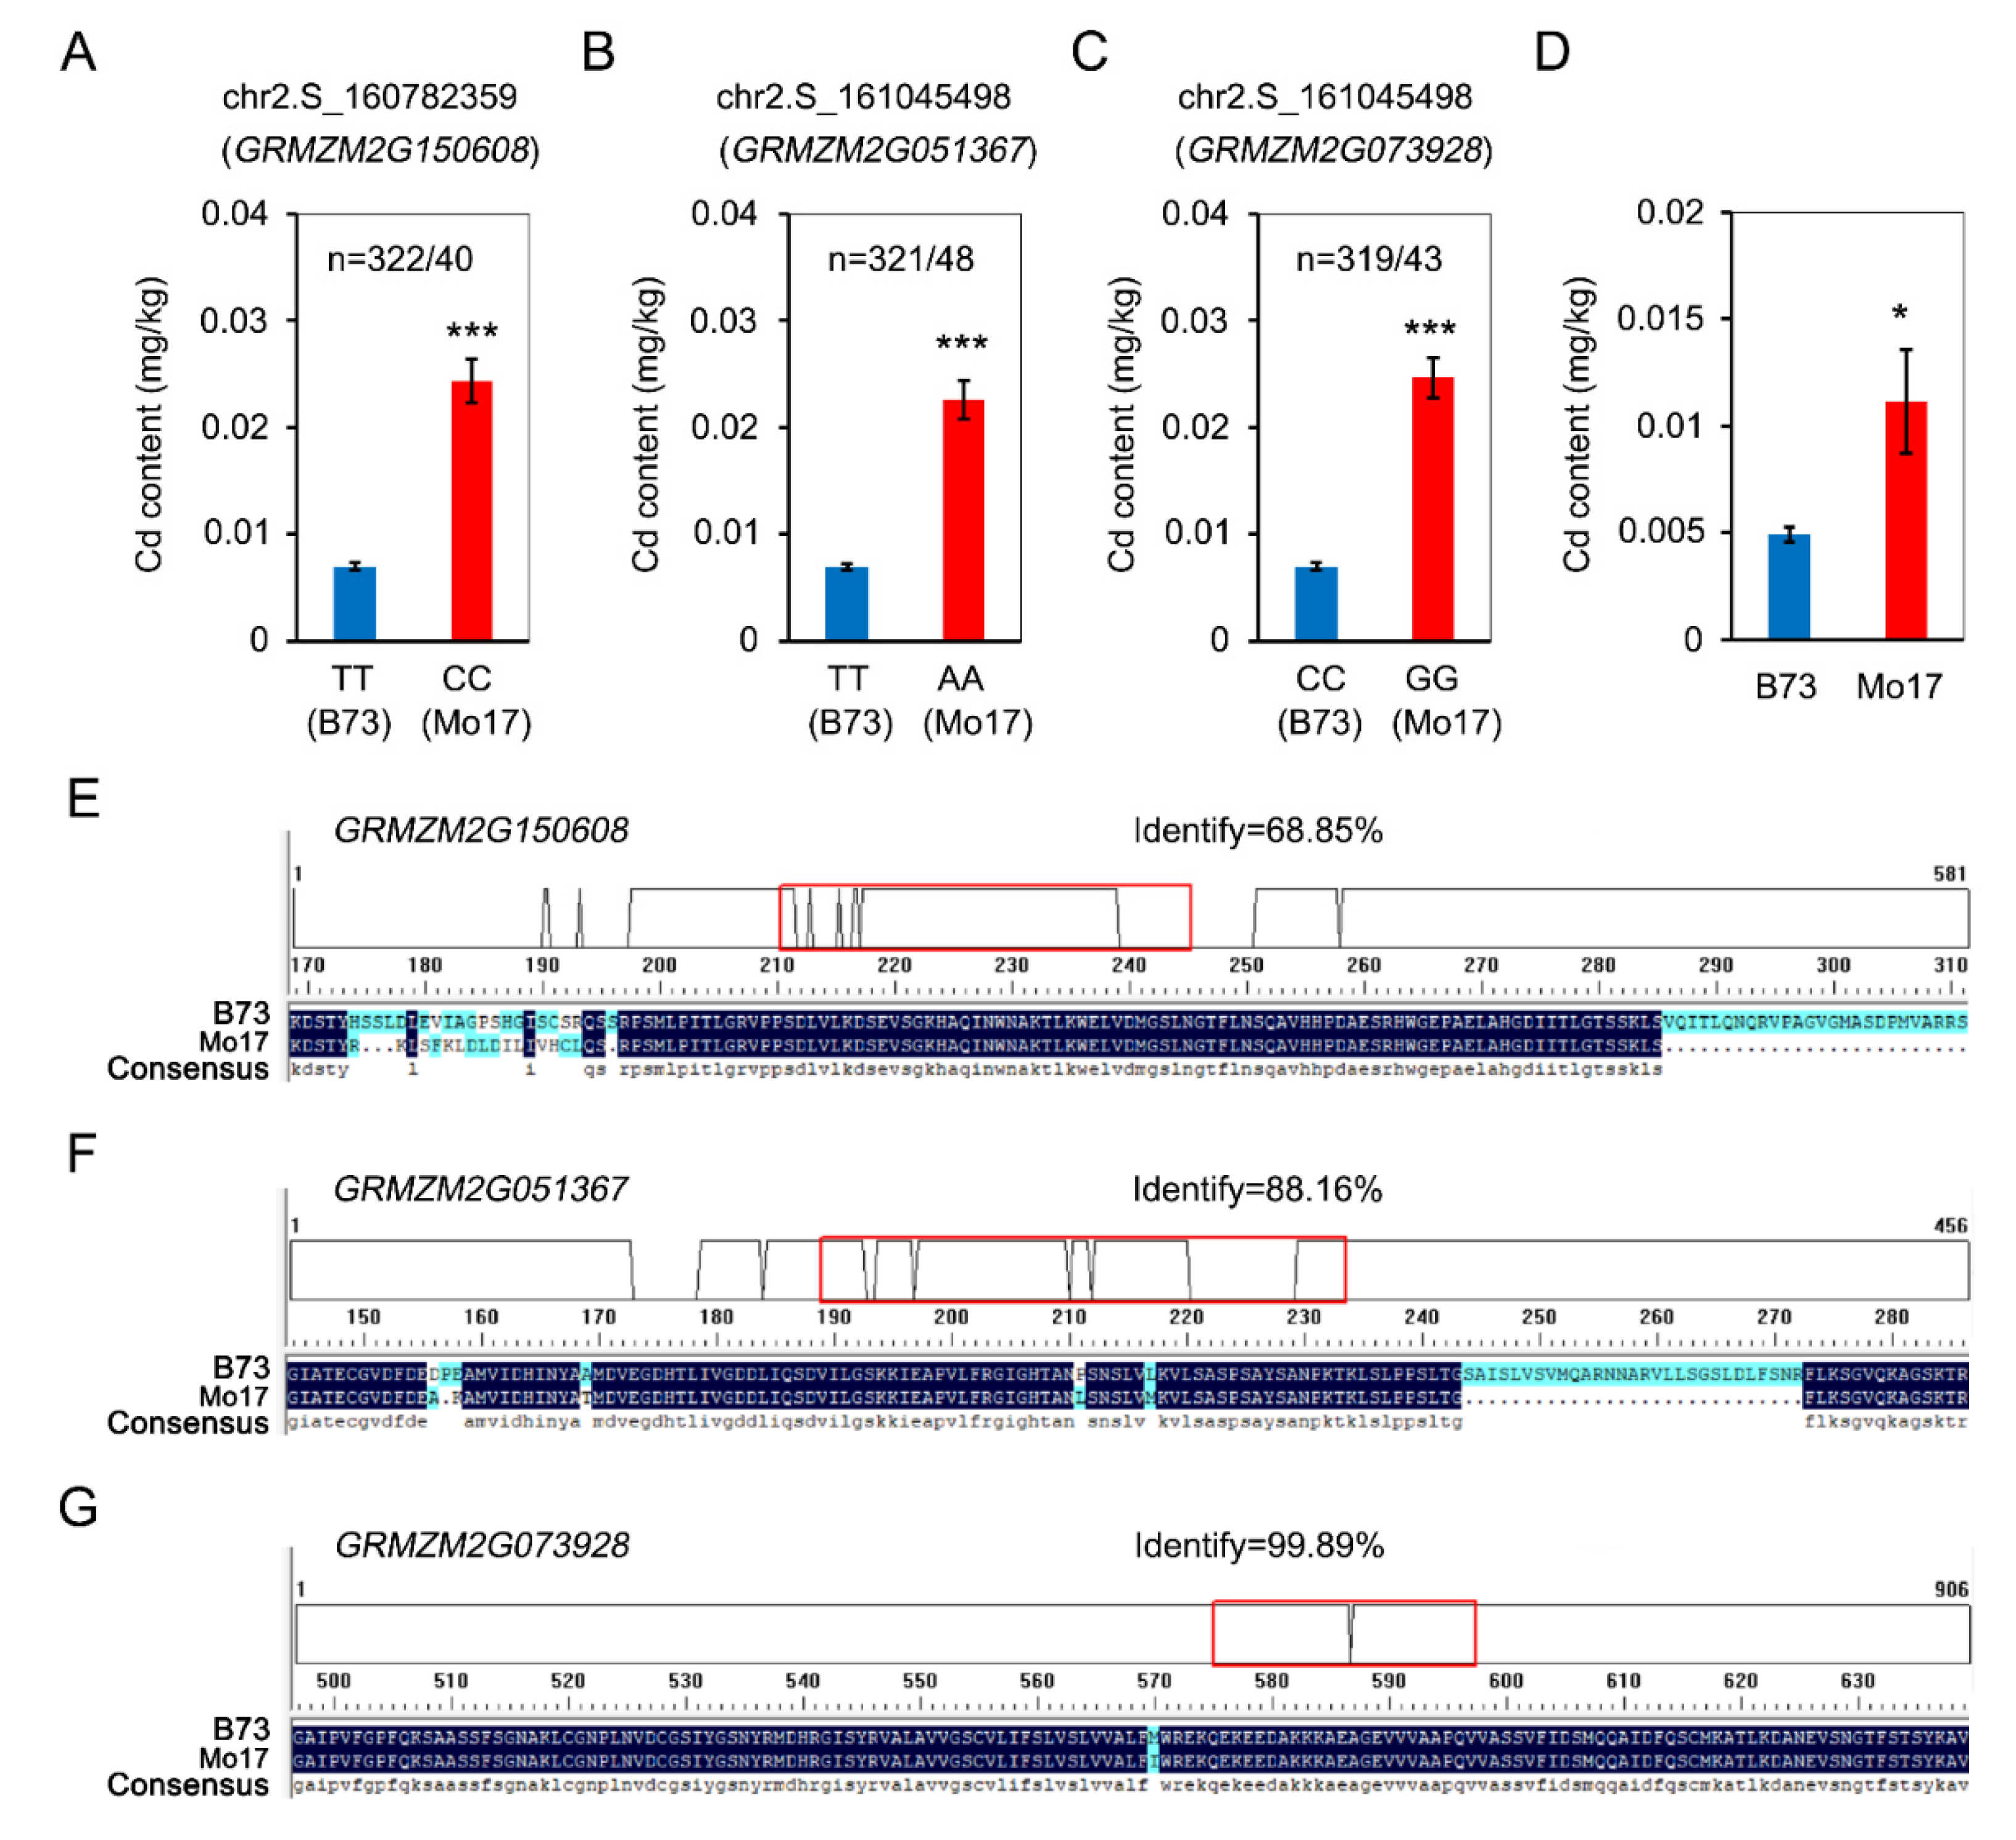
3.3. Identification of Causal Genes of Cd Accumulation

For the accumulation of Cd, the correlated SNPs in Hainan and Dongyang largely overlapped with each other. Furthermore, the Cd contents in three locations were analyzed by BLUP. Genome-wide association was also constructed by Cd-Hainan, Cd-Dongyang and Cd-BLUP (BLUP-based Cd content). At levels of 10−10 (p), 65 overlapped SNPs, which were located at 160773728…161276954 on Chr2, were detected among Cd-Hainan, Cd-Dongyang and Cd-BLUP (Figure 4). Additionally, 28 genes were annotated in this overlapped region (Table 4).
Among all overlapped SNPs, only 10 SNPs were found in the exon of the candidate genes. There were three SNPs located at GRMZM2G051367 and six SNPs located at the exon of GRMZM2G073928 (Table 4). Among them, three SNPs, chr2.S_160782359, chr2.S_161045498 and chr2.S_161273716, with p-values lower than 2 × 10⁻¹⁴ were detected, and distributed in the exon of GRMZM2G150608, GRMZM2G051367 and GRMZM2G073928, respectively. For chr2.S_160782359, the maize inbred lines could be divided into two basic groups concerning allelic effects (TT or CC). The Cd content in the CC haplotype was 3.1fold that of TT (Figure 5A). B73 belonged to TT, while Mo17 belonged to CC. For chr2.S_161045498, the maize inbred could be divided into two groups based on allelic effects (TT or AA). The Cd content in AA was 3.1-fold that of TT (Figure 5B). B73 belonged to TT, while Mo17 belonged to CC. For chr2.S_161273716, the maize inbred could also be divided into two basic groups concerning allelic effects (CC or GG). The Cd content in GG was 3.1-fold that of CC (Figure 5C). B73 belonged to CC, while Mo17 belonged to GG. According to haplotype, B73 was included in the low Cd population, while Mo17 belonged to the high Cd population. Cd content of Mo17 kernel was 2.2-fold that of B73 (Figure 5D). The analysis of the amino sequence showed that there was 68.85% similarity of GRMZM2G150608 between B73 and Mo17, 88.16% similarity of GRMZM2G051367 and 99.89% similarity of GRMZM2G073928 (Figure 5E–G). Additionally, large fragment deletion or replacement of GRMZM2G150608 and GRMZM2G051367 were present in Mo17 compared to B73, while only an amino acid replacement existed between B73 and Mo17 in the sequence of GRMZM2G073928. These results indicate that the differences in sequences of GRMZM2G150608 and GRMZM2G051367 might be responsible for Cd accumulation divergences between B73 and Mo17.

4. Discussion

4.1. Germplasm Resources for Cultivating New Maize Varieties with More Beneficial Trace Elements and Less Harmful Elements

This study presents a highly important way for people to survive by absorbing nutrient elements through staple food, meeting the physiological needs for the supplementation of micronutrients. As the largest planting area crop in the world, maize is the most important medium for transporting trace elements in the food chain [40]. The enrichments of beneficial or toxic trace elements in the food chain directly and indirectly affects people’s health. The application of mineral elements into the soil does not necessarily lead to a significant increase of trace elements’ content in maize stems, leaves and ears [41]. In our study, the accumulation of trace elements in maize kernels was mainly affected by environment and heritability (Table 2), while there was no significant correlation with the content of mineral elements in soil except As. Therefore, some researchers believed that the content of trace elements in the soil is high enough to fully meet the needs of maize growth and development, which led to the results that the content of trace elements in corn will not increase after application of trace elements [42]. Therefore, the enrichment of trace elements in maize kernels mainly depends on the genetic and physiological differences among cultivars.
In the results of the correlation analysis, the contents of Fe, Zn, Mn and Cu were highly correlated with each other, while there was a weak correlation between the content of As and Fe, Zn, Mn and Cu, and there was no correlation between Cd accumulation with other trace elements (Figure 2). This means the absorption of Fe, Zn, Mn and Cu may be regulated by the same pathway, but the accumulation of As and Cd may be independent from these beneficial trace elements. These results made it possible to cultivate high-quality maize varieties with more beneficial elements and less harmful elements. In this study, 19 lines, which had higher contents of Fe, Zn, Cu and Mn and fewer contents of As and Cd, were screened out of 489 maize lines (Supplemental Figure S1 and Table S2). These results will be helpful to cultivate high-quality maize varieties.

4.2. Candidate Genes for Cultivating New High-Quality Maize Varieties with Higher Beneficial Elements and Less Harmful Elements

In the plant, a variety of mineral elements were used in GWAS correlation analysis in one study for the sake of screening overlapped genes that regulated different mineral accumulation. Here, six trace elements were used for GWAS analysis in maize. The contents of Fe, Zn, Cu and Mn were found to be positively correlated with each other in three locations (Figure 2). Five SNPs, which were located on GRMZM2G375197, GRMZM2G384293, GRMZM2G039922 and GRMZM2G034206, were overlapped in GWAS associated results of Fe and Zn (Table 3), while chr5.s_164728663 and chr5.s_164728686, which were all located at GRMZM2G018820, were overlapped by Mn and Fe (Table 3). During correlation analysis of element contents, there was a high correlation between Fe and Zn in Hainan, Dongyang and Xinxiang (Figure 2). Fe and Mn also shared a high correlation in different locations (Figure 2). These results were consistent with the associated SNPs in Table 3. After further analysis, GRMZm2G384293, which was associated with Fe and Zn, was found to encode a NOS1 protein. In Arabidopsis, nos1 showed Al toxicity- and Mg deficiency-insensitive phenotypes [43]. In maize, GRMZm2G384293 (NOS1) may positively regulate the accumulation of Fe and Zn. In Vietnamese rice, GLYCEROPHOSPHORYL DIESTER PHOSPHODIESTERASES (GDPD13) was found by GWAS, associating with phosphate efficiency. Here, GRMZM2G018820, which encodes glycerophosphoryl diester phosphodiesterase1 [44], was linked with the accumulation of Fe and Mn by GWAS analysis (Table 3).
Heavy metal ions in plant leaves will damage plant growth, and the accumulation of heavy metal ions in maize seeds will not only harm plant development but also affect human dietary safety. The CVs of As and Cd varied greatly in different locations, from 7.55% to 37.13% and from 12.52% to 61.71% (Table 2), which indicated that the absorption of As and Cd were largely dependent on the environment. Previously, the function of HMA (heavy metal ATPase), NRAMP and MFS on Cd absorption was reported in Arabidopsis, rice and barley [45,46,47]. In the leaf of maize, a region, 153.75–167.58 Mb on Chr2, was associated with Cd accumulation by GWAS analysis and QTL mapping (Table 4), of which 269 inbred lines and 43,737 SNPs were used for GWAS analysis, while 280 IBM Syn10 populations and 5955 bins for were used QTL analysis [6]. Limited by population size and marker density, the localization interval related to Cd content could not be further narrowed accurately. Recently, 513 inbred lines and 1.25 M SNPs were used for genome-wide association analysis of Cd accumulation in maize grains, and ZmHMA3 and ZmHMA4 were screened and verified to be related to Cd accumulation in grains [48]. ZmHMA3 was also associated with Cd accumulation in maize leaf [49]. In this study, the same population was analyzed for Cd accumulation in maize kernels in Dongyang, Hannan and Xinxiang. Here, we found that chr2.S_158407174 (p = 2.71 × 10⁻¹⁰), chr2.S_158407712 (p = 3.12 × 10⁻¹³), chr2.S_158408660 (p = 4.20 × 10⁻¹⁴) and chr2.S_158410625 (p = 9.07 × 10⁻¹¹) were located at ZmHMA3 (Table S3). In the coding region of ZmHMA4, chr2.S_158388814, Cd associated SNP with p (4.31 × 10⁻¹⁰) was located (Table S3) in our study. In this region, our results were consistent with previous studies. However, it is unclear whether there are other mechanisms involved in Cd absorption, and the regulation mechanism of Cd absorption is still rarely reported. In regions ranging from 160773728 to 161276954 on Chr2, 65 SNPs with p-values lower than 10−10 were associated with Cd content in maize kernels (Table 4), which was not determined by Tang’s study [48]. Among them, three SNPs (chr2.S_160782359, chr2.S_161045498 and chr2.S_161273716) with p-values lower than 2 × 10⁻¹⁴ were linked and were located at the exon of GRMZM2G150608, GRMZM2G051367 and GRMZM2G073928, respectively (Figure 5). The amino acid sequence of GRMZM2G150608 and GRMZM2G051367 only shared 68.85% and 88.16% similarity between B73 and Mo17, in which Cd content was 2.2-fold that of B73 (Figure 5). In Arabidopsis, forkhead-associated domain 2 (FHA2), a plant-specific ISWI subunit, was responsible for stamen development and plant fertility [50,51]. In rice, OsDGL1, encoding a dolichyl-diphosphooligosaccharide-protein glycosyltransferase 48kDa subunit, was involved in N-Glycosylation and root development in rice [52]. The function of FHA and DGL on trace element accumulation was not studied in the plant. In maize, GRMZM2G150608 encodes an FHA transcription factor, while GRMZM2G051367 encodes a dolichyl-diphosphooligosaccharide-protein glycosyltransferase 48kDa subunit. The associated difference in this region between our study and Tang’ report may be attributed to the environmental factors (Tang et al., 2021). In our study, the maize kernels were harvested from different latitudes, Sanya, Hainan (HN, 18°14′ N, 109°31′ E), Dongyang, Zhejiang (DY, 28°59′ N, 120°05′ E) and Xinxiang, Henan (XX, 35°18′ N, 113° 54′ E), while maize grains were collected from similarity latitudes, Zhuzhou (ZZ) (N27°49′50.88″, E113°07′41.23″) and Ningxiang (NX) (N28°16′51.16″, E112°32′47.13″) (Tang et al., 2021). This means that the materials from the diverse environment will be helpful for the excavation of specific loci.

5. Conclusions

In summary, a genetic map with 1.25 M SNPs and 489 inbred lines was used for our genome-wide association study on the accumulation of Fe, Mn, Cu, Zn, Cd and As in maize kernels. In total, 17 SNPs, with which 6 genes were linked, were overlapped by different trace elements. In further analysis, 65 SNPs, with which 28 genes were closely linked, were associated with Cd accumulation. Among these genes, GRMZM2G150608 and GRMZM2G051367 were further analyzed and were found to share 68.85% and 88.16% amino sequence similarity between B73 (with low content of Cd) and Mo17 (with high content of Cd). In addition, 19 lines with higher contents of Fe, Zn, Cu, Mn and fewer contents of As and Cd were screened from GWAS-associated populations. All these will lay a foundation for revealing the molecular mechanism of trace element accumulation and provide candidate genes and germplasm for breeding new maize varieties with high nutritional quality in maize.

Supplementary Materials

The following supporting information can be downloaded at: www.mdpi.com/article/10.3390/agriculture12020262/s1, Figure S1: Overlapped lines between lines with higher contents of Fe, Zn, Cu, Mn and lines with lower contents of As and Cd.; Table S1: The BLUP-based content (mg/kg) of Fe, Zn, Cu, Mn, As, Cd in Hainan, Dongyang and Xinxiang.; Table S2: The maize inbred with higher contents of Fe, Zn, Cu, Mn and less content of As and Cd.; Table S3: SNPs associated with Cd accumulation in maize kernel, of which the p-value was less than 10−8.; Table S4: Correlation of the contents of Fe, Zn, Cu, Mn, As and Cd in maize kernel compared to soil.

Author Contributions

Conceptualization, F.Z. and Z.H.; formal analysis and visualization, Q.H.; investigation, F.Z., N.W. and F.B.; writing—original draft preparation, B.C.; writing—review and editing, L.J., G.W., G.Z. and Z.H. All authors have read and agreed to the published version of the manuscript.

Funding

This research was funded by the Zhejiang Science and Technology Major Program on Agricultural New Variety Breeding (Grant No 2021C02064-4), China Agriculture Research System of MOF and MARA (Grant No. CARS-02-82) and Zhejiang Provincial Key Research & Development Plan of China (Grant No 2020C02001).

Institutional Review Board Statement

Not applicable.

Informed Consent Statement

Not applicable.

Data Availability Statement

The data presented in this research are available on request from the corresponding author.

Acknowledgments

We acknowledge Jianbing Yan provided the plant materials used in this study.

Conflicts of Interest

The authors declare no conflict of interest.

References

  1. Zimmermann, M.B.; Hurrell, R.F. Improving iron, zinc and vitamin A nutrition through plant biotechnology. Curr. Opin. Biotechnol. 2002, 13, 142–145. [Google Scholar] [CrossRef]
  2. Godt, J.; Scheidig, F.; Grosse-Siestrup, C.; Esche, V.; Brandenburg, P.; Reich, A.; Groneberg, D.A. The toxicity of cadmium and resulting hazards for human health. J. Occup. Med. Toxicol. 2019, 1, 22. [Google Scholar] [CrossRef] [PubMed] [Green Version]
  3. Diepenbrock, C.H.; Gore, M.A. Closing the Divide between Human Nutrition and Plant Breeding. Crop Sci. 2015, 55, 1437–1448. [Google Scholar] [CrossRef]
  4. Wagner, G. Accumulation of Cadmium in Crop Plants And Its Consequences to Human Health. Adv. Agron. 1993, 51, 173–212. [Google Scholar]
  5. Feng, L.; Yan, H.; Dai, C.; Xu, W.; Gu, F.; Zhang, F.; Li, T.; Xian, J.; He, X.; Yu, Y.; et al. The systematic exploration of cadmium-accumulation characteristics of maize kernel in acidic soil with different pollution levels in China. Sci. Total Environ. 2020, 729, 138972. [Google Scholar] [CrossRef]
  6. Zhao, X.; Luo, L.; Cao, Y.; Liu, Y.; Li, Y.; Wu, W.; Lan, Y.; Jiang, Y.; Gao, S.; Zhang, Z.; et al. Genome-wide association analysis and QTL mapping reveal the genetic control of cadmium accumulation in maize leaf. BMC Genom. 2018, 19, 91. [Google Scholar] [CrossRef] [Green Version]
  7. Huang, Y.; Wang, L.; Wang, W.; Li, T.; He, Z.; Yang, X. Current status of agricultural soil pollution by heavy metals in China: A meta-analysis. Sci. Total Environ. 2019, 651, 3034–3042. [Google Scholar] [CrossRef]
  8. Du, C.; Zhang, N.; Baokun, L.; Anqiang, C.; Yanting, M.; Wanli, H.; Bin, F.; Zhengxiang, Y.; Jun, C. Selection of varieties of Zea mays with low accumulation of heavy metals of arsenic, lead and cadmium. Southwest China J. Agric. Sci. 2017, 30, 5–10. [Google Scholar]
  9. Ohmori, Y.; Sotta, N.; Fujiwara, T. Identification of introgression lines of Oryza glaberrima Steud. with high mineral content in grains. Soil Sci. Plant Nutr. 2016, 62, 456–464. [Google Scholar] [CrossRef] [Green Version]
  10. Mahender, A.; Anandan, A.; Pradhan, S.K.; Pandit, E. Rice grain nutritional traits and their enhancement using relevant genes and QTLs through advanced approaches. SpringerPlus 2016, 5, 2086. [Google Scholar] [CrossRef] [Green Version]
  11. Zhang, M.; Pinson, S.R.; Tarpley, L.; Huang, X.Y.; Lahner, B.; Yakubova, E.; Baxter, I.; Guerinot, M.L.; Salt, D.E. Mapping and validation of quantitative trait loci associated with concentrations of 16 elements in unmilled rice grain. Theor. Appl. Genet. 2014, 127, 137–165. [Google Scholar] [CrossRef] [PubMed] [Green Version]
  12. Du, J.; Zeng, D.; Wang, B.; Qian, Q.; Zheng, S.; Ling, H.Q. Environmental effects on mineral accumulation in rice grains and identification of ecological specific QTLs. Environ. Geochem. Health 2013, 35, 161–170. [Google Scholar] [CrossRef] [PubMed]
  13. Norton, G.J.; Duan, G.L.; Lei, M.; Zhu, Y.G.; Meharg, A.A.; Price, A.H. Identification of quantitative trait loci for rice grain element composition on an arsenic impacted soil: Influence of flowering time on genetic loci. Ann. Appl. Biol. 2012, 161, 46–56. [Google Scholar] [CrossRef]
  14. Lu, K.; Li, L.; Zheng, X.; Zhang, Z.; Mou, T.; Hu, Z. Quantitative trait loci controlling Cu, Ca, Zn, Mn and Fe content in rice grains. J. Genet. 2008, 87, 305–310. [Google Scholar] [CrossRef] [PubMed]
  15. Hindu, V.; Palacios-Rojas, N.; Babu, R.; Suwarno, W.B.; Rashid, Z.; Usha, R.; Saykhedkar, G.R.; Nair, S.K. Identification and validation of genomic regions influencing kernel zinc and iron in maize. Appl. Genet. 2018, 131, 1443–1457. [Google Scholar] [CrossRef] [Green Version]
  16. Jin, T.; Chen, J.; Zhu, L.; Zhao, Y.; Guo, J.; Huang, Y. Comparative mapping combined with homology-based cloning of the rice genome reveals candidate genes for grain zinc and iron concentration in maize. BMC Genet. 2015, 16, 17. [Google Scholar] [CrossRef] [Green Version]
  17. Benke, A.; Urbany, C.; Marsian, J.; Shi, R.; Wiren, N.; Stich, B. The genetic basis of natural variation for iron homeostasis in the maize IBM population. BMC Plant Biol. 2014, 14, 12. [Google Scholar] [CrossRef] [Green Version]
  18. Jin, T.; Zhou, J.; Chen, J.; Zhu, L.; Zhao, Y.; Huang, Y. The genetic architecture of zinc and iron content in maize grains as revealed by QTL mapping and meta-analysis. Breed. Sci. 2013, 63, 317–324. [Google Scholar] [CrossRef] [Green Version]
  19. Qin, H.; Cai, Y.; Liu, Z.; Wang, G.; Wang, J.; Guo, Y.; Wang, H. Identification of QTL for zinc and iron concentration in maize kernel and cob. Euphytica 2012, 187, 345–358. [Google Scholar] [CrossRef]
  20. Lung’aho, M.G.; Mwaniki, A.M.; Szalma, S.J.; Hart, J.J.; Rutzke, M.A.; Kochian, L.V.; Glahn, R.P.; Hoekenga, O.A. Genetic and physiological analysis of iron biofortification in maize kernels. PLoS ONE 2011, 6, e20429. [Google Scholar] [CrossRef] [Green Version]
  21. Zhou, J.; Huang, Y.; Liu, Z.; Chen, J.; Zhu, L.; Song, Z.; Zhao, Y. Genetic analysis and QTL mapping of zinc, iron, copper and manganese contents in maize seed. J. Plant Genet. Resour. 2010, 11, 593–595. [Google Scholar]
  22. Zdunic, Z.; Grljusic, S.; Ledencan, T.; Duvnjak, T.; Simic, D. Quantitative trait loci mapping of metal concentrations in leaves of the maize IBM population. Hereditas 2014, 151, 55–60. [Google Scholar] [CrossRef] [PubMed]
  23. Ren, Z.H.; Gao, J.P.; Li, L.G.; Cai, X.L.; Huang, W.; Chao, D.Y.; Zhu, M.Z.; Wang, Z.Y.; Luan, S.; Lin, H.X. A rice quantitative trait locus for salt tolerance encodes a sodium transporter. Nat. Genet. 2005, 37, 1141–1146. [Google Scholar] [CrossRef]
  24. Ueno, D.; Yamaji, N.; Kono, I.; Chao, F.H.; Ando, T.; Yano, M.; Jian, F.M. Gene limiting cadmium accumulation in rice. Proc. Natl. Acad. Sci. USA 2010, 107, 16500–16505. [Google Scholar] [CrossRef] [PubMed] [Green Version]
  25. Miyadate, H.; Adachi, S.; Hiraizumi, A.; Tezuka, K.; Nakazawa, N.; Kawamoto, T.; Katou, K.; Kodama, I.; Sakurai, K.; Takahashi, H. OsHMA3, a P1B-type of ATPase affects root-to-shoot cadmium translocation in rice by mediating efflux into vacuoles. New Phytol. 2011, 189, 190–199. [Google Scholar] [CrossRef]
  26. Hu, B.; Wang, W.; Ou, S.; Tang, J.; Li, H.; Che, R.; Zhang, Z.; Chai, X.; Wang, H.; Wang, Y. Variation in NRT1.1B contributes to nitrate-use divergence between rice subspecies. Nat. Genet. 2015, 47, 834–838. [Google Scholar] [CrossRef]
  27. Huang, X.; Han, B. Natural variations and genome-wide association studies in crop plants. Annu. Rev. Plant Biol. 2014, 65, 531–551. [Google Scholar] [CrossRef]
  28. Yan, J.; Warburton, M.; Crouch, J. Association mapping for enhancing maize (Zea mays L.) genetic improvement. Crop Sci. 2011, 51, 433–449. [Google Scholar] [CrossRef]
  29. Chao, D.Y.; Chen, Y.; Chen, J.; Shi, S.; Chen, Z.; Wang, C.; Danku, J.M.; Zhao, F.J.; Salt, D.E.; Maloof, J.N. Genome-wide Association Mapping Identifies a New Arsenate Reductase Enzyme Critical for Limiting Arsenic Accumulation in Plants. PLoS Biol. 2014, 12, e1002009. [Google Scholar] [CrossRef] [Green Version]
  30. Chao, D.Y.; Silva, A.; Baxter, I.; Huang, Y.S.; Nordborg, M.; Danku, J.; Lahner, B.; Yakubova, E.; Salt, D.E.; Bomblies, K. Genome-Wide Association Studies Identify Heavy Metal ATPase3 as the Primary Determinant of Natural Variation in Leaf Cadmium in Arabidopsis thaliana. PLoS Genet. 2012, 8, e1002923. [Google Scholar] [CrossRef] [Green Version]
  31. Shen, X.; Pettersson, M.; Rönnegård, L.; Carlborg, Ö.; Barsh, G.S. Inheritance Beyond Plain Heritability: Variance-Controlling Genes in Arabidopsis thaliana. PLoS Genet. 2012, 8, e1002839. [Google Scholar] [CrossRef] [PubMed] [Green Version]
  32. Forsberg, S.; Andreatta, M.E.; Huang, X.Y.; Danku, J.; Salt, D.; Carlborg, Ö. The multi-allelic genetic architecture of a variance-heterogeneity locus for molybdenum concentration in leaves acts as a source of unexplained additive genetic variance. PLoS Genet. 2015, 11, e1005648. [Google Scholar] [CrossRef] [PubMed] [Green Version]
  33. Norton, G.J.; Douglas, A.; Lahner, B.; Yakubova, E.; Price, A.H. Genome wide association mapping of grain arsenic, copper, molybdenum and zinc in rice (Oryza sativa L.) grown at four international field sites. PLoS ONE 2014, 9, e89685. [Google Scholar] [CrossRef] [Green Version]
  34. Nawaz, Z.; Kakar, K.U.; Li, X.B.; Li, S.; Zhang, B.; Shou, H.-X.; Shu, Q.-Y. Genome-wide Association Mapping of Quantitative Trait Loci (QTLs) for Contents of Eight Elements in Brown Rice (Oryza sativa L.). J. Agric. Food Chem. 2015, 63, 8008–8016. [Google Scholar] [CrossRef] [PubMed]
  35. Yang, M.; Lu, K.; Zhao, F.J.; Xie, W.B.; Ramakrishna, P.; Wang, G.Y.; Du, Q.Q.; Liang, L.M.; Sun, C.J.; Zhao, H.; et al. Genome-Wide Association Studies Reveal the Genetic Basis of Ionomic Variation in Rice. Plant Cell 2018, 30, 2720–2740. [Google Scholar] [CrossRef] [PubMed] [Green Version]
  36. Yang, N.; Lu, Y.; Yang, X.; Huang, J.; Zhou, Y.; Ali, F.; Wen, W.; Liu, J.; Li, J.; Yan, J. Genome wide association studies using a new nonparametric model reveal the genetic architecture of 17 agronomic traits in an enlarged maize association panel. PLoS Genet. 2014, 10, e1004573. [Google Scholar] [CrossRef] [Green Version]
  37. Holland, J.B.; Nyquist, W.E.; Cervantes-Martínez, C.T. Estimating and Interpreting Heritability for Plant Breeding: An Update; John Wiley&Sons, Inc.: Oxford, UK, 2010; pp. 9–112. [Google Scholar]
  38. Liu, H.J.; Luo, X.; Niu, L.Y.; Xiao, Y.J.; Chen, L.; Liu, J.; Wang, X.Q.; Jin, M.L.; Li, W.Q.; Zhang, Q.H.; et al. Distant eQTLs and Non-coding Sequences Play Critical Roles in Regulating Gene Expression and Quantitative Trait Variation in Maize. Mol. Plant 2017, 10, 414–426. [Google Scholar] [CrossRef] [Green Version]
  39. Bradbury, P.J.; Zhang, Z.; Kroon, D.E.; Casstevens, T.M.; Ramdoss, Y.; Buckler, E.S. TASSEL: Software for association mapping of complex traits in diverse samples. Bioinformatics 2007, 23, 2633–2635. [Google Scholar] [CrossRef]
  40. Cao, L.; Lin, C.; Gao, Y.; Sun, C.; Zhang, Z. Health risk assessment of trace elements exposure through the soil-plant (maize)-human contamination pathway near a petrochemical industry complex, Northeast China. Environ. Pollut. 2020, 263, 114414. [Google Scholar] [CrossRef]
  41. Lv, W.; Meng, Y. Effect of microelement fertilizers on maize in calcareous region. Guangxi Agric. Sci. 2006, 37, 419–421. [Google Scholar]
  42. Li, D.; Sun, Z.; Wang, Y.; Li, T.; Xue, S.; Wang, X. Effect of NPK and microelement fertilizers on nutrient accumulation, distribution and yield of maize on high-fertility soil. Soil Fertil. Sci. China 2009, 6, 32–36. [Google Scholar]
  43. Li, D.; Ma, W.; Wei, J.; Mao, Y.; Chen, Q. Magnesium promotes root growth and increases aluminum tolerance via modulation of nitric oxide production in Arabidopsis. Plant Soil 2019, 457, 83–95. [Google Scholar] [CrossRef]
  44. Mai, N.; To, H. A genome-wide association study reveals the quantitative trait locus and candidate genes that regulate phosphate efficiency in a Vietnamese rice collection. Physiol. Mol. Biol. Plants 2020, 26, 2267–2281. [Google Scholar]
  45. Chong, K.; Cobbett, C.S. HMA P-type ATPases are the major mechanism for root-to-shoot Cd translocation in Arabidopsis thaliana. New Phytol. 2010, 181, 71–78. [Google Scholar]
  46. Wu, D.; Yamaji, N.; Yamane, M.; Kashino-Fujii, M.; Sato, K.; Ma, J.F. The HvNramp5 transporter mediates uptake of cadmium and manganese, but not iron. Plant Physiol. 2016, 172, 1899–1910. [Google Scholar] [CrossRef] [Green Version]
  47. Yan, H.; Xu, W.; Xie, J.; Gao, Y.; He, Z. Variation of a major facilitator superfamily gene contributes to differential cadmium accumulation between rice subspecies. Nat. Commun. 2019, 10, 2562. [Google Scholar] [CrossRef] [Green Version]
  48. Tang, B.; Luo, M.; Zhang, Y.; Guo, H.; Li, J.; Song, W.; Zhang, R.; Feng, Z.; Kong, M.; Li, H.; et al. Natural variations in the P-type ATPase heavy metal transporter gene ZmHMA3 control cadmium accumulation in maize grains. J. Exp. Bot. 2021, 72, 6230–6246. [Google Scholar] [CrossRef]
  49. Cao, Y.; Zhao, X.; Liu, Y.; Wang, Y.; Wu, W.; Jiang, Y.; Liao, C.; Xu, X.; Gao, S.; Shen, Y.; et al. Genome-wide identification of ZmHMAs and association of natural variation in ZmHMA2 and ZmHMA3 with leaf cadmium accumulation in maize. PeerJ 2019, 7, e7877. [Google Scholar] [CrossRef] [Green Version]
  50. Gu, B.W.; Tan, L.M.; Zhang, C.J.; Hou, X.M.; Cai, X.W.; Chen, S.; He, X.J. FHA2 is a plant-specific ISWI subunit responsible for stamen development and plant fertility. J. Integr. Plant Biol. 2020, 62, 1703–1716. [Google Scholar] [CrossRef]
  51. Ahn, E.R.; Cho, H.K.; Pai, H.S. The forkhead-associated domain 2 (FHA2) in Arabidopsis plays a role in plant fertility by regulating stamen development. Planta 2013, 237, 1015–1023. [Google Scholar] [CrossRef]
  52. Cheng, Q.; Li, Y.; Jian, G.; Wang, W.; Zhang, H.; Yu, L.; Ping, W. OsDGL1, a homolog of an oligosaccharyltransferase complex subunit, is involved in N-glycosylation and root development in rice. Plant Cell Physiol. 2013, 54, 129–137. [Google Scholar]
Figure 1. Contents of Fe, Zn, Cu, Mn, As and Cd in maize kernel in Hainan (HN), Dongyang (DY) and Xinxiang (XX).
Agriculture 12 00262 g001
Figure 2. Frequency distributions and phenotypic correlations of Fe, Zn, Cu, Mn, As and Cd. (A) Hainan; (B) Dongyang; (C) Xinxiang. The Performance Analytics package in R software was used to calculate the correlation of traits in each location. Asterisk represents a significant difference. * p < 0.05, ** p < 0.01, *** p < 0.001 (Student’s t-test).
Agriculture 12 00262 g002
Figure 3. Manhattan plots on ten maize chromosomes for six traits in three locations. (A) Fe; (B) Zn; (C) Cu; (D) Mn; (E) As; (F) Cd. The circle from inside to outside represents HN, DY, XX and marker density. The red dotted line and black line indicate the significance at p = 10−4 and p = 10−5 level, respectively. The outermost circle shows the SNPs density on the 10 chromosomes. The marker density was shown in the color legend on the right side of the figure.
Agriculture 12 00262 g003
Figure 4. Presentation of a few highly reproducible and significant Q–Q Plots and Manhattan for Cd. (A) Quantile–quantile (Q–Q) plots showing inflation of estimated −log10 (p) values versus observed for traits Cd in Hainan using Q + K (MLM). Q represent 31 principal components (fixed), K represents a kinship matrix (random), GLM represents the general linear model, MLM represents the mixed linear model. (B) Manhattan plot from the Q + K (MLM) model for Cd in Hainan, plotted with the individual SNPs of all chromosomes on the X-axis and −log10 (p-value) of each SNP in the Y-axis. The different colors indicate the 10 chromosomes of maize. The red horizontal line shows the multiple testing threshold −log10 (p-value) of 7.4 for this panel. The SNPs located within the candidate genes, as identified by the GWAS of the whole population, are labeled as green dots. (C) Q–Q plots for GWAS of traits Cd in Dongyang. (D) Manhattan plot for GWAS of traits Cd. (E) Q–Q plots for GWAS of traits Cd-BLUP. Cd-BLUP represents the best linear unbiased prediction of Cd in Hainan, Dongyang and Xinxiang. (F) Manhattan plot for GWAS of traits Cd-BLUP.
Agriculture 12 00262 g004
Figure 5. Phenotype analysis between the candidate genes for locus associated with Cd concentration in maize and phenotypic difference between different alleles. The number above the box represents the number of inbred lines homozygous for a determined allelic variant. (AC) Two combinations of the minor and major between chr2.S_160782359 (A), chr2.S_161045498 (B) and chr2.S_161273716 (C) in GRMZM2G150608, GRMZM2G051367 and GRMZM2G073928 region. B73 represent allele in B73; Mo17 represent allele in Mo17. Asterisk represents significant difference. *** p < 0.001 (Student’s t-test). (D) Cd content in B73 or Mo17. Asterisk represents significant difference. * p < 0.05 (Student’s t-test). (EG) Amino sequence comparison of GRMZM2G150608, GRMZM2G051367 and GRMZM2G073928 between B73 and Mo17.
Agriculture 12 00262 g005
Table 1. The contents of Fe, Zn, Mn, Cu, As and Cd in the soil of Hainan, Dongyang and Xinxiang.
Fe (mg/kg)Zn (mg/kg)Cu (mg/kg)Mn (mg/kg)As (mg/kg)Cd (mg/kg)
HN3706.79 ± 301.22 b29.96 ± 3.49 b8.16 ± 1.61 b125.11 ± 7.55 c5.2 ± 0.70 c0.02 ± 0.01 c
DY14760.52 ± 182.45 a65.17 ± 2.41 a24.74 ± 0.19 a146.70 ± 2.89 b19.4 ± 0.35 a0.31 ± 0.01 a
XX33428.20 ± 562.40 b70.27 ± 4.15 a24.51 ± 0.12 a614.41 ± 12.09 a11.88 ± 0.37 b0.26 ± 0.01 b
The numbers in the table represented the average content (mg/kg) of each trace element of all inbred lines planted in different locations. HN: Hainan; DY: Dongyang; XX: Xinxiang. Different letters represent significant differences between samples.
Table 2. Heritability and contents of Fe, Zn, Cu, Mn, As and Cd in maize kernel in three locations.
TraitLocationHeritabilityMean aRangeCV (%)
FeHN0.9822.91 a11.74–45.475.41
DY0.9524.54 b15.32–41.045.74
XX0.8921.16 a14.09–38.897.58
ZnHN0.9832.66 b11.55–64.795.24
DY0.9836.38 c18.08–64.984.67
XX0.9422.31 a16.33–57.016.47
CuHN0.873.08 c0.83–10.4025.93
DY0.942.29 b0.61–6.7814.32
XX0.941.58 a0.45–6.7816.18
MnHN0.9911.00 c3.06–32.194.68
DY0.997.23 b3.37–20.933.75
XX0.995.08 a2.09–14.764.23
AsHN0.950.13 b0.10–1.2037.13
DY0.960.02 a0.0037–0.06114.55
XX0.980.01 a0.0031–0.057.55
CdHN0.878.59 × 103 a0–0.06861.71
DY0.981.21 × 102 b0.0012–0.1628.34
XX0.997.20 × 103 ab0.001–0.08312.52
a Different lowercase letters denote significant differences (p < 0.05, Tukey’s test).
Table 3. Functions of the SNPs located genes associated with at least two trace elements.
SNPGene IDAssociated Trace ElementAnnotation
chr2.s_121584444GRMZM2G076905Zn Cduncharacterized
chr3.s_28354214GRMZM2G375197Zn Feuncharacterized
chr4.s_38571269GRMZM2G123257Cd FeS-adenosyl-L-methionine-dependent methyltransferase superfamily protein
chr4.s_38571275GRMZM2G123257Cd FeS-adenosyl-L-methionine-dependent methyltransferase superfamily protein
chr4.s_38571287GRMZM2G123257Cd FeS-adenosyl-L-methionine-dependent methyltransferase superfamily protein
chr4.s_38571537GRMZM2G123257Cd FeS-adenosyl-L-methionine-dependent methyltransferase superfamily protein
chr4.s_240465668GRMZM2G384293Zn Feembryo defective 14
chr4.s_240465753GRMZM2G384293Zn Feembryo defective 14
chr5.s_164728663GRMZM2G018820Mn Feglycerophosphoryl phosphodiesterase
chr5.s_164728686GRMZM2G018820Mn Feglycerophosphoryldiester phosphodiesterase
chr7.s_4960091GRMZM2G039922Zn Feuncharacterized
chr10.s_110087144GRMZM2G034206Zn FeBeta-13-N-Acetylglucosaminyltransferase family protein
Gene functions were annotated by NCBI. A noncoding region in the table meant the SNP was not located within the coding region.
Table 4. The candidate genes included in the region detected by genome-wide association study.
Gene IDChrStartEndAnnotation
GRMZM2G150608Chr2160781682160789474fha7—FHA-transcription factor 7
GRMZM2G150754Chr2160797324160805739(MED33A, RFR1) REF4-related 1
GRMZM2G171370Chr2160956979160963086bzip86—bZIP-transcription factor 86
GRMZM2G100005Chr2161016548161017635Ribosomal protein S4 (RPS4A) family protein
GRMZM2G051367Chr2161045370161050327(DGL1) dolichyl-diphosphooligosaccharide-protein glycosyltransferase
GRMZM2G018241Chr2161123950161130108cesa9—cellulose synthase9
GRMZM2G319836Chr2161128260161129517cesa9—cellulose synthase9
GRMZM2G150404Chr2161135362161138301cesa9—cellulose synthase9
GRMZM2G452739Chr2161136453161137710cesa9—cellulose synthase9
GRMZM2G165133Chr2161197745161199034(FQR1) flavodoxin-like quinone reductase 1
GRMZM2G073928Chr2161273580161276954Leucine-rich repeat protein kinase family protein
Publisher’s Note: MDPI stays neutral with regard to jurisdictional claims in published maps and institutional affiliations.

