
Improved Multi-Plant Disease Recognition Method Using Deep Convolutional Neural Networks in Six Diseases of Apples and Pears


Abstract
:1. Introduction
2. Materials and Methods
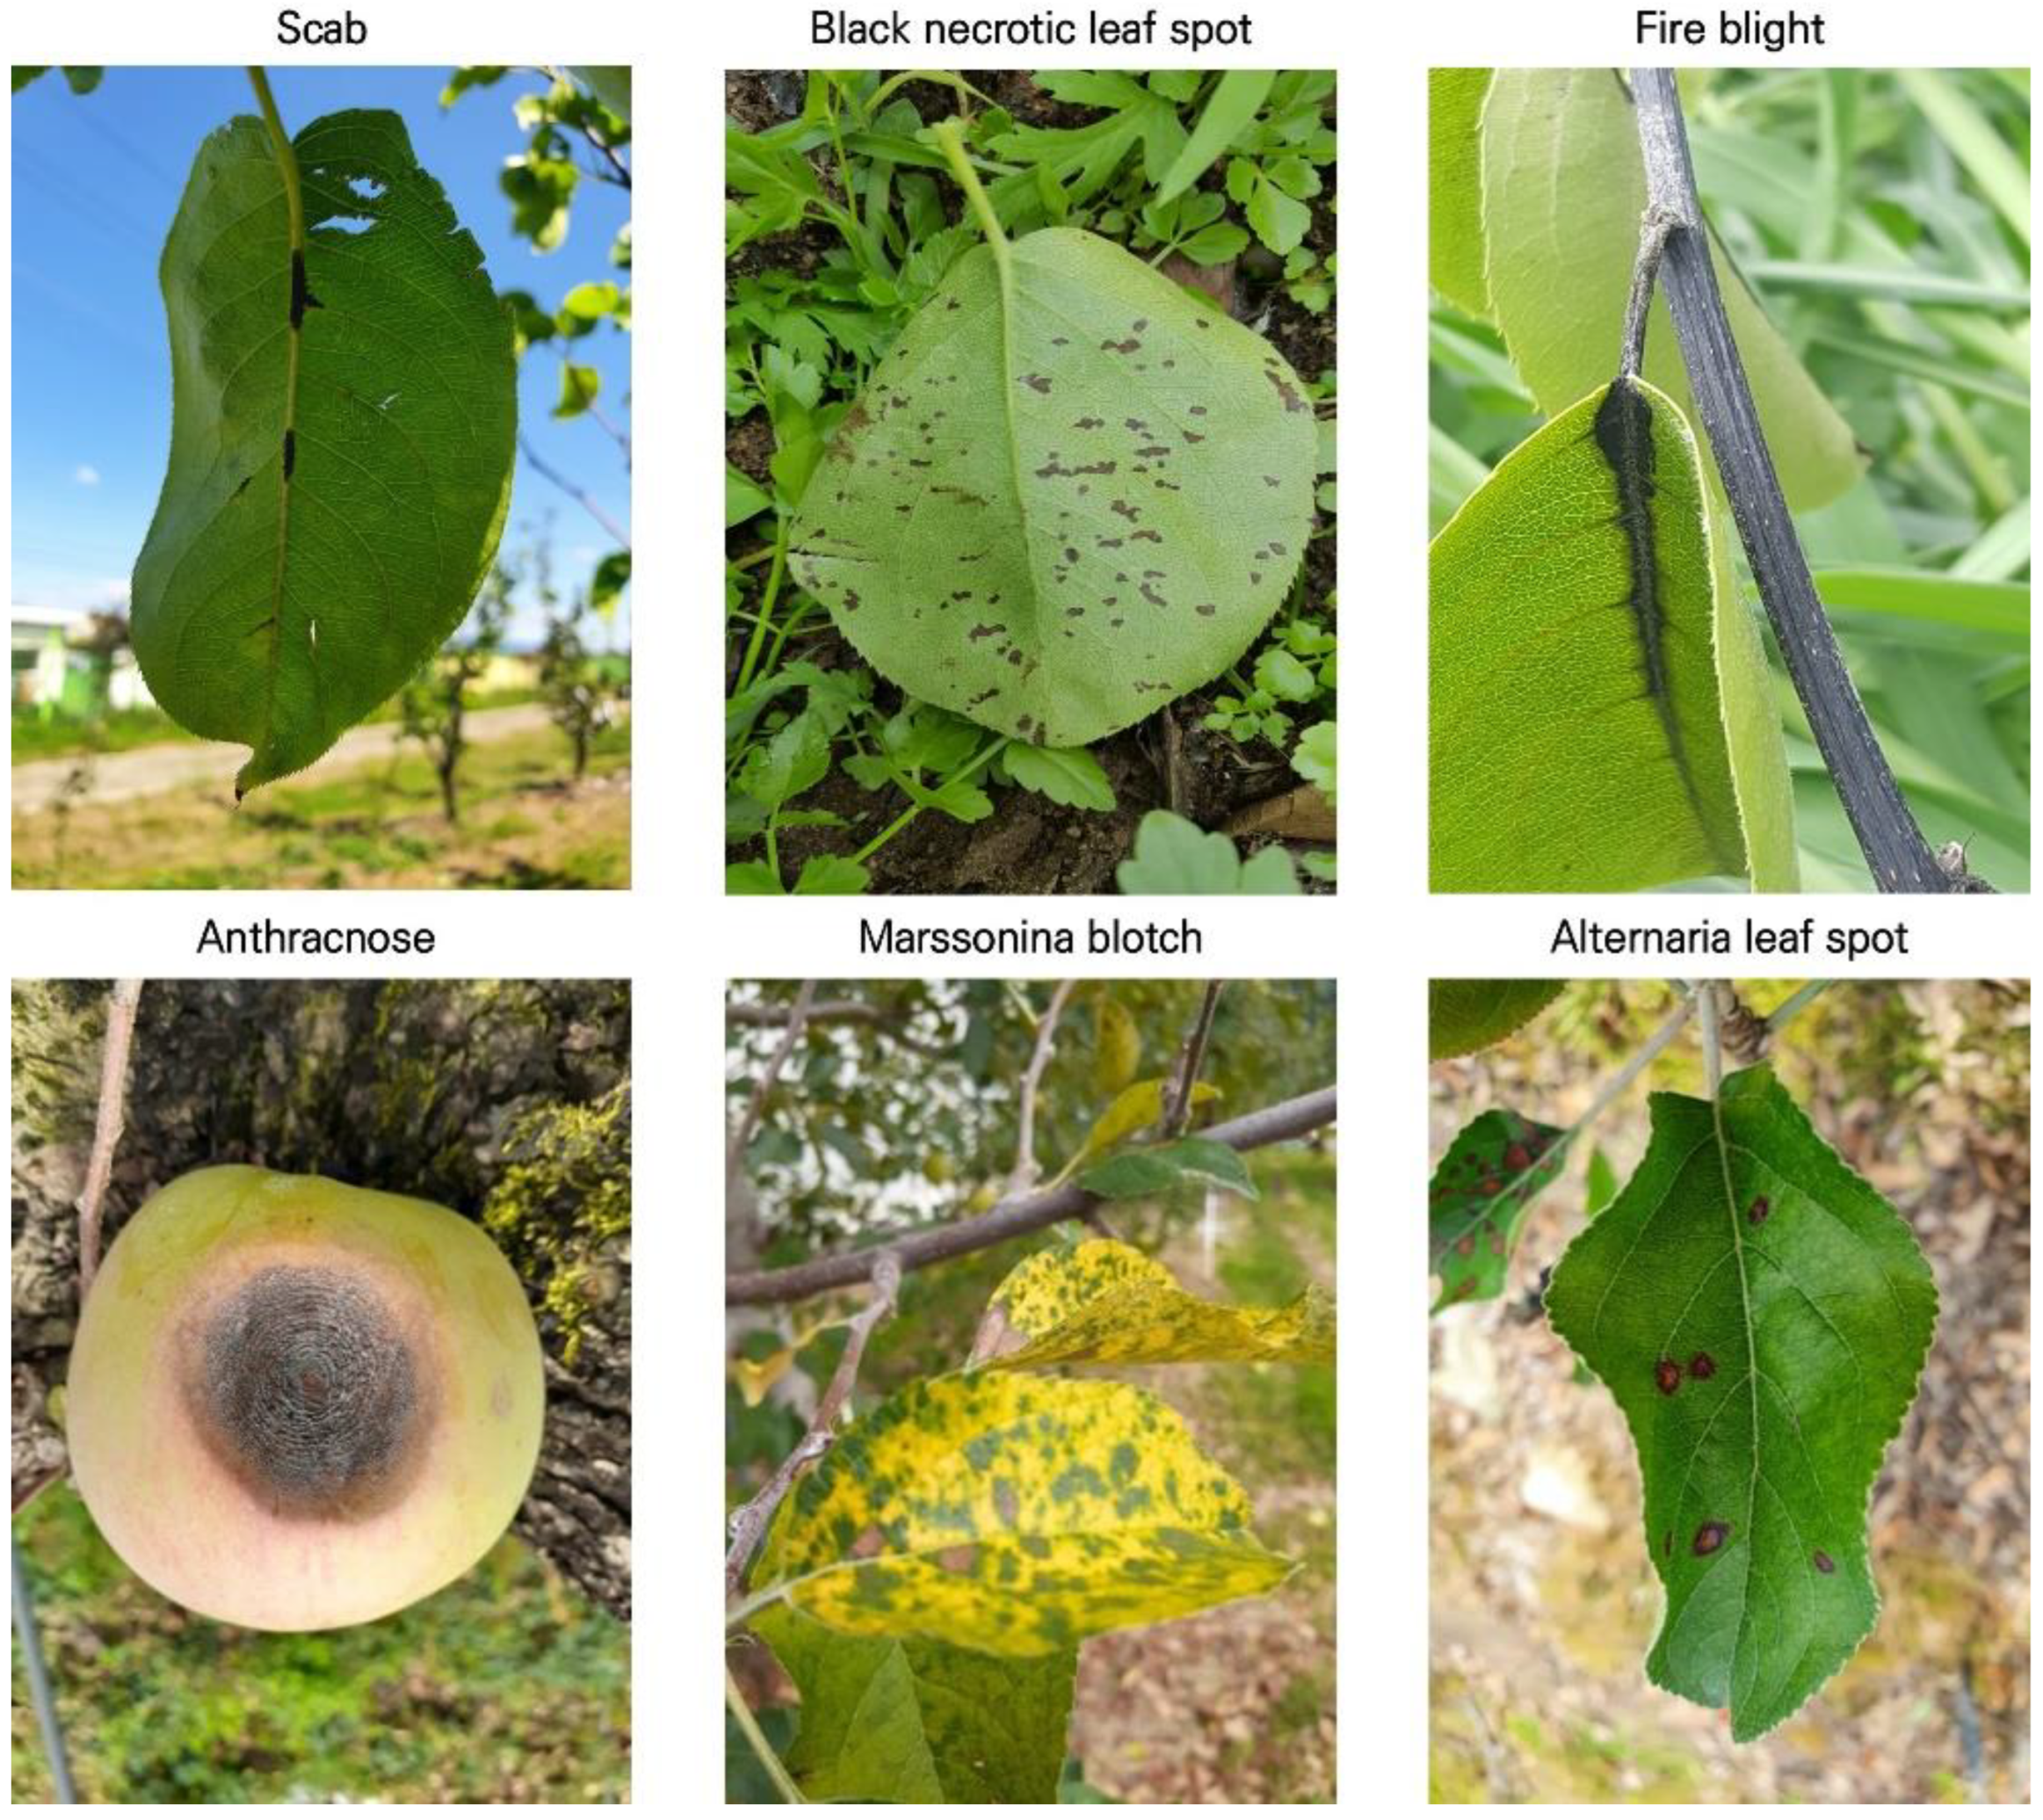
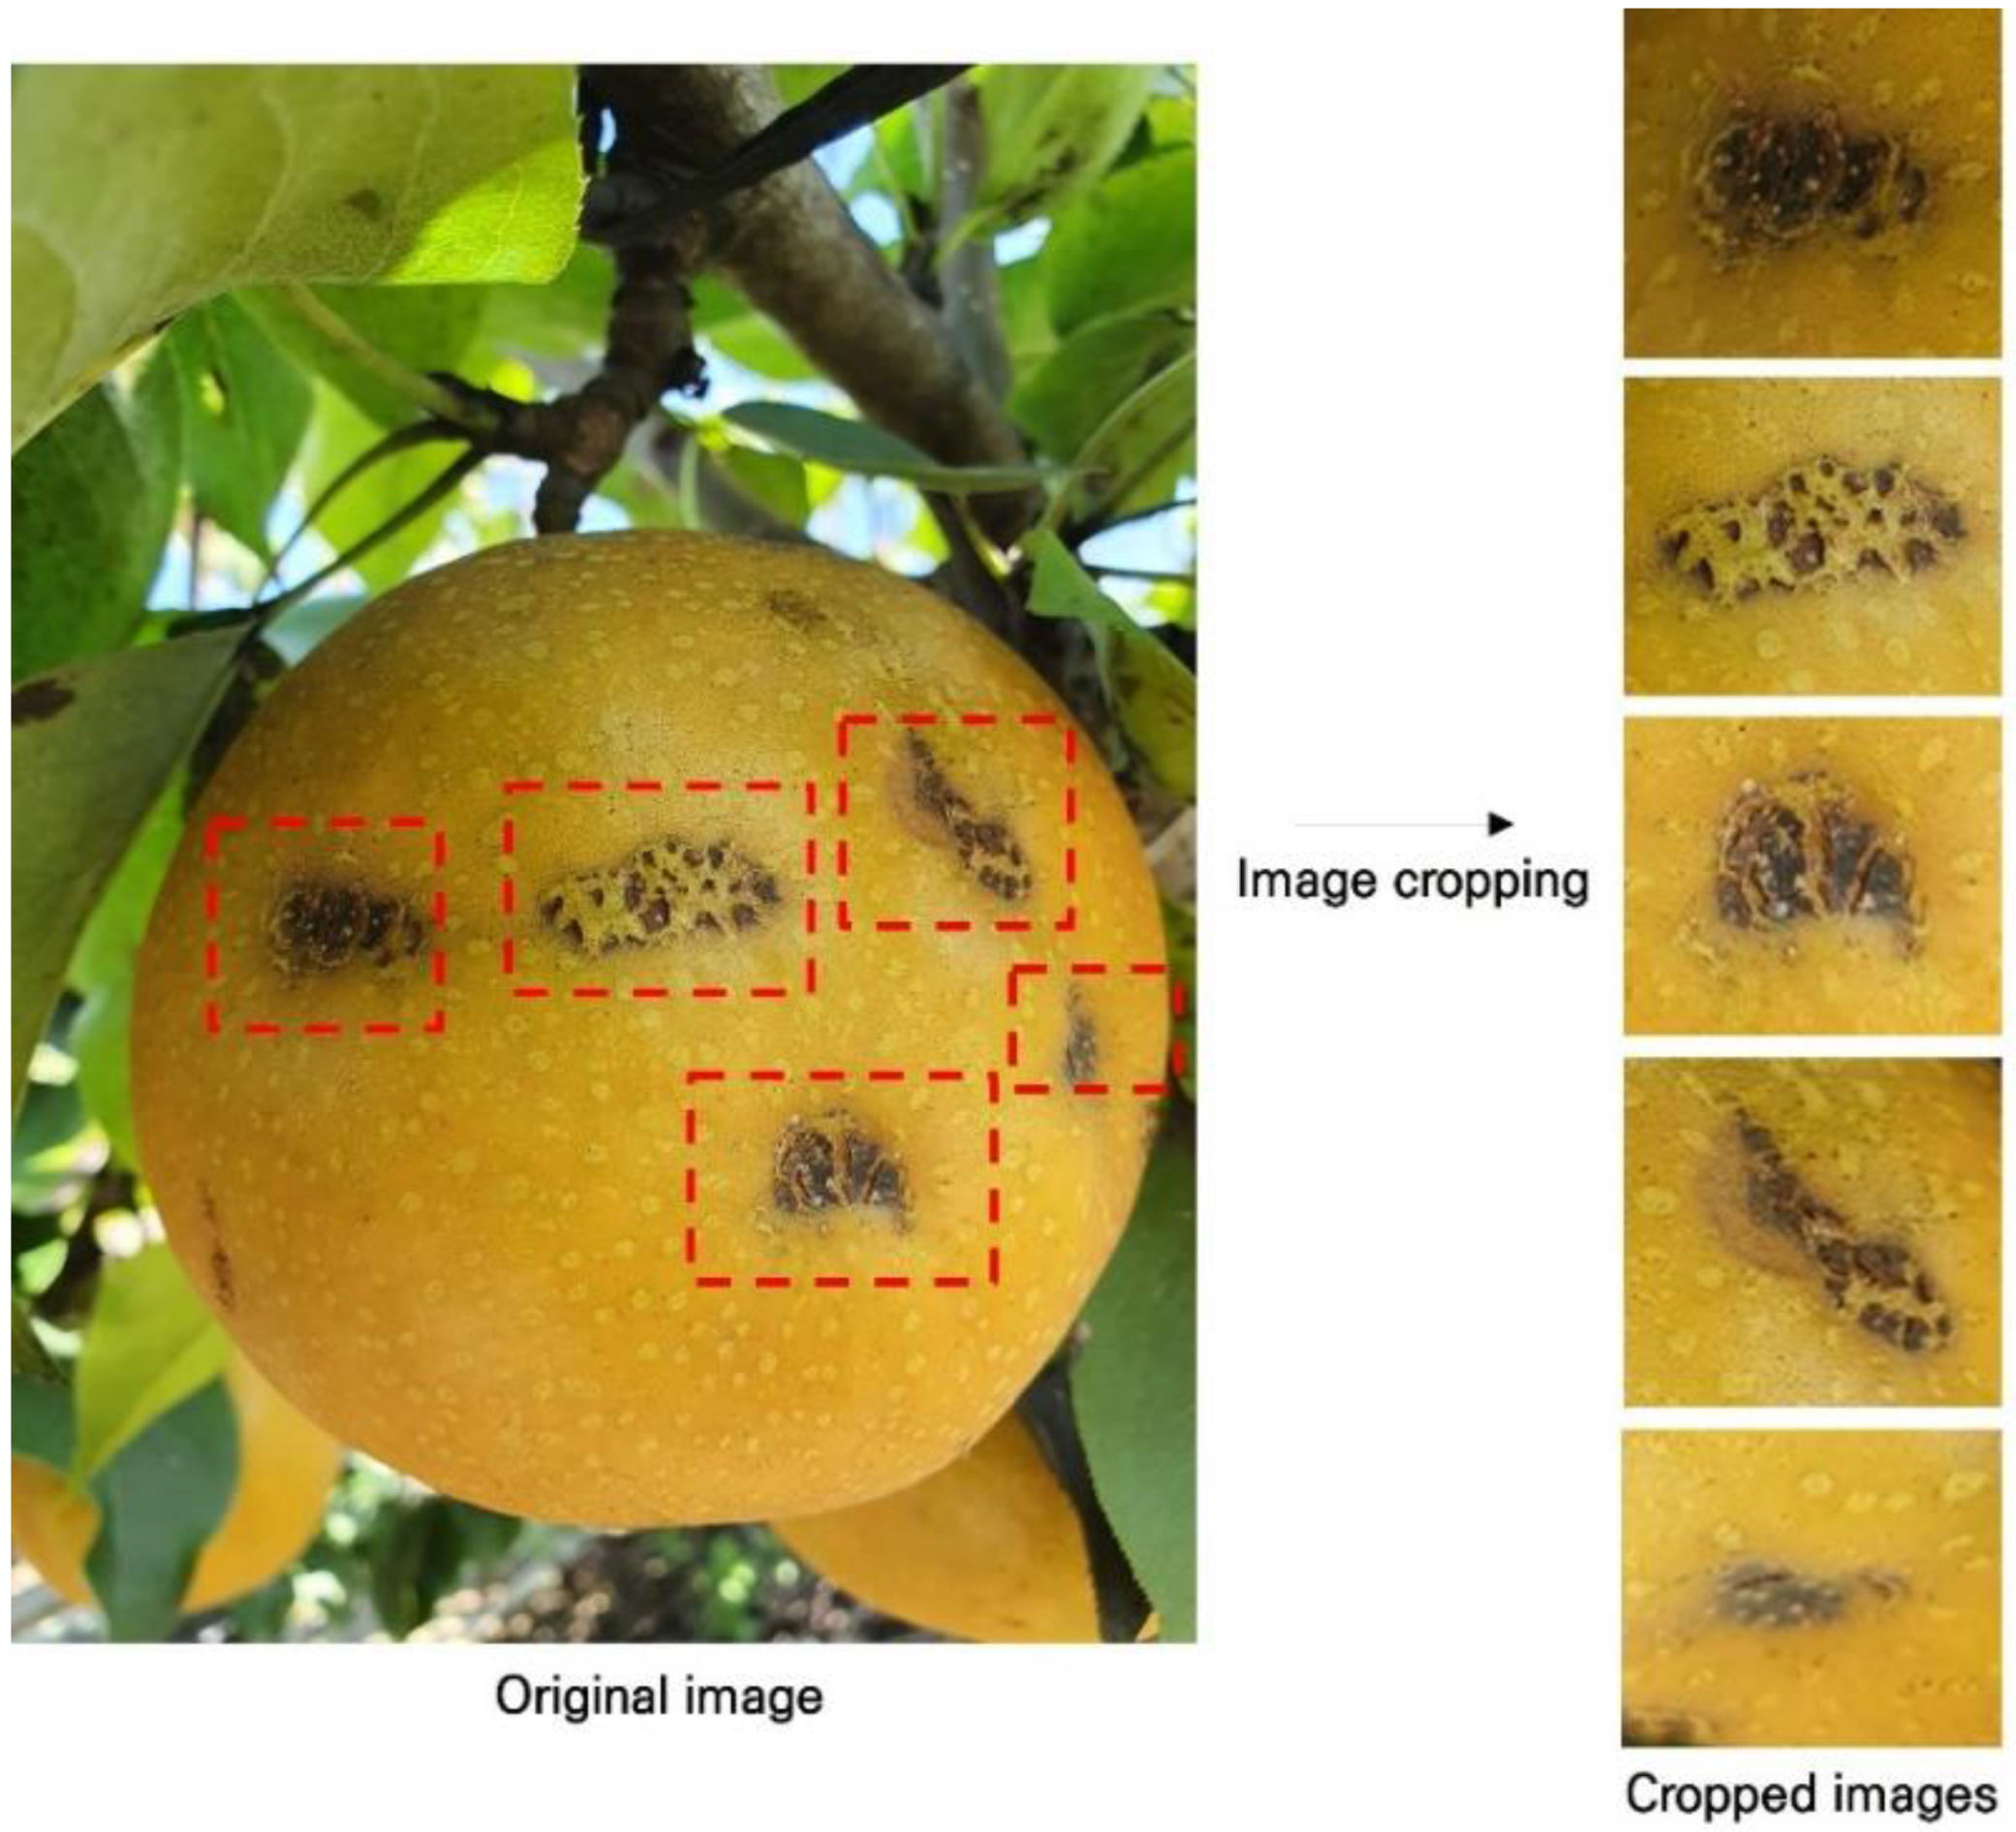
2.1. Dataset Description
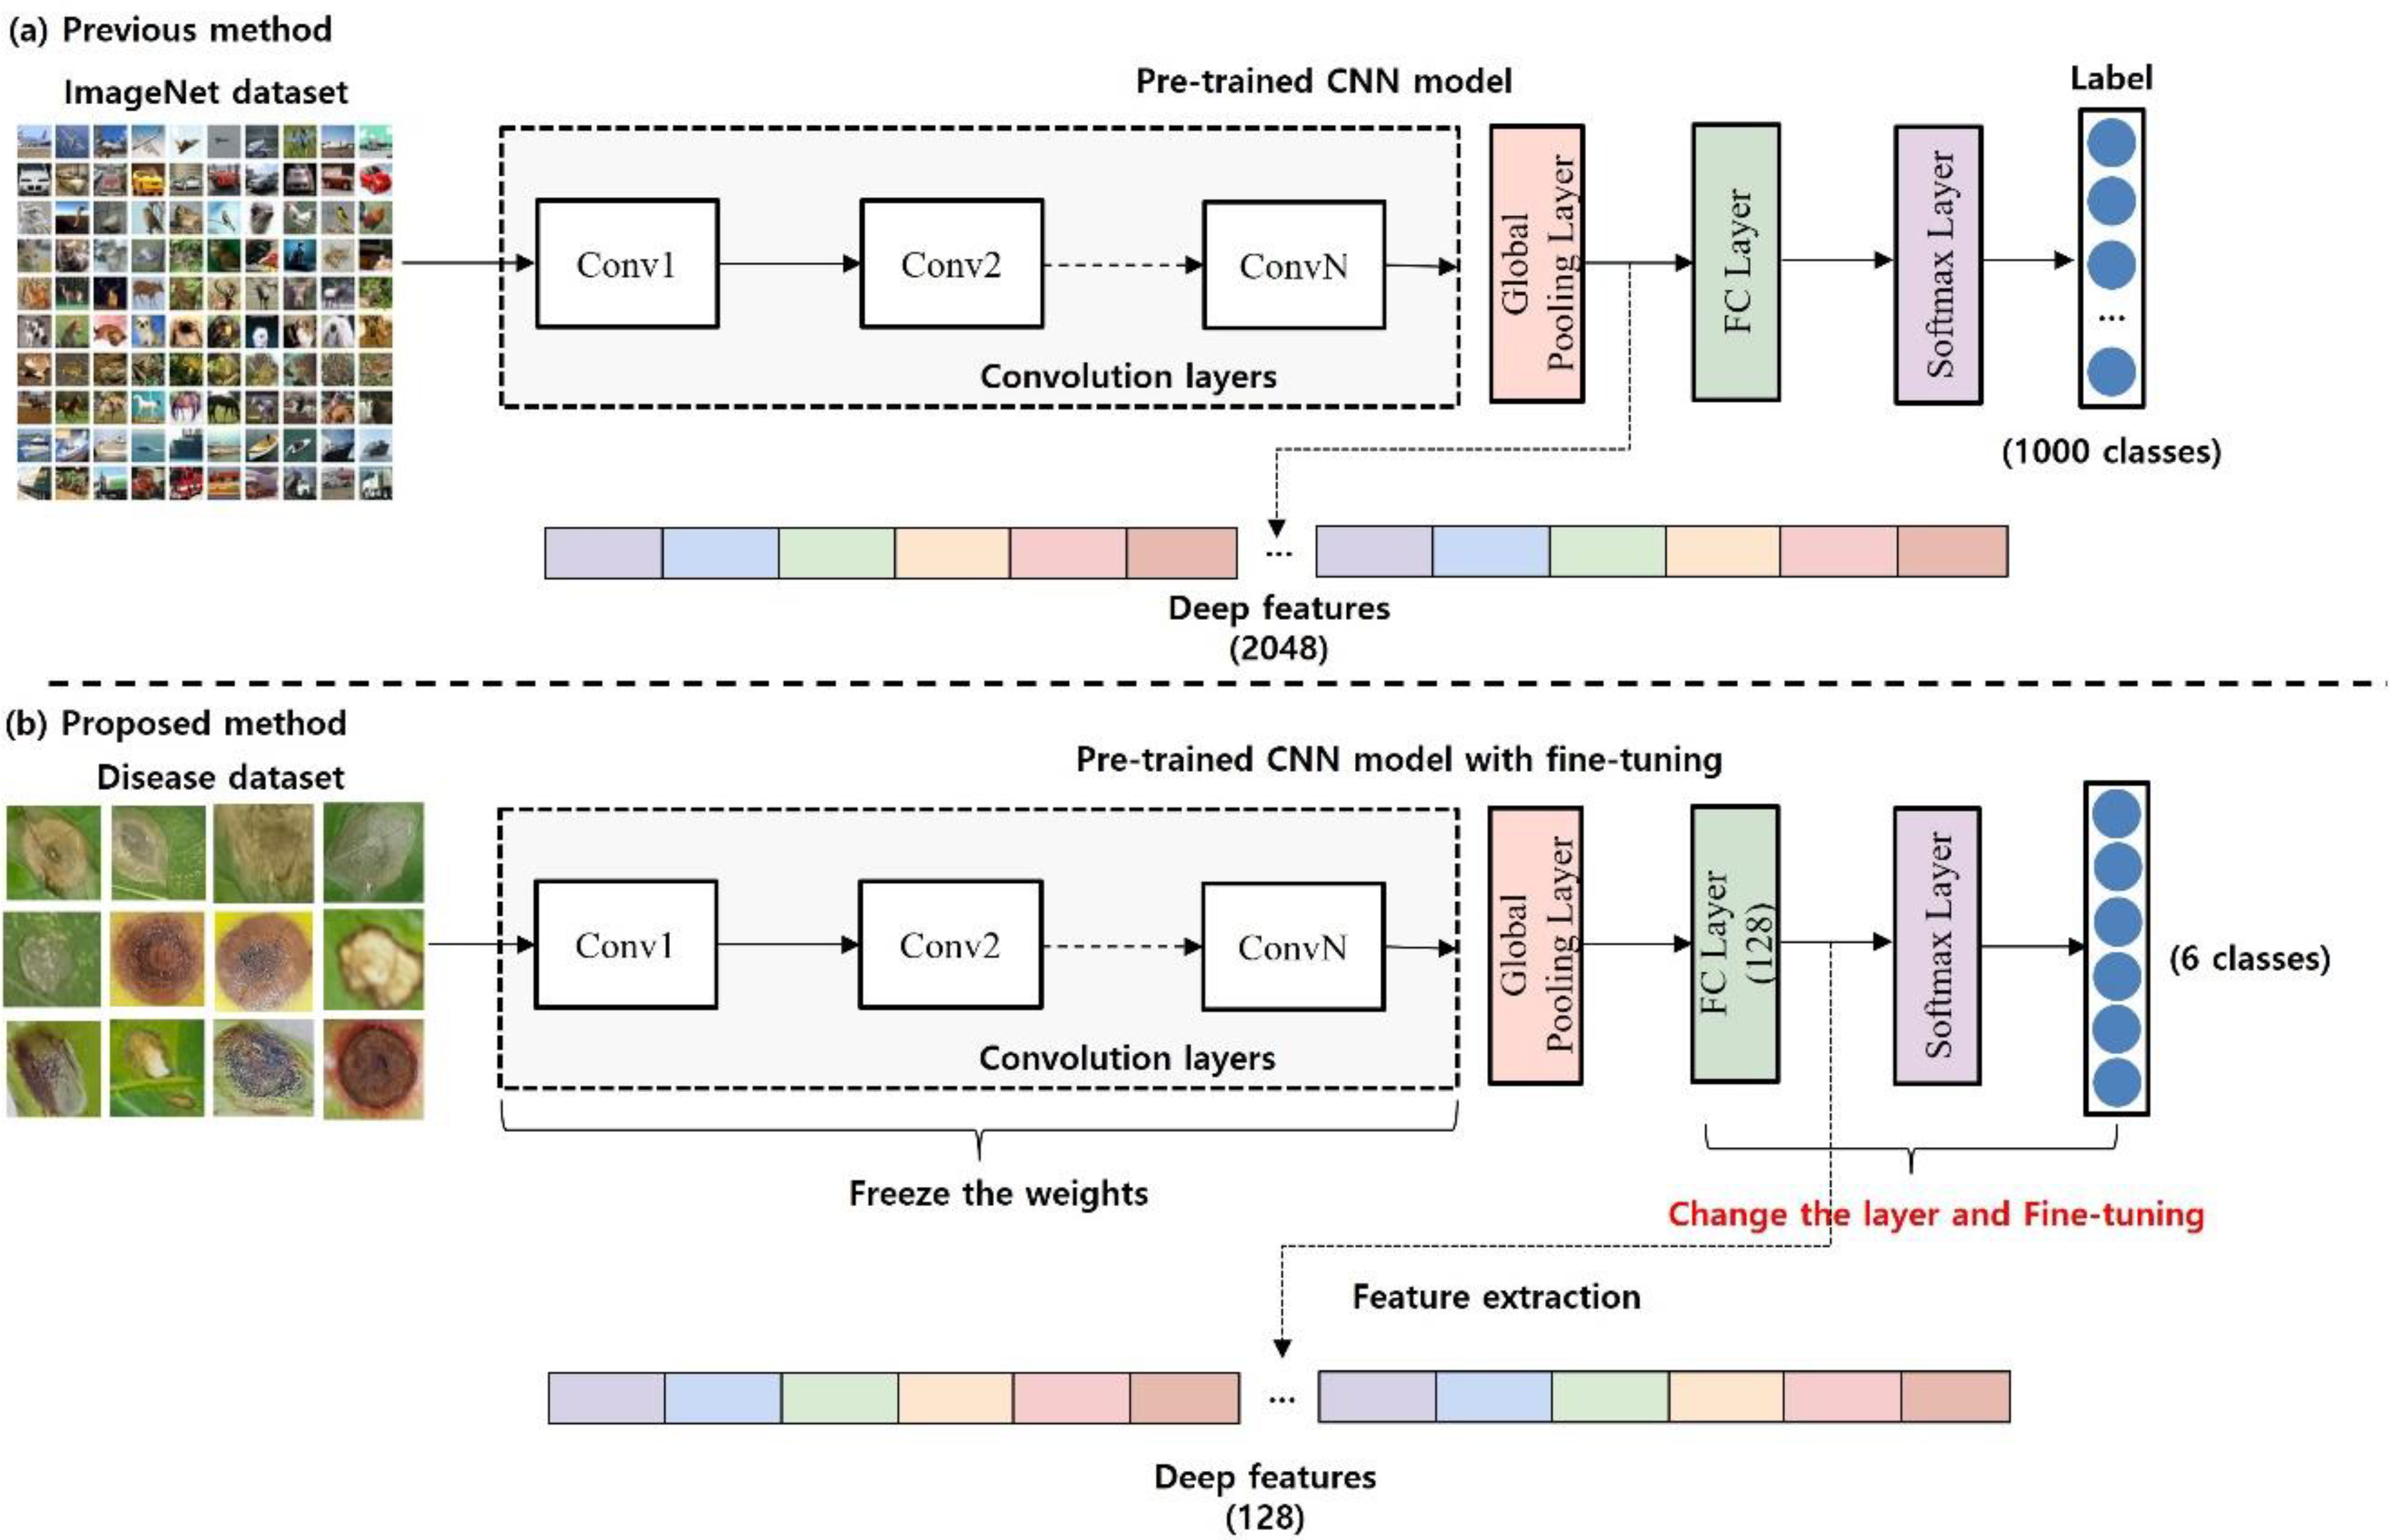
2.2. Pre-Trained Models and Fine-Tuning
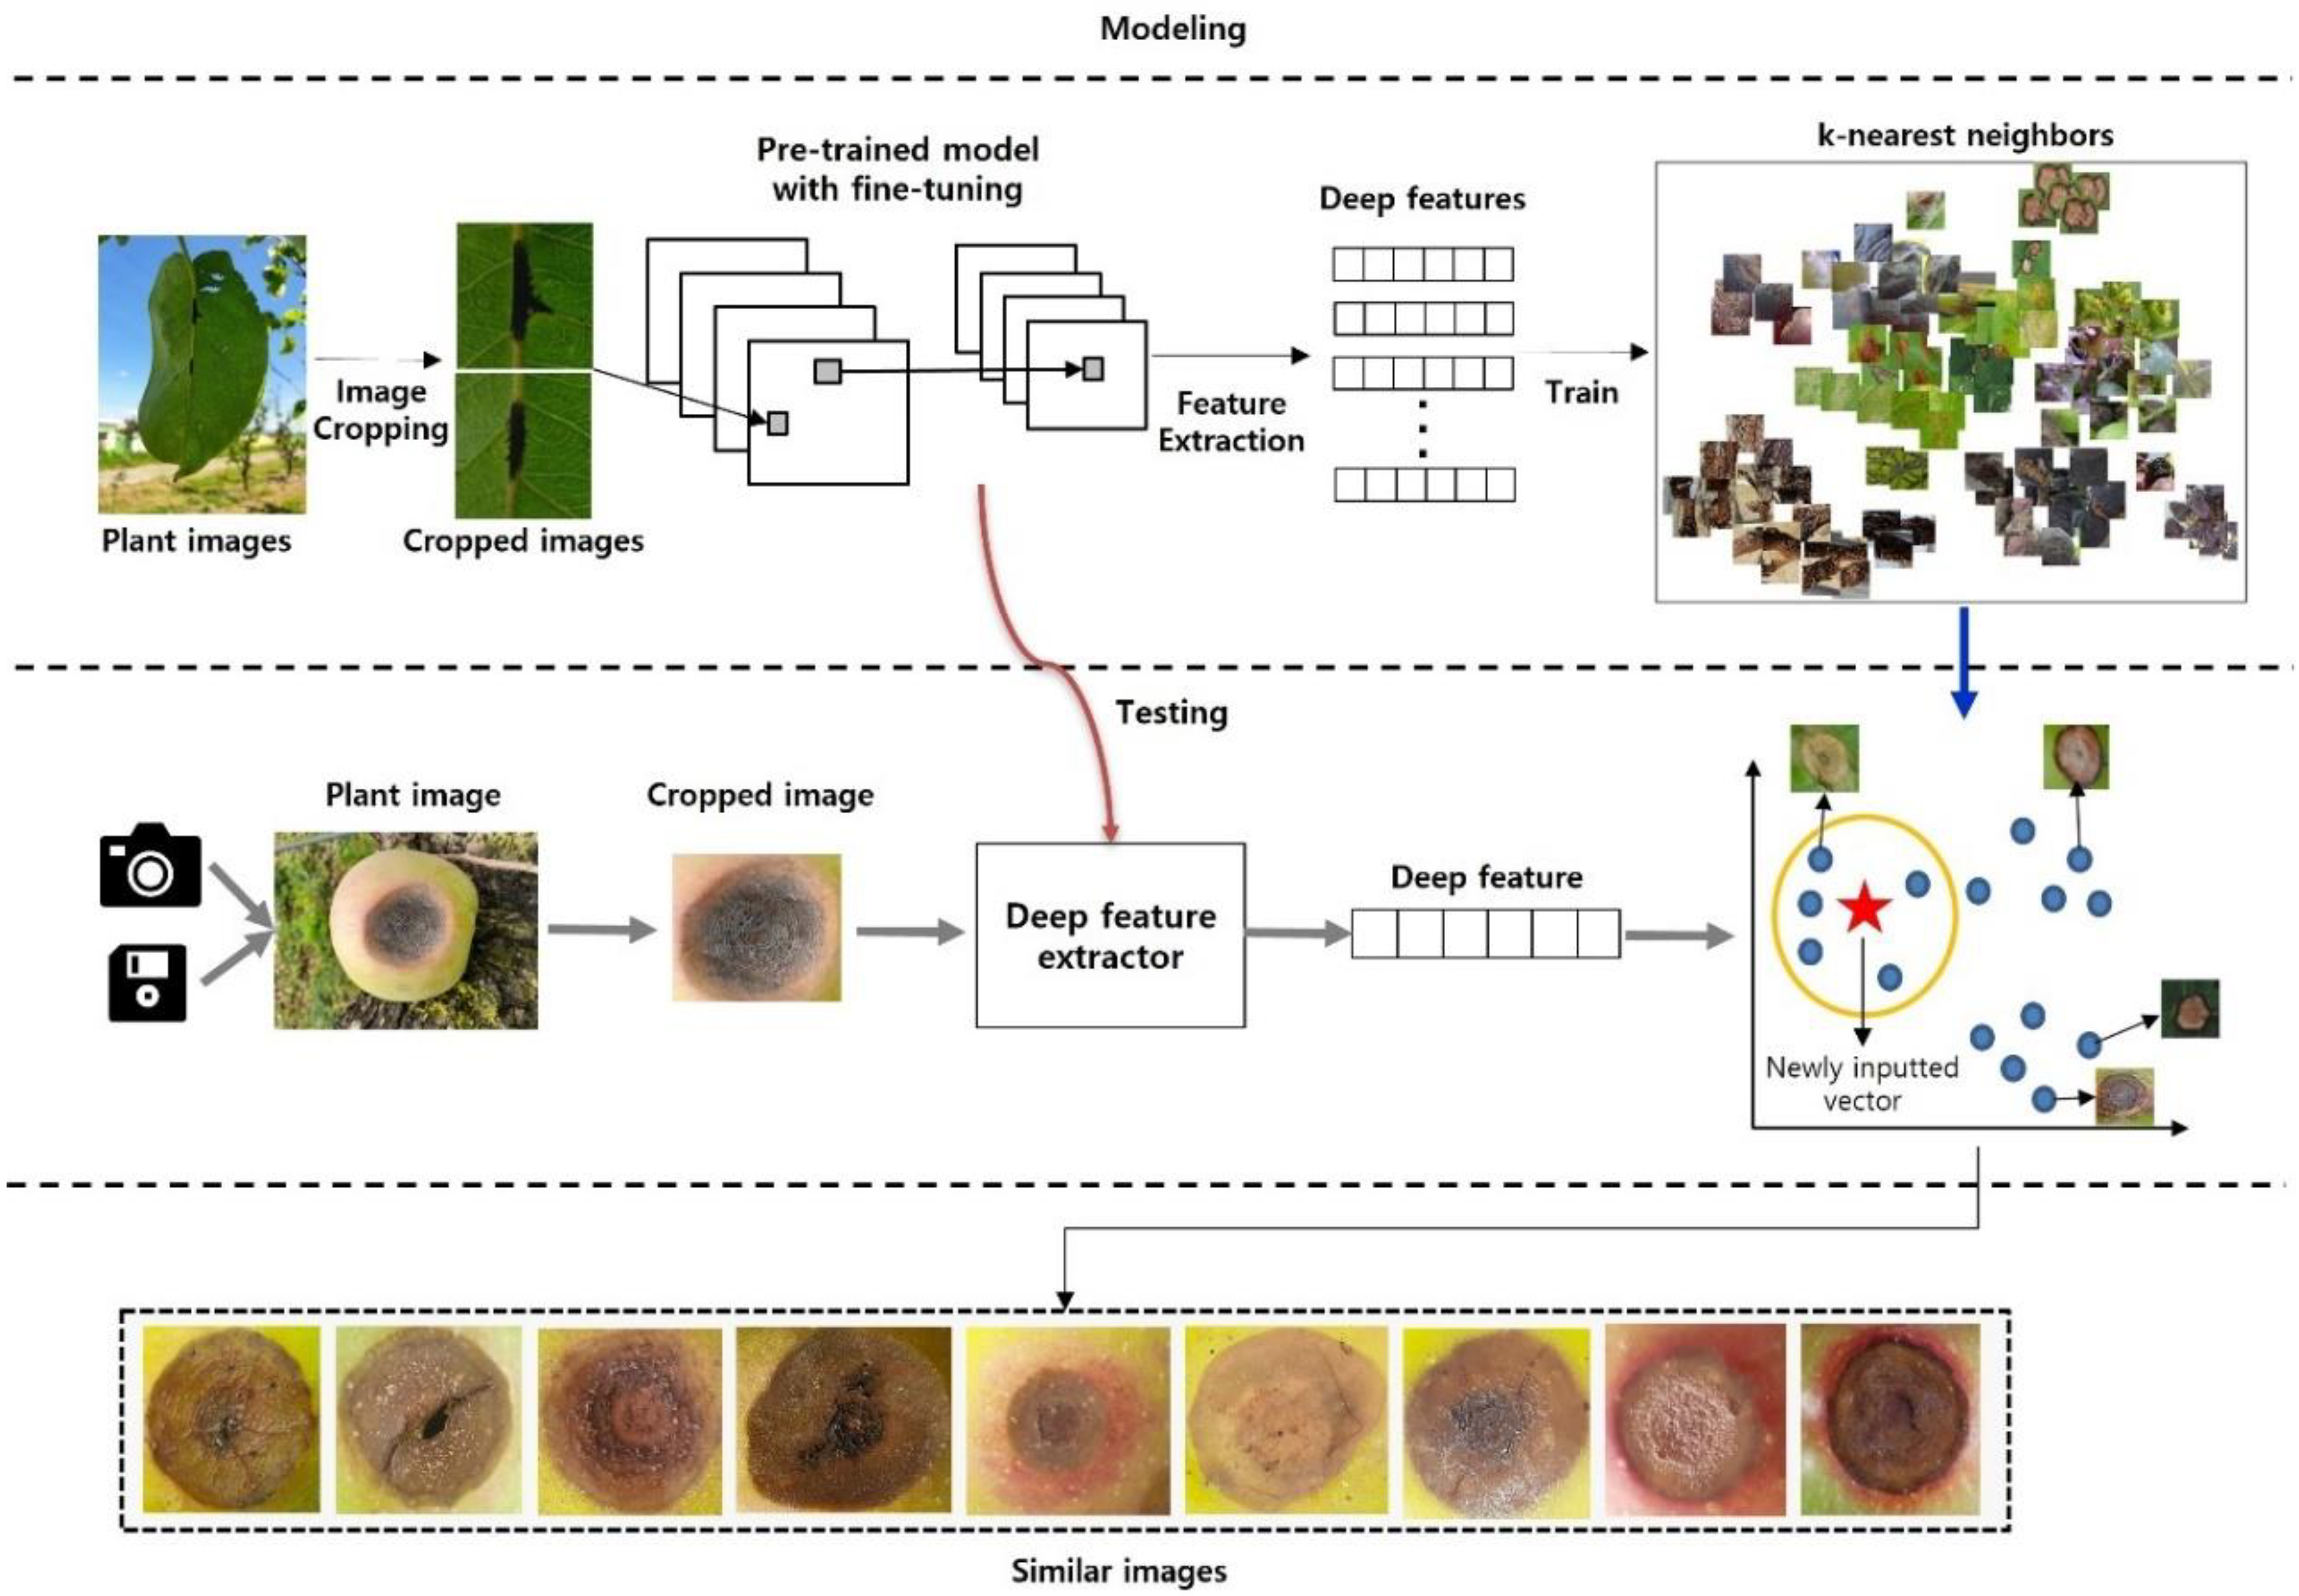
2.3. K-Nearest Neighbor
2.4. Proposed Method
3. Experiments
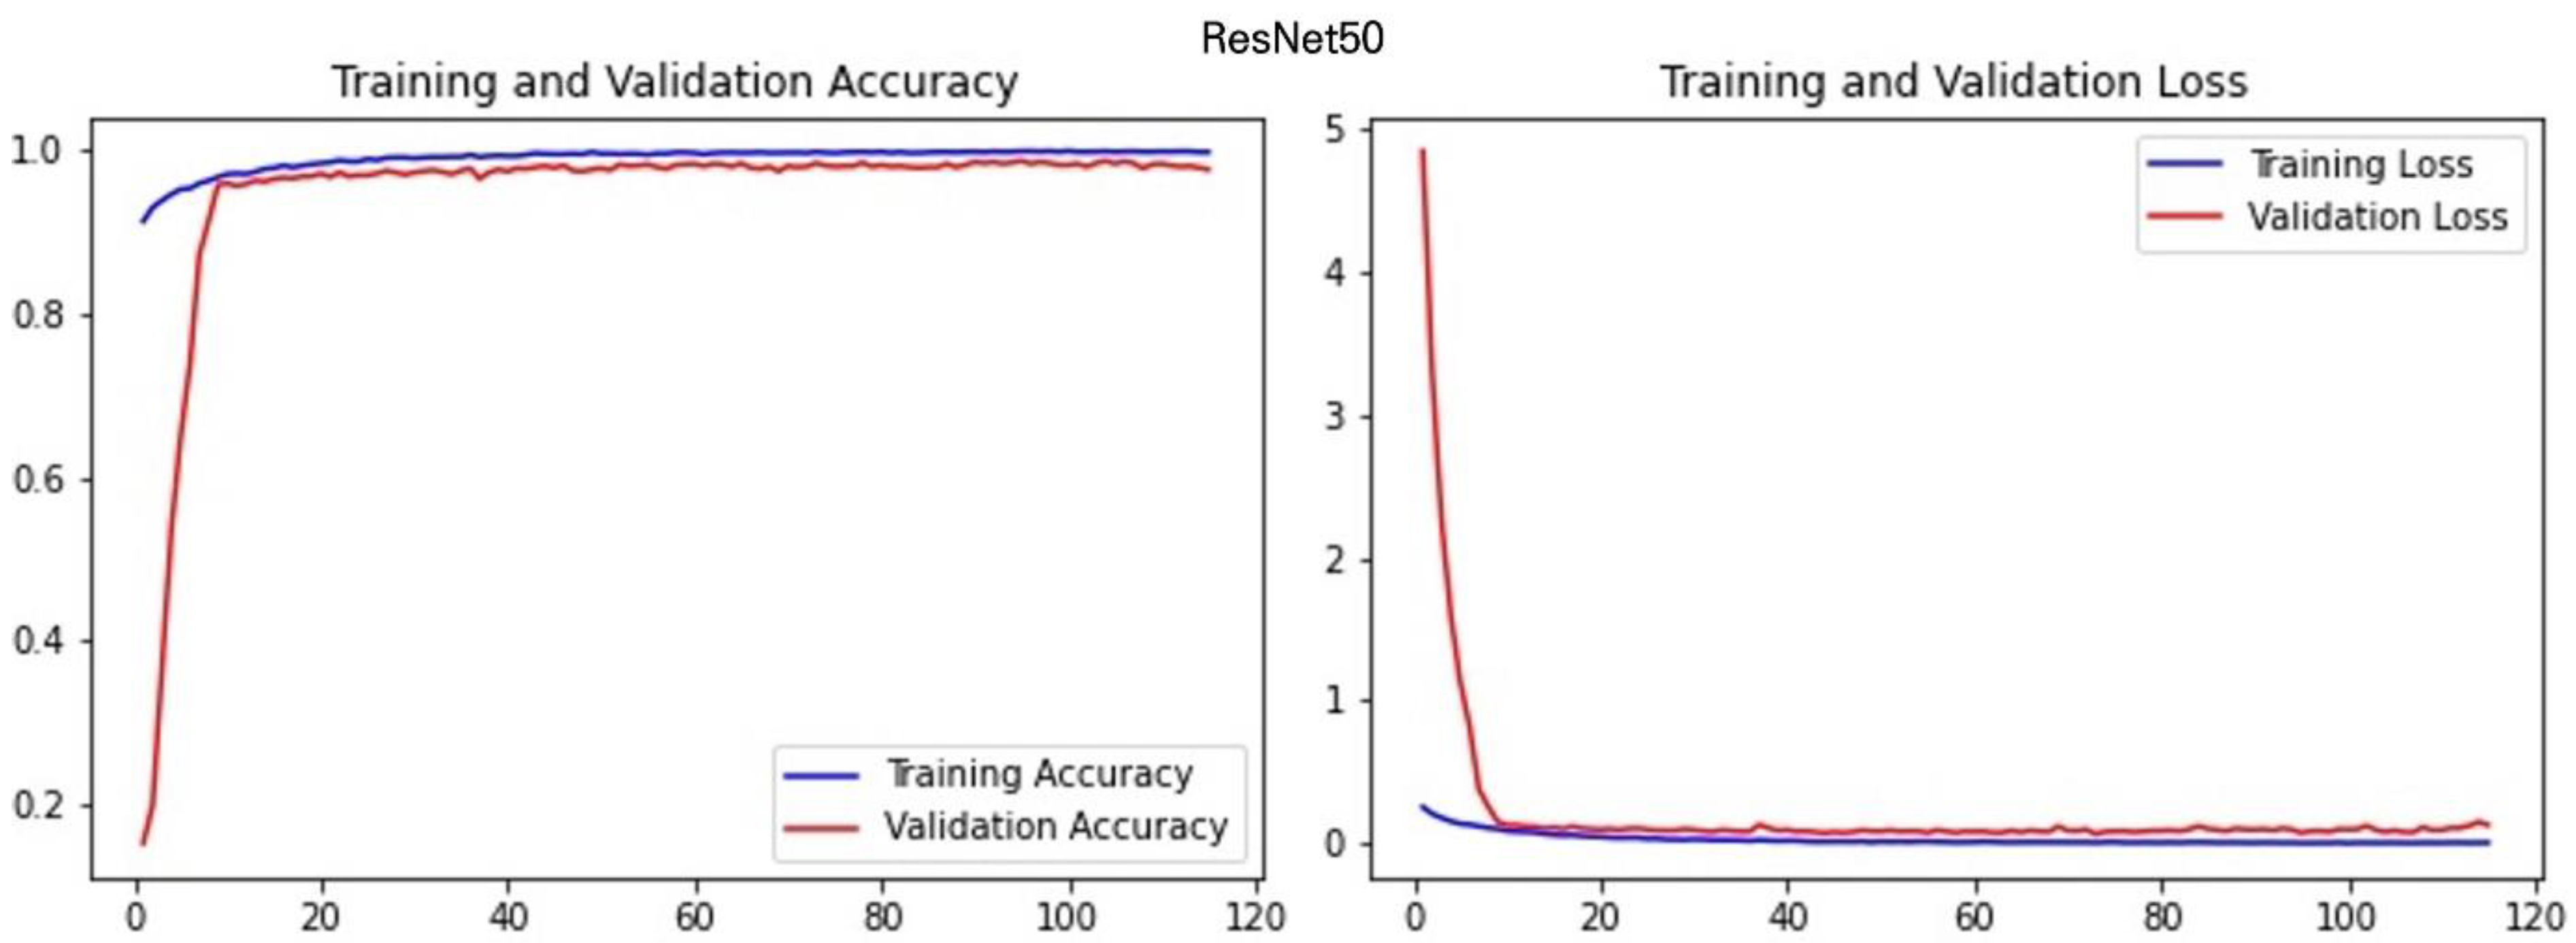
3.1. Experimental Setup
3.2. Performance Metrics
4. Results and Discussion
5. Conclusions
Author Contributions
Funding
Institutional Review Board Statement
Informed Consent Statement
Data Availability Statement
Conflicts of Interest
References
- Dhaka, V.S.; Meena, S.V.; Rani, G.; Sinwar, D.; Kavita, K.; Ijaz, M.F.; Woźniak, M. A survey of deep convolutional neural networks applied for prediction of plant leaf diseases. Sensors 2021, 21, 4749. [Google Scholar] [CrossRef] [PubMed]
- Yu, H.; Miao, C.; Leung, C.; White, T.J. Towards AI-powered personalization in MOOC learning. Npj Sci. Learn. 2017, 2, 1–5. [Google Scholar] [CrossRef] [PubMed] [Green Version]
- Traore, B.B.; Kamsu-Foguem, B.; Tangara, F. Deep convolution neural network for image recognition. Ecol. Inform. 2018, 48, 257–268. [Google Scholar] [CrossRef] [Green Version]
- Abeywardhana, D.L.; Dangalle, C.D.; Nugaliyadde, A.; Mallawarachchi, Y. Deep learning approach to classify Tiger beetles of Sri Lanka. Ecol. Inform. 2021, 62, 101286. [Google Scholar] [CrossRef]
- Atila, Ü.; Uçar, M.; Akyol, K.; Uçar, E. Plant leaf disease classification using EfficientNet deep learning model. Ecol. Inform. 2021, 61, 101182. [Google Scholar] [CrossRef]
- Kaya, A.; Keceli, A.S.; Catal, C.; Yalic, H.Y.; Temucin, H.; Tekinerdogan, B. Analysis of transfer learning for deep neural network based plant classification models. Comput. Electron. Agric. 2019, 158, 20–29. [Google Scholar] [CrossRef]
- Nitish, S.; Geoffrey, H.; Alex, K.; Ilya, S.; Ruslan, S. Dropout: A Simple Way to Prevent Neural Networks from Overfitting. J. Mach. Learn. Res. 2014, 15, 1929–1958. [Google Scholar]
- Penatti, O.A.B.; Nogueira, K.; Dos Santos, J.A. Do deep features generalize from everyday objects to remote sensing and aerial scenes domains? In Proceedings of the IEEE Conference on Computer Vision and Pattern Recognition Workshops, Boston, MA, USA, 7–12 October 2015; pp. 44–51. [Google Scholar] [CrossRef] [Green Version]
- Yin, H.; Gu, Y.H.; Park, C.J.; Park, J.H.; Yoo, S.J. Transfer learning-based search model for hot pepper diseases and pests. Agriculture 2020, 10, 439. [Google Scholar] [CrossRef]
- Zhuang, F.; Qi, Z.; Duan, K.; Xi, D.; Zhu, Y.; Zhu, H.; Xiong, H.; He, Q. A Comprehensive Survey on Transfer Learning. Proc. IEEE 2021, 109, 43–76. [Google Scholar] [CrossRef]
- Deng, Z.; Zhang, X.; Zhao, Y. Transfer learning based method for frequency response model updating with insufficient data. Sensors 2020, 20, 5615. [Google Scholar] [CrossRef]
- Dourado-Filho, L.A.; Calumby, R.T. An experimental assessment of deep convolutional features for plant species recognition. Ecol. Inform. 2021, 65, 101411. [Google Scholar] [CrossRef]
- He, K.; Zhang, X.; Ren, S.; Sun, J. Deep residual learning for image recognition. In Proceedings of the IEEE Conference on Computer Vision and Pattern Recognition, Las Vegas, USA, 27–30 June 2016; pp. 770–778. [Google Scholar]
- Simonyan, K.; Zisserman, A. Very deep convolutional networks for large-scale image recognition. In Proceedings of the 3rd International Conference on Learning Representations, San Diego, CA, USA, 7–9 May 2015. [Google Scholar]
- Szegedy, C.; Vanhoucke, V.; Ioffe, S.; Shlens, J.; Wojna, Z. Rethinking the Inception Architecture for Computer Vision. In Proceedings of the IEEE Conference on Computer Vision and Pattern Recognition, Las Vegas, NV, USA, 27–30 June 2016; pp. 2818–2826. [Google Scholar]
- Lecun, Y.; Bengio, Y.; Hinton, G. Deep learning. Nature 2015, 521, 436–444. [Google Scholar] [CrossRef] [PubMed]
- Pawara, P.; Okafor, E.; Surinta, O.; Schomaker, L.; Wiering, M. Comparing local descriptors and bags of visualwords to deep convolutional neural networks for plant recognition. In Proceedings of the ICPRAM 2017— 6th International Conference on Pattern Recognition Applications and Methods, Porto, Portugal, 24–26 February 2017; pp. 479–486. [Google Scholar] [CrossRef]
- Ur Rahman, H.; Ch, N.J.; Manzoor, S.; Najeeb, F.; Siddique, M.Y.; Khan, R.A. A comparative analysis of machine learning approaches for plant disease identification. Adv. Life Sci. 2017, 4, 120–126. [Google Scholar]
- Konstantinos, P. Ferentinos Deep learning models for plant disease detection and diagnosis. Comput. Electron. Agric. 2018, 145, 311–318. [Google Scholar]
- Torres, R.; Papa, J.P.; Da, R.; Torres, S.; Falcão, A.X. Content-based image retrieval: Theory and applications. RITA 2006, 13, 161–185. [Google Scholar]
- Marwaha, S.; Chand, S.; Saha, A. Disease diagnosis in crops using content based image retrieval. In Proceedings of the 2012 12th International Conference on Intelligent Systems Design and Applications (ISDA), Kochi, India, 27–29 November 2012; pp. 729–733. [Google Scholar]
- Patil, J.K.; Kumar, R. Comparative analysis of content based image retrieval using texture features for plant leaf diseases. Int. J. Appl. Eng. Res. 2016, 11, 6244–6249. [Google Scholar]
- Baquero, D.; Molina, J.; Gil, R.; Bojacá, C.; Franco, H.; Gómez, F. An image retrieval system for tomato disease assessment. In Proceedings of the 2014 19th Symposium on Image, Signal Processing and Artificial Vision, STSIVA, Armenia, Colombia, 17–19 September 2014. [Google Scholar]
- Yin, H.; Da Woon Jeong, Y.H.G.; Yoo, S.J.; Jeon, S.B. A Diagnosis and Prescription System to Automatically Diagnose Pests. In Proceedings of the Third International Conference on Computer Science, Computer Engineering, and Education Technologies (CSCEET2016), Lodz University of Technology, Lodz, Poland, 19–21 September 2016; p. 47. [Google Scholar]
- Piao, Z.; Ahn, H.G.; Yoo, S.J.; Gu, Y.H.; Yin, H.; Jeong, D.W.; Jiang, Z.; Chung, W.H. Performance analysis of combined descriptors for similar crop disease image retrieval. Cluster Comput. 2017, 20, 3565–3577. [Google Scholar] [CrossRef]
- Suh, B.; Ling, H.; Bederson, B.B.; Jacobs, D.W. Automatic thumbnail cropping and its effectiveness. In Proceedings of the 16th Annual ACM Symposium on User Interface Software and Technology, Vancouver, BC, Canada, 2–5 November 2003; pp. 95–104. [Google Scholar]
- Chen, J.; Bai, G.; Liang, S.; Li, Z. Automatic image cropping: A computational complexity study. In Proceedings of the IEEE Conference on Computer Vision and Pattern Recognition, Las Vegas, NV, USA, 27–30 June 2016; pp. 507–515. [Google Scholar]
- Zhang, Z. Introduction to machine learning: K-nearest neighbors. Ann. Transl. Med. 2016, 4, 218. [Google Scholar] [CrossRef] [Green Version]
- Koklu, M.; Ozkan, I.A. Multiclass classification of dry beans using computer vision and machine learning techniques. Comput. Electron. Agric. 2020, 174, 105507. [Google Scholar] [CrossRef]
- Bray, J.R.; Curtis, J.T. An Ordination of the Upland Forest Communities of Southern Wisconsin. Ecol. Monogr. 1957, 27, 325–349. [Google Scholar] [CrossRef]
- Elhassouny, A.; Smarandache, F. Smart mobile application to recognize tomato leaf diseases using Convolutional Neural Networks. In Proceedings of the 2019 International Conference of Computer Science and Renewable Energies (ICCSRE), Agadir, Morocco, 22–24 July 2019; pp. 10–13. [Google Scholar] [CrossRef]
- Kathiresan, G.; Anirudh, M.; Nagharjun, M.; Karthik, R. Disease detection in rice leaves using transfer learning techniques. J. Phys. Conf. Ser. 2021, 1911, 012004. [Google Scholar] [CrossRef]
- Sagar, A.; Jacob, D. On using transfer learning for plant disease detection. bioRxiv 2021. [Google Scholar] [CrossRef]


| Plant | Class | Original Images | Cropped Images |
|---|---|---|---|
| Pear | Fire blight (Erwinia amylovora) | 357 | 865 |
| Scab (Venturia nashicola) | 770 | 3911 | |
| Black necrotic leaf spot (Apple stem grooving virus) | 130 | 894 | |
| Apple | Marssonia blotch (Diplocarpon mali) | 976 | 2711 |
| Alternaria leaf spot (Alternaria mali) | 990 | 4416 | |
| Anthracnose (Glomerella cingulata) | 979 | 1507 | |
| Total | 4202 | 14,304 | |
| Model | Precision |
|---|---|
| ResNet50 | 98.83% |
| VGG16 | 94.53% |
| VGG19 | 95.70% |
| Inception ResNet | 93.12% |
| NASNet Large | 91.48% |
| EfficientNetB0 | 98.05% |
| DenseNet121 | 97.75% |
| ResNet50 | VGG16 | VGG19 | Inception ResNet | NASNet Large | Efficient NetB0 | DenseNet121 | |
|---|---|---|---|---|---|---|---|
| Similarity Accuracy/Compared with the Baseline Method [9] | |||||||
| Fire Blight | 99.58%/ (+26.44%) | 79.35%/ (+16.61%) | 89.61%/ (+26.33%) | 81.06%/ (+31.22%) | 81.46%/ (+25.40%) | 99.28%/ (+62.25%) | 90.07%/ (+25.15%) |
| Scab | 99.79%/ (+5.02%) | 96.90%/ (+4.61%) | 97.81%/ (+5.82%). | 95.34%/ (+5.36%) | 93.19%/ (+3.88%) | 99.60%/ (+17.56%) | 94.40%/ (+2.73%) |
| Black necrotic leaf spot | 99.98%/ (+8.31%) | 92.90%/ (+10.41%) | 96.64%/ (+13.69%) | 88.28%/ (+18.82%) | 89.40%/ (+13.02%) | 99.87%/ (+36.09%) | 93.76%/ (+9.33%) |
| Marssonia blotch | 99.66%/ (+25.19%) | 86.57%/ (+19.13%) | 91.87%/ (+22.60%) | 79.23%/ (+18.01%) | 76.56%/ (+13.14%) | 99.10%/ (+49.33%) | 87.95%/ (+13.52%) |
| Alternaria leaf spot | 99.80%/ (+8.86%) | 93.73%/ (+8.19%) | 95.23%/ (+7.97%) | 89.47%/ (+8.22%) | 90.33%/ (+9.54%) | 99.54%/ (+23.45%) | 90.85%/ (+2.24%) |
| Anthracnose | 99.87%/ (+4.81%) | 95.47%/ (+1.49%) | 97.64%/ (+3.44%) | 95.75%/ (+3.02%) | 96.56%/ (+2.21%) | 99.85%/ (+12.62%) | 96.98%/ (+4.25%) |
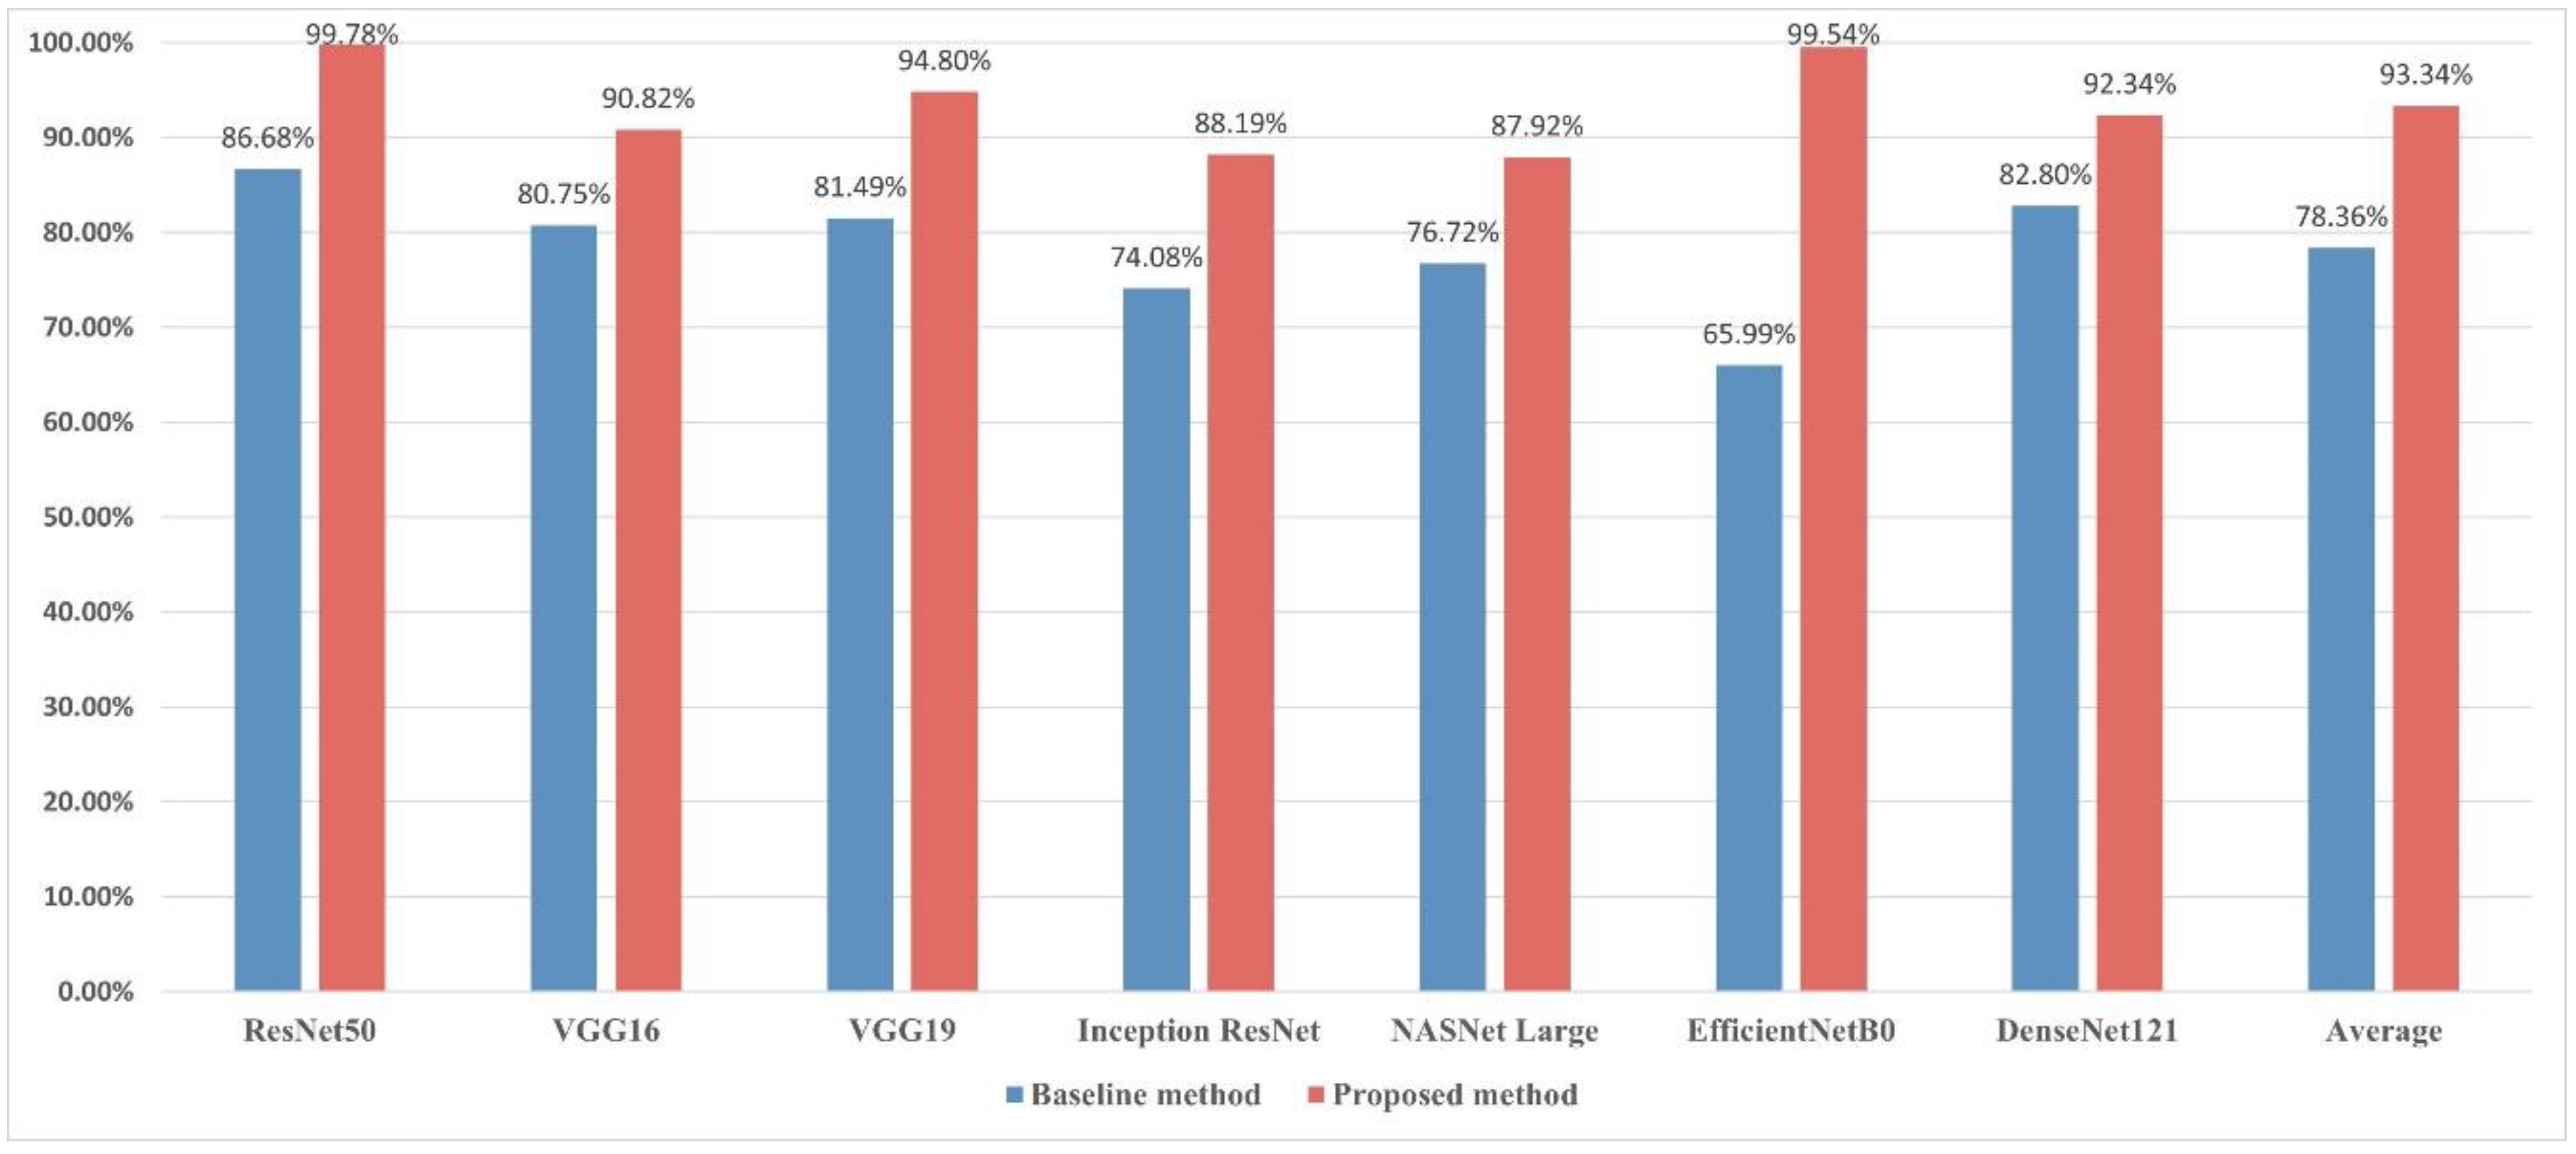
| Average | 99.78%/ (+13.10%) | 90.82%/ (+10.07%) | 94.80%/ (+13.31%) | 88.19%/ (+14.11%) | 87.92%/ (+11.20%) | 99.54%/ (+33.55%) | 92.34%/ (+9.54%) |
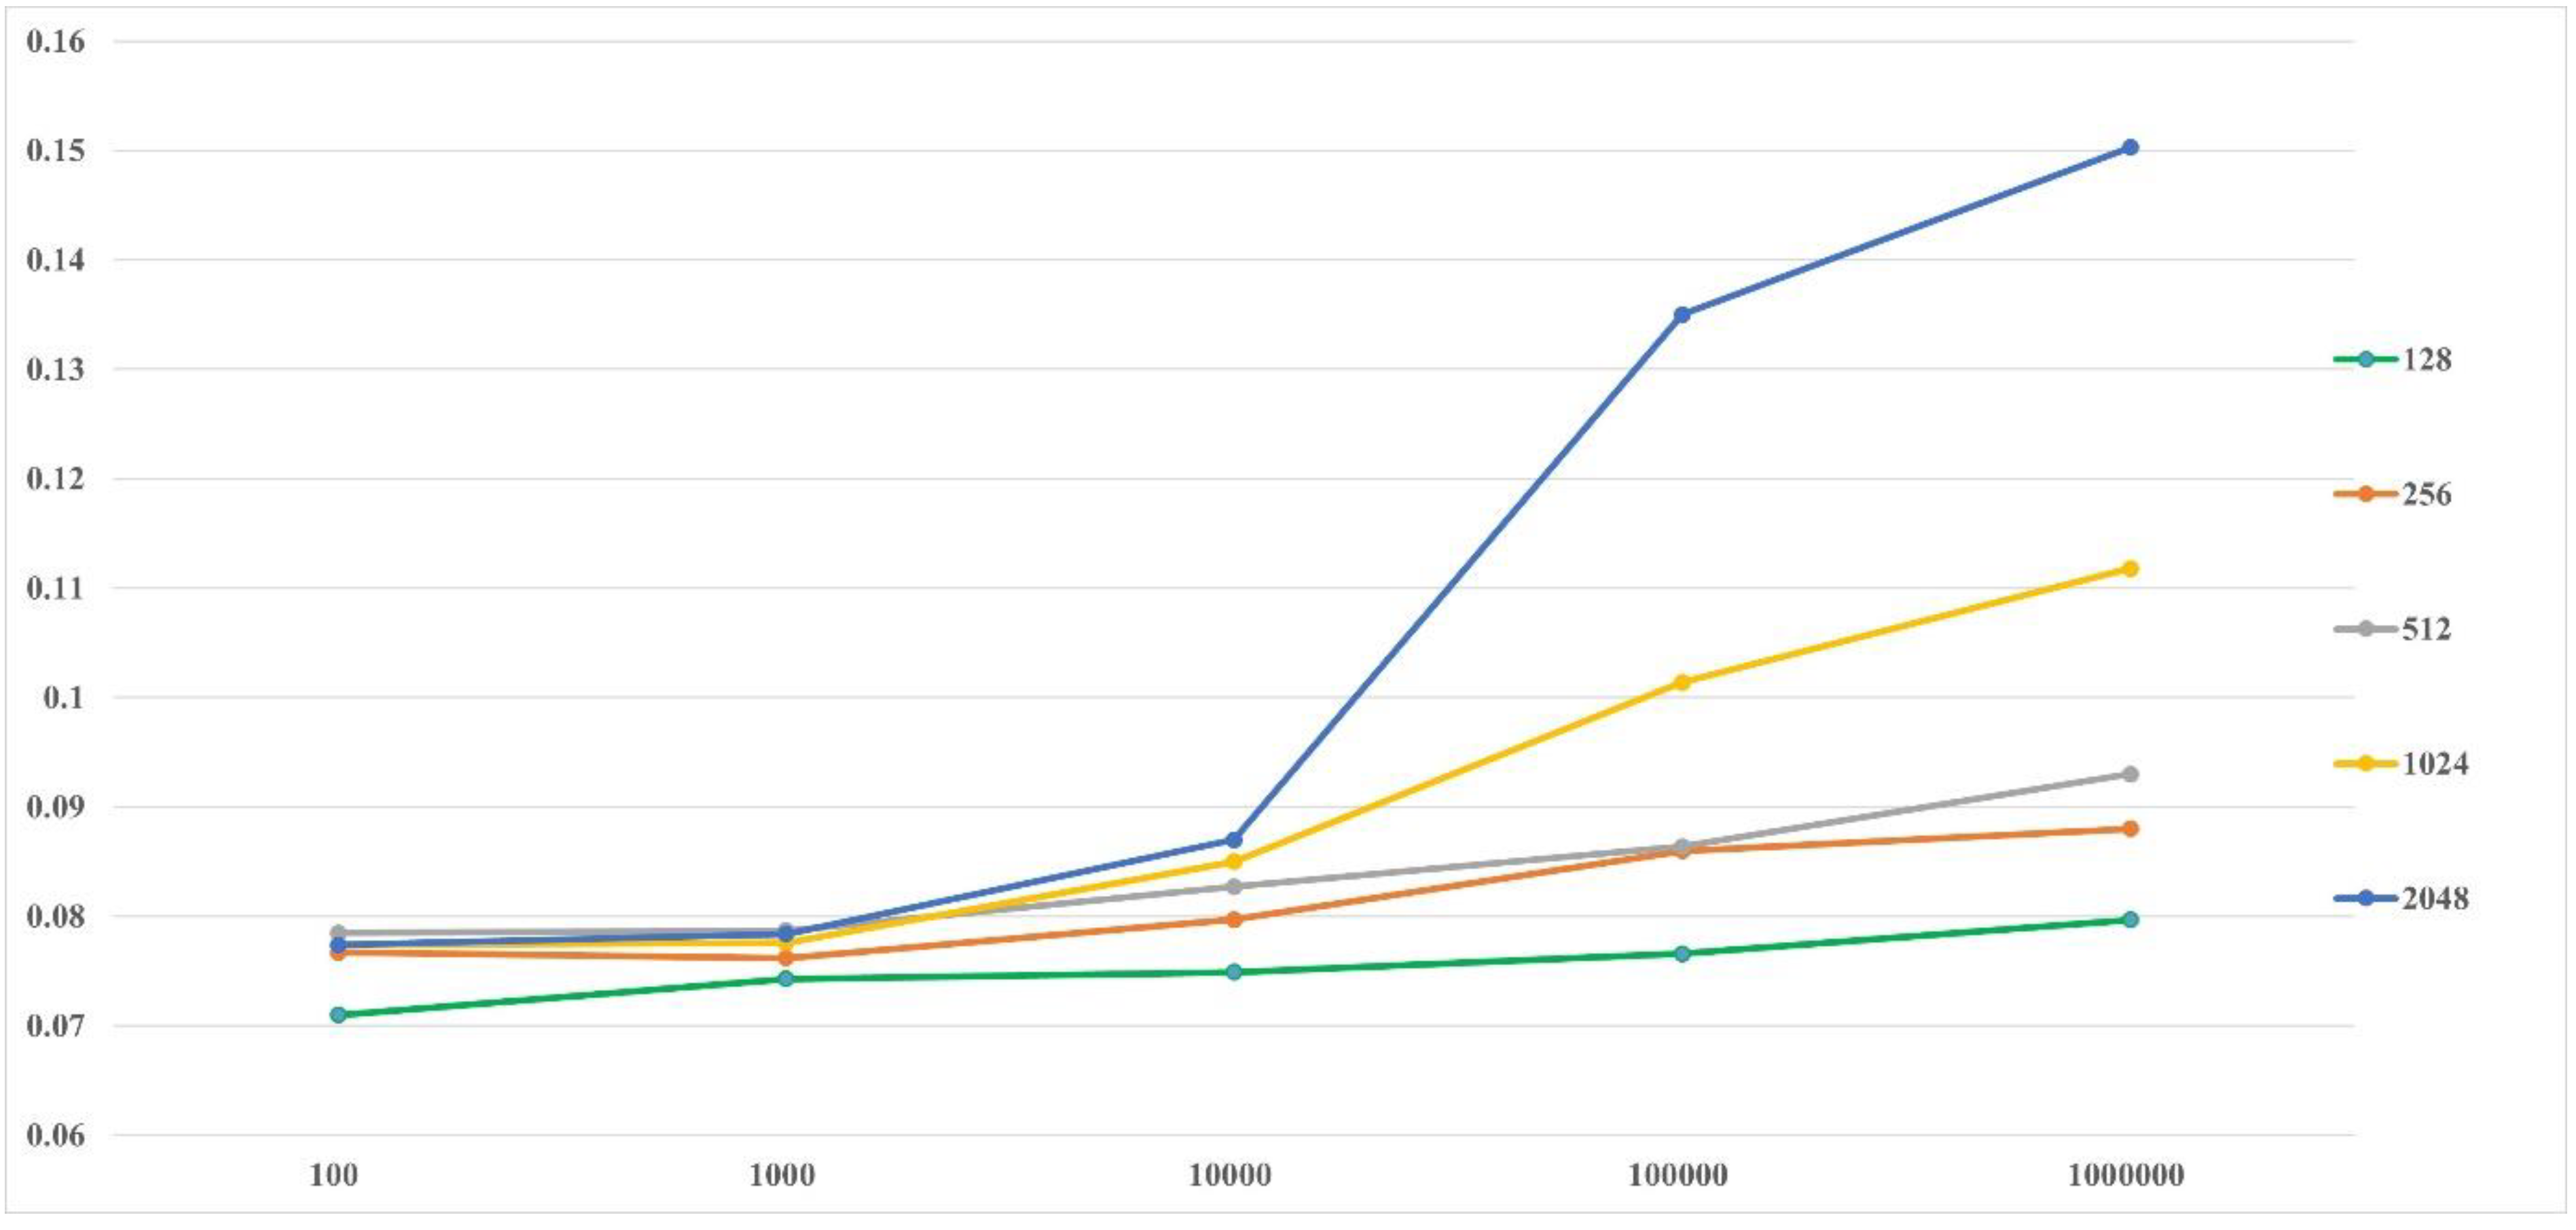
| Performance | ResNet50 with Different Number of Nodes | ||||
|---|---|---|---|---|---|
| 128 | 256 | 512 | 1024 | 2048 | |
| Precision | 98.83% | 98.83% | 99.14% | 98.91% | 99.06% |
| Similarity accuracy | 99.78% | 99.74% | 99.77% | 99.80% | 99.78% |
| Author(s) | Method(s) | Accuracy |
|---|---|---|
| Yin et al. [9] | Pre-trained model (Transfer Learning), KNN | 86.68% |
| Elhassouny and Smarandache [31] | MobileNet | 96.88% |
| Kathiresan et al. [32] | Modified Densenet-169 (Transfer learning), GAN Augmentation | 96.97% |
| Sagar and Jacob [33] | Pre-trained ResNet50 (Transfer Learning) | 98.52% |
| Proposed Method | Pre-trained model (Transfer learning) with fine-tuning, KNN | 99.78% |
Publisher’s Note: MDPI stays neutral with regard to jurisdictional claims in published maps and institutional affiliations. |
© 2022 by the authors. Licensee MDPI, Basel, Switzerland. This article is an open access article distributed under the terms and conditions of the Creative Commons Attribution (CC BY) license (https://creativecommons.org/licenses/by/4.0/).
Share and Cite
Gu, Y.H.; Yin, H.; Jin, D.; Zheng, R.; Yoo, S.J. Improved Multi-Plant Disease Recognition Method Using Deep Convolutional Neural Networks in Six Diseases of Apples and Pears. Agriculture 2022, 12, 300. https://0-doi-org.brum.beds.ac.uk/10.3390/agriculture12020300
Gu YH, Yin H, Jin D, Zheng R, Yoo SJ. Improved Multi-Plant Disease Recognition Method Using Deep Convolutional Neural Networks in Six Diseases of Apples and Pears. Agriculture. 2022; 12(2):300. https://0-doi-org.brum.beds.ac.uk/10.3390/agriculture12020300
Chicago/Turabian StyleGu, Yeong Hyeon, Helin Yin, Dong Jin, Ri Zheng, and Seong Joon Yoo. 2022. "Improved Multi-Plant Disease Recognition Method Using Deep Convolutional Neural Networks in Six Diseases of Apples and Pears" Agriculture 12, no. 2: 300. https://0-doi-org.brum.beds.ac.uk/10.3390/agriculture12020300