
A Digital Advisor Twin for Crop Nitrogen Management


1
Department of Bioengineering Sciences, Weihenstephan-Triesdorf University of Applied Sciences, Am Hofgarten 10, 85354 Freising, Germany
2
Department of Horticulture and Food Technology, Weihenstephan-Triesdorf University of Applied Sciences, Am Staudengarten 10, 85354 Freising, Germany
3
Organic Agriculture and Agronomy, TUM School of Life Sciences, Technical University of Munich, Liesel-Beckmann-Straße 2, 85354 Freising, Germany
*
Author to whom correspondence should be addressed.
Agriculture 2022, 12(2), 302; https://0-doi-org.brum.beds.ac.uk/10.3390/agriculture12020302
Submission received: 20 December 2021
/
Revised: 8 February 2022
/
Accepted: 11 February 2022
/
Published: 21 February 2022
(This article belongs to the Special Issue Application of Decision Support Systems in Agriculture)
Abstract
:Farmers and consultants face an unmanageable amount of diverse knowledge and information for crop management decisions. To determine optimal actions, decision makers require knowledge-based support. In this way, decisions can be improved and heuristics can be replaced over time. The study presents a digital knowledge base with an integrated decision support system (DSS), using the example of nutrient supply, specifically nitrogen (N), fertilization. Therefore, the requirements of farmers and crop consultants for DSS to inform fertilization decisions for winter wheat (Triticum aestivum L.) were elaborated using surveys, expert interviews, and a prototype test. Semantic knowledge was enriched by expert knowledge and combined in a web application, the Crop Portal. To map regional and personal decision making patterns and experiences, the tacit knowledge on the complex advisory problem of N fertilization is made digitally usable. For this purpose, 16 fuzzy variables were specified and formalized. Individual decision trees and their interactions with an integrative knowledge base were used to multiply the consulting reach of experts. Using three consultants and nine model farms from different soil–climate areas in Germany, the Crop Portal was tested under practical conditions and the perceived pragmatic and hedonic quality of the system was evaluated using a standardized questionnaire. The field test showed that the variation in fertilizer recommendations from the ‘digital advisor twin’ ranged from 5 kg N ha−1 to 16 kg N ha−1 when compared with the decisions of the experts in the field. The study presents the participatory development and evaluation of a rule-based DSS prototype in agricultural practice.
1. Introduction
1.1. Scientific Challenges
Crop production processes are complex, as they are influenced by the environment (soil, climate, weather), crop management (crop rotation, production system, field operations), and the genetics of the crop. These interactions and biological processes create the need for decision making throughout the growing season, but most critically during the vegetation period. Decisions are made on the basis of available information and practical knowledge but, increasingly, also through using decision support systems (DSS) [1,2,3]. To realize DSS, computer science methods and techniques are used in goal-directed action in environments that are not completely controllable, dynamic, and/or imprecisely known in advance. The ‘weak artificial intelligence’ of DSS can support human reasoning and technical applications in certain domains [4].
Nitrogen (N) fertilization is a major agricultural challenge that can be influenced by the fertilizer type and quantity, as well as the application timing and method. When optimizing the N supply in crop production systems, technical support is desired by farmers. Numerous dynamic factors, such as the previous crop, soil mineral nitrogen (SMN) content, and target yield, result in situations that require revised decisions every year. Depending on the optimization goal (maximum economic yield, maximum N use efficiency, etc.), farmers can determine appropriate field operations by weighing up different scenarios, including probabilistic evaluation (e.g., the precipitation needed for the targeted field operation (>20 mm) has a probability of 30%); the digital combination of information can inform such decisions.
In practice, assumptions and decision making processes are carried out by farmers or advisors on the basis of their experiential knowledge. Depending on the situation, this knowledge may be supplemented by the calculation of legal maximum amounts of application, weather apps, examination of the crop stand in the field, telephone calls with crop advisors, and documented field operations. Farmers generally combine this information intuitively, but decisions may lack quality as a result of this unstructured approach. Thus, a key challenge for DSS is to integrate practitioners’ long-established patterns, accumulated experience, and used heuristics—the so-called ‘invisible knowledge’—into the decision making process [5,6,7,8].
Although obtaining the information required for a single management unit (i.e., a field or several fields with the same site conditions) is achievable, the subsequent transfer of decisions to other areas with different site conditions, crops, and varieties is challenging, as the same practices may lead to dissimilar results in different fields. Therefore, initial factors must be assessed anew and answers must be combined to make the best possible decision for every field. To do this, many farmers are constantly improving their basis for decision making according to personal cost–benefit ratios, including the time spent gathering information or seeking advice [9]. Nevertheless, a lack of qualifications and the high technical and legal requirements for fertilizer decisions mean that many farmers are not able to correctly assess the interrelationships involved and can make poor decisions. Besides, uniform fertilization at the field level, or even across a crop, is prevalent. In Germany, these circumstances are some reasons leading to an N balance surplus of 80 kg ha−1 [10] and nitrate leaching, as 27% of the monitoring sites exceed the limit of 50 mg nitrate per liter [11].
1.2. Need for Research and Development
To make distributed data, information, and knowledge usable for farmers in a unified way, data interoperability and connection to a knowledge base without media discontinuity are needed. A particular challenge is to connect analog and digital data sources developed with different objectives, since a direct combination of information from different media is almost impossible. To inform the diverse tasks of farmers related to fertilization, applications for documentation and analysis e.g., [12,13], services for site-specific fertilization e.g., [14,15], and tools to support the decision respective the number of rates of application e.g., [16,17] are available. However, the majority of farmers choose not to use these stand-alone solutions because of privacy concerns, technology aversion, or a lack of profitability [18,19]. An integrative solution with comprehensive benefits that avoids multiple entries can address and reduce these obstacles.
The personalized recommendations of a crop advisor who knows the farmer and their farm are often sought [20,21]. In this context, farmers prefer high-quality independent advice rather than advice from industry and commerce [22]. However, face-to-face or single-farm advice has a limited sphere of influence because of the time and cost involved. Thus, technical support is required to maximize the reach of a single person while ensuring the quality of advice [22]. To test the digital multiplication of advisory services, a practice-oriented research approach is needed to formalize the expert’s decision making process [23,24]. The performance of such semi-automated consulting, in combination with an integrative digital knowledge base, must be tested [25,26].
A key challenge in building a knowledge base is the combination of invariant data, which must be sourced once (e.g., soil type and literature), with variable data, collected on a rotational basis (e.g., legal requirements), and real-time data (e.g., weather and GPS).
A methodology is needed to capture, annotate, and model expert and consultant knowledge to inform the management and optimization of crop N fertilization. Another challenge is to integrate this information into a knowledge base with spatial (e.g., for a soil–climate area) and temporal (e.g., observations from the previous 3 years) referencing. ‘Good enough’ decisions [27] should be replaced with knowledge-based decisions in the future. There is a need for research and development to support farmers and crop consultants in this respect while maintaining data transfer and interpretation capabilities. The goal of these powerful applications must be to combine topic- and question-specific content and output concrete recommendations for action on a farm to relax existing trade-offs between ecology, economy, and quality of life.
1.3. Purpose and Objective
The purpose of this work was to replicate the opinions of practitioners physically standing in the field, by creating a ‘digital advisor twin’. In doing so, a methodology had to be developed that reflects the language used in personal conversations between farmer and advisor, for example, to describe a perception (warm or cool) and reproduce this digitally. Imprecise formulations such as ‘in early locations the ear is already spiking’, ‘in late sown wheat’, or ‘in weak crop stands’ can be interpreted by farmers on the basis of their personal knowledge of the location, but for the purposes of this work, they must be transformed in a machine-readable way. The aim here was to concretize and digitize these, often ambiguous, formulations on the part of the consultants, which serve to cover as many eventualities as possible or to enable farmers to transfer the knowledge to other site conditions through help for self-help.
The objectives of this study were as follows:
- (1)
- to make advisor expertise on N fertilization digitally usable and multiply the advisory reach;
- (2)
- to develop a methodology to integrate, process, and retrieve information, data, and services concerning nutrient supply to crops, independent of the format and storage location of such information;
- (3)
- to develop a user interface in which the unified knowledge outputs are available in a web application, the Crop Portal;
- (4)
- to test and evaluate the DSS integrated into the Crop Portal.
Serving to reach these objectives, the present work focuses on the example of N fertilization of winter wheat, which is the most important crop in Germany in terms of area. The example includes the following technical aspects:
- (1)
- consideration of organic fertilization;
- (2)
- division of N fertilization into several rates of mineral N application;
- (3)
- determination of amounts of fertilizer applied in one rate;
- (4)
- determination of application dates.
2. Materials and Methods
Development of the web application Crop Portal was characterized by a participative approach and can be presented in three working steps:
- Analysis of the requirements for the performance of the knowledge base:
- (a)
- group interviews with farmers and crop consultants (the crop consultants involved in this study are working with the LKP (Association for Bavarian farmers));
- (b)
- discussion of data relevant to the N fertilization in winter wheat and the possibility of using these to improve the knowledge base in the Crop Portal.
- Formalization of expert knowledge and development of the DSS to make sound and site-adapted recommendations that are usable for farmers:
- (a)
- reflection on advisory discussions;
- (b)
- annotation of implicit expert knowledge to make it machine-understandable;
- (c)
- concretization of subjective language and vocabulary used → specification of 16 fuzzy variables;
- (d)
- elaboration of consultant-specific decision trees;
- (e)
- storage of decision patterns in OWL ontologies (RDF graph database);
- (f)
- optimization of the prototype through several field tests.
- Evaluation of the Crop Portal by farmers and consultants in the 2019/20 season:
- (a)
- evaluation of the perceived pragmatic and hedonic quality using a standardized questionnaire;
- (b)
- field test to quantitatively and qualitatively rank the advisory performance of the ‘digital advisor twin’ in comparison with the opinions of advisors and farmers.
The paper concludes with a discussion of the results.
3. Results
3.1. Data Needs and Formalization of Consultant Knowledge
To define the requirements for a knowledge base on fertilization, experienced consultants were accompanied in face-to-face and telephone meetings, information letters from the consultancy were viewed, and the common language usage of consultants and farmers was witnessed during exchanges on agricultural issues. The technique of shadowing was used to capture technical and regional knowledge, as well as the words, metaphors, and concepts from the user’s world that the system needed to represent. Shadowing offers the possibility to witness consulting sessions as inconspicuously as possible and to note down questions, answers, and observations [28].
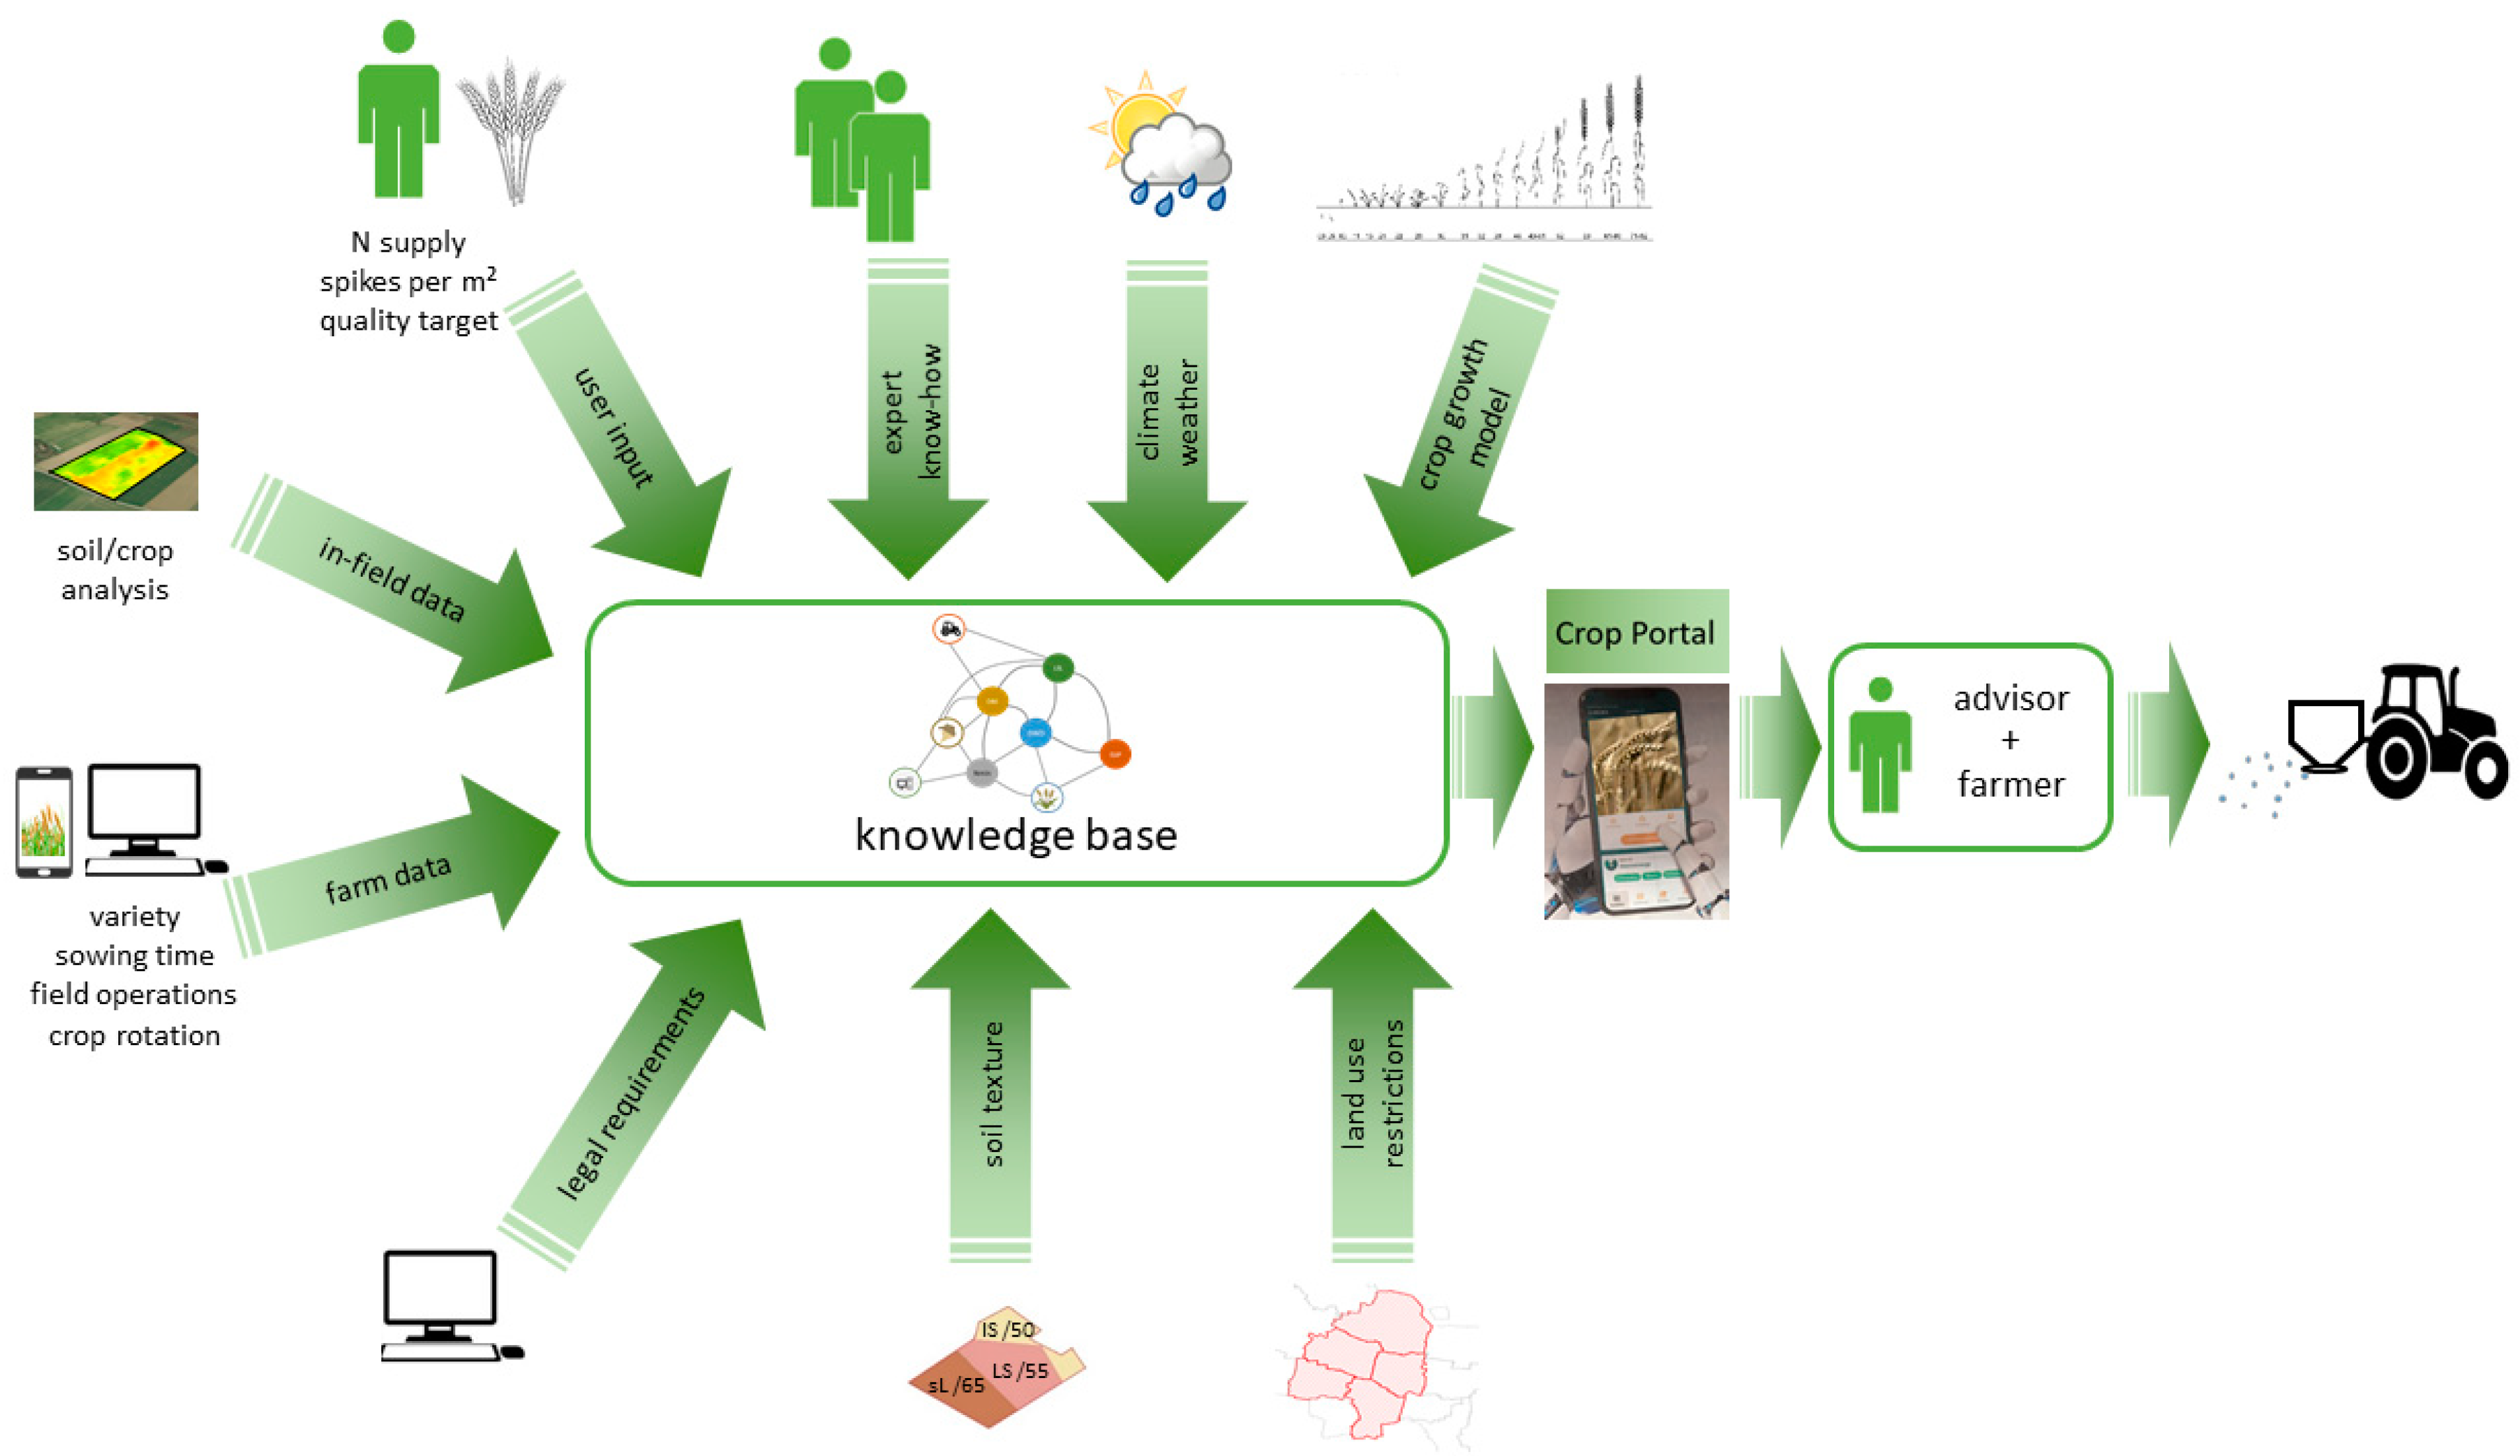
After 10 consultations on fertilization, including debriefing, no further sources of information or approaches to discussing fertilizer quantity and timing could be identified; thus, advisory support was discontinued after an additional five meetings. Accessible tools and media documented during the advisory meetings expanded the knowledge base (Figure 1).
The survey showed that respondents use the same decision parameters, but these are applied differently by the advisors, with variations in the surcharge and discharge rates (e.g., kg N ha−1), the interdependence of the variables, and the timing of application. No obvious relationship could be established between the farmers’ site descriptions and the advisory strategy; thus, further formalization of the decision process required advisor-specific modeling of the decision pattern used. To obtain an explicit and, as far as possible, declarative representation of expert knowledge, two advisors, each with more than 10 years of experience, were interviewed intensively regarding their decision making process for issuing fertilizer recommendations [29]. For this purpose, individual decision trees (individual cognitive maps) were developed for different N fertilization intensities. A similar approach for analysis of agricultural management practices of grasslands in Belgium was used by Vanwindekens et al. [30].
The decision trees are characterized by different parameters. These were subjectively perceived and mostly qualitatively described parameters, for example, the crop stand density. Stand density was usually described verbally as lush or thin and not with actual numbers (e.g., 1200 spikes per m2). For each of the N application rates in winter wheat, two decision trees were developed and implemented in the DSS. Hence, 16 variables related to soil, weather, or production methods flowed into the DSS via different decision trees, either directly or indirectly via auxiliary variables (e.g., query for the previous crop to select whether stem or leaf crop). These variables were measured or estimated qualitative parameters of the crop stand (e.g., risk of crop lodging, N mobilization, and N supply), as well as quantitative parameters (e.g., current crop stand density and N applied), which had to be recorded numerically at the time of the query (Table 1).
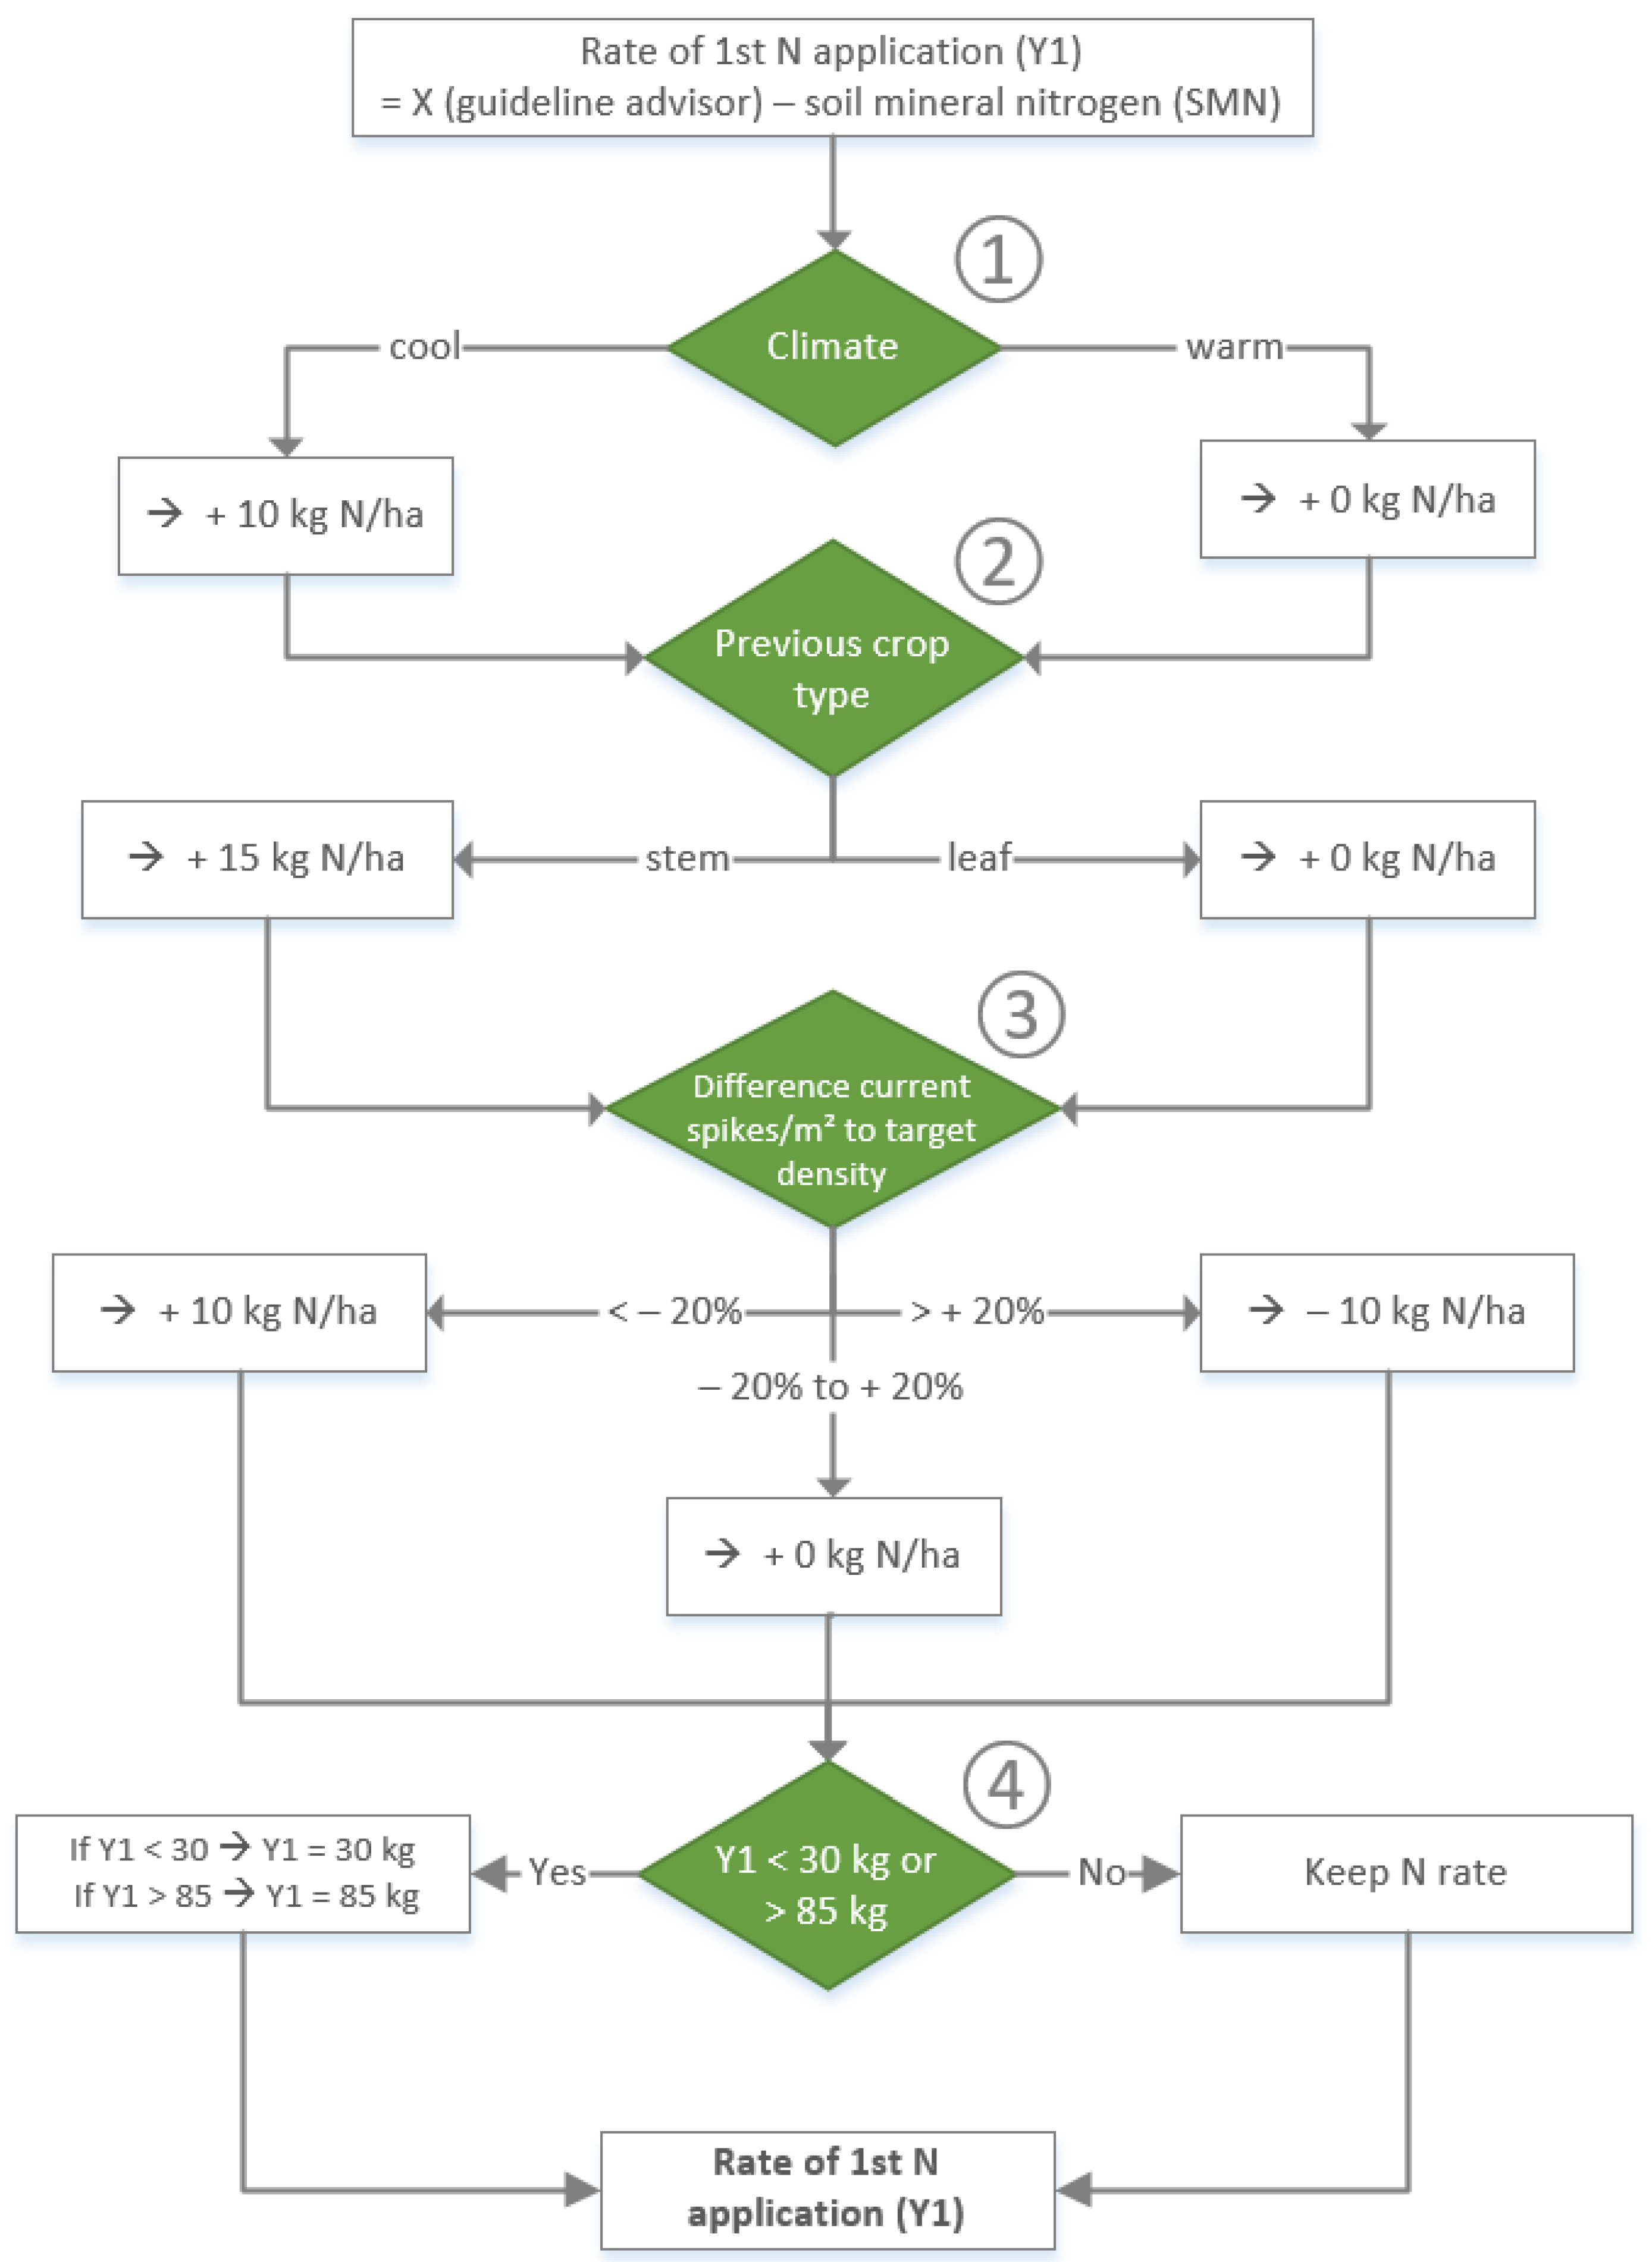
Possible fertilization strategies were linked to the patterns of the two modeled advisory decision trees. The optimization objective for all decision trees was maximum N use efficiency (NUE) = N output/N input. One of the decision trees for determining the rate of application (RoA) (kg N ha−1) for the 1st application is explained in more detail below (Figure 2).
The advisors’ rule of thumb for N requirements of the crop at the beginning of vegetation was 115 kg N ha−1 (X) for the 1st RoA. The scope of application of this rule assumes a yield potential of ≥80 dt ha−1 and includes the SMN content. It also assumes an average humus-rich mineral soil, with 1–2% humus. The parameters marked ① to ④, with the respective surcharge and discharge rates, are composed in Table 2. For more details on the explanation of the parameters, see Appendix A.
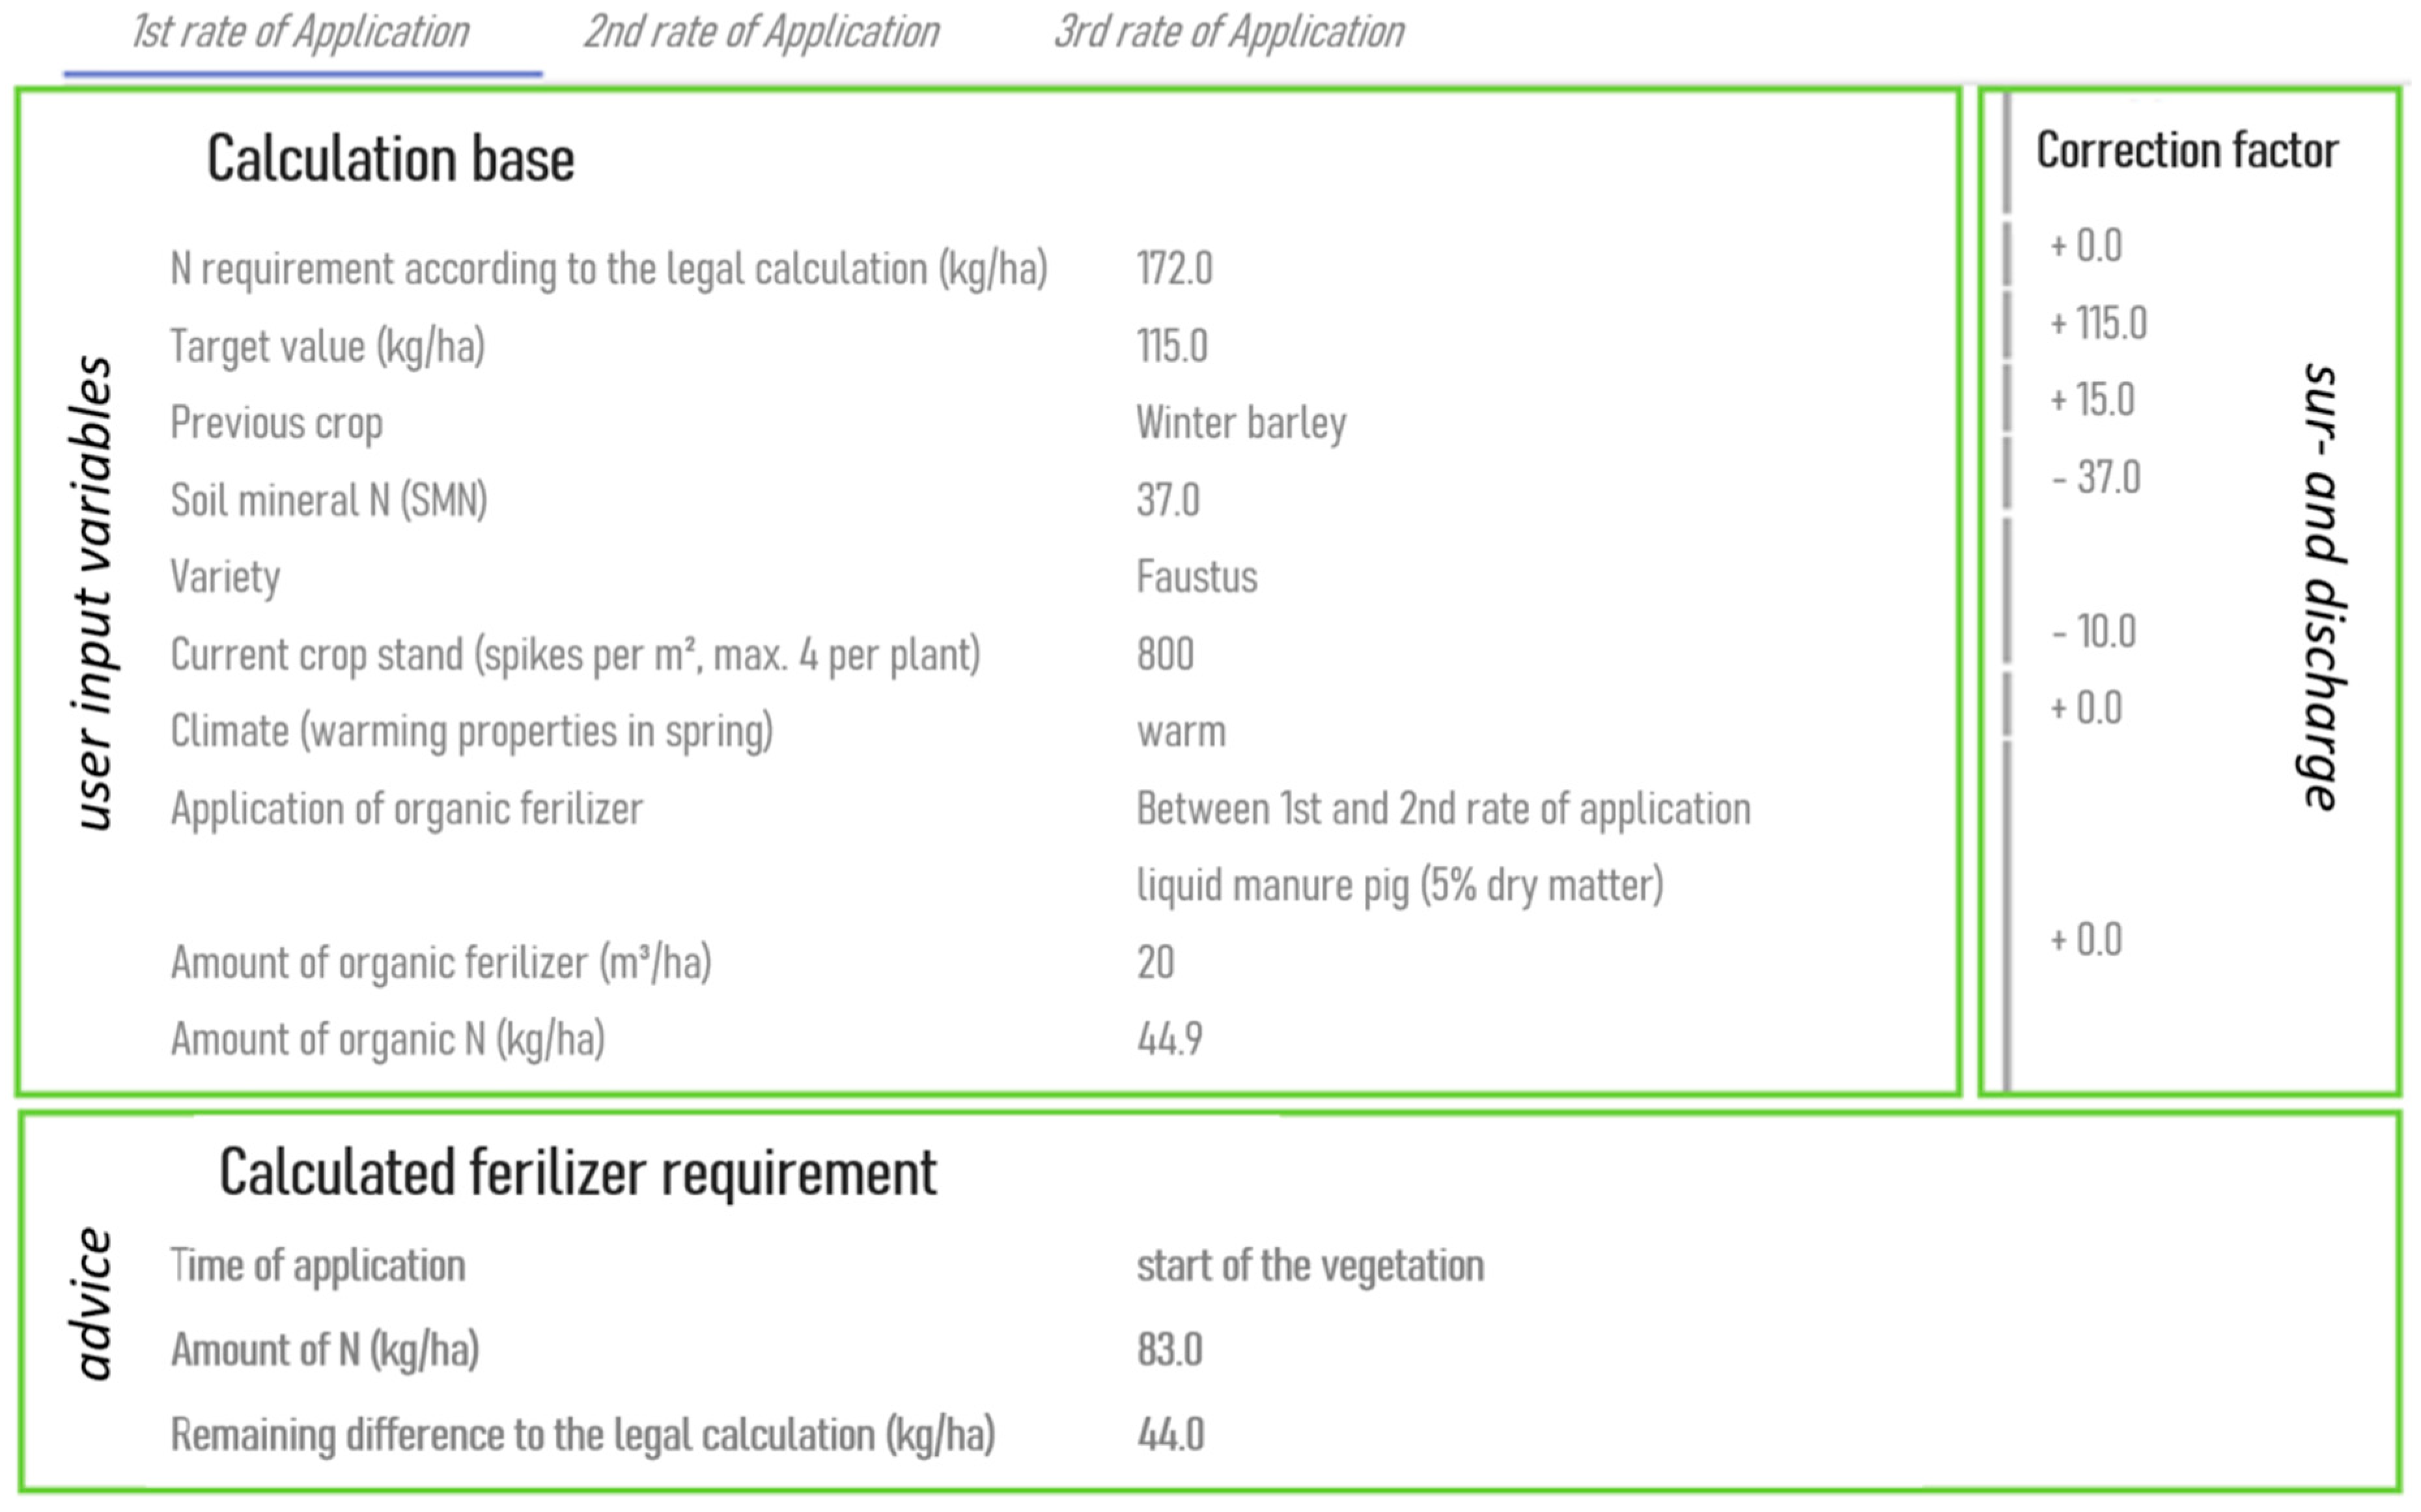
Figure 3 shows the output variables relevant to the 1st RoA together with the summarized input variables. The N requirements, determined according to the legally prescribed fertilizer requirement calculation [31], the previous crop, the SMN content, and the variety were queried from the knowledge base or connected external services (e.g., LKP soil information portal, record keeping software). For the crop stand density and the climate, as well as other parameters, the surcharge and discharge are displayed. The application of organic fertilizer has already been recorded as planned. As this application takes place between the 1st and 2nd application, the consultant does not consider any N effects expected when calculating the 1st application. The overall recommendation shown is an application of 83 kg N ha−1 at the beginning of vegetation. The timing depends on the crop stand density and the N supply of the crop at the time of calculation, the currently reached growth stage, and the weather forecast (displayed graphically but not processed automatically). According to the legal N requirement calculation (maximum RoA), a maximum of 44 kg N ha−1 may still be applied in the field. In this case, the planned organic N fertilization is already considered, with the recommended rate of mineral N application as an optional parameter (type of organic fertilizer, amount, and application date). The information enables the farmers to check its strategy ad hoc and to plan ahead.
The application enables a comparison and validation of the two fertilization strategies from advisors A and B, at the different locations of the model farms during the on-farm or virtual field tests. By running the cycle several times (modeling, evaluation, and optimization), the robustness of the methodology, as well as the corresponding recommended operations, were validated (Section 3.3).
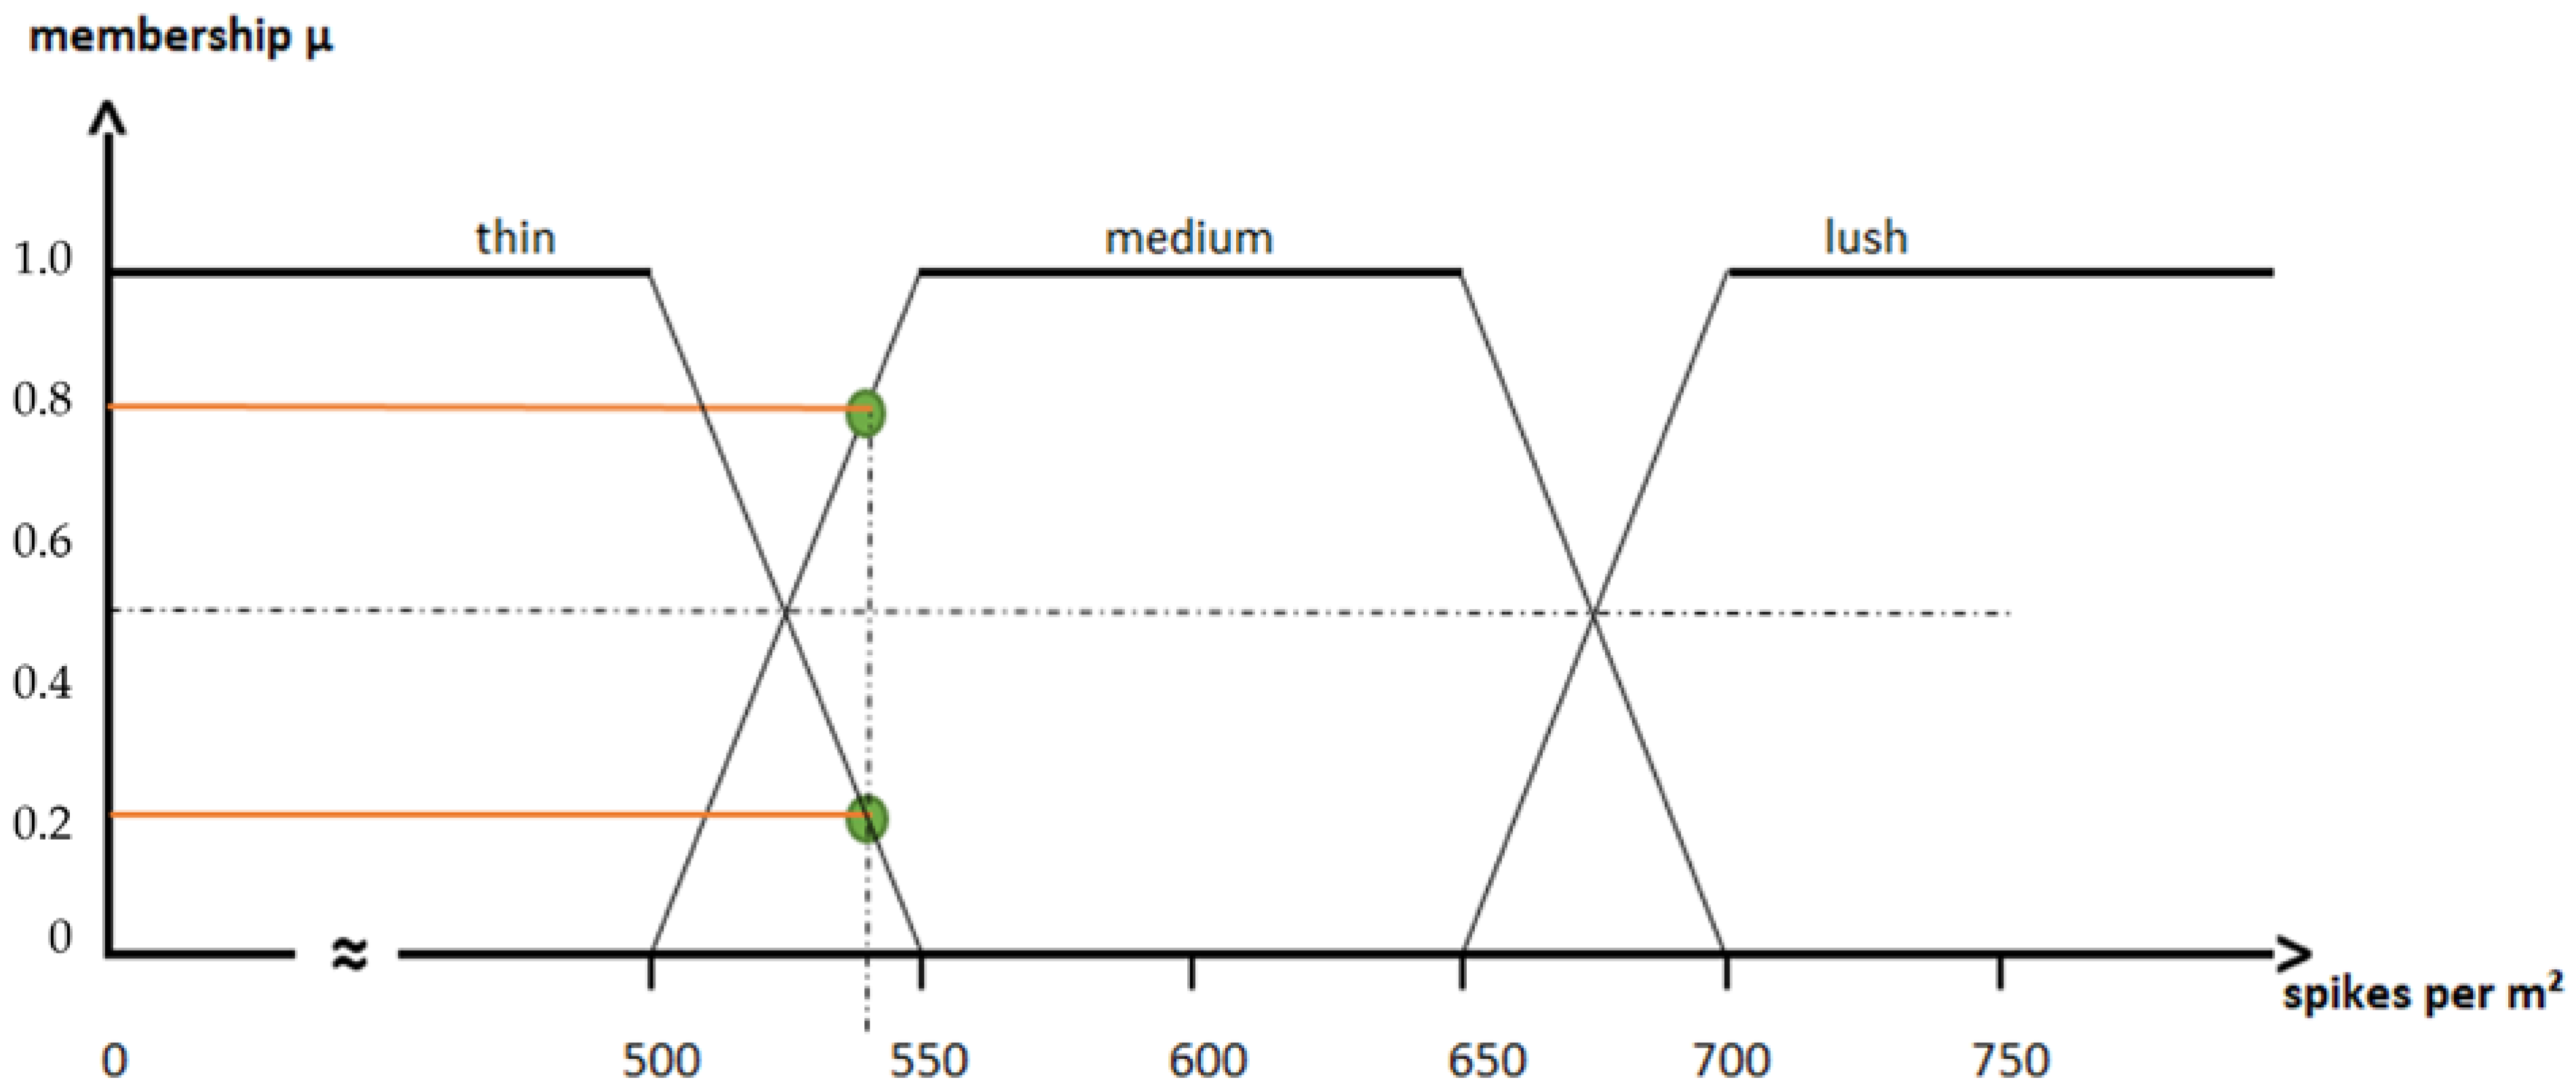
In the examples presented, attribute X has a uniquely assigned value. As a result of these limit values, there is no smooth transition between the systematization boundaries. In the future, such fuzzy variables (‘lush crop stand’) could be given relative weightings via a fuzzy membership function stored in the system, and thus, human thinking would be better represented [32]. Similar approaches have already been used to calculate the total amount of N applied in a season [33], including in milk and meat production [34]. An increase or reduction in the recommended application rate is, therefore, calculated proportionally, depending on the strength of the criterion. In the case of the variable ‘crop stand’ (Figure 4), intervals are defined in which a certain crop stand density is assigned as ‘thin, medium, or lush’. However, these intervals overlap, gradually increasing or decreasing, and there is a core interval where 100% affiliation is seen. Thus, a crop stand density of 540 spikes per m2 would have an affiliation µ of 0.2 to a ‘thin’ stand density and µ of 0.8 to a ‘medium’ density. The addition or deduction of the recommended amount of N required for this crop stand density can then be determined, for example, using a weighted average or other defuzzification methods: N surcharge at 540 spikes per m2 = 0.8 × 0 kg N + 0.2 × 10 kg N → 2.0 kg N ha−1.
3.2. Concept of the DSS and the User Interface (UI)
The aim was to provide a uniform knowledge base to represent formal knowledge from diverse agricultural sources, including public and private institutions. The UI of the Crop Portal displays relevant and current expert information for N fertilization of winter wheat to support legal compliance and site-adapted fertilization decisions. Formalized expert knowledge and individual farm and site data are processed to suggest the amount and timing of N application. Because of the diversity of data and degree of interconnectedness, it is insufficient to store raw data with implicit meanings that are relevant for consultation. To deal with the complexity involved, a formal descriptive language such as the Web Ontology Language (OWL) is needed. This language provides a semantic vocabulary for unambiguously modeling expert knowledge and machine understandability in uniform data structures in the form of ontologies. OWL ontologies and the semantic query language SPARQL Protocol and RDF Query Language (SPARQL) are open standards of the Semantic Web for linking data [35].
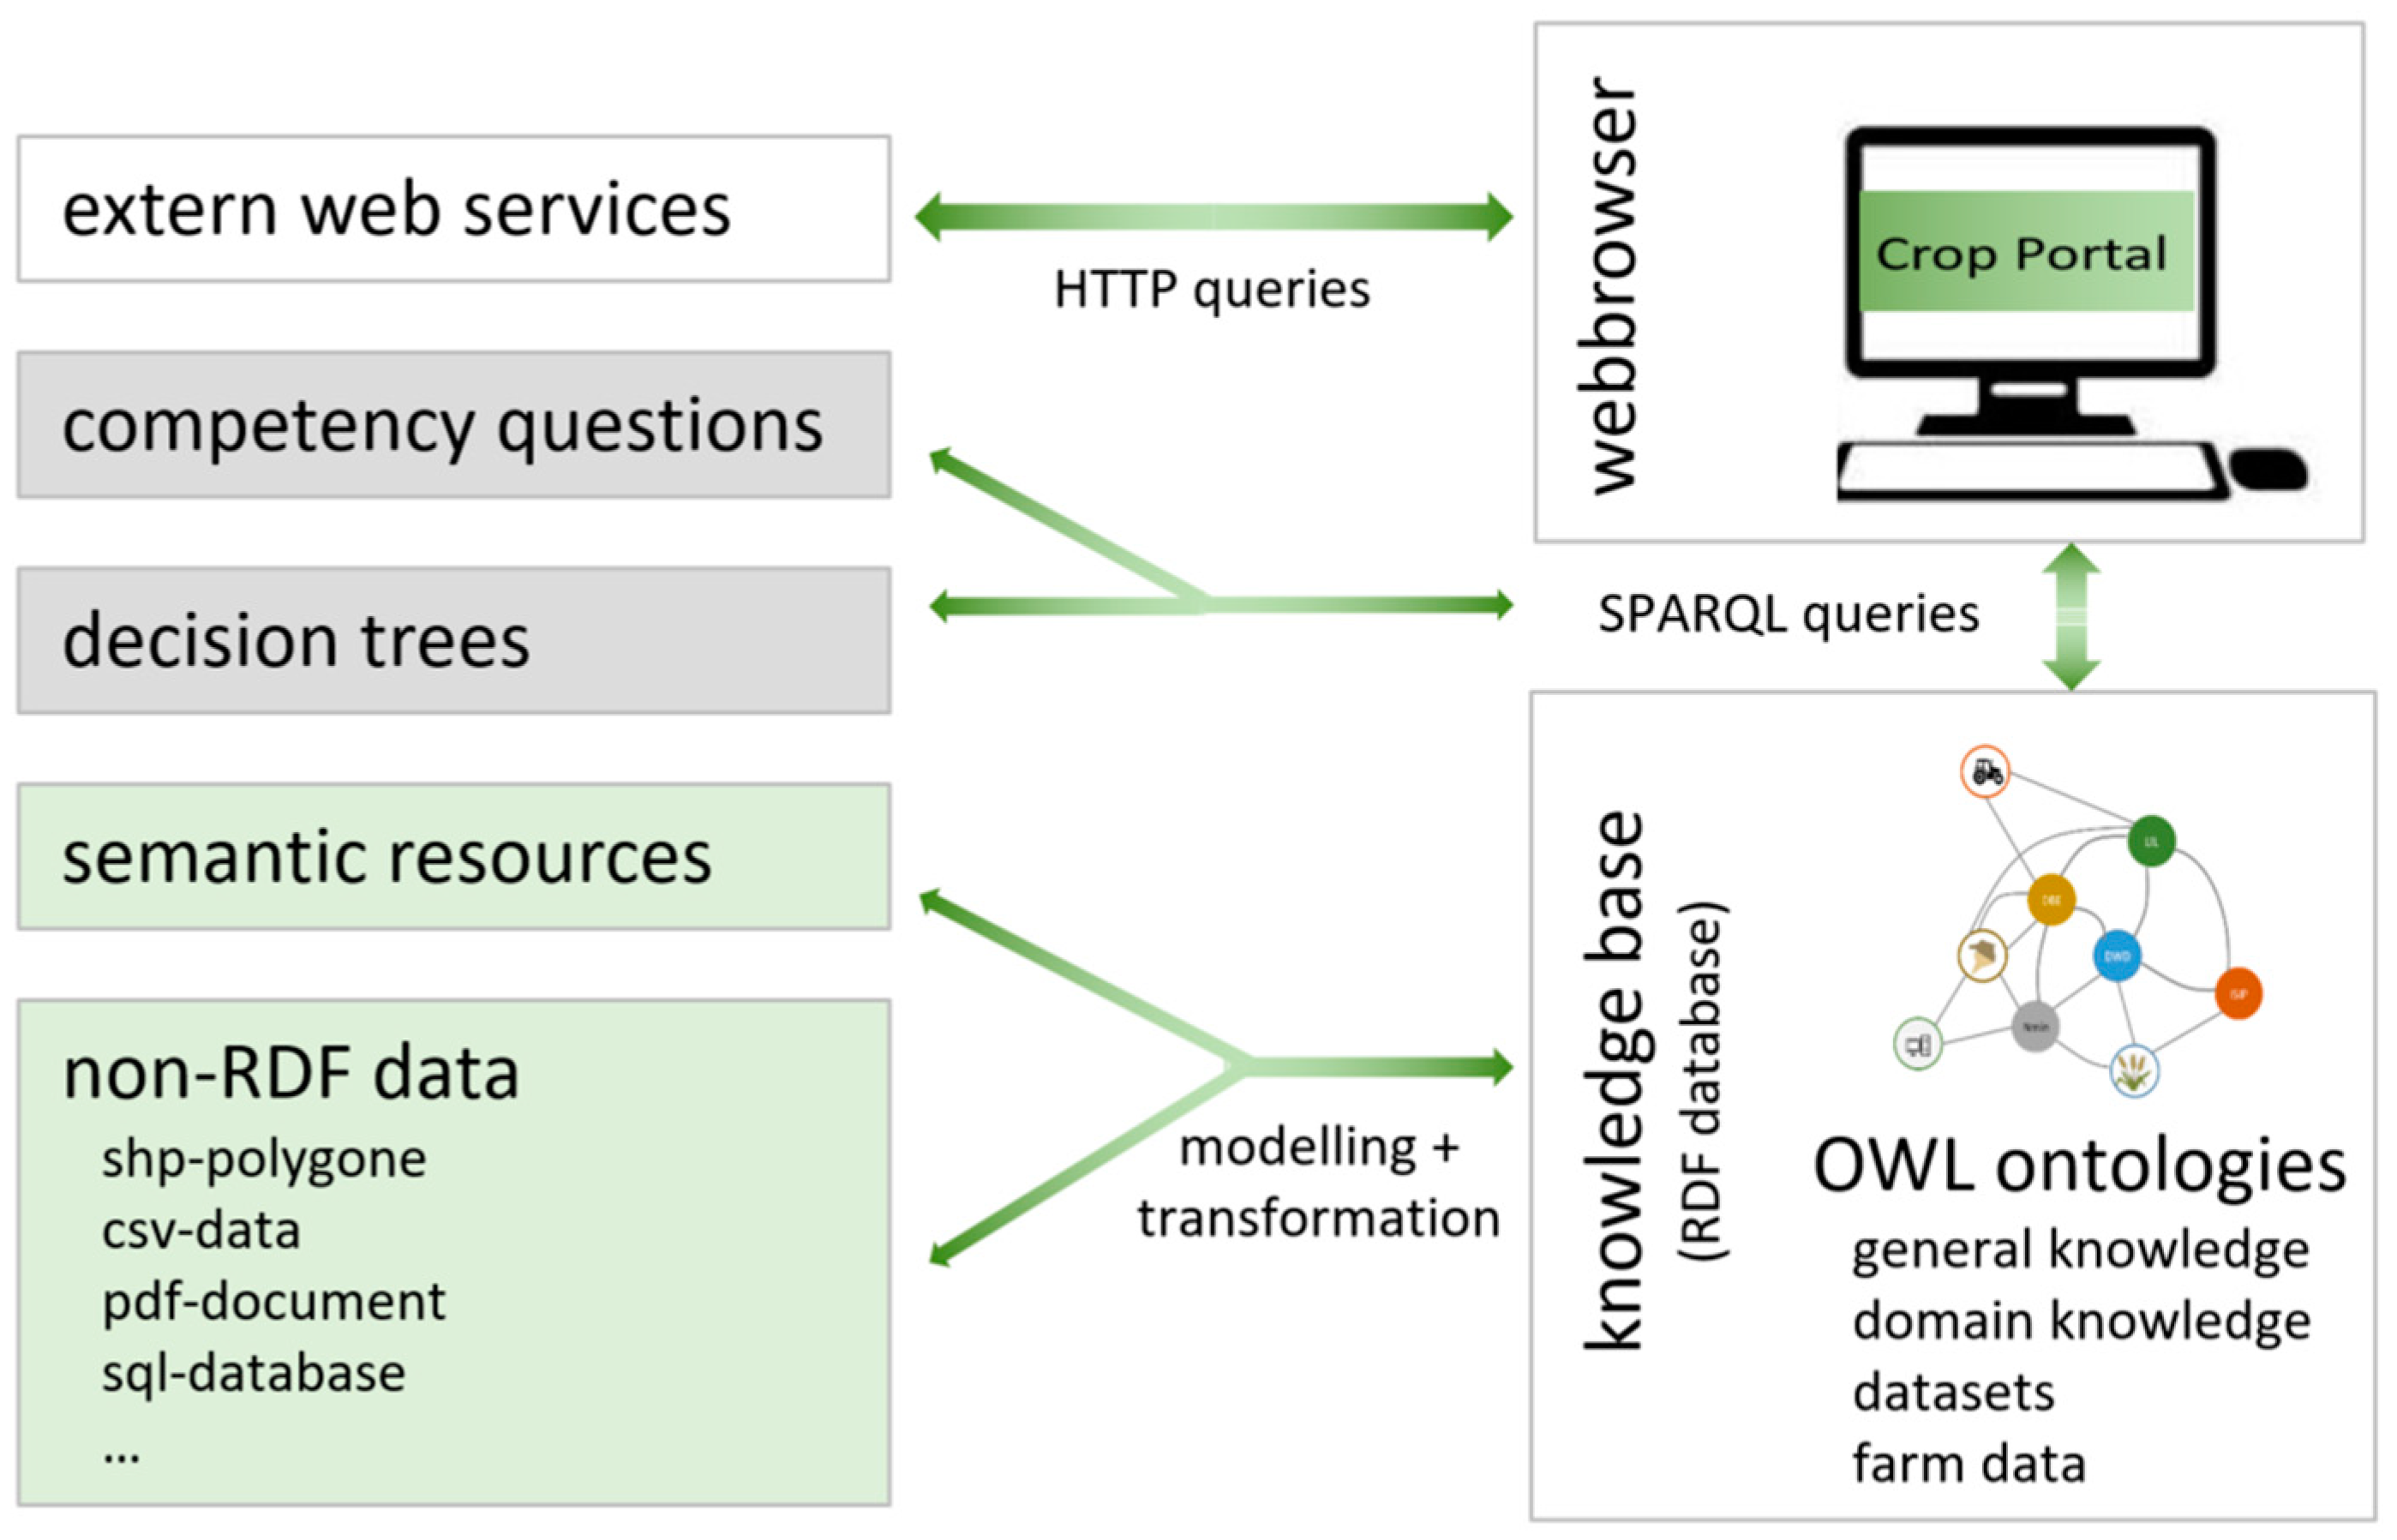
Figure 5 shows a schematic of the developed DSS. From existing semantic resources, such as ontologies available online, vocabularies (e.g., AGROVOC and QUDT), SPARQL endpoints, and non-RDF data sources (e.g., DWD raster maps, BBCH monograph [36], fertilization guidelines, and regulations), several OWL ontologies have been created using different software tools (e.g., Protégé, Ontop, and GraphDB OntoRefine) [35]. Here, the individual ontologies contain the modeled data structures, general and specialized knowledge, transformed datasets from data sources from different institutions, and farm data from individual model farms. The OWL ontologies are loaded into the central knowledge base of the DSS for storage, further processing, and querying. The knowledge base is an RDF graph database with an automatic reasoner that can infer additional facts from existing knowledge via semantic vocabulary [35]. The competence questions and decision trees are formulated as SPARQL queries so that they can be answered by the knowledge base [35].
Many parameters for the SPARQL queries are automatically filled using knowledge stored in, or logically inferred from, the central knowledge base. These include quantitative parameters, such as SMN content, as well as qualitative parameters, such as warming properties of the site. As part of the explicit modeling of human expert knowledge, these qualitatively described parameters were converted to quantitative ones (Section 3.1). Thus, the DSS queries the average temperature of the field from a DWD raster map to derive the corresponding parameter.
The expertise and operational data accessed by the decision trees are stored in the OWL ontologies so that the decision tree can be formulated as a parameterized SPARQL query. The application uses SPARQL queries to adaptively analyze the existing knowledge to automatically fill as many input variables as possible in the UI for the extended N requirements advice; this is done on the basis of individual farm data and reference values. For the SMN content, for example, farmers’ own investigations or regional reference values could be used. The formal semantics of the OWL vocabulary used to enable the influencing factors (such as the optimal number of spikes of the cultivated wheat variety and classification of previous crops as stem or leaf) to be semantically modeled in the class hierarchy and logically inferred.
A prototype UI was implemented for interactions between the end user and the DSS [35]. The UI parameterizes predefined SPARQL queries with automatically derived values and user input. Fully parameterized queries are sent to the central knowledge base for evaluation to display relevant farm, field, vegetation, soil, and weather information from different data sources (Figure 6, left). Such queries are also used to parameterize requests to external web services (e.g., SIMONTO [38]), to simulate BBCH stages. To complement these queries, the soil moisture and temperature profiles, and weather forecast from the closest weather station to the field, are embedded [35].
In the UI for extended N requirement advice (Figure 6, right), as many default values as possible are provided on the basis of existing and inferred expert knowledge and operational data in the central knowledge base. Thus, the SPARQL queries of the DSS formulated from the decision trees consider a wide variety of influencing factors to automatically suggest an individual N RoA recommendation.
The default values and input variables change according to the selected RoA (here it is the 1st RoA) and the selected consultant strategy. Default values can be checked by the user and adjusted if necessary. For example, for the calculation of the 2nd and 3rd RoAs, it is possible to adjust the target yield to the current yield expectation. The ‘yield expectation’ taken from the legal N requirement calculation (in the crop information field) remains unaffected. The information field ‘i’ shows the user the exact data origin when touching the button. Triggering ‘Calculate’ sends the query to the knowledge base and generates the recommendation, that also shows the surcharges and discharges on the basis of the calculations displayed in the results’ overview (Figure 3).
3.3. Evaluation in the Field, Results, and Discussion of the User Survey
In cooperation with three consultants and one to three model farms each, implementation of the prototype arable farming portal, including the graphical UI, was tested under practical conditions for the use of N fertilization of winter wheat. The implementation was subsequently evaluated using a standardized questionnaire. Additionally, the calculated nutrient quantities were compared and validated with the actual courses of action and recommendations. The cooperating farms in Lower Bavaria (Gäu, Danube, and Inn valleys), Swabia (Tertiary Hill Danube-South), and Upper Palatinate (decompositioned soils in the highlands, East Bavarian Hill) represented different soil–climate areas in Bavaria [39]. The desired conditions of the model farms (crop diversification, fertilizer regime, farm size, field size, with/without livestock, etc.) supported the derivation of parameters that were as ‘universal’ as possible so that a diversity of farms was represented.
The knowledge modeling and software development were frequently tested via the UI on a tablet or laptop in the field. The input variable mask was saved and ambiguities of the elaborated decision trees were discussed. Although the field visits for the 1st RoA were accompanied by research assistants, communications regarding the 2nd and 3rd RoA were conducted via phone, video, and e-mail. For documentation of the crop stand, numerous photos were exchanged and a questionnaire was used to query decision-relevant parameters for the RoA.
3.3.1. Evaluation of the UI
To measure the experience of using the software prototype, a standardized questionnaire ‘User Experience Questionnaire’ (UEQ) was used [40]. The evaluation was carried out by the participating farmers both during the 1st application and for evaluation of the 1st, 2nd and 3rd applications at the end of the crop cycle. Each evaluation was carried out after the fertilization operation had been planned in the Crop Portal.
The first part of the questionnaire served to determine whether the contents shown were presented in an understandable way and were relevant and interesting for the farmers and consultants. The individual questions assessed the perceived both ‘pragmatic quality’ and ‘hedonic quality’. The pragmatic quality is task-related and includes the usefulness and usability of the application or the information. Hedonic quality reflects the user enjoyment beyond mere usefulness. It addresses the human need for curiosity and stimulation. The perceptions of both qualities influenced the overall judgment.
In the second part of the questionnaire, the UI itself was evaluated. The focus here was on user-friendliness, comprehensibility, and the novelty of the UI.
The Crop Portal UI was presented to the farmers and advisors of the model farms and discussed with them. Immediately before the decisions to apply the 1st, 2nd and 3rd RoAs, three wheat fields were inspected by the farmers and/or the corresponding advisor.
Questionnaire on the Crop Portal for the 1st RoA
After farm-specific use of the Crop Portal to plan the 1st RoA, the support was evaluated by the users. The shown contents (chosen parameters, recommendation in kg N ha−1, etc.) were, on a scale from −3 (very bad) to +3 (extremely good), rated positively (1.8), and the pragmatic quality was rated better (2.1) than the hedonic quality (0.9).
When evaluating the usability, comprehensibility, and novelty of the UI, the pragmatic quality was rated at 2.4. The novelty or enjoyment of the product was rated at 0.9. Overall, it could be determined from the survey results that the content, UI, and handling were appreciated by the target group, but the attractiveness may have been reduced by the fact that there are already many commercial software solutions in this area, which may have been used (unconsciously) as a comparison.
Overall Evaluation of the 1st, 2nd, and 3rd RoAs
The final evaluation of the Crop Portal was conducted via videoconference with each farmer on a one-to-one basis. A total of seven farmers and two consultants participated in the survey. The consultation was used to provide the testers with remote access to the Crop Portal so that they could move freely within the application and make appropriate entries. For this purpose, the same farm or area example was chosen for each tester, so that a comparable evaluation, for example, of the ‘intuitive user control’, was possible. Besides the repeated evaluation of content and UI, there was an open question section.
Questionnaire on the Crop Portal in General
The content shown was rated as very positive by the respondents (Figure 7). Compared with the previous survey on the 1st RoA, the hedonic quality in particular improved from 0.9 to 2.0, which can be explained by the further development of the Crop Portal between surveys. Hence, content considered necessary by the farmers was explicitly included (e.g., display of the soil temperature). The pragmatic quality of the UI was rated as 2.1.
Note that one respondent gave inconsistent answers for individual topics. As the number of participants was already low, the questionnaire was not removed from the evaluation, especially since the impact on the overall results was minimal (±0.1).
For the final survey, users described their experiences using the product using 26 bipolar word pairs, which were assigned to the topics below (Figure 8). The questions on originality (Is a product novel, creative, or original?) received average ratings, whereas the remaining questions received above-average ratings.
Summary of the Results of the Open Question Section
- How would you use the application on your farm or integrate it into your daily operations?
The farmers stated that they would use the application for farm planning, documentation, and networking with other data (e.g., yield mapping) on the farm. Fertilizer operation documentation and planning, as well as calculation of the RoA, were explicitly mentioned. Additionally, the possibility of comparing several years was welcomed.
- What information would still need to be added in your view?
Most of the respondents felt that the information displayed was complete. Suggestions for additions concerned the display of water protection areas, consideration of the application technique in the crediting of organic fertilizer (N utilization rate), and documentation of fertilization by storing the operator and date of application. There was also interest in information regarding other nutrients, such as phosphorus, potassium, and magnesium. The integration of further area-specific information (e.g., water protection areas and nature reserves) and other legally required calculations for compliance with the German Fertilizer Ordinance (e.g., nutrient flow balance) were also mentioned. For the further development of the semi-automatic decision support, more input variables, such as the ‘value of the N-tester’ [41], would also make sense.
- What do you understand by a DSS?
The understanding of a DSS was not consistent and was, therefore, difficult to reduce to a few core statements. The information provided by the interviewees is presented below, as true to the original as possible:
- Processing of different data related to the production process and the operations (e.g., plant protection products, weather, and restrictions for application);
- Knowledge-based advice that can be ‘accepted’ but also ‘edited’;
- Answering concrete questions in acute decision-making situations;
- Systems that help with legal compliance, display limits, and provide an overview of the daily work;
- Display of weather forecast, forecast models for diseases, pesticide database (e.g., display of requirements, license information);
- ‘A system that helps make decisions’;
- Farm-specific recommendations;
- Support in ‘extreme situations’ (e.g., heavy rainfall after fertilization and calculation of nutrient displacement, herbicide application on slopes, and waterside runoff); interactions between calculated and apparent (assessed by the farmer) conditions and on-site information;
- Claas CEMOS Automatics, an app for optimizing threshing units (semi-automatic).
- Which DSS do you use on your farm?
The following systems were defined and listed by the farmers: weather apps, print and online media, LKP advisory manual, LKP plant protection app, LKP soil information portal (inclusive legal fertilizer requirement calculation), advisor, record keeping software and farm information management systems, scouting app (weed identification), an app for threshing optimization.
In an expert workshop with two consultants, the evaluation results obtained in the testing phase were examined. Subsequently, the revised final version of the Crop Portal was demonstrated, and how the advisors would use the semi-automatic DSS in their everyday advisory work was discussed. The answers were
- ‘Perfect to back up one’s own opinion’;
- ‘Intensively advised farms could be advised even more precisely’;
- ‘In the case of the advisory hotline, such a consolidation of information, for example after registration of the caller by its farm number or an area number, would ease work considerably. However, if too many input variables have to be added manually first, the concept is not feasible under time and cost pressures (named cause: low willingness of farmers to pay for advice)’;
- ‘The Crop Portal would motivate many farmers to give data access, as they can immediately see the benefit in processing their data. However, farms would also need to be motivated to maintain their data in the medium term’;
- ‘Support for complex decisions, such as advice in water protection areas in compliance with various restrictions’;
- ‘The final decision should remain with the farmer’, cf. [42].
3.3.2. Evaluation of the Semi-Automated Fertilizer Application Recommendation
To evaluate the proposed amount of N to be applied, the advisor’s recommendation proposed during the field inspection was used for the 1st application. For evaluation of the 2nd and 3rd RoAs, the real applied N quantity (farmer’s decision) was used as a comparison. Compared with the farmer’s or advisor’s opinion, deviations in the recommendations based on the decision trees for the advisors’ own areas ranged from 5 to 16 kg N ha−1 (Table 3) and between 10 and 21 kg N ha−1 when other advisory areas were included. It can, therefore, be deduced that a transfer of decision patterns to other soil–climate areas cannot be adequately represented by the variables considered.
To assess the results, a comparison was used. The deviation of the desire from the actual amount of fertilizer applied through the fertilizer spreader was estimated by several experts at 10–15% if no calibration took place before application. With an average application of mineral fertilizer of 120 kg N ha−1, this represents a deviation of approximately 12–18 kg N ha−1. Additionally, there may be an uneven cross-distribution.
Table 4 shows how much the recommendations deviated from the decisions of the consultant in the field. The average deviation of the application from decision tree B for the 1st RoA on the fields of farms A, B, and C was 11.2 kg N ha−1.
The average deviation of the recommendations of consultant B for the fields of region B was 5.4 kg N ha−1. Readjustments to reduce the deviation at ‘Beckeracker’ and ‘Vogler Schlag’ were made in the system:
- ‘Beckeracker’: silage maize, as the previous crop, was calculated using the impact of a leaf crop (narrow C:N ratio). The differentiation that corn is treated as a stem crop was not modeled. This resulted in a surcharge of 15 kg N ha−1.
- ‘Vogler Schlag’: the preceding crop, sugar beet, was discussed with consultants and farmers. Subsequently, but without effect on the results in the test year, a surcharge of 15 kg N ha−1 was calculated for previous crops of sugar beet and yields of more than 100 dt ha−1.
The average deviation, considering these two changes, was only 2.8 kg N ha−1 for the fields in region B.
The results from tree A for the 1st RoA tended to be higher than the fertilizer applications targeted by the farmer/consultant. Tree B, conversely, underestimated N fertilization for the 1st RoA. Then, for the 2nd RoA, the amount of N resulting from tree B was greater than that of the real application. This discrepancy was a result of the different fertilization strategies (strong stimulation of winter wheat in the 1st or 2nd RoAs). The choice of decision tree should be made with this in mind. The sum of the 1st and 2nd RoAs (recommendations across the consulting area) resulted in a deviation of 15.5 kg N ha−1 for tree A and 16.5 kg N ha−1 for tree B. Whether this can be attributed to the soil–climate area or the variety remains unclear. Moreover, because of the limited data, the question remains open as to whether these fertilization strategies can decisively influence yield components or whether the compensatory capacity of the wheat offsets these supply differences. To address this question, experiments would have to be conducted over several growth periods. Looking at the sum of the 1st and 2nd RoAs, the use of the decision tree of advisor A in area B showed an average deviation of 12.2 kg N ha−1. Testing the decision tree in its respective advisory region reduced the deviation to 9.2 kg N ha−1. The use of the decision tree of advisor B in area A resulted in a deviation of only 4.7 kg N ha−1, but its application in area B resulted in a deviation of 12.5 kg N ha−1.
The dynamic recommendations were compared with the ‘standard recommendations’ from the official advisory service [37], i.e., ‘1st RoA 60 kg, 2nd RoA 50 kg, 3rd RoA 60 kg’: For the 1st RoA, 79% of the recommendations were within a tolerance range of ±10 kg N (11 of 14) for consultant A and 29% (4 of 14) for consultant B. Here, a deviation of ±10 kg was confirmed as an ‘absolutely justifiable margin of discretion’ by the consultants. For the 2nd RoA, 57% were within the tolerance limits (8 v. 14 for advisors A and B, respectively). Comparing the advisor recommendations or farmer decisions with the standard recommendations at the respective dates, 67% (8 v. 12) of them were within the tolerance range at the 1st RoA and 53% (8 v. 15) at the 2nd.
The sums of the actual applied amounts deviated on average by 5.2 kg N ha−1 (17 observations) from the standard recommendations (14 observations, because three farms did not do a 2nd application). The total amount applied ranged between 60 and 138 kg N ha−1. Nine of 14 decisions (64%) were in the tolerance range (±20 kg N ha−1 for two RoAs).
Causes of Discrepancies between Crop Portal and Expert Opinion (Consultant/Farmer) in the Field
- The recommendations on the basis of decision tree A for the 1st RoA resulted in a postponement of the 1st application or a combination with the 2nd application at the main stage of tillering in three fields. Consequently, the 1st application was omitted and the comparison was, accordingly, drastic as it was a comparison of the advisor’s or farmer’s application with 0 kg N ha−1. This pooling resulted in a continuing discrepancy for the 2nd RoA.
- Similarly, discrepancies were found in crop stands that already had a high N supply (high humus content, many years of organic fertilization). For a crop stand with above-average development, the consultant and the farmer determined a low 1st fertilization rate (30 kg N ha−1). Such extreme sites were not considered in decision tree A for the 1st application. The suggested N amount was 70 kg N ha−1. For decision tree B, this problem arose for the 2nd RoA since only a discharge of 10 kg N ha−1 was deducted for extremely lush crop stands.
According to the consultant, the decision patterns have relevance when assuming yields of >80 dt ha−1, predominant N supply is via nitrate-containing fertilizers, and an SMN content of approximately 60 kg ha−1. Additionally, the basic strategy is to ‘always keep the crop green’. Should reality deviate from these assumptions, the fertilizer pattern cannot be applied.
4. Discussion
The method presented for knowledge acquisition is transferable to other types of advisors and other soil–climate areas by adapting the modeling. In this specific case, there was agreement among the experts that the observations of advisors and farmers should be significantly increased. With tracked data from the use of the Crop Portal, accompanying field trials, and analysis of best management practices, the amount of data increases and the knowledge base can be further specialized and variables adapted to specific sites [43,44,45,46]. By offsetting all variables that influence the plant growth and the soil N mineralization, such as the previous crop, location, weather, yield, with the indicators of the fertilization strategy, such as N use efficiency, N balance, humus balance, the surcharges and discharges of the RoAs could be made more precise in the future. For example, by using not only symbolic but also subsymbolic artificial intelligence (AI), the recommendations could be optimized. The short-term goal is to adapt the two-modeled decision making processes to other soil–climate areas, with the involvement of additional consultants.
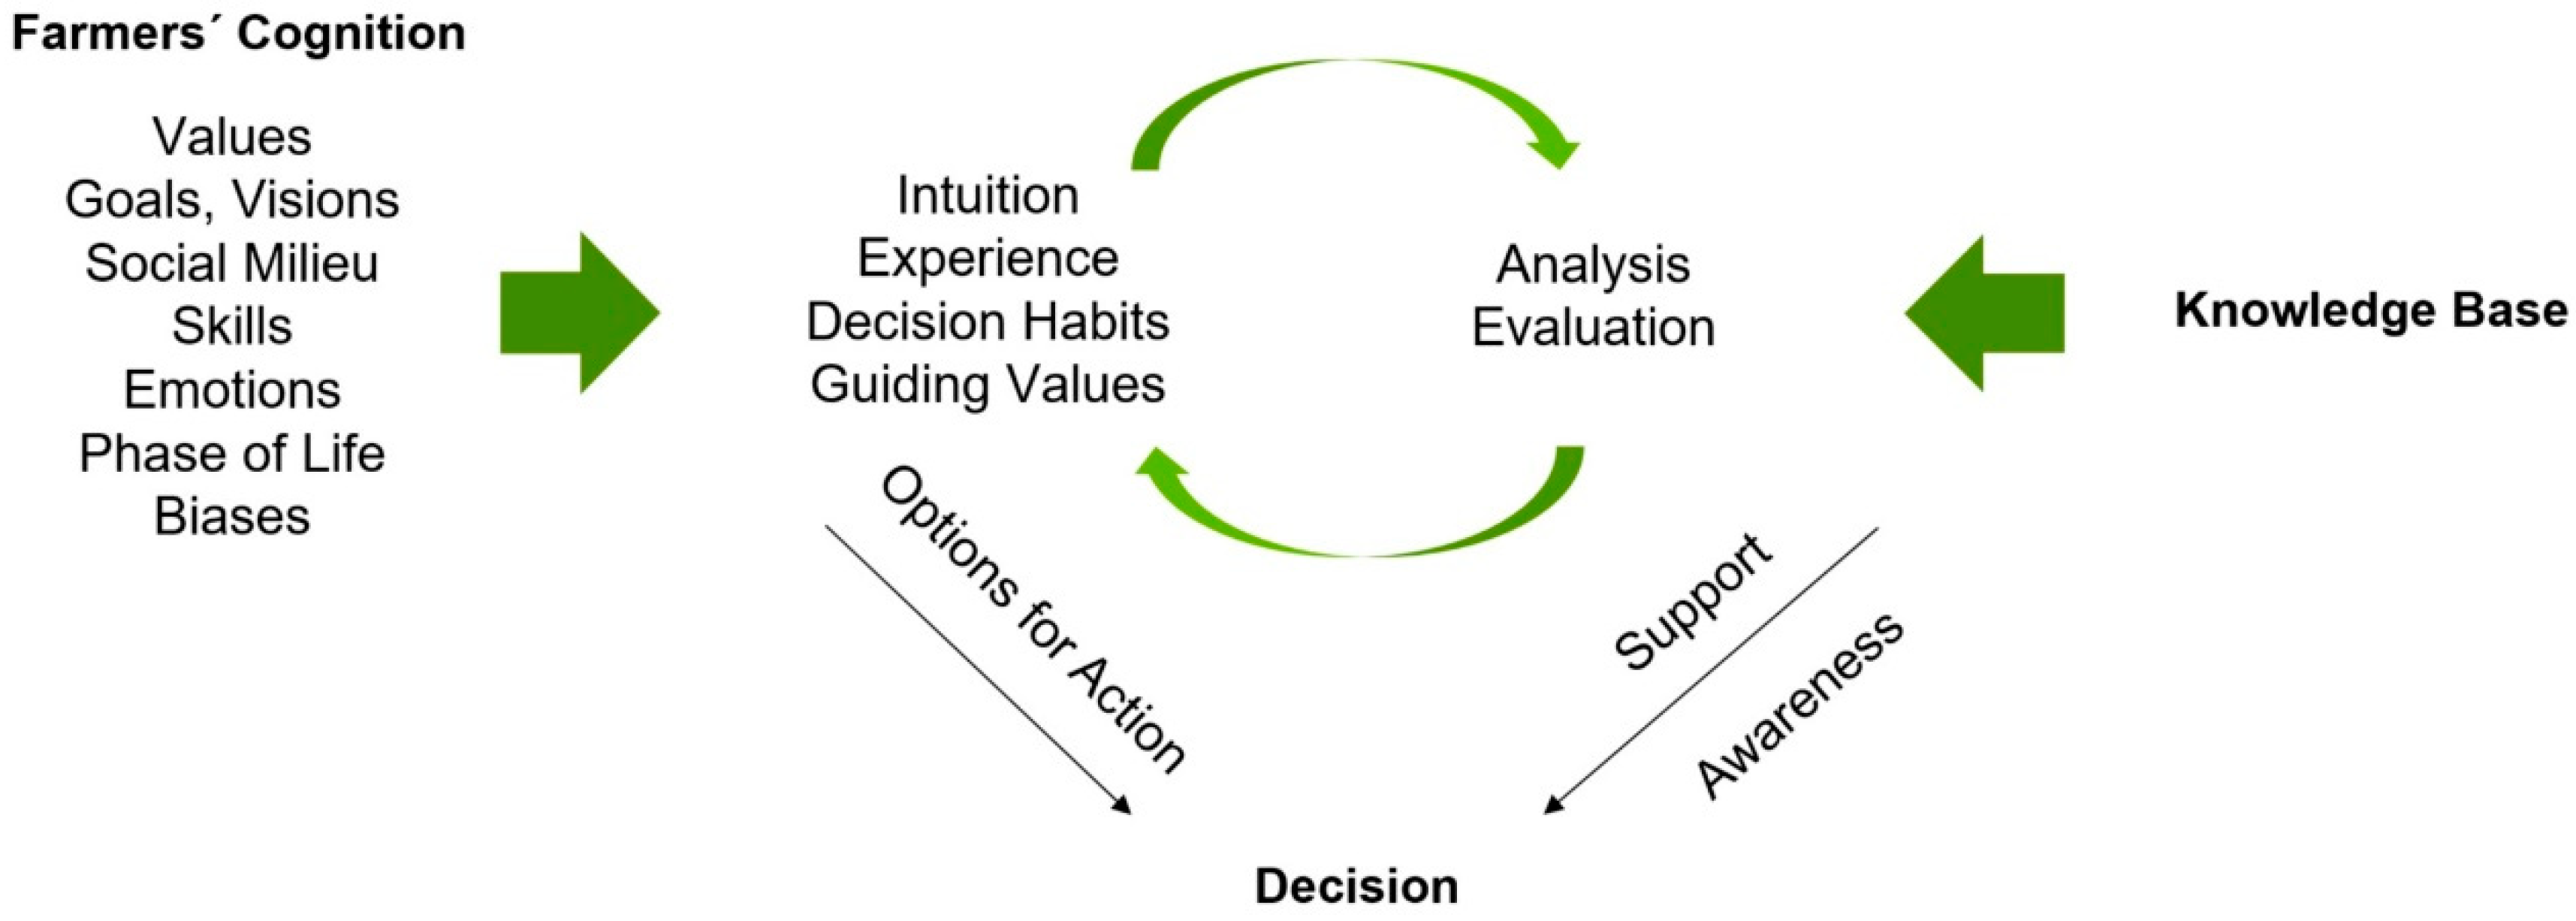
The relevance of semi-automated consultation at the field level, as presented here, should also be considered concerning site-specific fertilization systems. It should first be noted that the method presented here for determining fertilizer requirements can also be used for in-field or spot calibration of sensor systems. Other systems, e.g., [47,48], require the input of an absolute value to reference the crop-dependent surcharges and discharges in an area. It is undisputed that especially in the case of heterogeneous soil conditions, the integration of GIS-supported algorithms for subfield-specific fertilization can make decisions at the field level even more precise [49]. The following structural data show that the study area, Bavarian agriculture, is already small or ‘site-specific’. The average field size is 1.74 ha (for comparison: Old Federal States, 2.3 ha, versus New Federal States, 5.4 ha [50]), whereas 33% (1.348 million) of the fields are smaller than 2.0 ha [51]. Semi-automated consulting at the farm level has considerable potential and is likely to gain in importance, as fewer farms manage a greater total area or individual fields. The number of farms decreased by 1.1% per year from 2010 to 2019 to the current 105,297 [52]. Digital, knowledge-based support is needed to compensate for the loss of knowledge regarding the fields from previous farmers and, at the same time, to further professionalize arable farming. The partially automated support provided by Crop Portal also enables social factors (values, visions, skills, emotions, etc.) to be considered. This is made possible both by the consultant’s cognitive mapping (options for action) and in the interactive use of the dialog component, i.e., querying the knowledge base for practice-relevant decision making based on (subjective) user input [6,53,54]. Sustainable adoption of the DSS is likely to be enhanced by further reductions in personal and practical barriers [55]. Clustering farmers could help further individualize the advice and address these barriers [56,57].
The communication of the system with a broad site- and farm-specific knowledge base (Figure 9, right) will lead to improved problem awareness, with simultaneous increases in acceptance and, thus, adoption. The consulting approach described here enables the integration of other nutrient management systems with further functionalities (e.g., N balance, nitrate simulation) and enables holistic optimization of farm N fluxes [58].
5. Conclusions
In the Crop Portal, farmers and advisors can view crop information for individual fields from heterogeneous data sources at a glance. Through in-depth literature research and interviews with crop consultants and farmers, a requirement profile for a DSS for N management of winter wheat in arable and mixed farms was created. A prototype was implemented, tested, and evaluated, with positive results. Structured discussion of fertilizer requirements and the associated sensitization of the users to relevant considerations and input variables resulted in a transfer of knowledge and improved decisions. In this way, farmers benefit from the digital ‘social capital’ [59], i.e., knowledge of the digital expert network, cf. [55,60,61].
The integration of farm, field, soil, and climate data into the knowledge base was supplemented by rules, facts, and guideline values (expert knowledge). In the future, the expert knowledge will be validated by means of target parameters and substituted by long-term data. A further requirement of the system’s algorithms is to react dynamically to the weather and crop stand development throughout the growing season; therefore, user input of additional (not yet digitally developed) information is necessary. On this basis, certain recommendations for farmers can be determined automatically and the commonly described demand for smart tools to support farmers in the analysis, evaluation, optimization, scenario simulation, and output of recommendations can be met [62]. Nonetheless, depending on the complexity of the task, digitized advisors’ recommendations and knowledge-based products require skilled advisors, as the output of the system often needs to be translated into practical management options [63]. It can be assumed that the interpretation of information and data by crop consultants, i.e., ‘sensemaking’, will become more important in the future compared with the current focus on the application of personal knowledge [64].
The methodology and technology presented in this study will meet future requirements for building an incrementally expandable agricultural knowledge base. There are no limits of technical expansion to include different nutrients and crops, as well as the inclusion of other agricultural topics, e.g., mechanical weeding, plant protection, and variety selection.
Author Contributions
Conceptualization, F.W., M.B. and S.P.; methodology, F.W. and M.B.; validation, F.W.; investigation, F.W.; data curation, F.W.; writing—original draft preparation, F.W. and M.B.; writing—review and editing, F.W., K.-J.H., M.B. and S.P.; visualization, F.W.; supervision, S.P. and K.-J.H.; project administration, S.P.; funding acquisition, S.P. All authors have read and agreed to the published version of the manuscript.
Funding
The research leading to these results is part of a project that has received funding from the Bavarian State Ministry of Food, Agriculture and Forestry (StMELF), grant no. D/17/02—FarmExpert. This Article is funded by the Open Access Publication Fund of Weihenstephan-Triesdorf University of Applied Sciences.
Informed Consent Statement
Participation to the study was based on explicit consent.
Acknowledgments
Section 3.2 is a shortcut of the informatic science part of the research and development published by Ingmar Kessler, Alexander Perzylo and Markus Rickert [35]. We gratefully acknowledge Anja Hartmann for her assistance with the coordination and realization of the field tests. We would like to thank the advisors for their willingness to share their knowledge.
Conflicts of Interest
The authors declare no conflict of interest.
Appendix A. Details on the Parameters in the Decision Tree for the 1st Rate of Application (RoA)
- (1)
- Warming properties of the site
An assessment of the site regarding the temperature at the beginning of vegetation is particularly relevant for the timing of the 1st RoA. At a ‘cool’ site, fertilization is recommended later than at a ‘warm’ site, as the onset of vegetation can be significantly delayed. Furthermore, N surcharges at colder sites may compensate for reduced soil mineralization and, thus, reduced nutrient availability. Whether a site or different plots on the farm was considered ‘cool’ or ‘warm’ by the farmer or consultant was mostly subjective. The single-factor approach of equating the soil type of a field with its warming properties and thus defining heavy clay soils as cool and permeable sandy soils as warm, could not be confirmed by the farmers. To improve the classification, at this point, a climate map was used [65].
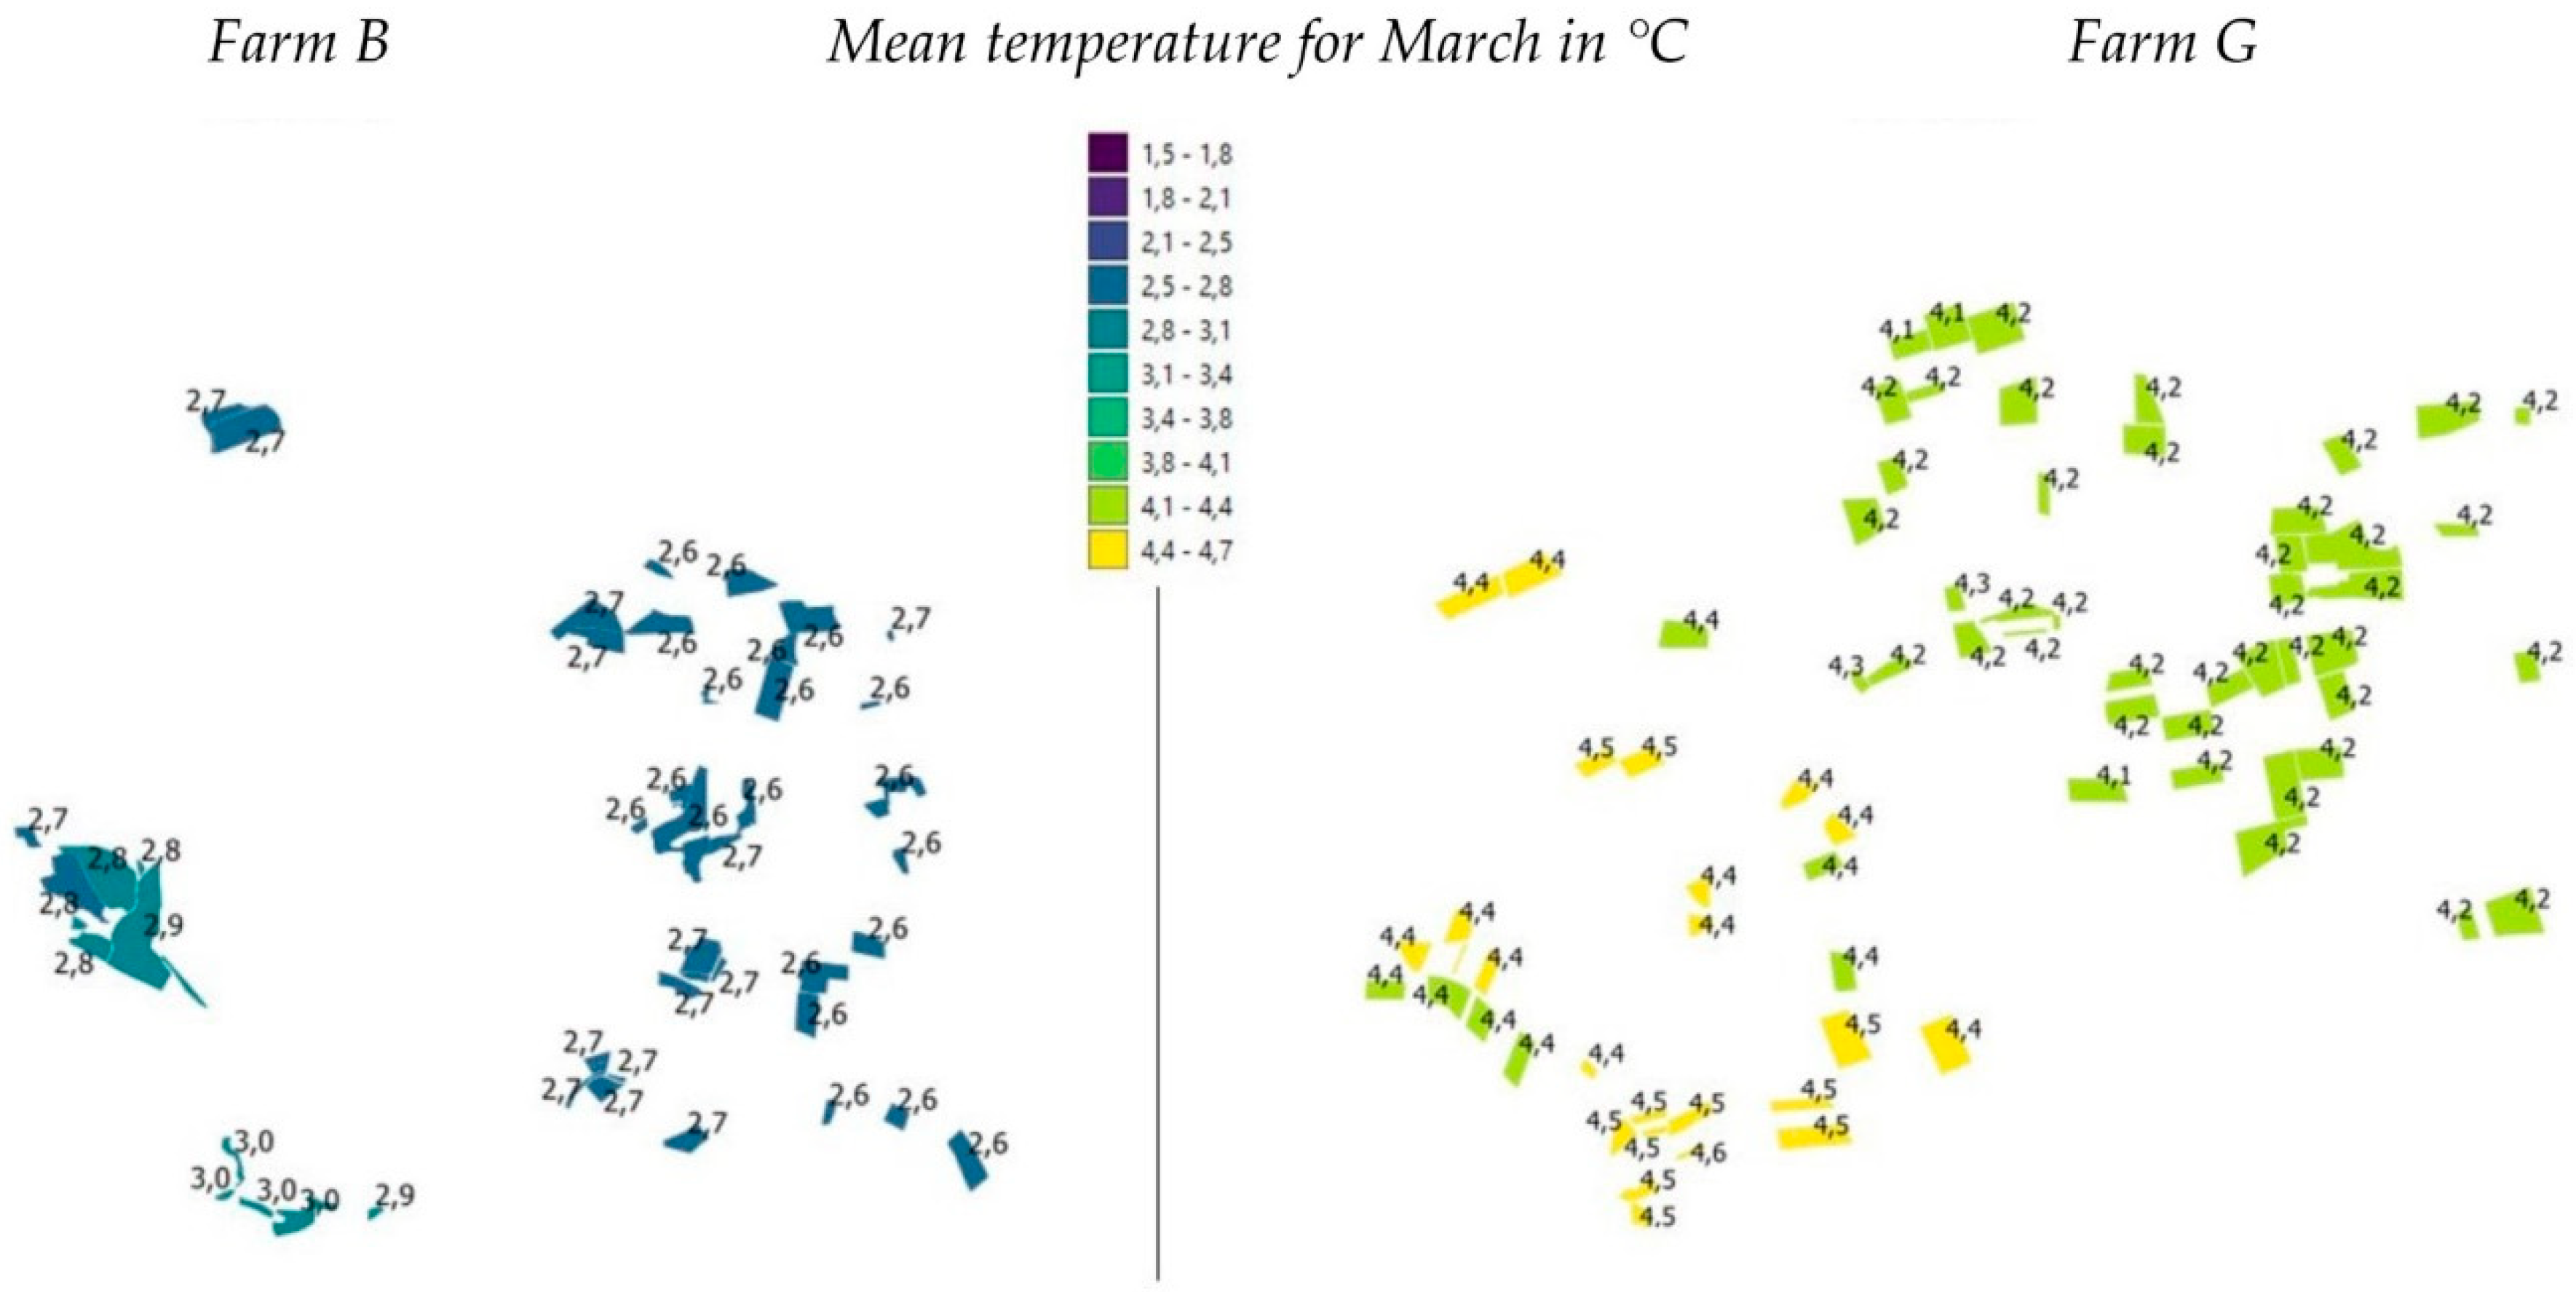
The climate map includes mean monthly temperatures in Bavaria for a 50 × 50 m grid. Besides the temperature values, other geophysical factors, such as the altitude/latitude/longitude, windward/leeward direction, land use and cold air indices, terrain slope, radiation exposure, and fog frequency were considered in a multiple regression approach and subsequent interpolation. The site temperature was determined using a spatial query based on the coordinates of the respective field. Based on the results of the expert interviews, a mean monthly temperature for March of 3.9 °C was set as the threshold for site classification (warm or cool). To be able to capture this quantitatively, the consultants’ assessments of farm areas known to them were obtained with the aid of temperature mapping (Figure A1).
Figure A1.
Climate map for March for fields of model farms B and G.

The explained variation was tested by polling 50 randomly selected fields of the model farms and was estimated to have 94% accuracy.
- (2)
- Previous crop: Stem or leaf crop
The C:N ratio of the crop residues of the previous crop determines the mineralization time. If the C:N ratio was high, as in the case of straw from a stem crop, an N quantity surcharge was applied. The automatic assignment of the previous crop to the class of stem or leaf crop was performed according to botanical nomenclature. The corresponding systematics were stored in the knowledge base. Subsequently modeled exceptions are discussed in Section 3.3.
- (3)
- Target spikes per m2
Based on the ideal yield structure, an optimal crop stand density (in spikes per m2 (Sm2)), can be derived for each site, depending on the variety and start of shooting (daylength response). This assignment was obtained from the breeder or corresponding trial observations. For a region with a yield expectation of ≥80 dt ha−1, the mean value of ‘normal stand density’ for a single-row type was 500 Sm2, with a range of ±20%. Accordingly, a stand density between 400 and 600 Sm2 was considered ‘normal/medium’. Below that, stands were considered to be ‘thin’, above that ‘lush’, which were followed by a surcharge or discharge of 10 kg N ha−1, respectively. The mean value for the stand density type was 600 Sm2, for the grain-density type it was 650 Sm2, and for the compensation type was 550 Sm2. At sites with lower yield expectations, the mean spike number should be reduced by 100 Sm2. The variety ‘Faustus’, selected in the following example, is classified as a grain-density type [66].
To promote an ideal crop stand, the question to the user was ‘Does the target number of spikes correspond to the current Sm2 in the field?’ Farmers have to estimate how many days are left until the end of tillering, which depends on the shoot behavior (short-day/neutral-day, or long-day shoot), variety, and date (time to transition from short-day to long-day, around March 20), among other factors. A possible further development could be to specify the anticipated Sm2 on the basis of the current crop stand (current stage of tillering). During implementation, the insertion of a temporal case decision would be necessary (e.g., IF the day of calculation is more than 14 days before March 20, THEN…). Without this decision, the addition can be seen as a ‘safety margin’ for an earlier chosen date.
- (4)
- Minimum and maximum amounts of fertilizer applied
If the recommended fertilizer quantity is less than 30 kg N ha−1, this amount should be applied. Judging by the low demand value, the N supply of the crop is secured and postponement of the operation to a later date is advisable. If the determined fertilization rate exceeds 85 kg N ha−1, a maximum of 85 kg N ha−1 should be applied. To react more dynamically to the development of the crop and to prevent losses on the surface, it is advisable to split the application into two stages, with an interval between them.
The additional information described about the parameters ① to ④ could be added to the results report of the recommendation.
References
- Zhai, Z.; Martínez, J.F.; Beltran, V.; Martínez, N.L. Decision support systems for agriculture 4.0: Survey and challenges. Comput. Electron. Agric. 2020, 170, 105256. [Google Scholar] [CrossRef]
- Naud, O.; Taylor, J.; Colizzi, L.; Giroudeau, R.; Guillaume, S.; Bourreau, E.; Crestey, T.; Tisseyre, B. Support to decision-making. In Agricultural Internet of Things and Decision Support for Precision Smart Farming; Castrignanò, A., Buttafuoco, G., Khosla, R., Mouazen, A.M., Moshou, D., Naud, O., Eds.; Academic Press: London, UK, 2020; pp. 183–224. ISBN 978-0-12-818373-1. [Google Scholar]
- Gutiérrez, F.; Htun, N.N.; Schlenz, F.; Kasimati, A.; Verbert, K. A review of visualisations in agricultural decision support systems: An HCI perspective. Comput. Electron. Agric. 2019, 163, 104844. [Google Scholar] [CrossRef] [Green Version]
- Russell, S.J.; Norvig, P. Artificial Intelligence: A Modern Approach, 4th ed.; Pearson: Boston, MA, USA, 2020; ISBN 978-0-13-461099-3. [Google Scholar]
- Curry, N.; Kirwan, J. The Role of Tacit Knowledge in Developing Networks for Sustainable Agriculture. Sociol. Rural. 2014, 54, 341–361. [Google Scholar] [CrossRef]
- McCown, R.L. A cognitive systems framework to inform delivery of analytic support for farmers’ intuitive management under seasonal climatic variability. Agric. Syst. 2012, 105, 7–20. [Google Scholar] [CrossRef]
- Polanyi, M. The Tacit Dimension; University of Chicago Press: Chicago, IL, USA, 1966. [Google Scholar]
- Rubinstein, A. Modeling Bounded Rationality, 3rd ed.; MIT Press: Cambridge, MA, USA, 2002; ISBN 0-262-68100-5. [Google Scholar]
- Liebe, U.; Preisendörfer, P. Rational Choice Theory and the Environment: Variants, Applications and New Trends. In Environmental Sociology: European Perspectives and Interdisciplinary Challenges; Gross, M., Heinrichs, H., Eds.; Springer Science + Business Media B.V.: Dordrecht, The Netherlands, 2010; ISBN 978-90-481-8730-0. [Google Scholar]
- German Environment Agency. Indicator: Agricultural Nitrogen Surplus. Available online: https://www.umweltbundesamt.de/en/data/environmental-indicators/indicator-agricultural-nitrogen-surplus#at-a-glance (accessed on 25 October 2021).
- Federal Ministry of Food and Agriculture; Ministry for the Environment, Nature Conservation and Nuclear Safety. Nitratbericht 2020. Available online: https://www.bmu.de/fileadmin/Daten_BMU/Download_PDF/Binnengewaesser/nitratbericht_2020_bf.pdf (accessed on 27 November 2021).
- 365FarmNet. The Software That Ploughs. Available online: https://www.365farmnet.com/en/ (accessed on 28 April 2020).
- FarmFacts. Simple Documentation. Available online: https://www.nextfarming.com/solutions/simple-documentation/ (accessed on 28 April 2020).
- YARA. Atfarm. Available online: https://www.at.farm (accessed on 11 May 2020).
- Lindblom, J.; Lundström, C.; Ljung, M.; Jonsson, A. Promoting sustainable intensification in precision agriculture: Review of decision support systems development and strategies. Precis. Agric. 2017, 18, 309–331. [Google Scholar] [CrossRef] [Green Version]
- Offenberger, K.; Fischer, K.; Wendland, M.; Sperger, C.; Brandl, M.; Kavka, A. Düngeberatungssystem Stickstoff: DSN 2020; Landesanstalt für Landwirtschaft (LfL): Freising, Germany, 2019.
- Villalobos, F.J.; Delgado, A.; López-Bernal, Á.; Quemada, M. FertiliCalc: A Decision Support System for Fertilizer Management. Int. J. Plant. Prod. 2020, 14, 299–308. [Google Scholar] [CrossRef]
- Gandorfer, M.; Schleicher, S.; Erdle, K. Barriers to Adoption of Smart Farming Technologies in Germany. In Proceedings of the 14th International Conference on Precision Agriculture, Montreal, QC, Canada, 24–27 June 2018. [Google Scholar]
- Schulze Schwering, D.; Lemken, D. Totally Digital? Adoption of Digital Farm Management Information Systems. In Lecture Notes in Informatics (LNI): 40. GIL-Jahrestagung—Digitalisierung für Mensch, Umwelt und Tier; Gesellschaft für Informatik: Bonn, Germany, 2020; pp. 295–300. [Google Scholar]
- Roosen, J.; Groß, S. Digitalisierung in LAND-und Ernährungswirtschaft: Studie; Vereinigung der Bayerischen Wirtschaft e.V. (vbw): München, Germany, 2017. [Google Scholar]
- Rose, D.C.; Parker, C.; Fodey, J.; Park, C.; Sutherland, W.; Dicks, L. Involving stakeholders in agricultural decision support systems: Improving user-centred design. Int. J. Agric. Manag. 2018, 6, 80–89. [Google Scholar] [CrossRef]
- Hochschule Weihenstephan-Triesdorf/HSWT. Bedarf an Beratungs-und Dienstleistungsangeboten in der landwirtschaftlichen pflanzlichen Erzeugung in Bayern: Marktforschungsstudie (Market Research Study) für das; Landeskuratorium für pflanzliche Erzeugung in Bayern e.V. (LKP): Freising, Germany, 2016. [Google Scholar]
- Beierle, C.; Kern-Isberner, G. Methoden Wissensbasierter Systeme: Grundlagen, Algorithmen, Anwendungen, 6th ed.; Springer: Berlin/Heidelberg, Germany, 2019; ISBN 978-3-658-27083-4. [Google Scholar]
- Gottlob, G.; Frühwirth, T.; Horn, W. Expertensysteme; Springer: Vienna, Austria, 1990; ISBN 978-3-7091-9094-4. [Google Scholar]
- Materia, V.C.; Giarè, F.; Klerkx, L. Increasing Knowledge Flows between the Agricultural Research and Advisory System in Italy: Combining Virtual and Non-virtual Interaction in Communities of Practice. J. Agr. Educ. Ext. 2015, 21, 203–218. [Google Scholar] [CrossRef]
- Norton, G.W.; Alwang, J. Changes in Agricultural Extension and Implications for Farmer Adoption of New Practices. Appl. Econ. Perspect. Policy 2020, 42, 8–20. [Google Scholar] [CrossRef]
- Simon, H.A. A Behavioral Model of Rational Choice. Q. J. Econ. 1955, 69, 99–118. [Google Scholar] [CrossRef]
- Proctor, A.; Donaldson, A.; Phillipson, J.; Lowe, P. Field Expertise in Rural Land Management. Environ. Plan A 2012, 44, 1696–1711. [Google Scholar] [CrossRef] [Green Version]
- Weckesser, F.; Hartmann, A.; Beck, M.; Peisl, S. Entscheidungsunterstützung durch Datenvernetzung—Ein Fallbeispiel der Pflanzenbauberatung. In Lecture Notes in Informatics (LNI): 40. GIL-Jahrestagung—Digitalisierung für Mensch, Umwelt und Tier; Gesellschaft für Informatik: Bonn, Germany, 2020; pp. 337–342. ISBN 978-3-88579-693-0. [Google Scholar]
- Vanwindekens, F.M.; Stilmant, D.; Baret, P.V. Development of a broadened cognitive mapping approach for analysing systems of practices in social-ecological systems. Ecol. Modell. 2013, 250, 352–362. [Google Scholar] [CrossRef]
- Federal Office for Agriculture and Food. Düngeverordnung 2020 (German Fertilizer Ordinance). Available online: https://www.ble-medienservice.de/frontend/esddownload/index/id/1515/on/1756/act/dl (accessed on 18 January 2021).
- Zadeh, L.A. Fuzzy sets. Inf. Control 1965, 8, 338–353. [Google Scholar] [CrossRef] [Green Version]
- Papadopoulos, A.; Kalivas, D.; Hatzichristos, T. Decision support system for nitrogen fertilization using fuzzy theory. Comput. Electron. Agric. 2011, 78, 130–139. [Google Scholar] [CrossRef]
- Vásquez, R.P.; Aguilar-Lasserre, A.A.; López-Segura, M.V.; Rivero, L.C.; Rodríguez-Duran, A.A.; Rojas-Luna, M.A. Expert system based on a fuzzy logic model for the analysis of the sustainable livestock production dynamic system. Comput. Electron. Agric. 2019, 161, 104–120. [Google Scholar] [CrossRef]
- Kessler, I.; Perzylo, A.; Rickert, M. Ontology-Based Decision Support System for the Nitrogen Fertilization of Winter Wheat. In Metadata and Semantic Research; Garoufallou, E., Ovalle-Perandones, M.-A., Eds.; Springer International Publishing: Cham, Switzerland, 2021; pp. 245–256. ISBN 978-3-030-71902-9. [Google Scholar] [CrossRef]
- Meier, U. Growth Stages of Mono- and Dicotyledonous Plants: BBCH Monograph; Open Agrar Repositorium: Quedlinburg, Germany, 2018. [Google Scholar]
- Weckesser, F.; Kessler, I.; Perzylo, A.; Hartmann, A.; Rickert, M.; Beck, M.; Peisl, S. Abschlussbericht zum Projekt FarmExpert 4.0—Architektur eines unabhängigen Expertennetzes für die Landwirtschaft für das Zeitalter der Digitalisierung; Hochschule Weihenstephan-Triesdorf (HSWT), Fortiss—Landesforschungsinstitut des Freistaats Bayern für softwareintensive Systeme; Landeskuratorium für pflanzliche Erzeugung in Bayern e.V.: München, Germany, 2020. [Google Scholar]
- Roßberg, D.; Jörg, E.; Falke, K. SIMONTO—Ein neues Ortogenesemodell für Wintergetreide und Winterraps. Nachrichtenbl. Deut. Pflanzenschutzd. 2005, 57, 74–80. [Google Scholar]
- Roßberg, D.; Michel, V.; Graf, R.; Neukampf, R. Definition von Boden-Klima-Räumen für die Bundesrepublik Deutschland: Definition of soil-climate-areas for Germany. Nachr. Dtsch. Pflanzenschutzd. 2007, 59, 155–161. [Google Scholar]
- Team UEQ. User Experience Questionnaire. Available online: https://www.ueq-online.org/ (accessed on 30 June 2020).
- YARA. N-Tester: Instruction Manual. Available online: https://www.yara.my/contentassets/6d5ba39b1a364a33be1e4e6b6b2a2be1/n-tester-instruction-manual.pdf/ (accessed on 20 July 2020).
- Wood, B.A.; Blair, H.T.; Gray, D.I.; Kemp, P.D.; Kenyon, P.R.; Morris, S.T.; Sewell, A.M. Agricultural science in the wild: A social network analysis of farmer knowledge exchange. PLoS ONE 2014, 9, e105203. [Google Scholar] [CrossRef] [Green Version]
- Janssen, S.J.C.; Porter, C.H.; Moore, A.D.; Athanasiadis, I.N.; Foster, I.; Jones, J.W.; Antle, J.M. Towards a new generation of agricultural system data, models and knowledge products: Information and communication technology. Agric. Syst. 2017, 155, 200–212. [Google Scholar] [CrossRef]
- Clavel, L.; Soudais, J.; Baudet, D.; Leenhardt, D. Integrating expert knowledge and quantitative information for mapping cropping systems. Land Use Policy 2011, 28, 57–65. [Google Scholar] [CrossRef]
- Wolfert, S.; Ge, L.; Verdouw, C.; Bogaardt, M.-J. Big Data in Smart Farming—A review. Agric. Syst. 2017, 153, 69–80. [Google Scholar] [CrossRef]
- Mahmood, F.; Wery, J.; Hussain, S.; Shahzad, T.; Ashraf, M.A.; Therond, O.; Belhouchette, H. Using expert knowledge data to validate crop models on local situation data. Arch. Agron. Soil Sci. 2016, 62, 217–234. [Google Scholar] [CrossRef] [Green Version]
- YARA. N-Sensor ALS—To Variably Apply Nitrogen. Available online: https://www.yara.co.uk/crop-nutrition/farmers-toolbox/n-sensor/ (accessed on 11 August 2020).
- Trimble. GreenSeeker System. Available online: https://agriculture.trimble.com/product/greenseeker-system/ (accessed on 7 August 2020).
- Whelan, B. Site-Specific Crop Management. In Pedometrics; McBratney, A.B., Minasny, B., Stockmann, U., Eds.; Springer International Publishing: Cham, Switzerland, 2018; pp. 597–622. ISBN 978-3-319-63437-1. [Google Scholar]
- Garvert, H. Determinanten der Pachtpreise in Deutschland—Biogasförderung und Direktzahlungen im Fokus. Ph.D Thesis, Justus-Liebig-Universität Gießen, Gießen, Germany, 2017. [Google Scholar]
- Zenger, X.; Friebe, R. Agrarstrukturentwicklung in Bayern: IBA-Agrarstrukturbericht 2014; Bayerische Landesanstalt für Landwirtschaft (LfL): Freising, Germany, 2015.
- Bavarian State Ministry of Food, Agriculture and Forestry. Bayerischer Agrarbericht 2020. Available online: https://www.agrarbericht.bayern.de/politik-strategien/index.html (accessed on 30 November 2020).
- Dessart, F.J.; Barreiro-Hurlé, J.; van Bavel, R. Behavioural factors affecting the adoption of sustainable farming practices: A policy-oriented review. Eur. Rev. Agric. Econ. 2019, 46, 417–471. [Google Scholar] [CrossRef] [Green Version]
- McCown, R.L.; Carberry, P.S.; Dalgliesh, N.P.; Foale, M.A.; Hochman, Z. Farmers use intuition to reinvent analytic decision support for managing seasonal climatic variability. Agric. Syst. 2012, 106, 33–45. [Google Scholar] [CrossRef]
- Siebrecht, N. Sustainable Agriculture and Its Implementation Gap—Overcoming Obstacles to Implementation. Sustainability 2020, 12, 3853. [Google Scholar] [CrossRef]
- Hülsbergen, K.-J.; Rahmann, G. (Eds.) Thünen Report 8: Klimawirkungen und Nachhaltigkeit ökologischer und konventioneller Betriebssysteme—Untersuchungen in einem Netzwerk von Pilotbetrieben; Johann Heinrich von Thünen-Institut: Braunschweig, Germany, 2013; ISBN 978-3-86576-108-8. [Google Scholar]
- Klerkx, L.; Jakku, E.; Labarthe, P. A review of social science on digital agriculture, smart farming and agriculture 4.0: New contributions and a future research agenda. NJAS Wageningen J. Life Sci. 2019, 90-91, 100315. [Google Scholar] [CrossRef]
- Weckesser, F.; Leßke, F.; Luthardt, M.; Hülsbergen, K.-J. Conceptual Design of a Comprehensive Farm Nitrogen Management System. Agronomy 2021, 11, 2501. [Google Scholar] [CrossRef]
- Klerkx, L.; Proctor, A. Beyond fragmentation and disconnect: Networks for knowledge exchange in the English land management advisory system. Land Use Policy 2013, 30, 13–24. [Google Scholar] [CrossRef]
- Bliss, K.; Padel, S.; Cullen, B.; Ducottet, C.; Mullender, S.; Rasmussen, I.A.; Moeskops, B. Exchanging knowledge to improve organic arable farming: An evaluation of knowledge exchange tools with farmer groups across Europe. Org. Agr. 2018, 9, 383–398. [Google Scholar] [CrossRef]
- Rose, D.C.; Sutherland, W.J.; Parker, C.; Lobley, M.; Winter, M.; Morris, C.; Twining, S.; Ffoulkes, C.; Amano, T.; Dicks, L.V. Decision support tools for agriculture: Towards effective design and delivery. Agric. Syst. 2016, 149, 165–174. [Google Scholar] [CrossRef] [Green Version]
- Antle, J.M.; Basso, B.; Conant, R.T.; Godfray, H.C.J.; Jones, J.W.; Herrero, M.; Howitt, R.E.; Keating, B.A.; Munoz-Carpena, R.; Rosenzweig, C.; et al. Towards a new generation of agricultural system data, models and knowledge products: Design and improvement. Agric. Syst. 2017, 155, 255–268. [Google Scholar] [CrossRef]
- Ayre, M.; Mc Collum, V.; Waters, W.; Samson, P.; Curro, A.; Nettle, R.; Paschen, J.-A.; King, B.; Reichelt, N. Supporting and practising digital innovation with advisers in smart farming. NJAS Wagening. J. Life Sci. 2019, 90–91, 100302. [Google Scholar] [CrossRef]
- Eastwood, C.; Ayre, M.; Nettle, R.; Dela Rue, B. Making sense in the cloud: Farm advisory services in a smart farming future. NJAS Wagening. J. Life Sci. 2019, 90–91, 100298. [Google Scholar] [CrossRef]
- Hera, U.; Rötzer, T.; Zimmermann, L.; Schulz, C.; Maier, H.; Weber, H.; Kölling, C. Klima en Détail—Neue Hochaufgelöste Klimakarten zur klimatischen Regionalisierung Bayerns; LWF Aktuell: Freising, Germany, 2011. [Google Scholar]
- Federal Plant Variety Office. Beschreibende Sortenliste Getreide 2020. Available online: https://www.bundessortenamt.de/bsa/media/Files/BSL/bsl_getreide_2020.pdf (accessed on 25 November 2021).
Figure 1.
Relevant data for N fertilization decisions.

Figure 2.
Decision tree for determining the amount of N for the 1st rate of application.

Figure 3.
Input variables (left) including comprehensible output variables of expert knowledge (right) and presentation of the determined fertilizer requirement for the 1st N application rate (below).
Figure 3.
Input variables (left) including comprehensible output variables of expert knowledge (right) and presentation of the determined fertilizer requirement for the 1st N application rate (below).

Figure 4.
Fuzzy membership function using the example of the linguistic variable ‘crop stand’.


Figure 6.
Structured user interface with information on the farm, area, crop, and soil (left), a dropdown menu of weather parameters (bottom left), and input variables for application advice entered by the user (right).
Figure 6.
Structured user interface with information on the farm, area, crop, and soil (left), a dropdown menu of weather parameters (bottom left), and input variables for application advice entered by the user (right).

Figure 7.
Evaluation of the shown content of the Crop Portal at the end of the crop cycle.

Figure 8.
Evaluation of the user interface at the end of the crop cycle—extended questionnaire.

Figure 9.
Influences in decision making (modified from [6]).
Figure 9.
Influences in decision making (modified from [6]).


Table 1.
Parameters of the decision trees for specifying the 1st, 2nd and 3rd rate of N application.
Table 1.
Parameters of the decision trees for specifying the 1st, 2nd and 3rd rate of N application.
| Input-Variable Name * | Rate of Application No. | Primary Data Source ** | |
|---|---|---|---|
| Advisor A | Advisor B | ||
| Variety | 1 | 1 | farmer |
| Previous crop | 1 | 1 | farmer |
| Expected yield | - | 3 | farmer |
| By-product harvest pre-crop | - | 2 | farmer |
| Climate (cool/warm) | 1 | 1 | farmer/climate map |
| 14-days temperature prediction | 1 | - | farmer/public data |
| Soil mineral N (SMN) content | 1 | 1 | farmer |
| N mobilization rate | - | 2 | farmer |
| N supply crop stand | - | 2 | farmer |
| Crop stand density (spikes/m2) | 2 | 1, 2 | farmer |
| Risk of crop lodging | 3 | - | farmer |
| Quality target (protein) | - | 3 | farmer |
| Application of organic fertilizer | 1, 2, 3 | 1, 2, 3 | farmer |
| Application of mineral fertilizer | 2, 3 | 2, 3 | farmer |
| Legume share in crop rotation | 2, 3 | - | farmer |
| Soil texture | 1 | - | public data |
| Land use restrictions | 1, 2, 3 | - | public data/farmer |
* Variables recorded in the user interface with a qualitative value (white) and a quantitative value (green). ** Depending on the farmer either digital records or manual input.
Table 2.
Fuzzy sets of parameters in the decision tree for the 1st rate of N application.
| Parameter | Value | Sur-/Discharge (kg N ha−1) |
|---|---|---|
| (1) Warming of the field | ≤3.9 °C | +10 |
| >3.9 °C | 0 | |
| (2) Previous crop type | stem | +15 |
| leaf | 0 | |
| (3) Target spikes per m2 variety: Faustus | 520 (−20%) | +10 |
| 650 | 0 | |
| 780 (+20%) | −10 |
Table 3.
Average absolute deviation of the DSS from the farmer’s or advisor’s opinion (tested on farms in the advisor’s own advisory area; adjusted for described exceptions).
Table 3.
Average absolute deviation of the DSS from the farmer’s or advisor’s opinion (tested on farms in the advisor’s own advisory area; adjusted for described exceptions).
| Rate of Application | 1st | 2nd | 3rd | |||
|---|---|---|---|---|---|---|
| Decision based on advisor | A | B | A | B | A | B |
| Deviation (kg N ha−1) | 15 | 5.4 | 7.5 | 16.2 | 15.8 | 10 |
Table 4.
Deviation of the DSS tailored by advisor B for recommendations for the 1st RoA in kg N ha−1 in comparison to the recommendations of advisor A and advisor B.
Table 4.
Deviation of the DSS tailored by advisor B for recommendations for the 1st RoA in kg N ha−1 in comparison to the recommendations of advisor A and advisor B.
| Advisor | Field | Deviation |
|---|---|---|
| Name | Name | (kg N ha−1) |
| Advisor A | Dostlerfeld | −25 |
| Bahn | 0 | |
| AB2 | −28 | |
| AB1 | −28 | |
| Spitz | 7 | |
| Pfarrpacht | −18 | |
| Kelleracker | −28 | |
| Bannstücke | −8 | |
| Advisor B | Stadlacker | −1 |
| Acker 1 | −5 | |
| Acker 2 | 5 | |
| Straßfeld | −2 | |
| Steinbühl | −2 | |
| Heide | −2 | |
| Beckeracker | −12 | |
| Voglerschlag | −20 | |
| Exlpoint | 0 |
Publisher’s Note: MDPI stays neutral with regard to jurisdictional claims in published maps and institutional affiliations. |
© 2022 by the authors. Licensee MDPI, Basel, Switzerland. This article is an open access article distributed under the terms and conditions of the Creative Commons Attribution (CC BY) license (https://creativecommons.org/licenses/by/4.0/).
Share and Cite
MDPI and ACS Style
Weckesser, F.; Beck, M.; Hülsbergen, K.-J.; Peisl, S. A Digital Advisor Twin for Crop Nitrogen Management. Agriculture 2022, 12, 302. https://0-doi-org.brum.beds.ac.uk/10.3390/agriculture12020302
AMA Style
Weckesser F, Beck M, Hülsbergen K-J, Peisl S. A Digital Advisor Twin for Crop Nitrogen Management. Agriculture. 2022; 12(2):302. https://0-doi-org.brum.beds.ac.uk/10.3390/agriculture12020302
Chicago/Turabian StyleWeckesser, Fabian, Michael Beck, Kurt-Jürgen Hülsbergen, and Sebastian Peisl. 2022. "A Digital Advisor Twin for Crop Nitrogen Management" Agriculture 12, no. 2: 302. https://0-doi-org.brum.beds.ac.uk/10.3390/agriculture12020302
Note that from the first issue of 2016, this journal uses article numbers instead of page numbers. See further details here.