
An Analysis of the Genetic Relation between Photosynthesis and Yield-Related Traits in Wheat


1
State Key Laboratory of Plant Cell and Chromosome Engineering, Institute of Genetics and Developmental Biology, Innovative Academy of Seed Design, Chinese Academy of Sciences, Beijing 100101, China
2
State Key Laboratory of Crop Stress Biology for Arid Areas, College of Agronomy, Northwest A&F University, Yangling 712100, China
*
Author to whom correspondence should be addressed.
Agriculture 2022, 12(4), 560; https://0-doi-org.brum.beds.ac.uk/10.3390/agriculture12040560
Submission received: 1 March 2022
/
Revised: 5 April 2022
/
Accepted: 12 April 2022
/
Published: 14 April 2022
(This article belongs to the Special Issue Molecular Markers and Marker-Assisted Breeding in Wheat)
Abstract
:A recombinant inbred line population, derived from a cross between a high light-tolerant wheat Triticum aestivum cv. Xiaoyan 54 and a high yielding, but high light-sensitive variety, Jing 411, was used to explore the genetic relation between photosynthesis and grain yield-related traits. The net CO2 assimilation rate, chlorophyll content, chlorophyll a fluorescence parameters, leaf area index, plant height, spike number, biomass, grain yield, and harvest index were evaluated in the field across two consecutive years. The results reveal that a total of 57 quantitative trait loci (QTL) are found to be associated with the investigated traits. They distributed on almost all 21 chromosomes, except for chromosomes 5D, 6D, 7A, and 7D. The phenotypic variance explained by a single QTL ranged from 9.3% to 39.9% depending on traits and QTL. Of these QTL, 12 QTL clusters were found to regulate at least 2 of the investigated traits, which distributed on 8 chromosomes, 1A, 1B, 2A, 2B, 2D, 3A, 3B, 4B and 5A. Seven QTL clusters were associated with both photosynthesis and grain yield-related traits, indicative of their genetic relation. Two QTL clusters on 2D and 4B were co-located with two reduced-height genes, Rht8 and Rht-B1b, respectively. These QTL clusters may be used as potential targets for wheat radiation use efficiency improvement in the future.
1. Introduction
Wheat is a staple cereal crop and plays a pivotal role in food security worldwide. Wheat yield should be continuously elevated to meet the increasing demand [1,2,3,4]. Radiation use efficiency (RUE) is considered an important approach for wheat genetic yield improvement [5,6,7,8,9,10,11]. However, it is controversial whether a high net CO2 assimilation rate (A) is associated with the increase in grain yield (GY) [12,13,14,15,16,17]. Evidences from elevated CO2 concentrations demonstrated that the enhancement of A leads to biomass (BM) and GY increases [18,19,20,21,22]. Additionally, it is theoretically estimated that the efficiency of conversion of the intercepted light into biomass (εc) can be improved by at least 50% [23], suggesting that photosynthesis can be an important avenue for wheat yield improvement.
GY is coordinately determined by the photosynthate acquisition at the canopy and leaf levels, photosynthate accumulation as BM, and partition of the grains. Canopy photosynthesis accounts for most of the variations in BM and GY [24]. Therefore, any enhancement of the contributors to canopy photosynthesis represents a potential increase in the BM and GY. Canopy photosynthesis is a function of the leaf area index (LAI), canopy architecture, and A at the leaf level [25]. The LAI varies dynamically and is determined by the leaf area, leaf number, plant height (PH), spike number (SN), chlorophyll content (Chl), and nutrient cycles. Several studies suggest that the LAI has already peaked for most crops, including wheat [5], and high-yielding varieties already possess the optimal canopy architecture [6,24]. The BM of wheat at maturity results from the cumulative accumulation of photosynthates from canopy photosynthesis during its whole growing season. The harvest index (HI) represents the translocation of photosynthates to grains. The history of wheat breeding shows that GY improvement has been associated with an increase in the HI [6], with no or small changes to the BM [6,8]. Although it appears that the HI has already reached its theoretical limit [7], recent evidence shows that the GY of the new wheat high-yielding lines is positively related with the improvement of both the HI and BM [17]. Hence, the further increase in the BM through RUE improvement is an important approach for high-yielding wheat breeding. Photosynthesis at leaf level is determined by A, stomatal conductance, Chl, the photochemical efficiency of photosystem II (PSII), and other biochemical processes [23]. Chlorophyll a fluorescence (CF) representing PSII photochemical efficiency has been widely used to non-invasively monitor photosynthesis efficiency at leaf level [26,27].
There exists a great genetic variation for photosynthesis at both canopy and leaf levels, as well as GY-related traits in wheat, which are complex and dynamically regulated by quantitative trait loci (QTL) and environmental cues [28,29,30,31,32,33,34,35,36,37,38,39,40,41,42,43,44,45,46,47,48,49,50,51,52,53,54,55,56,57]. The high density of molecular marker-saturated genetic linkage maps favor the identification of QTL for complex traits, such as GY and photosynthetic traits. In wheat, a number of QTL are reported to regulate some of the photosynthetic traits, including Chl, CF parameters, A, intercellular CO2 concentration, and stomatal conductance [28,29,30,31,32,33,34,35,36,37,38,39,40,41,42,43,44,45,46]. In addition, a large quantity of QTL were detected for GY-related traits, including GY, BM, HI, spike number, grain number, and/or thousand grain weight (TGW) [28,31,36,37,45,47,48,49,50,51,52,53,54,55,56,57]. In addition, a few genes, such as SBPase [58], Rubisco activase [59], Brassinosteroid Receptor [60], and receptor-like cytoplasmic kinase encoding genes [61] were found to regulate photosynthetic activity, and they were considered as potential targets for wheat genetic yield improvement. Trehalose 6-phosphate/SnRK1 also plays a role in wheat yield improvement [62]. In fact, most photosynthesis and GY-related genes are not cloned, which are usually represented as QTL at present. Most of these QTL were detected separately by using different bi-parental genetic populations under various conditions [28,29,30,31,32,33,34,35,36,37,38,39,40,41,42,43,44,45,46,47,48,49,50,51,52,53,54,55,56,57], which are limited to disclose the genetic relation between photosynthesis and GY-related traits. Especially, the genetic relation between photosynthesis at both canopy and leaf levels and GY related traits still remains unclear.
Previous researches demonstrated that the Chinese winter wheat variety, Xiaoyan 54, exhibits significant tolerance to high light-induced photo-oxidative stress [63,64,65,66], accounting for its high photosynthetic efficiency under stressful conditions. Several years ago, we initiated a project to breed new wheat lines with enhanced photosynthetic efficiency by crossing Xiaoyan 54 with a high yielding, but high light-sensitive variety, Jing 411. Successfully, we obtained a new line, 1–12, which showed a significantly higher photosynthetic efficiency than Xiaoyan 54 and Jing 411, especially under high light stress [64,65,66]. However, the genetic basis of pyramiding different photosynthetic traits in a few progenies is not clear, which limits the selection efficiency for RUE and GY improvement in wheat. The objectives in the present work are to find the genetic relations between photosynthesis at both canopy and leaf levels and GY-related traits by using a recombinant inbred line (RIL) population developed from the cross between Xiaoyan 54 and Jing 411.
2. Materials and Methods
2.1. Plant Growth
A total of 102 RILs derived from 2 winter wheat varieties, Triticum aestivum cv. Xiaoyan 54 and Jing 411, were used in this experiment. They were chosen from the original 182 RILs, according to the plant height, which ranged from 60 cm to 100 cm to avoid lodging risk. Xiaoyan 54 was certificated and released in 2000, which was selected from Xiaoyan 6, according to winter hardness. Xiaoyan 6 was developed from a cross between St2422/464 and Xiaoyan 96. Xiaoyan 96 was developed from a distant hybridization between tall wheatgrass (Thinopyrum ponticum, 2n = 10× = 70) and common wheat (T. aestivum, 2n = 42). Xiaoyan 54 usually maintains high photosynthetic efficiency under stressful conditions, while Jing 411 (Fengkang 2/Changfeng 1) was originally certificated and released in 1991. It is a Northern Chinese high-yielding winter wheat variety under non-stress conditions, but is sensitive to high light stress. The RILs and their parents were randomly planted in the experimental station of the Institute of Genetics and Developmental Biology, Chinese Academy of Sciences in Beijing (116°41′27″ E, 40°10′1″ N), with two and three replicates in 2009 and 2010, respectively. At the end of September, the seeds were sown in 5 2-m-long rows spaced 0.23 m apart, with 50 seeds in each row. During the growth seasons, diseases and wild grasses were efficiently controlled.
2.2. Chl and CF Measurements
At 7 and 14 days post anthesis (DPA) in 2009 and 14 DPA in 2010, 5 representative and healthy flag leaves of the main stems were randomly collected from each RIL and measured for Chl and CF parameters in the laboratory at room temperature. Before the measurements were conducted, the leaves were kept in a wet gauze. The relative chlorophyll content (Chl), represented as the soil and plant analyzer development (SPAD) value, was measured by using chlorophyll meter SPAD-502 (Minolta, Japan). An average on 5–6 reads in the middle part of a leaf was recorded as the Chl for each leaf.
After dark adaptation for 1 h, the middle parts of the flag leaves were immediately measured for the CF parameters with a Handy-PEA fluorometer (Hansatech Instruments Ltd., Norfolk, UK). The saturated flash light intensity was set at 3000 μmol m−2 s−1 and the flash light duration was 1 s. The CF parameters included a minimal fluorescence level (Fo); maximal fluorescence level (Fm); maximal photochemical efficiency of PSII (Fv/Fm); performance index PI; and JIP-test parameters, such as trapped energy flux (TRo/CS), electron transport flux (ETo/CS), dissipated energy flux (DIo/CS), and density of reaction center (RC/CSm) per excited cross section [26]. The formulas of the JIP-test CF parameters are expressed as: TRo/CS = [1 − Fo/Fm]•Fo; ETo/CS = [1 − Fo/Fm]•(1 − VJ)•Fo, VJ means the relative variable fluorescence intensity at the J-step; DIo/CS = Fo − TRo/CS; RC/CSm = [1 − Fo/Fm]•(VJ/Mo)•Fm; and Mo means the approximated initial slope of the fluorescence transient.
2.3. The Gas Exchange Measurement
At 7–14 DPA, in 2009 and 2010, the flag leaves were measured for the net CO2 assimilation rate (A) by using the LI-6400 Portable Photosynthesis System (Li-Cor, Nebraska, USA). Usually, the A measurements were conducted from 9:00–11:00 am on sunny days on 5–6 leaves for each line, and 3 reads were recorded for each leaf. When measuring, the light intensity was set as 1200 μmol m−2 s−1 provided by the internal red–blue light source 6400-02B, and the ambient CO2 concentration, leaf temperature, and relative humidity were 400 ± 20 ppm, 25.0 ± 2.0 °C, and 20–40%, respectively.
2.4. The LAI and GY-Related Trait Measurements
At 7 and 17 DPA in 2009 and 0, 7, and 34 DPA in 2010, the LAI was measured on overcast days with a single-sensor mode by using an LAI-2000 canopy analyzer (Li-Cor, Inc., Lincoln, NE, USA), according to Malone et al. [67]. This instrument estimates the LAI as a function of the intercepted diffuse solar radiation at the top and bottom of the canopy. Two repeats of one above canopy and four ground readings between two middle rows were carried out to compute the LAI for each plot. A 90° view cap was applied on the optics to avoid the influence of the operator and the adjacent plots. The standard outputs (five rings) were recomputed to estimate the LAIs for the four rings using FV2000 data processing software, according to the manufacture’s instruction. The PH was measured on ten plants of each line from the ground to the tip of the spike, excluding awns before harvest. In order to reduce the marginal effects, two relatively even-growing middle rows, 0.4 m long and 0.46 m wide, were harvested for each plot to assay the SN, BM, GY, and HI. The total spike number, above ground biomass, and grain yield per 0.4 m × 0.46 m were used as the SN, BM, and GY per unit soil area and were analyzed directly in this study. The ratios of the GY to BM resulted in the HI.
2.5. The Statistical Analysis and QTL Identification
The descriptive statistics, analysis of variance, and significance determination were conducted by using SPSS 13.0 for Windows. The mean values of the investigated parameters from each trial were used for the QTL analysis following the composite interval mapping (CIM) method with Windows QTL Cartographer 2.5 [68]. Model 6 was obtained using forward and backward regression on a window size of 10 cM, and the walk speed was 2 cM. The threshold of likelihood of odd (LOD) scores were calculated for each trait according to 1000 random permutations at p < 0.05 [69,70]. A significant QTL was declared when its LOD peak score was above the threshold values. The additive effects and R2 value, the percentage of the phenotypic variance explained by the QTL, of each QTL were obtained directly from the output of this software. The linkage map consisted of 523 simple sequenced repeats (SSRs), 18 expressed sequence tag-SSRs (EST-SSRs), and 14 Glu loci, which was previously reported by Xu et al. (2014) [56].
3. Results
3.1. The Phenotypic Variation of Photosynthesis and Grain-Yield Traits
The statistical summary of the investigated traits are presented in Table 1. The values of Chl, A, and LAI in Jing 411 were significantly higher than those in Xiaoyan 54, while the values of PI, TRo/CS, Eto/CS, Dio/CS, and RC/CSm in Jing 411 were slightly higher, but not as significantly as those in Xiaoyan 54, suggesting that Jing 411 had a higher chlorophyll content, carbon assimilation rate, leaf area index, trapped energy flux, electron transport flux, dissipated energy flux, and density of reaction center per excited cross section. Ultimately, for Jing 411, the high photosynthetic efficiency may account for a 10% higher GY, in comparison to Xiaoyan 54 under non-stress conditions. The phenotypic values of the studied traits in the RIL population showed broad and continuous variations. The coefficients of the variations (CV) ranged from 0.7% (Fv/Fm) to 22.4% (LAI), depending on the traits and trials. The transgressive segregation and significant genetic variation among the RILs were observed for all the investigated traits, resulting in potential RILs with an enhanced photosynthetic efficiency. All the assayed traits were significantly different among the RILs. The skewness and kurtosis of the phenotypic distribution demonstrated that the phenotypic variance in the RIL population exhibited a normal distribution, which was suitable for QTL analysis.
The correlation coefficients between photosynthesis and GY-related traits are shown in Table S1. The PH was negatively related, while the HI was positively related with the Chl and ETo/CS, suggesting that dwarfing plant statue and a high harvest index may be associated with the improvement of the photosynthetic efficiency of flag leaves. The LAI was positively related with the PH and BM. However, no significant relation was found between the photosynthetic traits in the flag leaves and spike number, BM, and GY, indicating that the BM and GY may be instead determined by the plant height, canopy photosynthesis, and spike number, rather than the photosynthetic traits in the flag leaves.
3.2. The Identification of the QTL
The mean values of the investigated traits for each trial were used for QTL identification. Only a QTL was declared when its LOD peak score was above the threshold values that ranged from 2.60 to 3.44, depending on the traits and trials. Finally, a total of 57 QTL were identified to be associated with the investigated traits. They were mapped to almost all 21 chromosomes, except for chromosomes 5D, 6D, 7A, and 7D (Table 2 and Table 3; Figure 1).
A total of 35 QTL were found to be associated with Chl, CF parameters, and A in flag leaves, which individually explained 9.3–30.5% of the phenotypic variance (Table 2 and Figure 1). Of these, 20 QTL and 19 QTL were detected in 2009 and 2010, respectively. Four QTL were reproducibly detected across two years. A total of 5 QTL located on 1A, 2D, 6A, and 6B were found to regulate Chl, which explained 10.3–14.1% of the Chl variation. A total of 3 QTL were detected for Fo, Fm, and DIo/CS, respectively, accounting for 11.6–17.5%, 15.1–30.5%, and 12.4–23.1% of the phenotypic variances. A total of 4 and 6 QTL were found to be associated with Fv/Fm and ETo/CS, which explained 9.3–15.6% and 9.9–27.1% of the phenotypic variances, respectively. Additionally, 2 QTL were found to be associated with PI, TRo/CS, and A, respectively, which explained 9.8–22.8%, 12.8–27.6%, and 11.0–17.0% of the phenotypic variances. For these 35 mapped chromosome intervals, Jing 411 conferred the increasing alleles for 20 QTL, while Xiaoyan 54 had the increasing alleles for the other 15 QTL, indicative of the high photosynthetic efficiency of Jing 411 under non-stress conditions.
In total, 22 QTL were detected for the LAI and GY-related traits, which explained 9.5–39.9% of the phenotypic variances (Table 3 and Figure 1). A total of 6 QTL were identified for the LAI and they were mapped on 5 chromosomes, 1B, 2D, 3B, 4B, and 5B, accounting for 10.9–23.3% of the phenotypic variances. A total of 2 QTL were detected for the PH and mapped on 2D and 4B, respectively, which explained 27.6–39.9% and 29.7% of the plant height variations. A total of 6 QTL located on 2A, 2D, 3A, 4B, 4D, and 7B were identified to be associated with SN, which individually explained 10.4–17.8% of the phenotypic variances. A total of 3 QTL located on 2B, 2D, and 3A were found to control the BM, which explained 12.0–15.6% of the phenotypic variances. A total of 2 and 3 QTL were found to be associated with the GY and HI, which explained 10.0–14.1% and 9.5–18.6% of the phenotypic variances, respectively. Xiaoyan 54 conferred the favorable allele to reduce the plant height and increase the LAI, SN, BM, and HI for 10 QTL, while Jing 411 carried the increasing alleles for the other 12 QTL to elevate the LAI, SN, BM, GY, and HI.
3.3. The QTL Clusters Detected for the Investigated Traits
Co-located or nearly linked QTL for two or more different traits can disclose the genetic relation and result in a QTL cluster (QCL). A total of 12 QCLs were identified to be associated with 2 or more of the investigated traits (Table 4). They distributed on nine chromosomes, 1A, 1B, 2A, 2B, 2D, 3A, 3B, 4B and 5A, with two QCLs being on 1B, 2D, and 5A. Six QCLs (QCL2, QCL3, QCL4, QCL7, QCL9, and QCL12) were found to regulate only photosynthetic traits, but not GY-related traits. QCL2, QCL3, and QCL12 were found to control Fm, ETo/CS, and RC/CSm. The increasing allele came from Jing 411 for QCL2 and QCL3 and from Xiaoyan 54 for QCL12. QCL4 and QCL7 were associated with DIo/CS, Fv/Fm, and PI. Since lower values of DIo/CS means that less light energy is dissipated as heat but more light energy is utilized for photochemical quenching, the Jing 411’s allele had the effect to increase PI and Fv/Fm but decrease DIo/CS for QCL4 and QCL7. QCL9 was found to regulate Fo, TRo/CS, and LAI, for which Xiaoyan 54’s allele conferred the effects to increase the LAI, but decrease Fo and TRo/CS. Only one QCL (QCL5) was found to control GY-related traits, such as GY and BM, indicative of the significant contribution of BM to GY. The increasing effect of this QCL was from Jing 411’s allele.
In addition, four QCLs (QCL1, QCL6, QCL8, and QCL10) simultaneously regulated both the photosynthesis and GY-related traits, indicating the genetic relation between photosynthesis and GY-related traits. For example, QCL1 was identified to control both the RC/CSm and HI, indicating that, for this locus, a high density of reaction centers in flag leaves may promote photosynthate translocation. However, for QCL8, the high density of reaction centers in flag leaves was associated with a low SN and BM. Jing 411’s allele had the effect to increase RC/CSm and HI, but reduce SN and BM for QCL1 and QCL8. QCL6 on 2D flanked by two SSR markers Xgwm296.3 and Xbarc168 was found to simultaneously regulate six traits: Chl, LAI, PH, SN, BM, and GY. For this locus, Xiaoyan 54’s allele reduced the PH, LAI, SN, BM, and GY, but increased the Chl in flag leaves, suggesting that, for this locus, the chlorophyll content in the flag leaves was negatively linked to the leaf area index, plant height, spike number, biomass, and grain yield. QCL10 on 4B flanked by Xdupw270 and Xgwm107.1 was found to regulate eight traits, including Fo, Fm TRo/CS, PI, SN, HI, LAI, PH. Xiaoyan 54’s allele conferred the increasing effects of Fo, Fm, TRo/CS, LAI, SN, and HI, while it reduced the PI and PH.
3.4. Selection Effects of Two SSR Markers for the QCL10 on 4B
To explore the selection effects of two SSR markers, Xgwm192.1 and Xgwm165.1, on 4B for the QCL10 region, we compared the mean values of the investigated traits in the RILs with alleles from Xiaoyan 54 and Jing 411. As shown in Table S1, the Chl, Fo, Fm, Fv/Fm, TRo/CS, ETo/CS, DIo/CS, and RC/CSm in flag leaves of the RILs with Xiaoyan 54’s allele were significantly higher than those with Jing 411’s. However, the PI and A in the flag leaves of the RILs with Xiaoyan 54’s allele were significantly lower than those with Jing 411’s, suggesting that Xiaoyan 54’s allele has different effects on the photosynthetic traits. In addition, the RILs with Xiaoyan 54’s allele exhibited a significantly reduced PH, but a higher LAI, SN, and HI than those carrying the Jing 411’s allele. Therefore, the increase in the LAI may compensate for the reduction in the carbon assimilation rate and performance index of the PSII photochemistry of flag leaves. Taken together, by using two SSR markers, Xgwm192.1 and Xgwm165.1, as the selection markers, this QCL region may be used for marker-assisted breeding for wheat RUE improvement.
4. Discussion
RUE improvement involves the coordinate regulation of photosynthate acquisition at the leaf and canopy levels, photosynthate accumulation, and translocation to grains [5,6,7,8,9,10,11]. Therefore, it should be taken as an integrative process. The genetic variation of photosynthetic traits enables wheat RUE improvement possible, which is determined by internal (QTL) and external (environmental cues) factors. Although several QTL were detected for photosynthesis or GY-related traits in different populations under various conditions, no QTL identification for such an integrative process has been reported for wheat to date. To disclose the genetic relation between photosynthesis and GY-related traits, in the present study, we mapped the QTL for photosynthesis at both the leaf and canopy levels and GY-related traits.
The QTL analysis revealed that a total of 57 QTL were associated with the investigated traits. Of these, 32 QTL and 30 QTL were detected in 2009 and 2010, respectively, and only 5 QTL were reproducibly detected across 2 years. The less repeatable QTL may be ascribed to the high LOD threshold values computed by 1000 permutations. More reproducible QTL were observed when the LOD threshold was set to 2.5. The high LOD threshold enhanced the significance and reliability of the QTL, though it reduced the number of QTL. In addition, the reason for less reproducible QTL also may be ascribed to the environmental factors, because photosynthetic traits are largely determined by environmental factors, such as light intensity, temperature, and humidity.
A total of 12 QCLs were identified for the co-located QTL for different traits in this work, most of which are consistent with the previously reported QTL controlling photosynthesis and/or GY-related traits. For instance, the QCL6 in a 7.4 cm interval between Xgwm296.3 and Xbarc168 on 2D was found to simultaneously regulate Chl, PH, LAI, SN, BM, and GY (Figure S1). In this region, the QPH-2D flanked by Xwmc112 and Xbarc168 should be Rht8 [56] as it is close to Rht8, 4.0 cM from Xbarc168 in a wheat composite map [71]. This region was also mapped for the GY, HI, grain number per spike [48], Chl [29,32], flag leaf weight [29], BM [51], and TGW [36,55]. The Xiaoyan 54’s allele carried the effects to reduce the PH, LAI, SN, BM, and GY, but it increased Chl in the flag leaves. Therefore, the negative correlation between the GY and Chl should be broken before this locus was used for marker-assisted selection in the wheat breeding process.
QCL10, in an interval between Xdupw270 and Xgwm107.1 on 4B, was found to regulate four photosynthetic traits in flag leaves (Fo, Fm, TRo/CS, and P.I.), canopy photosynthetic traits (LAI, PH, and SN), and a photoassimilate partition trait (HI) (Figure S2). In this region, the QPH-4B flanked by Xbarc90 and Xgwm107.1 should be Rht-B1 [72], as it is close to Rht-B1, 1.0 cM from Xgwm107 in a wheat composite SSR map [71]. The Xiaoyan 54’s allele had the effectof reducing the plant height, suggesting that Xiaoyan 54 conferred Rht-B1. The QPH-4B for plant height was consistent with the results determined by McCartney et al. [47], Habash et al. [73], and Xu et al. [56]. In addition, this region had been previously identified for Chl and three CF parameters (RC/CSm, ETo/CS, and PI) [37], biomass per plant and Fv/Fm in high light-grown wheat seedlings [40], flag leaf weight [29], normalized difference vegetation index (NDVI) at anthesis and at 10 days post-anthesis [57], SN [50], HI [48,50], TGW [47,50,55,73], grain number per spike [73], grain weight per spike [50,52], and GY [50]. The co-locations of Rht-B1 with Chl and CF traits, tolerance to high light stress, canopy photosynthetic traits (LAI, SN, and NDVI), HI, and grain yield-related traits suggest that Rht-B1b may exert profound effects on plant architecture through the enhancement of the LAI and SN at a canopy level, photochemical efficiency and tolerance to high light stress at flag leaf level, and photosynthate translocation, ultimately resulting in an improvement to RUE [74,75]. The favorite alleles for the above two Rht intervals for QCL6 and QCL10 may be from Xiaoyan 6, the founder variety of Xiaoyan 54, which were strongly selected during the breeding history [56], suggesting that they may play a pivotal role in wheat GY and RUE improvement during the wheat breeding history.
A comparison of the QTL identified in this work with the previously documented QTL shows that more QTL co-locations regulating photosynthesis and GY-related traits were found. For example, the QCL8 on 3A flanked by Xbarc67 and Xbarc1060 was found to simultaneously control SN, BM, and RC/CSm. Additionally, the QRC/CSm-3A was consistent with the QTL for RC/CSm, PI, and ETo/CS [37], suggesting that this QTL may play a role in the regulation of PSII photochemical efficiency. As the increasing alleles for SN and BM were from Xiaoyan 54, while the increasing allele for RC/CSm was from Jing 411, this locus may have negative effects to reduce RC/CSm in flag leaves when the Xiaoyan 54’s allele is used to select a high SN and BM. Hence, the negative linkage between photosynthesis (RC/CSm) and GY (SN and BM)-related traits should be broken before this locus is used for marker-assisted selection.
Additionally, three QCLs for the photosynthetic traits were co-located with the previously reported QTL for GY-related traits. For example, the QCL9 in a region between Xbarc75 and Xgwm493 on 3B detected for Fo, TRo/CS, and LAI was also co-located with a GY meta-QTL [53] and a QTL for Chl [37]. This chromosome region appeared to control Fo, the trapped energy flux, chlorophyll content, leaf area index, and GY, suggesting that this region may be a potential target for RUE improvement. Additionally, the QCL11 flanked by Xgwm335.2 and Xgwm186 on 5A mapped for Fo and ETo/CS was also found to control Chl under drought stress [30] and in high light [40], TGW [52], dry-matter accumulation [29], and a GY-related MQTL40 [53]. Additionally, the QCL12 in another region on 5A flanked by Xgwm156.1 and Xgwm328 associated with Fm and ETo/CS also co-located with the QTL for Chl in high-light-grown wheat seedlings [40], above-ground dry matter [56], the GY of the main stem [37] and TGW [56]. These coincidences of photosynthesis-related QTL on 5A (QCL11 and QCL12) with GY-related traits indicated that these two regions may be used as the selection targets for RUE improvement.
Additionally, the QCL5 in a region between TC288392 and Xgwm55.1 on 2B detected for GY and BM was consistent with the study of McCartney et al. [47] and Kumar et al. [48]. This region was mapped for the grain number per spike and TGW [55,56], tiller number [51], flag leaf weight [29], Chl and Car (carotenoid content) in low-light and Fv/Fm in high-light grown wheat seedlings [40], Fm and Fv/Fm in dark-induced senescing leaves [38], Chl, Fm, and Fv/Fm under high light stress [39]. Although QCL5 was identified for GY and BM rather than the photosynthetic traits under non-stress, it appeared that this locus also regulated photosynthetic traits under low- and high-light conditions as well as during senescence.
In addition, the QTL was also found to co-locate or nearly link with photosynthesis and/or GY-related traits. For instance, an LAI QTL, located between Xgwm273.3 and Xbarc61 on 1B, was co-located with the QTL for Chl [37], tiller number [48], TGW [52], and GY [47,49,53]. Additionally, an SN QTL on 2A flanked by Xgwm630 and Xwmc181 was linked with QChl a + b.igdb-2A, QChl a.igdb-2A.1, and QChl a.igdb-2A.1 during senescence [38], qFv/FmN-2A under non-stress, qFmH-2A and qFv/FmH-2A under high light stress [39], and QFv/Fm.csdh-2A [37]. Additionally, it was consistent with the QTL for the SN per plant [56] and TGW [47]. In addition, a Chl QTL QChl-1A.1 flanked by Xbarc119.1 and WCI5 on 1A was consistent with the QTL for Fo and TRo/CS [37], Chl and Fm under high-light stress [39], Chl and Car in medium-light-grown wheat seedlings [40], and grain weight per spike [56]. QCL2 on 1B between Glu57.2 and Glu_3D detected for Fm, RC/CSm, and ETo/CS was nearly linked with a Chl QTL [37], indicating that it may regulate the maximal fluorescence level, electron transport flux, and density of reaction centers, as well as Chl.
However, no co-location was observed for four QCLs (QCL1, QCL3, QCL4, and QCL7) with the previously reported QTL for photosynthesis relatedtraits, indicating that they may be specifically expressed in Xiaoyan 54, a wheat-Thinopyrum ponticum introgression line, Jing 411, and their RILs. Further work is needed to explore their contribution to RUE improvement in wheat. After further confirmation of the effects of these QCLs, some of these loci may be used for wheat RUE improvement in the future.
5. Conclusions
In conclusion, a total of 102 RILs, developed from the cross between the high-light-tolerant wheat variety Xiaoyan 54 and the high-yielding wheat variety Jing 411, were used to analyze the genetic relation between photosynthetic traits at the canopy and leaf levels and GY-related traits. In total, 12 QCLs were found, of which 8 QCLs (QCL2, QCL5–6, and QCL8-12) were co-located with the previously reported photosynthesis and GY-related traits. More specifically, it appeared that Rht8 and Rht-B1 play a key role in the coordinate regulation of photosynthesis and GY-related traits. The other four QCLs (QCL1, QCL3, QCL4, and QCL7), for which no co-location with the previously reported QTL for photosynthesis and/or GY-related traits seemed to be specifically expressed in this RIL population. These QCLs may provide potential targets for the identification of key loci/genes determining RUE in wheat in the future. In addition, molecular markers can be developed for wheat genetic yield improvement based on this study.
Supplementary Materials
The following supporting information can be downloaded at: https://0-www-mdpi-com.brum.beds.ac.uk/article/10.3390/agriculture12040560/s1, Figure S1: QTL cluster on 2B detected with composite interval mapping. Chl, chlorophyll content; LAI, leaf area index; PH, plant height; SN, spike number; BM, biomass; GY, grain yield. The trials for each trait were described in brackets, e.g., 09-7 means at 7 days post anthesis in year 2009. Figure S2: QTL cluster on 4B detected with composite interval mapping. Fo, the minimum fluorescence level; Fm, the maximum fluorescence level; PI, performance index; TRo/CS, trapped energy flux per cross section; LAI, leaf area index; PH, plant height; SN, spike number; HI, harvest index. The trials for each trait were described in brackets, e.g., 09-7 means at 7 days post anthesis in year 2009. Table S1: Co-relation coefficients between photosynthesis and GY related traits. Table S2: Selection effects on photosynthetic traits by using two SSR markers Xgwm192.1 and Xgwm165.1 on 4B.
Author Contributions
Conceptualization, Funding acquisition, Investigation, Writing—original draft, H.L.; Data curation, Formal analysis, Investigation, Q.A.; Investigation, Validation, Writing—review and editing, C.L.; Data curation, Resources, B.L.; Investigation, Writing—review and editing, Q.Z.; Supervision, Funding acquisition, Writing—review and editing, Z.L. All authors have read and agreed to the published version of the manuscript.
Funding
This work was supported by the National Natural Science Foundation of China (No. 31872863) and the National Key Basic Research Program of China (No. 2015CB150106).
Institutional Review Board Statement
Not applicable.
Informed Consent Statement
Not applicable.
Data Availability Statement
Not applicable.
Conflicts of Interest
Authors declare that there are no conflict of interest.
References
- Aiad, M.A.; Amer, M.M.; Khalifa, T.H.H.; Shabana, M.M.A.; Zoghdan, M.G.; Shaker, E.M.; Eid, M.S.M.; Ammar, K.A.; Al-Dhumri, S.A.; Kheir, A.M.S. Combined application of compost, zeolite and a raised bed planting method alleviate salinity stress and improve cereal crop productivity in arid regions. Agronomy 2021, 11, 2495. [Google Scholar] [CrossRef]
- Asseng, S.; Guarin, J.R.; Raman, M.; Monje, O.; Kiss, G.; Despommier, D.D.; Meggers, F.M.; Gauthier, P.P.G. Wheat yield potential in controlled-environment vertical farms. Proc. Natl. Acad. Sci. USA 2020, 117, 19131–19135. [Google Scholar] [CrossRef] [PubMed]
- Asseng, S.; Kheir, A.M.S.; Kassie, B.T.; Hoogenboom, G.; Andelaal, A.I.N.; Haman, D.Z.; Ruane, A.C. Can Egypt become self-sufficient in wheat? Environ. Res. Lett. 2018, 13, 094012. [Google Scholar] [CrossRef] [Green Version]
- Grote, U.; Fasse, A.; Nguyen, T.T.; Erenstein, O. Food security and the dynamics of wheat and maize value chains in africa and asia. Front. Sustain. Food Syst. 2021, 4, 617009. [Google Scholar] [CrossRef]
- Horton, P. Prospects for crop improvement through the genetic manipulation of photosynthesis: Morphological and biochemical aspects of light capture. J. Exp. Bot. 2000, 51, 475–485. [Google Scholar] [CrossRef]
- Richards, R.A. Selectable traits to increase crop photosynthesis and yield of grain crops. J. Exp. Bot. 2000, 51, 447–458. [Google Scholar] [CrossRef]
- Foulkes, M.J.; Slafer, G.A.; Davies, W.J.; Berry, P.M.; Sylvester-Bradley, R.; Martre, P.; Calderini, D.F.; Griffiths, S.; Reynolds, M.P. Raising yield potential of wheat. III. Optimizing partitioning to grain while maintaining lodging resistance. J. Exp. Bot. 2011, 62, 469–486. [Google Scholar] [CrossRef] [Green Version]
- Parry, M.A.J.; Reynolds, M.; Salvucci, M.E.; Raines, C.; Andralojc, P.J.; Zhu, X.G.; Price, G.D.; Condon, A.G.; Furbank, R.T. Raising yield potential of wheat. II. Increasing photosynthetic capacity and efficiency. J. Exp. Bot. 2011, 62, 453–467. [Google Scholar] [CrossRef]
- Reynolds, M.; Foulkes, J.; Furbank, R.; Griffiths, S.; King, J.; Murchie, E.; Parry, M.; Slafer, G. Achieving yield gains in wheat. Plant Cell Environ. 2012, 35, 1799–1823. [Google Scholar] [CrossRef]
- Furbank, R.T.; Sharwood, R.; Estavillo, G.M.; Silva-Perez, V.; Condon, A.G. Photons to food: Genetic improvement of cereal crop photosynthesis. J. Exp. Bot. 2020, 71, 2226–2238. [Google Scholar] [CrossRef] [Green Version]
- Li, Y.B.; Hou, R.X.; Tao, F.L. Wheat morpho-physiological traits and radiation use efficiency under interactive effects of warming and tillage management. Plant Cell Environ. 2021, 44, 2386–2401. [Google Scholar] [CrossRef] [PubMed]
- Zelitch, I. The close relationship between net photosynthesis and crop yield. Bioscience 1982, 32, 796–802. [Google Scholar] [CrossRef]
- Fischer, R.A.; Rees, D.; Sayre, K.D.; Lu, Z.M.; Condon, A.G.; Saavedra, A.L. Wheat yield progress associated with higher stomatal conductance and photosynthetic rate, and cooler canopies. Crop Sci. 1998, 38, 1467–1475. [Google Scholar] [CrossRef]
- Nelson, C.J. Genetic associations between photosynthetic characteristics and yield—Review of the evidence. Plant Physiol. Bioch. 1988, 26, 543–554. [Google Scholar]
- Jiang, G.M.; Sun, J.Z.; Liu, H.Q.; Qu, C.M.; Wang, K.J.; Guo, R.J.; Bai, K.Z.; Gao, L.M.; Kuang, T.Y. Changes in the rate of photosynthesis accompanying the yield increase in wheat cultivars released in the past 50 years. J. Plant Res. 2003, 116, 347–354. [Google Scholar] [CrossRef]
- Hubbart, S.; Peng, S.; Horton, P.; Chen, Y.; Murchie, E.H. Trends in leaf photosynthesis in historical rice varieties developed in the Philippines since 1966. J. Exp. Bot. 2007, 58, 3429–3438. [Google Scholar] [CrossRef] [Green Version]
- Zhou, B.W.; Sanz-Saez, A.; Elazab, A.; Shen, T.M.; Sanchez-Bragado, R.; Bort, J.; Serret, M.D.; Araus, J.L. Physiological traits contributed to the recent increase in yield potential of winter wheat from Henan Province, China. J. Integr. Plant Biol. 2014, 56, 492–504. [Google Scholar] [CrossRef]
- Bender, J.; Hertstein, U.; Black, C.R. Growth and yield responses of spring wheat to increasing carbon dioxide, ozone and physiological stresses: A statistical analysis ‘ESPACE-wheat’ results. Eur. J. Agron. 1999, 10, 185–195. [Google Scholar] [CrossRef]
- Mitchell, R.A.C.; Black, C.R.; Burkart, S.; Burke, J.I.; Donnelly, A.; de Temmmerman, L.; Fangmeier, A.; Mulholland, B.J.; Theobald, J.C.; van Oijen, M. Photosynthetic responses in spring wheat grown under elevated CO2 concentrations and stress conditions in the European, multiple-site experiment ‘ESPACEwheat’. Eur. J. Agron. 1999, 10, 205–214. [Google Scholar] [CrossRef]
- Wu, D.X.; Wang, G.X.; Bai, Y.F.; Liao, J.X. Effects of elevated CO2 concentration on growth, water use, yield and grain quality of wheat under two soil water levels. Agr. Ecosyst. Environ. 2004, 104, 493–507. [Google Scholar] [CrossRef]
- Högy, P.; Wieser, H.; Köhler, P.; Schwadorf, K.; Breuer, J.; Franzaring, J.; Muntifering, R.; Fangmeier, A. Effects of elevated CO2 on grain yield and quality of wheat: Results from a 3-year free-air CO2 enrichment experiment. Plant Biol. 2009, 11, 60–69. [Google Scholar] [CrossRef] [PubMed]
- Kheir, A.M.S.; El Baroudy, A.; Aiad, M.A.; Zoghdan, M.G.; Abd El-Aziz, M.A.; Ali, M.G.M.; Fullen, M.A. Impacts of rising temperature, carbon dioxide concentration and sea level on wheat production in North Nile delta. Sci. Total. Environ. 2019, 651, 3161–3173. [Google Scholar] [CrossRef] [PubMed]
- Zhu, X.G.; Long, S.P.; Ort, D.R. What is the maximum efficiency with which photosynthesis can convert solar energy into biomass? Curr. Opin. Biotech. 2008, 19, 153–159. [Google Scholar] [CrossRef] [PubMed]
- Peng, S. Single-leaf and canopy photosynthesis of rice. In Redesigning Rice Photosynthesis to Increase Yield; International Rice Research Institute: Los Baños, Philippines, 2000; pp. 213–228. [Google Scholar]
- Loomis, R.S.; Connor, D.J. Crop Ecology: Productivity and Management in Agricultural Systems; Cambridge University Press: Cambridge, UK, 1992; p. 556. [Google Scholar]
- Strasser, R.J.; Srivastava, A.; Govindjee. Polyphasic chlorophyll a fluorescence transient in plants and cyanobacteria. Photochem. Photobiol. 1995, 61, 32–42. [Google Scholar] [CrossRef]
- Baker, N.R. Chlorophyll fluorescence: A probe of photosynthesis in vivo. Annu. Rev. Plant Biol. 2008, 59, 89–113. [Google Scholar] [CrossRef] [Green Version]
- Quarrie, S.A.; Quarrie, S.P.; Radosevic, R.; Rancic, D.; Kaminska, A.; Barnes, J.D.; Leverington, M.; Ceoloni, C.; Dodig, D. Dissecting a wheat QTL for yield present in a range of environments: From the QTL to candidate genes. J. Exp. Bot. 2006, 57, 2627–2637. [Google Scholar] [CrossRef] [Green Version]
- Su, J.Y.; Tong, Y.P.; Liu, Q.Y.; Li, B.; Jing, R.L.; Li, J.Y.; Li, Z.S. Mapping quantitative trait loci for post-anthesis dry matter accumulation in wheat. J. Integr. Plant Biol. 2006, 48, 938–944. [Google Scholar] [CrossRef]
- Yang, D.L.; Jing, R.L.; Chang, X.P.; Li, W. Quantitative trait loci mapping for chlorophyll fluorescence and associated traits in wheat (Triticum aestivum). J. Integr. Plant Biol. 2007, 49, 646–654. [Google Scholar] [CrossRef]
- Zhang, K.; Zhang, Y.; Chen, G.; Tian, J. Genetic analysis of grain yield and leaf chlorophyll content in common wheat. Cereal Res. Commun. 2009, 37, 499–511. [Google Scholar] [CrossRef]
- Zhang, K.P.; Fang, Z.J.; Liang, Y.; Tian, J.C. Genetic dissection of chlorophyll content at different growth stages in common wheat. J. Genet. 2009, 88, 183–189. [Google Scholar] [CrossRef]
- Liang, Y.; Zhang, K.P.; Zhao, L.; Liu, B.; Meng, Q.W.; Tian, J.C.; Zhao, S.J. Identification of chromosome regions conferring dry matter accumulation and photosynthesis in wheat (Triticum aestivum L.). Euphytica 2010, 171, 145–156. [Google Scholar] [CrossRef]
- Vijayalakshmi, K.; Fritz, A.K.; Paulsen, G.M.; Bai, G.H.; Pandravada, S.; Gill, B.S. Modeling and mapping QTL for senescence-related traits in winter wheat under high temperature. Mol. Breed. 2010, 26, 163–175. [Google Scholar] [CrossRef]
- Zhang, Z.B.; Xu, P.; Jia, J.Z.; Zhou, R.H. Quantitative trait loci for leaf chlorophyll fluorescence traits in wheat. Aust. J. Crop Sci. 2010, 4, 571–579. [Google Scholar]
- Czyczylo-Mysza, I.; Marcinska, I.; Skrzypek, E.; Chrupek, M.; Grzesiak, S.; Hura, T.; Stojalowski, S.; Myskow, B.; Milczarski, P.; Quarrie, S. Mapping QTLs for yield components and chlorophyll a fluorescence parameters in wheat under three levels of water availability. Plant Genet. Resour.-C 2011, 9, 291–295. [Google Scholar] [CrossRef]
- Czyczylo-Mysza, I.; Tyrka, M.; Marcinska, I.; Skrzypek, E.; Karbarz, M.; Dziurka, M.; Hura, T.; Dziurka, K.; Quarrie, S.A. Quantitative trait loci for leaf chlorophyll fluorescence parameters, chlorophyll and carotenoid contents in relation to biomass and yield in bread wheat and their chromosome deletion bin assignments. Mol. Breed. 2013, 32, 189–210. [Google Scholar] [CrossRef] [Green Version]
- Li, H.W.; Lin, F.Y.; Wang, G.; Jing, R.F.; Zheng, Q.; Li, B.; Li, Z.S. Quantitative trait loci mapping of dark-induced senescence in winter wheat (Triticum aestivum). J. Integr. Plant Biol. 2012, 54, 33–44. [Google Scholar] [CrossRef]
- Li, H.W.; Tong, Y.P.; Li, B.; Jing, R.L.; Lu, C.M.; Li, Z.S. Genetic analysis of tolerance to photo-oxidative stress induced by high light in winter wheat (Triticum aestivum L.). J. Genet. Genom. 2010, 37, 399–412. [Google Scholar] [CrossRef]
- Li, H.W.; Wang, G.; Zheng, Q.; Li, B.; Jing, R.L.; Li, Z.S. Genetic analysis of biomass and photosynthetic parameters in wheat grown in different light intensities. J. Integr. Plant Biol. 2014, 56, 594–604. [Google Scholar] [CrossRef]
- Malik, S.; Mehboob-ur-Rahman; Malik, T.A. Genetic mapping of potential QTLs associated with drought tolerance in wheat. J. Anim. Plant Sci. 2015, 25, 1032–1040. [Google Scholar]
- Wang, S.G.; Jia, S.S.; Sun, D.Z.; Wang, H.Y.; Dong, F.F.; Ma, H.X.; Jing, R.L.; Ma, G. Genetic basis of traits related to stomatal conductance in wheat cultivars in response to drought stress. Photosynthetica 2015, 53, 299–305. [Google Scholar] [CrossRef]
- Barbour, M.M.; Bachmann, S.; Bansal, U.; Bariana, H.; Sharp, P. Genetic control of mesophyll conductance in common wheat. N. Phytol. 2016, 209, 461–465. [Google Scholar] [CrossRef] [PubMed]
- Osipova, S.; Permyakov, A.; Permyakova, M.; Pshenichnikova, T.; Verkhoturov, V.; Rudikovsky, A.; Rudikovskaya, E.; Shishparenok, A.; Doroshkov, A.; Borner, A. Regions of the bread wheat D genome associated with variation in key photosynthesis traits and shoot biomass under both well watered and water deficient conditions. J. Appl. Genet. 2016, 57, 151–163. [Google Scholar] [CrossRef] [PubMed]
- Xu, Y.F.; Li, S.S.; Li, L.H.; Ma, F.F.; Fu, X.Y.; Shi, Z.L.; Xu, H.X.; Ma, P.T.; An, D.G. QTL mapping for yield and photosynthetic related traits under different water regimes in wheat. Mol. Breed. 2017, 37, 34. [Google Scholar] [CrossRef]
- Bhusal, N.; Sharma, P.; Sareen, S.; Sarial, A.K. Mapping QTLs for chlorophyll content and chlorophyll fluorescence in wheat under heat stress. Biol. Plantarum. 2018, 62, 721–731. [Google Scholar] [CrossRef]
- McCartney, C.A.; Somers, D.J.; Humphreys, D.G.; Lukow, O.; Ames, N.; Noll, J.; Cloutier, S.; McCallum, B.D. Mapping quantitative trait loci controlling agronomic traits in the spring wheat cross RL4452 x ‘AC Domain’. Genome 2005, 48, 870–883. [Google Scholar] [CrossRef]
- Kumar, N.; Kulwal, P.L.; Balyan, H.S.; Gupta, P.K. QTL mapping for yield and yield contributing traits in two mapping populations of bread wheat. Mol. Breed. 2007, 19, 163–177. [Google Scholar] [CrossRef]
- Kuchel, H.; Williams, K.J.; Langridge, P.; Eagles, H.A.; Jefferies, S.P. Genetic dissection of grain yield in bread wheat. I. QTL analysis. Theor. Appl. Genet. 2007, 115, 1029–1041. [Google Scholar] [CrossRef]
- Cuthbert, J.L.; Somers, D.J.; Brule-Babel, A.L.; Brown, P.D.; Crow, G.H. Molecular mapping of quantitative trait loci for yield and yield components in spring wheat (Triticum aestivum L.). Theor. Appl. Genet. 2008, 117, 595–608. [Google Scholar] [CrossRef] [PubMed]
- Su, J.Y.; Zheng, Q.; Li, H.W.; Li, B.; Jing, R.L.; Tong, Y.P.; Li, Z.S. Detection of QTLs for phosphorus use efficiency in relation to agronomic performance of wheat grown under phosphorus sufficient and limited conditions. Plant Sci. 2009, 176, 824–836. [Google Scholar] [CrossRef]
- Wang, R.X.; Hai, L.; Zhang, X.Y.; You, G.X.; Yan, C.S.; Xiao, S.H. QTL mapping for grain filling rate and yield-related traits in RILs of the Chinese winter wheat population Heshangmai X Yu8679. Theor. Appl. Genet. 2009, 118, 313–325. [Google Scholar] [CrossRef]
- Zhang, L.Y.; Liu, D.C.; Guo, X.L.; Yang, W.L.; Sun, J.Z.; Wang, D.W.; Zhang, A.M. Genomic distribution of quantitative trait loci for yield and yield-related traits in common wheat. J. Integr. Plant Biol. 2010, 52, 996–1007. [Google Scholar] [CrossRef] [PubMed]
- Jia, H.Y.; Wan, H.S.; Yang, S.H.; Zhang, Z.Z.; Kong, Z.X.; Xue, S.L.; Zhang, L.X.; Ma, Z.Q. Genetic dissection of yield-related traits in a recombinant inbred line population created using a key breeding parent in China’s wheat breeding. Theor. Appl. Genet. 2013, 126, 2123–2139. [Google Scholar] [CrossRef] [PubMed]
- Cui, F.; Zhao, C.H.; Ding, A.M.; Li, J.; Wang, L.; Li, X.F.; Bao, Y.G.; Li, J.M.; Wang, H.G. Construction of an integrative linkage map and QTL mapping of grain yield-related traits using three related wheat RIL populations. Theor. Appl. Genet. 2014, 127, 659–675. [Google Scholar] [CrossRef] [PubMed]
- Xu, Y.F.; Wang, R.F.; Tong, Y.P.; Zhao, H.T.; Xie, Q.G.; Liu, D.C.; Zhang, A.M.; Li, B.; Xu, H.X.; An, D.G. Mapping QTLs for yield and nitrogen-related traits in wheat: Influence of nitrogen and phosphorus fertilization on QTL expression. Theor. Appl. Genet. 2014, 127, 59–72. [Google Scholar] [CrossRef] [PubMed]
- Gao, F.M.; Wen, W.E.; Liu, J.D.; Rasheed, A.; Yin, G.H.; Xia, X.C.; Wu, X.X.; He, Z.H. Genome-wide linkage mapping of QTL for yield components, plant height and yield-related physiological traits in the Chinese wheat cross Zhou 8425B/Chinese Spring. Front. Plant Sci. 2015, 6, 1099. [Google Scholar] [CrossRef] [PubMed] [Green Version]
- Driever, S.M.; Simkin, A.J.; Alotaibi, S.; Fisk, S.J.; Madgwick, P.J.; Sparks, C.A.; Jones, H.D.; Lawson, T.; Parry, M.A.J.; Raines, C.A. Increased SBPase activity improves photosynthesis and grain yield in wheat grown in greenhouse conditions. Philos. Trans. R. Soc. Lond. B Biol. Sci. 2017, 372, 20160384. [Google Scholar] [CrossRef] [Green Version]
- Saeed, I.; Bachir, D.G.; Chen, L.; Hu, Y.G. The Expression of TaRca2-α Gene Associated with net photosynthesis rate, biomass and grain yield in bread wheat (Triticum aestivum L.) under field conditions. PLoS ONE 2016, 11, e0161308. [Google Scholar] [CrossRef]
- Fang, J.J.; Zhu, W.Q.; Tong, Y.P. Knock-down the expression of brassinosteroid receptor TaBRI1 reduces photosynthesis, tolerance to high light and high temperature stresses and grain yield in wheat. Plants 2020, 9, 840. [Google Scholar] [CrossRef]
- Ying, Y.; Liu, F.F.; Li, G.P.; Zheng, Q.; Li, B.; Li, Z.S.; Cheng, J.F.; Li, H.W. Silencing of the receptor-like cytoplasmic kinase gene TaRKL1 reduces photosynthetic capacity in wheat. Photosynthetica 2020, 58, 1188–1199. [Google Scholar] [CrossRef]
- Lawlor, D.W.; Paul, M.J. Source/sink interactions underpin crop yield: The case for trehalose 6-phosphate/SnRK1 in improvement of wheat. Front. Plant Sci. 2014, 5, 418. [Google Scholar] [CrossRef] [Green Version]
- Wang, S.W.; Xu, C.C.; Bai, K.Z.; Zhang, Q.D.; Li, L.B.; Kuang, T.Y.; Li, J.Y.; Li, Z.S. Comparative study on photoinhibition between two wheat genotypes. Acta Bot. Sin. 2000, 42, 1300–1303. [Google Scholar]
- Yang, X.H.; Chen, X.Y.; Ge, Q.Y.; Li, B.; Tong, Y.P.; Li, Z.S.; Kuang, T.Y.; Lu, C.M. Characterization of photosynthesis of flag leaves in a wheat hybrid and its parents grown under field conditions. J. Plant Physiol. 2007, 164, 318–326. [Google Scholar] [CrossRef] [PubMed]
- Yang, X.H.; Chen, X.Y.; Ge, Q.Y.; Li, B.; Tong, Y.P.; Zhang, A.M.; Li, Z.S.; Kuang, T.Y.; Lu, C.M. Tolerance of photosynthesis to photoinhibition, high temperature and drought stress in flag leaves of wheat: A comparison between a hybridization line and its parents grown under field conditions. Plant Sci. 2006, 171, 389–397. [Google Scholar] [CrossRef] [PubMed]
- Chen, X.Y.; Li, W.; Lu, Q.T.; Wen, X.G.; Li, H.W.; Kuang, T.Y.; Li, Z.S.; Lu, C.M. The xanthophyll cycle and antioxidative defense system are enhanced in the wheat hybrid subjected to high light stress. J. Plant Physiol. 2011, 168, 1828–1836. [Google Scholar] [CrossRef] [PubMed]
- Malone, S.; Herbert, D.A.; Holshouser, D.L. Evaluation of the LAI-2000 plant canopy analyzer to estimate leaf area in manually defoliated soybean. Agron. J. 2002, 94, 1012–1019. [Google Scholar] [CrossRef]
- Zeng, Z.B. Precision mapping of quantitative trait loci. Genetics 1994, 136, 1457–1468. [Google Scholar] [CrossRef]
- Churchill, G.A.; Doerge, R.W. Empirical threshold values for quantitative trait mapping. Genetics 1994, 138, 963–971. [Google Scholar] [CrossRef]
- Doerge, R.W.; Churchill, G.A. Permutation tests for multiple loci affecting a quantitative character. Genetics 1996, 142, 285–294. [Google Scholar] [CrossRef]
- Somers, D.J.; Isaac, P.; Edwards, K. A high-density microsatellite consensus map for bread wheat (Triticum aestivum L.). Theor. Appl. Genet. 2004, 109, 1105–1114. [Google Scholar] [CrossRef]
- Ellis, M.H.; Spielmeyer, W.; Gale, K.R.; Rebetzke, G.J.; Richards, R.A. “Perfect” markers for the Rht-B1b and Rht-D1b dwarfing genes in wheat. Theor. Appl. Genet. 2002, 105, 1038–1042. [Google Scholar] [CrossRef]
- Habash, D.Z.; Bernard, S.; Schondelmaier, J.; Weyen, J.; Quarrie, S.A. The genetics of nitrogen use in hexaploid wheat: N utilisation, development and yield. Theor. Appl. Genet. 2007, 114, 403–419. [Google Scholar] [CrossRef] [PubMed]
- Miralles, D.J.; Slafer, G.A. Radiation interception and radiation use efficiency of near-isogenic wheat lines with different height. Euphytica 1997, 97, 201–208. [Google Scholar] [CrossRef]
- Nenova, V.R.; Kocheva, K.V.; Petrov, P.I.; Georgiev, G.I.; Karceva, T.V.; Borner, A.; Landjeva, S.P. Wheat Rht-B1 dwarfs exhibit better photosynthetic response to water deficit at seedling stage compared to the wild Type. J. Agron. Crop Sci. 2014, 200, 434–443. [Google Scholar] [CrossRef]
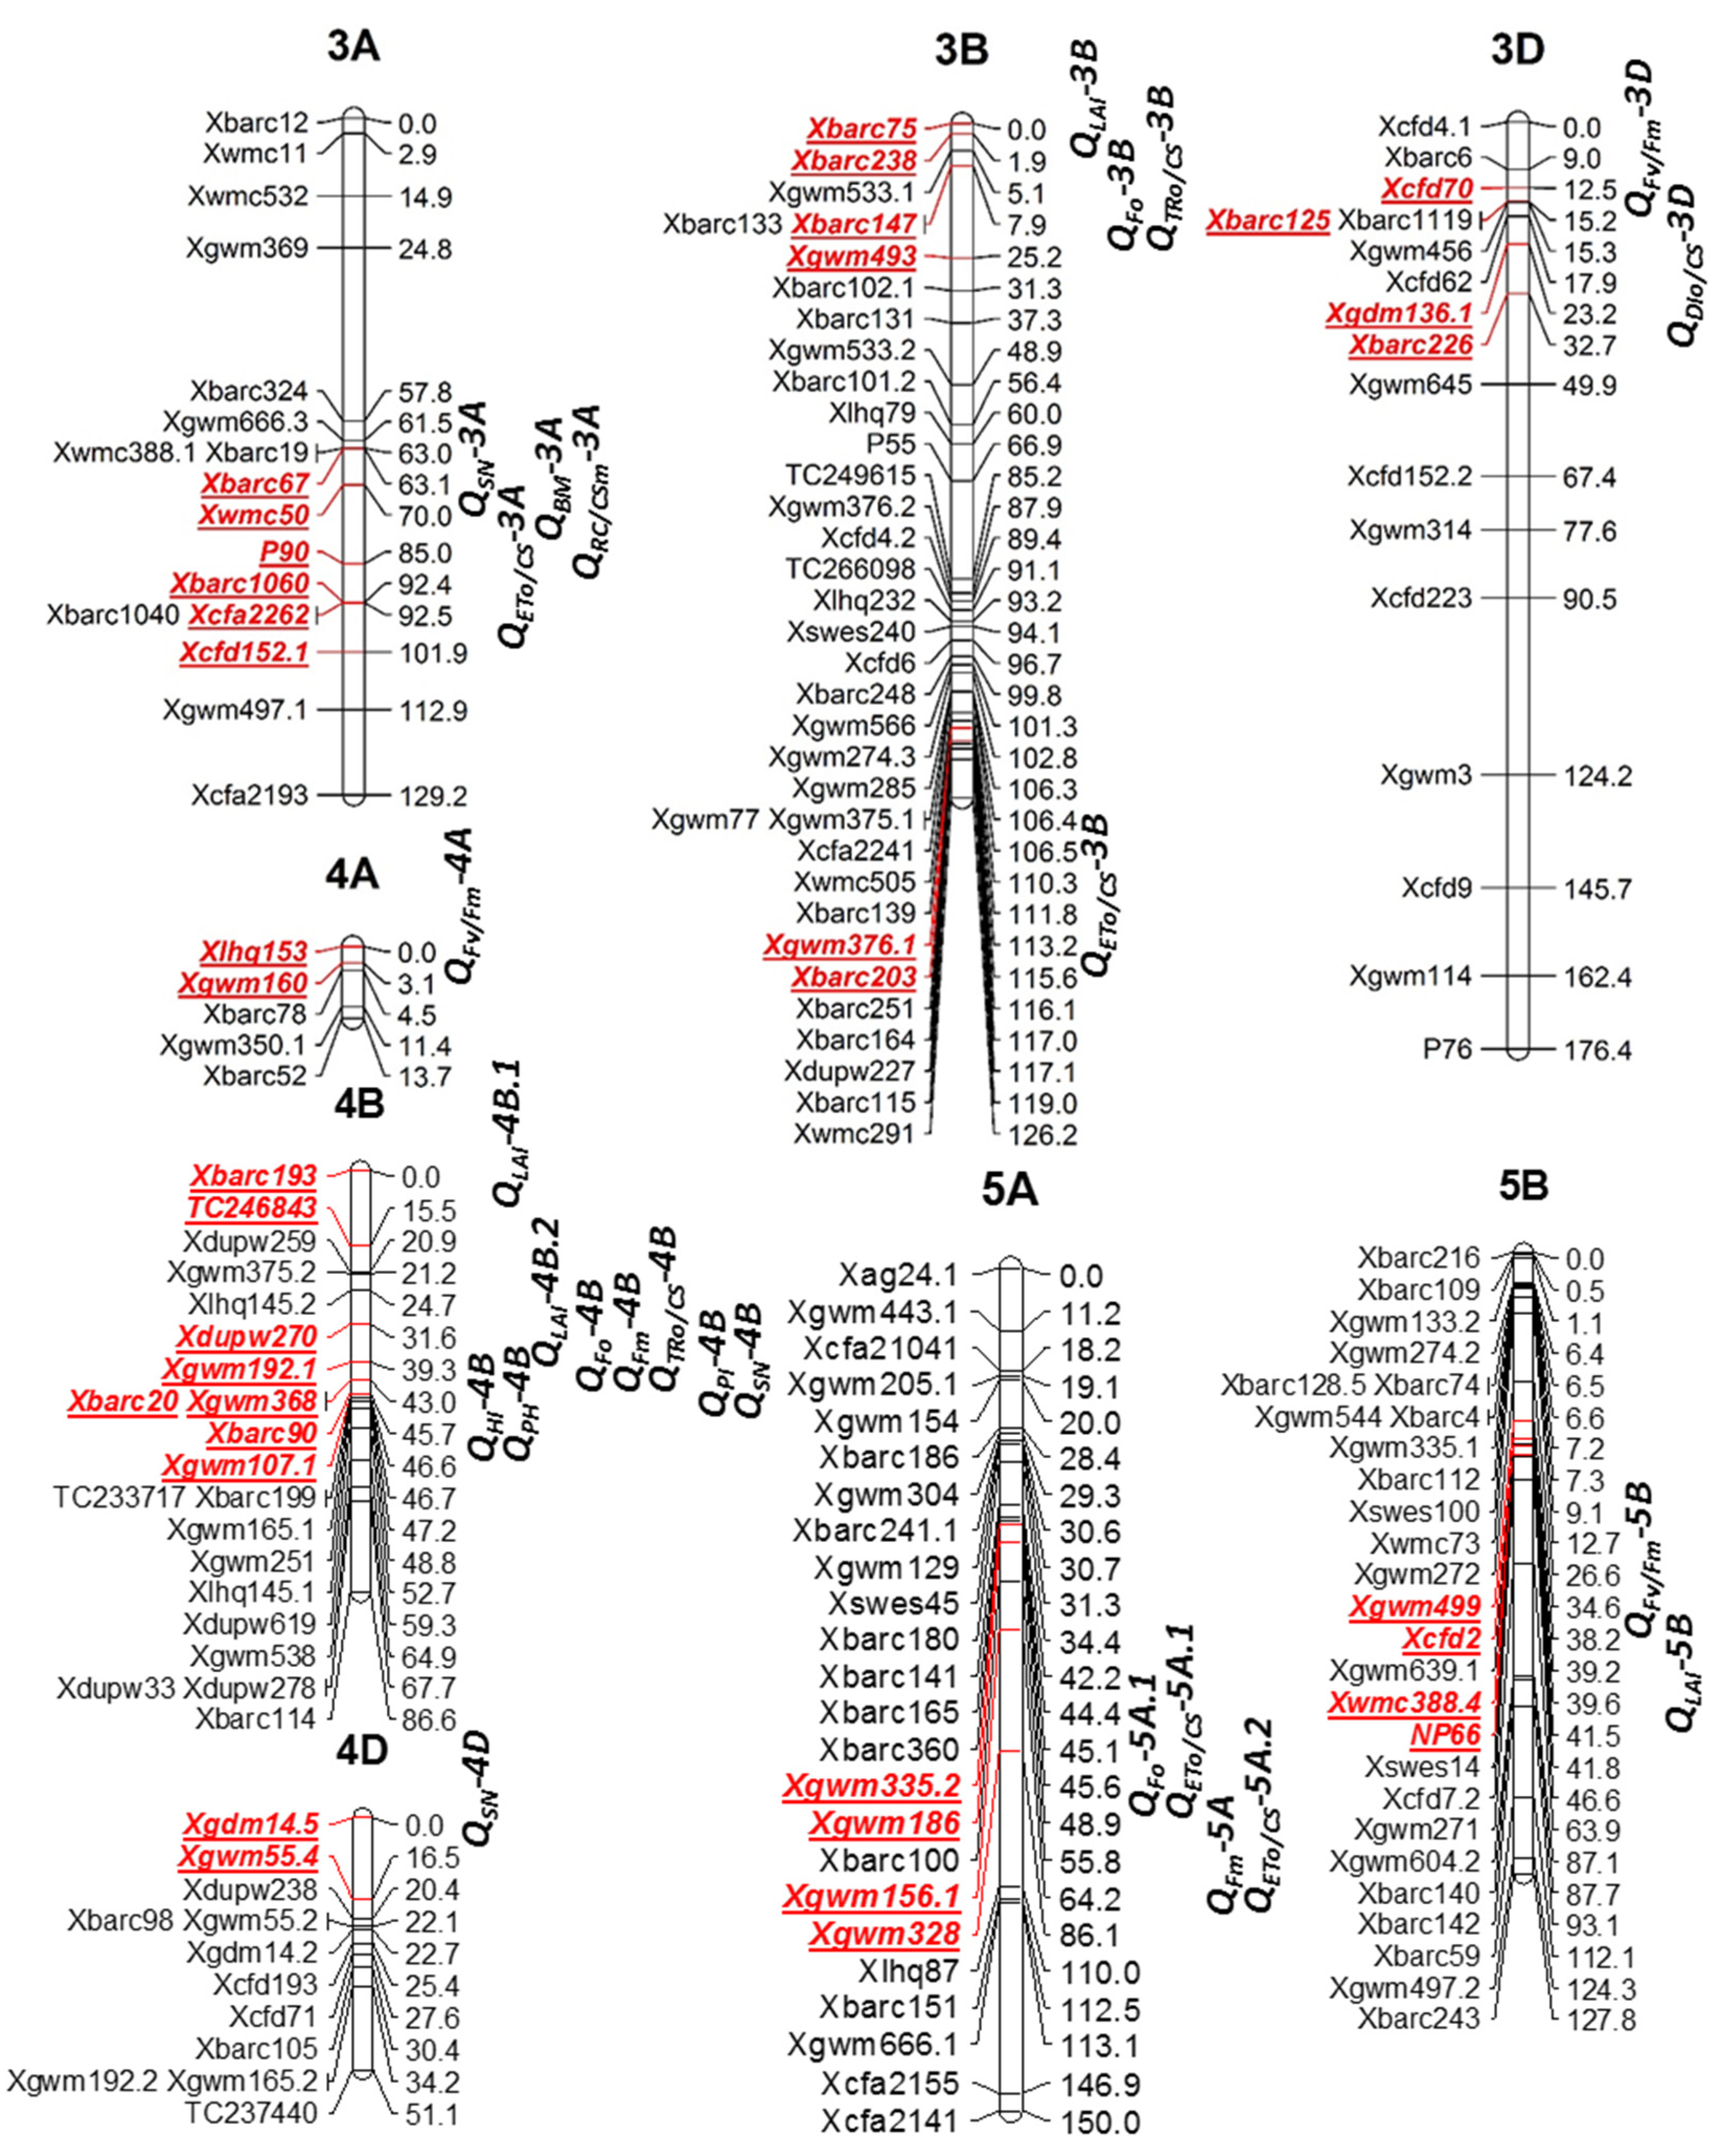
Figure 1.
The distribution of the quantitative trait loci (QTL) for the investigated traits in wheat genetic linkage groups constructed on the “Xiaoyan 54 × Jing 411” recombinant inbred line population. The red text indicates marker intervals for the identified QTL. Chl, chlorophyll content; Fo, the minimum fluorescence level; Fm, the maximum fluorescence level; Fv/Fm, the maximal quantum yield of photosystem II photochemistry; PI, performance index; TRo/CS, trapped energy flux per cross section; ETo/CS, electron transport flux per cross section; DIo/CS, dissipated energy flux per cross section; RC/CSm, density of reaction center per excited cross section; A, net CO2 assimilation rate; LAI, leaf area index; PH, plant height; SN, spike number; BM, biomass; GY, grain yield; and HI, harvest index.


Table 1.
Statistics of the investigated traits of the recombinant inbred lines (RILs) and their parents.
Table 1.
Statistics of the investigated traits of the recombinant inbred lines (RILs) and their parents.
| Traits | Xiaoyan 54 | Jing 411 | RIL Population | |||||||
|---|---|---|---|---|---|---|---|---|---|---|
| Mean | Min | Max | SD | CV (%) | F-Value | Skewness | Kurtosis | |||
| Chl | 46.3 ± 3.7 | 51.1 ± 4.1 ** | 49.3 | 41.7 | 55.4 | 2.3 | 4.7 | 5.64 *** | 0.009 | 0.914 |
| Fo | 400.1 ± 25.3 | 412.3 ± 27.7 | 422.3 | 379.0 | 466.4 | 15.4 | 3.6 | 2.69 *** | −0.185 | 0.310 |
| Fm | 2351.3 ± 259.7 | 2426.6 ± 248.4 | 2427.8 | 2154.7 | 2797.6 | 118.9 | 4.9 | 3.73 *** | 0.471 | 1.019 |
| Fv/Fm | 0.828 ± 0.015 | 0.829 ± 0.014 | 0.825 | 0.810 | 0.840 | 0.006 | 0.7 | 2.10 *** | 0.404 | 0.623 |
| PI | 5.09 ± 1.38 | 5.43 ± 1.15 | 4.91 | 3.64 | 6.18 | 0.48 | 9.8 | 2.07 *** | 0.294 | 0.399 |
| TRo/CS | 331.5 ± 22.3 | 341.8 ± 23.4 | 348.3 | 311.3 | 382.4 | 12.9 | 3.7 | 3.16 *** | −0.153 | 0.380 |
| ETo/CS | 208.0 ± 19.1 | 218.6 ± 21.6 | 220.0 | 196.5 | 242.7 | 9.0 | 4.1 | 2.59 *** | −0.083 | 0.147 |
| DIo/CS | 68.6 ± 7.2 | 70.5 ± 7.8 | 74.1 | 64.0 | 84.0 | 3.7 | 5.0 | 1.74 *** | 0.167 | 0.019 |
| RC/CSm | 1422.2 ± 199.3 | 1487.2 ± 144.1 | 1412.9 | 1236.8 | 1653.7 | 77.8 | 5.5 | 2.94 *** | 0.279 | 0.383 |
| A (μmol m−2 s−1) | 18.64 ± 2.91 | 21.31 ± 3.12 ** | 20.79 | 17.17 | 23.91 | 1.67 | 8.0 | 7.46 *** | 0.125 | −0.827 |
| LAI | 3.77 ± 0.78 | 4.56 ± 0.78 * | 3.21 | 1.51 | 4.77 | 0.72 | 22.4 | 3.84 *** | −0.335 | −0.589 |
| PH (cm) | 70.4 ± 15.5 | 81.4 ± 10.5 | 74.7 | 46.0 | 101.0 | 12.0 | 16.1 | 5.70 *** | 0.227 | −0.235 |
| SN | 90.5 ± 15.8 | 86.3 ± 9.1 | 87.1 | 54.7 | 122.3 | 14.3 | 16.4 | 2.47 *** | 0.007 | −0.503 |
| BM (g) | 222.7 ± 89.7 | 220.3 ± 59.5 | 220.0 | 117.2 | 356.5 | 46.6 | 21.2 | 1.58 *** | 0.018 | 0.372 |
| GY (g) | 94.8 ± 28.9 | 104.3 ± 19.2 | 97.9 | 58.6 | 161.1 | 19.2 | 19.6 | 1.63 *** | 0.168 | 0.448 |
| HI | 0.444 ± 0.059 | 0.484 ± 0.059 | 0.450 | 0.330 | 0.630 | 0.040 | 8.9 | 3.53 *** | 0.397 | 2.877 |
Data are represented as mean ± SD (standard deviation); CV, coefficient of variation; Chl, chlorophyll content; Fo, the minimum fluorescence level; Fm, the maximum fluorescence level; Fv/Fm, the maximal quantum yield of photosystem II photochemistry; PI, performance index; TRo/CS, trapped energy flux per cross section; ETo/CS, electron transport flux per cross section; DIo/CS, dissipated energy flux per cross section; RC/CSm, density of reaction center per excited cross section; A, net CO2 assimilation rate; LAI, leaf area index; PH, plant height; SN, spike number; BM, biomass; GY, grain yield; and HI, harvest index. For parents, data are represented as the mean ± standard deviation (SD). *, **, *** represent the difference between Xiaoyan 54 and Jing 411, as well as among RILs at p < 0.05, p < 0.01, and p < 0.001, respectively.
Table 2.
Summary of the QTL for the photosynthetic traits in flag leaves detected with composite interval mapping by using the “Xiaoyan 54 × Jing 411” recombinant inbred line population.
Table 2.
Summary of the QTL for the photosynthetic traits in flag leaves detected with composite interval mapping by using the “Xiaoyan 54 × Jing 411” recombinant inbred line population.
| Traits | QTL | Marker Interval | Year 2009 | Year 2010 | ||||
|---|---|---|---|---|---|---|---|---|
| LOD | Add | R2 (%) | LOD | Add | R2 (%) | |||
| Chl | QChl-1A.1 | Xbarc119.1-WCI5 | 3.25 | −1.0 | 10.8 | 4.34 | −0.4 | 14.1 |
| QChl-1A.2 | Xcfd59.2-Xgwm558.2 | 3.83 | −1.0 | 10.6 | ||||
| QChl-2D | Xgwm132.1-Xcfd53 | 4.43 | 1.0 | 11.2 | ||||
| QChl-6A | Xgwm617-Xcfa2114 | 3.86 | −0.4 | 12.8 | ||||
| QChl-6B | NP323103-Xcfd13 | 3.64 | −1.1 | 10.3 | ||||
| Fo | QFo-3B | Xbarc147-Xgwm493 | 5.21 | −6.5 | 17.5 | |||
| QFo-4B | Xgwm192.1-Xbarc20 | 4.91 | 8.3 | 15.2 | 5.31 | 7.2 | 17.5 | |
| QFo-5A | Xgwm335.2-Xgwm186 | 3.81 | 5.5 | 11.6 | ||||
| Fm | QFm-1B | Glu57.2-Glu_3D | 6.57 | −110.1 | 30.5 | |||
| QFm-4B | Xgwm192.1-Xbarc20 | 7.79 | 64.0 | 23.7 | ||||
| QFm-5A | Xgwm156.1-Xgwm328 | 3.76 | 59.7 | 15.1 | ||||
| Fv/Fm | QFv/Fm-2D | Xcfd43-Xgwm102 | 3.76 | −0.003 | 12.8 | |||
| QFv/Fm-3D | Xcfd70-Xbarc125 | 3.75 | −0.003 | 11.5 | ||||
| QFv/Fm-4A | Xlhq153-Xgwm160 | 3.31 | −0.003 | 9.3 | ||||
| QFv/Fm-5B | Xgwm499-Xcfd2 | 4.75 | 0.003 | 15.6 | ||||
| PI | QPI-2A | Xgwm501-Xgwm156.2 | 6.07 | −0.48 | 22.8 | |||
| QPI-4B | Xgwm368-Xbarc90 | 3.37 | −0.18 | 9.8 | ||||
| TRo/CS | QTRo/CS-3B | Xbarc147-Xgwm493 | 3.54 | −4.7 | 12.9 | |||
| QTR/CS-4B | Xgwm192.1-Xbarc20 | 4.29 | 6.1 | 12.8 | 8.84 | 7.3 | 27.6 | |
| ETo/CS | QETo/CS-1B.1 | Glu57.2-Glu_3D | 6.20 | −7.8 | 27.1 | |||
| QETo/CS-1B.2 | Glu_3D-Xswes215 | 3.81 | 3.3 | 9.9 | ||||
| QETo/CS-3A | Xcfa2262-Xcfd152.1 | 3.42 | −3.7 | 12.1 | ||||
| QETo/CS-3B | Xgwm376.1-Xbarc203 | 3.79 | −3.3 | 10.2 | ||||
| QETo/CS-5A.1 | Xgwm335.2-Xgwm186 | 3.37 | 3.3 | 10.0 | ||||
| QETo/CS-5A.2 | Xgwm156.1-Xgwm328 | 3.32 | 4.6 | 15.5 | 3.23 | 3.9 | 14.6 | |
| DIo/CS | QDIo/CS-2A | Xgwm501-Xgwm156.2 | 6.74 | 2.4 | 23.1 | |||
| QDIo/CS-2D | Xcfd43-Xgwm102 | 4.63 | 2.1 | 15.0 | ||||
| QDIo/CS-3D | Xgdm136.1-Xbarc226 | 4.10 | 1.9 | 12.4 | ||||
| RC/CSm | QRC/CSm-1A | Xcfd61.2-Xwmc329.1 | 5.13 | −53.1 | 16.8 | |||
| QRC/CSm-1B.1 | Glu57.2-Glu_3D | 4.28 | −63.8 | 14.5 | ||||
| QRC/CSm-1B.2 | Glu_3D-Xswes215 | 3.30 | 34.3 | 10.2 | ||||
| QRC/CSm-2B | Xag24.2-Xgwm191.1 | 3.60 | −35.7 | 11.6 | ||||
| QRC/CSm-3A | P90-Xbarc1060 | 3.63 | −41.3 | 13.6 | ||||
| A | QA-1D | Xbarc152.1-Xcfd61.1 | 4.34 | 0.86 | 17.0 | |||
| QA-2D | Xgwm614.1-Xcfd51 | 3.30 | −0.90 | 11.0 | ||||
Chl, chlorophyll content; Fo, the minimum fluorescence level; Fm, the maximum fluorescence level; Fv/Fm, the maximal quantum yield of photosystem II photochemistry; PI, performance index; TRo/CS, trapped energy flux per cross section; ETo/CS, electron transport flux per cross section; DIo/CS, dissipated energy flux per cross section; RC/CSm, density of reaction center per excited cross section; A, net CO2 assimilation rate; LOD, likelihood of odd; Add, additive effects (a positive sign means that the increased alleles are obtained from Xiaoyan 54, while a negative sign signifies the positive alleles from Jing 411); and R2, % of the phenotypic variance explained by the QTL.
Table 3.
Summary of QTL for the LAI and grain yield-related traits detected with composite interval mapping by using the “Xiaoyan 54 × Jing 411” recombinant inbred line population.
Table 3.
Summary of QTL for the LAI and grain yield-related traits detected with composite interval mapping by using the “Xiaoyan 54 × Jing 411” recombinant inbred line population.
| Traits | QTL | Marker Interval | Year 2009 | Year 2010 | ||||
|---|---|---|---|---|---|---|---|---|
| LOD | Add | R2 (%) | LOD | Add | R2 (%) | |||
| LAI | QLAI-1B | Xlhq11-Xwmc402 | 3.45 | −0.21 | 10.9 | |||
| QLAI-2D | Xwmc112-Xbarc168 | 3.71 | −0.23 | 23.3 | ||||
| QLAI-3B | Xbarc75-Xbarc238 | 3.55 | 0.23 | 16.6 | ||||
| QLAI-4B.1 | Xbarc193-TC246843 | 3.49 | 0.24 | 21.4 | ||||
| QLAI-4B.2 | Xdupw270-Xgwm192.1 | 6.91 | 0.26 | 25.9 | ||||
| QLAI-5B | Xwmc388.4-NP66 | 3.80 | −0.19 | 11.9 | ||||
| PH | QPH-2D | Xwmc112-Xbarc168 | 9.31 | −4.5 | 39.9 | 9.30 | −4.9 | 27.6 |
| QPH-4B | Xbarc90-Xgwm107.1 | 11.48 | −4.9 | 29.7 | ||||
| SN | QSN-2A | Xgwm448-Xcfa2043 | 3.41 | −4.1 | 11.4 | |||
| QSN-2D | Xgwm296.3-Xgwm261 | 5.00 | −6.4 | 16.3 | ||||
| QSN-3A | Xbarc67-Xwmc50 | 3.52 | 4.7 | 10.4 | ||||
| QSN-4B | Xgwm368-Xbarc90 | 4.52 | 5.0 | 16.9 | ||||
| QSN-4D | Xgdm14.5-Xgwm55.4 | 4.33 | −5.4 | 17.8 | ||||
| QSN-7B | Xgwm577-Xwmc273 | 5.44 | 6.4 | 17.8 | ||||
| BM | QBM-2B | Xbarc160-Xgwm55.1 | 4.08 | −8.7 | 15.6 | |||
| QBM-2D | Xgwm296.3-Xgwm261 | 4.11 | −13.8 | 12.0 | ||||
| QBM-3A | Xwmc50-P90 | 4.23 | 14.0 | 12.6 | ||||
| GY | QGY-2B | TC288392-Xbarc91 | 3.78 | −4.1 | 14.1 | |||
| QGY-2D | Xcfd53-Xwmc112 | 3.65 | −6.0 | 10.0 | ||||
| HI | QHI-1A | Xcfd61.2-Xwmc329.1 | 3.23 | −0.014 | 13.5 | |||
| QHI-4B | Xbarc90-Xgwm107.1 | 3.65 | 0.010 | 9.5 | ||||
| QHI-6B | Xgwm132.3-Xgwm132.2 | 6.72 | −0.012 | 18.6 | ||||
LAI, leaf area index; PH, plant height; SN, spike number; BM, biomass; GY, grain yield; HI, harvest index; LOD, likelihood of odd; Add, additive effects (a positive sign means that the increased alleles are obtained from Xiaoyan 54, while a negative sign signifies the positive alleles from Jing 411); and R2, % of the phenotypic variance explained by the QTL.
Table 4.
QTL clusters detected for at least two of the investigated traits.
| Cluster | Chr | Marker Intervals | Position (cM) | Traits |
|---|---|---|---|---|
| 1 | 1A | Xcfd61.2-Xwmc329.1 | 34.0–36.0 | RC/CSm (09-14), HI (09) |
| 2 | 1B | Glu57.2-Glu_3D | 0.0–3.0 | Fm (10-14), RC/CSm (10-14), ETo/CS (10-14) |
| 3 | 1B | Glu_3D-D57R | 29.6–30.3 | ETo/CS (09-14), RC/CSm (09-14) |
| 4 | 2A | Xgwm501-Xgwm156.2 | 71.6 | DIo/CS (10-14), PI (10-14) |
| 5 | 2B | TC288392-Xbarc91-Xbarc160-Xgwm55.1 | 71.3–74.3 | BM (09), GY (09) |
| 6 | 2D | Xgwm296.3-Xgwm261-Xgwm132.1-Xcfd53-Xwmc112-Xbarc168 | 94.5–111.9 | Chl (09-14), LAI (10-34), PH (09), PH (10), SN (10), BM (10), GY (10) |
| 7 | 2D | Xcfd43-Xgwm102 | 142.4–144.4 | Fv/Fm (09-14), DIo/CS (09-14) |
| 8 | 3A | Xbarc67-Xwmc50-P90-Xbarc1060 | 66.1–87.0 | RC/CSm (10-14), SN (10), BM (10) |
| 9 | 3B | Xbarc75-Xbarc238-Xbarc147-Xgwm493 | 0.0–21.9 | Fo (10-14), TRo/CS (10-14), LAI (09-7) |
| 10 | 4B | Xdupw270-Xgwm192.1-Xbarc20-Xgwm368-Xbarc90-Xgwm107.1 | 38.6–45.8 | Fo (09-7), Fo (09-14), Fm (09-14), TRo/CS (09-7), TRo/CS (09-14), SN (09), HI (10), LAI (09-17), PI (09-7), PH (10) |
| 11 | 5A | Xgwm335.2-Xgwm186 | 45.6 | Fo (10-14), ETo/CS (10-14) |
| 12 | 5A | Xgwm156.1-Xgwm328 | 78.2 | Fm (09-7), ETo/CS (09-7), ETo/CS (09-14) |
Chl, chlorophyll content; Fo, the minimum fluorescence level; Fm, the maximum fluorescence level; Fv/Fm, the maximal quantum yield of photosystem II photochemistry; PI, performance index; TRo/CS, trapped energy flux per cross section; ETo/CS, electron transport flux per cross section; DIo/CS, dissipated energy flux per cross section; RC/CSm, density of the reaction center per excited cross section; LAI, leaf area index; PH, plant height; SN, spike number; BM, biomass; GY, grain yield; and HI, harvest index. The traits in bold represent the increasing allele from Xiaoyan 54 while those in plain text mean the increasing allele from Jing 411. The trials for each trait are described in brackets, e.g., 09-7 represents 7 days post anthesis in the year 2009
Publisher’s Note: MDPI stays neutral with regard to jurisdictional claims in published maps and institutional affiliations. |
© 2022 by the authors. Licensee MDPI, Basel, Switzerland. This article is an open access article distributed under the terms and conditions of the Creative Commons Attribution (CC BY) license (https://creativecommons.org/licenses/by/4.0/).
Share and Cite
MDPI and ACS Style
An, Q.; Li, C.; Li, H.; Zheng, Q.; Li, B.; Li, Z. An Analysis of the Genetic Relation between Photosynthesis and Yield-Related Traits in Wheat. Agriculture 2022, 12, 560. https://0-doi-org.brum.beds.ac.uk/10.3390/agriculture12040560
AMA Style
An Q, Li C, Li H, Zheng Q, Li B, Li Z. An Analysis of the Genetic Relation between Photosynthesis and Yield-Related Traits in Wheat. Agriculture. 2022; 12(4):560. https://0-doi-org.brum.beds.ac.uk/10.3390/agriculture12040560
Chicago/Turabian StyleAn, Qiang, Chunlian Li, Hongwei Li, Qi Zheng, Bin Li, and Zhensheng Li. 2022. "An Analysis of the Genetic Relation between Photosynthesis and Yield-Related Traits in Wheat" Agriculture 12, no. 4: 560. https://0-doi-org.brum.beds.ac.uk/10.3390/agriculture12040560
Note that from the first issue of 2016, this journal uses article numbers instead of page numbers. See further details here.