


Optimization of a High-Pressure Soil Washing System for Emergency Recovery of Heavy Metal-Contaminated Soil
Abstract
:1. Introduction
2. Experimental Methodology
2.1. Soil Collection and Analysis Process
2.2. Physicochemical Analyses
2.3. Scanning Electron Microscopy (SEM) Analyses
2.4. X-ray Powder Diffraction (XRPD) Analysis
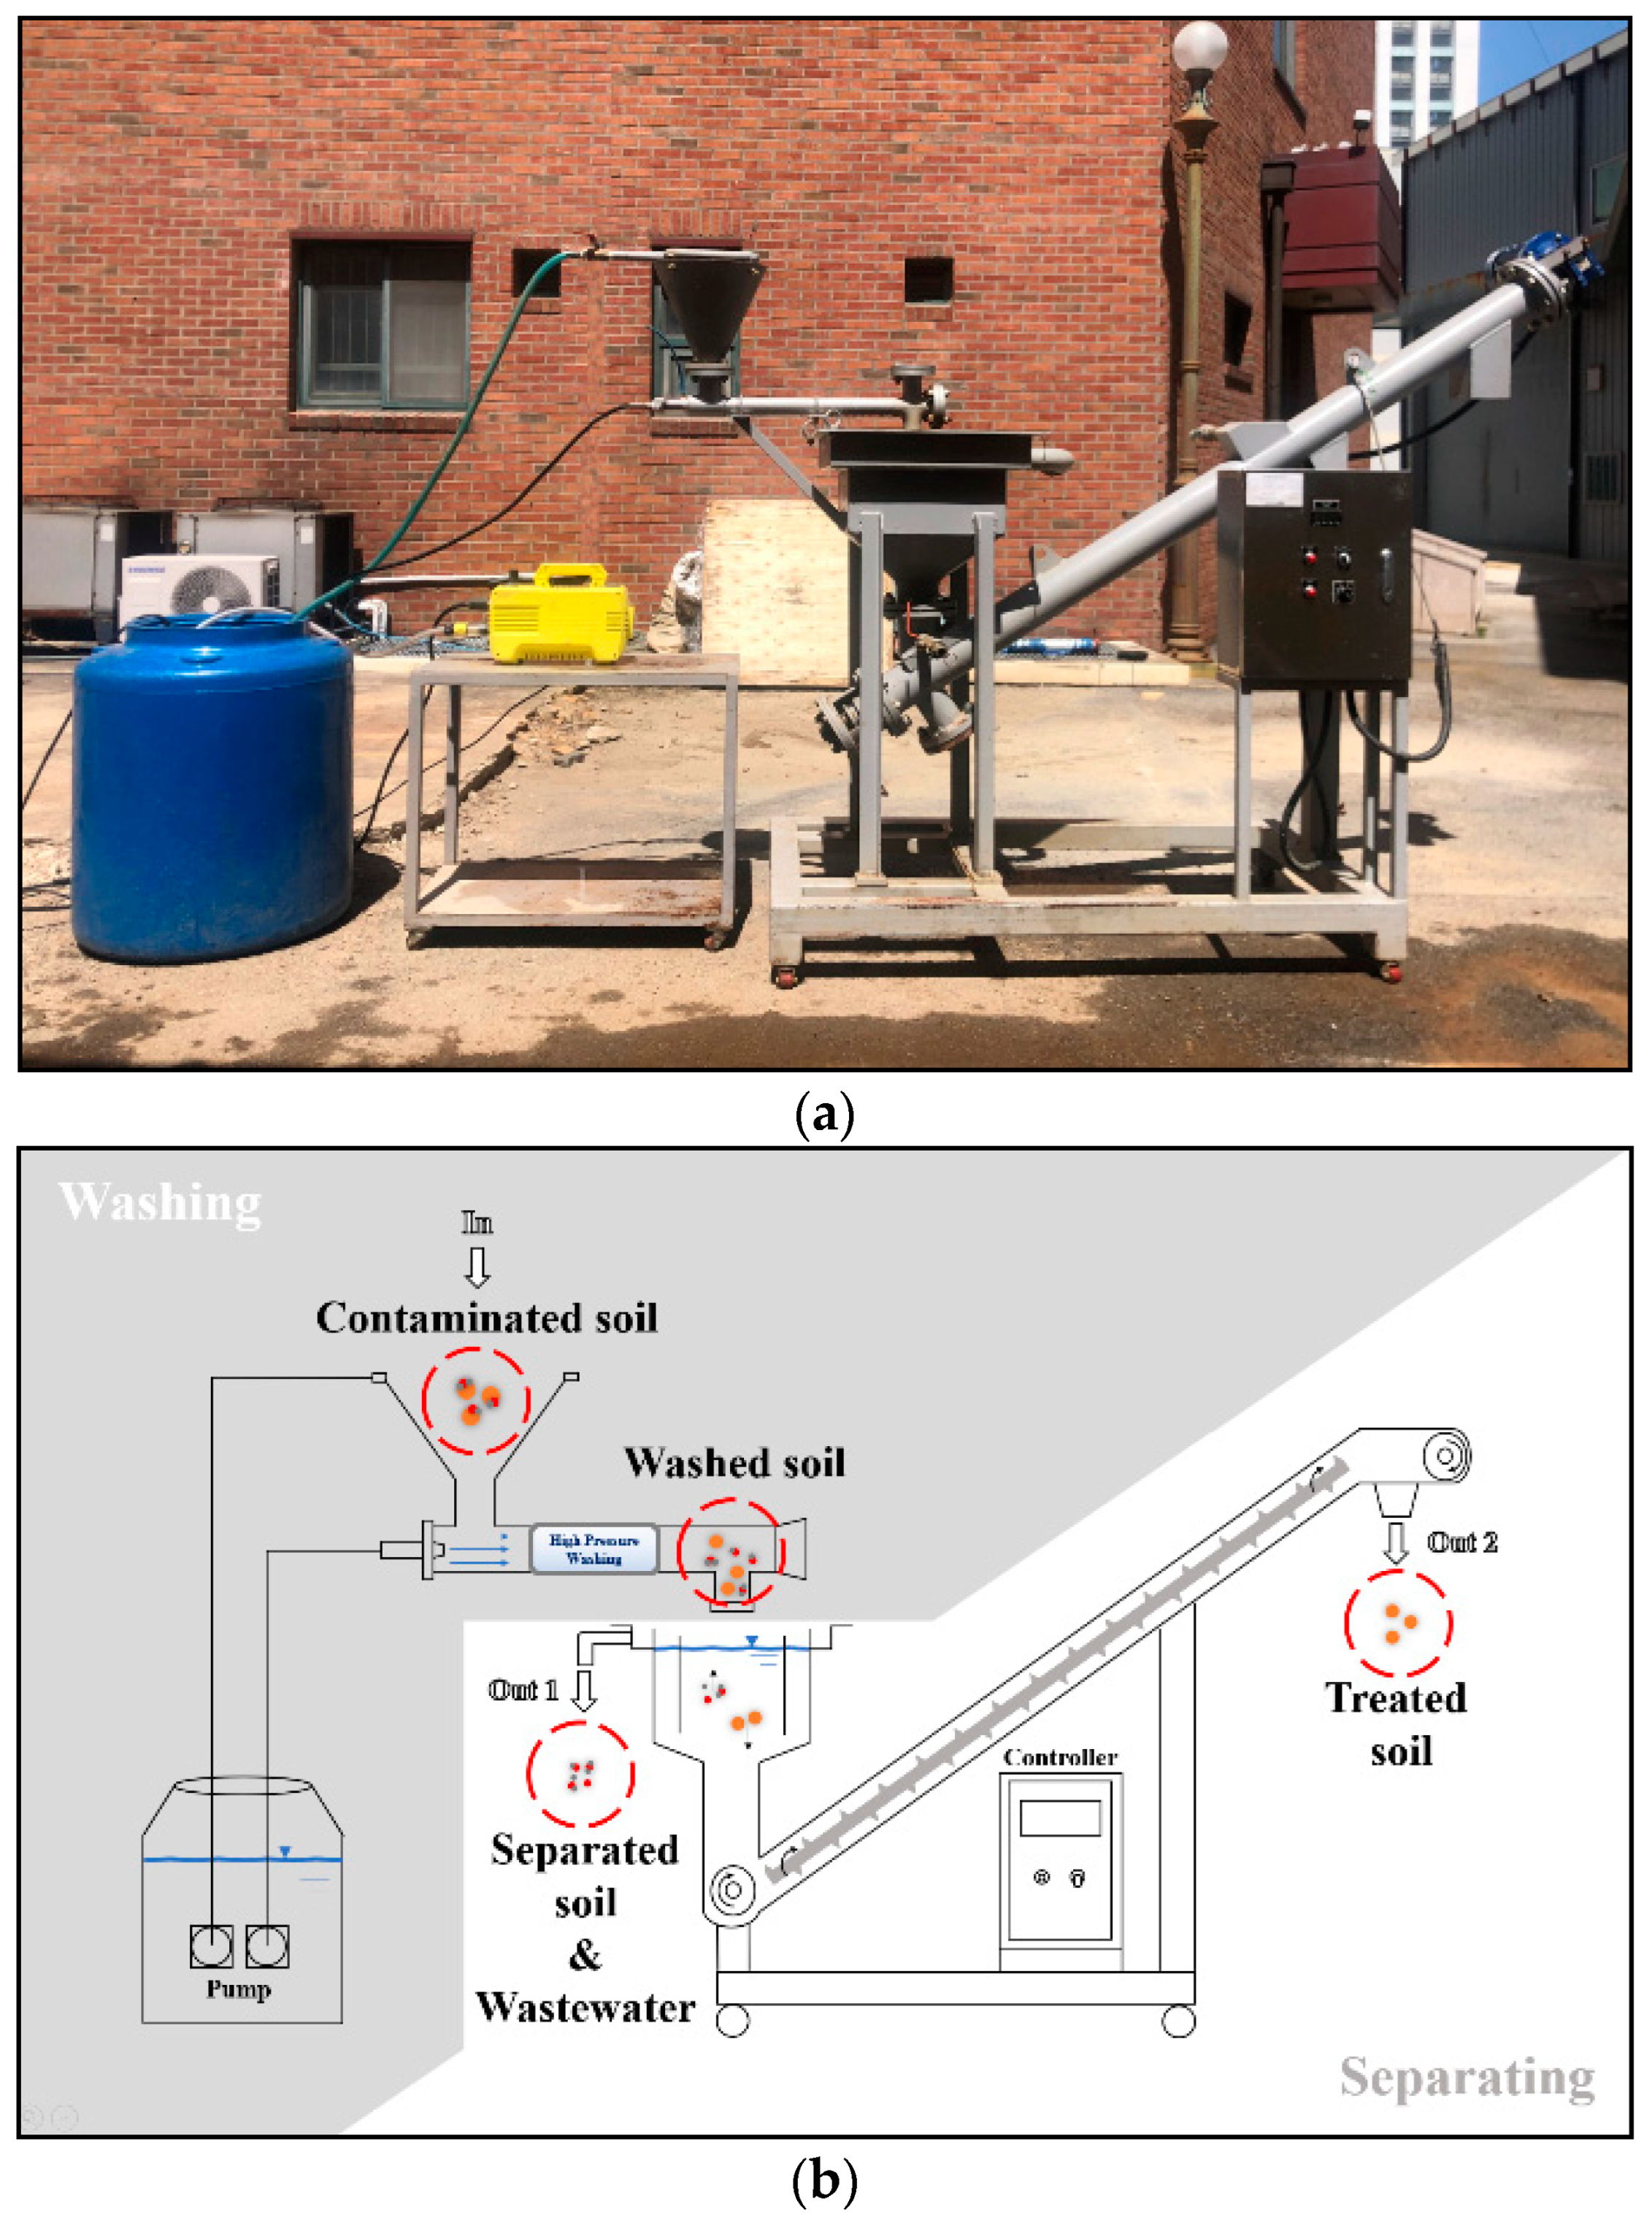
2.5. The High-Pressure Soil Washing Ejector and Solid-Liquid Separator
2.6. High-Pressure Soil Washing Optimization
2.7. Particle Size Fraction and Heavy Metal Mass Loading Analyses
3. Results and Discussion
3.1. Characterization of Contaminated Soil
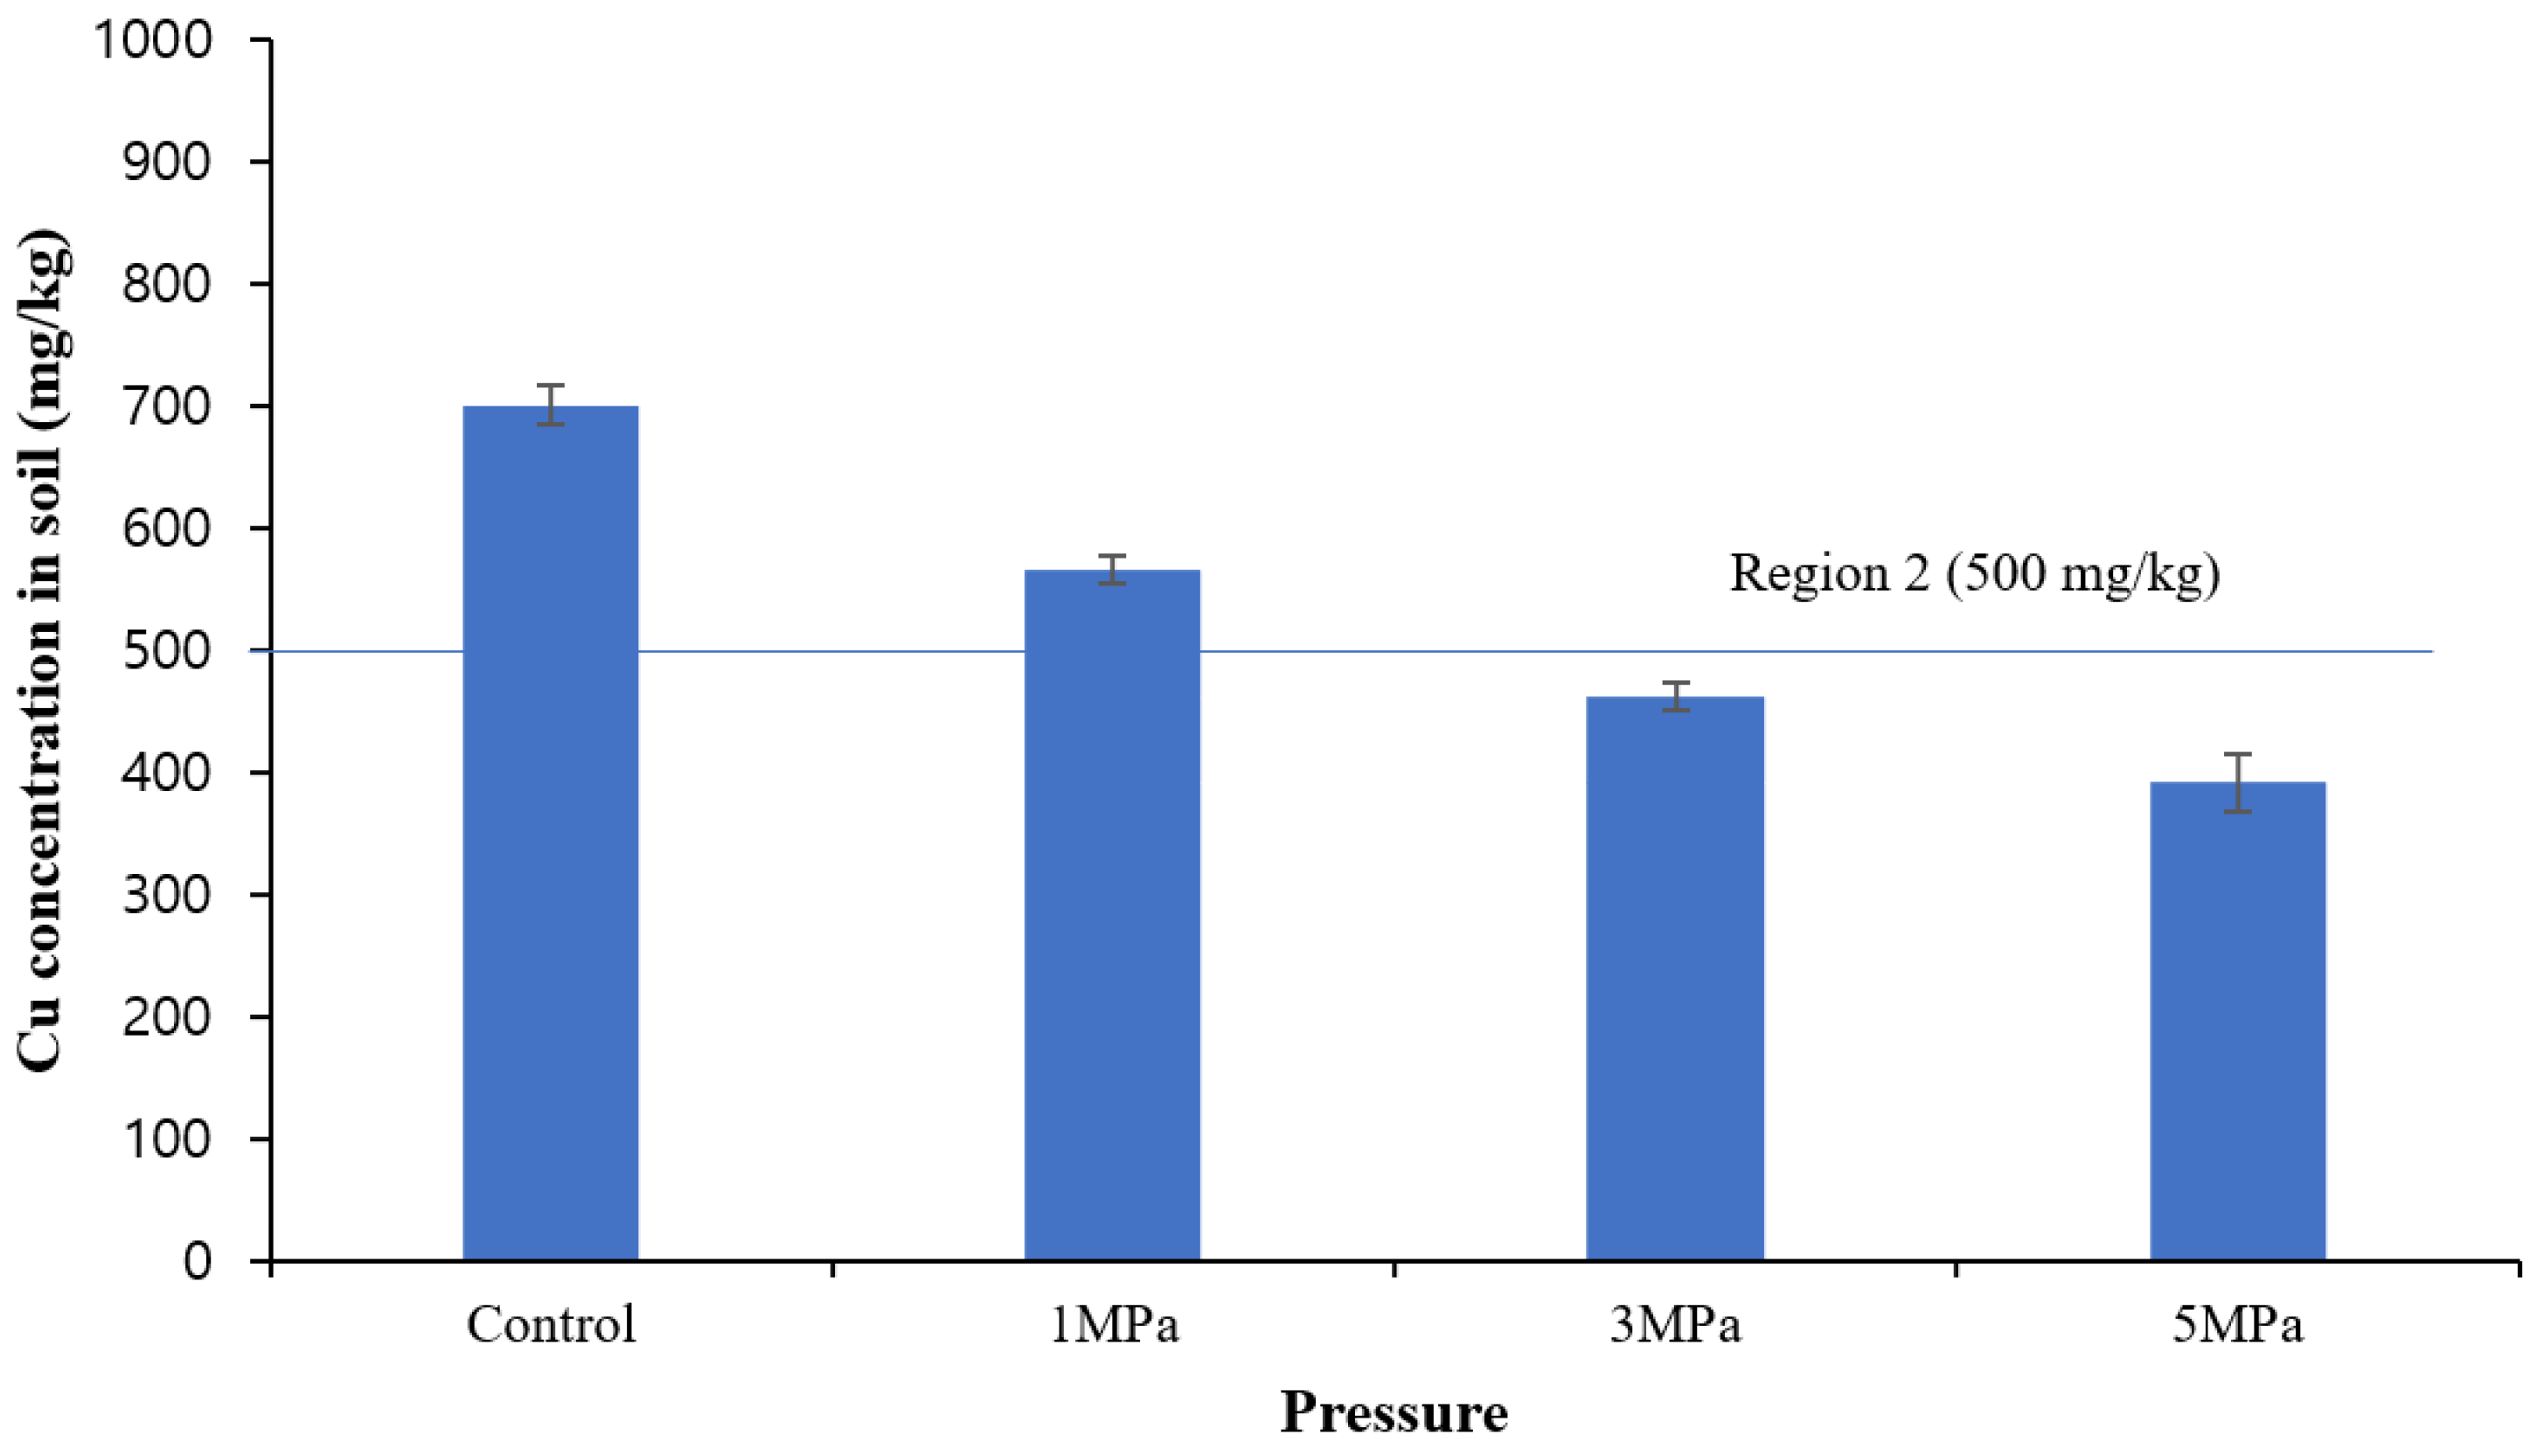
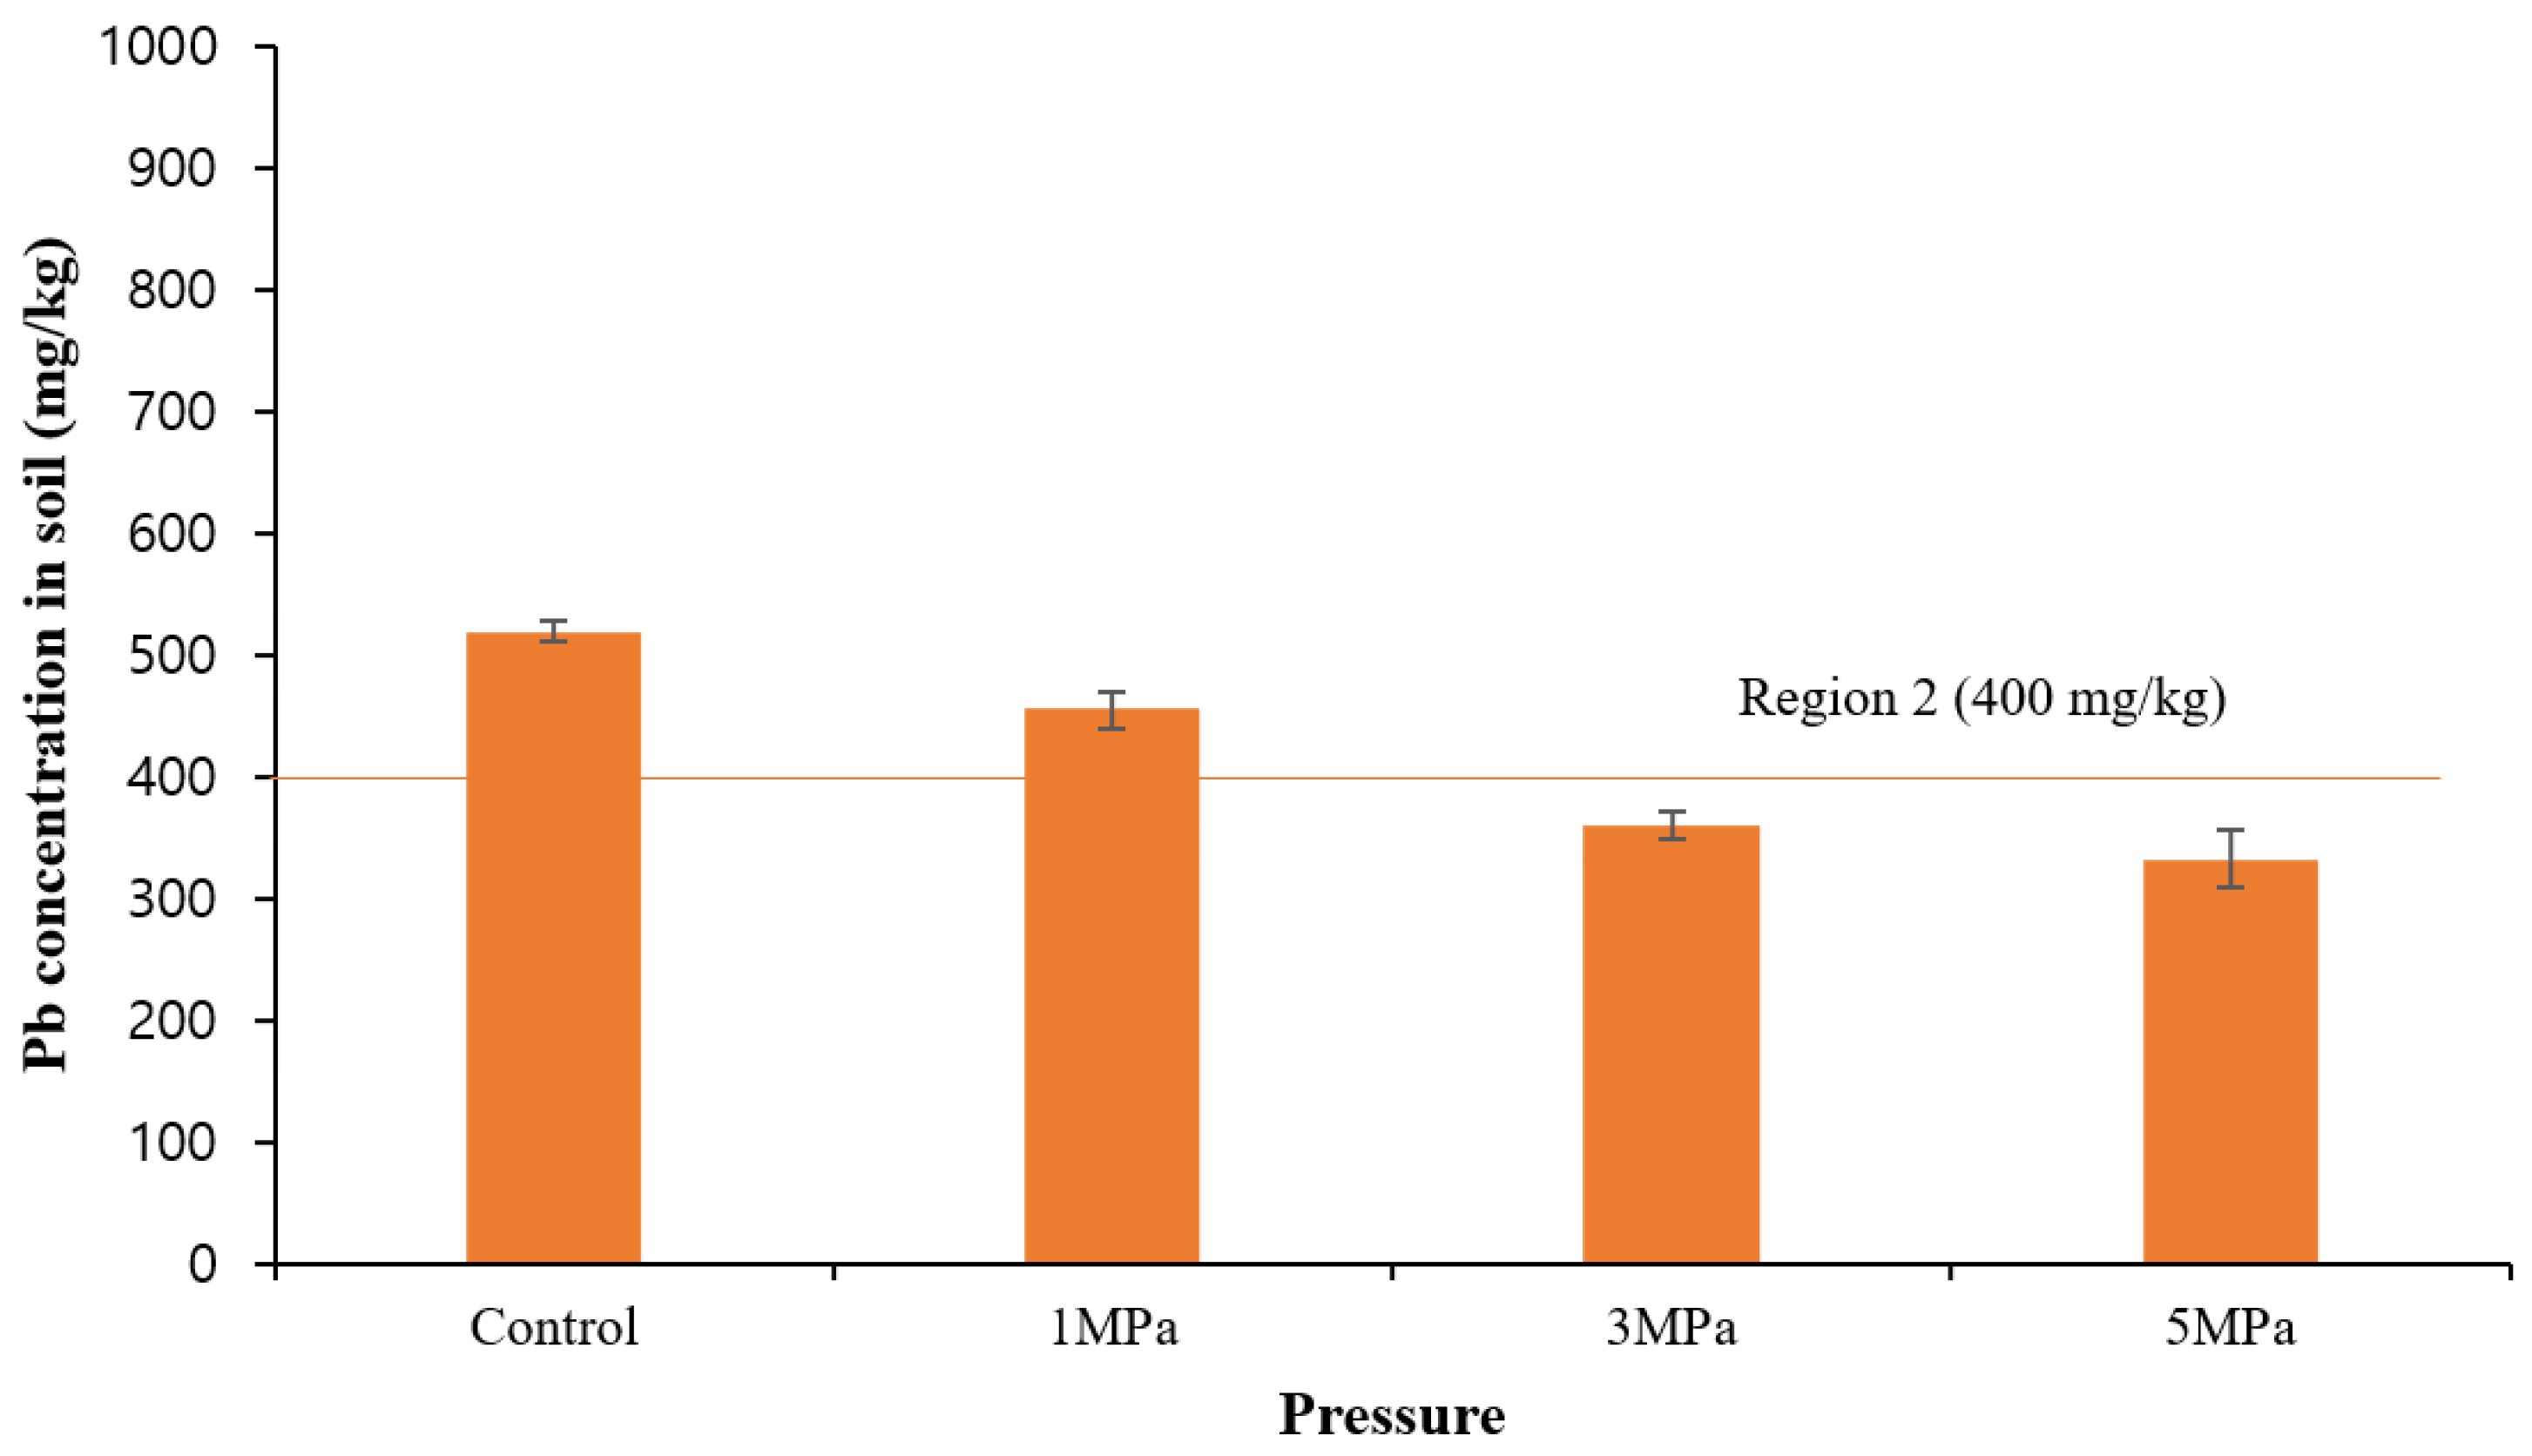
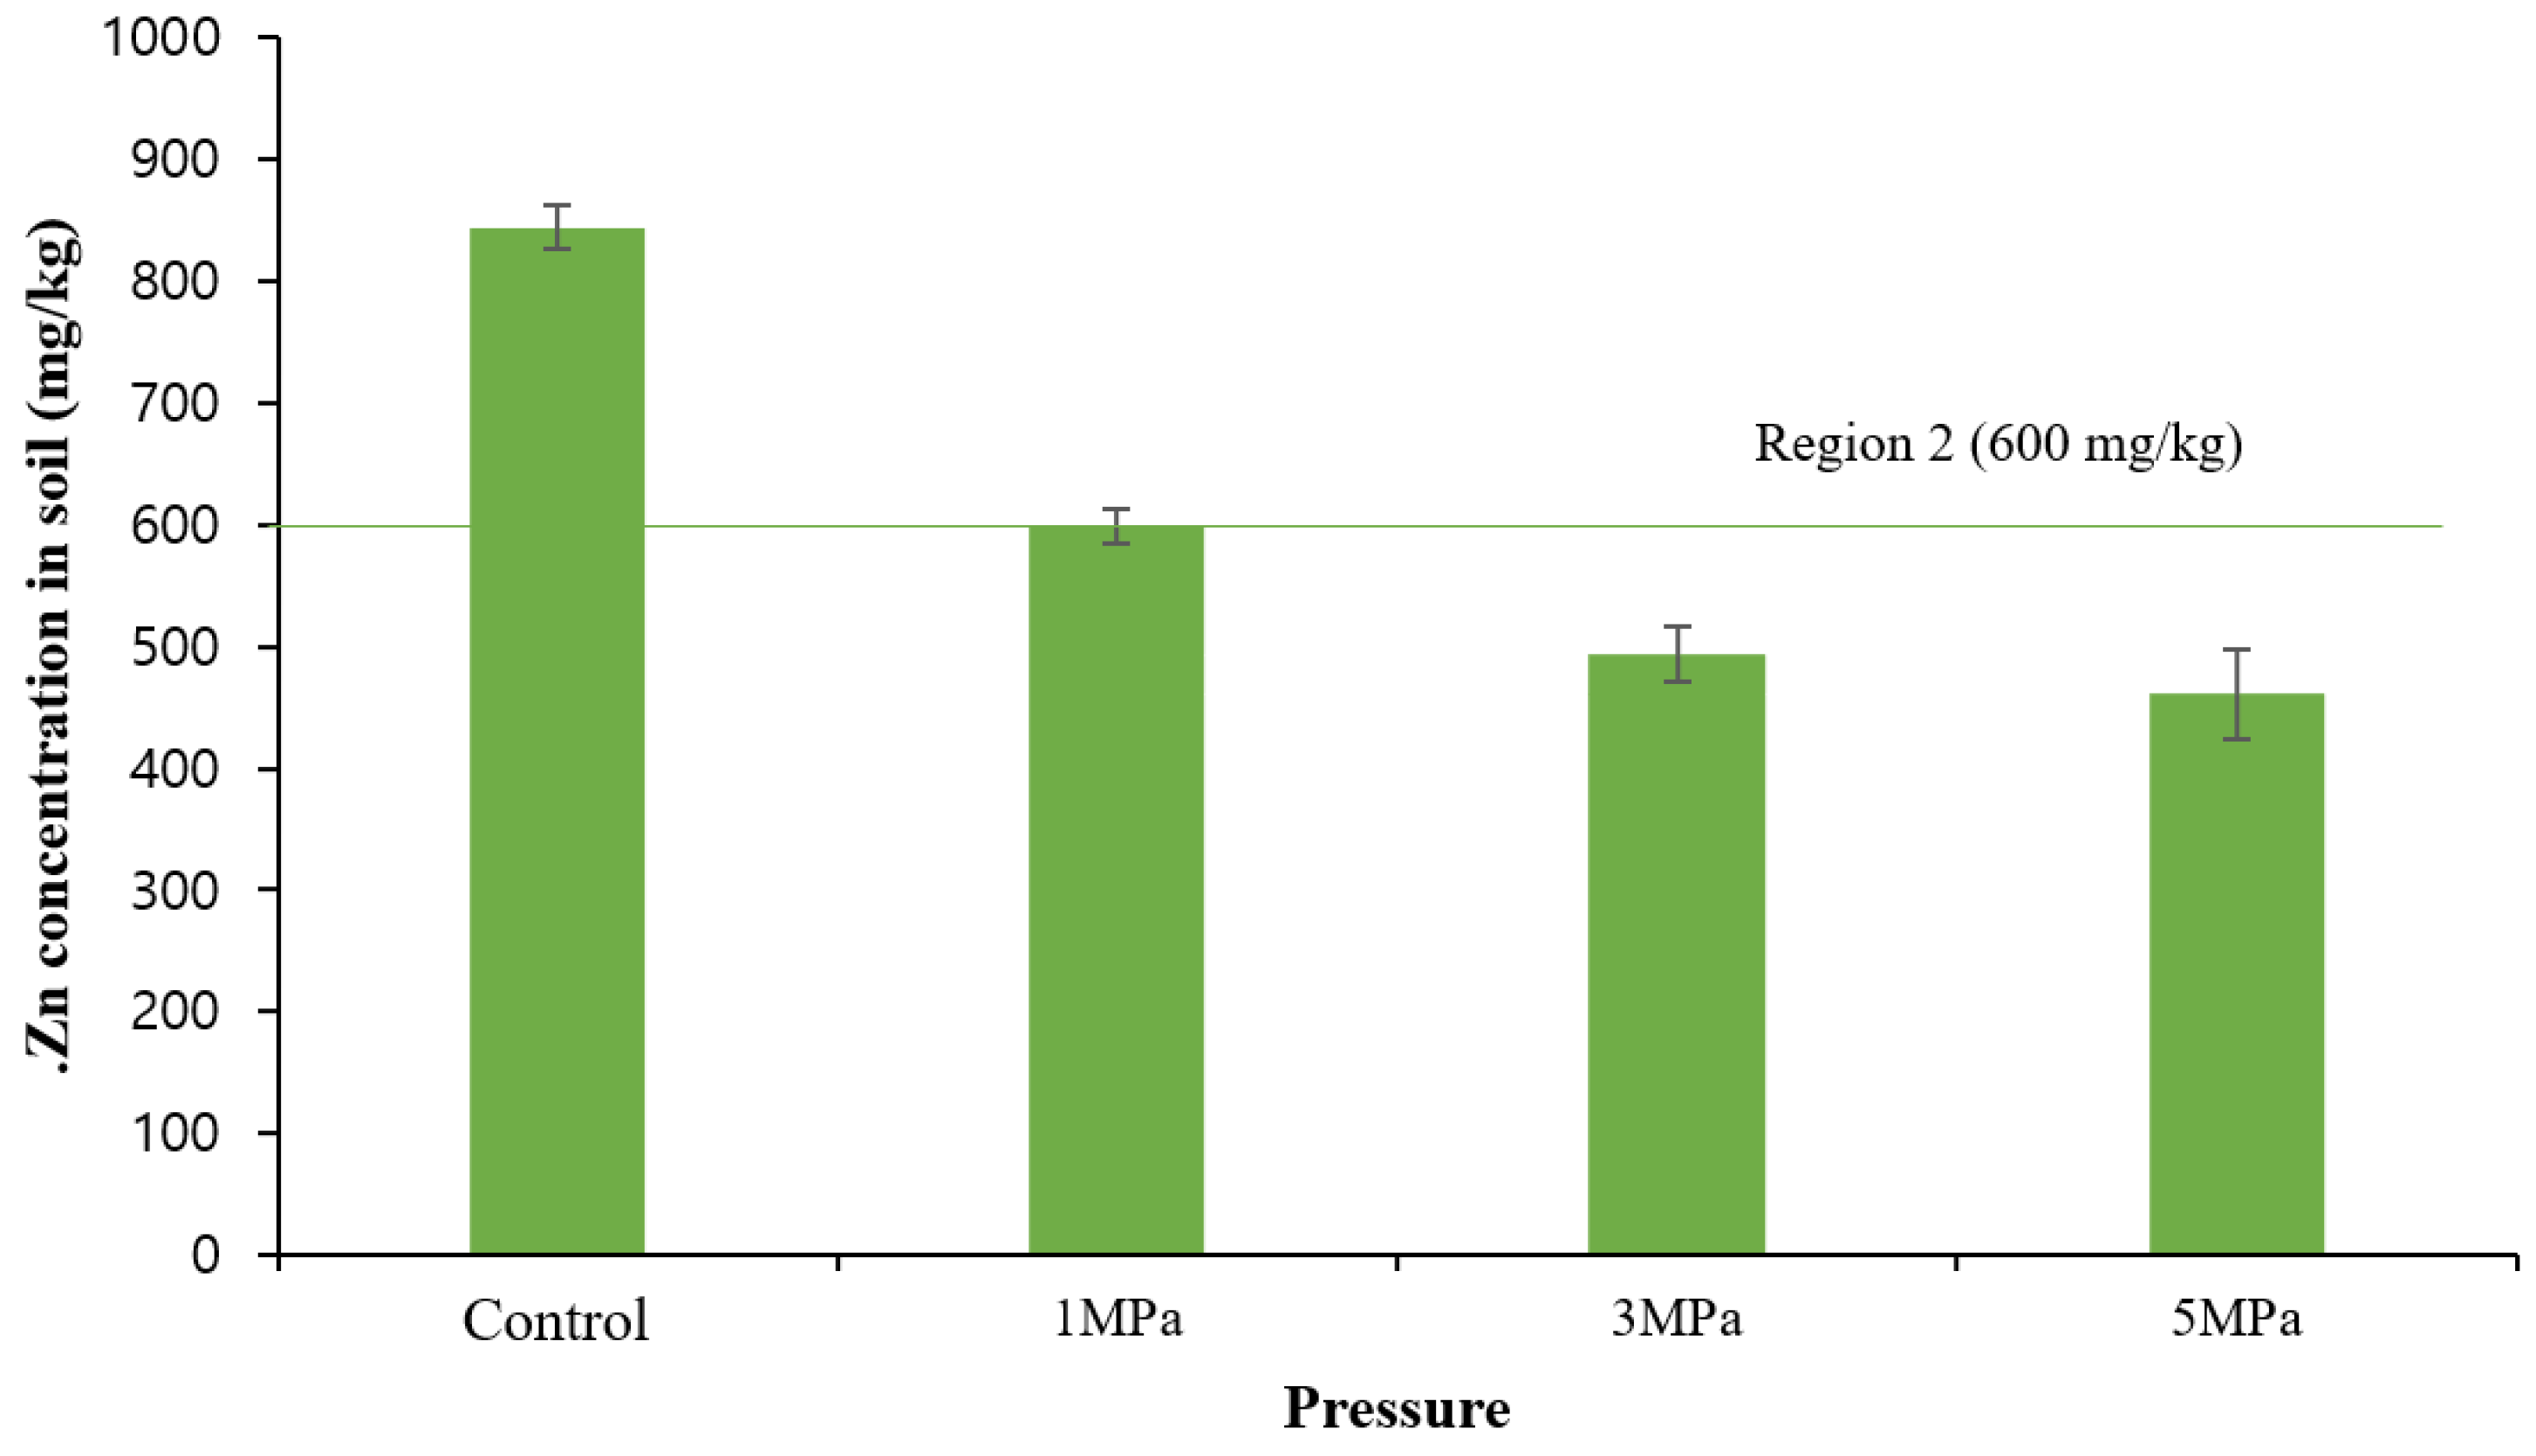
3.2. Optimal Washing Pressure
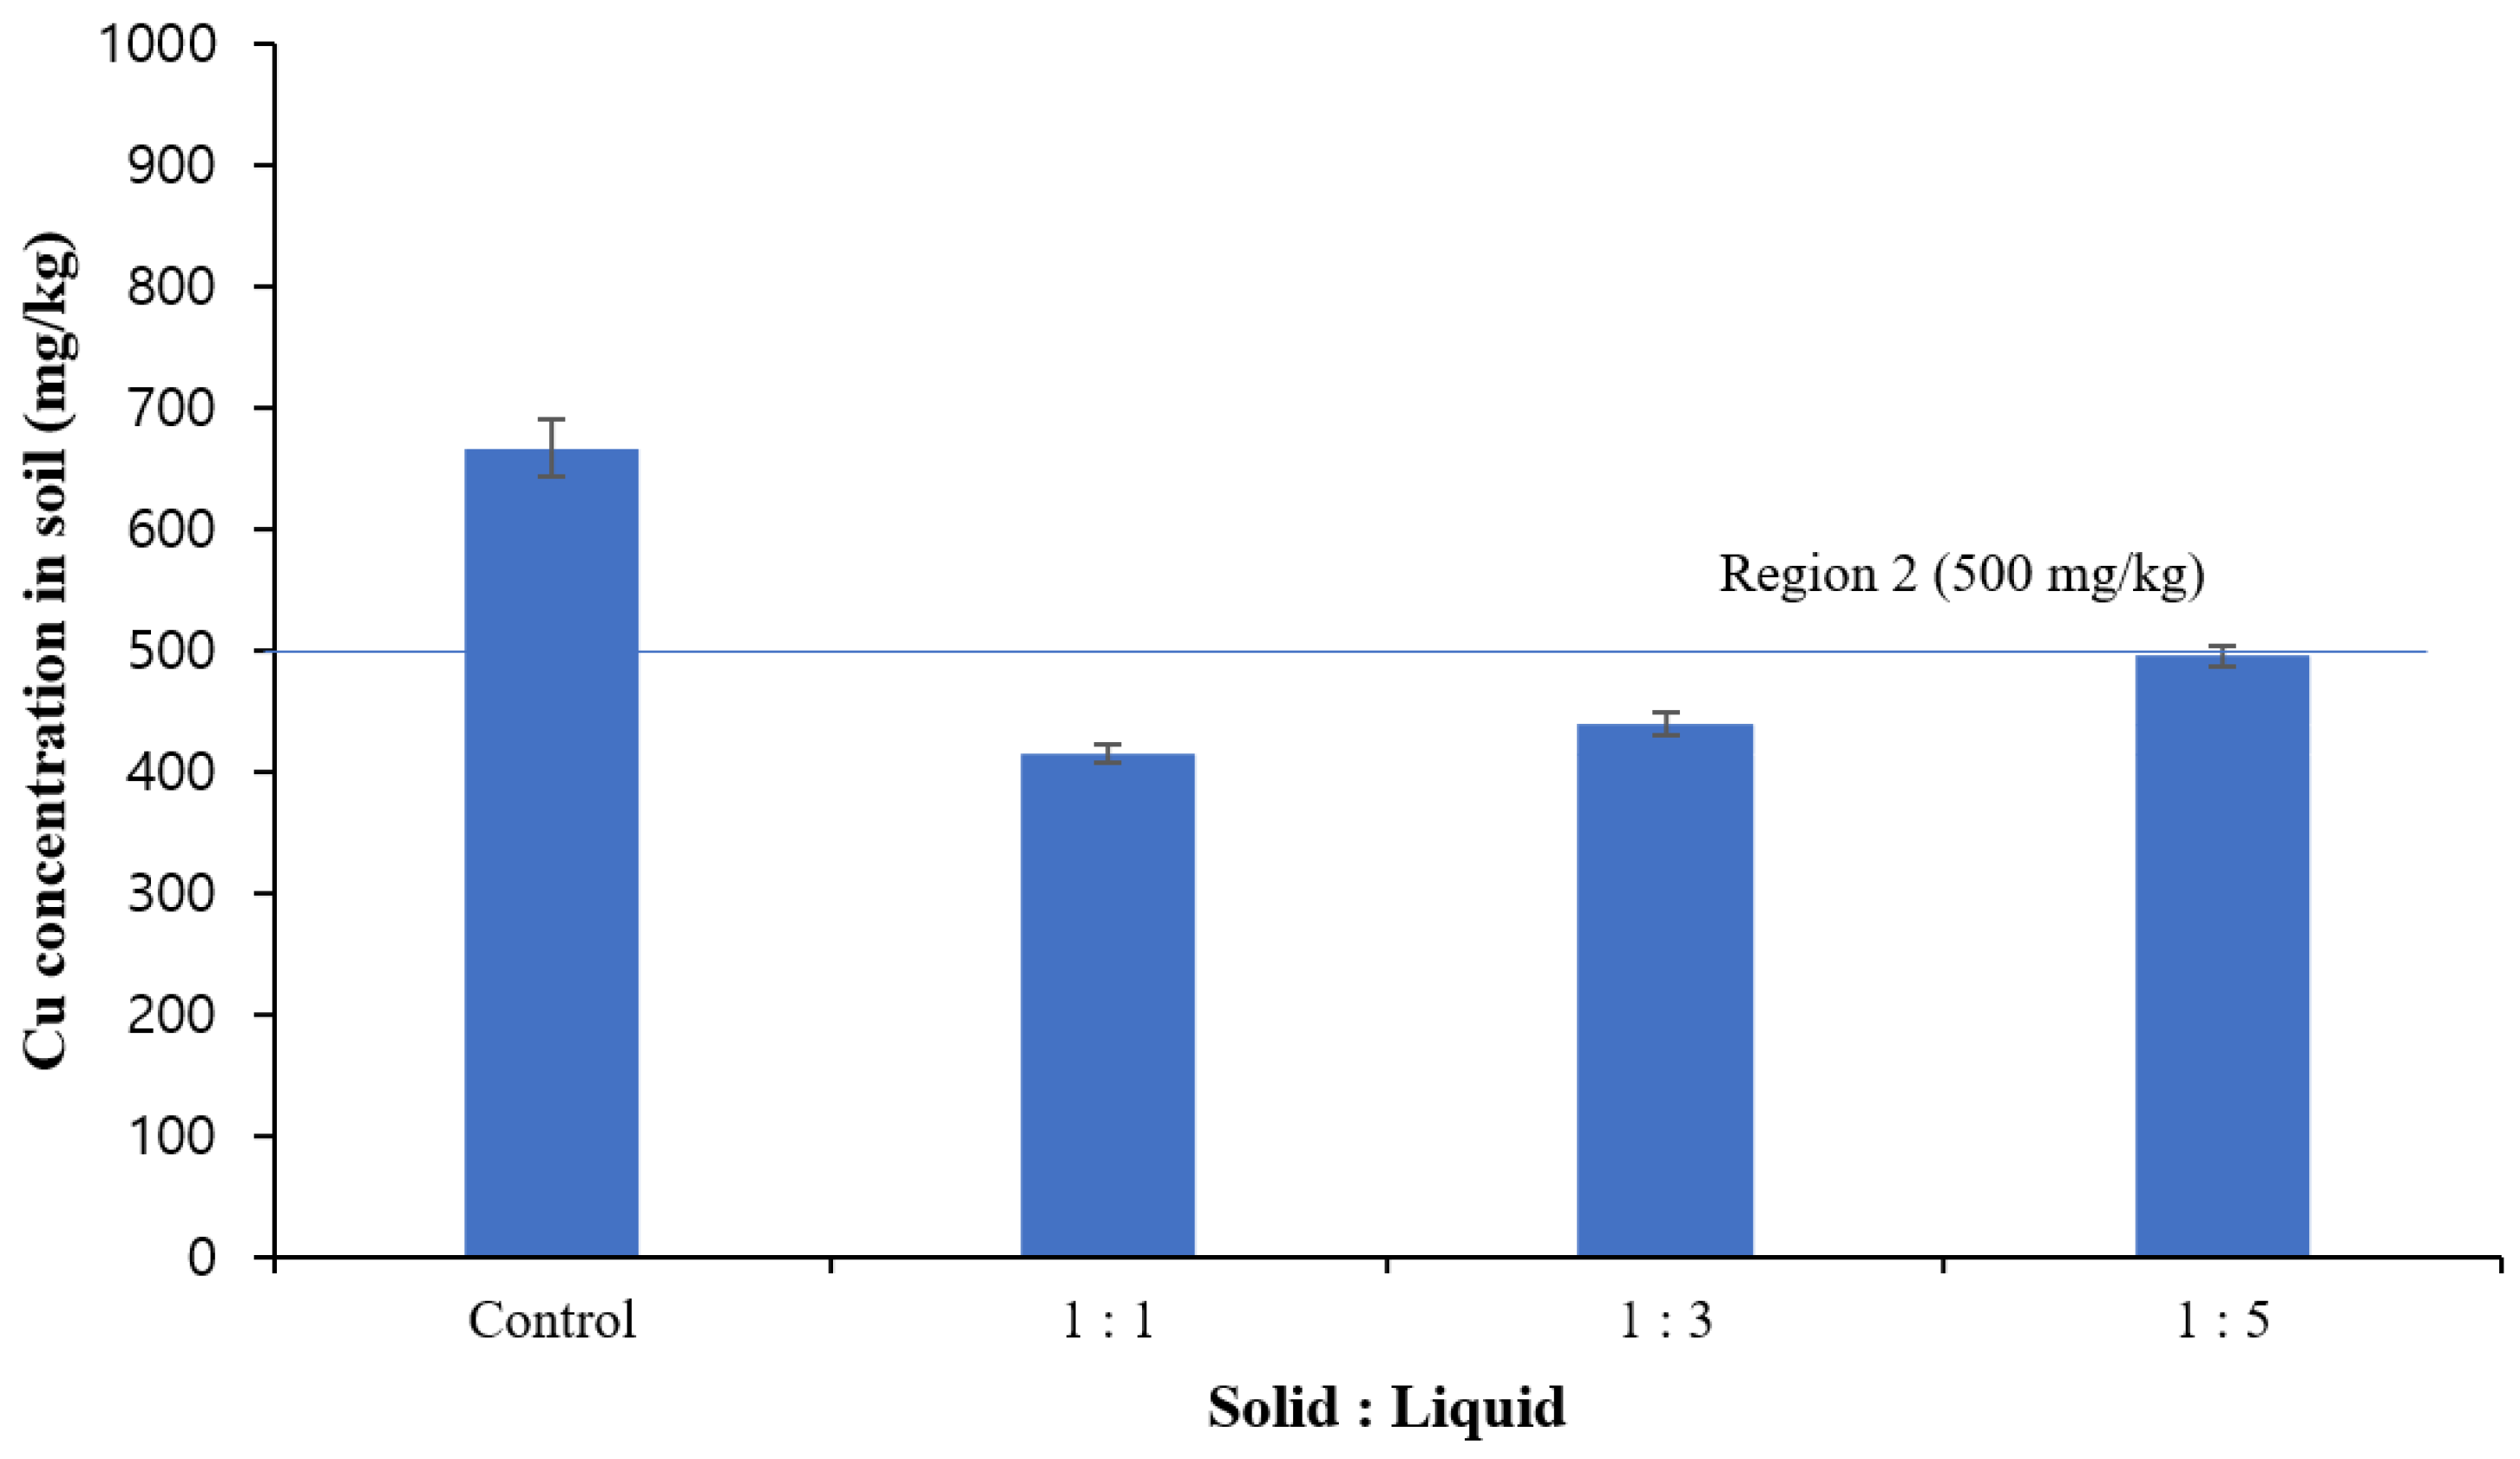
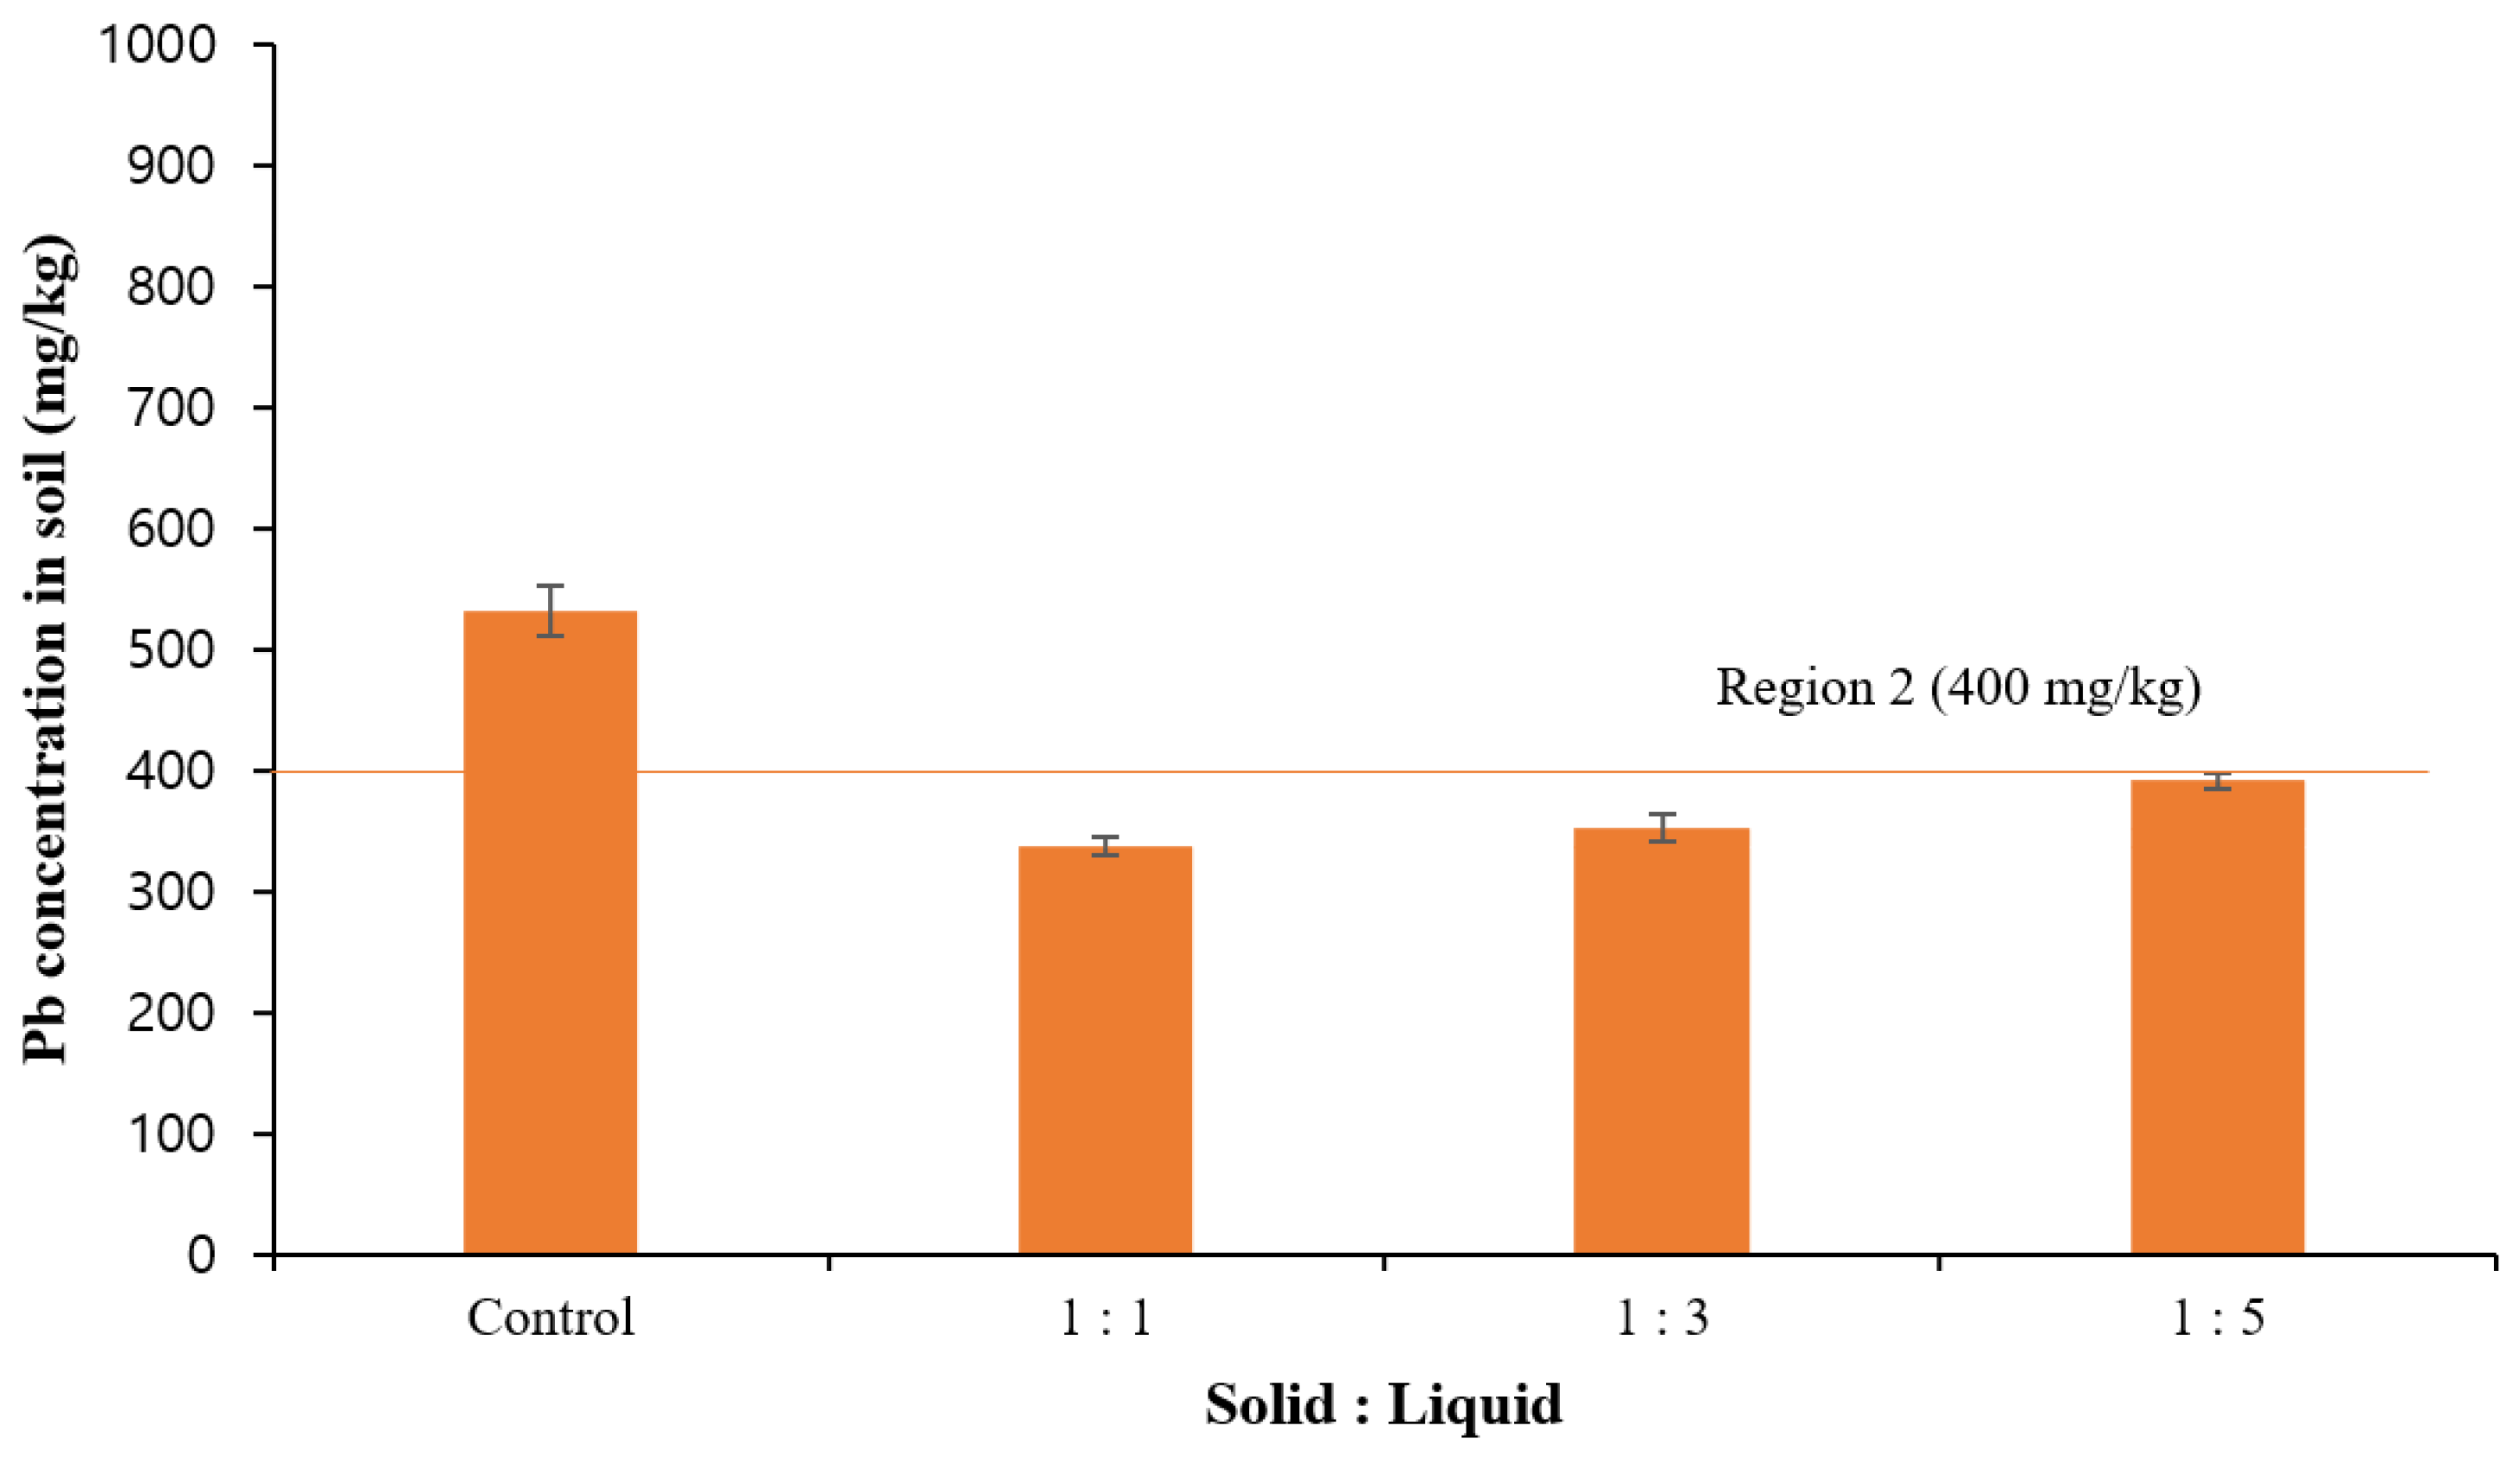
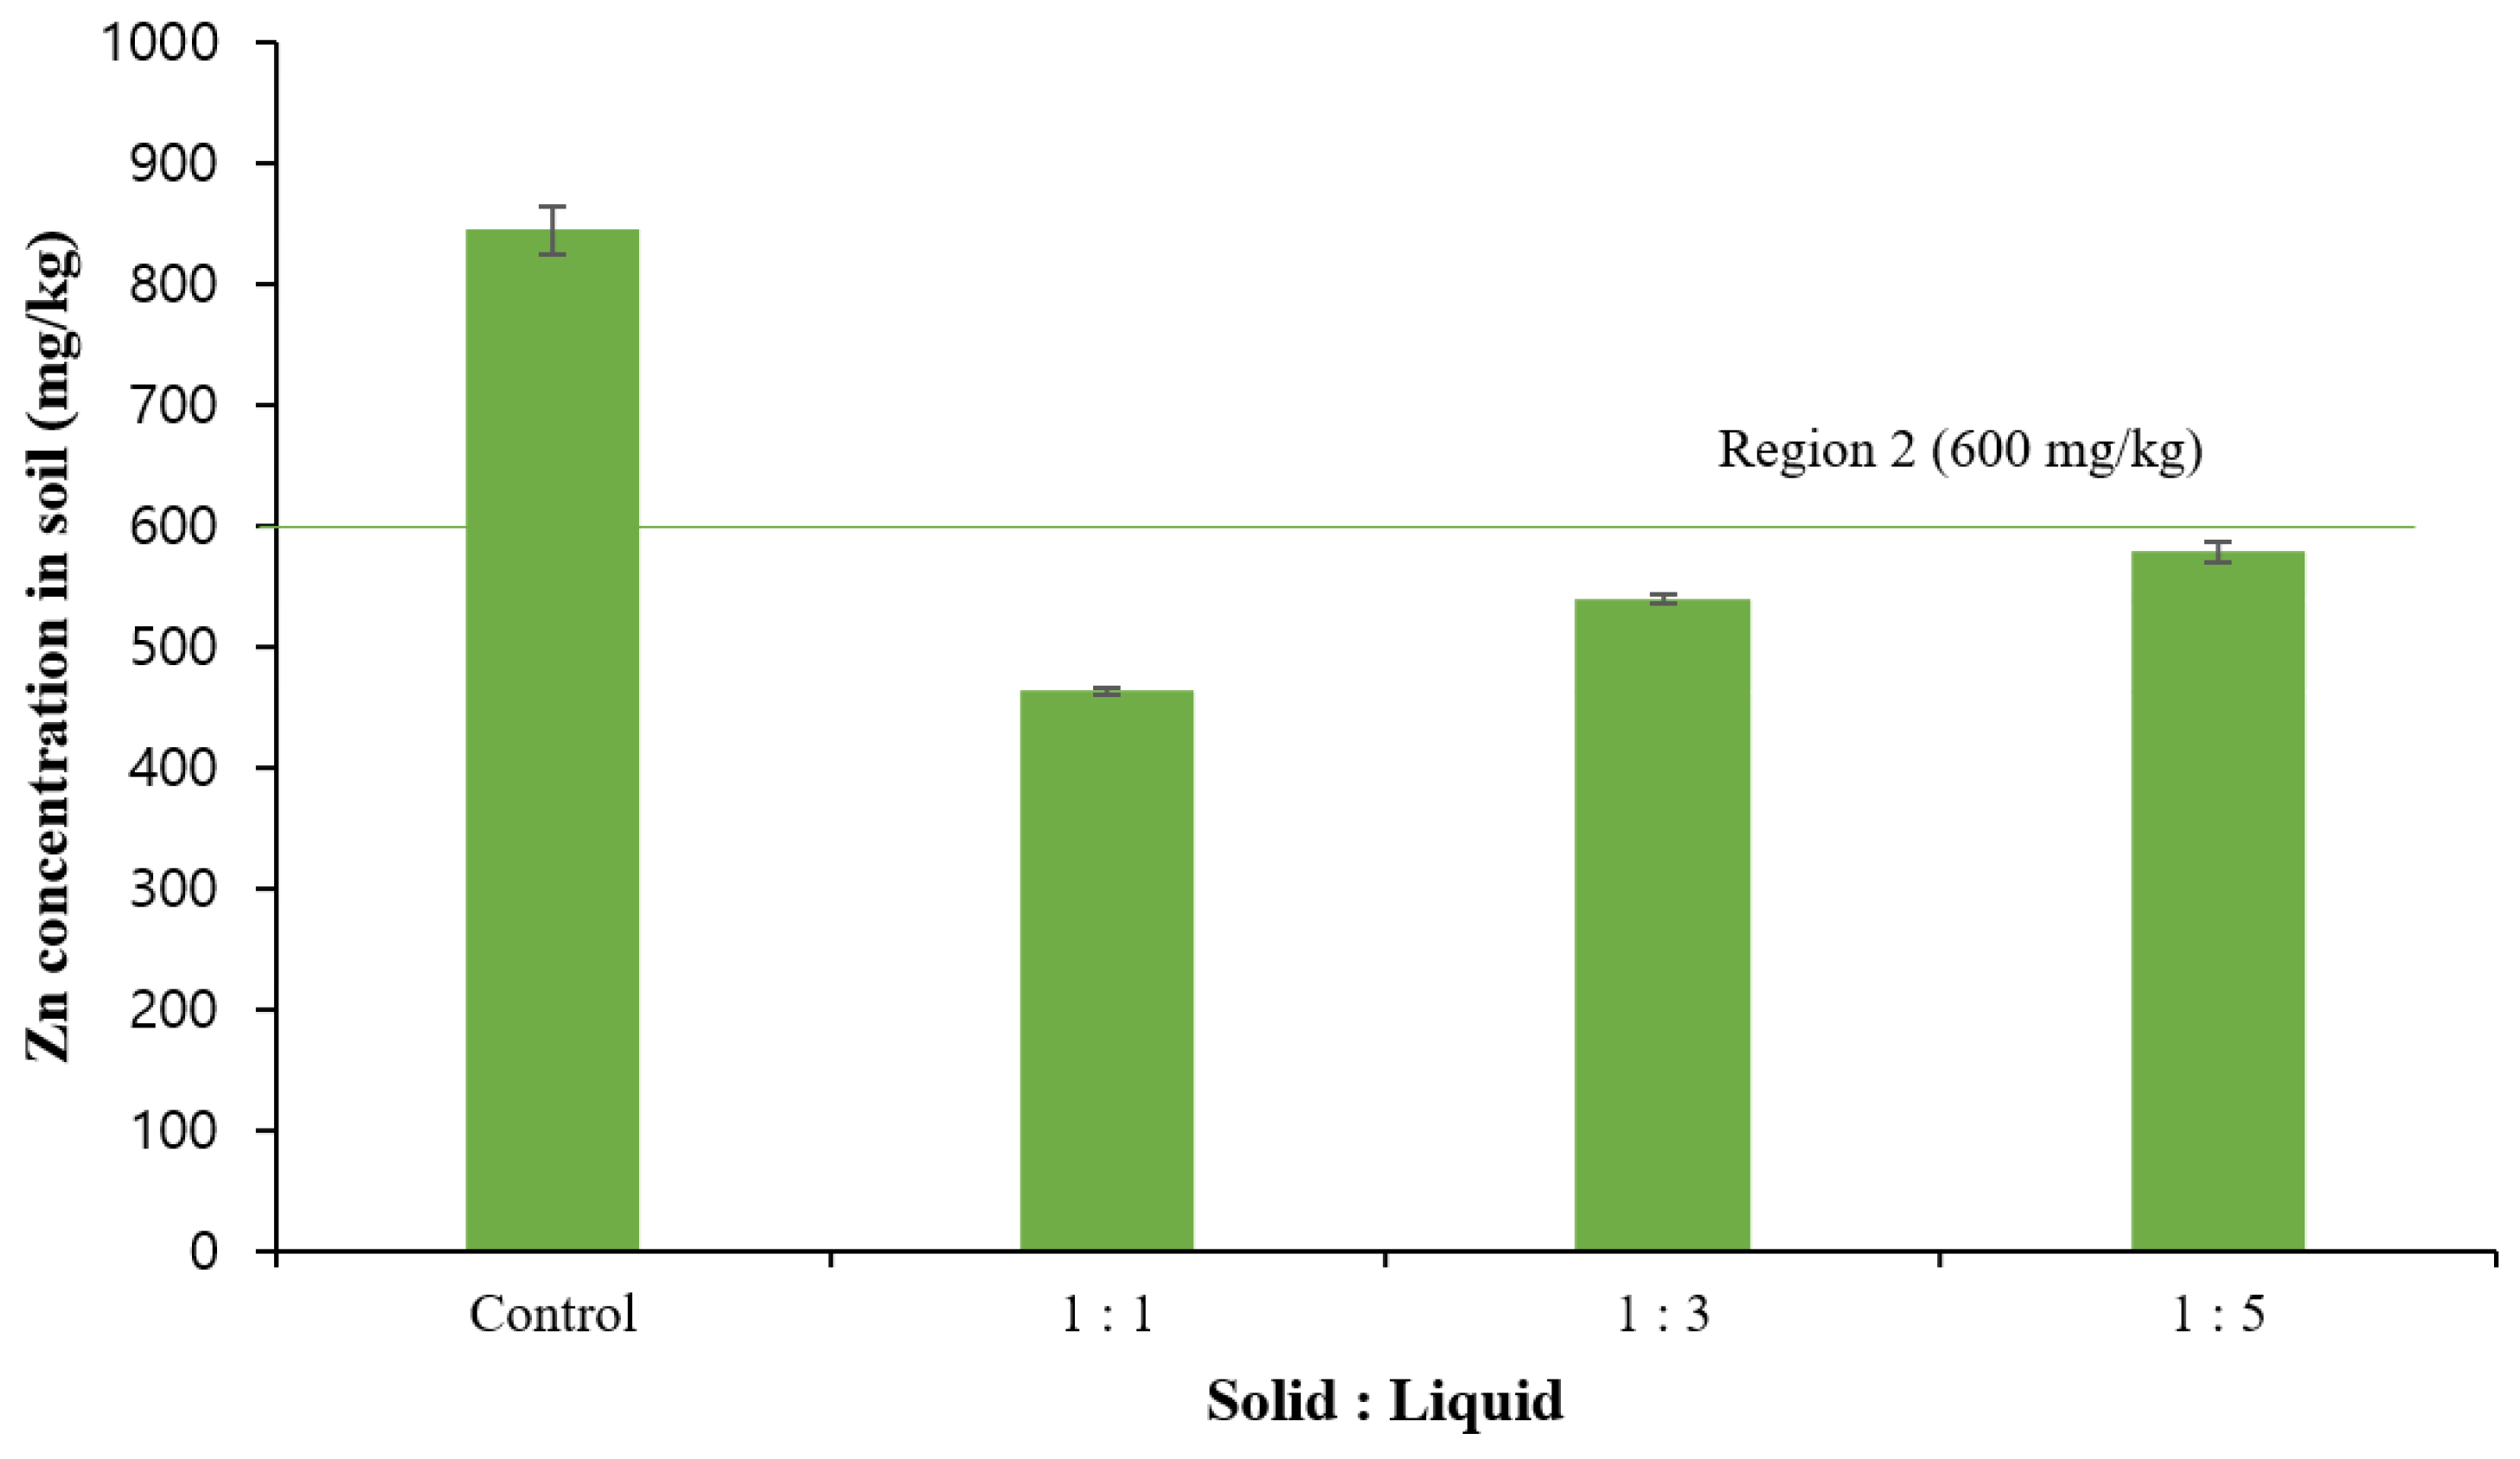
3.3. Optimal Solid-to-Liquid Ratio
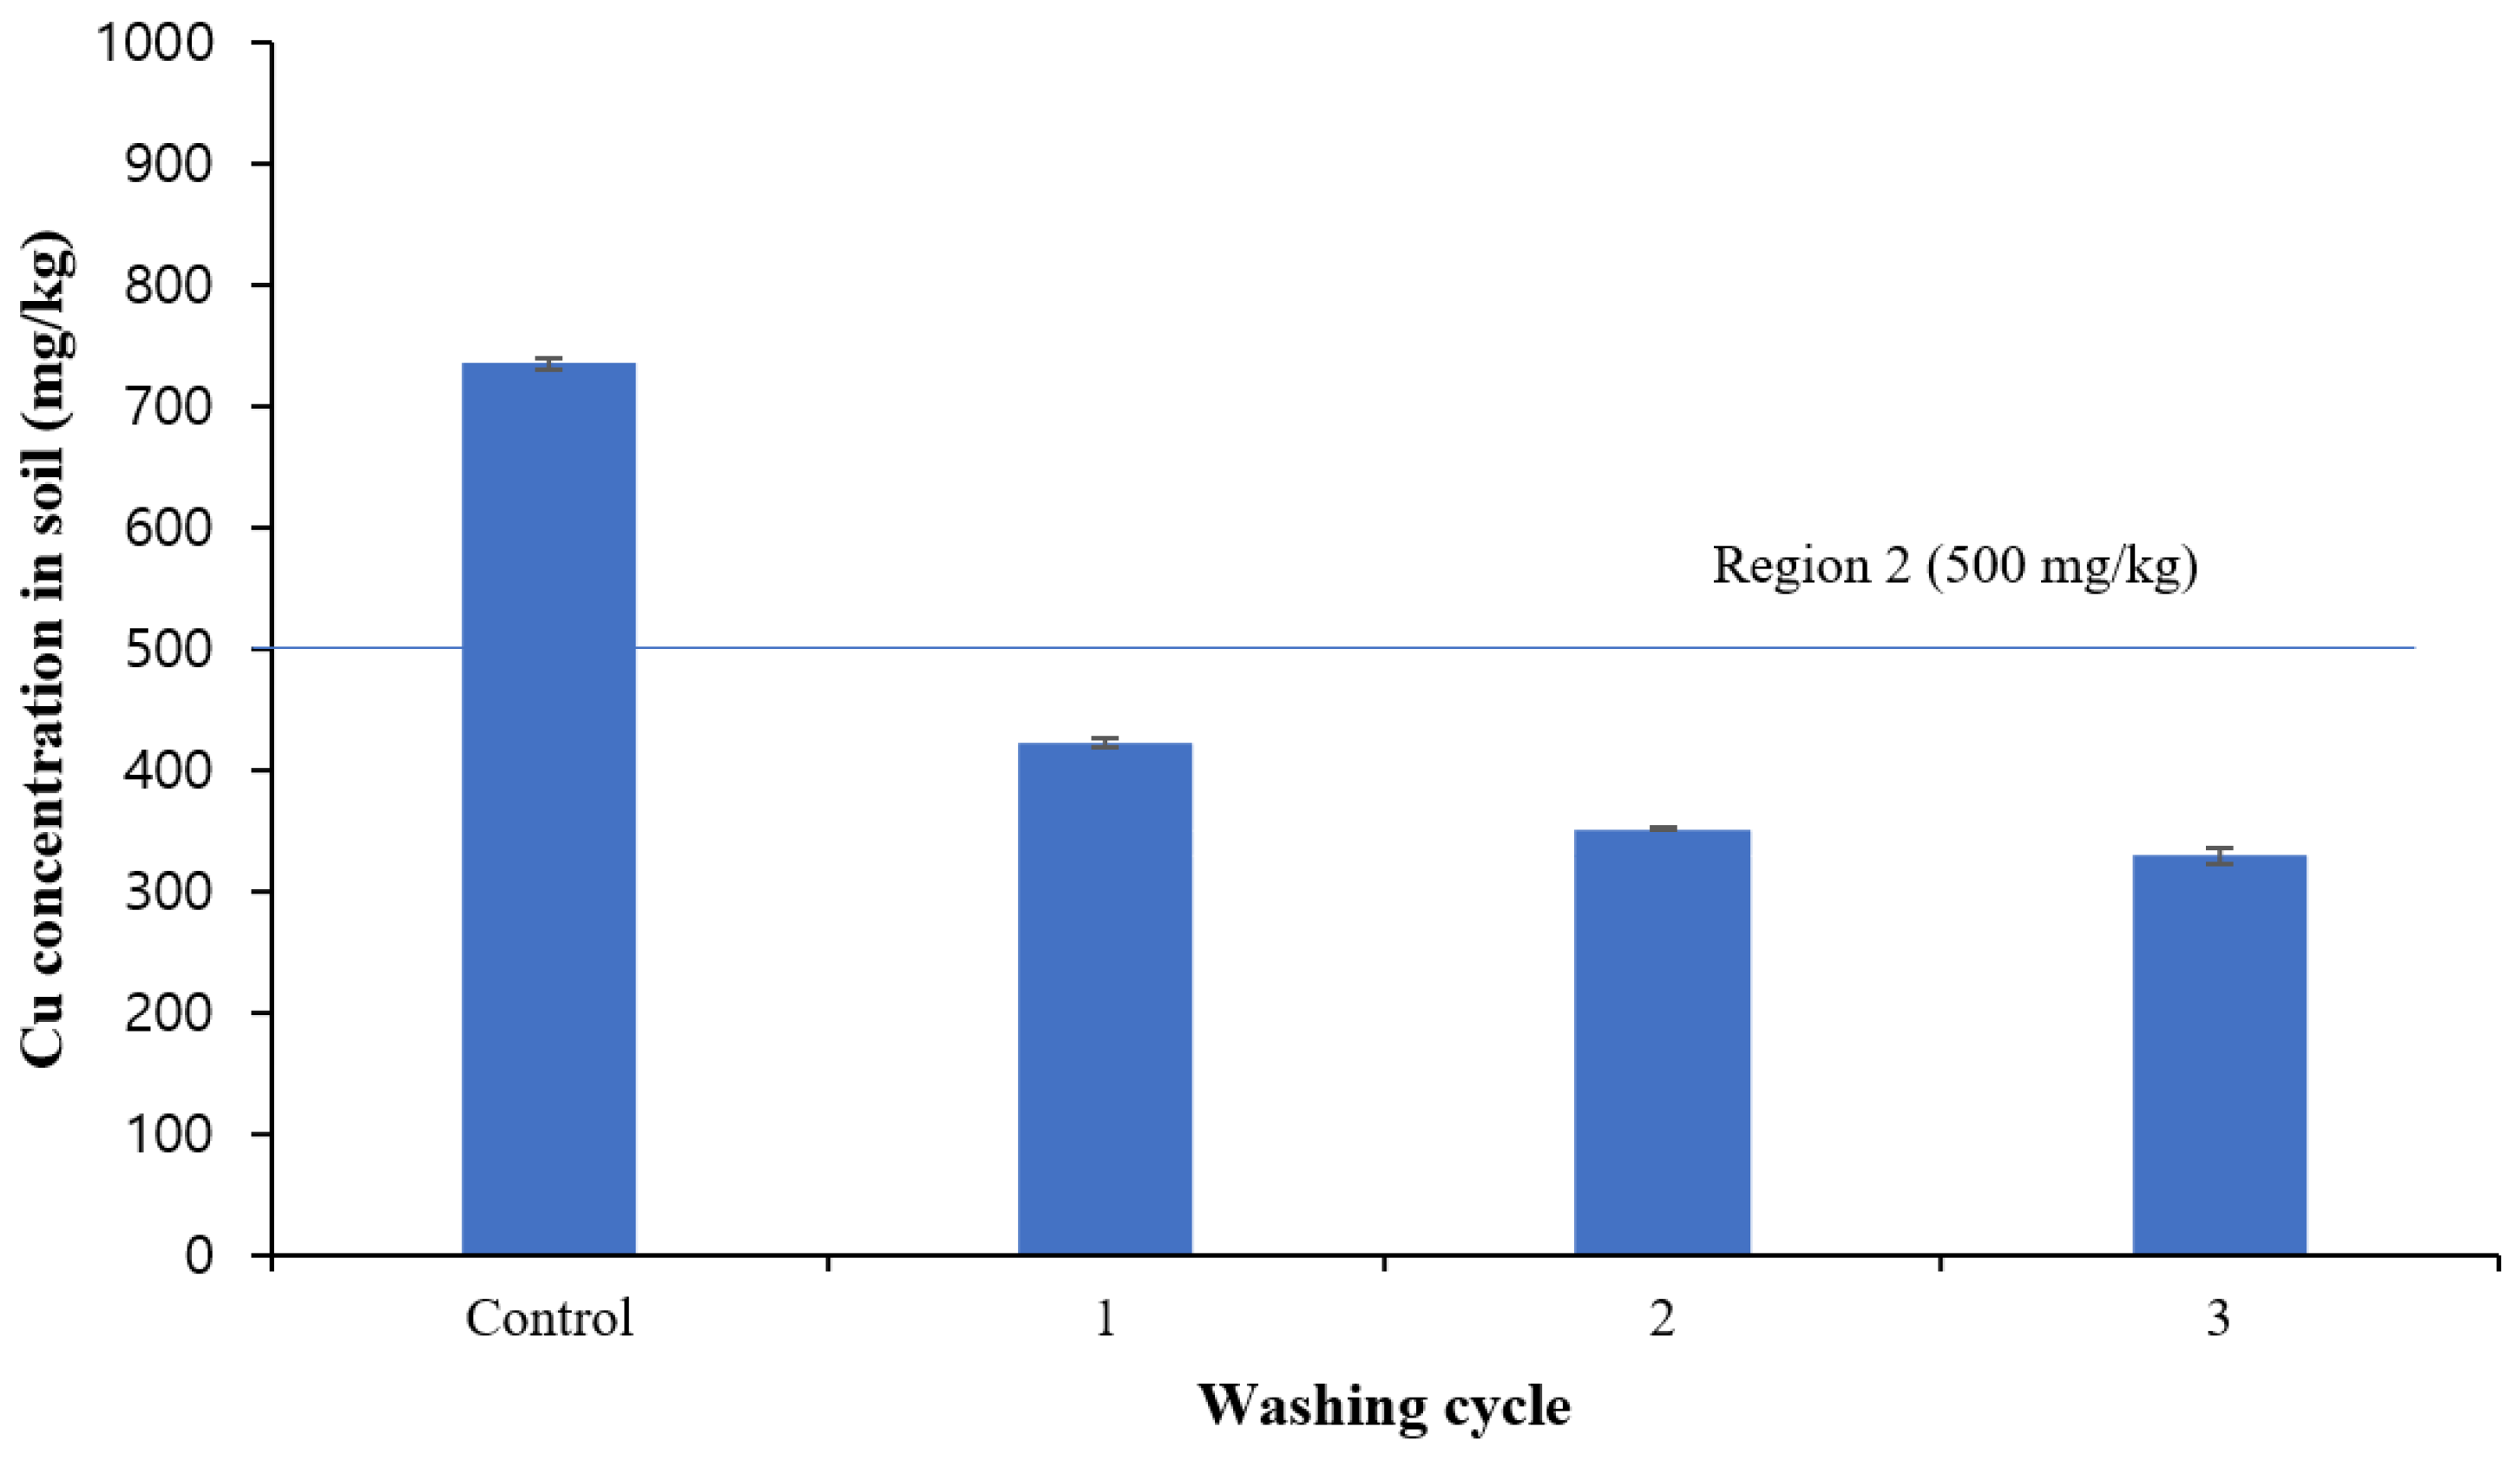
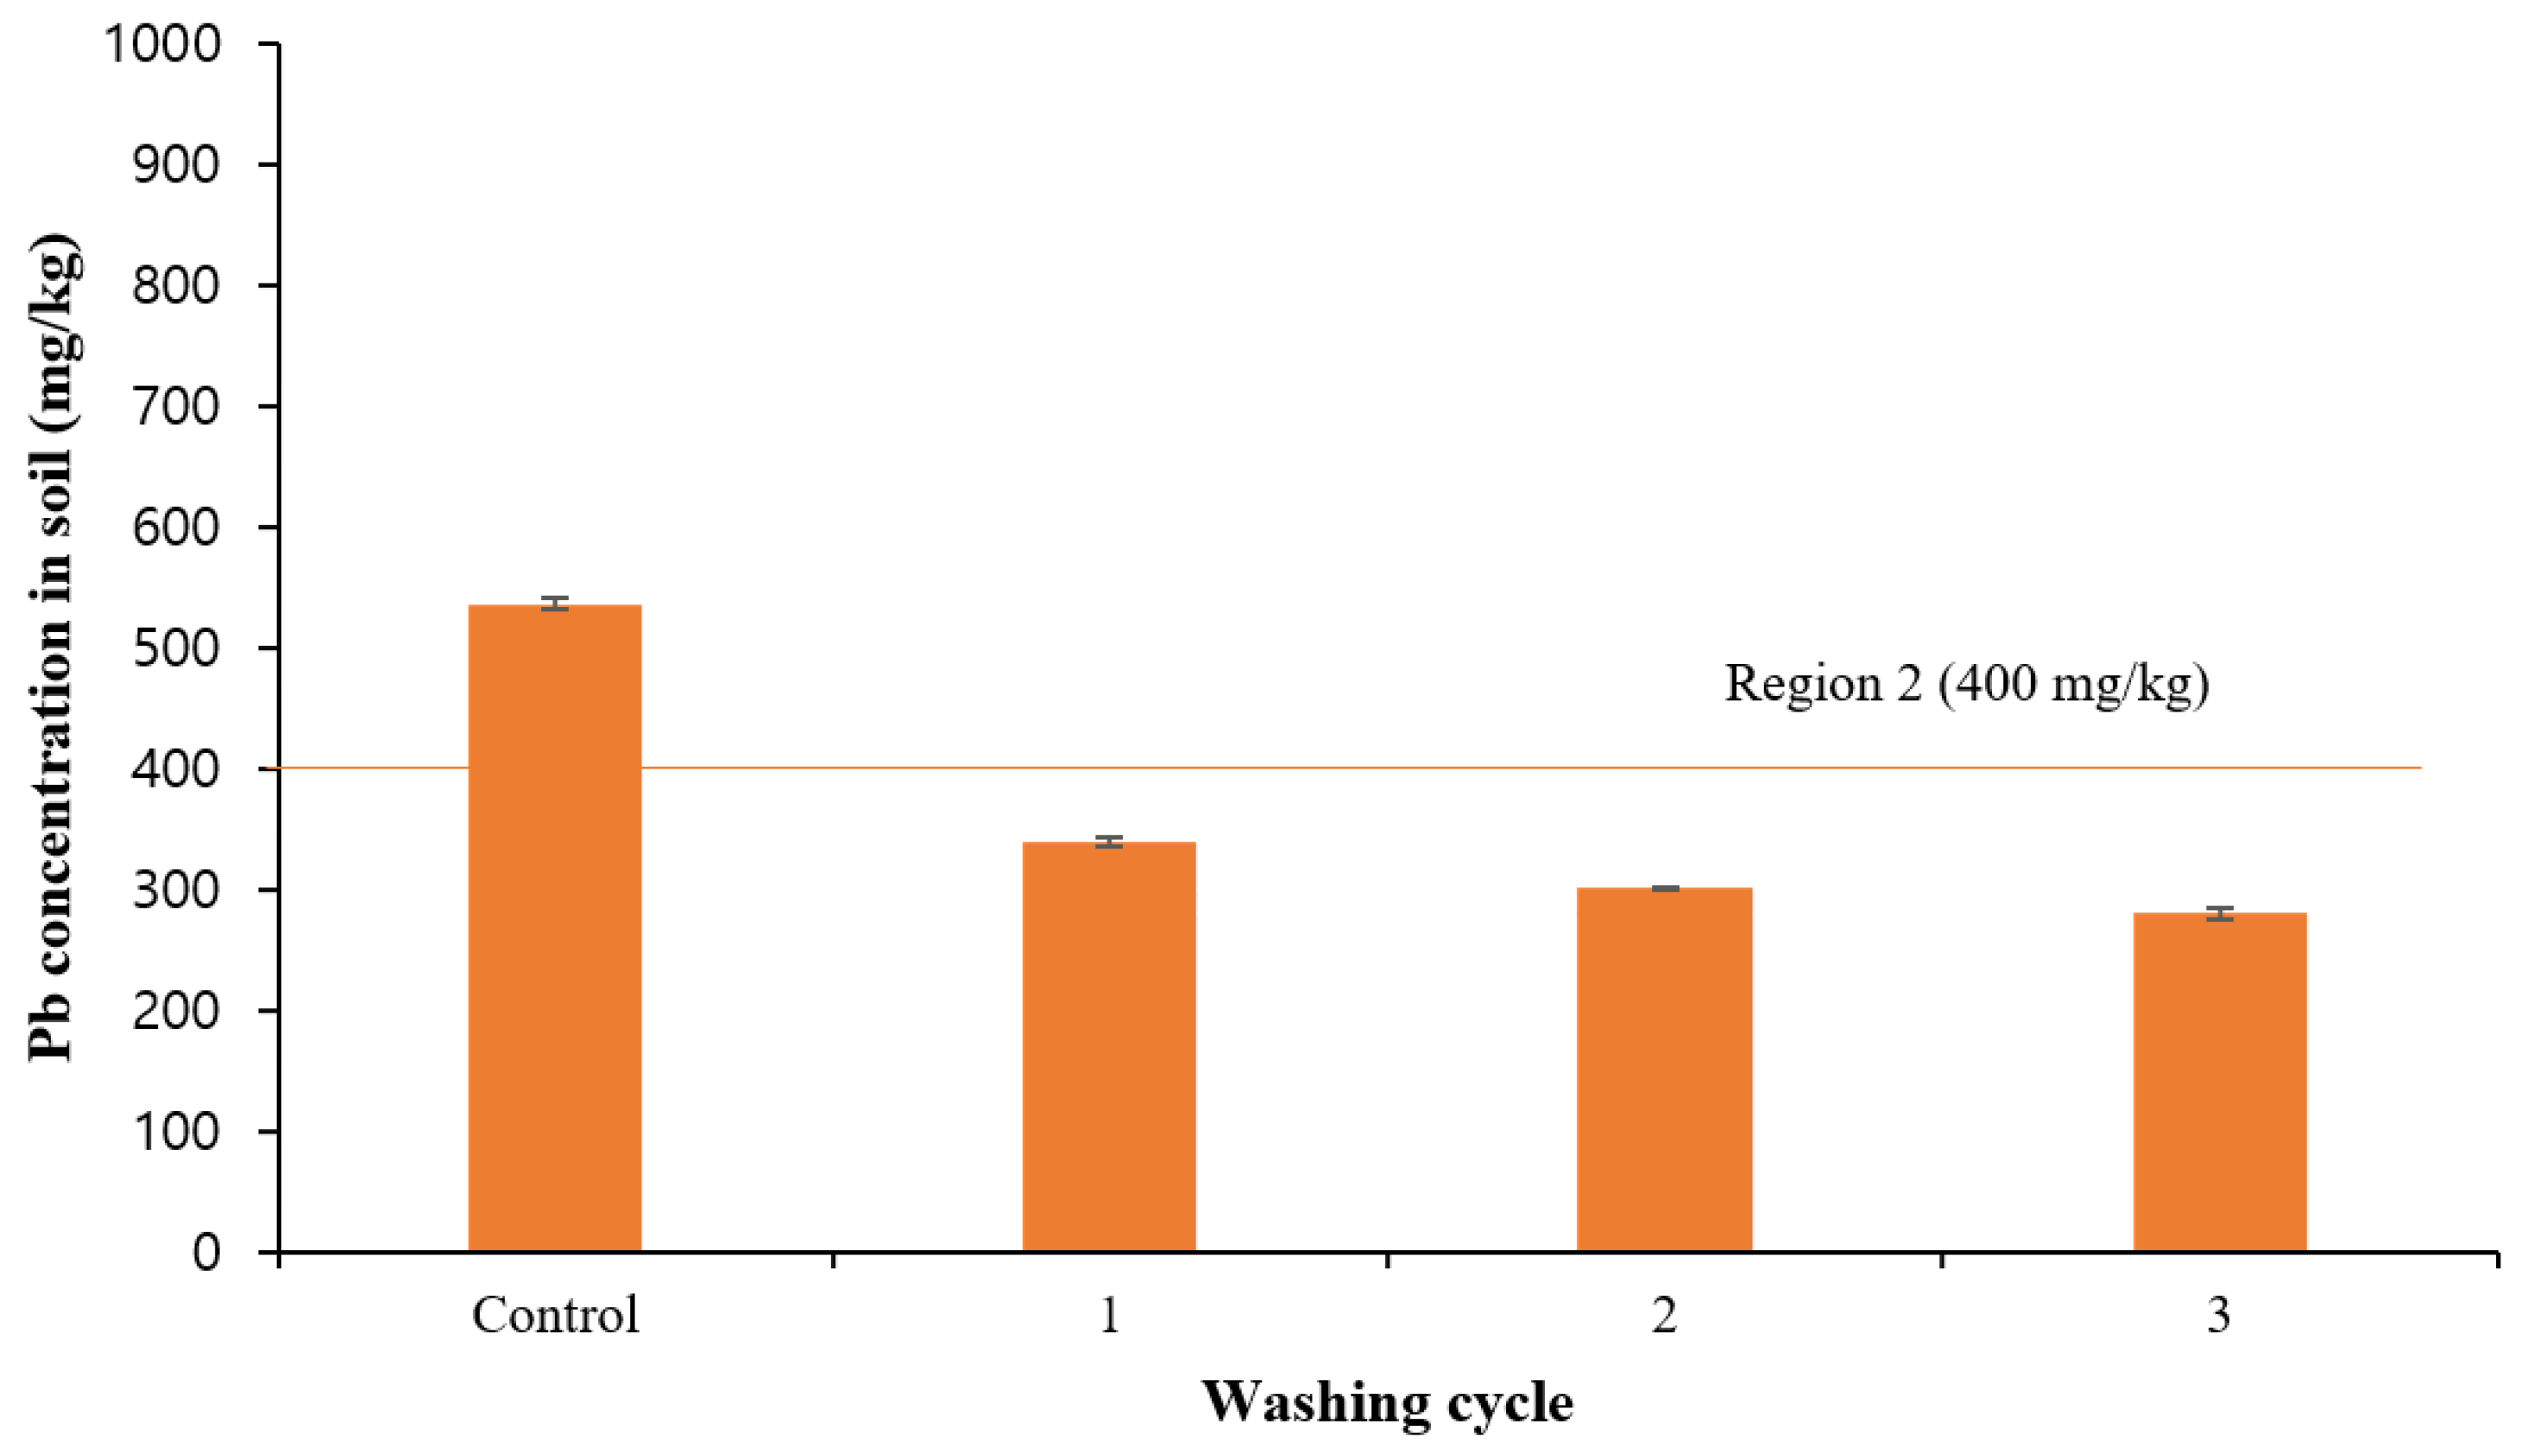
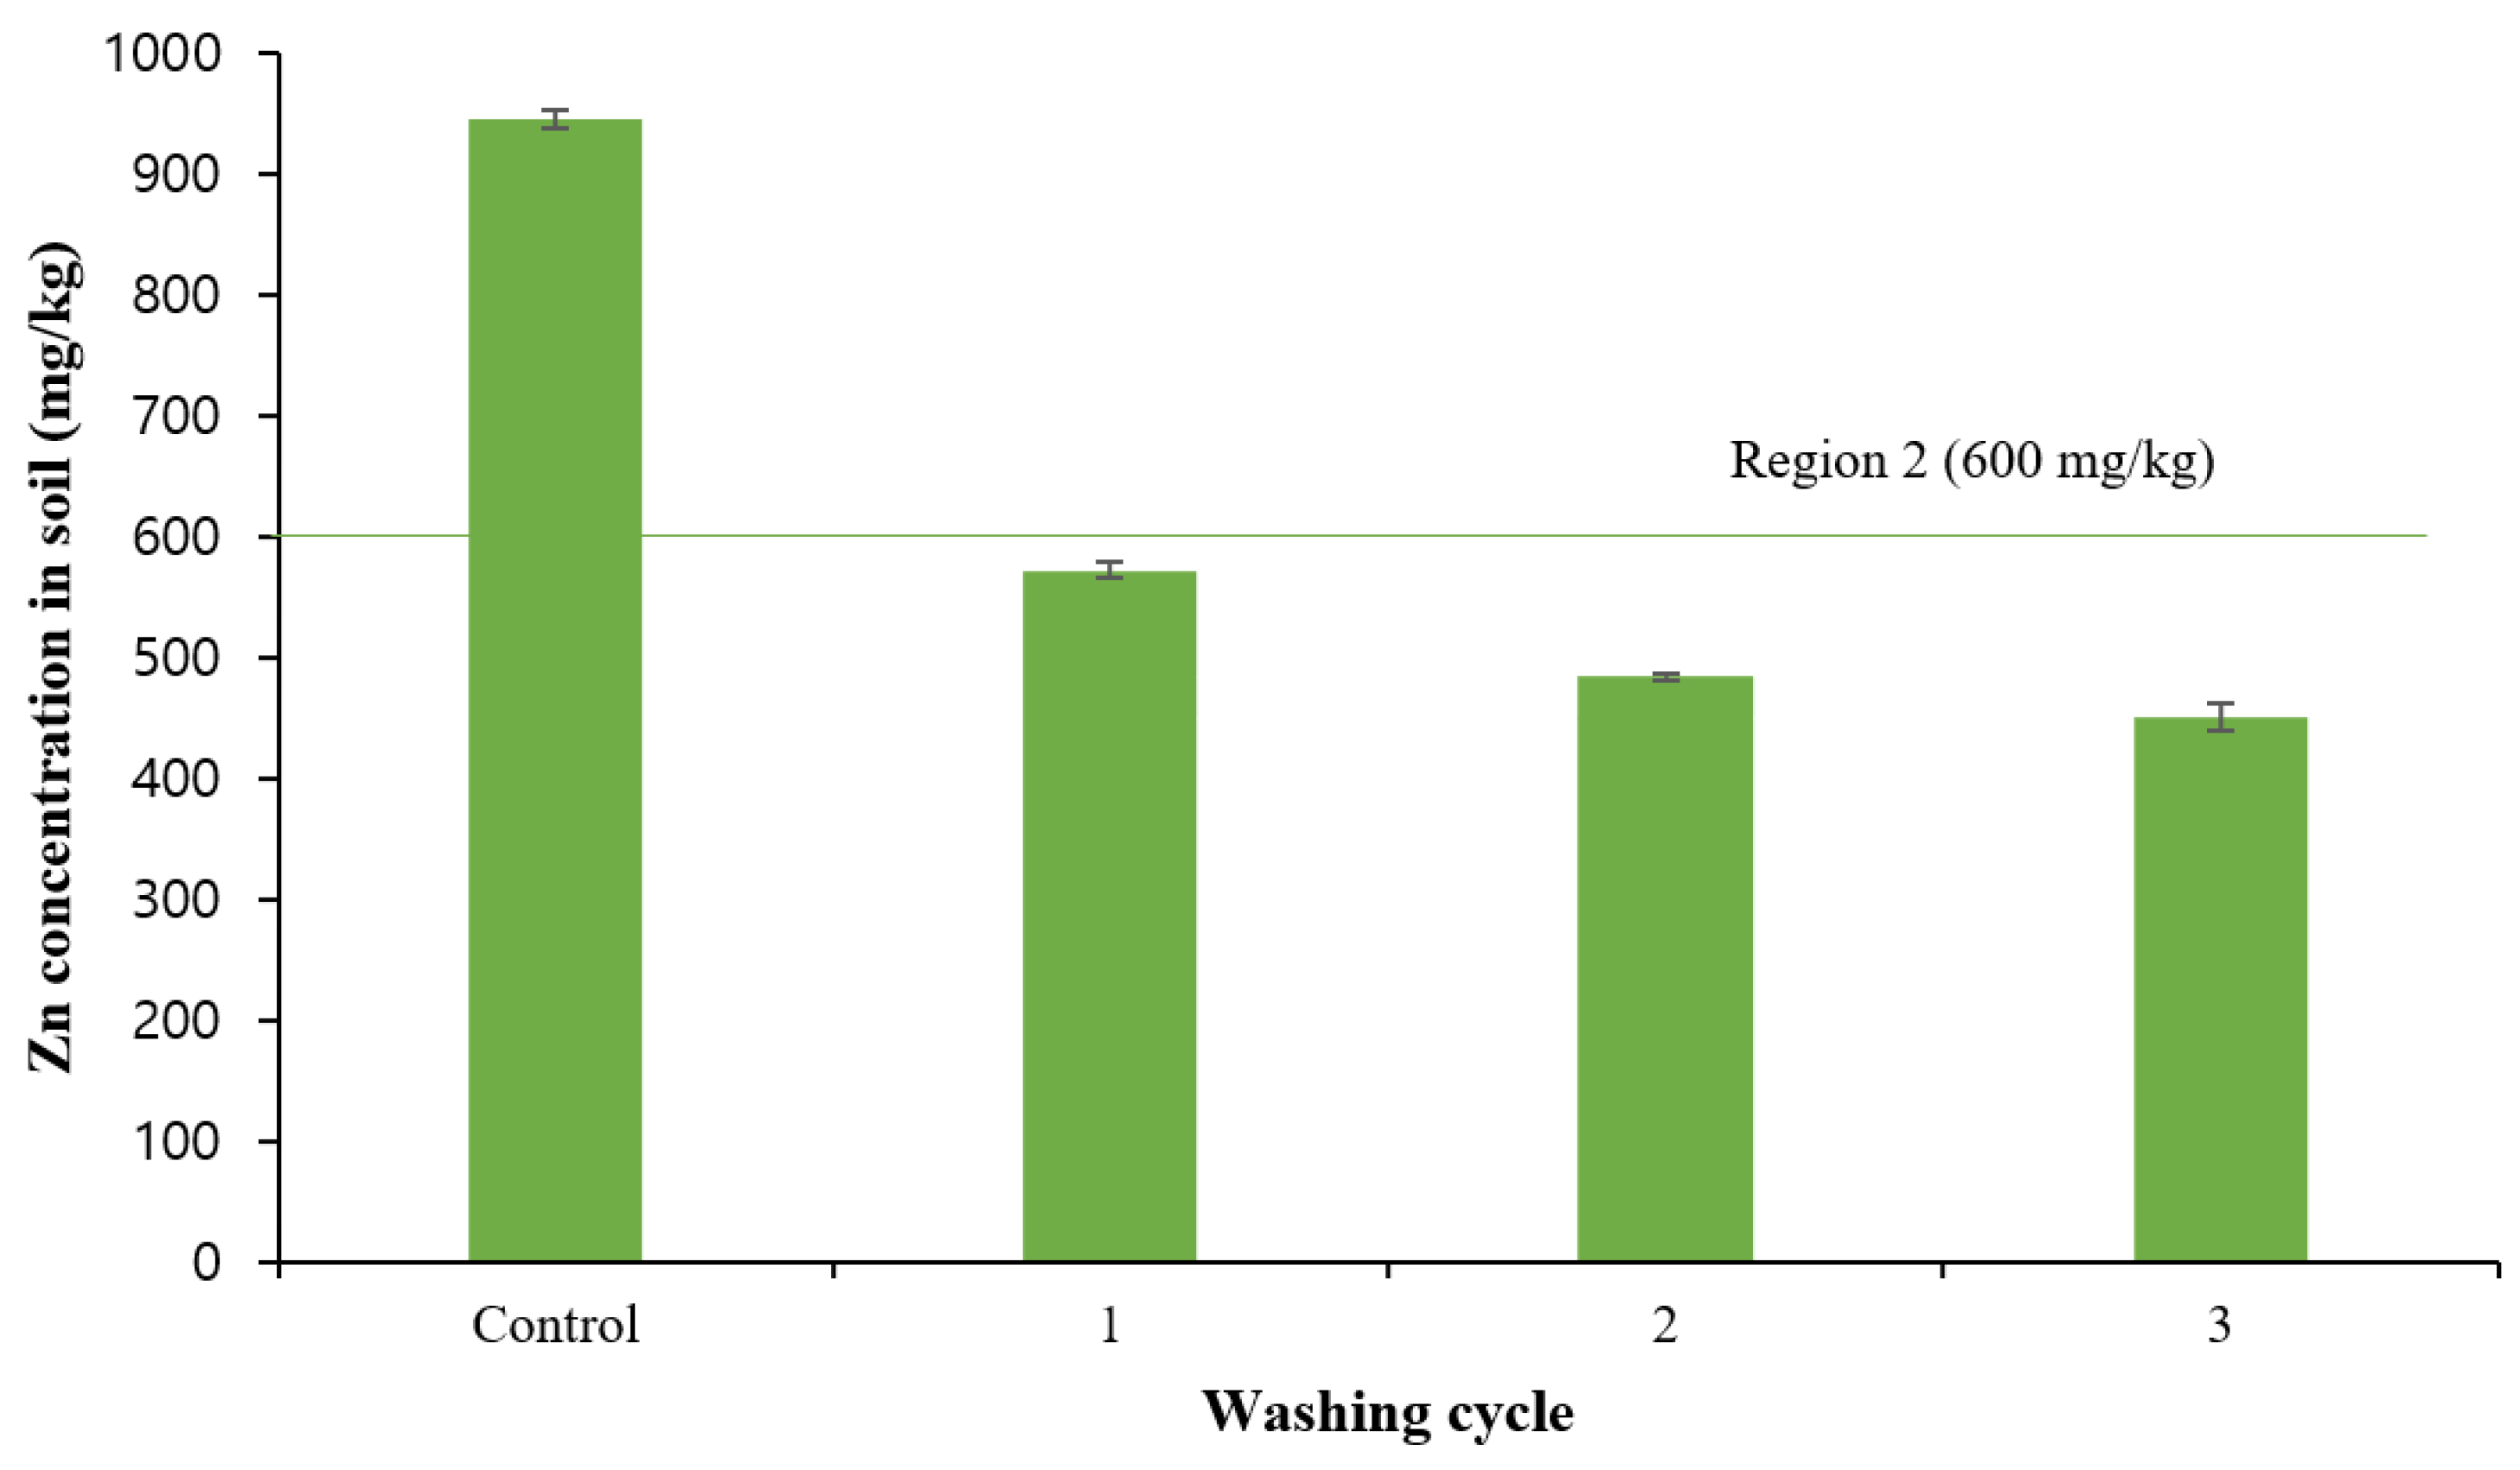
3.4. Optimal Number of High-Pressure Washing Cycles
3.5. Change in Particle Size Fraction during High-Pressure Washing and Separation
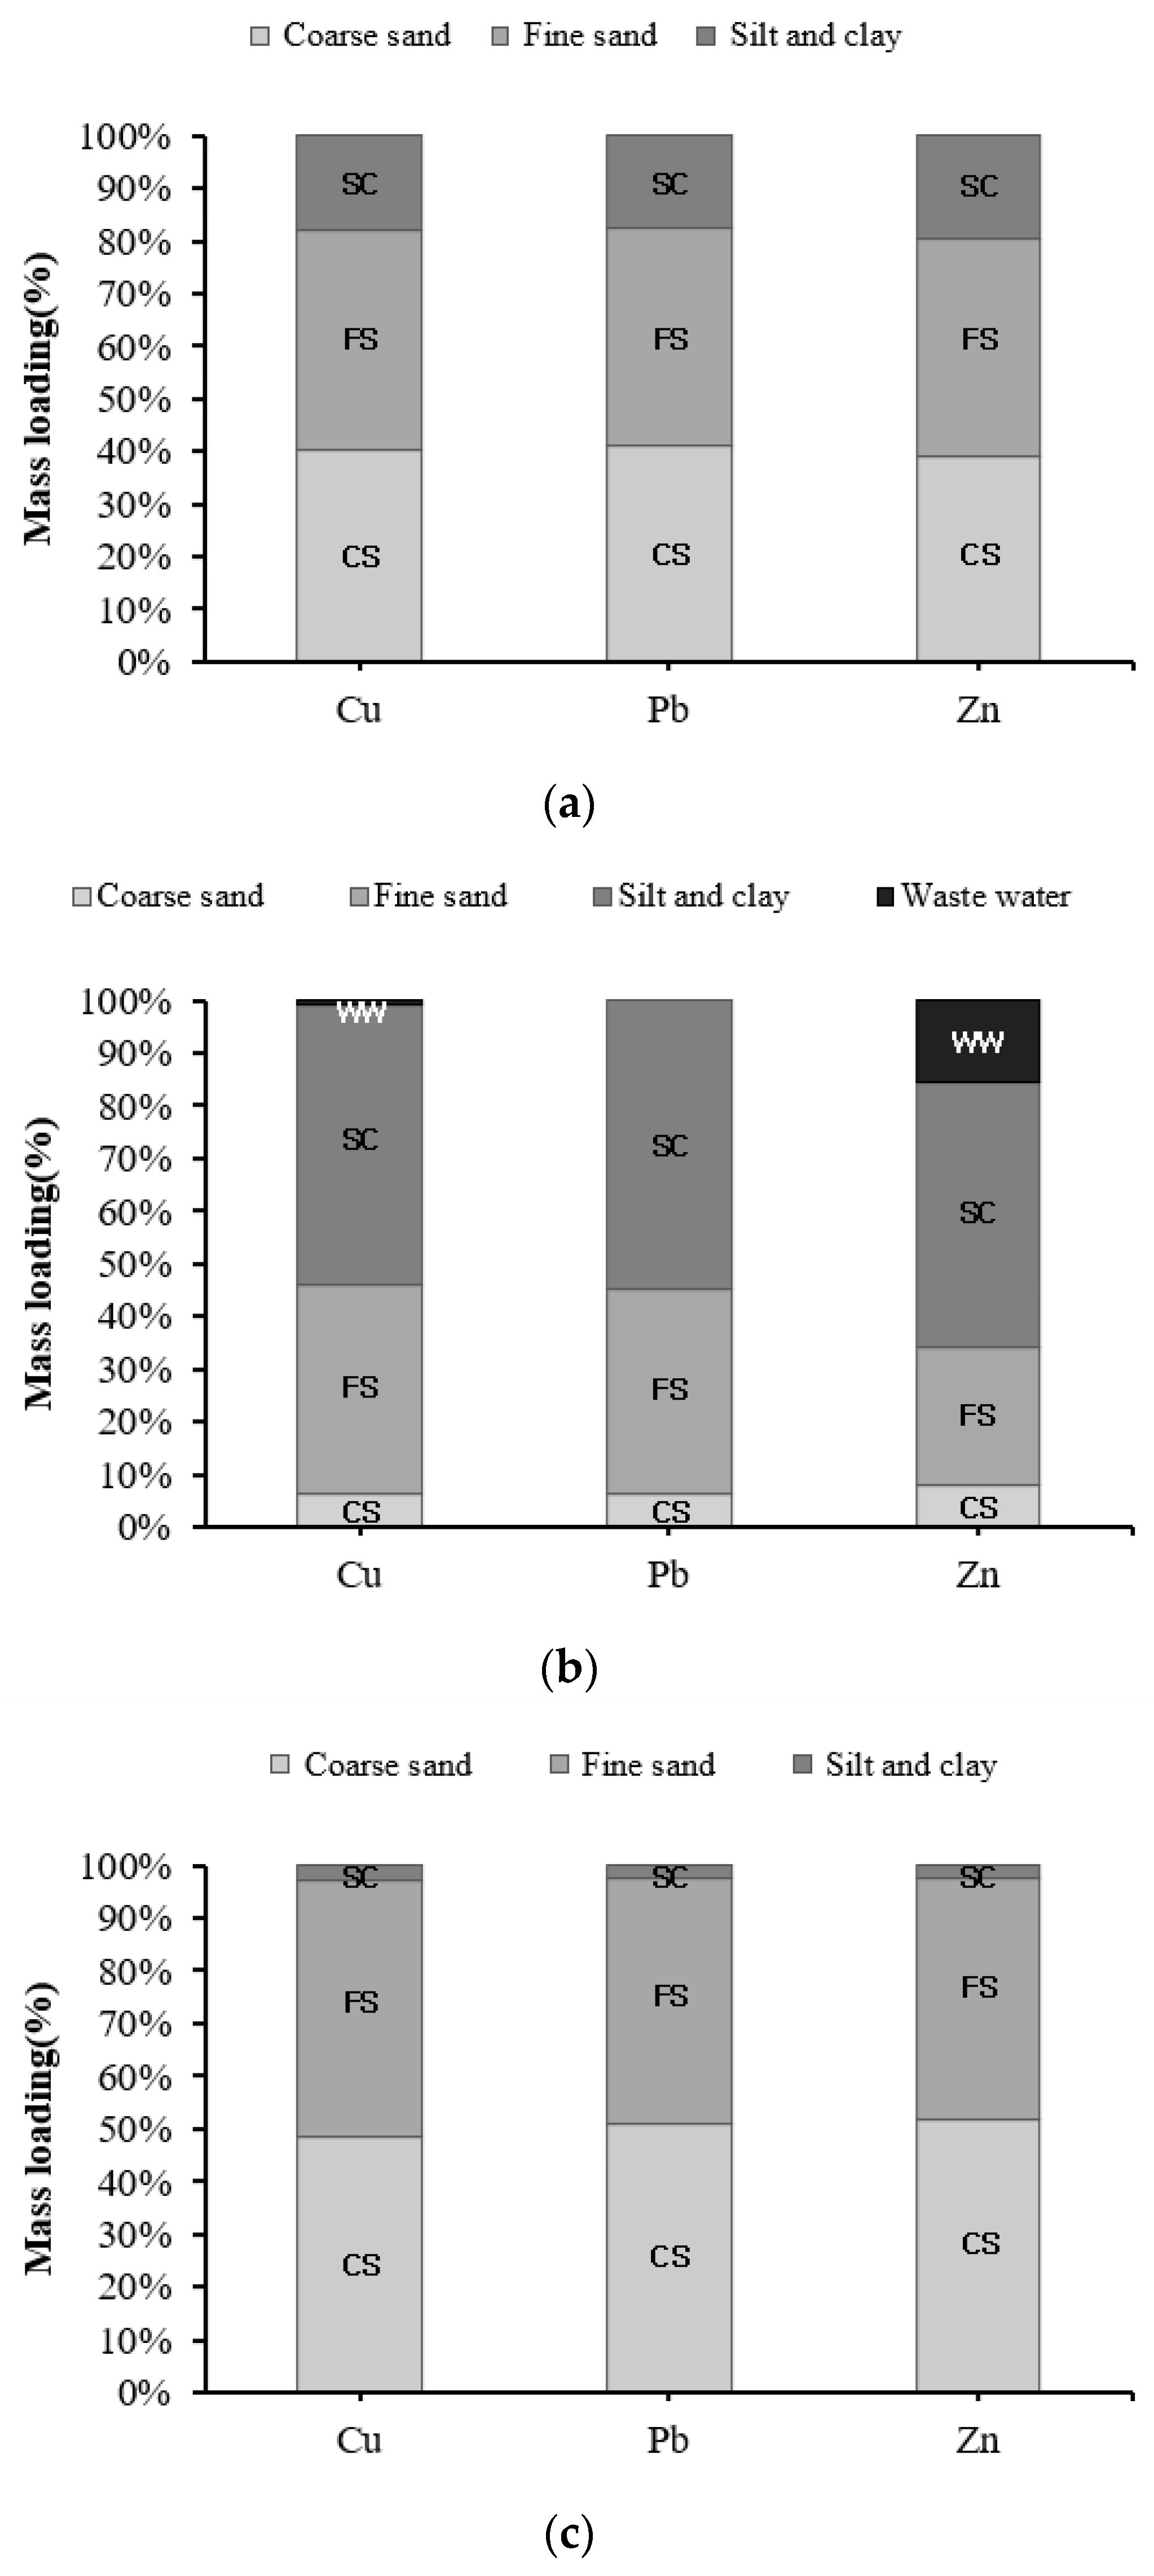
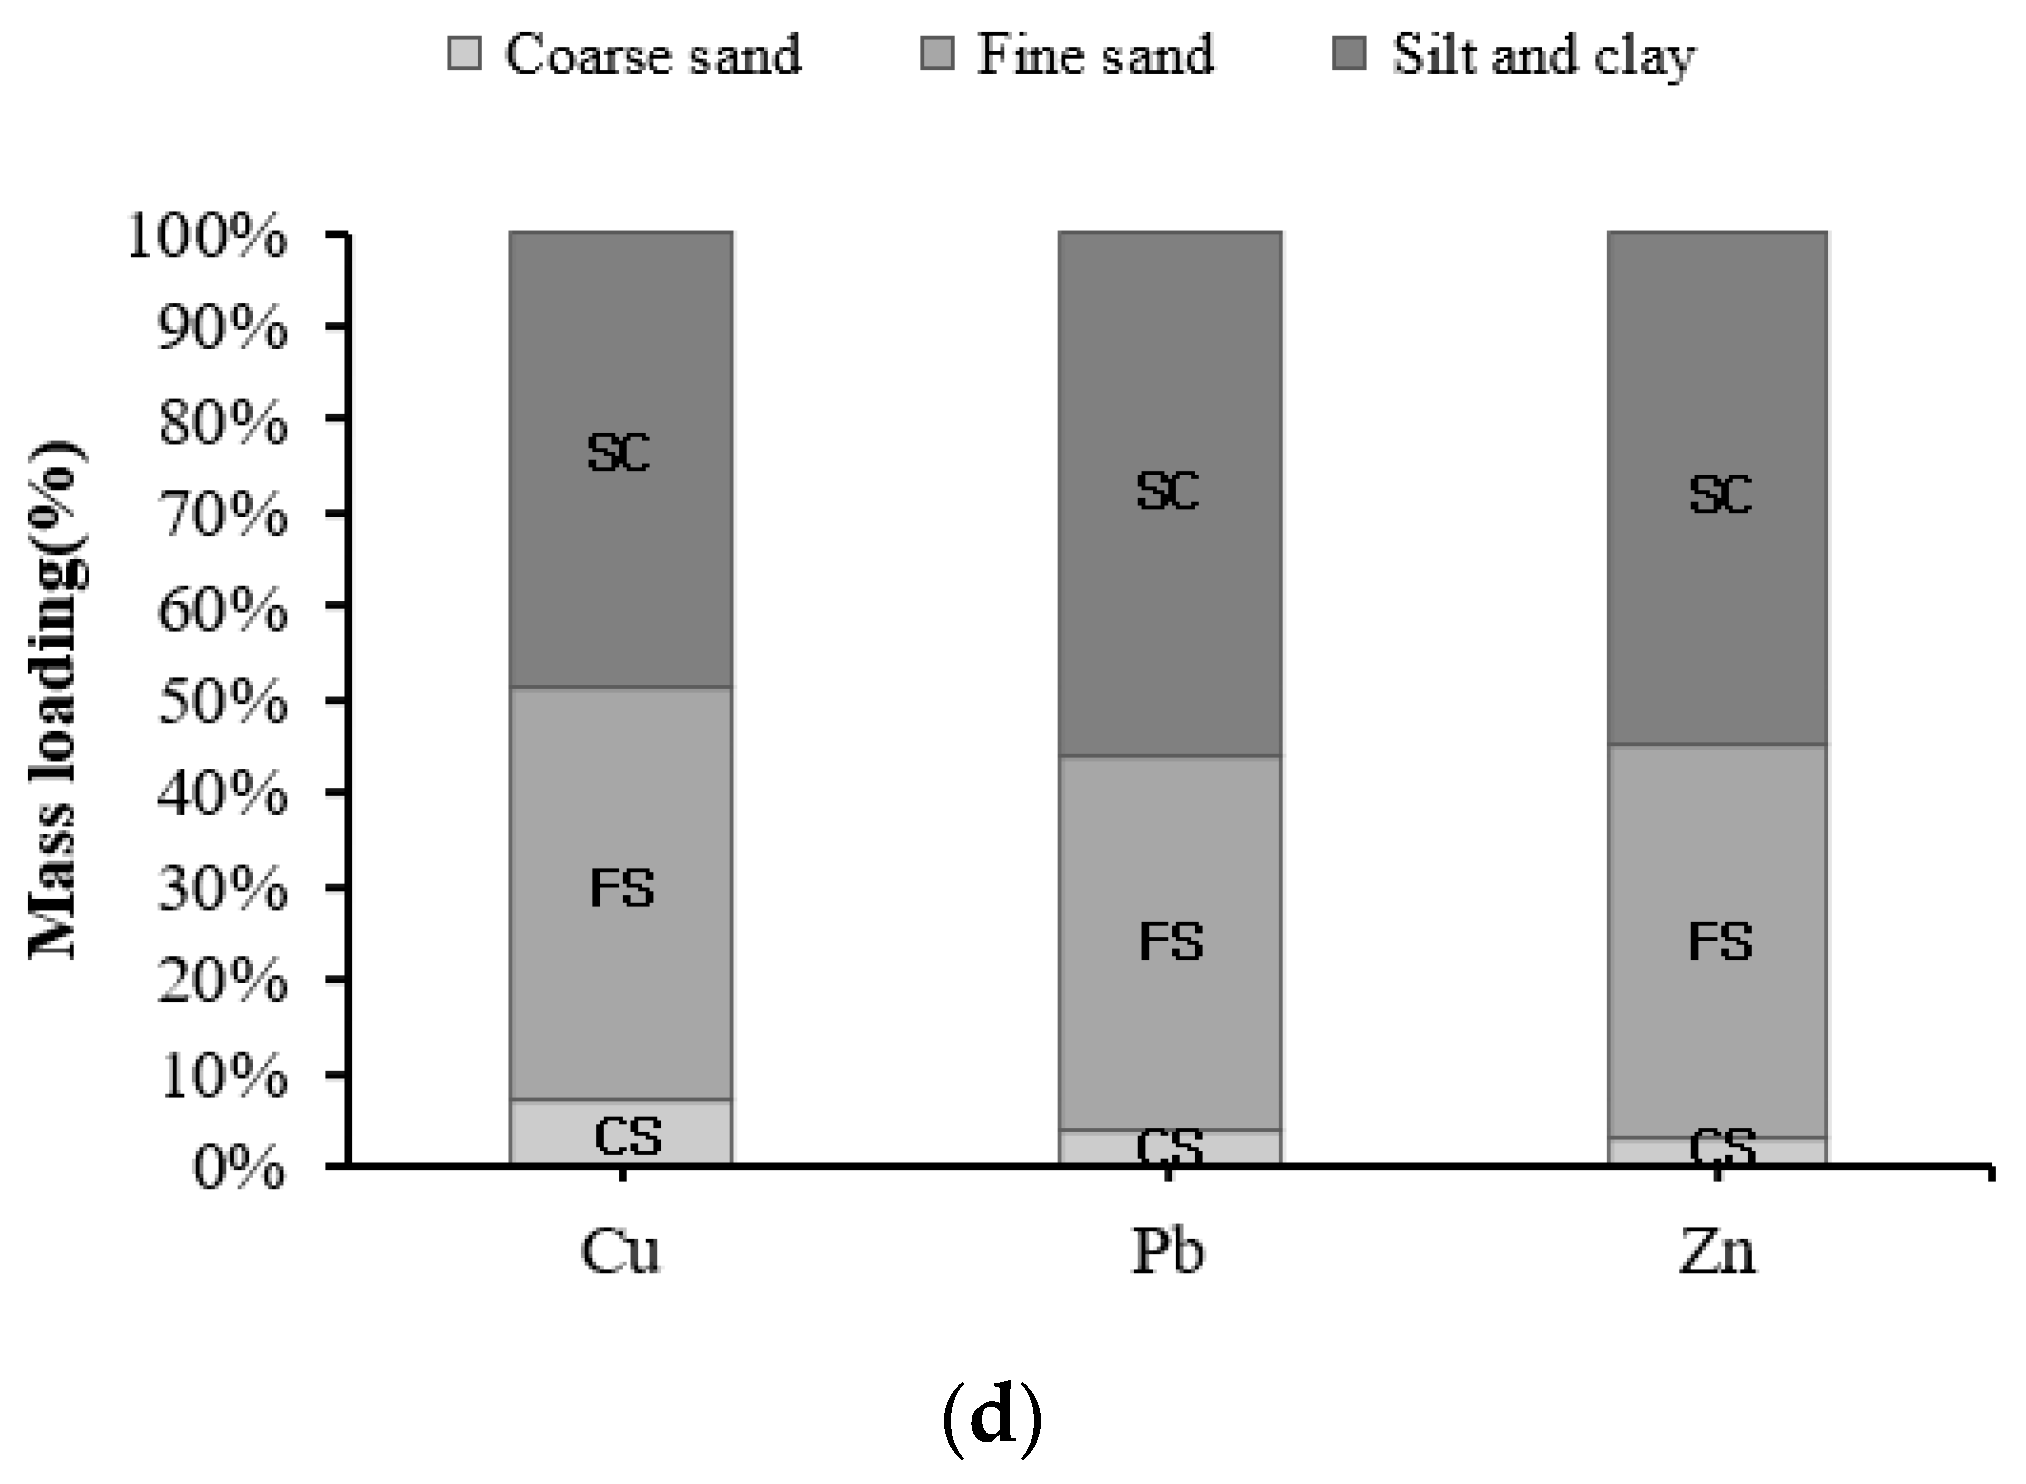
3.6. Change in Heavy Metal Mass Loading during High-Pressure Washing and Separation
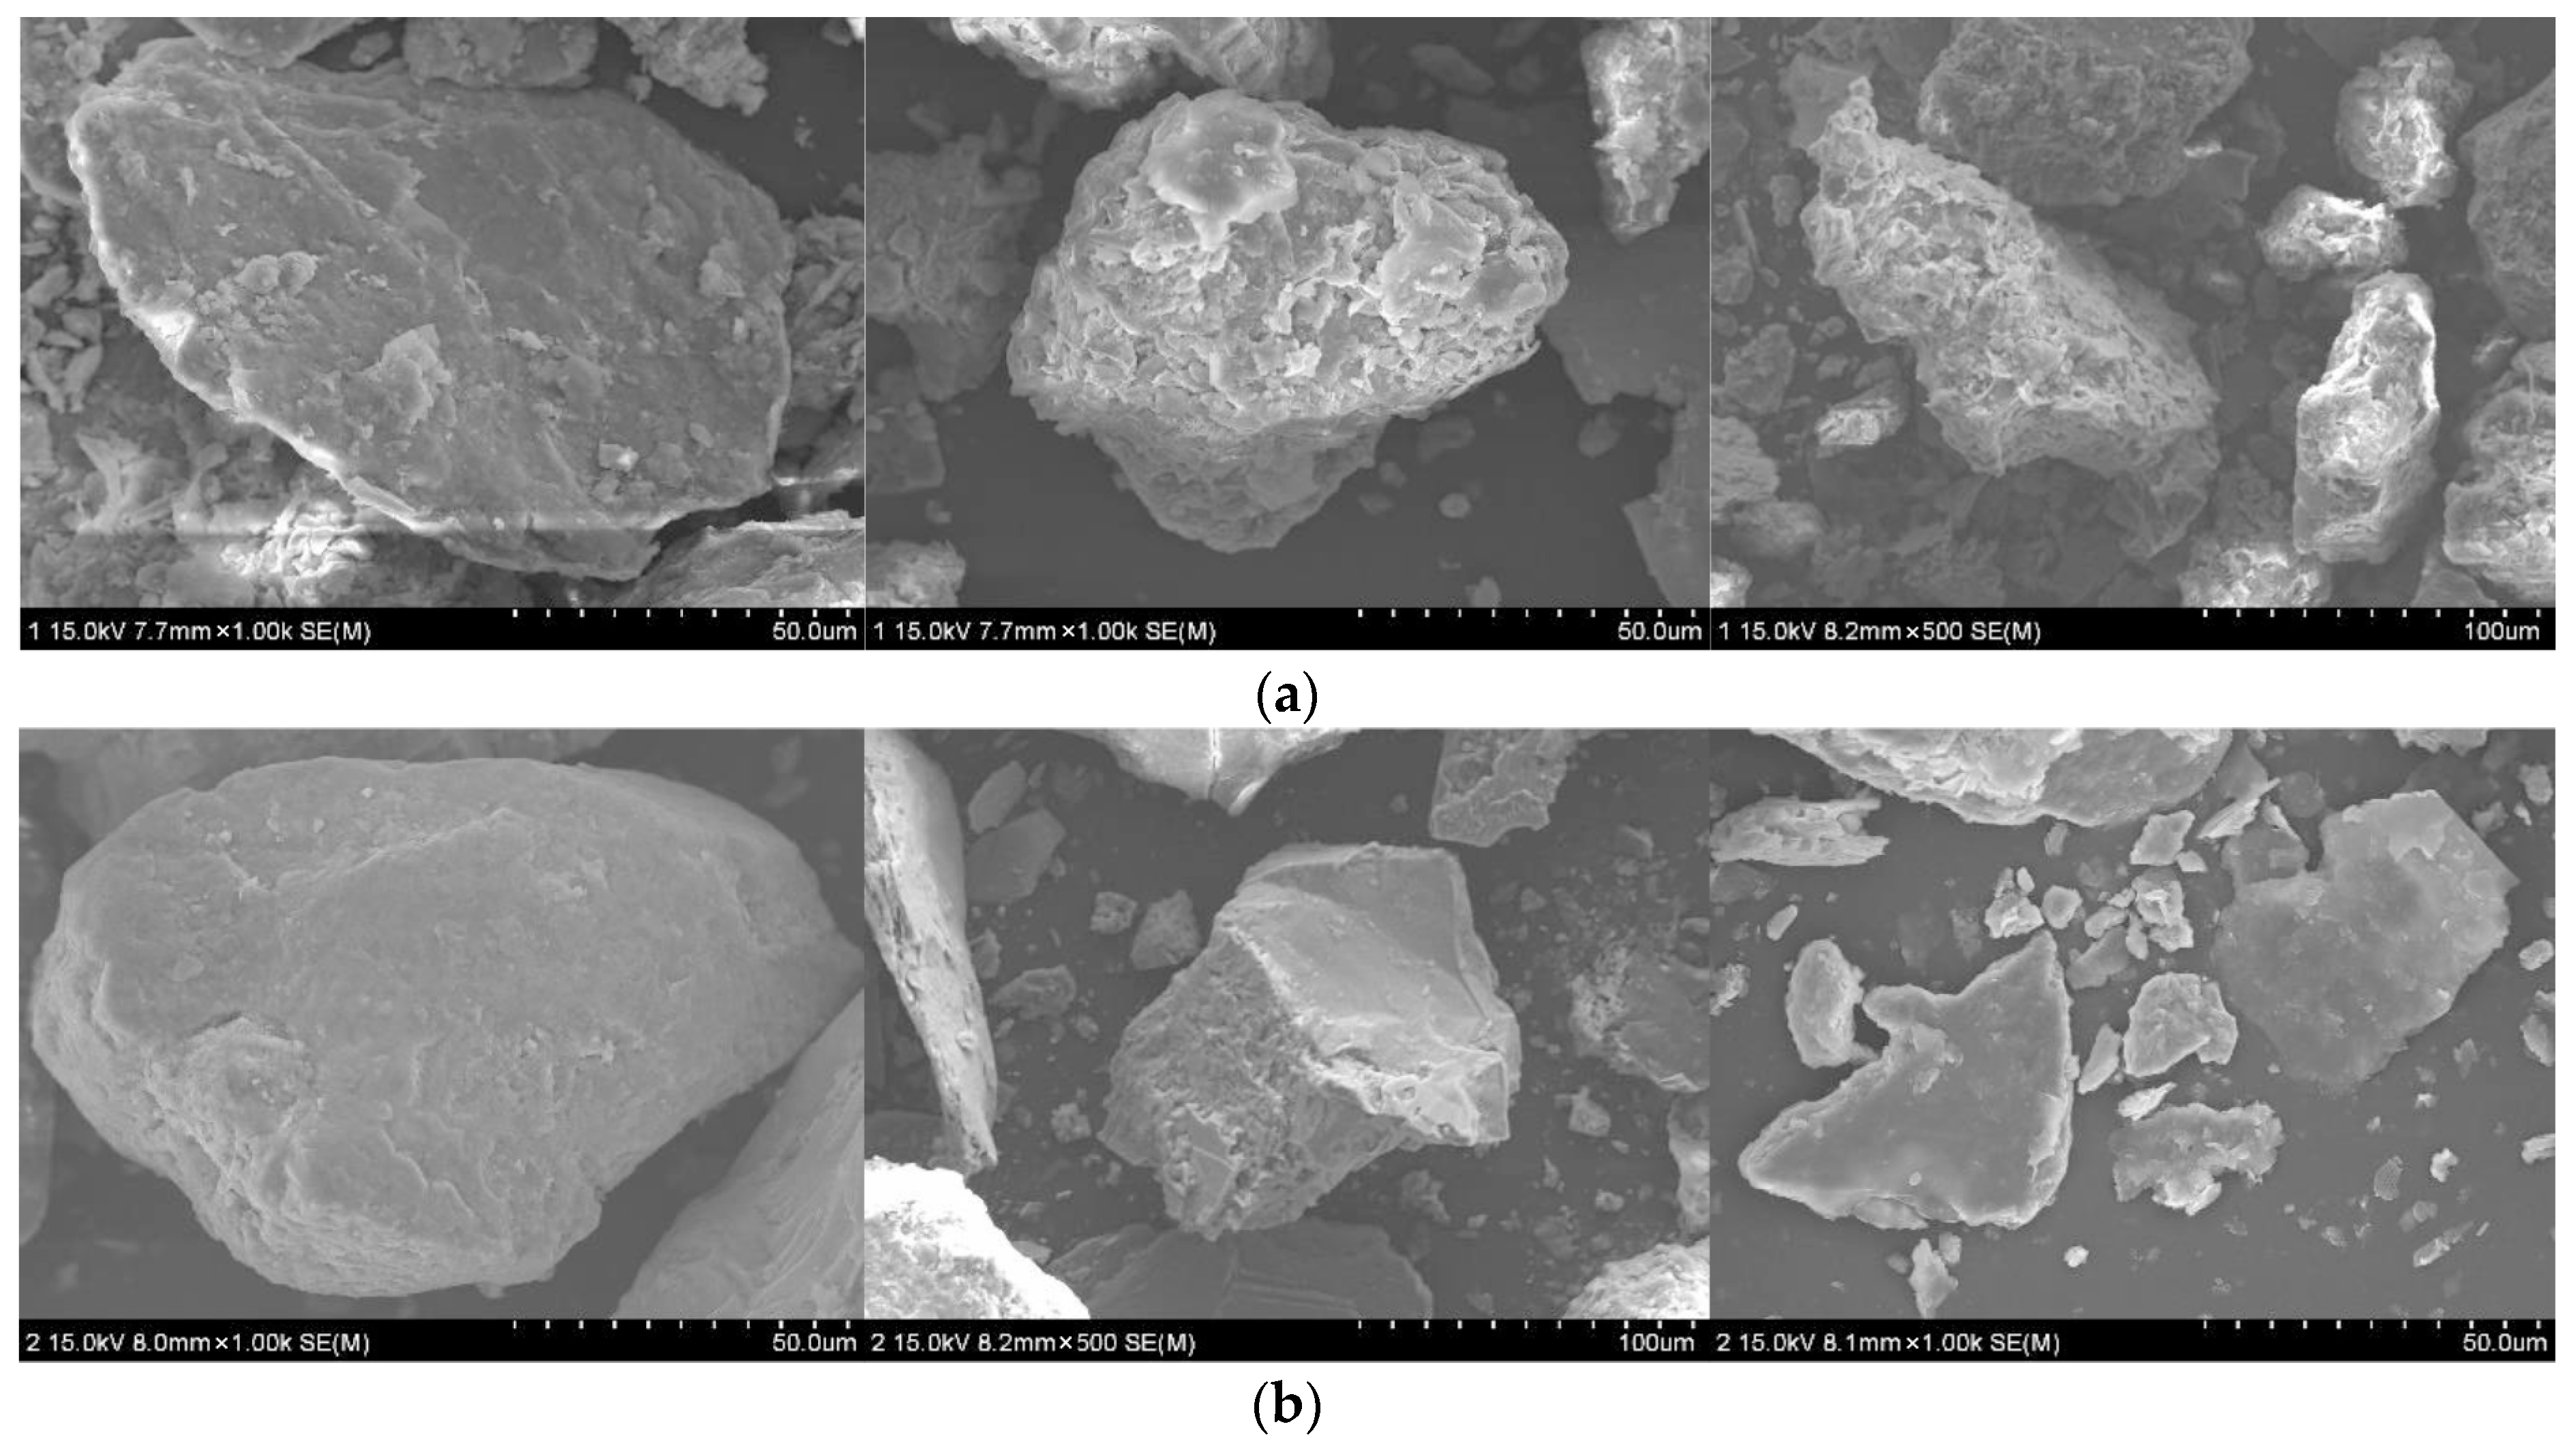
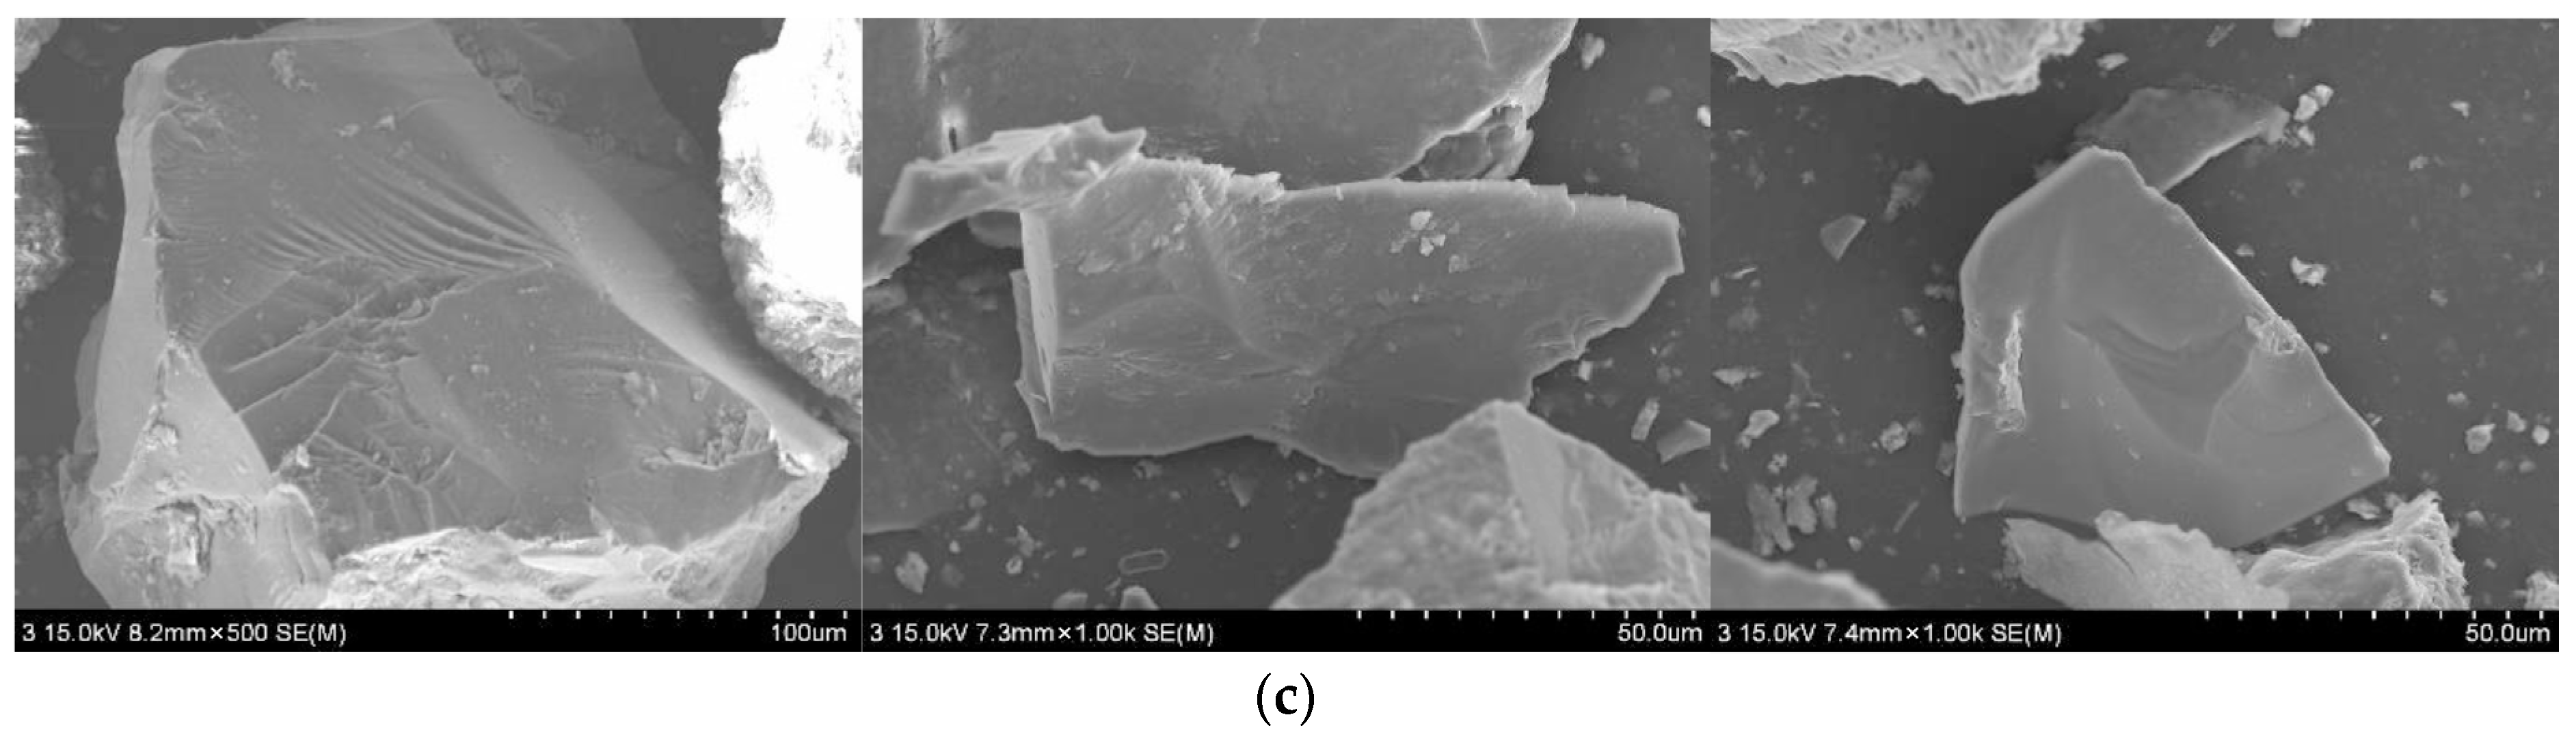
3.7. Soil Surface Analysis Using SEM
4. Conclusions
Author Contributions
Funding
Institutional Review Board Statement
Informed Consent Statement
Data Availability Statement
Conflicts of Interest
References
- Kinuthia, G.K.; Ngure, V.; Beti, D.; Lugalia, R.; Wangila, A.; Kamau, L. Levels of heavy metals in wastewater and soil samples from open drainage channels in nairobi, Kenya: Community health implication. Sci. Rep. 2020, 10, 8434. [Google Scholar] [CrossRef] [PubMed]
- Ma, Q.-L.; Yao, L.-A.; Guo, Q.-W.; Zhou, G.-J.; Liang, R.-C.; Fang, Q.-L.; Xu, Z.-C.; Zhao, X.-M. Long-term impact of accidental pollution on the distribution and risks of metals and metalloids in the sediment of the Longjiang river, China. Environ. Sci. Pollut. Res. 2021, 28, 1889–1900. [Google Scholar] [CrossRef] [PubMed]
- Yuan, Y.; Xiang, M.; Liu, C.; Theng, B.K.G. Chronic impact of an accidental wastewater spill from a smelter, china: A study of health Risk of heavy metal(loid)s via vegetable intake. Ecotoxicol. Environ. Saf. 2019, 182, 109401. [Google Scholar] [CrossRef] [PubMed]
- Gusiatin, Z.M.; Klimiuk, E. Metal (Cu, Cd and Zn) removal and stabilization during multiple soil washing by saponin. Chemosphere 2012, 86, 383–391. [Google Scholar] [CrossRef] [PubMed]
- Yang, J.-W.; Lee, Y.-J. Status of soil remediation and technology development in Korea. Korean Chem. Eng. Res. 2007, 45, 311–318. (In Korean) [Google Scholar]
- Moon, D.H.; Koutsospyros, A. Stabilization of lead-contaminated mine soil using natural waste materials. Agriculture 2022, 12, 367. [Google Scholar] [CrossRef]
- Moon, D.H.; Jung, S.P.; Koutsospyros, A. Assessment of the stabilization of mercury contaminated soil using starfish. Agriculture 2022, 12, 542. [Google Scholar] [CrossRef]
- Ahmad, M.; Lee, S.S.; Moon, D.H.; Yang, J.E.; Ok, Y.S. A review of environmental contamination and remediation strategies for heavy metals at shooting range soils. In Environmental Protection Strategies for Sustainable Development; Malik, A., Grohmann, E., Eds.; Strategies for Sustainability; Springer: Dordrecht, The Netherlands, 2012; pp. 437–451. [Google Scholar] [CrossRef]
- Mohammed, A.S.; Kapri, A.; Goel, R. Heavy metal pollution: Source, impact, and remedies. In Biomanagement of Metal-Contaminated Soils; Khan, M.S., Zaidi, A., Goel, R., Musarrat, J., Eds.; Springer: Dordrecht, The Netherlands, 2011; pp. 1–28. [Google Scholar] [CrossRef]
- Oh, W.K.; Lee, J.Y.; Kim, H.J. A feasibility study on Pteris Multifida Pior. for the phytoremediation of arsenic contaminated mine soil. J. Korean Soc. Environ. Eng. 2006, 12, 515–519. [Google Scholar]
- Kim, W.S.; Moon, S.H.; Kim, K.W.; Kim, S.O. Removal of heavy metals from soils by electrokinetic soil processing enhanced by ion exchange membranes. J. Korean Soc. Environ. Eng. 2003, 118, 415–422. [Google Scholar]
- Dermont, G.; Bergeron, M.; Mercier, G.; Richer-Laflèche, M. Soil washing for metal removal: A review of physical/chemical technologies and field applications. J. Hazard. Mater. 2008, 152, 1–31. [Google Scholar] [CrossRef]
- Liu, J.; Zhao, L.; Liu, Q.; Li, J.; Qiao, Z.; Sun, P.; Yang, Y. A Critical review on soil washing during soil remediation for heavy metals and organic pollutants. Int. J. Environ. Sci. Technol. 2021, 19, 601–624. [Google Scholar] [CrossRef]
- Moon, D.H.; Chang, Y.-Y.; Lee, M.; Koutsospyros, A.; Koh, I.-H.; Ji, W.H.; Park, J.-H. Assessment of soil washing for heavy metal contaminated paddy soil using FeCl3 washing solutions. Environ. Geochem. Health 2021, 43, 3343–3350. [Google Scholar] [CrossRef]
- Kim, D.-H.; Hwang, B.-R.; Moon, D.-H.; Kim, Y.-S.; Baek, K. Environmental assessment on a soil washing process of a Pb-contaminated shooting range site: A case study. Environ. Sci. Pollut. Res. Int. 2013, 20, 8417–8424. [Google Scholar] [CrossRef] [PubMed]
- Cho, K.; Kim, H.; Purev, O.; Choi, N.; Lee, J. Physical separation of contaminated soil using a washing ejector based on hydrodynamic cavitation. Sustainability 2022, 14, 252. [Google Scholar] [CrossRef]
- Kim, H.; Cho, K.; Purev, O.; Choi, N.; Lee, J. Remediation of toxic heavy metal contaminated soil by combining a washing ejector based on hydrodynamic cavitation and soil washing process. Int. J. Environ. Res. Public Health 2022, 19, 786. [Google Scholar] [CrossRef] [PubMed]
- Ministry of Environment (MOE). The Korean Standard Test (KST) Methods for Soils; Korean Ministry of Environment: Sejong City, Republic of Korea, 2010; p. 225. (In Korean)
- Hur, J.-H.; Jeong, S.-W. Effect of water-thoroughly-rising in the artificially metal-contaminated soil preparation on final soil metal concentrations. Korean Soc. Environ. 2011, 33, 670–676. (In Korean) [Google Scholar] [CrossRef] [Green Version]
- Ministry of Environment (MOE). The Korean Standard Test (KST) Methods for Soils; Korean Ministry of Environment: Sejong City, Republic of Korea, 2016; p. 31. (In Korean)
- Rural Development Administration (RDA). Methods of Soil Analysis; Korean Rural Development Administration: Sejong City, Republic of Korea, 2010; pp. 59–60. (In Korean)
- Rural Development Administration (RDA). Comprehensive Examination Manuals for Soils; Korean Rural Development Administration: Sejong City, Republic of Korea, 2013; pp. 19–22. (In Korean)
- MDI. Jade, Version 7.1; Material’s Data Inc.: Livermore, CA, USA, 2005.
- ICDD. Powder Diffraction File.PDF-2 Database Release; International Centre for Diffraction Data: Newtown Square, PA, USA, 2002. [Google Scholar]
- Mason, T.J.; Lorimer, J.P. Applied Sonochemistry: The Uses of Power Ultrasound in Chemistry and Processing; Wiley-Vch Weinheim: Weinheim, Germany, 2002; Volume 10. [Google Scholar]
- Feng, D.; Lorenzen, L.; Aldrich, C.; Maré, P.W. Ex situ diesel contaminated soil washing with mechanical methods. Miner. Eng. 2001, 14, 1093–1100. [Google Scholar] [CrossRef]
- Li, Y.; Liao, X.; Li, W. Combined sieving and washing of multi-metal-contaminated soils using remediation equipment: A pilot-scale demonstration. J. Clean. Prod. 2019, 212, 81–89. [Google Scholar] [CrossRef]
- Ko, I.; Lee, C.-H.; Lee, K.-P.; Kim, K.-W. Remediation of soils contaminated with arsenic and heavy metals by soil washing. J. Soil Groundw. Environ. 2004, 9, 52–61. (In Korean) [Google Scholar]
- Huang, B.; Yuan, Z.; Li, D.; Zheng, M.; Nie, X.; Liao, Y. Effects of soil particle size on the adsorption, distribution, and migration behaviors of heavy metal(loid)s in soil: A review. Environ. Sci. Process. Impacts 2020, 22, 1596–1615. [Google Scholar] [CrossRef]
- Namkoong, W.; Kim, J. Evaluation on extractability of heavy metals in mine tailings of disused metal mines with concentrations and kinds of soil washing solutions. J. Korean Soc. Environ. Eng. 2005, 27, 785–796. [Google Scholar]
- Hermann, R.; Neumann-Mahlkau, P. The mobility of zinc, cadmium, copper, lead, iron and arsenic in ground water as a function of redox potential and pH. Sci. Total Environ. 1985, 43, 1–12. [Google Scholar] [CrossRef]
- Hu, W.; Niu, Y.; Zhu, H.; Dong, K.; Wang, D.; Liu, F. Remediation of zinc-contaminated soils by using the two-step washing with citric acid and water-soluble chitosan. Chemosphere 2021, 282, 131092. [Google Scholar] [CrossRef] [PubMed]


| Soil Properties | Contaminated Soil | Korean Warning Standards (Region 2) 1 |
|---|---|---|
| Soil pH | 5.03 | |
| Cation exchange capacity (cmolc/kg) | 14.17 | |
| Organic matter content (%) 2 | 8.01 | |
| Composition (%) 3 | ||
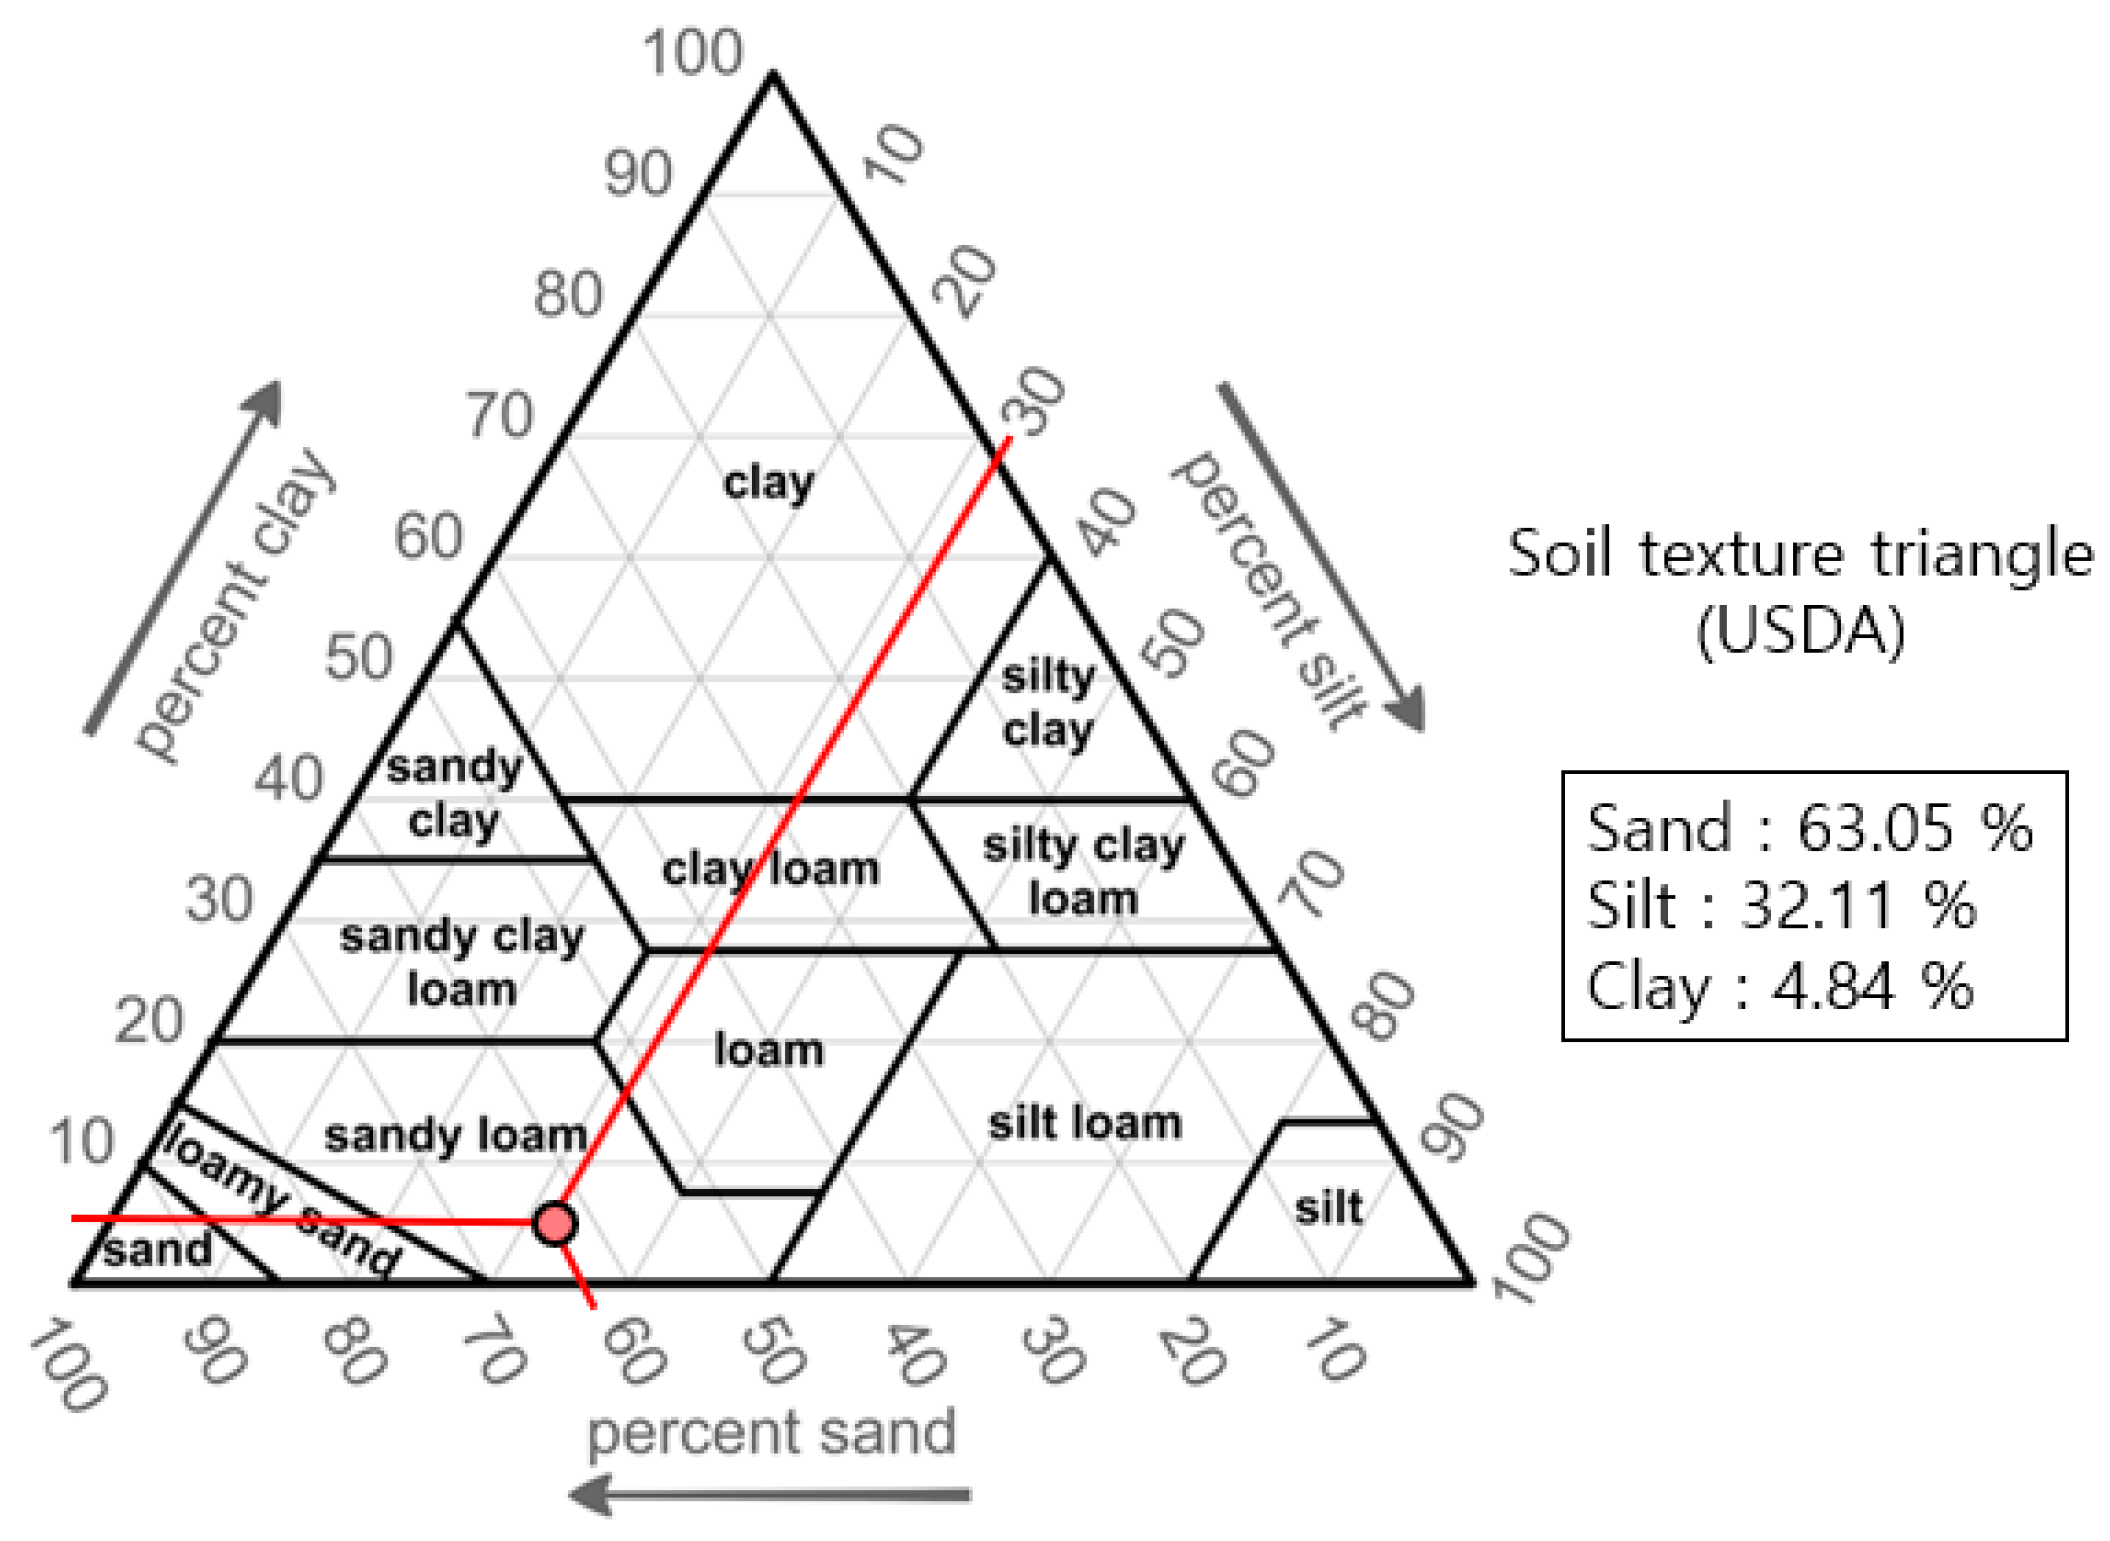
| Sand | 63.05 | |
| Silt | 32.11 | |
| Clay | 4.84 | |
| Texture 4 | Sandy loam | |
| Heavy metals (mg∙kg−1) | ||
| Cu | 700 ± 36 | 500 |
| Pb | 530 ± 10 | 400 |
| Zn | 900 ± 56 | 600 |
| Major mineral phases 5 | Quartz, Microcline | |
| Albite, Calcite |
| Particle Size (mm) | Contaminated Soil (%) | Washed Soil (%) | Treated Soil (%) | Separated Soil (%) |
|---|---|---|---|---|
| Coarse sand, CS (2–0.42) | 55.4 | 32.1 | 54.3 | 2.7 |
| Fine sand, FS (0.42–0.074) | 33.3 | 37.5 | 44.2 | 36.0 |
| Silt and clay, SC (<0.074) | 11.3 | 30.4 | 1.5 | 61.3 |
| Total weight (%) | 100 | 100 | 100 | 100 |
| Particle Size (mm) | Contaminated Soil | ||
|---|---|---|---|
| Cu (mg/kg) | Pb (mg/kg) | Zn (mg/kg) | |
| Coarse sand (2–0.42) | 486.5 | 423.9 | 591.8 |
| Fine sand (0.42–0.074) | 846.2 | 715.4 | 1035.8 |
| Silt and clay (<0.074) | 1072.7 | 899.5 | 1447.0 |
| Particle Size (mm) | Contaminated Soil (%) | Washed Soil (%) | Treated Soil (%) | Separated Soil (%) | ||||||||
|---|---|---|---|---|---|---|---|---|---|---|---|---|
| Cu | Pb | Zn | Cu | Pb | Zn | Cu | Pb | Zn | Cu | Pb | Zn | |
| Coarse sand, CS (2–0.42) | 40.1 | 40.9 | 39.2 | 6.4 | 6.3 | 8.1 | 48.7 | 51.1 | 51.9 | 8.2 | 4.2 | 3.5 |
| Fine sand, FS (0.42–0.074) | 41.9 | 41.4 | 41.2 | 39.6 | 39.0 | 26.1 | 48.4 | 46.6 | 45.5 | 43.1 | 39.2 | 41.2 |
| Silt and clay, SC (<0.074) | 18.0 | 17.7 | 19.6 | 53.4 | 54.7 | 50.1 | 2.9 | 2.3 | 2.6 | 48.7 | 56.6 | 55.3 |
| Wastewater, WW | - | 0.6 | 0.0 | 15.7 | - | - | ||||||
Publisher’s Note: MDPI stays neutral with regard to jurisdictional claims in published maps and institutional affiliations. |
© 2022 by the authors. Licensee MDPI, Basel, Switzerland. This article is an open access article distributed under the terms and conditions of the Creative Commons Attribution (CC BY) license (https://creativecommons.org/licenses/by/4.0/).
Share and Cite
Park, S.H.; Koutsospyros, A.; Moon, D.H. Optimization of a High-Pressure Soil Washing System for Emergency Recovery of Heavy Metal-Contaminated Soil. Agriculture 2022, 12, 2054. https://0-doi-org.brum.beds.ac.uk/10.3390/agriculture12122054
Park SH, Koutsospyros A, Moon DH. Optimization of a High-Pressure Soil Washing System for Emergency Recovery of Heavy Metal-Contaminated Soil. Agriculture. 2022; 12(12):2054. https://0-doi-org.brum.beds.ac.uk/10.3390/agriculture12122054
Chicago/Turabian StylePark, Sang Hyeop, Agamemnon Koutsospyros, and Deok Hyun Moon. 2022. "Optimization of a High-Pressure Soil Washing System for Emergency Recovery of Heavy Metal-Contaminated Soil" Agriculture 12, no. 12: 2054. https://0-doi-org.brum.beds.ac.uk/10.3390/agriculture12122054