
Spatiotemporal Estimation of Reference Evapotranspiration for Agricultural Applications in Punjab, Pakistan

 ,
, 

 ,
,  ,
,  , ,
, ,  and
and
Abstract
:1. Introduction
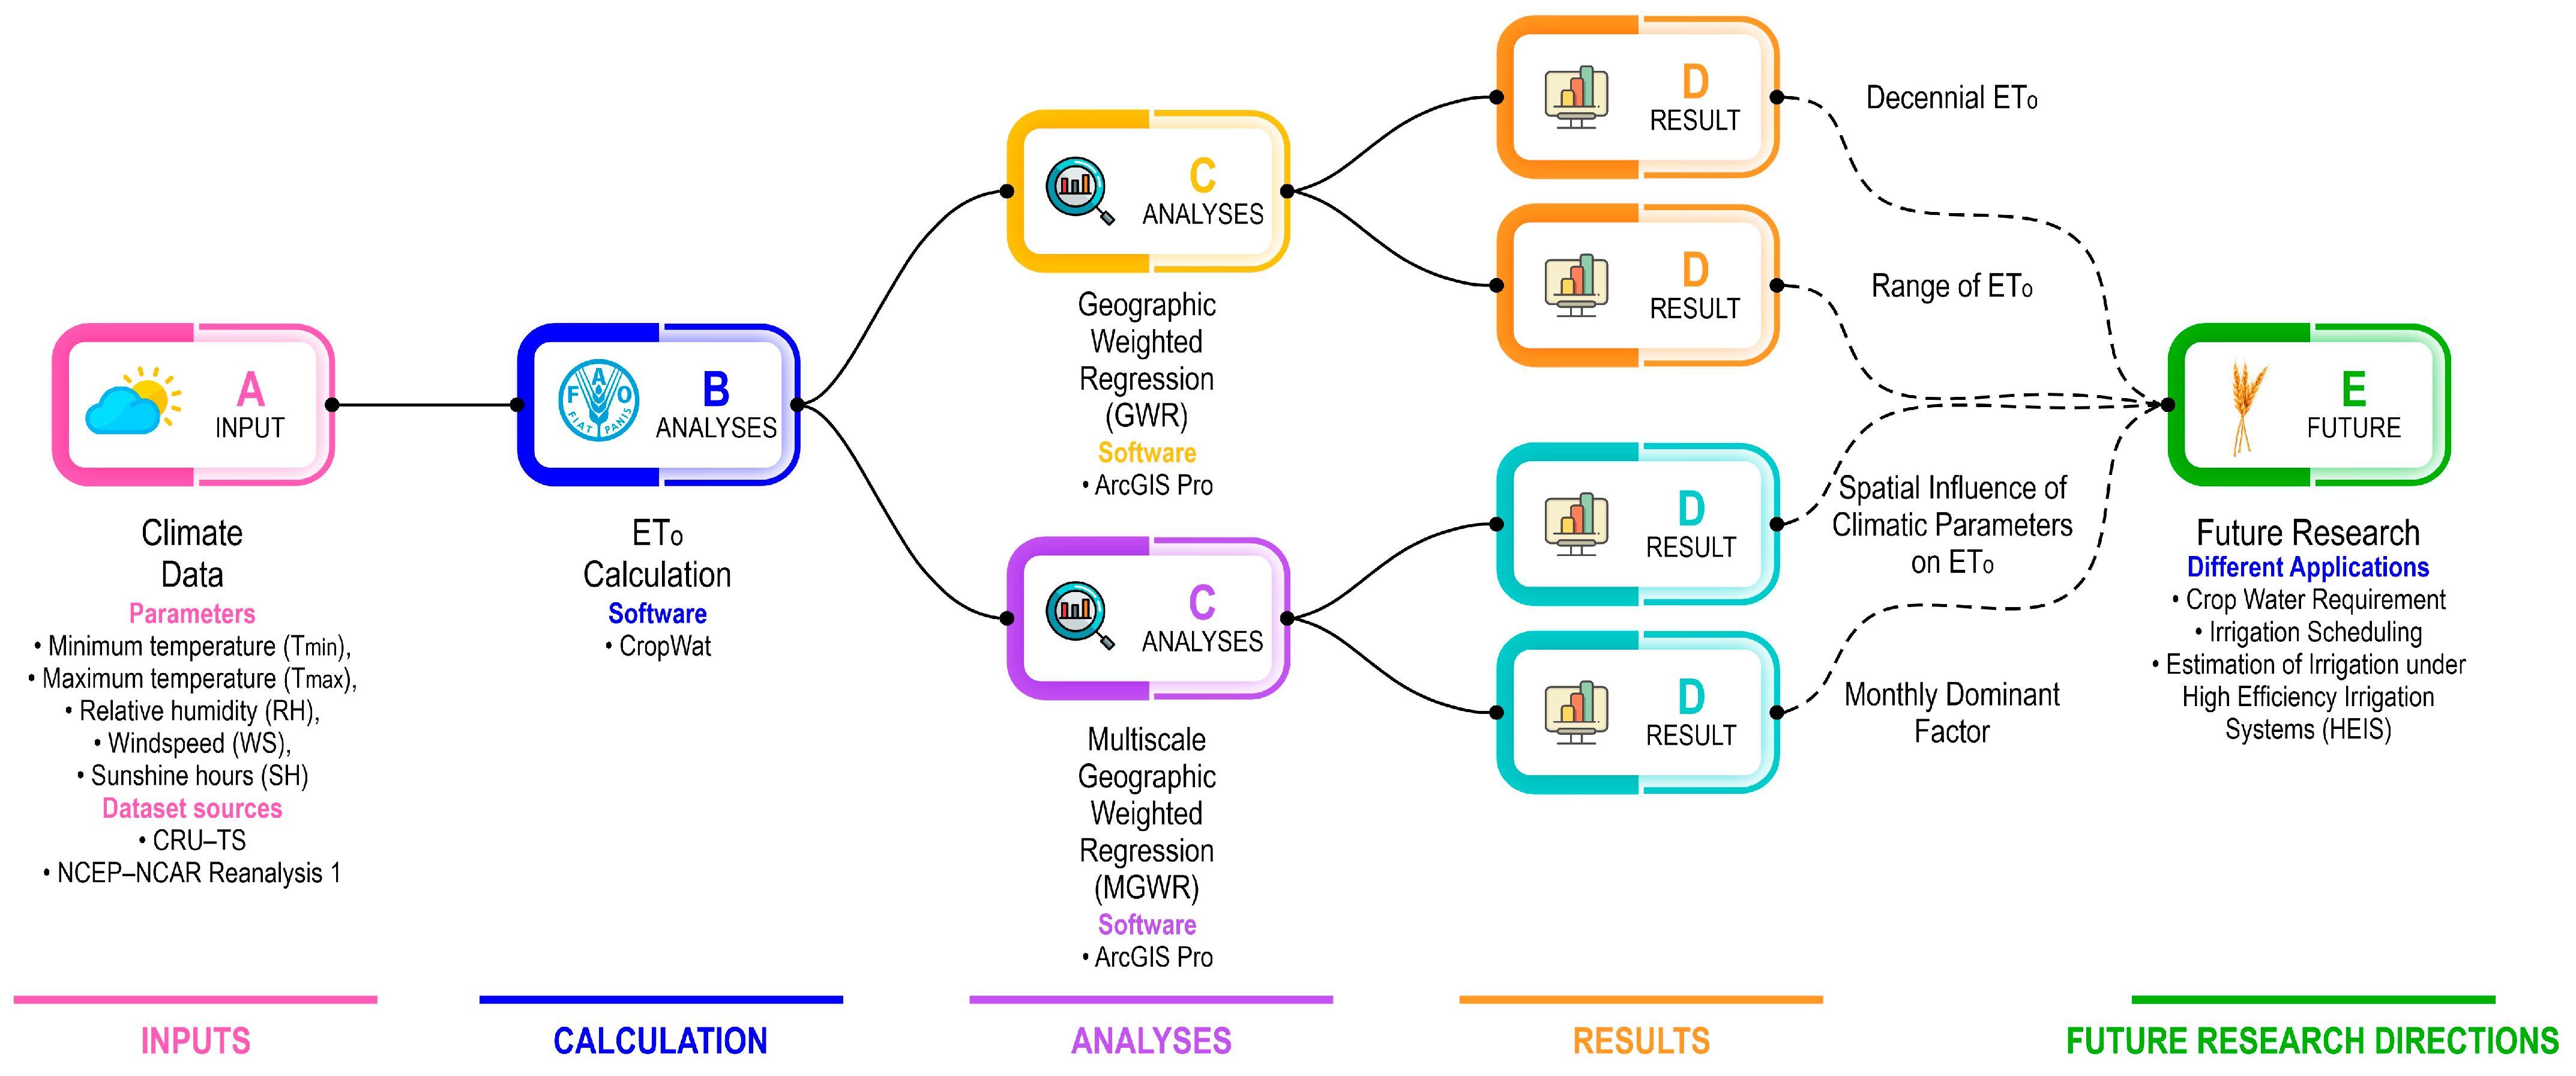
2. Materials and Methods
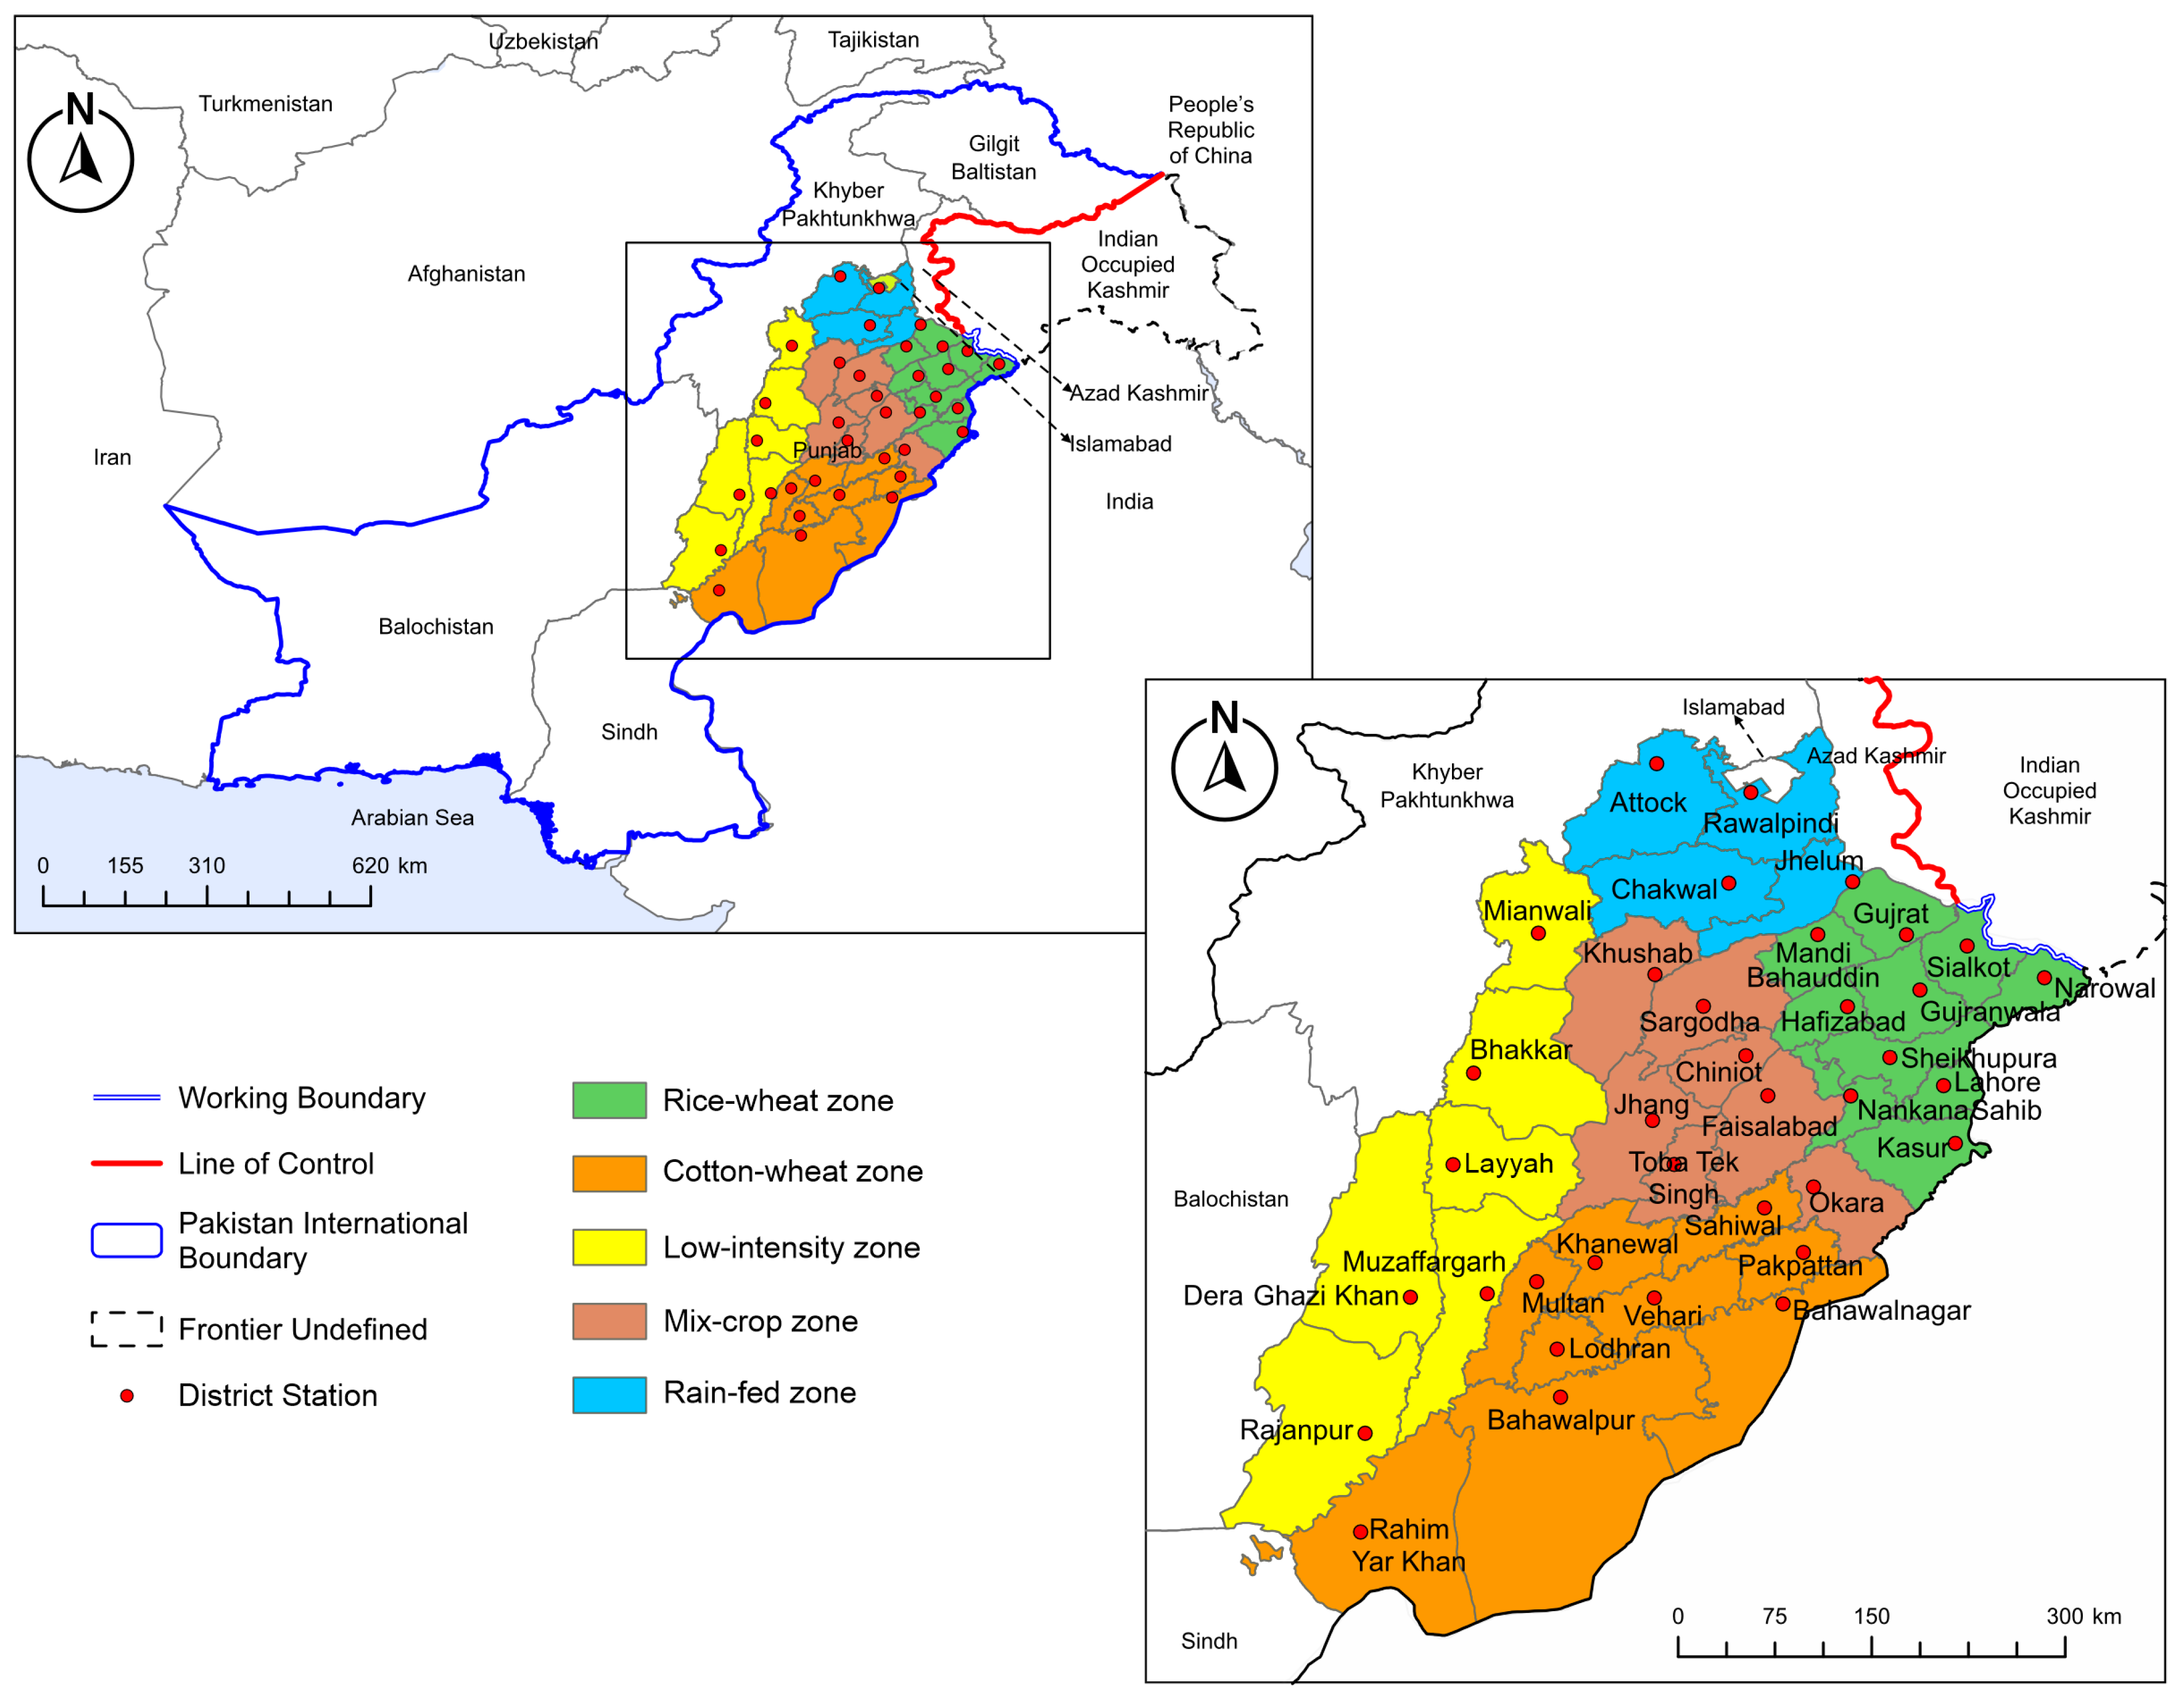
2.1. Study Area
2.2. Data Collection
2.2.1. ETo Estimation
2.2.2. Trend Analysis
2.2.3. Data Quality and Integrity Assessment
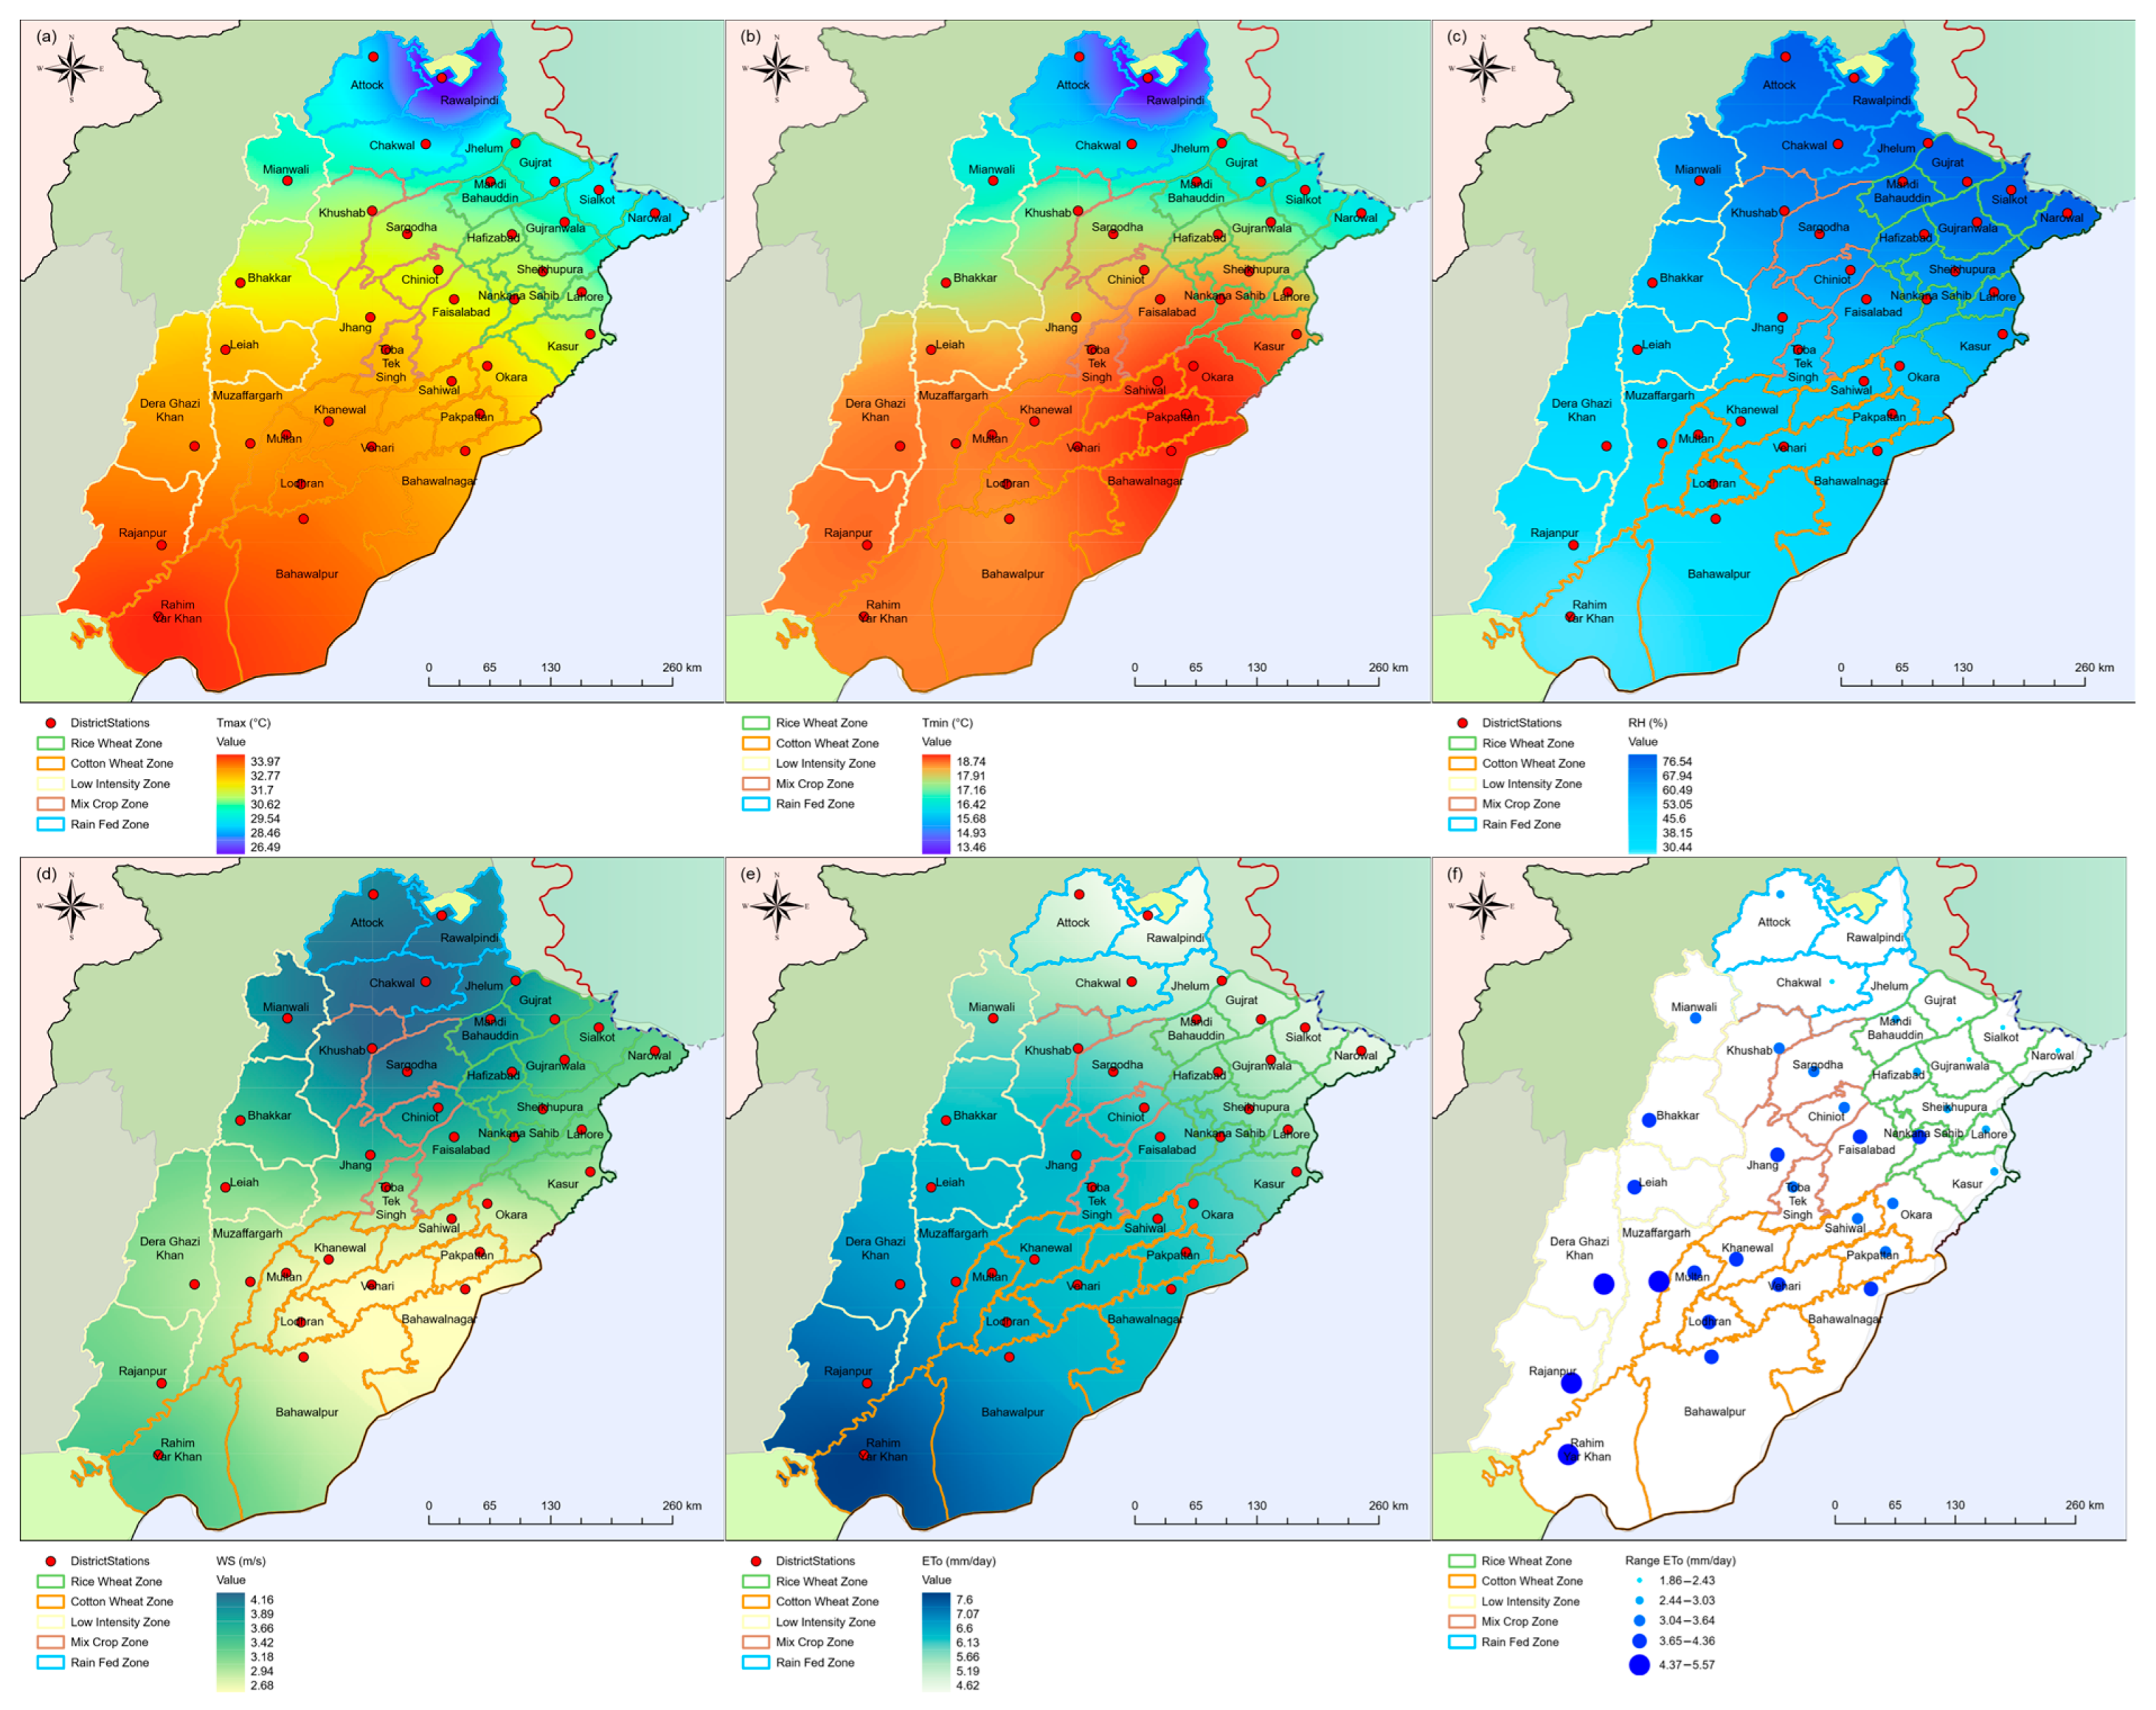
2.2.4. Spatial Distribution of ETo
2.2.5. Spatial Relationship between Climatic Variables and ETo
3. Results
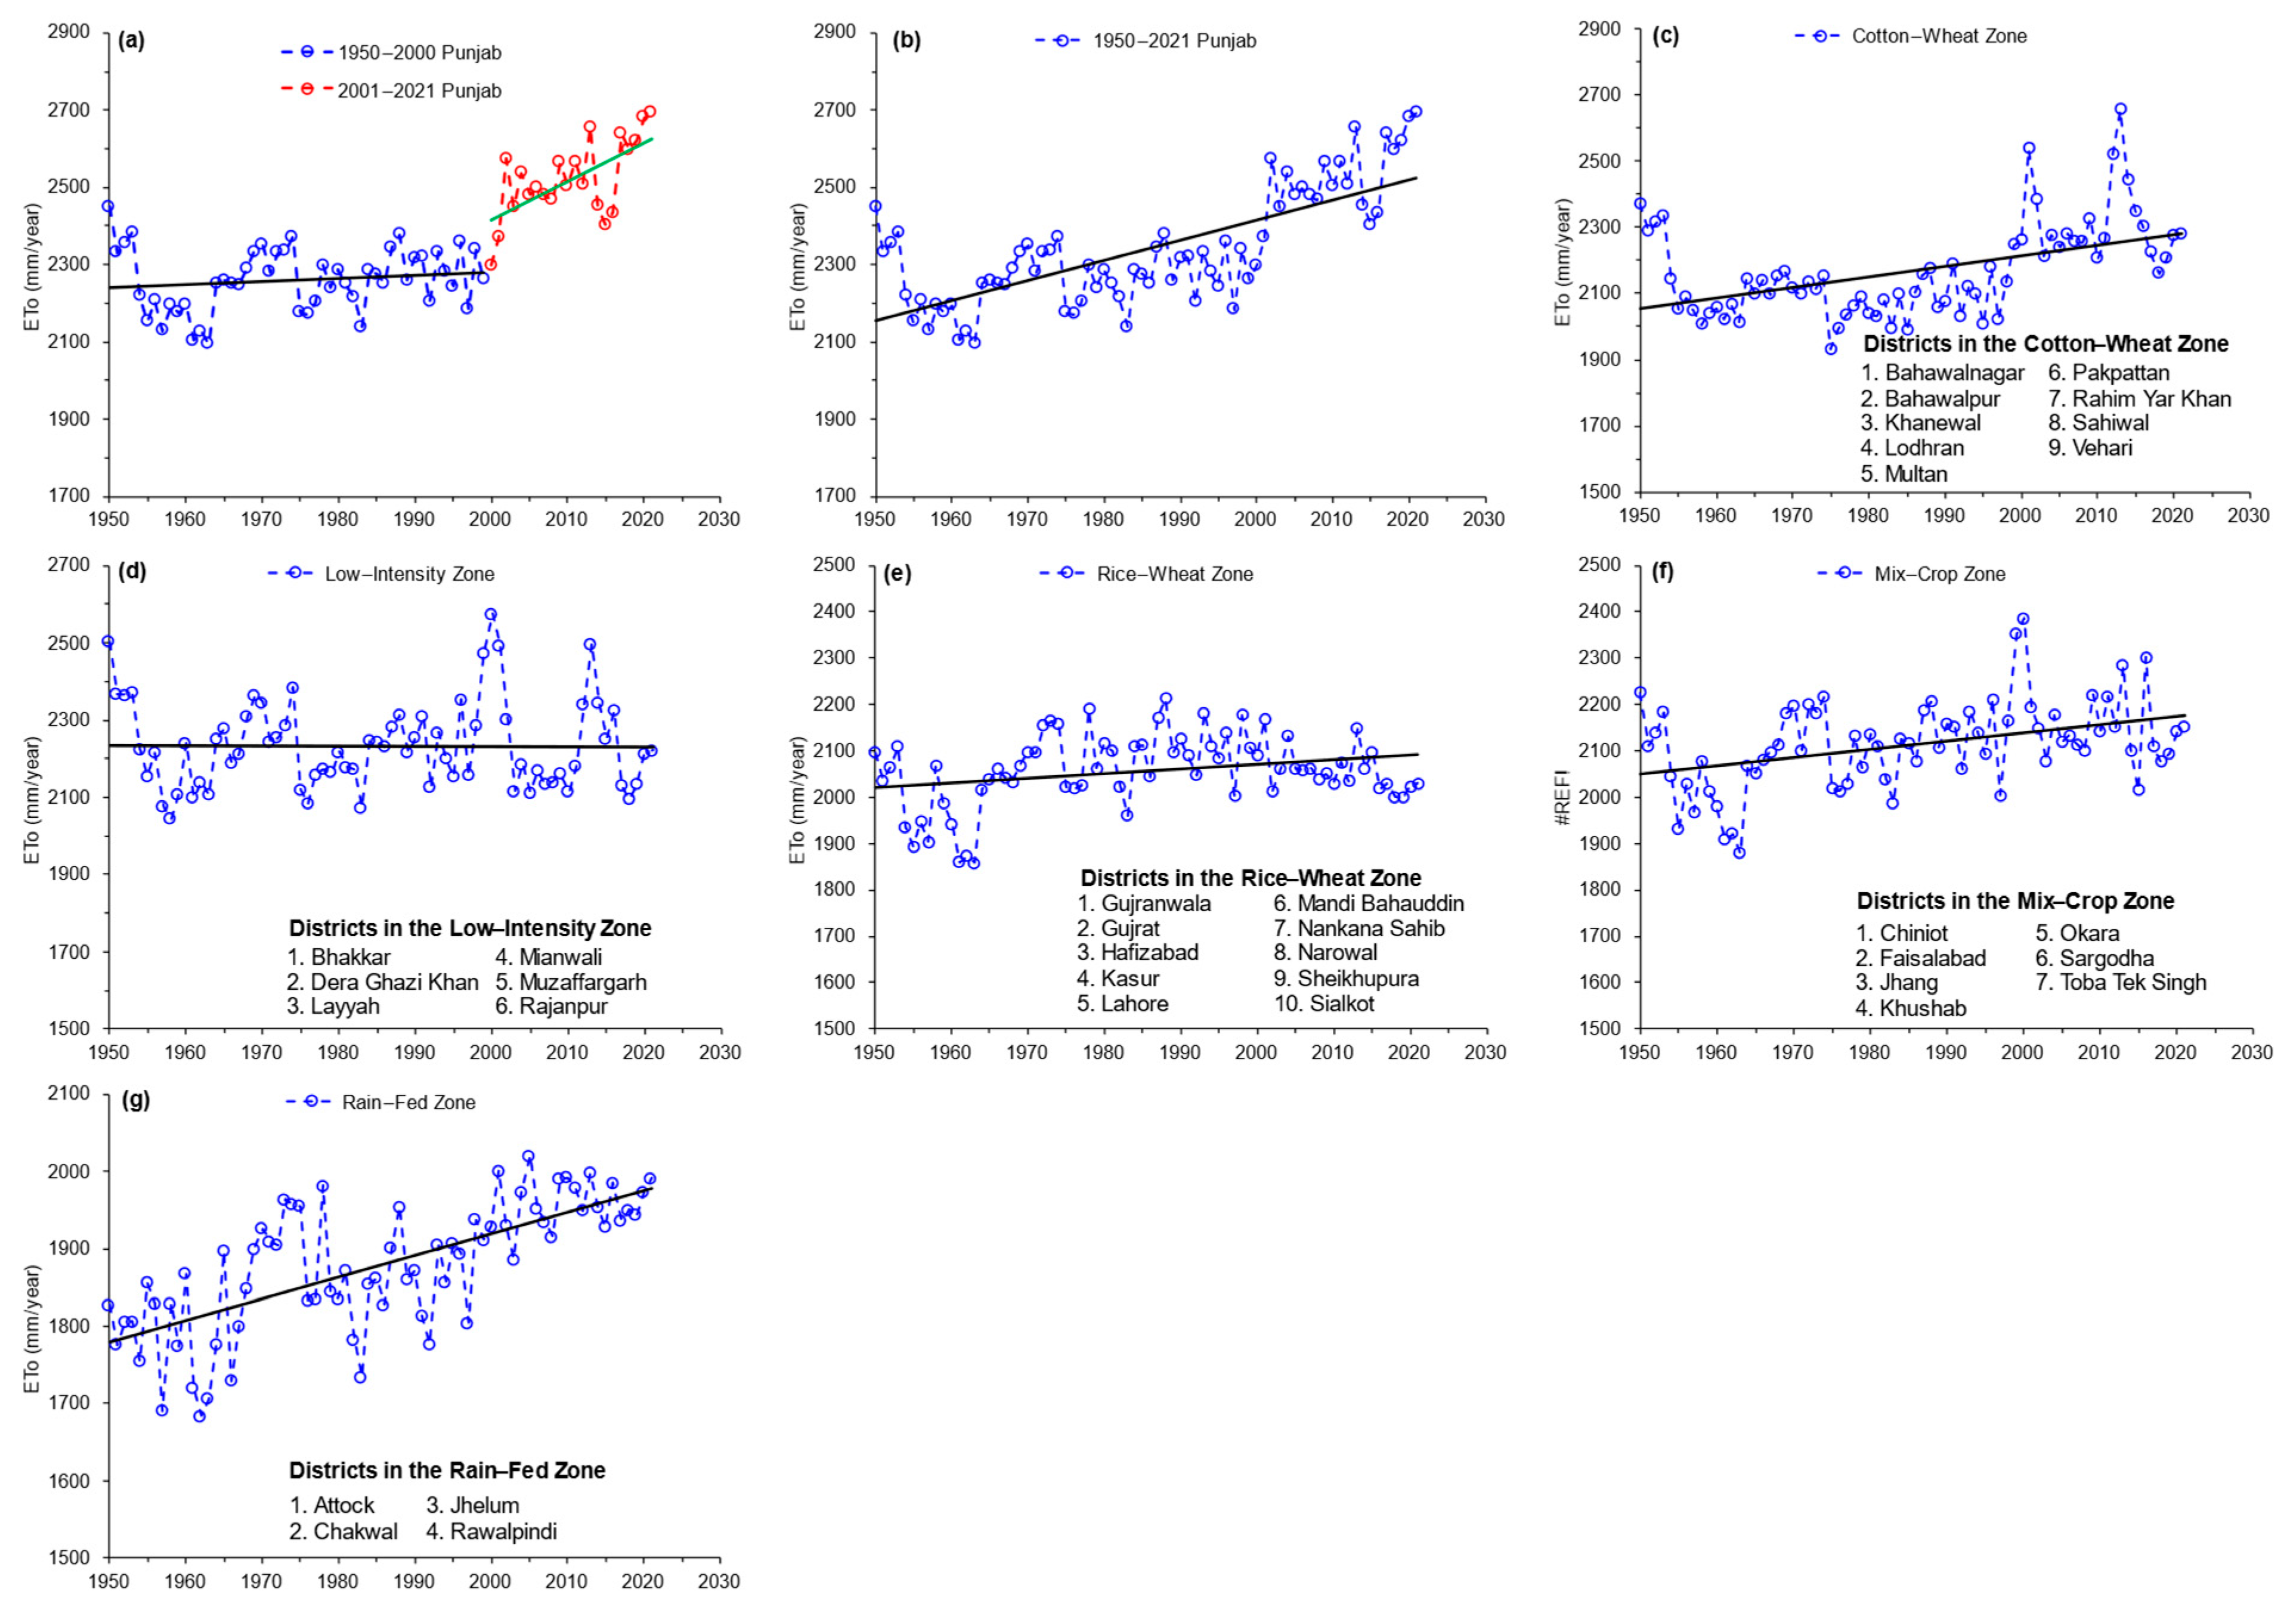
3.1. Trend of ETo
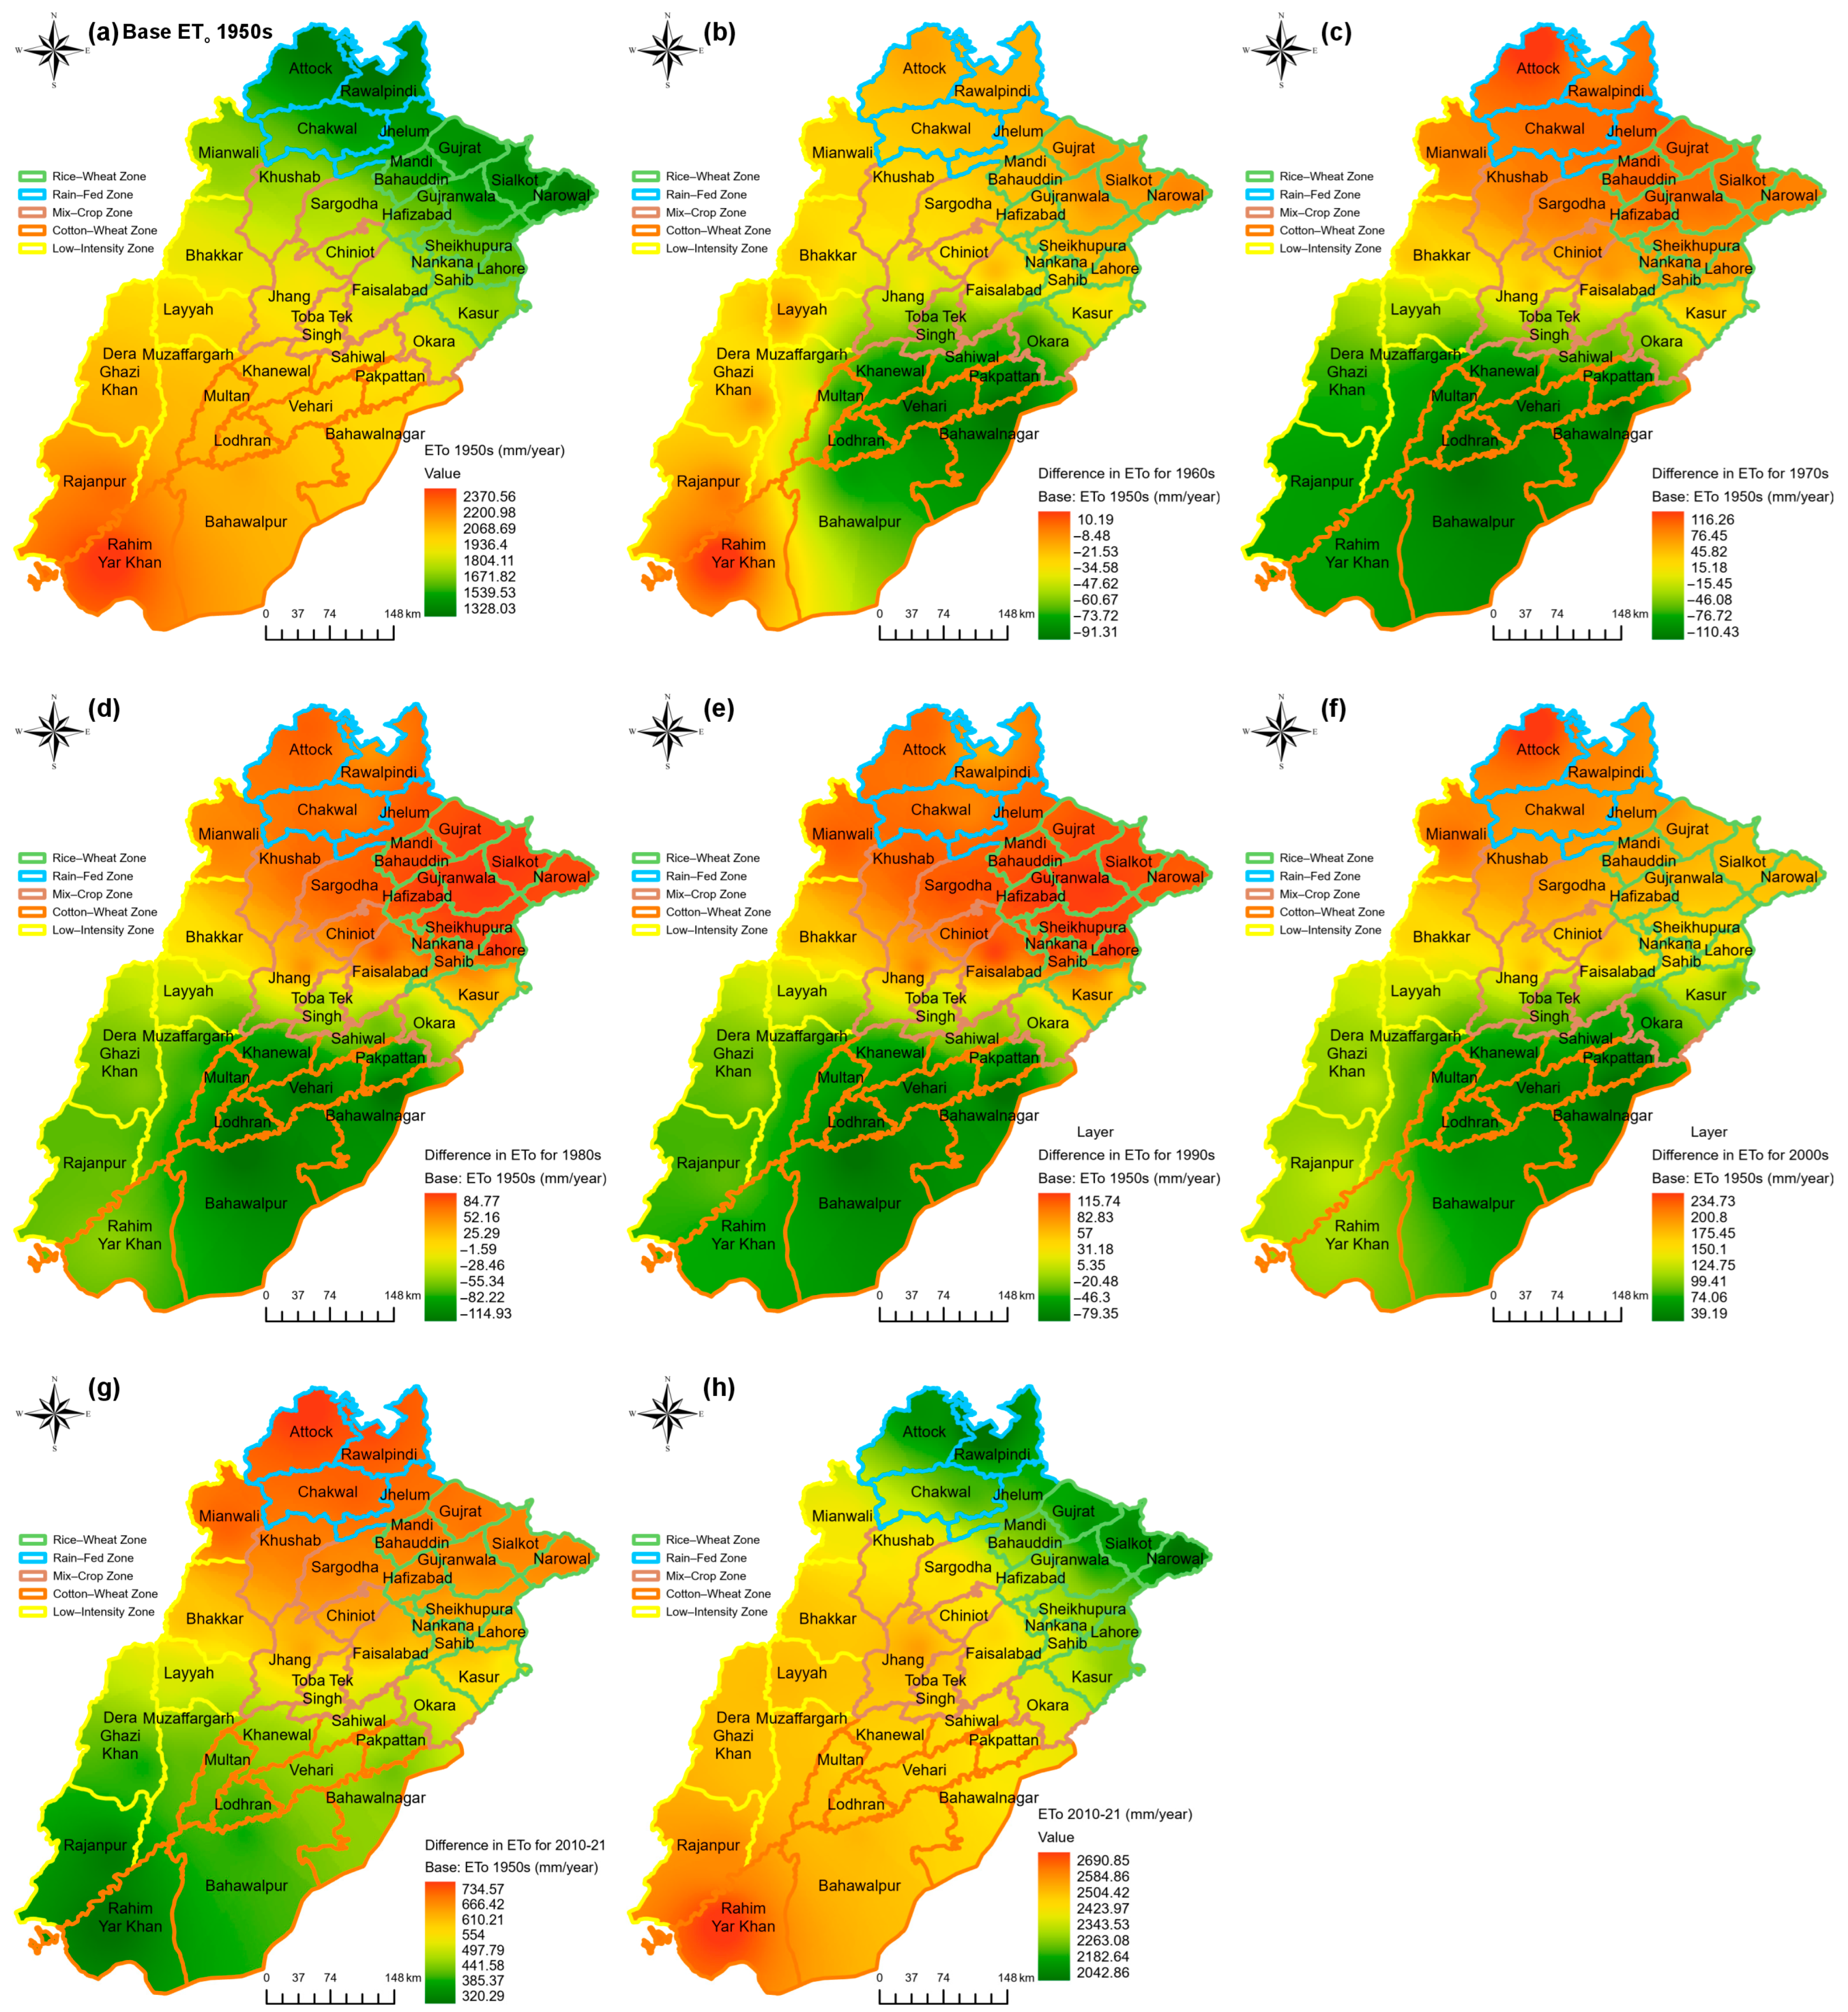
3.2. Decennial ETo
3.3. Sensitivity Analysis
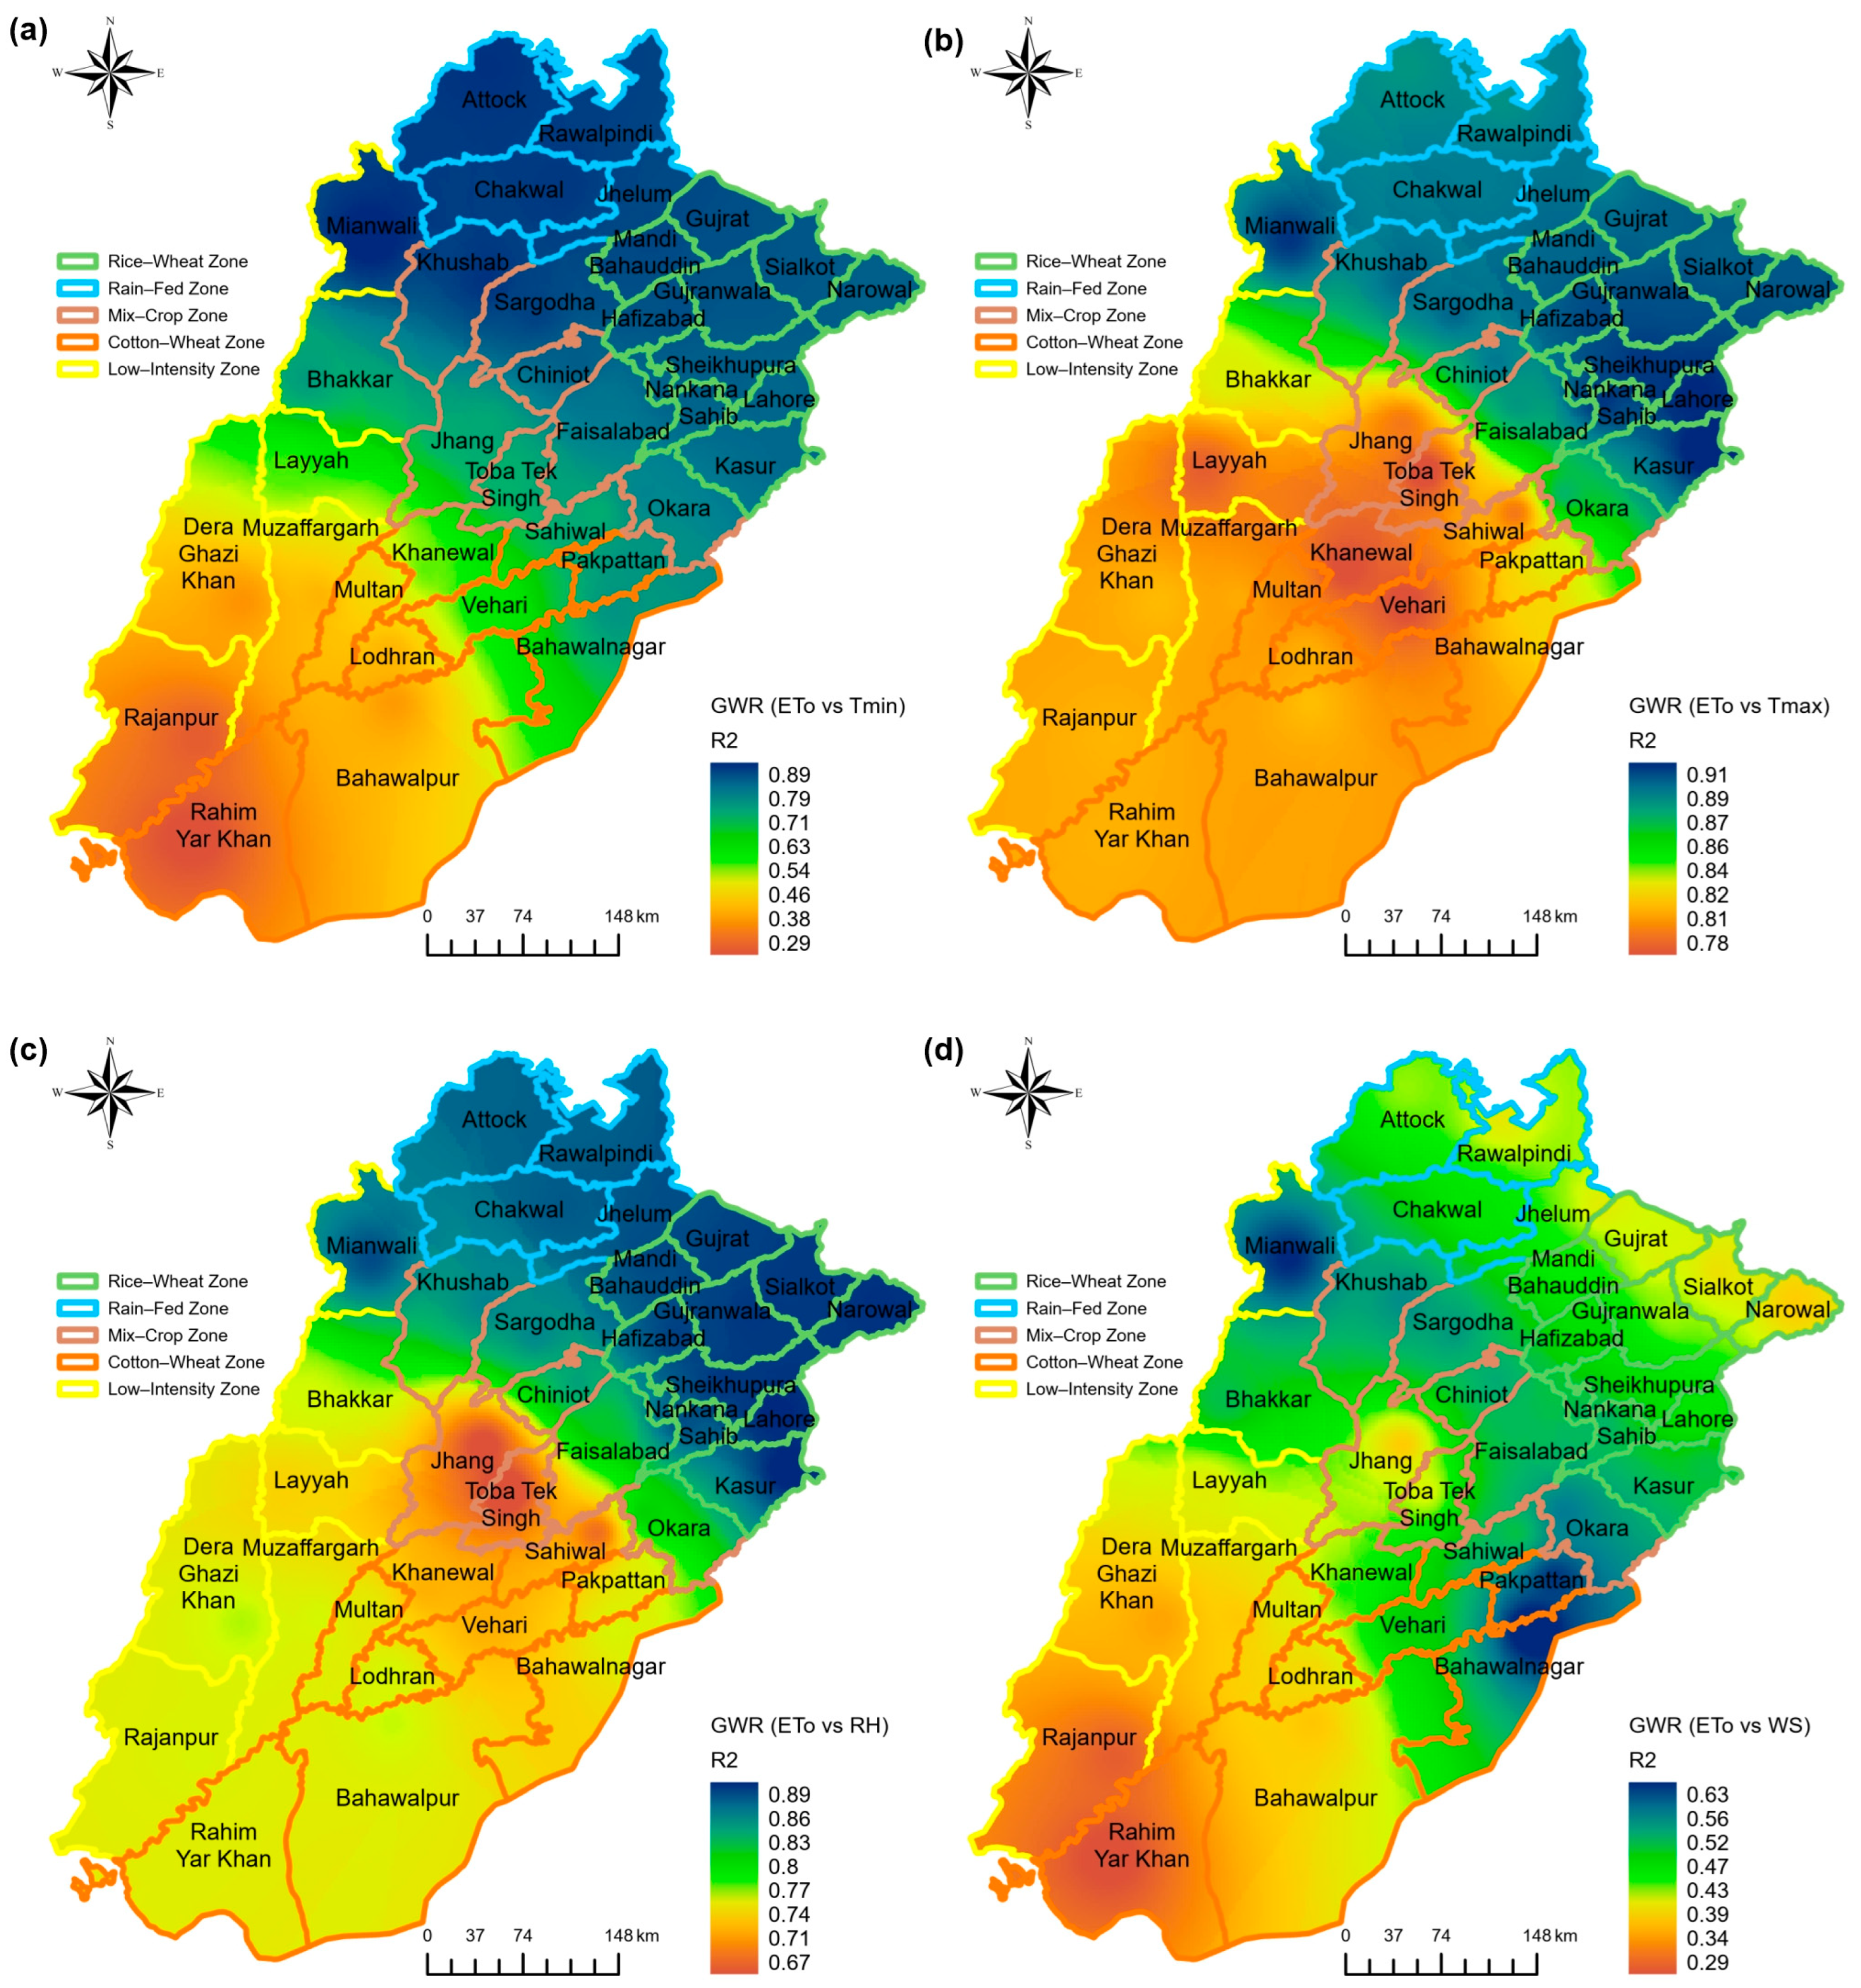
3.3.1. Geographic Weighted Regression (GWR)
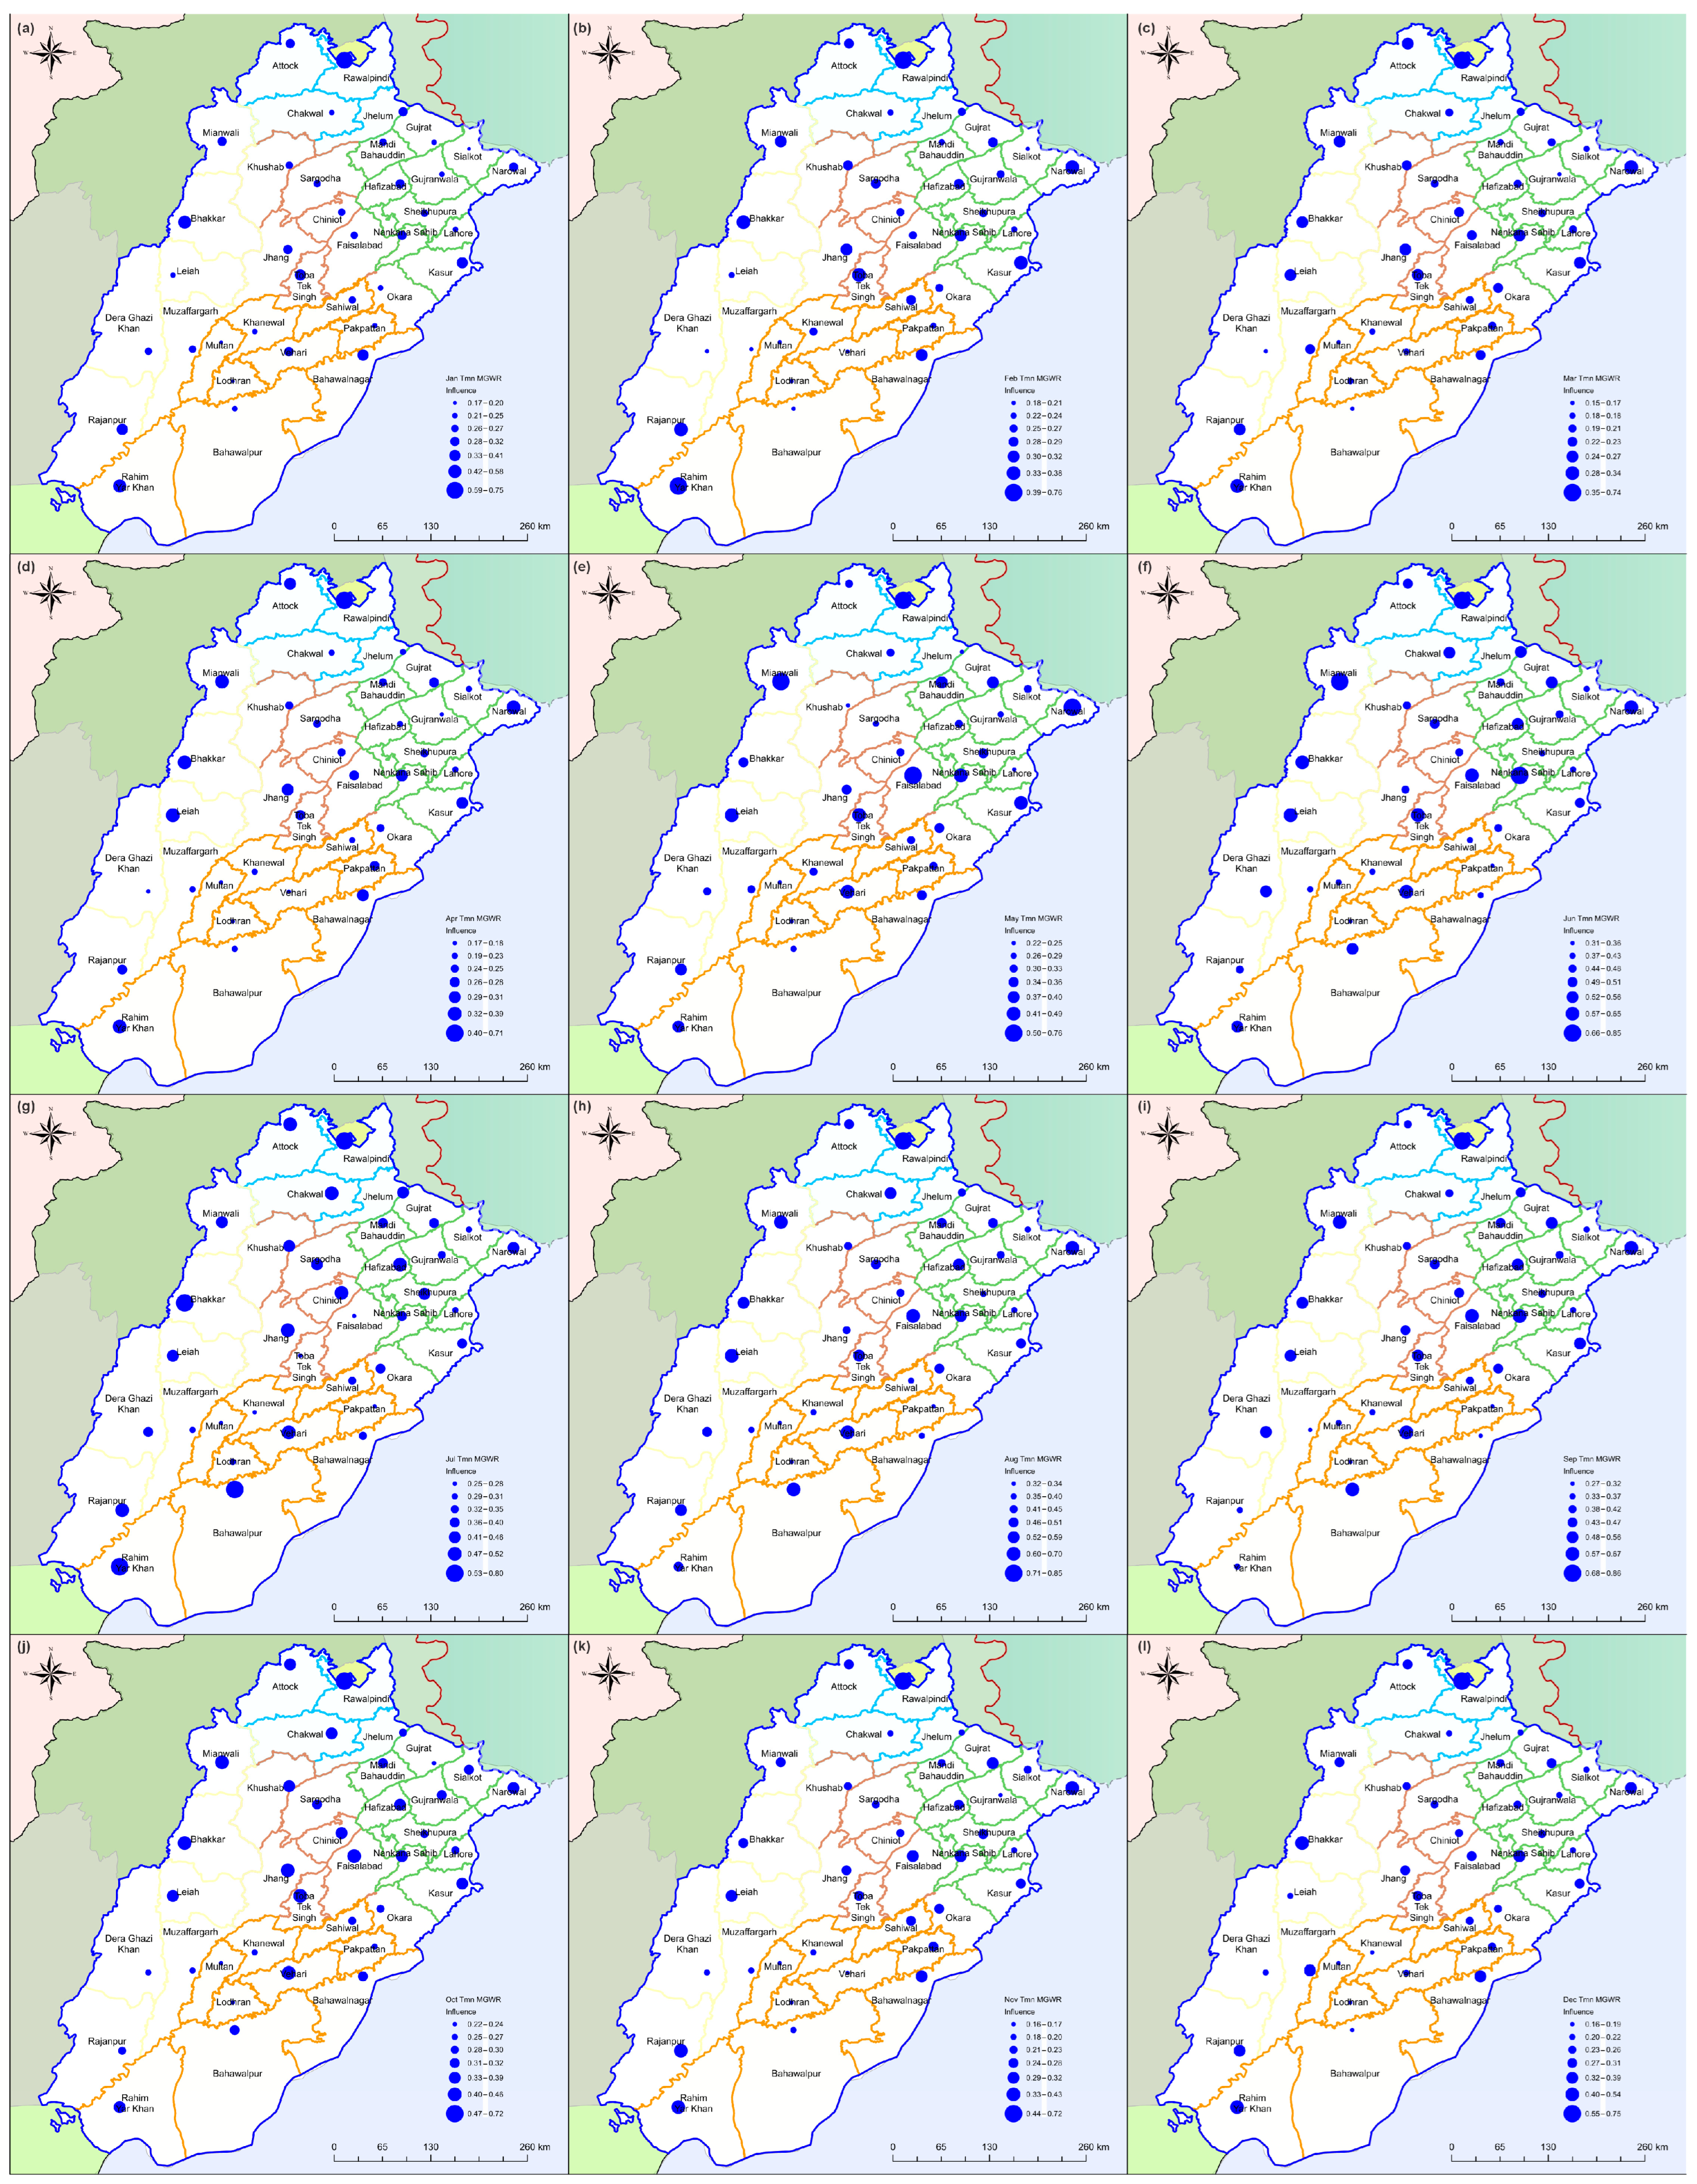
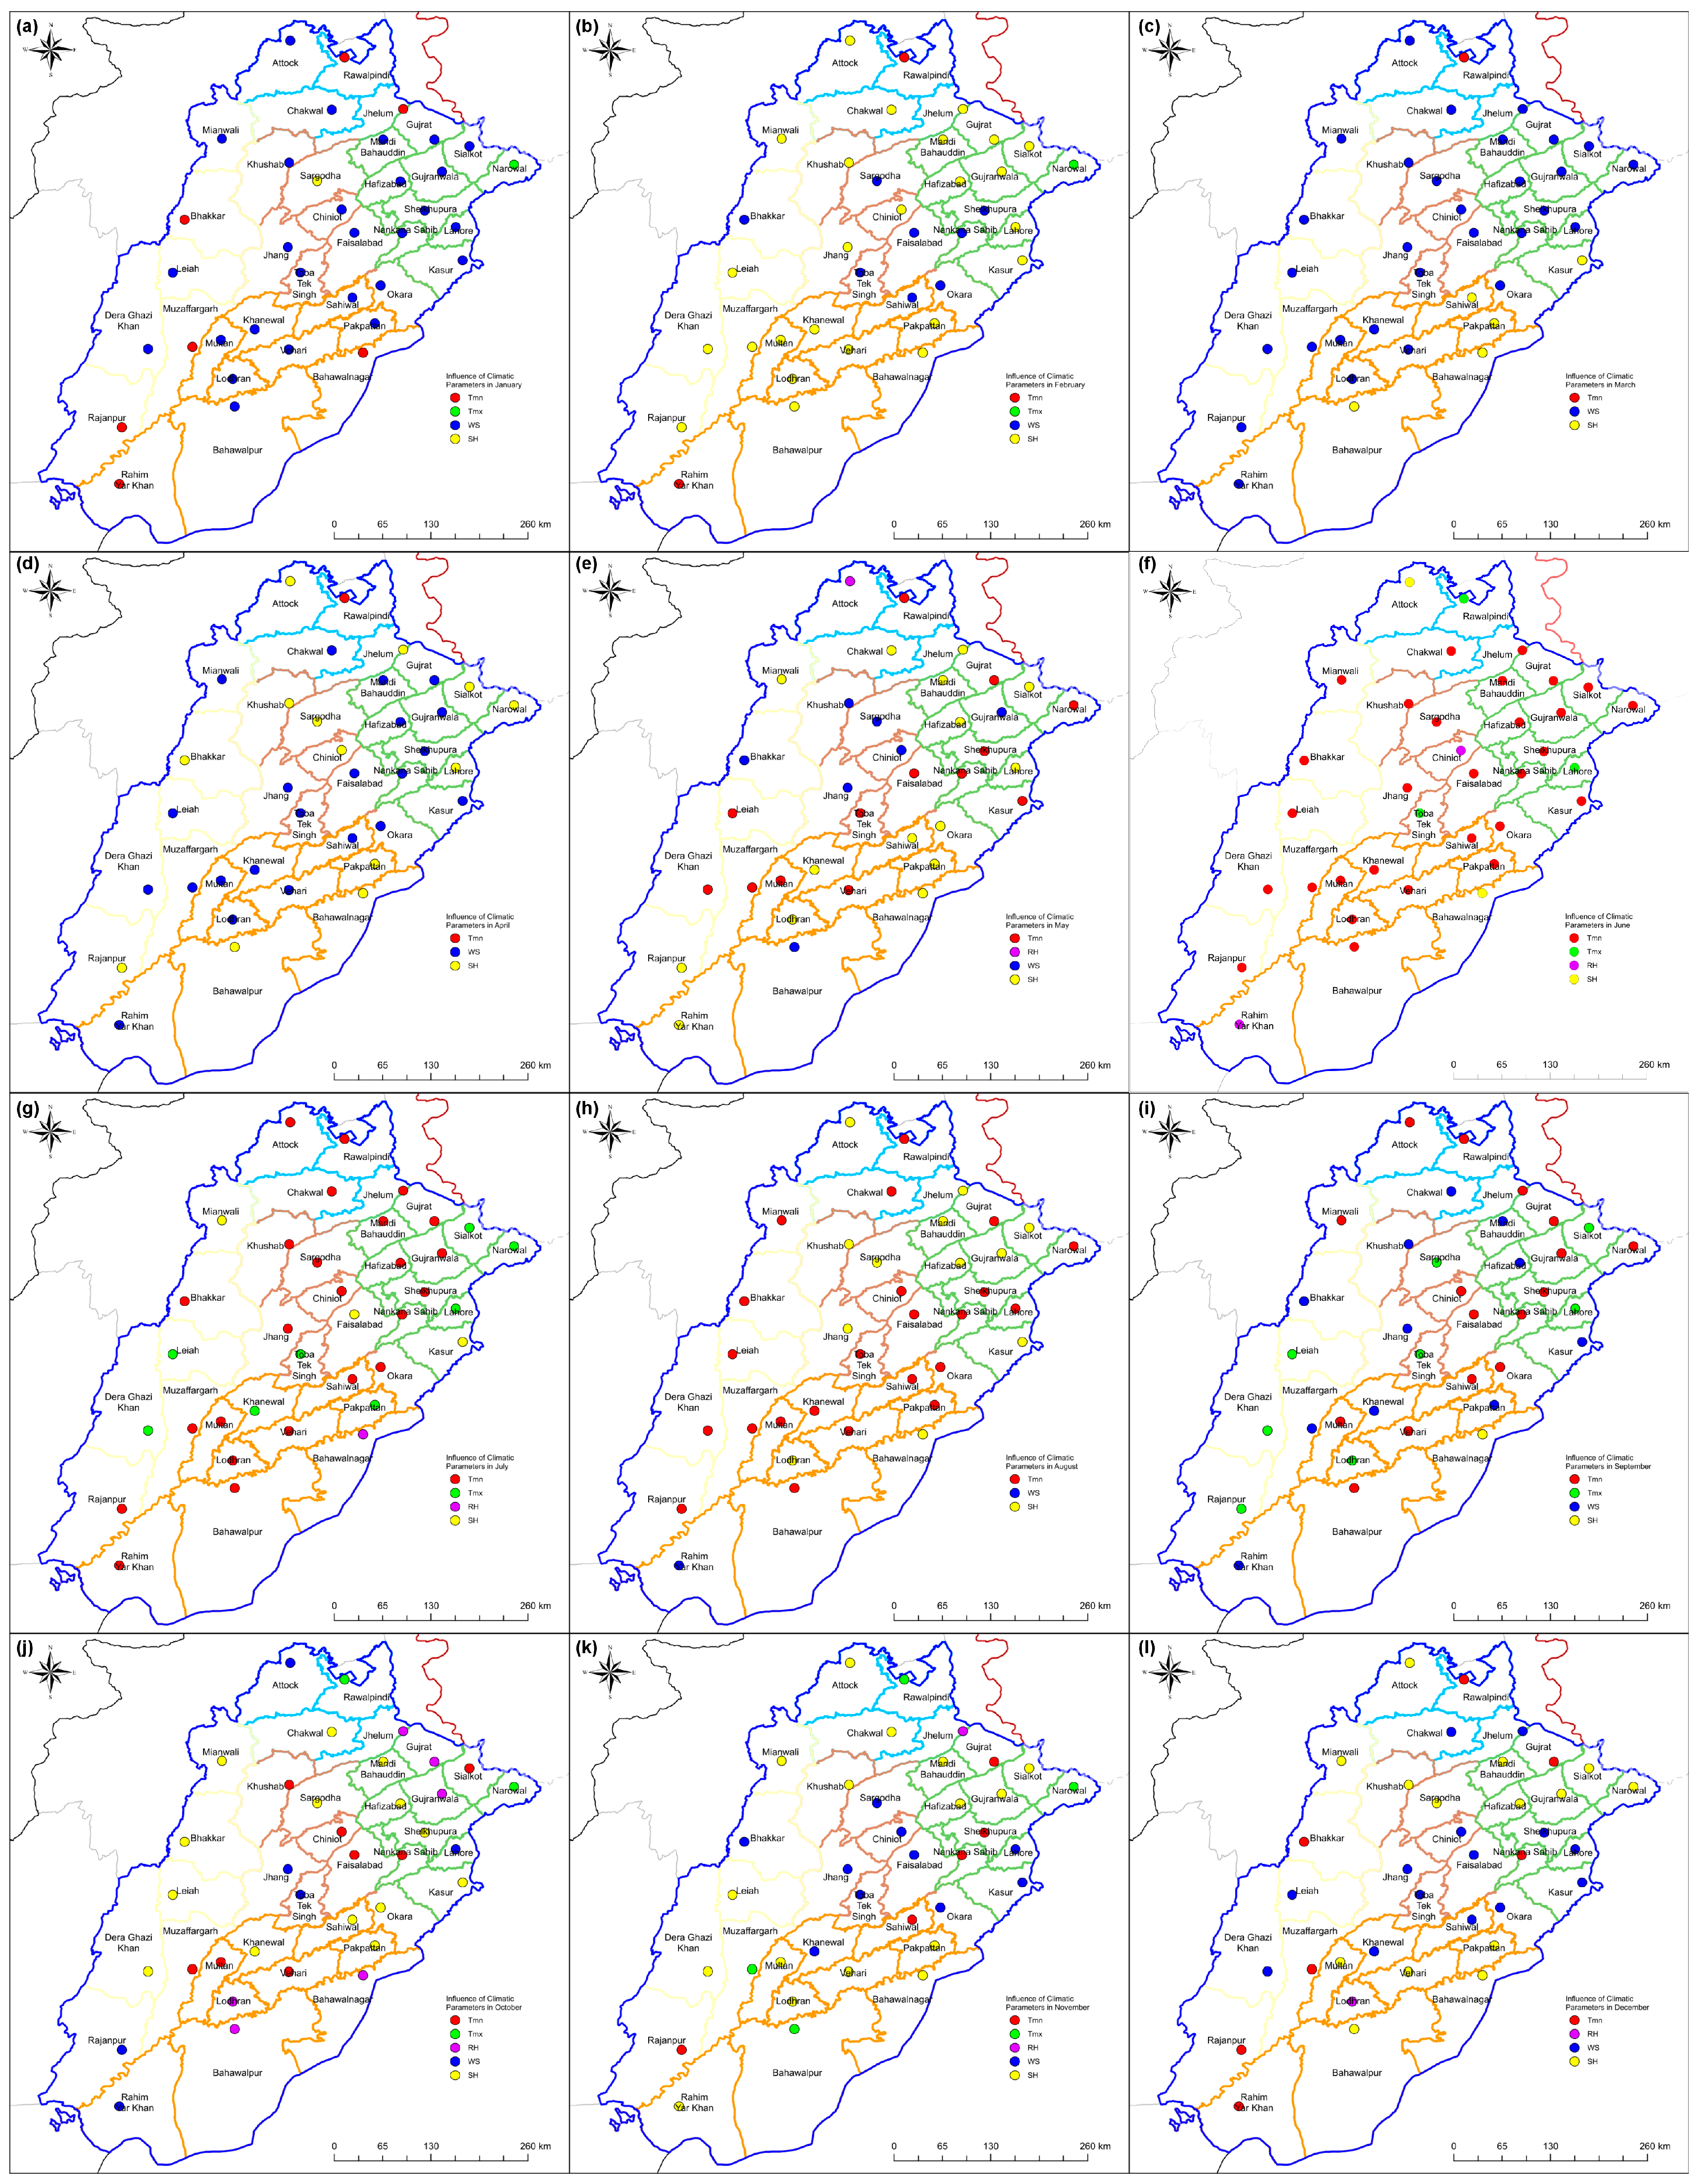
3.3.2. Multiscale Geographic Weighted Regression (MGWR)
4. Discussion
5. Conclusions
Author Contributions
Funding
Institutional Review Board Statement
Informed Consent Statement
Data Availability Statement
Acknowledgments
Conflicts of Interest
References
- Allen, R.G.; Pereira, L.S.; Raes, D.; Smith, M. Crop Evapotranspiration—Guidelines for Computing Crop Water Requirements—FAO Irrigation and Drainage Paper 56; FAO: Rome, Italy, 1998; Volume 300, p. D05109. [Google Scholar]
- Wu, B.; Quan, Q.; Yang, S.; Dong, Y. A social-ecological coupling model for evaluating the human-water relationship in basins within the Budyko framework. J. Hydrol. 2023, 619, 129361. [Google Scholar] [CrossRef]
- Zakir-Hassan, G.; Punthakey, J.F.; Shabir, G.; Yasmeen, F.; Sultan, M.; Ashraf, H.; Sohoo, I.; Majeed, F. Physicochemical Investigation of Rainfall for Managed Aquifer Recharge in Punjab (Pakistan). Water 2022, 14, 2155. [Google Scholar] [CrossRef]
- Zakir, G.; Kahlown, M.A.; Punthakey, J.F.; Shabir, G.; Aziz, M.; Sultan, M.; Ashraf, H.; Majeed, F. Evaluation of hydraulic efficiency of lined irrigation channels—A case study from Punjab, Pakistan. Hydrol. Res. 2023, 54, 523–546. [Google Scholar] [CrossRef]
- Elnmer, A.; Khadr, M.; Kanae, S.; Tawfik, A. Mapping daily and seasonally evapotranspiration using remote sensing techniques over the Nile delta. Agric. Water Manag. 2019, 213, 682–692. [Google Scholar] [CrossRef]
- Karbasi, M.; Jamei, M.; Ali, M.; Malik, A.; Yaseen, Z.M. Forecasting weekly reference evapotranspiration using Auto Encoder Decoder Bidirectional LSTM model hybridized with a Boruta-CatBoost input optimizer. Comput. Electron. Agric. 2022, 198, 107121. [Google Scholar] [CrossRef]
- Malik, A.; Jamei, M.; Ali, M.; Prasad, R.; Karbasi, M.; Yaseen, Z.M. Multi-step daily forecasting of reference evapotranspiration for different climates of India: A modern multivariate complementary technique reinforced with ridge regression feature selection. Agric. Water Manag. 2022, 272, 107812. [Google Scholar] [CrossRef]
- Chen, Z.; Liu, Z.; Yin, L.; Zheng, W. Statistical analysis of regional air temperature characteristics before and after dam construction. Urban Clim. 2022, 41, 101085. [Google Scholar] [CrossRef]
- Muhammad Adnan, R.; Chen, Z.; Yuan, X.; Kisi, O.; El-Shafie, A.; Kuriqi, A.; Ikram, M. Reference Evapotranspiration Modeling Using New Heuristic Methods. Entropy 2020, 22, 547. [Google Scholar] [CrossRef] [PubMed]
- Pei, Y.; Qiu, H.; Zhu, Y.; Wang, J.; Yang, D.; Tang, B.; Wang, F.; Cao, M. Elevation dependence of landslide activity induced by climate change in the eastern Pamirs. Landslides 2023, 20, 1115–1133. [Google Scholar] [CrossRef]
- Huang, S.; Lyu, Y.; Sha, H.; Xiu, L. Seismic performance assessment of unsaturated soil slope in different groundwater levels. Landslides 2021, 18, 2813–2833. [Google Scholar] [CrossRef]
- Li, Q.; Song, D.; Yuan, C.; Nie, W. An image recognition method for the deformation area of open-pit rock slopes under variable rainfall. Measurement 2022, 188, 110544. [Google Scholar] [CrossRef]
- Li, J.; Wang, Z.; Wu, X.; Zscheischler, J.; Guo, S.; Chen, X. A standardized index for assessing sub-monthly compound dry and hot conditions with application in China. Hydrol. Earth Syst. Sci. 2021, 25, 1587–1601. [Google Scholar] [CrossRef]
- Zhou, J.; Wang, L.; Zhong, X.; Yao, T.; Qi, J.; Wang, Y.; Xue, Y. Quantifying the major drivers for the expanding lakes in the interior Tibetan Plateau. Sci. Bull. 2022, 67, 474–478. [Google Scholar] [CrossRef]
- Xie, X.; Huang, L.; Marson, S.M.; Wei, G. Emergency response process for sudden rainstorm and flooding: Scenario deduction and Bayesian network analysis using evidence theory and knowledge meta-theory. Nat. Hazards 2023, 117, 3307–3329. [Google Scholar] [CrossRef]
- Samanta, S.; Pal, D.K.; Lohar, D.; Pal, B. Interpolation of climate variables and temperature modeling. Theor. Appl. Climatol. 2012, 107, 35–45. [Google Scholar] [CrossRef]
- Saeed Shah, S.M.; El-Morshedy, M.; Mansoor, W. Spatial-Temporal Interpolation of Reference Evapotranspiration for Pakistan. Math. Probl. Eng. 2022, 2022, 5488725. [Google Scholar] [CrossRef]
- Fotheringham, A.S.; Brunsdon, C.; Charlton, M. Geographically Weighted Regression: The Analysis of Spatially Varying Relationships; John Wiley & Sons: Hoboken, NJ, USA, 2002. [Google Scholar]
- Muhammad, M.K.I.; Nashwan, M.S.; Shahid, S.; Ismail, T.b.; Song, Y.H.; Chung, E.-S. Evaluation of Empirical Reference Evapotranspiration Models Using Compromise Programming: A Case Study of Peninsular Malaysia. Sustainability 2019, 11, 4267. [Google Scholar] [CrossRef] [Green Version]
- Finance Division, Government of Pakistan. Pakistan Economic Survey 2021-22; Finance Division, Government of Pakistan: Islamabad, Pakistan, 2022; p. 548. [Google Scholar]
- Nagappan, M.; Gopalakrishnan, V.; Alagappan, M. Prediction of reference evapotranspiration for irrigation scheduling using machine learning. Hydrol. Sci. J. 2020, 65, 2669–2677. [Google Scholar] [CrossRef]
- Amjad, R.; Arif, G.M.; Mustafa, U. Does the labor market structure explain differences in poverty in rural Punjab? Lahore J. Econ. 2008, SE, 139–162. [Google Scholar] [CrossRef]
- Pinckney, T.C. The Demand for Public Storage of Wheat in Pakistan; International Food Policy Reseasrch Institute: Washington, DC, USA, 1989; Volume 77. [Google Scholar]
- Zhang, Q.; Kong, D.; Singh, V.P.; Shi, P. Response of vegetation to different time-scales drought across China: Spatiotemporal patterns, causes and implications. Glob. Planet. Chang. 2017, 152, 1–11. [Google Scholar] [CrossRef] [Green Version]
- Kalnay, E.; Kanamitsu, M.; Kistler, R.; Collins, W.; Deaven, D.; Gandin, L.; Iredell, M.; Saha, S.; White, G.; Woollen, J.; et al. The NCEP/NCAR 40-Year Reanalysis Project. Bull. Am. Meteorol. Soc. 1996, 77, 437–472. [Google Scholar] [CrossRef]
- Allen, R. Penman–Monteith Equation. In Encyclopedia of Soils in the Environment; Hillel, D., Ed.; Elsevier: Oxford, UK, 2005; pp. 180–188. [Google Scholar]
- Mann, H.B. Nonparametric Tests Against Trend. Econometrica 1945, 13, 245–259. [Google Scholar] [CrossRef]
- Sen, P.K. Estimates of the Regression Coefficient Based on Kendall’s Tau. J. Am. Stat. Assoc. 1968, 63, 1379–1389. [Google Scholar] [CrossRef]
- Gao, C.; Wang, Z.; Ji, X.; Wang, W.; Wang, Q.; Qing, D. Coupled improvements on hydrodynamics and water quality by flowing water in towns with lakes. Environ. Sci. Pollut. Res. 2023, 30, 46813–46825. [Google Scholar] [CrossRef] [PubMed]
- Ashraf, A.; Ahmed, A.; Mukhtar, A.; Iqbal, M. Changing Pattern of Agroclimate in Pakistan and Measures for Agriculture Sustainability. Pak. J. Meteorol. 2023, 2023, 15. [Google Scholar]
- Zhang, L.; Cui, Y.; Xiang, Z.; Zheng, S.; Traore, S.; Luo, Y. Short-term forecasting of daily crop evapotranspiration using the ‘Kc-ETo’ approach and public weather forecasts. Arch. Agron. Soil Sci. 2018, 64, 903–915. [Google Scholar] [CrossRef]
- Harrell, F.E. Regression Modeling Strategies; Springer Nature Switzerland AG: Cham, Switzerland, 2015; Volume 330, p. 14. [Google Scholar]
- Bois, B.; Pieri, P.; Van Leeuwen, C.; Wald, L.; Huard, F.; Gaudillere, J.P.; Saur, E. Using remotely sensed solar radiation data for reference evapotranspiration estimation at a daily time step. Agric. For. Meteorol. 2008, 148, 619–630. [Google Scholar] [CrossRef] [Green Version]
- Zhang, F.; Geng, M.; Wu, Q.; Liang, Y. Study on the spatial-temporal variation in evapotranspiration in China from 1948 to 2018. Sci. Rep. 2020, 10, 17139. [Google Scholar] [CrossRef]
- Wu, X.; Guo, S.; Qian, S.; Wang, Z.; Lai, C.; Li, J.; Liu, P. Long-range precipitation forecast based on multipole and preceding fluctuations of sea surface temperature. Int. J. Climatol. 2022, 42, 8024–8039. [Google Scholar] [CrossRef]
- Zhu, G.; Liu, Y.; Wang, L.; Sang, L.; Zhao, K.; Zhang, Z.; Lin, X.; Qiu, D. The isotopes of precipitation have climate change signal in arid Central Asia. Glob. Planet. Chang. 2023, 225, 104103. [Google Scholar] [CrossRef]
- Huang, Y.; Bárdossy, A.; Zhang, K. Sensitivity of hydrological models to temporal and spatial resolutions of rainfall data. Hydrol. Earth Syst. Sci. 2019, 23, 2647–2663. [Google Scholar] [CrossRef] [Green Version]
- Hupet, F.; Vanclooster, M. Effect of the sampling frequency of meteorological variables on the estimation of the reference evapotranspiration. J. Hydrol. 2001, 243, 192–204. [Google Scholar] [CrossRef]
- Zhang, L.; Traore, S.; Cui, Y.; Luo, Y.; Zhu, G.; Liu, B.; Fipps, G.; Karthikeyan, R.; Singh, V. Assessment of spatiotemporal variability of reference evapotranspiration and controlling climate factors over decades in China using geospatial techniques. Agric. Water Manag. 2019, 213, 499–511. [Google Scholar] [CrossRef]


| Agroclimatic Zone | Maximum Temperature Tmax (°C) | Minimum Temperature Tmin (°C) | Relative Humidity RH (%) | Sunshine Hours SH (h) | Windspeed WS (m/s) | Reference Evapotranspiration ETo (mm/day) |
|---|---|---|---|---|---|---|
| Cotton–wheat zone | 32.97 | 18.44 | 40.4 | 11.99 | 2.85 | 6.49 |
| Rice–wheat zone | 30.47 | 17.35 | 67.49 | 11.99 | 3.47 | 5.47 |
| Low-intensity zone | 32.35 | 17.86 | 44.99 | 11.99 | 3.29 | 6.52 |
| Mixed-crop zone | 31.8 | 18.02 | 57.37 | 11.99 | 3.62 | 6.15 |
| Rain-fed zone | 28.89 | 15.45 | 74.17 | 12 | 4.04 | 5.03 |
| Dataset Name | Variables | Temporal Extent | Spatial Resolution | Ref. |
|---|---|---|---|---|
| CRU–TS | Tmin, Tmax | 1901–2021 | All land areas (excluding Antarctica) at 0.5° resolution | [24] |
| NCEP–NCAR Reanalysis 1 (Data provided by the NOAA PSL, Boulder, Colorado, USA, from their website at https://psl.noaa.gov (accessed on 28 January 2023)) | RH and WS | 1948–2021 | All land areas (excluding Antarctica) at 2.5° resolution | [25] |
| Sunshine hours (calculated) | SH | – | – | – |
| Variable | Mean | St. Dev. | Minimum | Maximum | Range | Skewness | Kurtosis |
|---|---|---|---|---|---|---|---|
| Tmin (°C) | 17.631 | 0.516 | 16.426 | 18.774 | 2.348 | –0.14 | –0.47 |
| Tmax (°C) | 31.496 | 0.499 | 30.168 | 32.412 | 2.243 | –0.25 | –0.46 |
| RH (%) | 55.747 | 2.529 | 49.407 | 61.944 | 12.537 | –0.33 | 0.02 |
| WS (m/s) | 3.3819 | 0.5137 | 2.3519 | 4.3133 | 1.9615 | –0.32 | –1.19 |
| ETo (mm/year) | 2339.7 | 149.1 | 2094.1 | 2691.3 | 597.1 | 0.63 | –0.34 |
| Agroclimatic Zone | ETo (mm/year) per Decade | ETo Trend (mm/year) | ||||||
|---|---|---|---|---|---|---|---|---|
| 1950–1950 | 1960–1969 | 1970–1979 | 1980–1989 | 1990–1999 | 2000–2009 | 2010–2021 | 1950–2021 | |
| Low-intensity zone | 2243 | 2230 | 2221 | 2220 | 2287 | 2227 | 2237 |  |
| Cotton–wheat zone | 2157 | 2096 | 2068 | 2072 | 2123 | 2293 | 2323 |  |
| Rice–wheat zone | 1999 | 1990 | 2100 | 2097 | 2105 | 2070 | 2046 |  |
| Rain-fed zone | 1801 | 1805 | 1904 | 1850 | 1873 | 1956 | 1965 |  |
| Mixed-crop zone | 2064 | 2044 | 2117 | 2114 | 2173 | 2164 | 2149 |  |
Disclaimer/Publisher’s Note: The statements, opinions and data contained in all publications are solely those of the individual author(s) and contributor(s) and not of MDPI and/or the editor(s). MDPI and/or the editor(s) disclaim responsibility for any injury to people or property resulting from any ideas, methods, instructions or products referred to in the content. |
© 2023 by the authors. Licensee MDPI, Basel, Switzerland. This article is an open access article distributed under the terms and conditions of the Creative Commons Attribution (CC BY) license (https://creativecommons.org/licenses/by/4.0/).
Share and Cite
Ashraf, H.; Qamar, S.; Riaz, N.; Shamshiri, R.R.; Sultan, M.; Khalid, B.; Ibrahim, S.M.; Imran, M.; Khan, M.U. Spatiotemporal Estimation of Reference Evapotranspiration for Agricultural Applications in Punjab, Pakistan. Agriculture 2023, 13, 1388. https://0-doi-org.brum.beds.ac.uk/10.3390/agriculture13071388
Ashraf H, Qamar S, Riaz N, Shamshiri RR, Sultan M, Khalid B, Ibrahim SM, Imran M, Khan MU. Spatiotemporal Estimation of Reference Evapotranspiration for Agricultural Applications in Punjab, Pakistan. Agriculture. 2023; 13(7):1388. https://0-doi-org.brum.beds.ac.uk/10.3390/agriculture13071388
Chicago/Turabian StyleAshraf, Hadeed, Saliha Qamar, Nadia Riaz, Redmond R. Shamshiri, Muhammad Sultan, Bareerah Khalid, Sobhy M. Ibrahim, Muhammad Imran, and Muhammad Usman Khan. 2023. "Spatiotemporal Estimation of Reference Evapotranspiration for Agricultural Applications in Punjab, Pakistan" Agriculture 13, no. 7: 1388. https://0-doi-org.brum.beds.ac.uk/10.3390/agriculture13071388