Article

Assessment of Potential Land Suitability for Tea (Camellia sinensis (L.) O. Kuntze) in Sri Lanka Using a GIS-Based Multi-Criteria Approach

by
Sadeeka Layomi Jayasinghe
1,2,*,
Lalit Kumar
1 and
Janaki Sandamali
3
1
School of Environmental and Rural Science, University of New England, Armidale, NSW 2351, Australia
2
Department of Export Agriculture, Faculty of Animal Science and Export Agriculture, Uva Wellassa University, Passara Road, Badulla 90000, Sri Lanka
3
Department of oceanography and marine geology, Faculty of Fisheries and Marine Sciences & Technology, University of Ruhuna, Matara 81000, Sri Lanka
*
Author to whom correspondence should be addressed.
Submission received: 6 May 2019 / Revised: 28 June 2019 / Accepted: 5 July 2019 / Published: 8 July 2019

Abstract

:
The potential land suitability assessment for tea is a crucial step in determining the environmental limits of sustainable tea production. The aim of this study was to assess land suitability to determine suitable agricultural land for tea crops in Sri Lanka. Climatic, topographical and soil factors assumed to influence land use were assembled and the weights of their respective contributions to land suitability for tea were assessed using the Analytical Hierarchical Process (AHP) and the Decision-Making Trail and Evaluation Laboratory (DEMATEL) model. Subsequently, all the factors were integrated to generate the potential land suitability map. The results showed that the largest part of the land in Sri Lanka was occupied by low suitability class (42.1%) and 28.5% registered an unsuitable land cover. Furthermore, 12.4% was moderately suitable, 13.9% was highly suitable and 2.5% was very highly suitable for tea cultivation. The highest proportion of “very highly suitable” areas were recorded in the Nuwara Eliya District, which accounted for 29.50% of the highest category. The model validation results showed that 92.46% of the combined “highly suitable” and “very highly suitable” modelled classes are actual current tea-growing areas, showing the overall robustness of this model and the weightings applied. This result is significant in that it provides effective approaches to enhance land-use efficiency and better management of tea production.

Graphical Abstract

1. Introduction

Land evaluation is a foundation for sustainable land resource planning, management and finding optimum land use for each defined land unit [1]. Land cover is the biophysical features of land and the land use refers to the socio-economic functions of land to meet human needs [2,3]. Appropriate land use decisions are vital to achieving optimum land productivity and ensuring environmental sustainability. This requires an effective management of land information on which such decisions should be based [4]. The Food and Agricultural Organization [5,6] recommended a land suitability assessment approach for crops in terms of suitability ratings ranging from very highly suitable to unsuitable based on climatic and terrain data, as well as soil properties. Land suitability evaluation according to FAO standards has been applied in many parts of the world, particularly in the developing countries.
The planting of tea in Sri Lanka has been carried out since 1860 and it has become the mainstay of the island’s economy [7]. Of the agricultural land, 40% is used for plantation agriculture—of which 28% is used for tea cultivation [8]. The major constraints of the tea sector in Sri Lanka are the limited area of suitable terrain, which keep land prices high and the average estate size small, and labor shortage [9]. Thus, the selection of land according to its suitability has become increasingly important in making the best use of available land for tea cultivation. Farmers establish tea based on prior knowledge and experience, without the availability of scientific information and validation. So, farmers definitely consider site suitability but using a different set of information. This adversely impacts on tea production and, in the long run, would exacerbate the existing economic, social, and environmental problems related to the tea sector.
Further, land use activity contributes to climate change and the impact of climate and natural disasters has increased in recent decades due to improper land use in Sri Lanka [10]. Tea cultivation in Sri Lanka is clearly vulnerable to climate change and extreme events, and this has resulted in some of the existing tea land area becoming unsustainable for tea cultivation and, by contrast, existing marginal land has been morphed into cultivated land [11]. Other ramifications of climate change are receiving longer dry seasons, uneven rainfall distribution, and erosion of top soil caused by uncharacteristic heavy rainfall patterns, which can lead to negative effects on production. In addition, crop-weed competition, the spread of pests and diseases, drought damage, soil losses and infertility in tea fields fostering the increased use of fertilizers to maintain the soil fertility, resulting in an increase in the cost of production and posing a threat to the tea industry [12,13]. Commercial tea growing in Sri Lanka, limited to a few areas, is at risk due to climate change and its subsequent fallouts. Consequently, the expected production in response to the demand may not be as easy as in the earlier days under given potential constraints on the availability of suitable tea lands [14].
This situation has also aggravated the current status of tea cultivation in Sri Lanka through construction and other human activities and, correspondingly, there is a great risk of a lower return on investment in tea cultivation [15]. For example, forest areas and tea lands in hilly areas have been converted for human settlement and the cultivation of annual crops, which has resulted in soil erosion, soil infertility, landslides and floods. The National Building Research Organization (2015) identified that seven tea-growing districts of Sri Lanka (i.e., Badulla, Nuwara Eliya, Kegalle, Ratnapura, Kandy, Matale and Kalutara) are subjected to severe landslides that demarcate nearly 12,000 km2 (21%) of the total area of Sri Lanka. Therefore, the extent of the major tea producing area is apparently threatened and not sustainable to produce a high quantity of tea to cater for global demand. Moreover, land use policies in Sri Lanka are not designed to ensure that economies of scale in production and cropping and that farming systems are sustainable in the long run [16]. Also, the productivity of fertile lands has been reduced due to improper land use [10] and this can lead to the mismanagement of natural resources and degradation of the environment with other socio-economic conflicts [17].
Under the current economic trends and the nature of commercialization, tea planters and related companies are more interested in converting the estate bungalows into tourist hotels, cutting down trees in the estates for timber, extracting granite and other mineral resources and selling the land at the end [18]. The public railed against some multipurpose development projects especially implemented in hilly areas (i.e., the irrigation project of Uma oya) for wreaking unsafe levels of environmental damage and thus thousands of acres of tea lands are becoming unusable or less suitable for tea growing [19]. Hence the responsible authorities should shoulder the responsibility to take initiatives to only make use of the unproductive tea lands for the above-mentioned activities, leaving the suitable lands for the long-term sustainability of tea cultivation. Approximately 80% of the population concentrated in the tea plantation sector are Tamil people who immigrated to Sri Lanka from South India during the British colonial era in the 19th century. Most of the workers in the tea estates reside within the estate area itself and work as laborers. The clusters of the labor lines are strategically located in different parts of the tea estate to enable quick labor deployment and to protect the boundary of the tea plantations. But with the increase of population in communities attached to the tea industry, tea plantation workers demand land for constructing their own settlements and fight for their rights for lands as they have no choice [20]. Sometimes they establish their settlements illegally in tea lands, clearing the existing tea cultivation and adjacent forest areas. Thus, it is obvious that immediate steps must be taken to form a national policy and strategy on these circumstances by giving special reference to the land management practices in tea plantations.
In conjunction with the above circumstances, the existing tea-growing areas in Sri Lanka that were identified in the early 1940s may not be suitable for tea anymore or some other areas may have suitable conditions to grow tea. The total land area under tea cultivation was estimated to be approximately 221,969 hectares in 2016 [12], but the area under tea has decreased by 10% from 1946 to 1982 [8]. Based on the figures given by Food and Agriculture Organization (FAO) Statistical Databases [13], we estimate that the tea cultivation area decreased by 2.6% from 1961 to 2016 while other tea producing countries substantially increased their cultivation extent. The land area for tea cultivation in Sri Lanka has not increased compared to other tea producing countries like Kenya, China and India, which creates difficulties in competing in the international market in the future [14]. Therefore, urgent attention has to be drawn to implement proper land use planning and to work on suitability analysis for tea in order to upgrade the productivity and to avoid land use-related problems in tea cultivation [21].
In the global context, a number of studies have been undertaken to assess the land suitability assessment for tea crops. In Kenya, a land use assessment was done for tea, particularly in Kirinyage region using the MaxEnt Species Distribution Model [17], quantitative and economic land suitability has been assessed for tea in Gulian province in Iran using the Square root and the Storie methods [18], and the land suitability assessment was conducted in the Kabarole District of Western Uganda for tea and food crops using a model built in Automated Land Evaluation System (ALES) software by means of decision trees [19]. A comprehensive suitability evaluation was carried out by Bo, Zhang [22] for tea in Southern China using the Geographic Information System (GIS) and modified land ecological suitability evaluation model, providing the scientific basis and reference for the rational distribution of the tea crops, while Gahlod, Binjola [20] carried out an evaluation for tea, cardamom and rubber cultivations in Kerala, making use of environmental and variety of soil physio-chemical parameters. These types of studies provide information on the constraints and opportunities for the use of the land and therefore guide in decision making on optimal utilization of land resources [23].
The present land use pattern in Sri Lanka is a legacy of the land policy of the colonial past, where export-based commercial plantations like tea were superimposed on a traditional subsistence farming system. Today, the tea industry is considered as one of the largest agro-based industries in Sri Lanka and the land suitability assessment will help to achieve maximum sustained production. Until recently, many decisions on land use matters in Sri Lanka were taken on an ad hoc basis, using the local knowledge and intuition of the officers concerned. An inadequate number of studies have been conducted to enable informed decisions on the proper utilization of lands for tea plantation in Sri Lanka, and they have not taken the factors of topography, soil, climate and management into account. The first such attempt was made by Panabokke [24], who identified the main regions for tea and rubber. This gave a general assessment of the land suitability for tea, but no criteria of suitability were given [25]. Jayathilaka, Soni [26] generated crop suitability maps for tea, amalgamating yield maps and climatic factors maps using the Analytic Hierarchy Process (AHP) in multi-criteria analysis under two times frames of 1980–1992 and 1993–2007. The selected study area only covers five agro-ecological zones (AEZs) between the coordinates of 6° and 7°30’N latitude and 79°50’ to 81°E longitude. They only considered climate parameters such as temperature, rainfall, relative humidity and evapotranspiration with yield factors whereas our study addresses climatic as well as topographical and soil parameters in order to study the suitability of land for tea. Land Utilization Committee and Tea Commission of Sri Lanka conducted a comprehensive assessment of the unsuitability of tea plantation lands and the feasibility of rehabilitation and diversification in 1968 considering available data for slope, rockiness, soil depth, drainage, soil erosion, nutrition status, rainfall and temperature. A case study was undertaken to classify and to map the tea-growing areas in Ratnapura District [27], but climatic factors were not taken into consideration for this study.
Also, land use planning for tea by individual site assessment using the traditional method is subjective and a time-consuming procedure [27,28]. Although a few studies have been undertaken [25,29,30] to map the suitability of lands for tea cultivation, they did not cover the entire tea-growing region of the country. In the given context, no initiative has yet been taken by the Sri Lankan Tea Research Institute to classify land or existing tea-growing areas to varying degrees of suitability.
It is usually difficult to make a detailed and precise analysis because of the inappropriate understanding of evaluation factors and weights in practice [31]. The availability of GIS and Multi-Criteria Decision Analysis (MCDM) methods allows the combination of knowledge from different sources to support land use planning and management [32,33]. The most commonly used MCDM are the AHP, weighted linear combination, ordered weighted averaging, ELECTRE, DEMATEL, PROMETHEE, VIKOR and multiple-objective land allocation [34,35]. The AHP has advantages over conventional multi-attribute utility methods, consisting of the hierarchical breakdown of the particular decision problem and the use of subjective and verbal expressions to determine the relative importance of the criteria [35]. The main drawbacks of the AHP indicated by literature are potential internal inconsistency and the dubious theoretical base of the rigid 1–9 scale, together with the possibility of rank reversal following the introduction of a new alternative [36,37]. Also, the AHP is incapable of finding the interdependence between criteria which does not address the influences and effects that each of them has on other factors. The DEMATEL method is generally used to establish interactive relationships among criteria [38,39,40]. In addition, this allows to estimate both the importance of criteria and shows the causal relations of factors [41]. This method was originally developed by the Science and Human Affairs Program of the Battelle Memorial Institute of Geneva between 1972 and 1976 [42]. DEMATEL technique has been used in a broad spectrum of fields because of its capacity to handle complex relationships between components of a system [43].
Compared with other MCDMs, the DEMATEL method has many advantages such as it effectively analyzes both direct and indirect effects among different criteria, understands the cause and effect relationships in the decision-making problem, is able to visualize the interrelationships between factors via a causal diagram, and enables the decision maker to clearly understand which factors have mutual influences on one another. The DEMATEL method can be used not only to determine the ranking of alternatives, but also to find out critical evaluation criteria and measure the weights of evaluation criteria [42]. Although the AHP can be implemented to rank alternatives and determine criteria weights, it assumes the criteria are autonomous and their interactions and dependencies are not considered. The DEMATEL technique also has some drawbacks compared to other techniques of MCDMs. It determines the ranking of alternatives based on interdependent interactions between them, but other criteria are not included in the issue of decision-making. It cannot take into account the aspiration level of alternatives or obtain partial ranking orders of alternatives. Therefore, DEMATEL has been incorporated with other MCDM techniques to combine other necessary characteristics in many previous studies [43]. A combined AHP–DEMATEL technique has been used approximately the globe in many land suitability assessments [44,45,46,47].
The land suitability assessment for tea is important for identifying the potential areas for maximizing the production and to suggest ameliorating measures for better crop management [20]. The suitability analysis allows recognizing marginal suitable areas which facilitate decision makers to identify limiting factors and enable them to formulate appropriate management decisions (i.e., new planting, replanting, infilling, diversification, and adopting climate-friendly best practices) for increasing the productivity of the land. An exhaustive study needs to be carried out to determine appropriate land use in the unproductive estates giving due consideration to other factors. Also, this allows stakeholders to identify new areas where tea can be planted in accordance with the requirements of the tea crops, emphasizing the qualities of the land unit. Hence, matching crop requirements with available resources through land suitability analysis has become an urgent need to sustain agricultural land productivity in Sri Lanka.
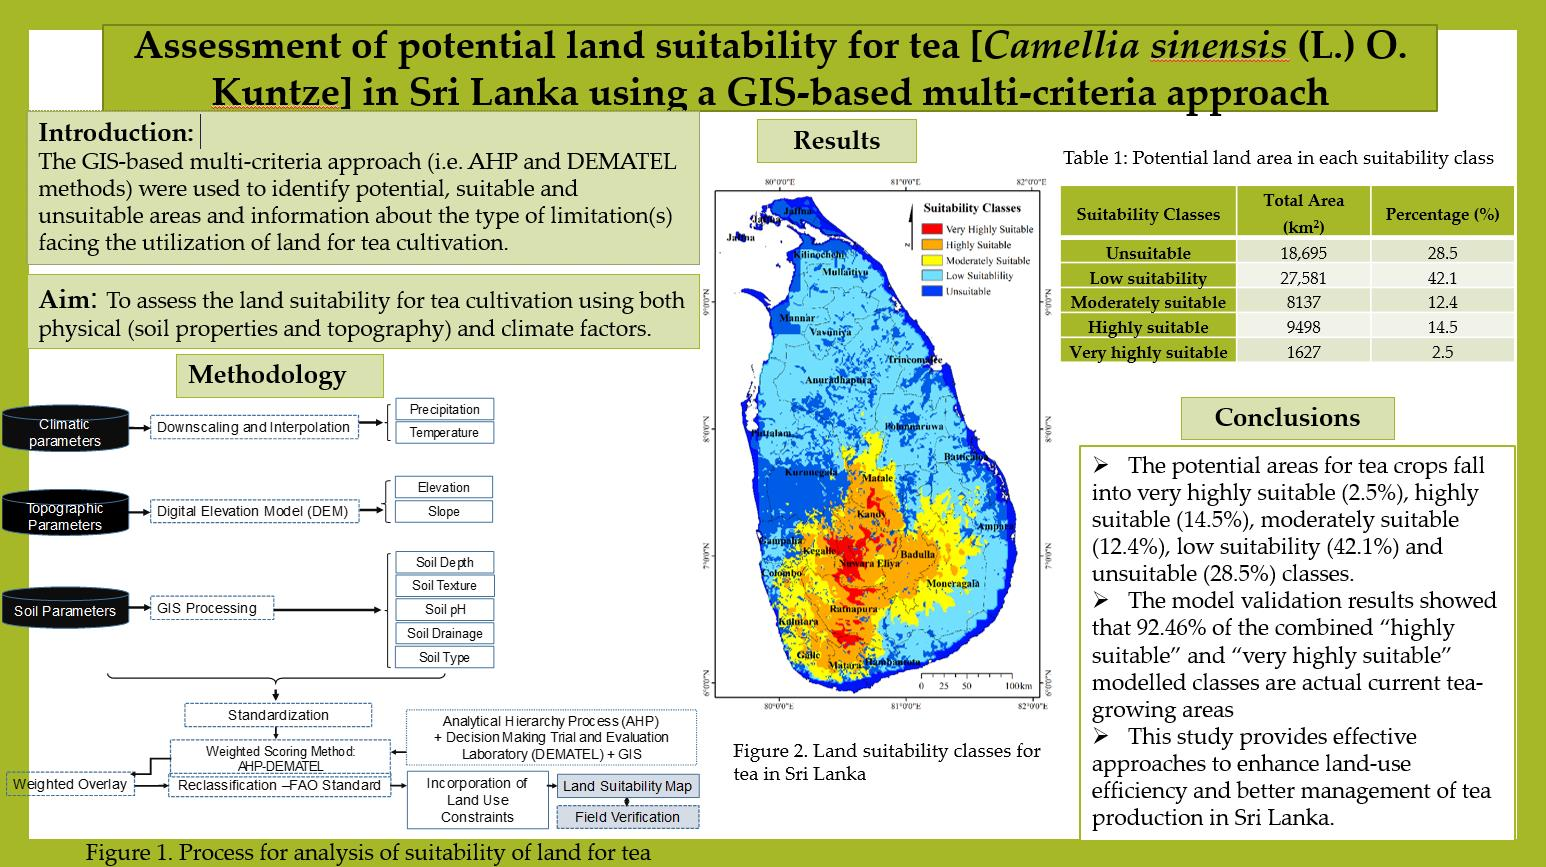
The previous sections show that no comprehensive study has been undertaken in Sri Lanka to look at land suitability for tea cultivation using both physical (soil properties and topography) and climate factors. This shows the need for the rationalization of land use, where the available land should be selected according to the crop requirements and it has become enormously important in making the best use of the land available in Sri Lanka for tea cultivation. Therefore, in this study, an attempt has been made to assess the land suitability for tea in order to ensure the long-term progression in the tea sector towards a sustainable tea production. The geographical information system-based multi-criteria approach was used to identify potential, suitable and unsuitable areas and information about the type of limitation (s) facing the utilization of the land for tea cultivation. The research value and novelty of this study is the simultaneous utilization of the AHP and DEMATEL methods to assess the land suitability for tea crops.

2. Methodology

2.1. Data Sources and General Methodology

2.1.1. Study Area and Climate

The whole of Sri Lanka was considered as the study area. Attention has to be drawn in particular to the effect of rainfall and temperature as they are considered as delimiting and significant factors upon land use in Sri Lanka. The mean monthly temperature range is 25–30 °C in coastal areas and 15–18 °C in the highlands. The Southwest and Northeast monsoons play a major role in annual rainfall in Sri Lanka, which ranges from 900 to 5000 mm per year [48].
Red-yellow podzolic soils (leached lateritic soils) can be found in the Wet Zone and reddish brown earth (nonlateritic loamy soils) is present in the Dry Zone. Reddish brown latosolic soils (partially laterized soils) or immature brown loams (clayey loams) are available in Central Hills. Alluvials occur along the lower courses of rivers and the regosols (sandy soils) occur in the coastal tracts [28].
Guidelines given by Food and Agriculture Organization [5] were used to conduct the land assessment process. Topographic, soil and climatic factors were used to evaluate the suitability of land for tea. Nine criteria were used for land suitability classification for tea crops in Sri Lanka. These were selected based on existing literature and views of local experts. These criteria were basically soil factors (soil type, pH, depth, texture, drainage (permeability)), variables related to topography (slope, elevation and land use) and climatic factors (rainfall and temperature). The existing land use map was used to identify areas with physical limitations for tea cultivation and this allowed us to distinguish potential areas that link ranges and threshold values for other relevant characteristics (i.e., climatic, soil and terrain requirements) to tea crop suitability ratings. The summary of steps used in the land suitability assessment is presented in Figure 1.
The above set of layers were prepared to assess the suitability of the land for tea cultivation in Sri Lanka. The layers were combined using GIS-based MCDA [32]. This involved five main steps: (1) data acquisition, (2) defining crop requirements for tea in relation to the selected criteria (Table 1), (3) the reclassification of criterion maps using Spatial Analyst Reclassify tool, (4) the weighting of criteria according to importance using the pairwise comparison method using the Analytic Hierarchy Process (AHP) and DEMATEL method, and (5) the standardized criterion maps are combined/aggregated by means of the weighted overlay technique and vector overlay analysis.

2.1.2. Crop Requirements and Classification Procedure

Suitability ratings were established according to FAO [49] classification on the appropriateness of land for defined uses in five different suitability classes defining very highly suitable, highly suitable, moderately suitable, low and unsuitable conditions. Table 1 shows the extent to which a particular factor influences the growth of tea crops directly or indirectly.
The most critical environmental factors for tea are temperature and rainfall as tea growth and productivity are mainly controlled by water availability and temperature [26,50,51,52]. The tea plant requires a minimum rainfall of 1200 mm per year, but 2500–3000 mm per year is considered optimum [53]. The distribution of rainfall is very important in countries with rain-fed tea production systems, such as Kenya, Sri Lanka and India. Rainfall in Sri Lanka consists of monsoonal, convectional and expressional rainfall. Among them, monsoons play a major role in the share of the annual rainfall [54]. The mean annual rainfall is less than 900 mm in the south-eastern and north-western (driest) parts of the island, and it is over 5000 mm in the western slopes and the central highlands. However, since the distribution of rainfall throughout the year is distinctly bi-modal due to the seasonality of the monsoons, some areas experience a continuous dry period of approximately 2–3 months [55]. In addition, tea-growing areas are expanding rapidly and a large proportion of this expansion is taking place in areas where the main limitation is soil moisture. Hence, the water deficit is and will continue to be a major limiting factor in tea production [56].
The growth of the tea plant is highly affected by temperature ranges. Tea yield is sensitive to increased average monthly temperatures, and sustained periods of higher temperatures reduce tea yield. Tea grows well within an air temperature (Ta) range of approximately 19–23 °C. Air temperatures below 13 °C and above 30 °C have been found to reduce shoot growth [52,57]. Most of the country’s central region (i.e., Nuwara Eliya, Badulla, Kandy) has the best temperature for growing tea.
Tea is also grown across a range of elevations, from sea level up to approximately 2200 m above sea level (a.s.m.l). The elevations at which tea grows greatly affects the quality and quantity of tea [53,58]. The difficult climatic conditions found at these extreme altitudes are highly favorable for the development of aromas, as the cold nights and misty peaks slow the growth of the tea plant, resulting in a higher concentration of aromatic oils and richer flavors. The elevation above 2000 m is considered to be moderate areas of suitability, as it involves infrastructure and other practical problems in plucking tea. In addition to that, as the elevation increases above 2000 m, the air gets colder, the soil gets harder and the land gradient makes less rainwater available. These factors inevitably reduce tea crop yield. Low-lying areas ranging from 0 to100 m are considered inappropriate for tea because they flood much more frequently in the rainy seasons [59] and are unfavorable for growth of tea.
The main effect of the slope aspect on surface runoff and erosion is due to differences in the microclimate [60]. Also, Khormali, Ayoubi [60] found that the slope position had a significant impact on soil properties such as soil moisture, clay content, total N, calcium carbonate content and exchangeable Mg. The land with a slope of between 15–25° is considered as very highly suitable class while gentle slope (>5–7°) is regarded as highly suitable for tea. The class of “very steep slope” (more than 35°) is considered as unsuitable for tea. More flatlands and steeper slopes are advisable to be avoided because steeper slopes provide a major risk of soil erosion and landslide while flatlands will increase water-logging conditions, which is undesirable for tea growth [61].
The variety of soil types on which tea is cultivated successfully makes it very difficult to fit the soils into a general classification. This is further complicated by the various descriptive terms and systems used around the world in soil classification. We classified soil into five major classes based on its suitability for tea, according to the literature [28,62]. The Red Yellow Podzolic soils (Ultisol in the U.S. Soil Taxonomy) dominate existing tea lands in Sri Lanka at an altitude of more than 600 a.m.s.l. This soil occurs in a variety of landforms such as undulating, plains, rolling lands, dissected rolling plains, hills with moderately steep slopes, ridge and valley formations, high massive hills, and also steep slopes (i.e., central highlands). Reddish brown latolic soils (partially laterated soils) or immature brown loams (clayey loams) are also suitable for tea growth [28].
Tea is grown in soils that differ from country to country, with soil pH being the most important feature. The pH requirement for the growth of tea is in the range of 4.5–5.5 [20,63]. The optimum soil conditions recommended for tea growth include a well-drained, deep and well-aerated soil with more than 2% organic matter [64]. Other characteristics have to be considered for economic tea production, including field slope, soil gravel percentage in the top 50 cm of the soil layer and rockiness. Soil depths of less than 50 cm, soil gravel of more than 50% in top 50 cm of the soil layer and a rockiness of 20% negatively affect tea growth. Tea plants growing in shallow and compacted soils are likely to suffer from drought and waterlogging during the rainy months [65]. Due to the unavailability of data, organic matter, rockiness and soil gravity were not taken into account in the land suitability assessment.

2.2. Criteria Layers Creation

The vector-formatted world soil data were downloaded from [email protected] (accessed on 13 November 2018) and then clipped to the Sri Lanka border. Vector files were then converted to raster layers with 30-m cell resolution. Attribute tables were created including pH (5 pH classes), soil type (5 classes where 1 is highly suitable for tea and 5 is not suitable for tea cultivation), texture (1 organic, 2 heavy, 3 medium and 5 light and there is no marginal class, as only 4 classes were available) and depth (5 depth classes).
The 30-m digital elevation data (DEM) were obtained from the global multi-resolution terrain elevation data 2010 (http://lta.cr.usgs.gov/GMTED2010; accessed on 13 November 2018). Slope raster of the study area was derived from the elevation data (both in degrees) using ARC GIS version 10.4.1 [66]. Elevation layer was classified into five classes with regard to the production performance of existing tea cultivation areas, expert advice and previous studies [67]. The slope was also classified into five classes based on tea-growing ability (See Table 1 and Figure 2).
Raster maps for temperature and rainfall were downloaded from WorldClim (1950–2000) (http://www.worldclim.org/; accessed on 13 November 2018). Maps for mean temperature for 12 months were downloaded and annual precipitation was computed. Mean monthly temperature was calculated using the raster calculator and then final maps were clipped and two climate rasters were reclassified according to five classes of suitability as defined in Table 1 and Figure 2.
Land use map 2007 was obtained from the Department of Agriculture, Sri Lanka, and it was used to produce the final land suitability map for tea crops. All raster layers used in this study were projected into the Kandawela Sri Lankan national projection system. All data layers were at 30-m spatial resolution prior to being used in modelling or overlaying to extract statistics.

2.3. Determination of Weights

As mentioned in the introduction section, a number of methods exist for the determination of weights for the criteria. In this study, we used the Analytical Hierarchical Process (AHP) and the Decision-Making Trail and Evaluation Laboratory (DEMATEL) methods to calculate the weights. Each of these methods has strengths and weaknesses, and utilizing two methods is expected to give more balanced results.

2.3.1. The Analytic Hierarchy Process (AHP)

Weights were allocated for each criterion using the Analytical Hierarchy Process (AHP) introduced by Saaty [72]. The AHP uses a fundamental measurement of 9 points to express individual preferences or judgments [72] and creates a matrix of pairwise comparisons (Table 2). A value of 1 expresses "equal importance" and a value of 9 is given over another factor for those factors which have "extreme importance" (Table 2).
The weight for each factor was calculated through a pairwise comparison matrix and the maximum eigenvalues (λmax) of normalized matrix were computed. The consistency index (CI) was estimated using the formula: CI= (λmax-n)/(n-1) [73]. The random consistency index (RCI) (Table 3) was used to determine the degree of consistency or consistency ratio (CR) (i.e., CI/RCI). If the CR value is less than or equal to 0.1, the inconsistency is acceptable, or the pair-wise comparison may be revised [74]. Accordingly, weights were assigned relevant to the importance of criteria for tea based on expert ideas and literature [75].

2.3.2. Decision-Making Trial and Evaluation Laboratory (DEMATEL)

The DEMATEL method was used to deal with the importance and causal relationships among the criteria, and to recognize the influential criteria of the land suitability assessment for tea. In this research, the software of MATLAB and Excel 2013 were used to estimate six major measures in the DEMATEL technique. First, three respondents were asked to assess the direct influence between any two criteria. The measurement criteria of 0, 1, 2, 3, and 4 were used to illustrate no influence, very low influence, low influence, high influence and very high influence, respectively [76]. Secondly, the direct-influence matrix was constructed based upon the degrees of relative impact derived from the pair comparisons Equation (1). An initial direct-influence matrix (A) with the directly observed relations was obtained where aij denotes the degree of impact of the i factor on the j factor [40]. As the third step, the normalized matrix was obtained from Equations (2) and (3) where all the matrix diagonals are equal to zero and the sum of each row and column does not exceed 1. Then, the full relationship matrix (T) was derived from Equation (4). The significance and relationship indicators were estimated summing each column and row using Equations (5) and (6).
A = [ a 11 a 1 j a 1 n a i 1 a i j a i n a n 1 a n j a n n ]
X = s . A
s = m i n [ 1 m a x i j = 1 n | a i j | , 1 m a x i i = 1 n | a i j | ]
T = X + X 2 + X k = T = X ( 1 X ) 1
D = ( j = 1 n T i j ) = [ d i ] n X 1
R = ( i = 1 n T i j ) = [ r j ] 1 X n
Here, di is the sum of each row in T and the rows show the degrees of direct and indirect impact over the other criteria, and rj is the sum of each column in T where columns indicate the degrees of influence from the other criteria. Numeric algorithm variable di, therefore, represents the factors that influence the others, rj represents the factors that are influenced by others, di + rj represents the strength of relationships between factors, dirj represents the strength of influences among factors [43]. Subsequently, a threshold value to ignore the minor effects is necessary to isolate the relationship structure of the factors and finally to obtain causal diagram [77]. The threshold value helps in distinguishing some important and unimportant criteria. Only the values greater than the threshold value were highlighted and selected for illustrating the causal diagram.

2.4. Aggregating Criterion Weights and Standardized Criterion Maps

The land adaptation map for tea was created using the "weighted overlay" spatial analysis tool in Arc GIS by assigning a given weight to each criterion. Each raster was assigned a percentage influence depending on its importance as defined by the average weights of the AHP–DEMATEL analysis (Table 10). The weight is a relative percentage, and the sum of the percentage influence weights must add up to 100. Each cell value was multiplied by its percentage influence and then added to create the output raster.
The formula used to calculate land unit’s suitability index was as follows Equation (7);
S i = X i × W i
where, Xi = values of each criterion, Wi = weight values of each criterion, and Si = suitability index
As the final step, the constraint criteria were taken into account. The existing land use map of Sri Lanka was used to assess the condition of restrictions on land use for tea growing. The evaluation of land use classes was based on factors affecting the cultivation of tea. Therefore, the existing land use classes were classified in which "1" was for possible appropriate land use classes for tea such as existing tea-growing areas, crop lands, etc., and "0" was where tea could not be grown (i.e., urban, rock, bare lands, open water, wet lands, paddy, roads, etc.). A raster map was then developed. The newly developed land use restriction map was overlaid with the rasterized suitability map.

2.5. Validation of the Results

The validation method used here concerned whether the selected crop had already been produced or grown in the region and a subjective comparison was made [65]. The final suitability map produced from the model was verified to ensure that the model corresponded to the actual conditions in the field. Existing tea-growing areas were extracted from the land use map of Sri Lanka. Using the "geometry intersection" tool in Arc GIS software, each suitability class was intersected with the layer of existing tea-growing area. We calculated the percentage of existing tea-growing areas that were intersected with each of the modelled suitability classes. If a high percentage of modelled “very highly suitable” and “highly suitable” areas fell within the actual tea-growing areas, we assumed that our results were more valid.

3. Results

3.1. Results of the Multi-Criteria Analysis-AHP

The criteria were weighted and scored in terms of their importance for tea cultivation in the preparation of the model. Table 4 and Table 5 show the comparison matrix and the calculated weights of the criteria. The overall consistency ratio (CR) of 0.09 was below the 0.10 ratio, suggesting that the judgement had a reasonable level of consistency.

3.2. Results of the Multi-Criteria Analysis-DEMATEL

Table 6 presents the ratings assigned to individual pairs of criteria based on the expert participatory method. Then, the normalized direct influence matrix (X) was calculated according to Equation (4) (Table 7) and the matrix of total relations (T) is given in Table 8. DEMATEL has the ability to complete the matrix by obtaining direct and indirect relations from each pair of alternatives. With reference to Table 9, values in the (di + rj) column show the total effect of each main factor on the whole system. Correspondingly, rainfall acquires high influence compared to other criteria. Similarly, values in the (dirj) column, divide all criteria into cause and effect groups based on their values. The (di + rj) values of all criteria are greater than the threshold value, indicating the importance of these criteria to use in the land suitability assessment process for tea.
In Figure 2, the criterion of rainfall has the highest significance indicator value followed by temperature, elevation and slope, indicating that these are the most important criteria for the land suitability assessment for tea in Sri Lanka. The lowest position indicator value is attained by depth and texture. Further, the relationship indicator allows to set a degree of influence of the analyzed parameters on other parameters. In Figure 2, rainfall has the greatest positive value of relationship indicator, which means that it has a dominating, causal influence on the other criteria. The value of di-rj segregated the flexibilities into two groups: cause group and effect group. According to the relationship indicators (Figure 2 and Table 9), rainfall, temperature, elevation and slope belong to the cause group, and have a significant influence over the criteria of pH, soil type, drainage, depth and texture.
The final criteria weights were achieved by calculating each criterion’s average weight in both techniques as shown in Table 10 and applied in the land-use suitability for tea crops. Rainfall (21.6%) followed by temperature (18.56%) and elevation (16.69%) highly contributed to the land suitability evaluation than other criteria. The least impact on the evaluation of land suitability for tea was the texture, accounting for 3.8%.

3.3. The Land-Use Suitability with Respect to Selected Criteria

All criteria maps were standardized (reclassified) into five classes (very highly suitable, highly suitable, moderately suitable, low suitability and unsuitable). Figure 3 shows the standardized criteria maps for tea suitability. Each of the criteria was separately analyzed for their suitability for supporting tea crops based on its requirements. Most of Sri Lanka’s northern, northwestern, north central, and eastern parts do not have suitable rainfall, temperature, and elevation requirements for tea cultivation (Figure 3). Figure 3 shows that, with the exception of the northern parts of the country, many Sri Lankan regions have at least a moderate slope category for tea production. The soil maps of pH, drainage, depth and texture illustrate varying degrees of suitability to grow tea. Overall, soil properties in many parts of Sri Lanka are suitable for tea cultivation.

3.4. Overall Land Suitability for Tea in Sri Lanka

Figure 4 shows the map of derived suitability classes of the land for tea cultivation in Sri Lanka and Table 11 shows the potential land area in each suitability class. The land consists of very highly suitable, highly suitable, moderately suitable, low suitable and unsuitable areas as described in Table 2. Nuwara Eliya, Ratnapura, Matara, Galle, Matale, Kandy, Badulla, Kegalle and Kalutara districts show “very highly suitable” or “highly suitable” classes for tea cultivation.
The degree of potential land suitability for tea cultivation varies between districts in Sri Lanka (Figure 5). It clearly shows that the existing tea-growing districts are ideal for tea. Among the areas under the very highly suitable category, 29.5% belong to Nuwara-Eliya, 26.2% to Kandy and 21.7% to Ratnapura District. The districts of Ratnapura (52.2%), Kandy (51.4%), Badullla (56.2%), Kegalle (43.1%), NuwaraEliya (48.7%), Matara (38.9%), Matale (32.5%) and Kalutara (25.2%) are clearly classified in the "highly suitable" land category (Figure 5). The highest area under "moderately suitable" is recorded in the Kalutara District, which is approximately 52.0%, followed by Colombo (43.8%), Galle (42.9%) and Moneragala (42.4%). The district of Jaffna (94.9%), Kurunegala (74.1%) and Kilinochchi (70.4%) were dominated by "unsuitable" areas for tea compared to other districts. There are no low suitable areas in the Nuwara Eliya District.

3.5. Measures of Model Performance

The coordinates of modelled very highly and highly suitable areas were within the range of the coordinates of existing tea-growing areas (Figure 6). The latitudes of existing tea cultivation areas range from 5.9991 to 7.59550, where the coordinates of modelled highly tea-growing areas ranged from 6.2473 to 7.4508. This showed that most of the existing tea-growing areas range from 80.0489 to 81.3026, where the longitude of the modelled very highly and highly suitable area ranged from 80.4531 to 80.9239 (Figure 6).
Most of the modelled "highly suitable" class aligns with existing tea-growing areas, accounting for 62.45%, while the "very highly suitable" class accounts for 30.01% of existing tea cultivation (Figure 6 and Table 12). The moderately suitable class accounts for 7.10% of existing tea lands, while the lowest percentage of existing tea land classified as "low suitability" was 0.36% (Figure 6 and Table 12). Further, 0.08% of the current tea-growing areas were modelled as unsuitable areas.

4. Discussion

Selecting the most rational algorithm for assessing the land suitability is crucial for current and future land use planning for tea cultivation. A key step in the land suitability assessment for crop production is to determine the weight of each factor affecting the land suitability [77]. The presence of different and multiple criteria complicates the assessment of land suitability because factors affecting land suitability are of unequal significance [78]. The AHP and DEMATEL methods have been widely reported in literature [40,43,46,79,80]. In this study we used an integrated multiple criteria decision-making (MCDM) technique that combines the AHP and DEMATEL. Our decision to integrate the DEMATEL approach with the AHP was because one of the weaknesses of the AHP is the fact that it does not allow for evaluating interrelations and influences between the elements that compose the decision-making process. Application of the DEMATEL method allows not only the description of the structure and interrelationships between the criteria, but also allowed us to identify the key criteria influencing tea with regard to land suitability [43]. Further, the results of the AHP are often taken into consideration when making short-term decisions. The DEMATEL technique, on the other hand, evaluates both the importance of criteria and shows the causal diagram which could assist in enhancing the long-term impacts of choices. The integration of the AHP and DEMATEL techniques thus offers the decision maker comprehension to enhance efficiency from either short-term or long-term points of view [79]. The integrated approach of GIS and the AHP–DEMATEL technique in this study has great potential to classify the land suitability of tea plantations. No previous studies have been conducted in Sri Lanka and the holistic approach of GIS and the AHP–DEMATEL technique are hence used for the first time to determine the suitability of tea lands. This study represents the efficacy of the AHP and weighted overlay model for the land suitability analysis of tea resulting in a CR value less than 0.1 (Table 5). The paired comparison matrix used in this study therefore appears to have sufficient internal consistency to be considered acceptable. Furthermore, the DEMATEL technique confirmed the importance of the criteria chosen from the AHP analysis to use in the tea suitability assessment process.
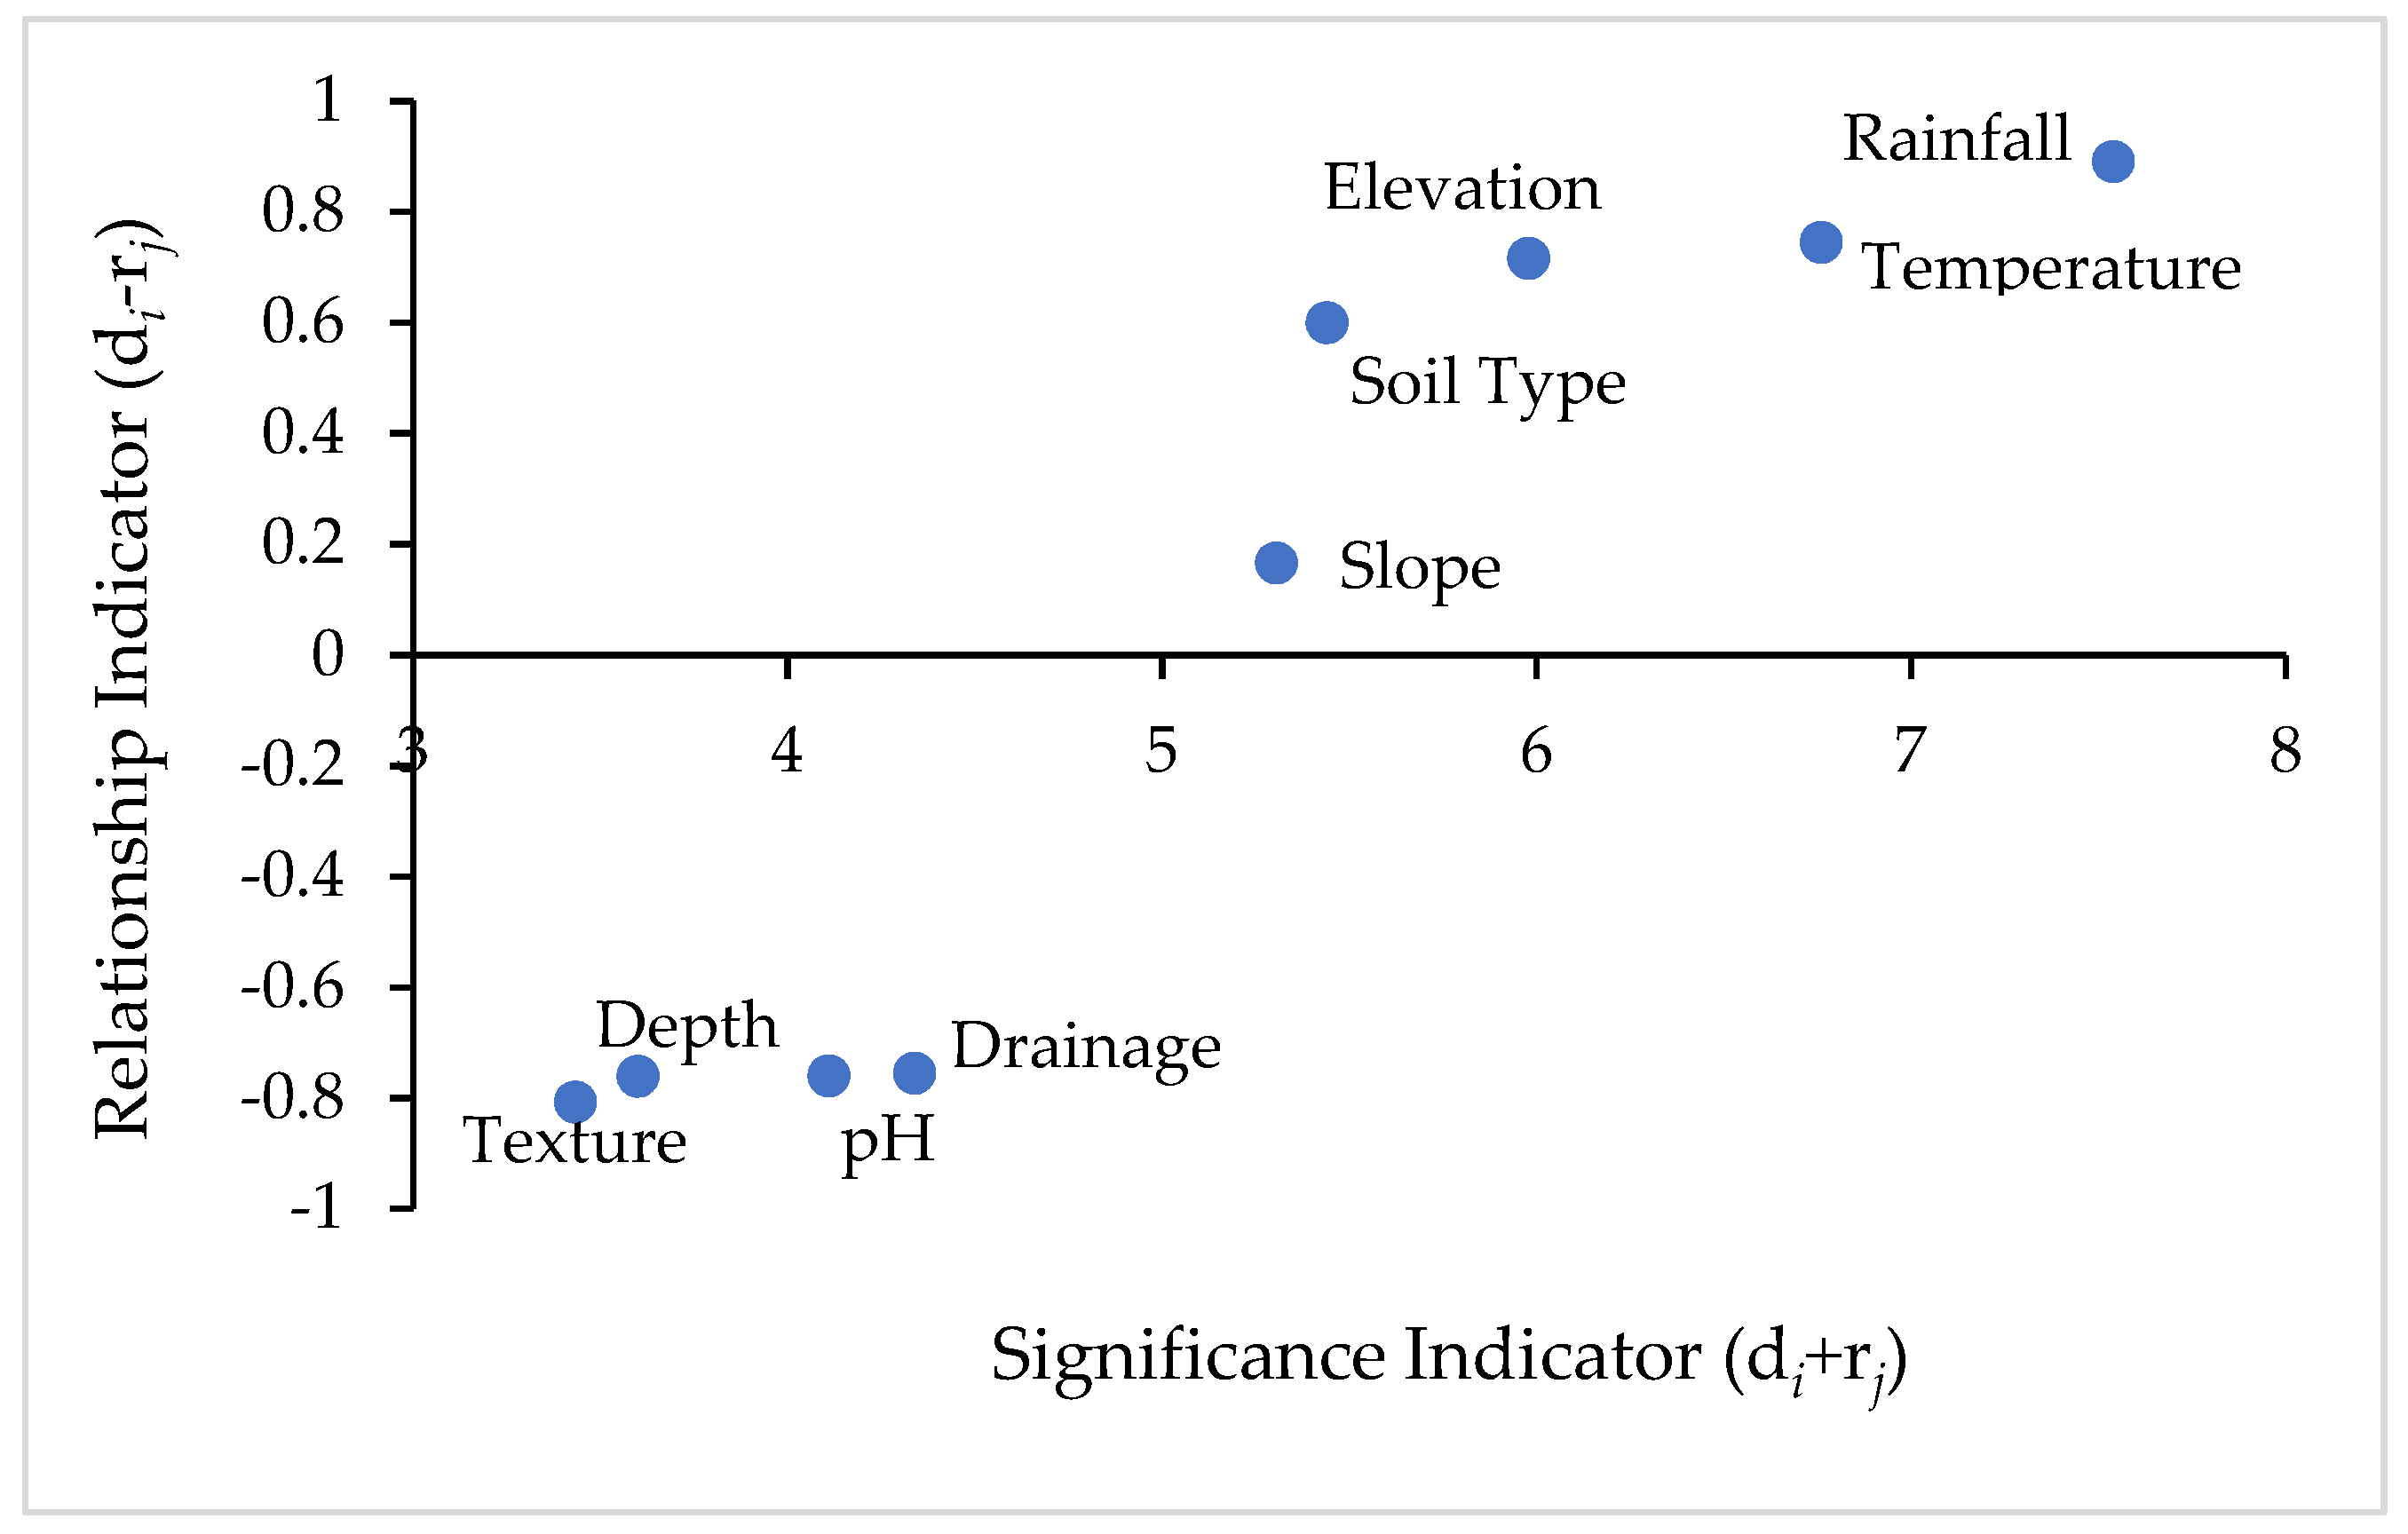
The soil, topography and climate factors are critical and necessary for successful tea cultivation [27]. All criteria which are considered as relevant for a land suitability decision are compared against each other in a pair-wise comparison matrix which is a measure to express the relative preference among the factors (Table 10). On the basis of the results, the total suitability of rainfall and temperature were given a high average weight in the AHP–DEMATEL technique compared to the total suitability of the other topographic and soil factors since these variables were the most restrictive factors for the assessment of land suitability for tea [26,48,52]. The climate is the most important factor that determines the land suitability of tea [26,81]. Rainfall in fact influences all other meteorological elements, including temperature, and the present agricultural land use of Sri Lanka already underlines the effects of rainfall upon land use [4,51]. Therefore, in matrix comparison AHP and DEMATEL, rainfall is considered as equally or moderately important than temperature (Table 4, Table 9 and Table 10).
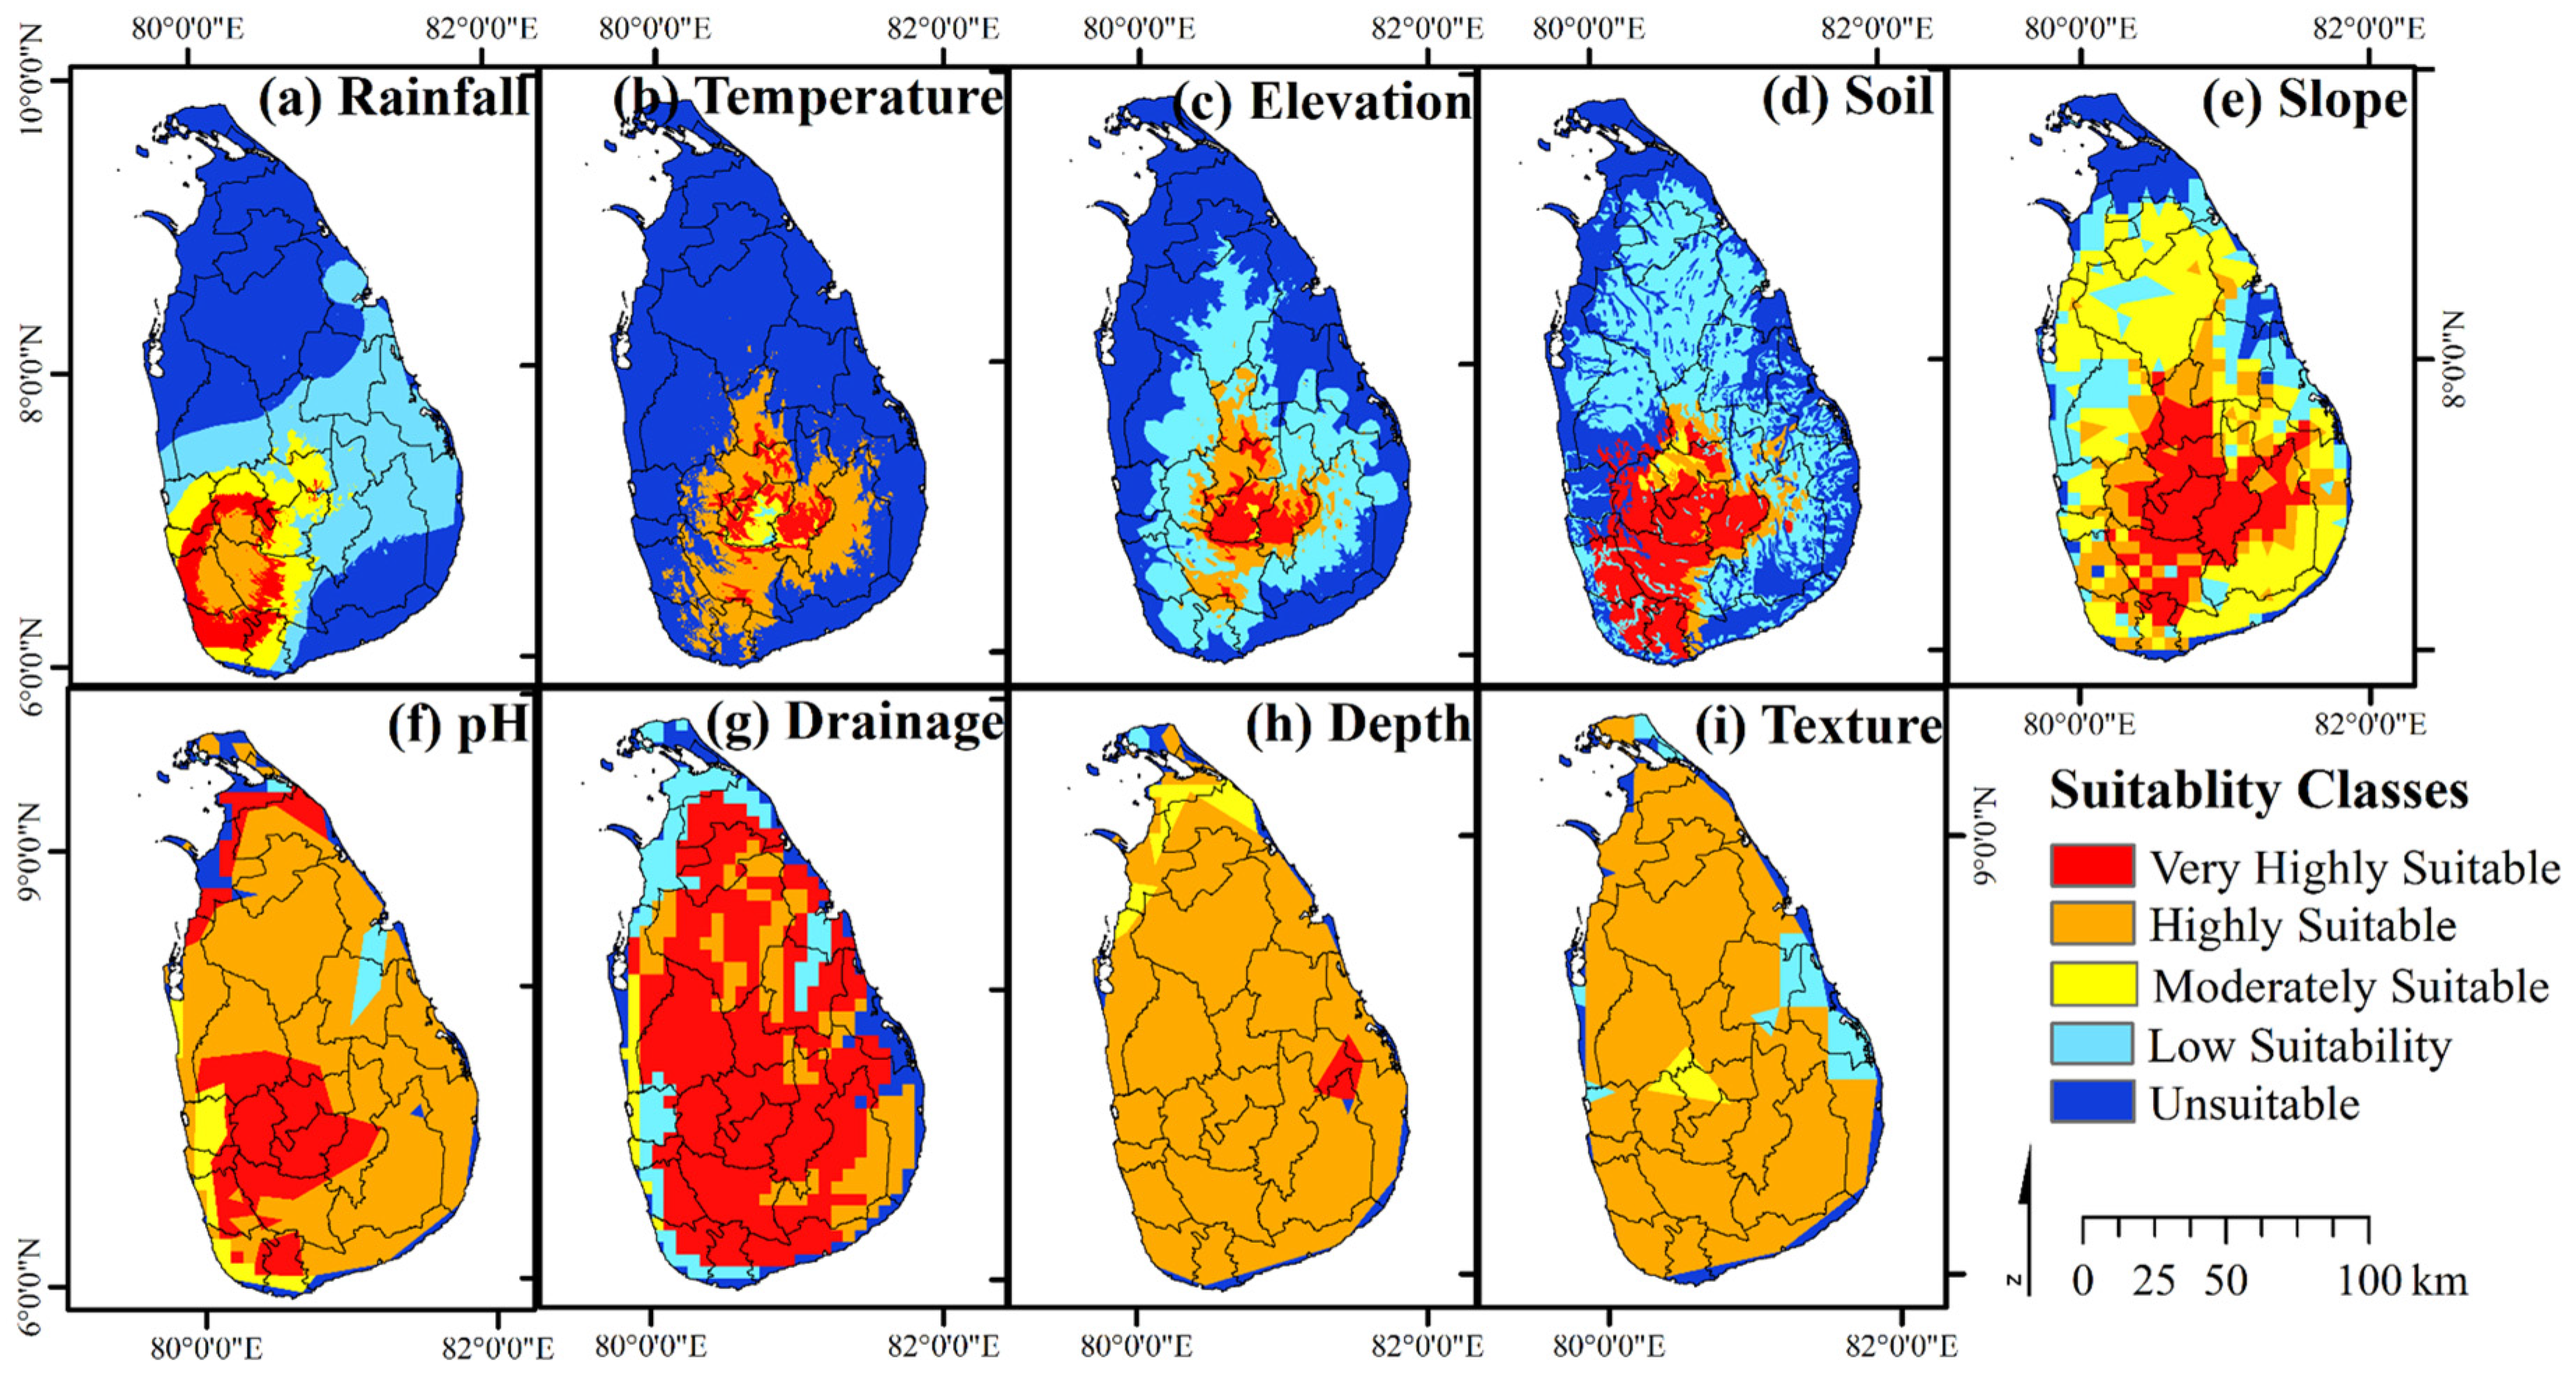
The actual spatial variation of crop cultivation is often modified by different types of soil with varying physical, chemical and biological properties and thus determining the land suitability for tea [81]. In the analysis of the land suitability for tea, slope is another key determinant [60] which is given high priority compared to other soil characteristics (Table 10). The lack of reliable country-specific soil data can significantly hamper interventions to assess land suitability. There is no clear and detailed coverage of point-based soil profile data in Sri Lanka. Since there are no country-specific data available at the desirable scale, data were extracted from the Harmonized World Soil Database which is readily available on FAO soils portal (Figure 3). Land suitability mapping can only be used as a first step in spatial planning, since the actual suitability can only be assessed on the basis of a detailed investigation [82].
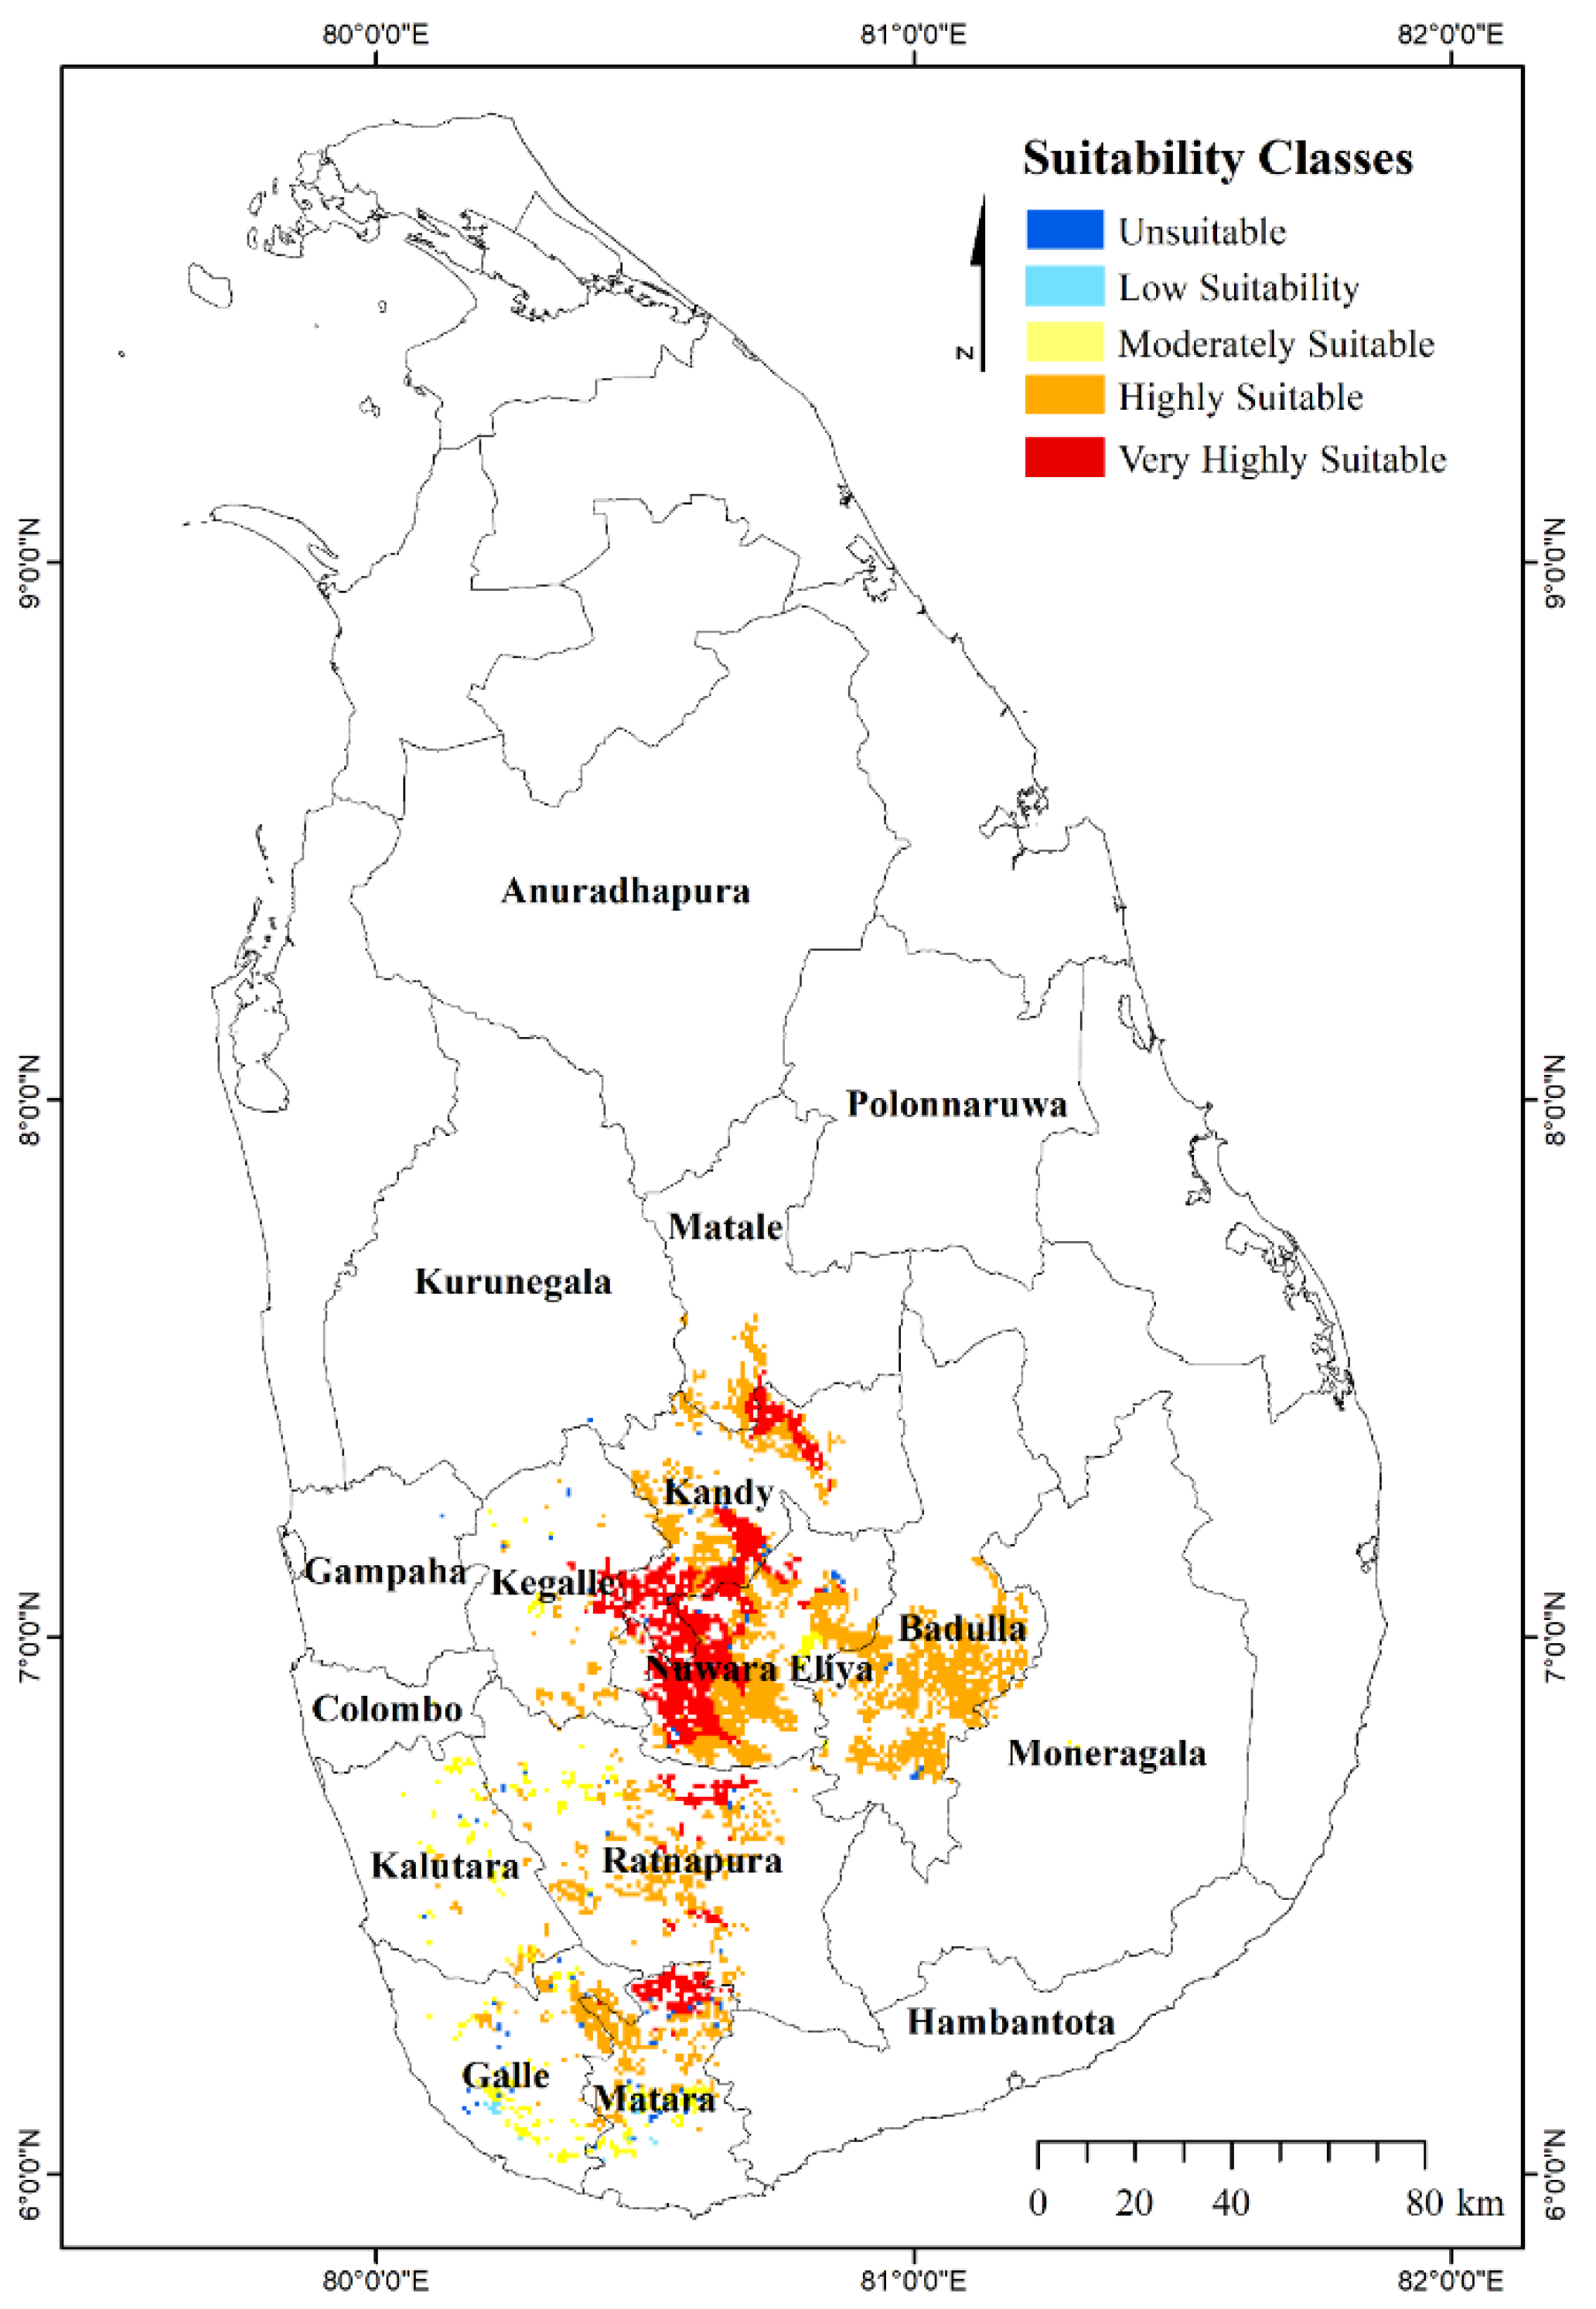
Despite some of the above limitations, the majority of existing tea-growing areas is classified into "very highly suitable "and "highly suitable” classes in the modelling, implying that the results are robust (Figure 4). Therefore, our assessment of land suitability is considered to be sufficiently accurate as it aligns with the current tea-growing regions. In line with the results of previous research conducted by others [26,27,81], this study shows that tea-growing areas are clustered in the central hills and SW quarter of Sri Lanka. Apparently the most suitable land masses for tea are clustered in Nuwara Eliya, Ratnapura, Matara, Galle, Matale, Kandy, Badulla, Kegalle and Kalutara districts. Soil types in these regions are mainly red yellow Podzolic which are suitable for the cultivation of tea crops, and soil textures are mainly sandy loam and loamy sand. If the environment is relatively stable and no natural disasters occur, these regions typically show a high yield of tea crops. Therefore, this type of region should be protected as a key tea ecological protection region and the suitability classes for tea will pave the way in determining policies for the optimal utilization of land in a sustainable manner for the future.
The analysis showed that the largest part of the land is occupied by a low suitability class, with 27,581 km2 (42.1%), and an area of 18,695 km2 (28.5%) has unsuitable land cover. An area of 8137 km2 was moderately suitable and an area of 9498 km2 was highly suitable for tea cultivation. The area of land that is very highly suitable for tea cultivation was 1627 km2 (
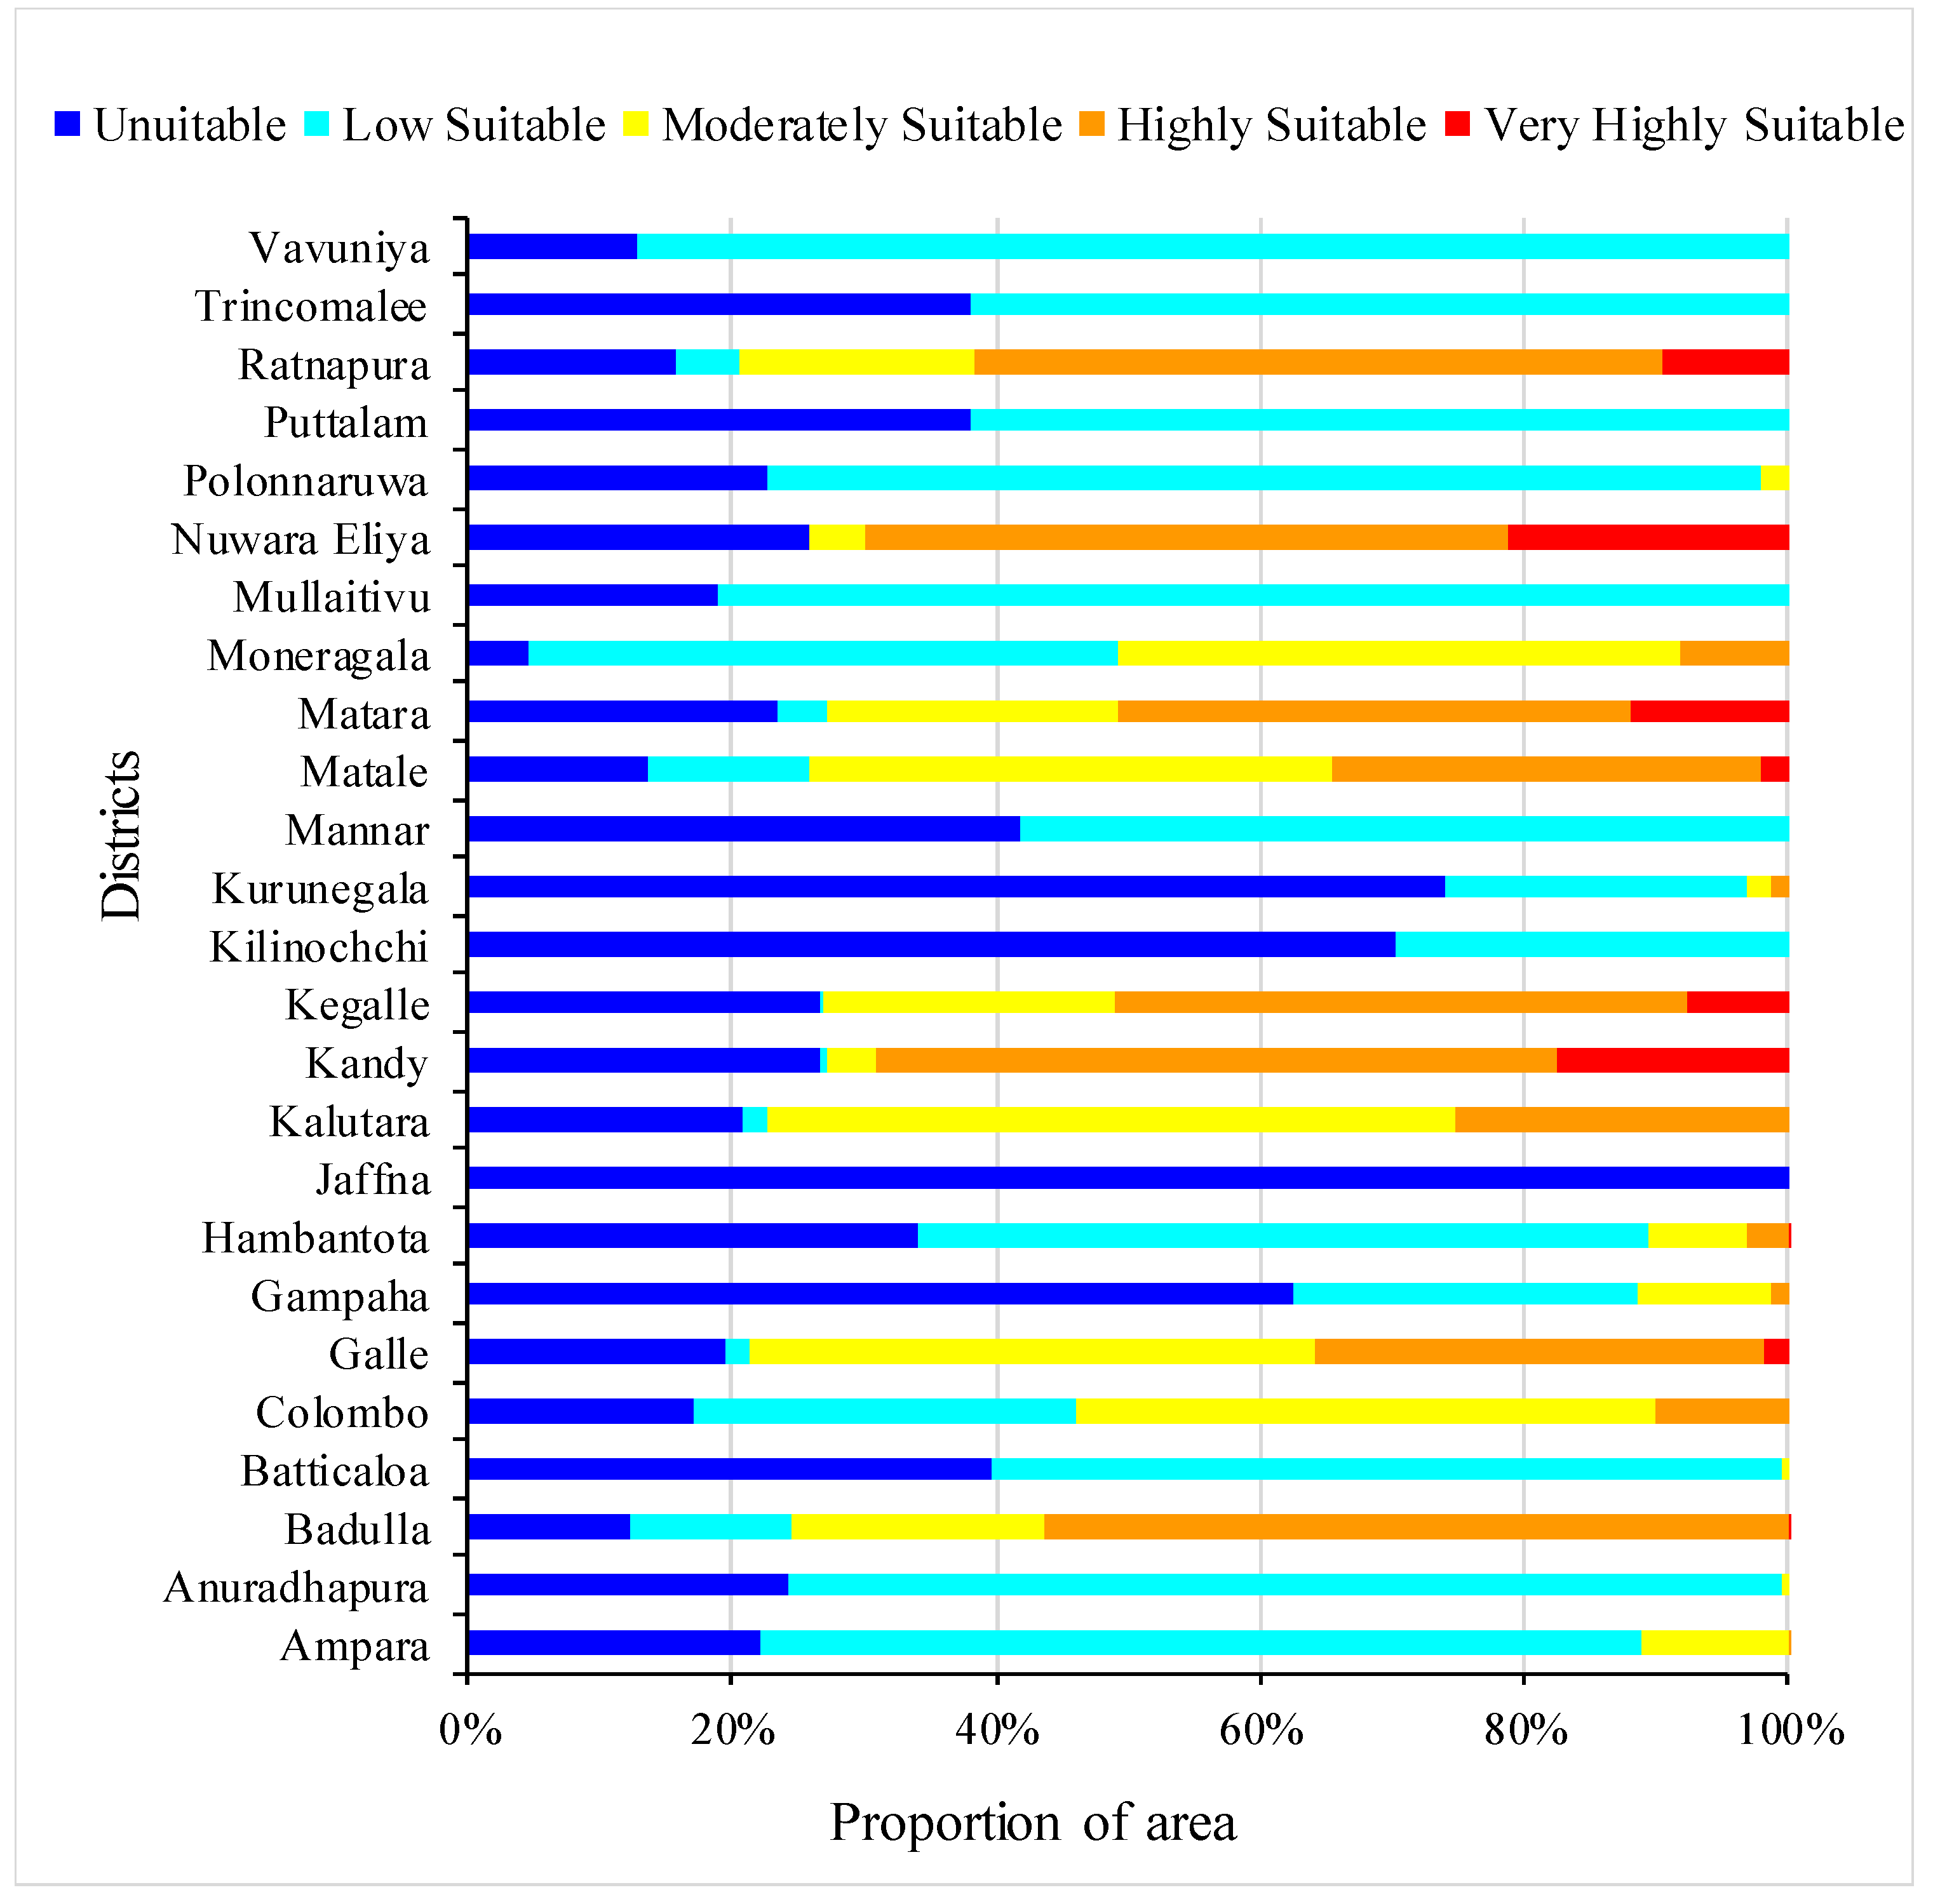
Table 11). The highest proportion of “very highly suitable” areas in the Nuwara Eliya District, which is approximately 25 percent, indicates that climate, topographic and soil factors are desirable for tea cultivation in the Nuwara Eliya District. An area of approximately 477.5 km2 (29.5%) of the very highly suitable class was recorded in the Kandy District, while Matara (465.1 km2), Galle (508.1 km2), Kegalle (820.6 km2) and Ratnapura (1935.9 km2) districts were also recorded as highly suitable tea-growing areas.
The coastal belt and the northern, western, eastern and north central regions are not suitable for tea cultivation (Figure 4). It is known, for example, that considerable stretches of the coastal belt in the south western part of Sri Lanka (Galle, Matara, Kalutara and Colombo etc.) are partially or totally unsuitable for tea, not because of the climate, but mainly due to the poor soil types, namely grumosols, sandy regosols, non-calcic brown soils, etc. On the other hand, it is apparent that under suitable soil conditions, it is the climate and its temporal and spatial variations that delimit the possibilities and potential of agriculture in Sri Lanka [81]. Although tea is not currently grown in some areas, they are found to be of moderate or low suitability (Figure 4 and Figure 5). This implies the possibility for future tea cultivation in these potential areas. In the Ampara, Moneragala and Kurunegala districts, for instance, there are moderately suitable areas where the cultivation can be expanded, despite the fact that they are not currently very renowned for tea cultivation.
A very small proportion of very highly suitable areas is reported in the Badulla district, which accounts for only 0.16%, although it is one of the major tea-growing areas in Sri Lanka [11]. It can possibly be due to changing climatic conditions and other physical, chemical and soil-related biological limitations. The Kurunegala, Kegalle and Moneragala districts are known to contribute to tea production in Sri Lanka. The present study also shows that the Kurunegala, Kalutara, and Moneragala districts have "highly suitable" tea-growing areas, resulting in 1.35, 7.79, and 8.23% respectively.
Jaffna District is totally unsuitable for growing tea. The Kilinochchi District is also highly unsuitable for tea cultivation. Moreover, most other parts of Sri Lanka, such as the northern, central, north-western and eastern parts are shown as likely to be unsuitable as the topographical, climatic and soil factors are not favorable for tea cultivation, resulting in a higher proportion of "unsuitable" or "low suitable" categories (Figure 5).
For Sri Lanka, in particular, climatic indices such as the ratio between rainfall and evaporation seems to be of great practical use for delimiting the potential growing areas of the tea plant. With regard to water balance, the potential tea-growing areas are limited roughly to the south-west quarter of Sri Lanka, including the Central Highlands [81]. Interestingly, some parts of the Nuwara Eliya District are also unsuitable for tea production, as some lands are located on a much higher elevation, where the favorable environment for tea growth is limited. In particular, the upper limit of the highlands represents the boundaries of a warmth deficit as a result of temperature reduction with a higher altitude above sea level [83]. This temperature deficit can have a severe impact on tea bushes by accelerating frost damage. Many parts of the highly grown tea fields (>1900 m) are heavily affected by "frost burning" and this may result in some areas of Nuwara Eliya being unsuitable for tea cultivation. Taking into account the specific slope requirements of the tea plants, the slope is highly correlated with sunshine hours.
According to the Tea Research Institute of Sri Lanka, the current main tea-growing areas are Nuwara Eliya, Ratnapura, Matara, and Kalawana [84,85], while the Galle and Kalutara districts and some parts of the Ratnapura, Kandy, and Matale districts are partly contributing to tea production [85]. The results were verified by comparing the modelled suitability sites with the existing tea cultivation locations (Figure 6 and Table 12). If the majority of suitability classes exist in a region, it reflects the results in a logical and acceptable way, and then the findings become more viable [78]. Correspondingly, the results of this study show that the existing tea-growing areas represent a higher percentage of “very highly” and “highly” suitable modelled classes, implying that our modelling was robust and the weightings that were used were appropriate. The high overlay in the very high and highly suitable class (92.46%) with existing tea-growing areas validates selection procedures of farmers and planters but also shows that the methodology used here is valid.
This study’s findings provide insights into recognizing those areas that are irreplaceable in terms of existing and future production and can therefore be used as a focus for more detailed planning. It is important for the tea sector to identify very highly and/or highly suitable land areas for tea as these areas can be used to further expand tea cultivation and to prevent it from being allocated for other non-agricultural purposes. An area of 685.8 km2 under the very highly suitable category is recorded in Ratnapura, Nuwara Eliya, Kegalle, and Matara districts that can potentially be brought into tea production in the future, while an area of 7261.7 km2 is also registered as a highly suitable area in the Moneragala, Kalutara and Matale districts and the other major existing tea-growing regions. In addition, the highly suitable potential lands can also be focused on for more detailed planning to help ensure sustainable tea production. Appropriate measures and resources should be properly placed in moderately suitable areas to maximize the land use for tea cultivation. This study allows the easy identification of low suitability and unsuitable tea lands, providing a sound impetus to utilize these lands for other management and development activities (i.e., construction, urban planning, ecosystem conservation, and agricultural purposes).
Furthermore, it is strategically important to understand the prevailing reality of the land suitability classes to tackle the socio-economic as well as environmental consequences of existing tea-based land use systems [86]. The information provided in the maps (Figure 4 and Figure 5) can be used to identify more productive regions and tea lands for replanting, crop diversification, forestry and urban amenities, etc. Growers can also improve the suitability of available lands for tea crops by adopting appropriate agronomy measures relevant to the limitations indicated. A more detailed analysis for tea still requires more data, for example in terms of soil chemical properties and socio-economic factors. This study has provided information not only to the tea plantation sector and tea small holding sector, but also to the other investors planning for tea tourism. This helps stakeholders to easily identify the suitable blocks for tea cultivation and also the limiting factors, if any.

5. Conclusions

The analysis of land suitability for tea is important information for the development and future planning of the tea sector in Sri Lanka. This research used GIS processing and analysis in conjunction with the AHP–DEMATEL technique to assess land suitability for tea production. This is the first study that used climatic as well as topographic and soil factors in modelling land suitability for tea cultivation in Sri Lanka. The spatial land suitability for tea crops was obtained after analyzing selected evaluation criteria such as soil characteristics, topographic and climatic factors. As per the land characteristics and crop requirements, the potential areas for tea crops fall into very highly suitable (2.5%), highly suitable (14.5%), moderately suitable (12.4%), low suitability (42.1%) and unsuitable (28.5%) classes. The model validation results showed that 92.46% of the combined “highly suitable” and “very highly suitable” modelled classes are actual current tea-growing areas, showing the overall robustness of this model and the weightings applied. The land suitability assessment that was utilized in this study provides a useful decision-making approach to help tea growers and decision makers to carry out suitability assessment for tea crops. It should be noted that socio-economic and cultural factors that enable policy makers to make better decisions must be taken into account in making final decisions.

Author Contributions

Proposal and original idea, L.K. and S.L.J.; Conceptualization, L.K. and S.L.J.; Modelling, S.L.J.; Methodology, L.K. and S.L.J.; Data construction, S.L.J. and J.S.; Validation, S.L.J.; Formal Analysis, S.L.J.; Investigation; S.L.J and L.K.; Resources, L.K. and S.L.J.; Software, L.K., S.L.J. and J.S; Literature review, S.L.J.; Writing—original draft preparation, S.L.J and L.K.; Writing—review and editing, S.L.J. and L.K.; Visualization, L.K. and S.L.J.; Supervision, L.K.; Project administration, L.K; Proof-reading, L.K, S.L.J. and J.S.

Funding

This research received no external funding

Acknowledgments

This research was supported by the Australian Government Research Training Program (AGRTP) Stipend Scholarship. The authors acknowledge Mrs. Chithrangani Rathnayake who provided technical assistance and data on soil and land use.

Conflicts of Interest

The authors declare no conflict of interest.

References

  1. Sys, C.; Van Ranst, E.; Debaveye, J. Land Evaluation: Principles in Land Evaluation and Crop Production Calculations; International Training Centre for Post-Graduate Soil Scientists, University Ghent: Ghent, Belgium, 1991; Volume 46, Available online: http://www.plr.ugent.be/publicatie.html (accessed on 12 October 2018).
  2. Comber, A.J. Land use or land cover? J. Land Use Sci. 2008, 3, 199–202. [Google Scholar] [CrossRef]
  3. Haines-Young, R. Land use and biodiversity relationships. Land Use Policy 2009, 26, S178–S186. [Google Scholar] [CrossRef]
  4. Baja, S.; Chapman, D.M.; Dragovich, D. A conceptual model for assessing agricultural land suitability at a catchment level using a continuous approach in GIS. In Proceedings of the Geospatial Information and Agriculture Conference, Denver, CO, USA, 5–7 November 2001. [Google Scholar]
  5. FAO. A Framework for Land Evaluation; Soils Bulletin 32; Food and Agriculture Organization of the United Nations: Rome, Italy, 1976. [Google Scholar]
  6. FAO. Land Evaluation towards a Revised Framework Rome; Food and Agriculture Organization of the United Nations: Rome, Italy, 2007. [Google Scholar]
  7. Rajakaruna, K.S.S.; De Silva, N.; Shaymalie, H.W.; Jayasinghe, A.D. Assessment of enterpreneurial behaviour among tea small holders in low country Sri Lanka. Trop. Agric. Res. Ext. 2016, 19. Available online: https://tare.sljol.info/articles/abstract/10.4038/tare.v19i2.5351/ (accessed on 23 October 2018). [CrossRef]
  8. Mapa, R.B.; Kumaragamage, D.; Gunarathne, W.D.L.; Dassanayake, A.R. Land use in Sri Lanka: Past, present and the future. In Proceedings of the 17th World Congress of Social Science (WCSS), Bangkok, Thailand, 14–21 August 2002. [Google Scholar]
  9. Herath, D.; Weersink, A. From plantations to smallholder production: The role of policy in the reorganization of the Sri Lankan tea sector. World Dev. 2009, 37, 1759–1772. [Google Scholar] [CrossRef]
  10. Karunasena, G.; Amaratunga, D.; Haigh, R. Post-disaster construction & demolition debris management: A Sri Lanka case study. J. Civ. Eng. Manag. 2012, 18, 457–468. [Google Scholar]
  11. Dharmasena, P.B. Sustainable Management Practices for Agricultural Lands in the Central Highlands of Sri Lanka. Tech. Package Marg. Tea Lands 2017, 1, 21. Available online: https://www.academia.edu/33284911/SUSTAINABLE_LAND_MANAGEMENT_PRACTICES_IN_SRI_LANKA_With_Special_Reference_to_Central_Highlands (accessed on 8 August 2018).
  12. Sri Lanka Export Development Board. Tea Industry Capability Report; Export Agriculture Division, EDB: Colombo, Sri Lanka, 2016; pp. 2–3.
  13. FAO. FAOSTAT Data; Food and Agriculture Organization of the United Nations: Rome, Italy, 2004. [Google Scholar]
  14. Hilal, M.M. Export Trend in Global Tea Trade: A Cross Countries Analysis with Reference to Sri Lankanand Indian Tea Industry. In Proceedings of the UMT 11th International Annual Symposium on Sustainability Science and Management, Kuala Terengganu, Malaysia, 9–11 July 2012; pp. 291–303. [Google Scholar]
  15. Jayaratne, P.; Styger, L.; Perera, N. Sustainable supply chain management: Using the Sri Lankan tea industry as a pilot study. In Proceedings of the 5th Annual Australia New Zealand Academy of Management Conference (ANZAM 201), Wellington, New Zealand, 7–9 December 2011; pp. 1–22. [Google Scholar]
  16. Munasinghe, M.; Deraniyagala, Y.; Dassanayake, N.; Karunarathna, H. Economic, social and environmental impacts and overall sustainability of the tea sector in Sri Lanka. Sustain. Prod. Consum. 2017, 12, 155–169. [Google Scholar] [CrossRef]
  17. Leshamta, G.T. Assessing the Suitability of Tea Growing Zones of Kenya under Changing Climate and Modeling Less Regret Agrometeorological Options. Ph.D. Thesis, Department of Meteorology, University of Nairobi, Nairobi, Kenya, 2017. [Google Scholar]
  18. Darvishi-Foshtomi, M.; Norouzi, M.; Rezaei, M.; Akef, M.; Akbarzadeh, A. Qualitative and economic land suitability evaluation for tea (Camellia sinensis L.) in sloping area of Guilan, Iran. J. Biol. Environ. Sci. 2011, 5, 135–146. [Google Scholar]
  19. Nuwategeka, E.; Ayine, R.; Ofoyuru, D. Land Suitability Evaluation for Tea and Food Crops in Kabarole District, Western Uganda. In Proceedings of the Sustainable Research and Innovation Conference, Gulu, Uganda, 7–9 May 2014. [Google Scholar]
  20. Gahlod, N.S.; Binjola, S.; Ravi, R.; Arya, V.S. Land-site suitability evaluation for tea, cardamom and rubber using Geo-spatial technology in Wayanad district, Kerala. J. Appl. Nat. Sci. 2017, 9, 1440–1447. [Google Scholar] [CrossRef] [Green Version]
  21. Fernando, T.; Gunawardena, A. Determination of Conversion of Tea Lands in Kandy District Using Different Remote Sensing Indices. In Proceedings of the Asian Conference on Remote Sensing (ACRS), Colombo, Sri Lanka, 17–21 October 2016. [Google Scholar]
  22. Bo, L.I.; Zhang, F.; Zhang, L.W.; Huang, J.F.; Zhi-Feng, J.I.N.; Gupta, D.K. Comprehensive suitability evaluation of tea crops using GIS and a modified land ecological suitability evaluation model. Pedosphere 2012, 22, 122–130. [Google Scholar]
  23. Collette, B.B.; Nauen, C.F. FAO Species Catalogue; Scombrids of the World. An Annotated and Illustrated Catalogue of Tunas, Mackerels, Bonitos and Related Species Known to Date; FAO Fisheries Synopsis, Food and Agriculture Organization of the United Nations: Rome, Italy, 1983. [Google Scholar]
  24. Panabokke, C.R. Map of the Agro-Ecological Regions of the Main Tea and Rubber Areas; Irrigation Department: Colombo, Sri Lanka, 1970.
  25. Perera, M. Planned Landuse for the Tea Country; National Science Foundation: Colombo, Sri Lanka, 1989. [Google Scholar]
  26. Jayathilaka, P.M.S.; Soni, P.; Perret, S.R.; Jayasuriya, H.P.W..; Salokhe, V.M. Spatial assessment of climate change effects on crop suitability for major plantation crops in Sri Lanka. Reg. Environ. Chang. 2012, 12, 55–68. [Google Scholar] [CrossRef]
  27. Amarathunga, S.L.D.; Panabokke, C.R.; Pathiranage, S.R.W.; Amarasinghe, L.; Wijeratne, M.A. Land Suitability Classification and Mapping of Tea Lands in Ratnapura District. Sri Lanka J. Tea Sci. 2008, 73, 1–10. [Google Scholar]
  28. Panabokke, C.R. Soils and Agro-Ecological Environments of Sri Lanka; Natural Resources, Energy and Science Authority (NARESA): Colombo, Sri Lanka, 1996. [Google Scholar]
  29. De Silva, M.; Thomas, D.P.; Hazleman, B.L.; Wraight, P. Liposomes in arthritis: A new approach. Lancet 1979, 313, 1320–1322. [Google Scholar] [CrossRef]
  30. de Alwis, K. A simplified land suitability classification for tea. Tea Q. 1980, 49, 5–12. [Google Scholar]
  31. Saaty, T.L. Decision Making with Dependence and Feedback: The Analytic Network Process; RWS Publications: Pittsburgh, PA, USA, 1996; Volume 4922. [Google Scholar]
  32. Malczewski, J. On the use of weighted linear combination method in GIS: Common and best practice approaches. Trans. GIS 2000, 4, 5–22. [Google Scholar] [CrossRef]
  33. Liu, C.; Frazier, P.; Kumar, L.; Macgregor, C.; Blake, N. Catchment-wide wetland assessment and prioritization using the multi-criteria decision-making method TOPSIS. Environ. Manag. 2006, 38, 316–326. [Google Scholar] [CrossRef] [PubMed]
  34. Rikalovic, A.; Cosic, I.; Lazarevic, D. GIS based multi-criteria analysis for industrial site selection. Procedia Eng. 2014, 69, 1054–1063. [Google Scholar] [CrossRef]
  35. Sadok, W.; Angevin, F.; Bergez, J.E.; Bockstaller, C.; Colomb, B.; Guichard, L.; Dore, T. Ex ante assessment of the sustainability of alternative cropping systems: Implications for using multi-criteria decision-aid methods. A review. Agron. Sustain. Dev. 2008, 28, 163–174. [Google Scholar] [CrossRef]
  36. Cinelli, M.; Coles, S.R.; Kirwan, K. Analysis of the potentials of multi criteria decision analysis methods to conduct sustainability assessment. Ecol. Indic. 2014, 46, 138–148. [Google Scholar] [CrossRef] [Green Version]
  37. Bozdağ, A.; Yavuz, F.; Günay, A.S. AHP and GIS based land suitability analysis for Cihanbeyli (Turkey) County. Environ. Earth Sci. 2016, 75, 813. [Google Scholar] [CrossRef]
  38. Dytczak, M.; Ginda, G. Is explicit processing of fuzzy direct influence evaluations in DEMATEL indispensable? Expert Syst. Appl. 2013, 40, 5027–5032. [Google Scholar] [CrossRef]
  39. Michnik, J. Multi-Criteria Methods of Streamlining the Process of Managing New Products; Multi-criteria analysis of selected issues; Prace Naukowe/University of Economics in Katowice: Katowice, Poland, 2013; pp. 41–58. [Google Scholar]
  40. Tzeng, G.-H.; Huang, J.-J. Multiple Attribute Decision Making: Methods and Applications; Chapman and Hall/CRC Press Taylor and Francis Group: Boca Raton, FL, USA, 2011; ISBN 9781439861578. [Google Scholar]
  41. Kobryń, A. Dematel as a Weighting Method in Multi-Criteria Decision Analysis. Mult. Criteria Decis. Mak. 2017, 12, 153–167. [Google Scholar] [CrossRef]
  42. Fontela, E.; Gabus, A. The Dematel Observer, Dematel 1976 Report; Battelle Geneva Research Center: Geneva, Switzerland, 1976. [Google Scholar]
  43. Si, S.L.; You, X.Y.; Liu, H.C.; Zhang, P. DEMATEL technique: A systematic review of the state-of-the-art literature on methodologies and applications. Math. Probl. Eng. 2018, 2018, 3696457. [Google Scholar] [CrossRef]
  44. Khalili-Damghani, K.; Aminzadeh-Goharrizi, B.; Rastegar, S.; Aminzadeh-Goharrizi, B. Solving land-use suitability analysis and planning problem by a hybrid meta-heuristic algorithm. Int. J. Geogr. Inf. Sci. 2014, 28, 2390–2416. [Google Scholar] [CrossRef]
  45. Łaska, G. Wind Energy and multi-criteria analysis in making decisions on the location of wind farms. Procedia Eng. 2017, 182, 418–424. [Google Scholar] [CrossRef]
  46. Khodashenas, S.R.; Yarahmadi, N. Storage dam’s locality placing by MCDM techniques (case study: Three dams in Iran). Arab. J. Geosci. 2016, 9, 612. Available online: https://0-link-springer-com.brum.beds.ac.uk/article/10.1007%2Fs12517-016-2636-y (accessed on 20 August 2018). [CrossRef]
  47. Azizi, A.; Malekmohammadi, B.; Jafari, H.R.; Nasiri, H.; Parsa, V.A. Land suitability assessment for wind power plant site selection using ANP-DEMATEL in a GIS environment: Case study of Ardabil province, Iran. Environ. Monit. Assess. 2014, 186, 6695–6709. [Google Scholar] [CrossRef]
  48. Jayasinghe, S.L.; Kumar, L. Modeling the climate suitability of tea [Camellia sinensis (L.) O. Kuntze] in Sri Lanka in response to current and future climate change scenarios. Agric. For. Meteorol. 2019, 272, 102–117. [Google Scholar] [CrossRef]
  49. FAO. Soils resources, management and conservation service. In Guidelines: Land Evaluation for Rainfed Agriculture; Food and Agriculture Organization of the United Nations: Rome, Italy, 1983. [Google Scholar]
  50. Bhagat, R.; Baruah, R.D.; Safique, S. Climate and tea [Camellia sinensis (L.) O. Kuntze] production with special reference to North Eastern India: A review. J. Environ. Res. Dev. 2010, 4, 1017–1028. [Google Scholar]
  51. Nijamdeen, A.; Zubair, L.; Dharmadasa, M.; Najimuddin, N.; Malge, C. Seasonal Impact of Climate on Tea Production in Sri Lanka; National Science and Technology commission, Centre for Science and Technology of the Non-Aligned and Other Developing Countries (NAM S&T Centre), Tropical Climate, Mahaweli Authority: Rajawella, Sri Lanka, 2017.
  52. Jayasinghe, H.A.S.L.; Suriyagoda, L.D.B.; Karunarathne, A.S.; Wijeratna, M.A. Modelling shoot growth and yield of Ceylon tea cultivar TRI-2025 (Camellia sinensis (L.) O. Kuntze). J. Agric. Sci. 2018, 156, 200–214. [Google Scholar] [CrossRef]
  53. Carr, M.; Stephens, W. Climate, weather and the yield of tea. In Tea; Springer: Dordrecht, The Netherlands, 1992; pp. 87–135. [Google Scholar]
  54. Kilian, A.H.D.; Langi, P.; Talisuna, A.; Kabagambe, G. Rainfall pattern, El Niño and malaria in Uganda. Trans. R. Soc. Trop. Med. Hyg. 1999, 93, 22–23. [Google Scholar] [CrossRef]
  55. Jaetzold, R.; Schmidt, H. Farm Management Handbook of Kenya (Vol. II, Part C): Natural Conditions and Farm Management Information, East Kenya; Ministry of Agriculture: Nairobi, Kenya, 1983.
  56. Cheruiyot, E.K.; Mumera, L.M.; NG’ETICH, W.K.; Hassanali, A.; Wachira, F.; Wanyoko, J.K. Shoot epicatechin and epigallocatechin contents respond to water stress in tea [Camellia sinensis (L.) O. Kuntze]. Biosci. Biotechnol. Biochem. 2008, 72, 1219–1226. [Google Scholar] [CrossRef] [PubMed]
  57. Carr, M. The climatic requirements of the tea plant: A review. Exp. Agric. 1972, 8, 1–14. [Google Scholar] [CrossRef]
  58. Owuor, P.O.; Obaga, S.O.; Othieno, C.O. The effects of altitude on the chemical composition of black tea. J. Sci. Food Agric. 1990, 50, 9–17. [Google Scholar] [CrossRef]
  59. Mirza, M.M.Q. Climate change, flooding in South Asia and implications. Reg. Environ. Chang. 2011, 11, 95–107. [Google Scholar] [CrossRef]
  60. Khormali, F.; Ayoubi, S.; Kananro Foomani, F.; Fatemi, A. Tea yield and soil properties as affected by slope position and aspect in Lahijan area, Iran. Int. J. Plant Prod. 2012, 1, 99–111. [Google Scholar]
  61. Deka, D.K.; Borah, D.; Lahon, T.; Baruah, U.; Handique, A.K.; Barman, T.S. Selection of waterlogging tolerant tea (Camellia sinensis L.) genotypes. J. Plant. Crops 2011, 39, 203–209. [Google Scholar]
  62. Moorman, F.; Panabokke, C. Soils of Ceylon. Trop. Agric. 1961, 117, 22–23. [Google Scholar]
  63. Jinadasa, L.; Dimantha, S. Land Suitability Evaluation and Land Use Study of the Matara District; Agrarian Research and training Institute: Colombo, Sri Lanka, 1981. [Google Scholar]
  64. De Silva, M.S.D.L. The Effects of Soil Amendments on Selected Properties of Tea Soils and Tea Plants (Camellia sinensis L.) in Australia and Sri Lanka; ResearchOnline@JCU; James Cook University: Douglas, Australia, 2007; Available online: https://researchonline.jcu.edu.au/2016/1/01front.pdf (accessed on 10 August 2018).
  65. Hajiboland, R. Environmental and nutritional requirements for tea cultivation. Folia Hortic. 2017, 29, 199–220. [Google Scholar] [CrossRef] [Green Version]
  66. ESRI. ArcGIS 10.3. 1 for Desktop 2015; Environmental Systems Research Institute: ESRI Redlands, CA, USA, 2015. [Google Scholar]
  67. Xin, T.; Youhua, M.; Zhongxiang, Y. Evaluation on Suitability of Camellia sinensis Planting Based on GIS. Agric. Sci. Technol. 2015, 16, 2055–2059. [Google Scholar]
  68. Mishra, A. Land suitability classification for different crops. In Orissa Review; Orissa University of Agriculture & Technology: Bhubaneswar, India, 2007. [Google Scholar]
  69. Li, G.; Messina, J.P.; Peter, B.G.; Snapp, S.S. Mapping land suitability for agriculture in Malawi. Land Degrad. Dev. 2017, 28, 2001–2016. [Google Scholar]
  70. FAO. Soil Drianage. In Guidelines for Soil Description; Food and Agriculture Organization of the United Nations: Rome, Italy, 2006. [Google Scholar]
  71. Tea Research Institute; Advisory Circulars. Guidelines on Land Suitability Classification for Tea; Tea Research Institute of Sri Lanka Repository, Ed.; Tea Research Institute: Talawakelle, Sri Lanka, 2002; pp. 1–3. [Google Scholar]
  72. Saaty, T.L. A scaling method for priorities in hierarchical structures. J. Math. Psychol. 1977, 15, 234–281. [Google Scholar] [CrossRef]
  73. Satty, T.L.; Kearns, K.P. Analytical Planning: The Organization of Systems; Pergamon Press, Elsevier: Oxford, UK, 1985. [Google Scholar]
  74. Triantaphyllou, E.; Mann, S.H. Using the analytic hierarchy process for decision making in engineering applications: Some challenges. Int. J. Ind. Eng. Appl. Pract. 1995, 2, 35–44. [Google Scholar]
  75. Nathaniel, R.K. Introduction of Tea Handbook. In Tea Hand Book; Tea research Institute: Talawakelle, Sri Lanka, 1986; pp. 1–2. [Google Scholar]
  76. Tseng, M.-L.; Lin, Y.H. Application of fuzzy DEMATEL to develop a cause and effect model of municipal solid waste management in Metro Manila. Environ. Monit. Assess. 2009, 158, 519. [Google Scholar] [CrossRef] [PubMed]
  77. Duc, T.T. Using GIS and AHP technique for land-use suitability analysis. In Proceedings of the International Symposium on Geoinformatics for Spatial Infrastructure Development in Earth and Allied Sciences, Ho Chi Minh City, Vietnam, 9–11 November 2006; pp. 1–6. [Google Scholar]
  78. Elsheikh, R.; Shariff, A.R.B.M.; Amiri, F.; Ahmad, N.B.; Balasundram, S.K.; Soom, M.A.M. Agriculture Land Suitability Evaluator (ALSE): A decision and planning support tool for tropical and subtropical crops. Comput. Electron. Agric. 2013, 93, 98–110. [Google Scholar] [CrossRef] [Green Version]
  79. Yang, J.L.; Tzeng, G.-H. An integrated MCDM technique combined with DEMATEL for a novel cluster-weighted with ANP method. Expert Syst. Appl. 2011, 38, 1417–1424. [Google Scholar] [CrossRef]
  80. Zhou, X.; Hu, Y.; Deng, Y.; Chan, F.T.; Ishizaka, A. A DEMATEL-based completion method for incomplete pairwise comparison matrix in AHP. Ann. Oper. Res. 2018, 271, 1045–1066. [Google Scholar] [CrossRef] [Green Version]
  81. Domroes, M. Monsoon and land use in Sri Lanka. GeoJournal 1979, 3, 179–192. [Google Scholar] [CrossRef]
  82. Proske, H.; Vlcko, J.; Rosenbaum, M.S.; Dorn, M.; Culshaw, M.; Marker, B. Special purpose mapping for waste disposal sites. Bull. Eng. Geol. Environ. 2005, 64, 1–54. [Google Scholar] [CrossRef]
  83. Seo, S.N.N.; Mendelsohn, R.; Munasinghe, M. Climate change and agriculture in Sri Lanka: A Ricardian valuation. Environ. Dev. Econ. 2005, 10, 581–596. [Google Scholar] [CrossRef]
  84. Willson, K.C.; Clifford, M.N. Tea: Cultivation to Consumption; Springer Science & Business Media: Dordrecht, The Netherlands, 2012. [Google Scholar]
  85. Dharmadasa, M.; Zubair, L.; Nijamdeen, A.; Najimuddin, N. Review of tea industry in Sri Lanka for climate analysis. In Tropical Climate; Mahawelli Authority of Sri Lanka, Ed.; Dilmah Conservation Center for Climate Change Research & Adaptation: Nawalapitiya, Sri Lanka, 2018. [Google Scholar]
  86. Palihakkara, I.R.; Mohammed, A.J.; Inoue, M. Current Livelihood Condition of and Futurity of Tea Farming for Marginal Small Tea Farm Holders (MSTH) of Sri Lanka: Case Study from Badulla and Matara District. Environ. Nat. Resour. Res. 2015, 5, 11. [Google Scholar] [CrossRef]
Figure 1. Process for analysis of the suitability of land for tea.
Agriculture 09 00148 g001
Figure 2. Causal diagram for nine criteria used for the land suitability assessment for tea.
Agriculture 09 00148 g002
Figure 3. Criteria distribution maps of the study area climatic factors (rainfall (a) and temperature (b)), elevation (c), soil types (d), slope (e), and other soil characteristics (pH (f), drainage (g), depth (h) and texture (i)).
Agriculture 09 00148 g003
Figure 4. Land suitability classes for tea in Sri Lanka.
Agriculture 09 00148 g004
Figure 5. Land suitability assessment according to district basis.
Agriculture 09 00148 g005
Figure 6. Coordinates of highly suitable modelled areas and existing tea cultivation areas.
Agriculture 09 00148 g006
Table 1. Crop requirements for tea in relation to the selected criteria.
CriteriaRange of Suitability (From Very Highly Suitable (5) to Unsuitable (1))References
Very Highly Suitable (5)Highly Suitable (4)Moderately Suitable (3)Low Suitability (2)Unsuitable (1)[6,68]
Soil Parameters
Soil depth50–10010–50100–150>150<10[20,63,69]
Soil textureLoam/OrganicSilt loam/HeavySandy loam/Medium Clay, sandy/Light[20,63,69]
Soil pH4.5–5.55.5–7.2<4.57.2–8.5>8.5[20,63,69]
Soil drainageWell drained (28–48)Moderately well drained (48–58)Excessively drained (10–28)Imperfectly drained (58–74) Poorly d rained (74–97)Water bodies[63,70]
Soil typeRed-yellow podzolic, Red yellopodzolic soils and mountain regosols, Red-yellopodzolic soil with dark B horizon red yellow podzolic soilRed-yellow podzolic soils with semi prominent Al horizon, Reddish brown earths and immature brown loams, Reddish Brown Latasolic soilsRed-yellow latosols, red-yellow podzolic soils with soft or hard laterite, red-yellow podzolic soils with strongly mottled subsoilImmature Brown Loam, Reddish brown earth and low humicgley soils, Reddish Brown Earths and SolodizedSolonetz, Reddish Brown Earths Non-Calcic Brown Soils and low HumicGley soilsAlluvial Soil, Bog and Half-bog soil, Calcic-red yellow Latsols, Erosional remnants, Grumusols, Latosols and Regosols on old red and yellow sands. Non-Calcic Brown soil, Regosols on recent beach and dune sands, Regosols on recent beach sands, Rock knob plains and eroded lands, Solodized on recent marine calcareous sediment, Steep rockland and lithosols[63]
Climate parameters
Rainfall (mm)2500–30003000–35002000–25001500–20001000–1500[26]
Temperature (°C)19.5–2323–26.516–19.526.5–3030–33, 13.5–16[26]
Topography parameters
Slope≥15–25 (Moderate Slope)>5–7 (Gentle Slope)<5 (Very Gentle Slope)>25–35 (Steep Slope)>35 (Very steep Slope)[6,63,71]
Elevation600–2000 m300–600 m2000–2500 m100–300 m0–100 mOwn elaboration based on Xin, Youhua [67]
Table 2. Scale of relative importance according to Saaty [73] (Note: 1 is the highest importance and 9 is the least importance).
Intensity of ImportanceDefinition Description
1Equal importanceTwo factors contribute equally to the objective
3Moderate importance of one factor over anotherExperience and judgment favor each other slightly
5Strong or essential importanceExperience and judgement strongly favor one over the other
7Very strong importanceExperience and judgement very strongly favor one over the other. Its importance is demonstrated in practice
9Extreme importanceThe evidence favoring one over the other is of the highest possible validity
2,4,6,8Intermediate valuesWhen Compromise is needed
Table 3. Random Consistency Index (RCI).
n123456789101112131415
RCI000.580.901.121.241.321.411.451.491.511.481.561.571.59
Table 4. Matrix comparing the relative importance of land use requirements for tea cultivation.
CriteriaTemperatureRainfallElevationSoil TypeSlopepHDrainageDepthTexture
Temperature1½2335777
Rainfall 12335777
Elevation 1335777
Soil Type 133555
Slope 13555
pH 1333
Drainage 133
Depth 13
Texture 1
Sum4.93.26.311.313.92335.538.341
(The numbers show the rating of the row factors relative to the column factor). Note: for example, rainfall is more important for tea cultivation than soil texture. (If the soil texture is “a,” then the rainfall value can be given as “7a” and the raw value is “7”).
Table 5. Analytical Hierarchical Process (AHP) analysis for the assessment of the relative importance of climate, soil and topography parameters; normalized matrix with results.
CriteriaTemperatureRainfallElevationSoil TypeSlopepHDrainageDepthTextureTotalPriority Vector Influence %
Temperature0.200.160.320.270.220.220.200.180.171.930.2121.4
Rainfall0.410.320.320.270.220.220.200.180.172.290.2525.4
Elevation0.100.160.160.270.220.220.200.180.171.670.1918.5
Soil Type0.070.110.050.090.220.130.140.130.121.050.1211.7
Slope0.070.060.050.030.070.130.140.130.120.810.099.0
pH0.070.060.030.030.020.040.080.080.070.500.065.5
Drainage0.030.050.020.020.010.010.030.080.070.320.043.6
Depth0.030.050.020.020.010.010.010.030.070.250.032.8
Texture0.030.050.020.020.010.010.010.010.020.180.022.0
Eigenvalue (λmax) = 10.0, Consistency Index (CI) = 0.13, Consistency Ratio (CR) = 0.09.
Table 6. The initial direct influence matrix (A).
CriteriaTemperatureRainfallElevationSoil TypeSlopepHDrainageDepthTexture
Temperature043.332.33010.3310.67
Rainfall3.6702.672.331.6722.6700
Elevation32.3302.332.330.670.670.330.33
Soil Type000003.332.672.332.67
Slope0.3313.670.67011.671.330.33
pH11.3313.330.67010.331
Drainage00.6712.331.33101.671.33
Depth0002.670.331.33202
Texture0002.3301.672.33720
Table 7. The normalized direct influence matrix (X).
CriteriaTemperatureRainfallElevationSoil TypeSlopepHDrainageDepthTexture
Temperature0.000.230.190.130.000.060.020.060.04
Rainfall0.210.000.150.130.100.120.150.000.00
Elevation0.170.130.000.130.130.040.040.020.02
Soil Type0.000.000.000.000.000.190.150.130.15
Slope0.020.060.210.040.000.060.100.080.02
pH0.060.080.060.190.040.000.060.020.06
Drainage0.000.040.060.130.080.060.000.100.08
Depth0.000.000.000.150.020.080.120.000.12
Texture0.000.000.000.130.000.100.130.120.00
Table 8. The matrix of total relations (T) and direct–indirect matrix.
CriteriaTemperatureRainfallElevationSoil TypeSlopepHDrainageDepthTexture
Temperature1.380.380.350.360.180.400.260.200.24
Rainfall0.401.530.340.310.210.380.460.280.31
Elevation0.360.231.000.230.210.320.360.300.32
Soil Type0.200.220.120.230.110.460.450.780.45
Slope0.100.150.140.161.470.360.130.110.12
pH0.180.220.190.400.110.140.150.170.23
Drainage0.150.340.190.270.090.170.130.170.17
Depth0.110.130.170.370.080.210.130.050.17
Texture0.140.130.140.100.110.110.360.120.11
Table 9. The values of significance and relationship indicators for criteria and their weights.
CriteriaSum Successive Rows of Di MatrixSum of Each Column of the rj MatrixSignificance Indicator (di + rj)Relationship Indicator (dirj)Average RatesScales
Temperature3.7523.0086.7600.7453.7520.161
Rainfall4.2163.3257.5410.8914.2160.181
Elevation3.3472.6325.9790.7163.3470.144
Soil Type3.0202.4215.4410.5993.0200.130
Slope2.7362.5705.3060.1662.7360.118
pH1.7922.5474.339−0.7551.7920.077
Drainage1.6762.4364.111−0.7601.6760.072
Depth1.4202.1813.601−0.7611.4200.061
Texture1.3132.1213.434−0.8081.3130.056
Threshold value = 0.287∑ = 23.2721.00
Table 10. The final weights for criteria combining the AHP and Decision-Making Trail and Evaluation Laboratory (DEMATEL) model for the land suitability assessment for tea.
CriteriaAHPDEMATELAverage Weights of AHP–DEMATELInfluence %Rank
Temperature0.210.160.1918.562
Rainfall0.250.180.2221.561
Elevation0.190.140.1716.693
Soil Type0.120.130.1212.494
Slope0.090.120.1010.385
pH0.060.080.076.856
Drainage0.040.070.065.607
Depth0.030.060.054.558
Texture0.020.060.043.829
Table 11. Potential land area in each suitability class.
Suitability ClassesTotal Area (km2) Percentage (%)
Unsuitable18,69528.5
Low suitability27,58142.1
Moderately suitable813712.4
Highly suitable949814.5
Very highly suitable16272.5
Table 12. The percentage of existing tea-growing areas intersected with each of the modelled suitability classes.
Suitability ClassesModelled Area under Existing Tea Land Cover (km2)Percentage (%)
Unsuitable1.840.08
Low suitability8.30.36
Moderately suitable163.47.10
Highly suitable1437.2862.45
Very highly suitable690.5630.01

