Morphological and Agronomic Characterization of Spanish Landraces of Phaseolus vulgaris L.


 and
and
Abstract
:1. Introduction
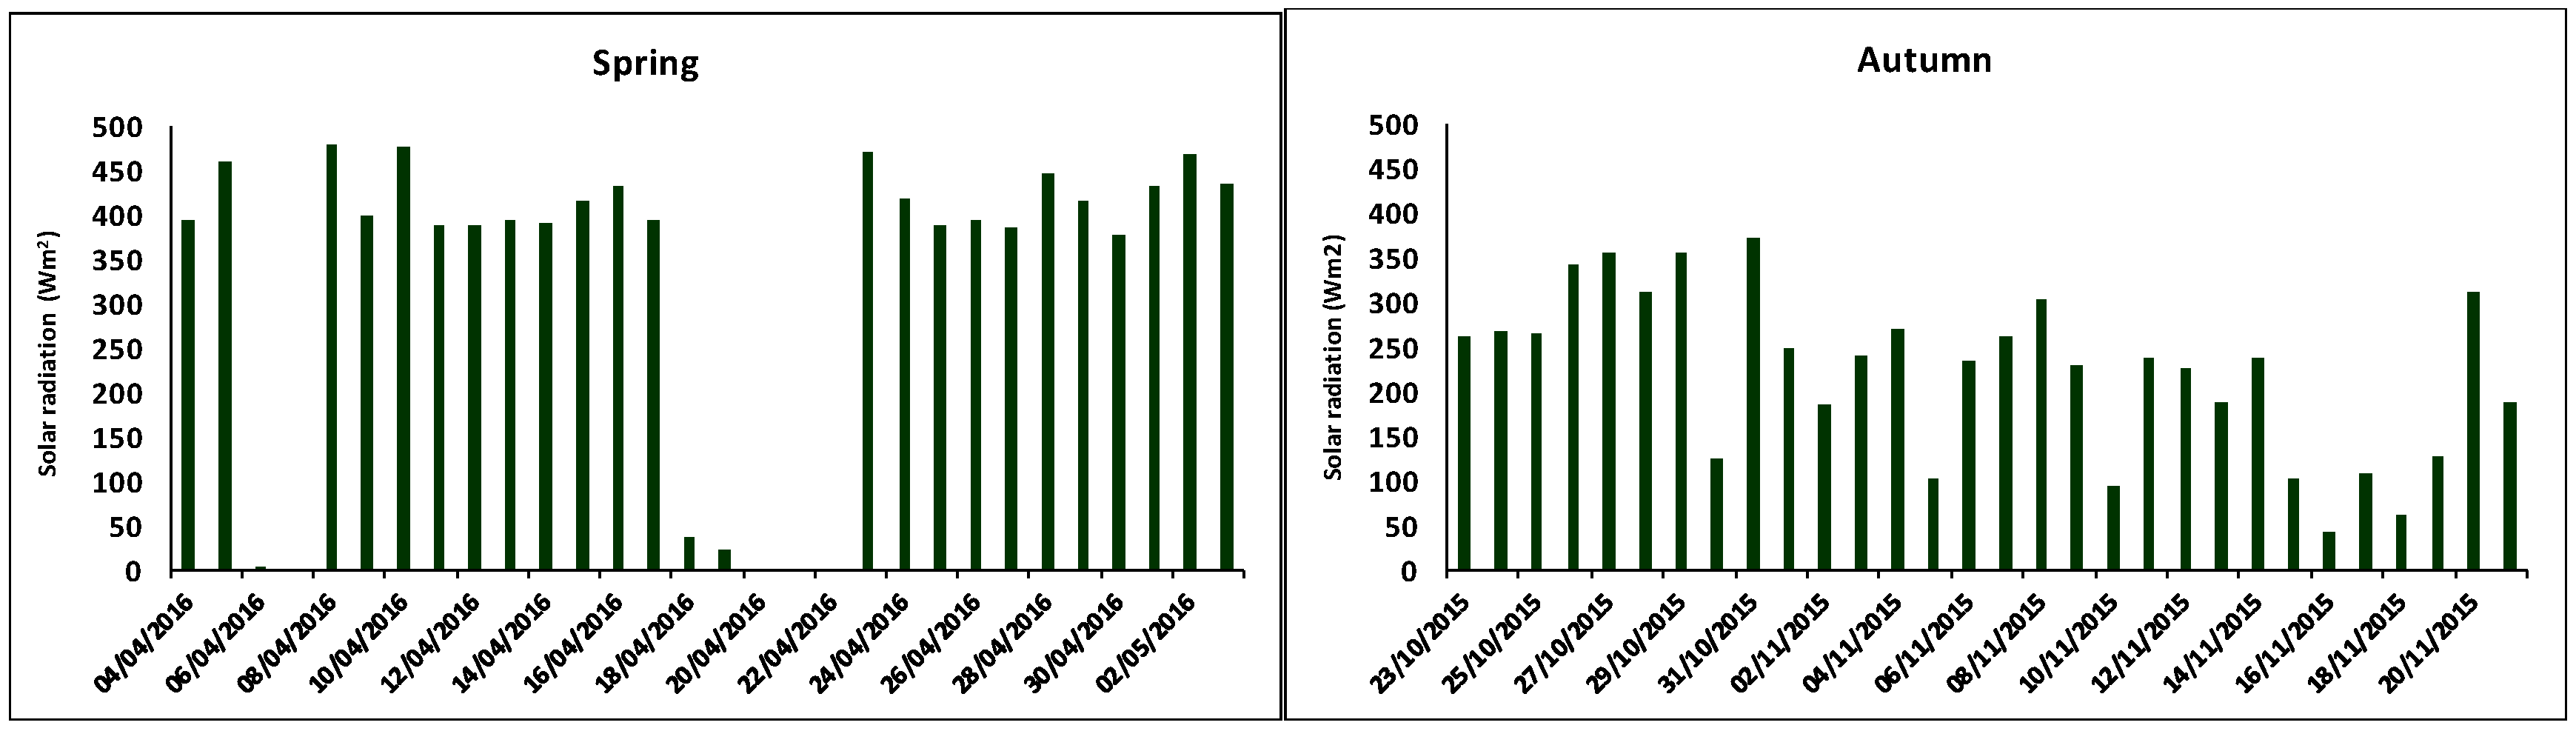
2. Materials and Methods
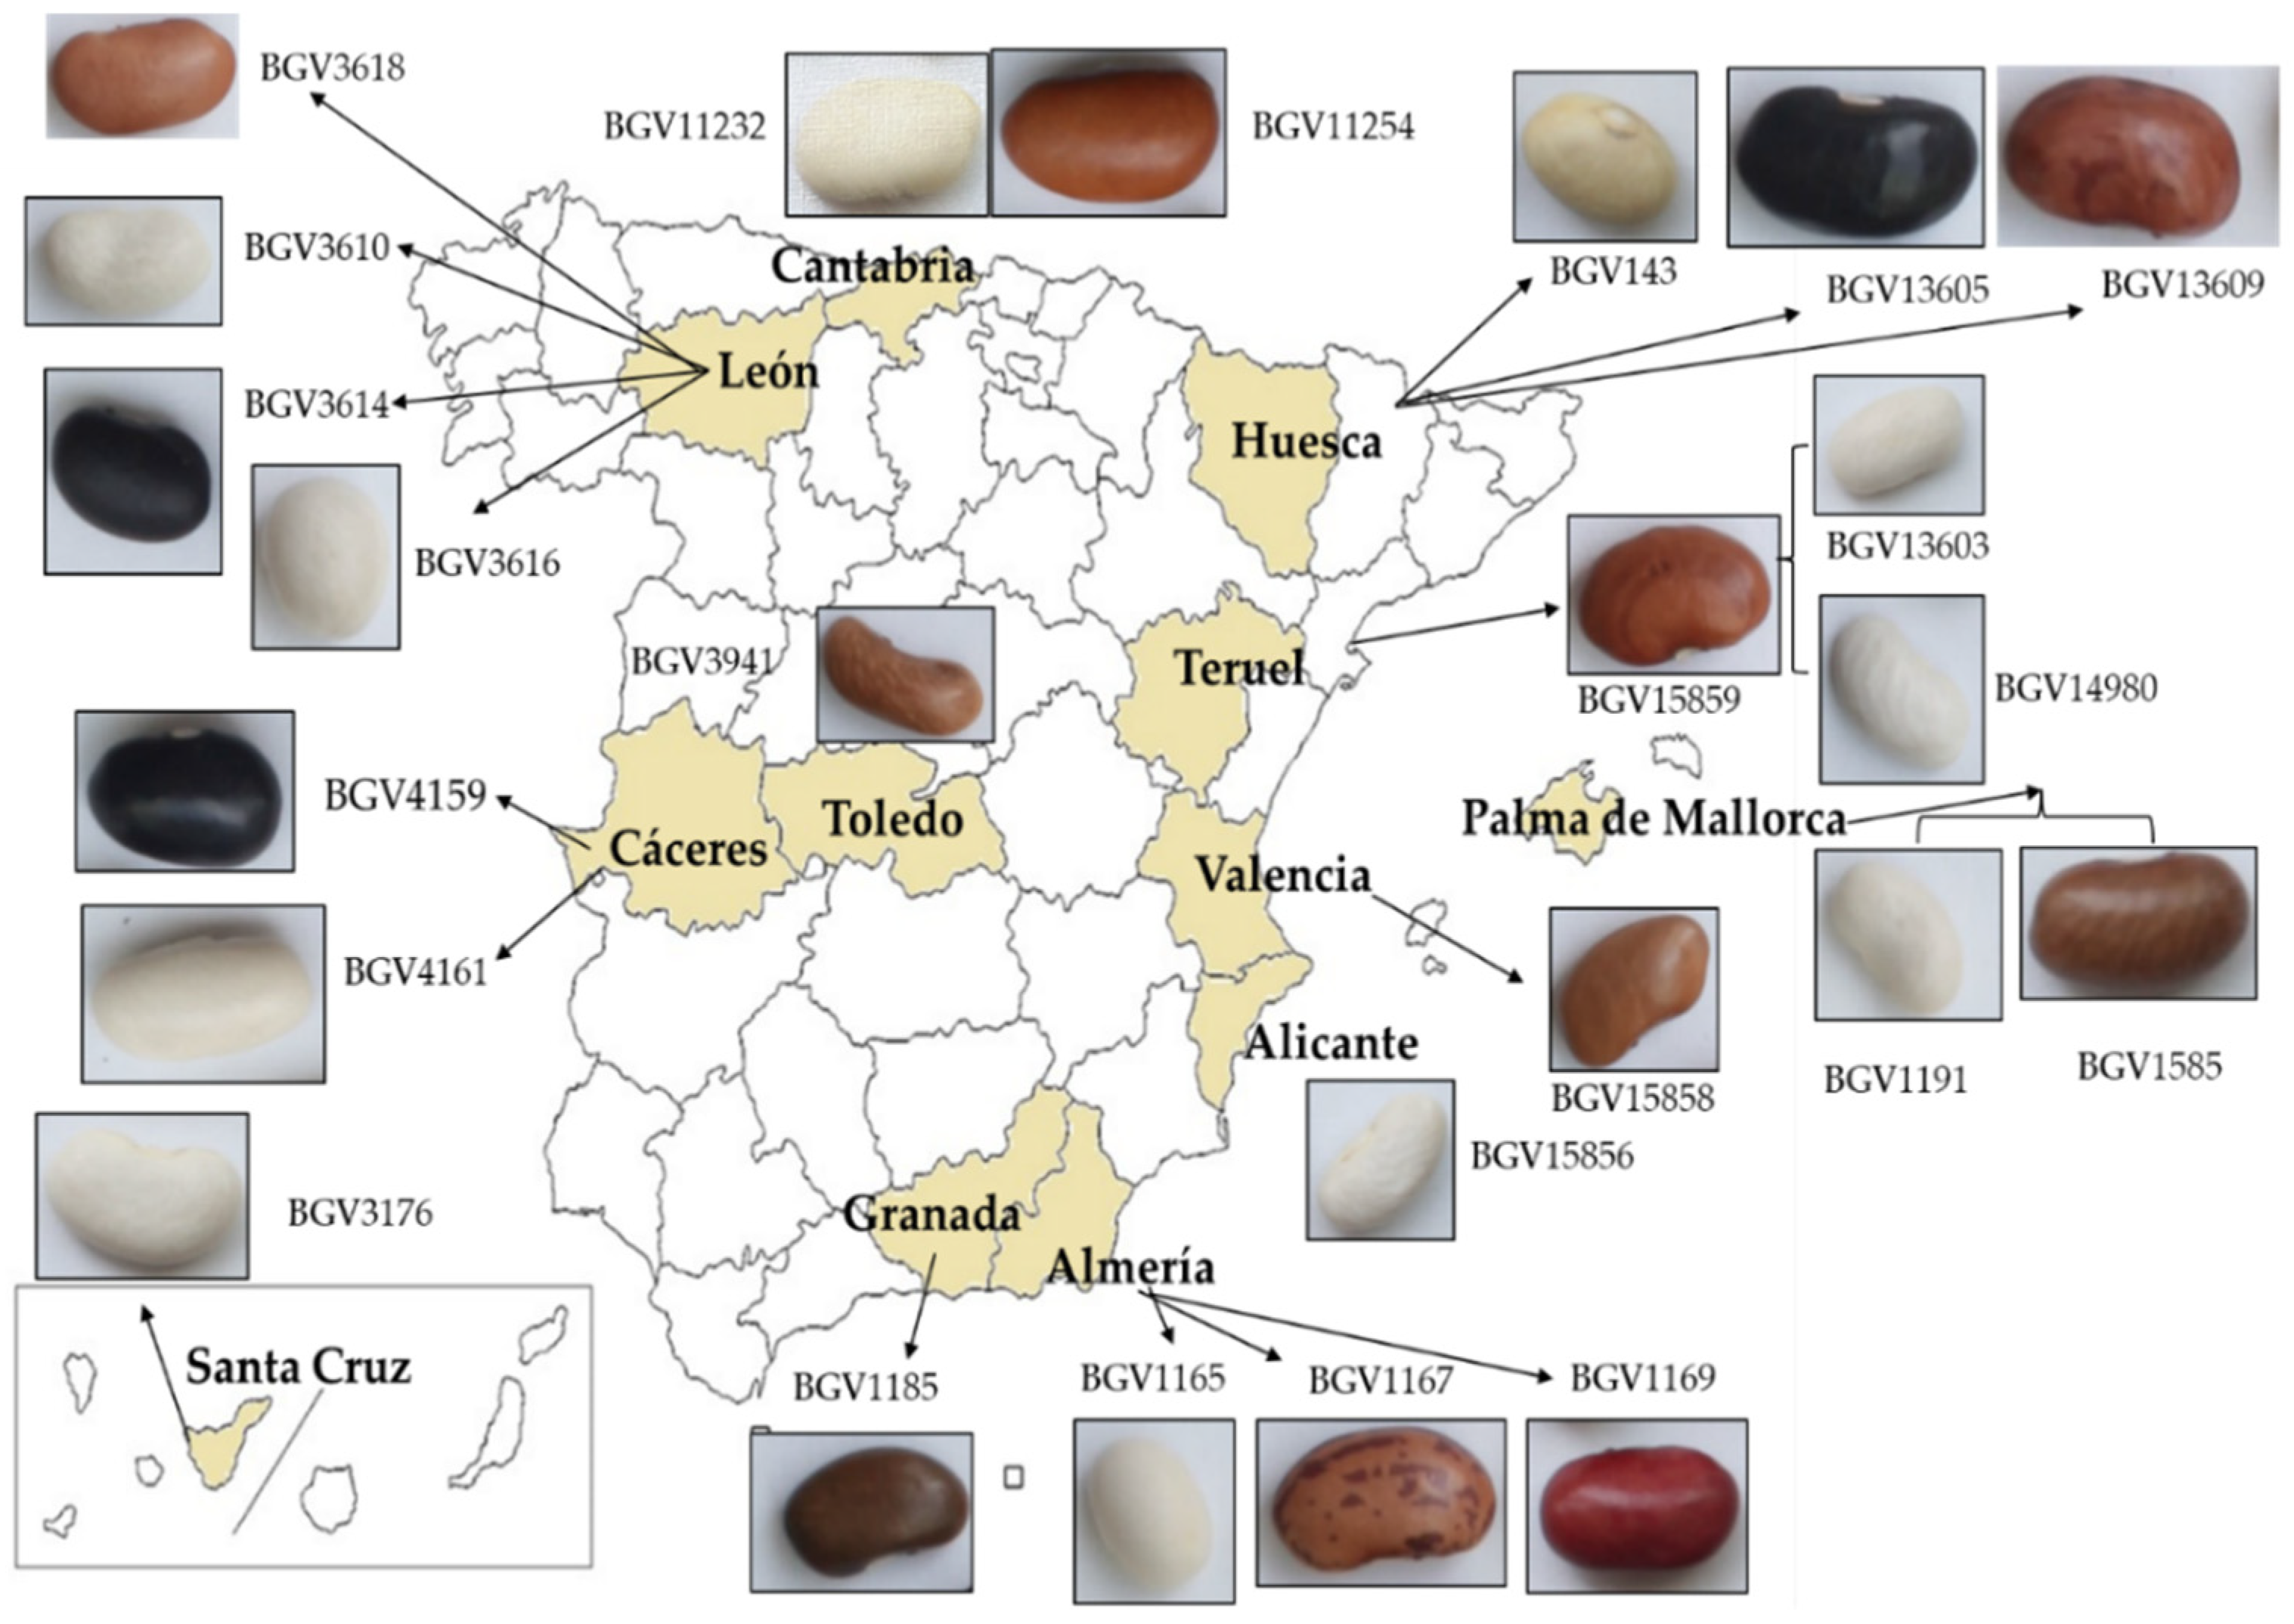
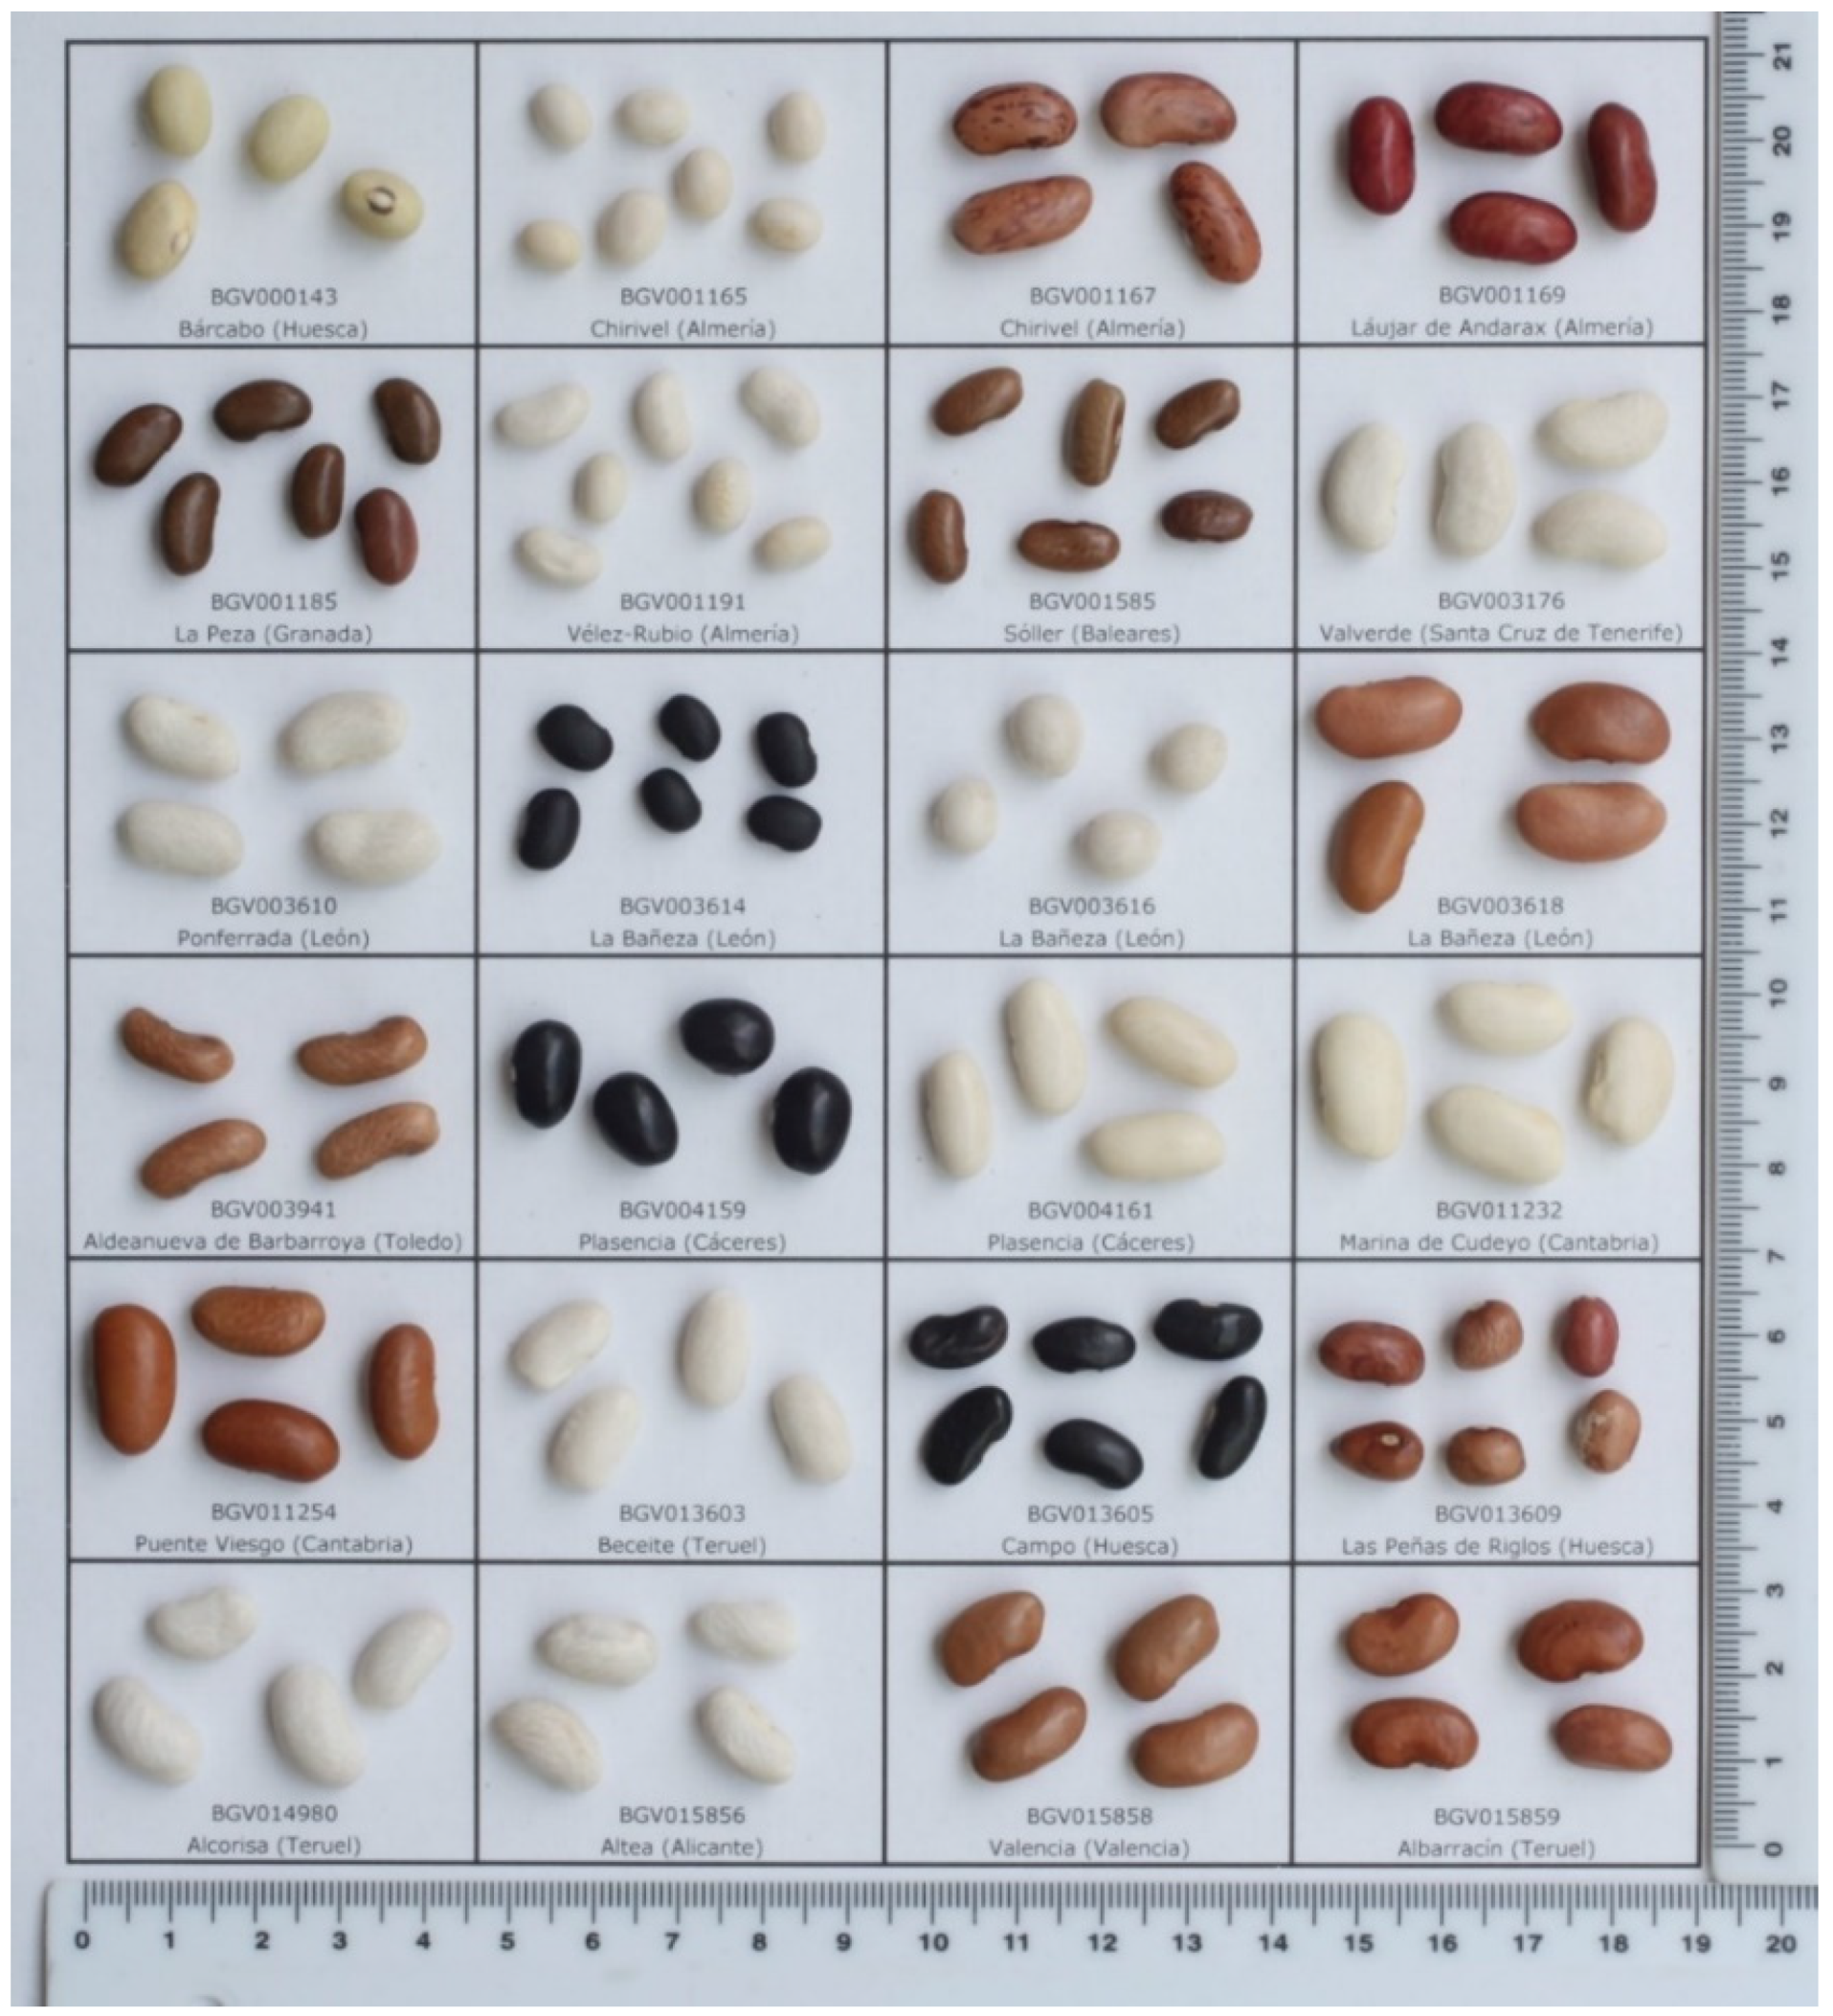
2.1. Seed Material
2.2. Descriptors Used for the Agronomic Characterization
2.3. Data Analysis
3. Results
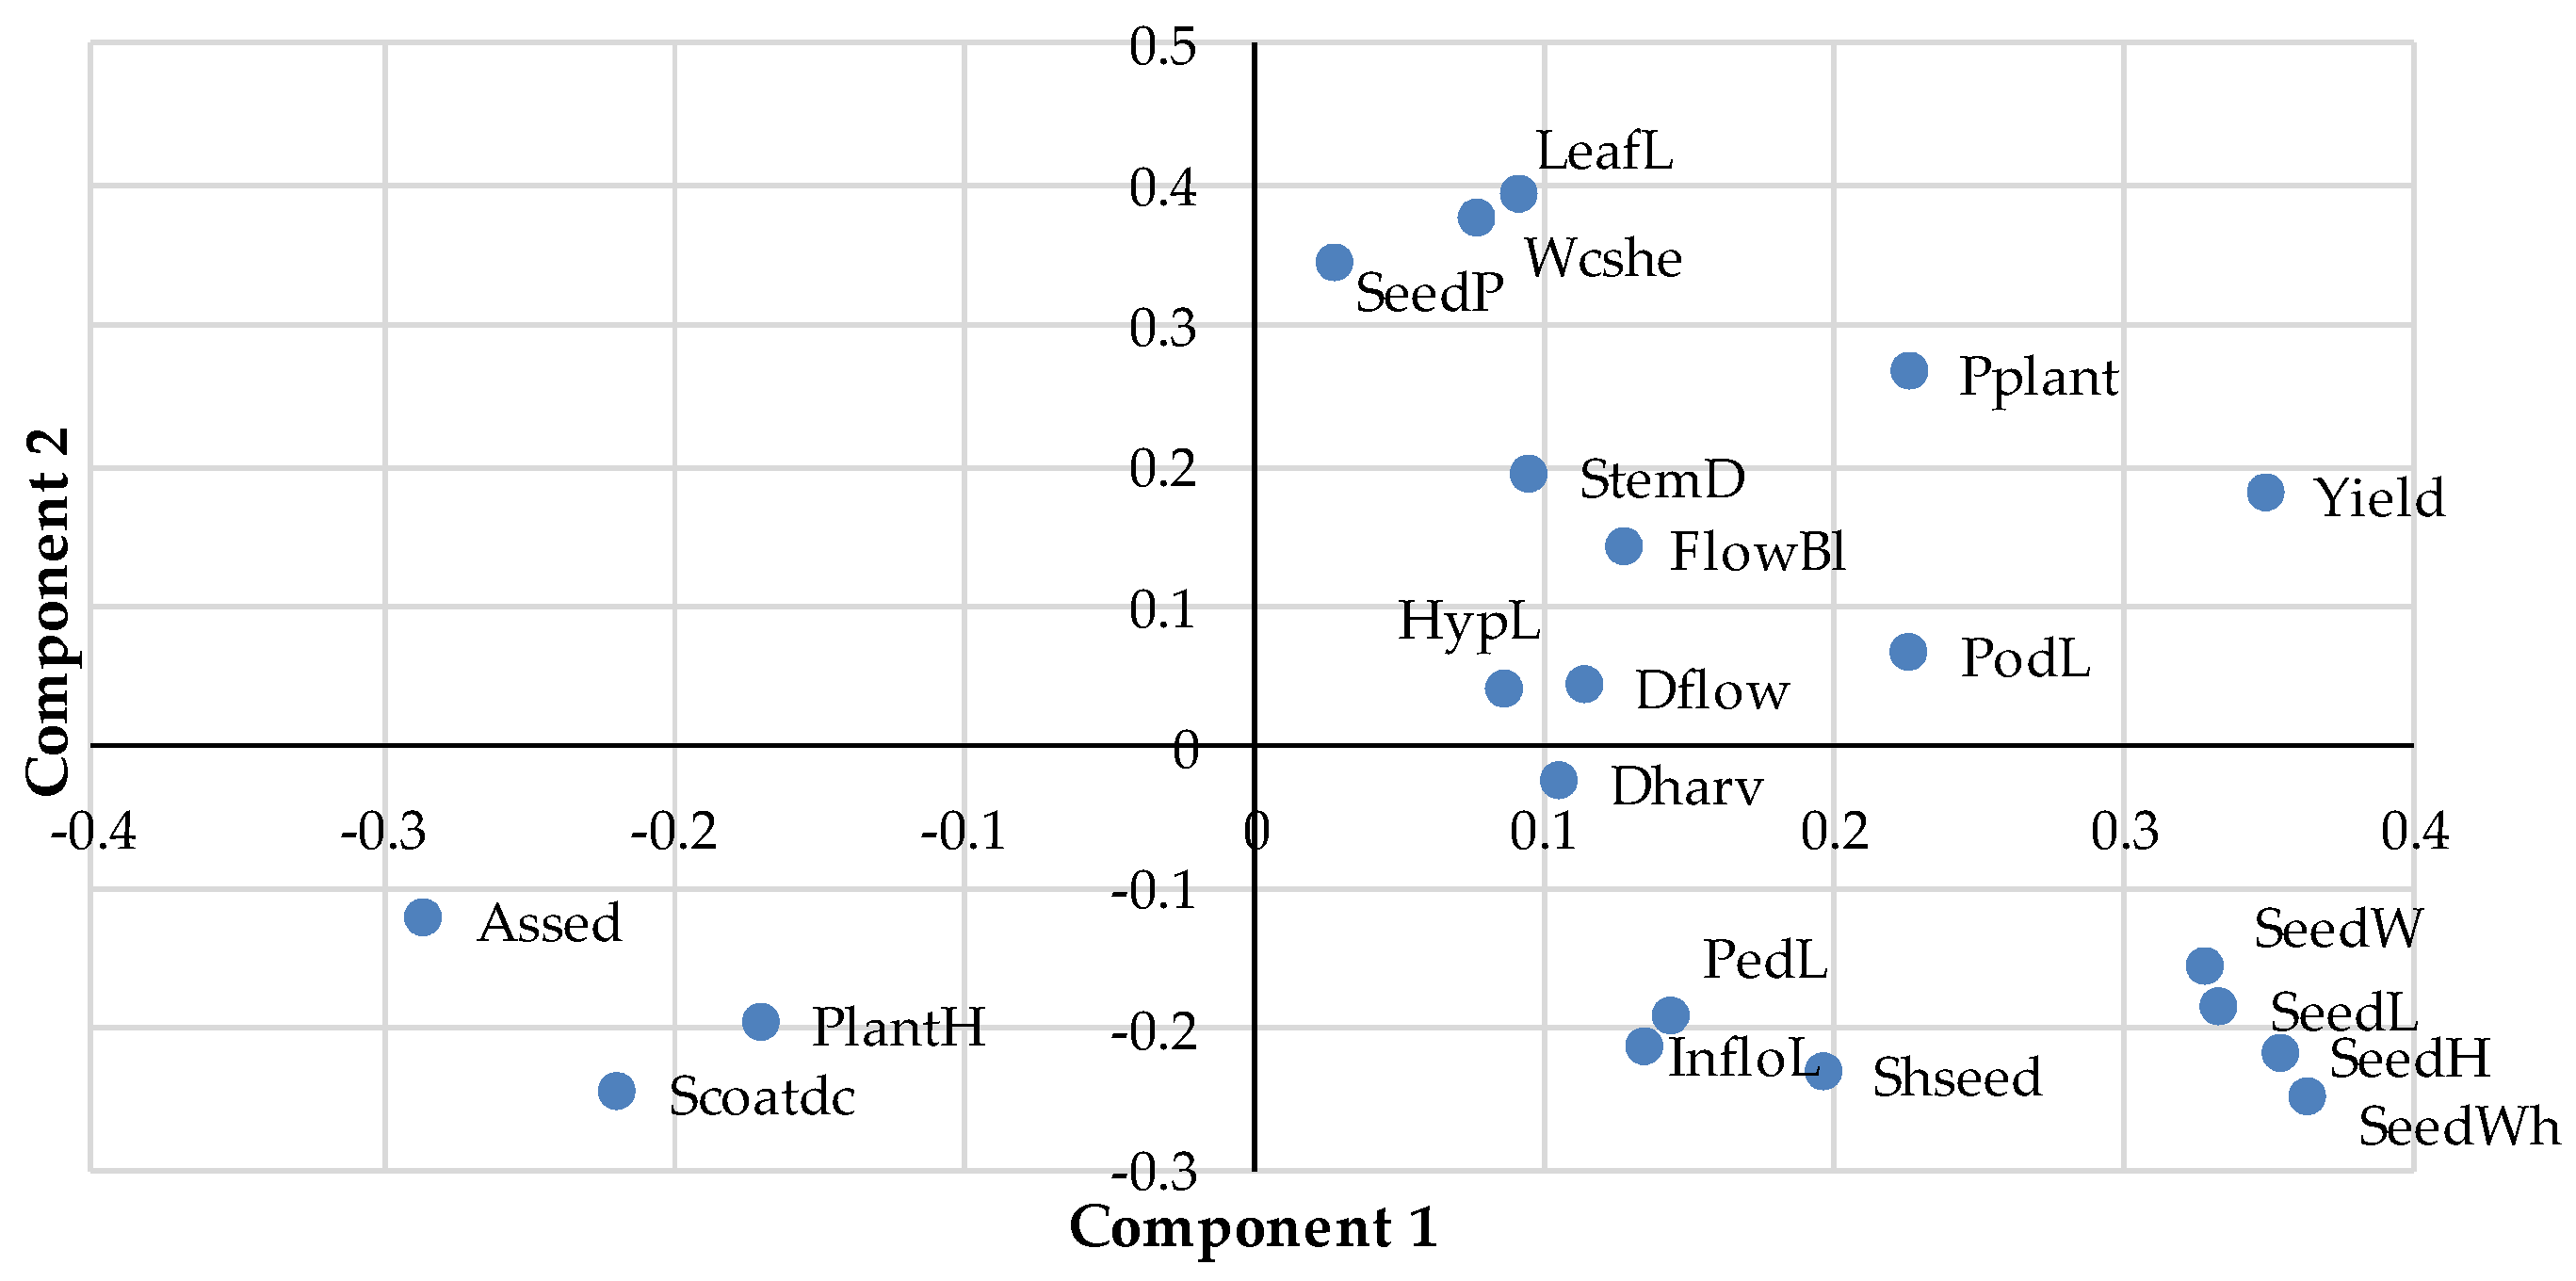
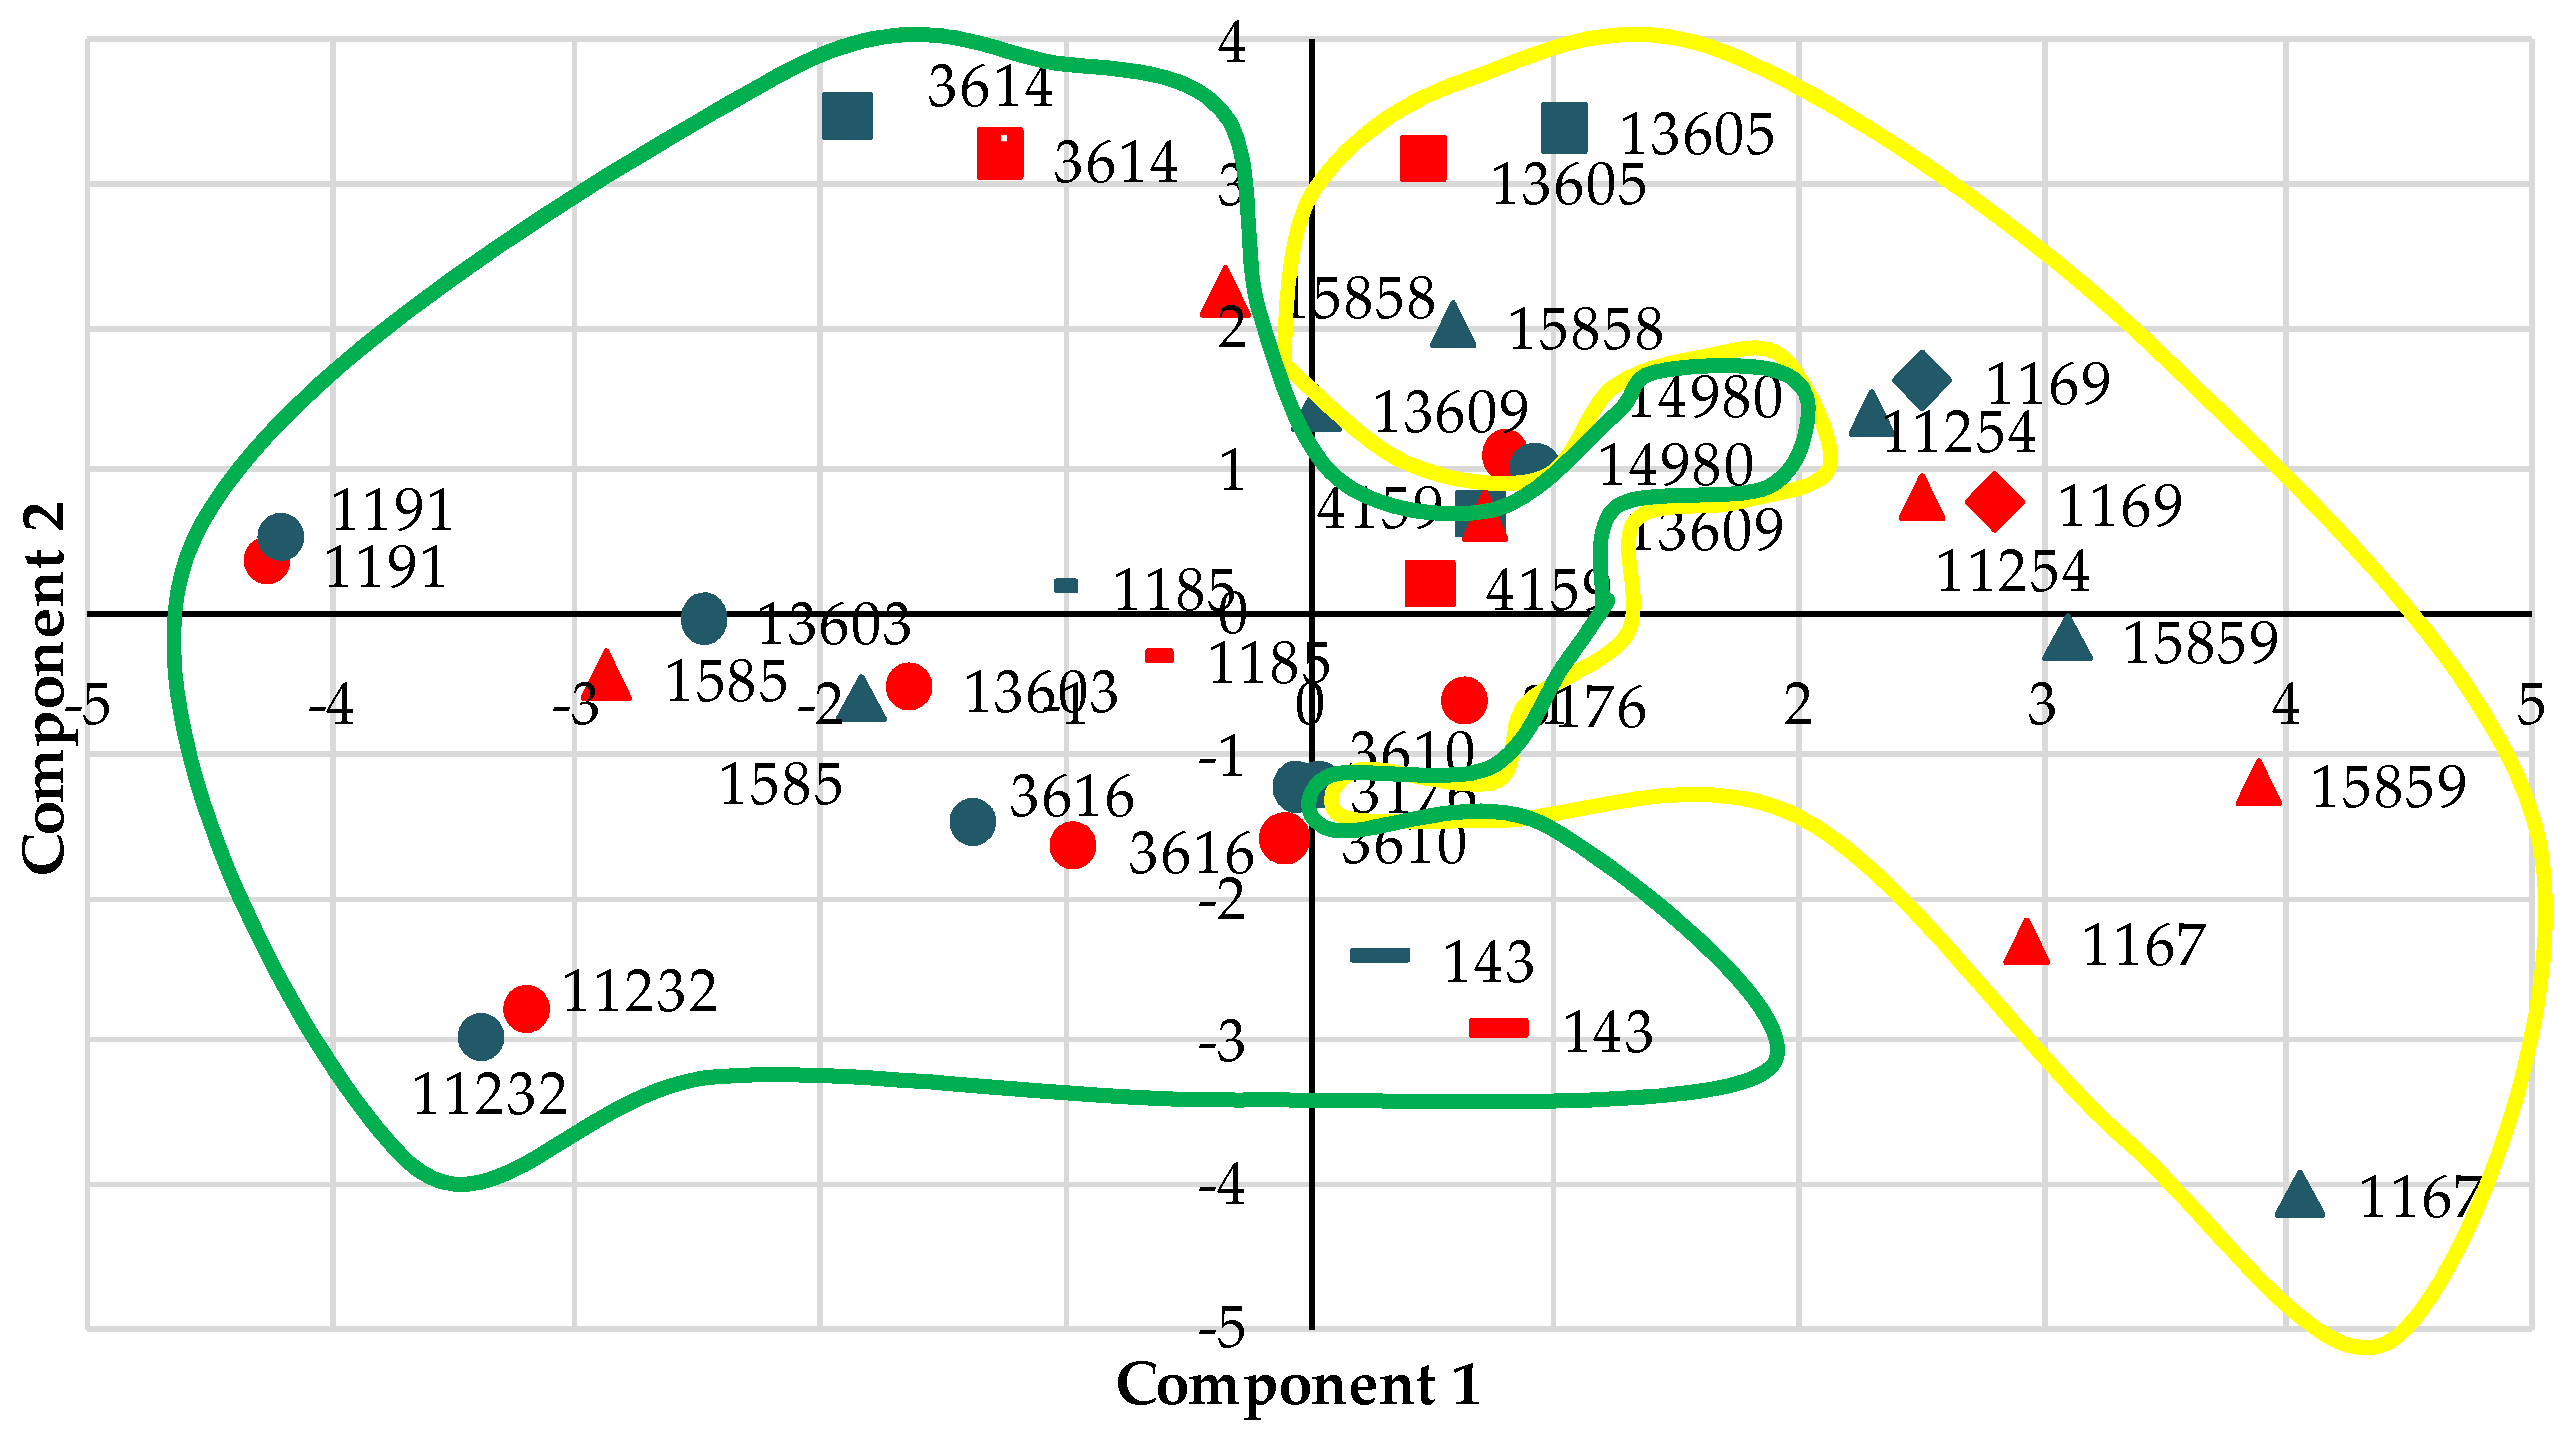
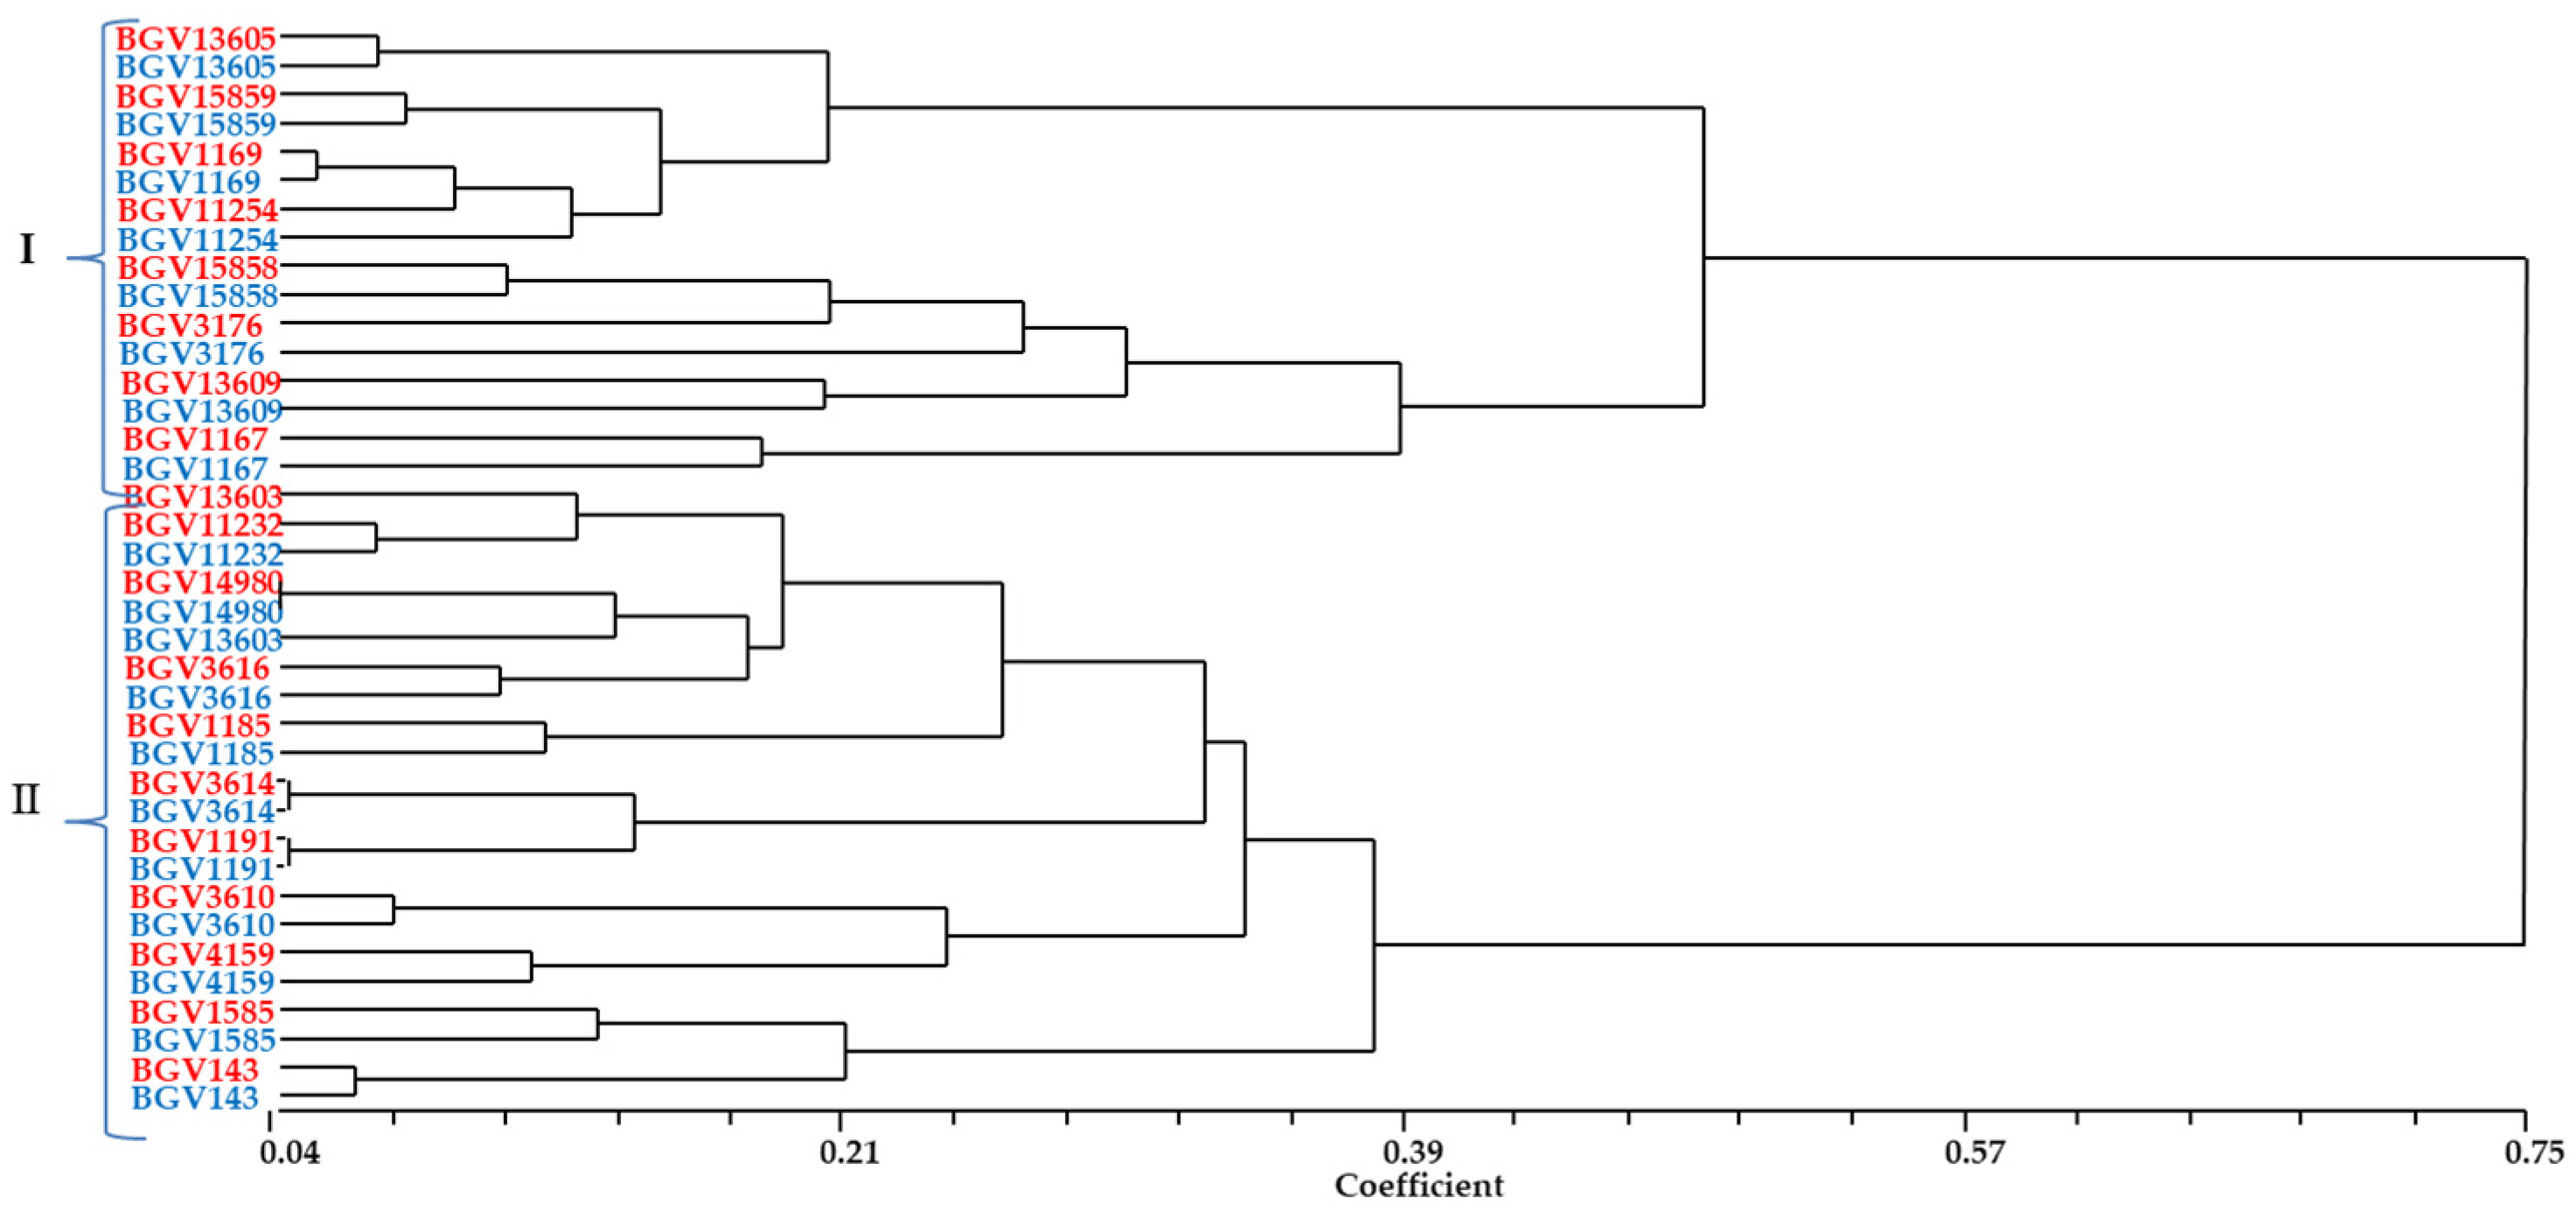
3.1. Principal Component Analysis and Cluster Analysis
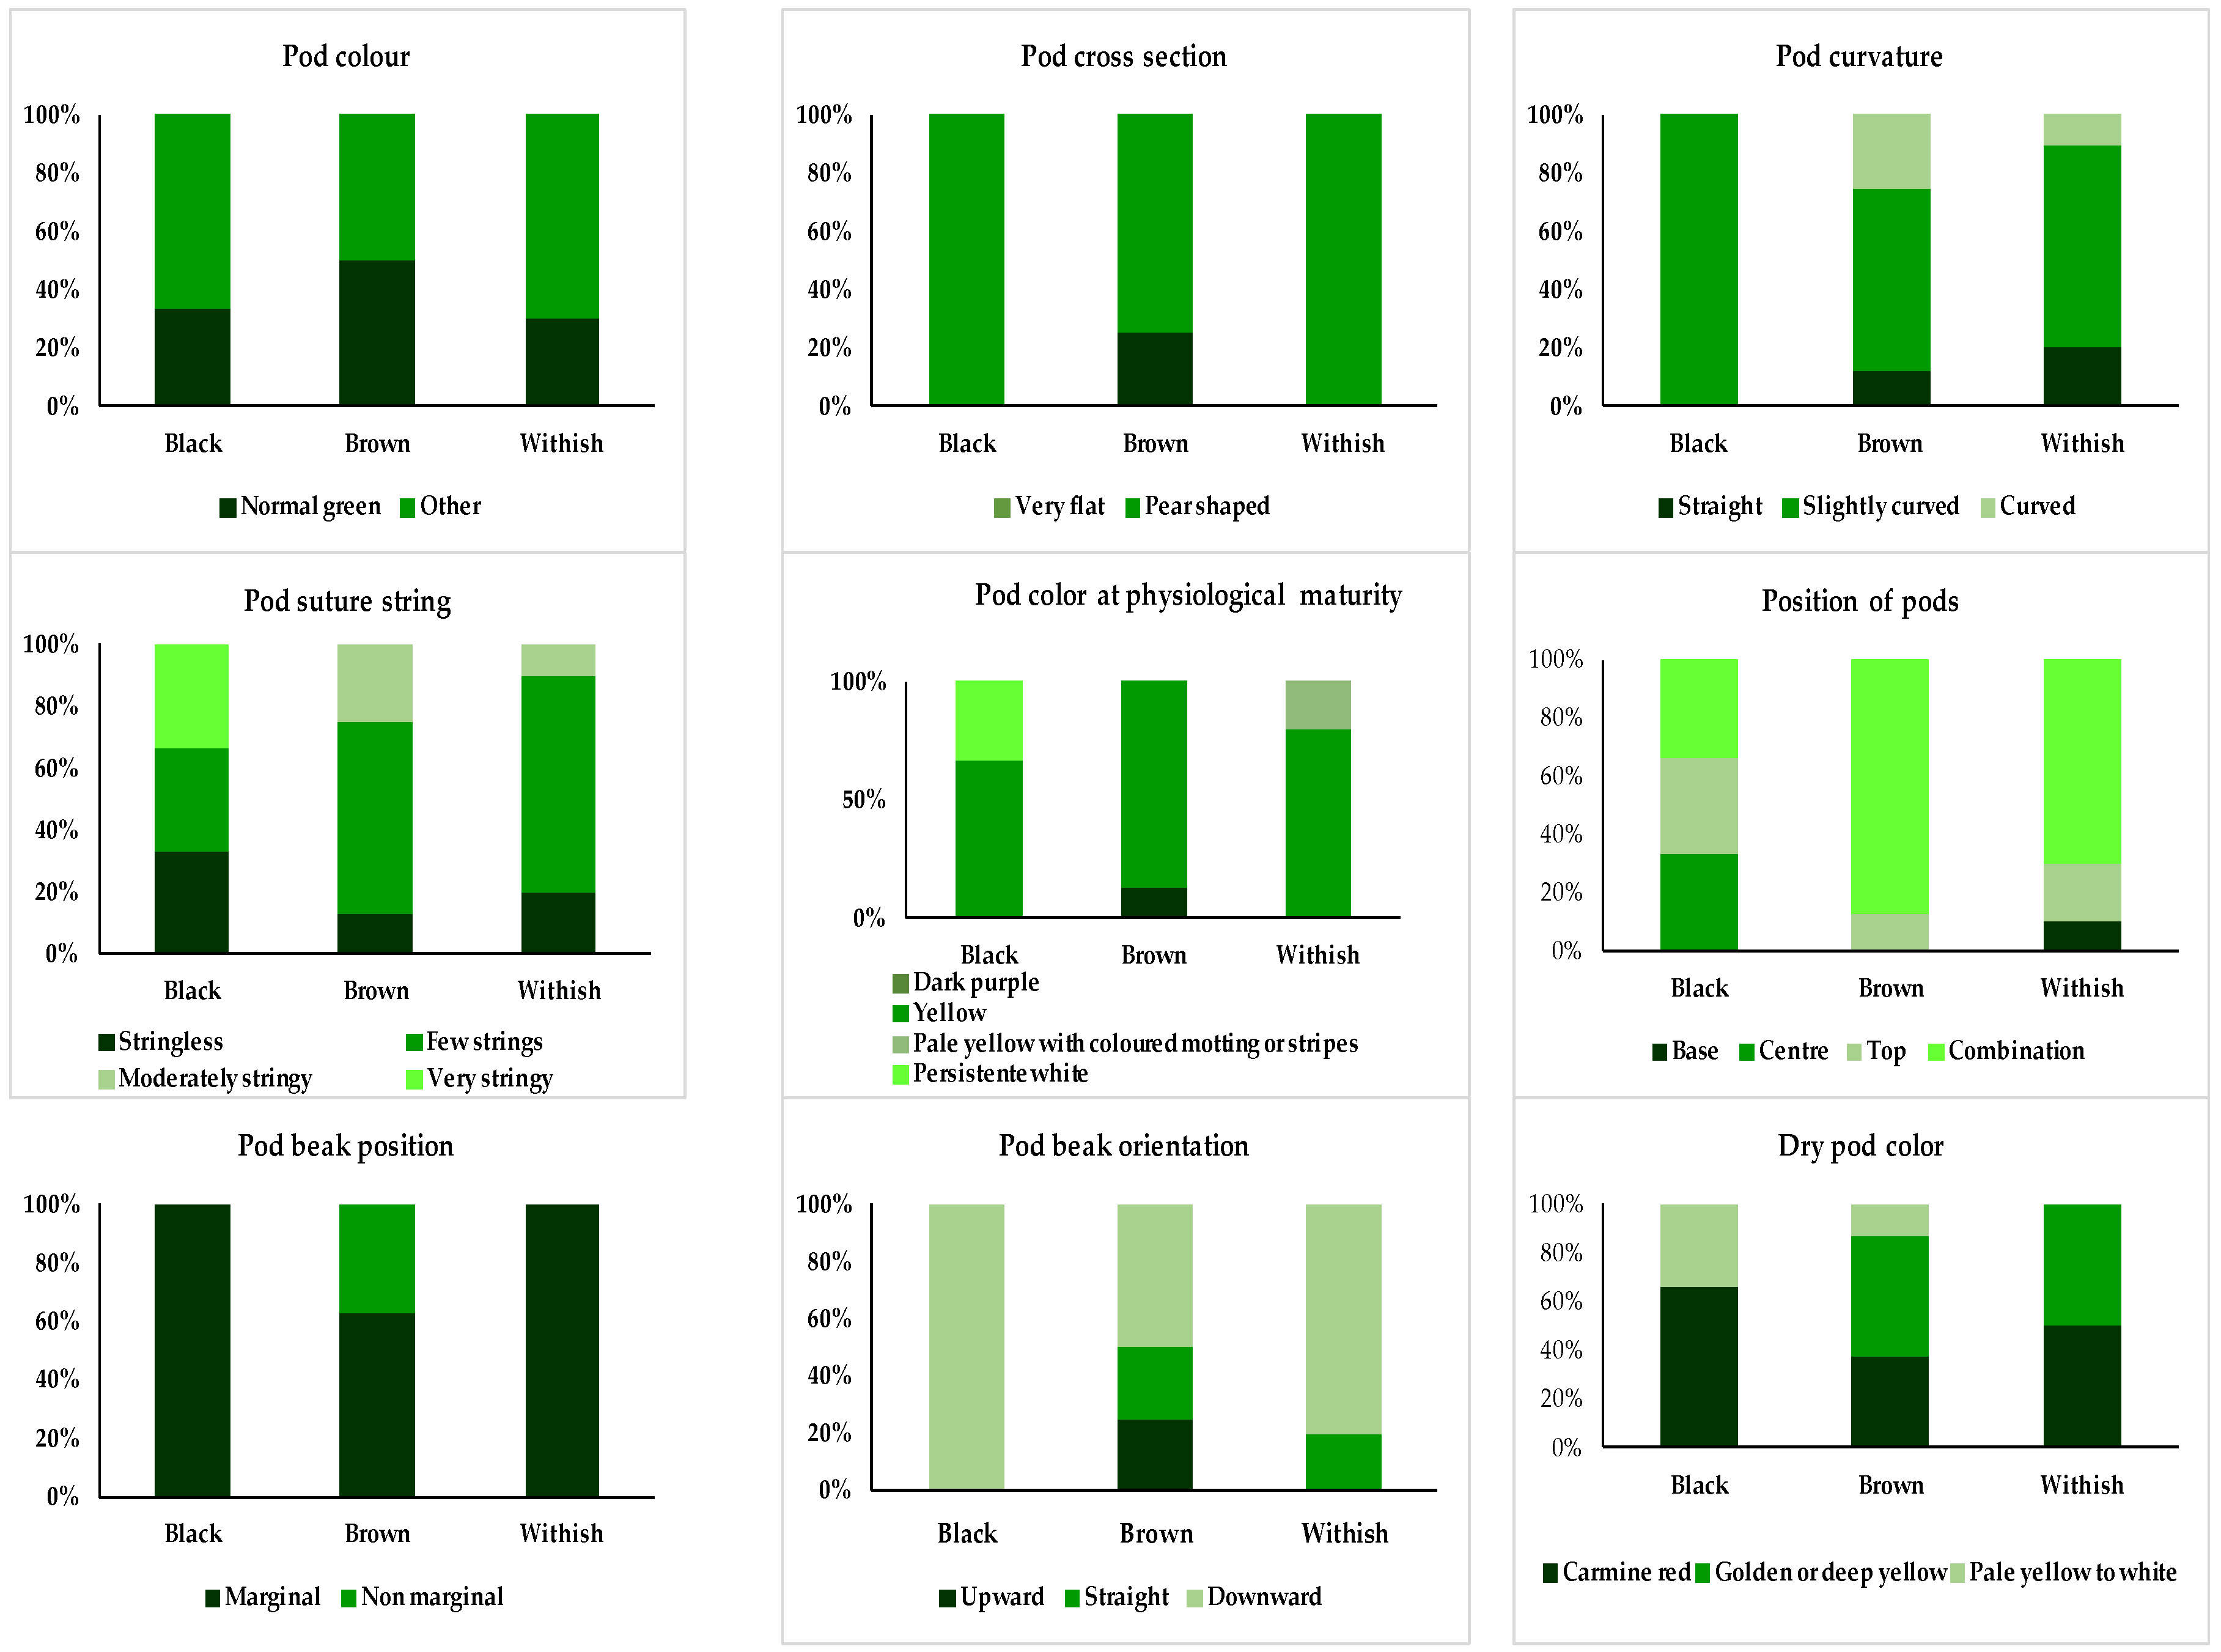
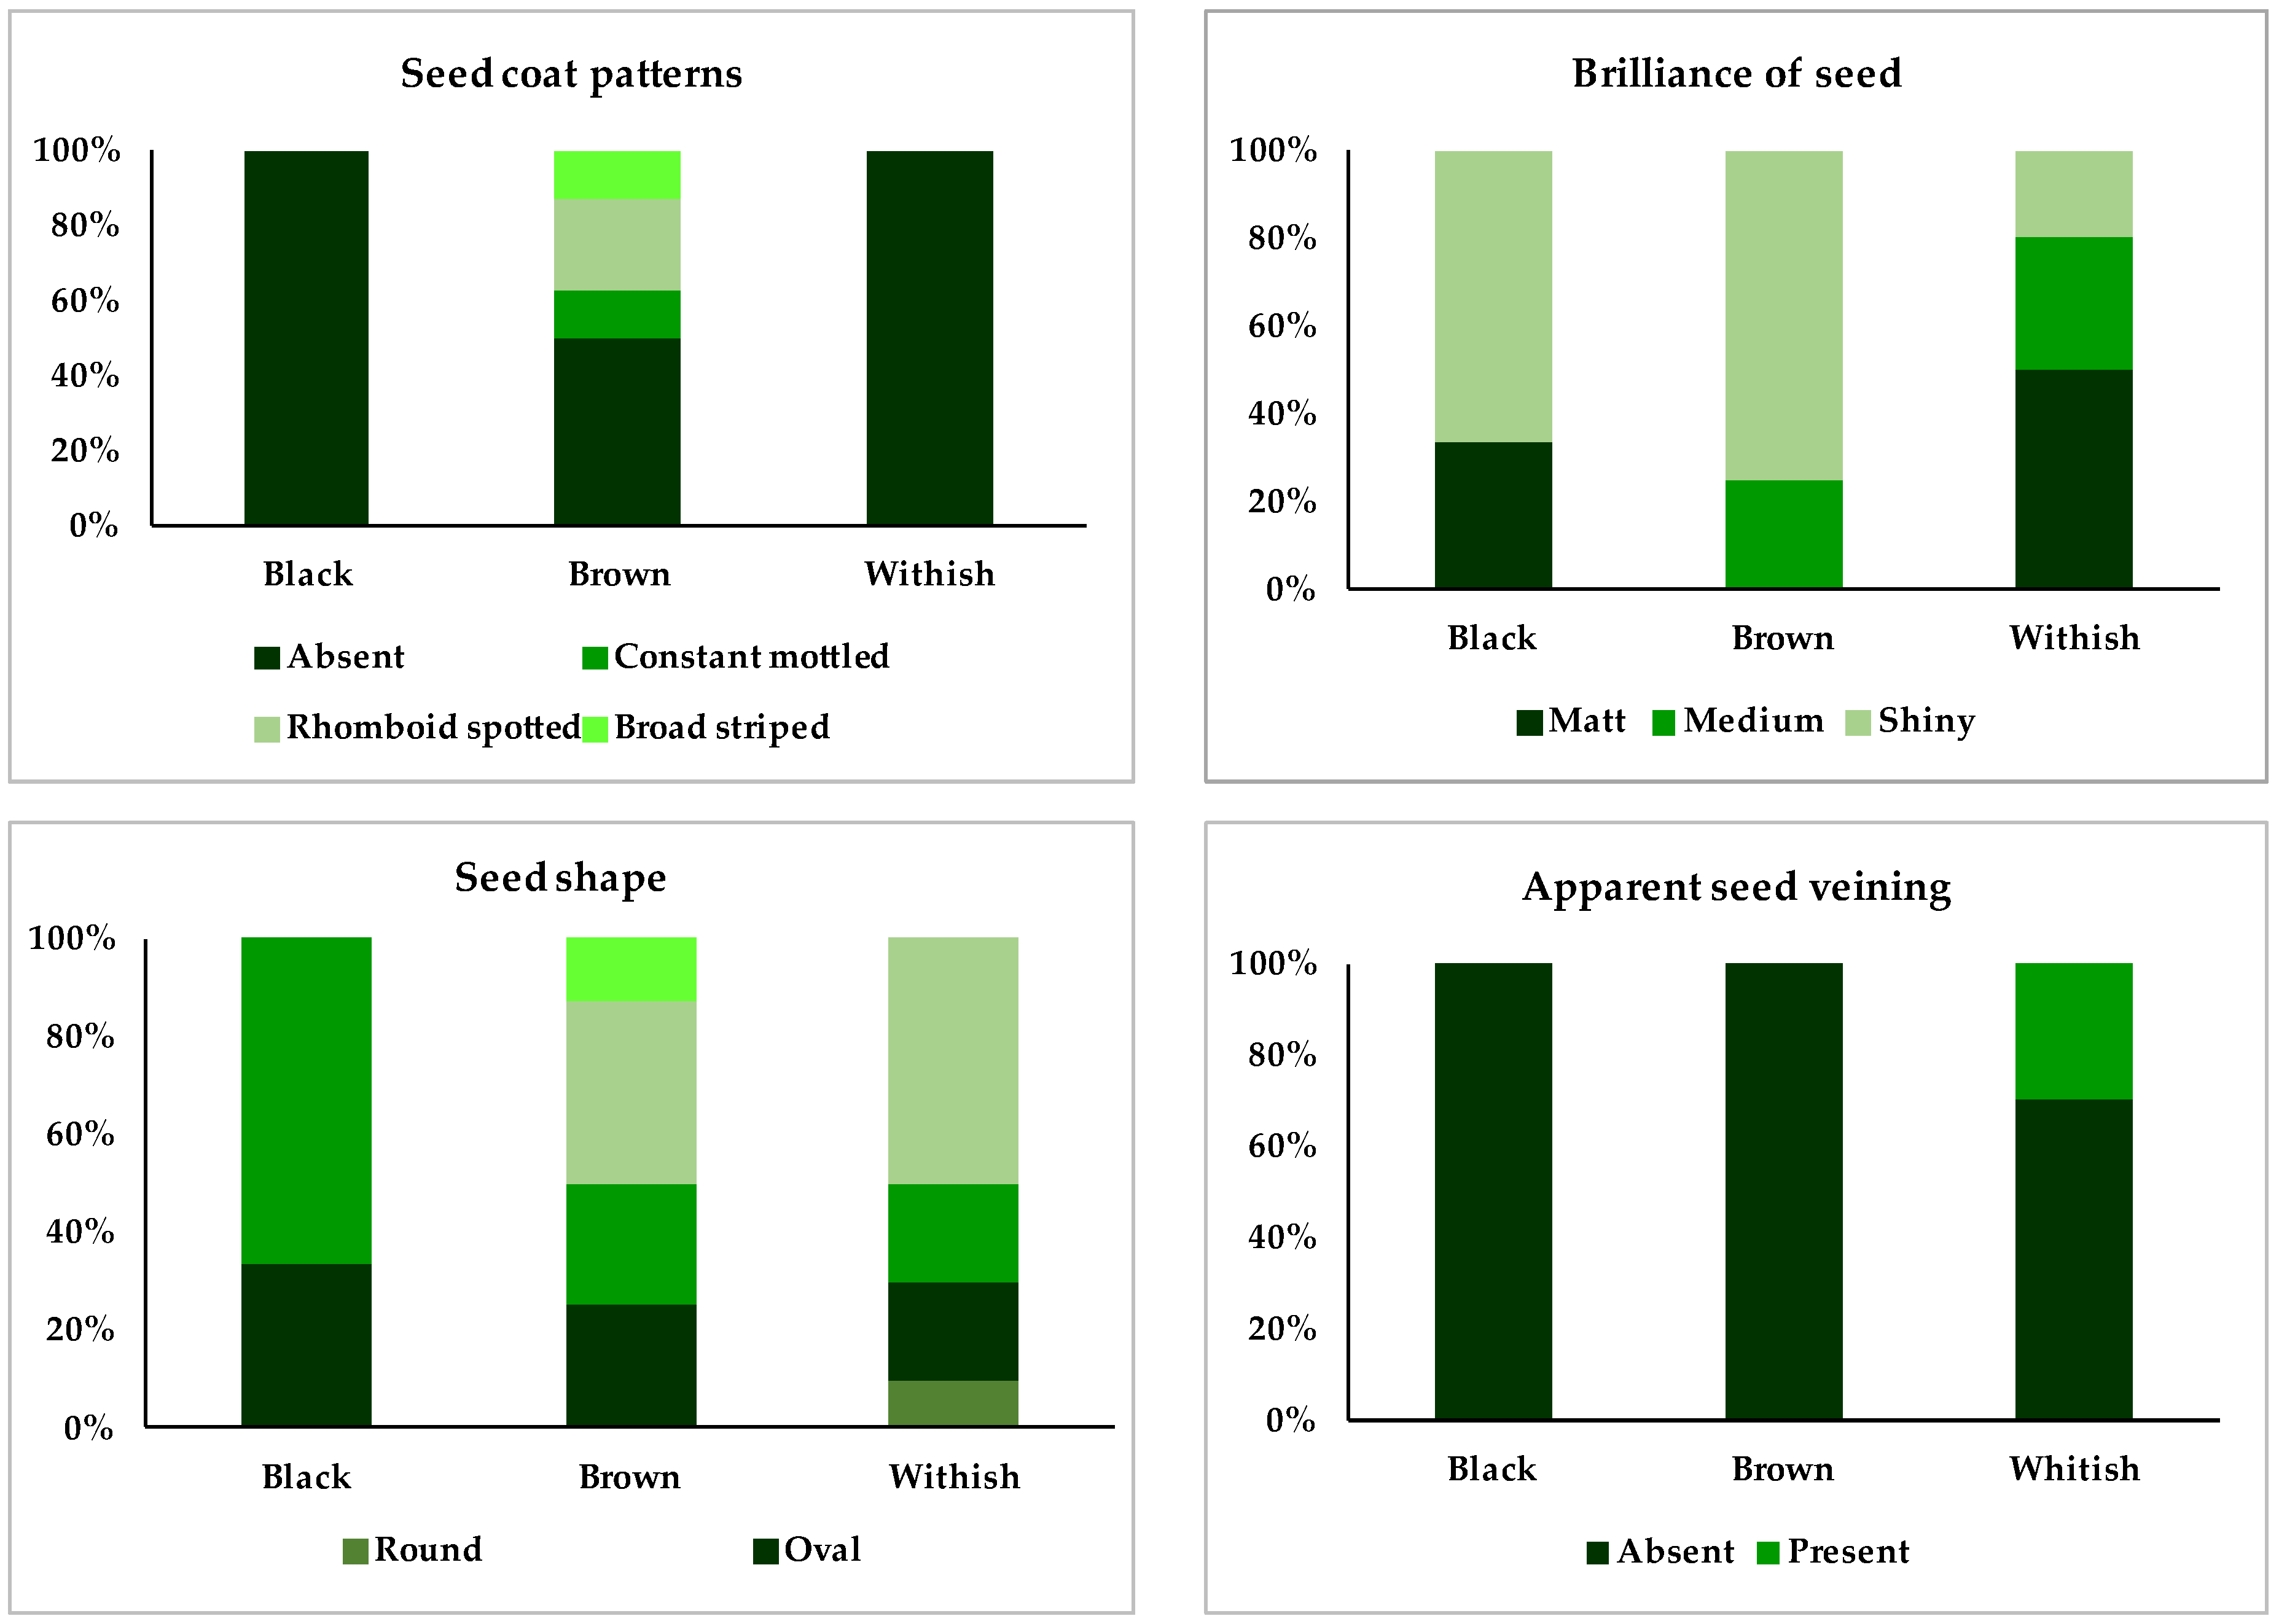
3.2. Description of the Variability of the Whole Set of Accessions and of the Groups Established
3.2.1. Variability of the Whole Set of Accessions
3.2.2. Description of the Three Accessions with Black-Colored Seeds
3.2.3. Description of the Six Accessions with Brown-Colored Seeds
3.2.4. Description of the Seven Accessions with White-Colored Seeds
3.2.5. Description of the Accessions with Different Seed Colors and of the Accessions with a Determinate Growth Habit
4. Discussion
Author Contributions
Funding
Conflicts of Interest
References
- Food and Agriculture Organization of the United Nations (FAO). FAOSTAT. Available online: http://faostat3.fao.org/browse/Q/QC/S (accessed on 10 January 2019).
- Gepts, P.; Debouck, D.G. Origin, domestication and evolution of the common vean (Phaseolus vulgaris, L.). In Common Bean: Research for Crop Improvement; van Schoonhoven, A., Voysest, O., Eds.; CIAT: Wallingford, UK, 1991; pp. 7–43. [Google Scholar]
- Gepts, P. Biochemical evidence bearing on the domestication of Phaseolus (Fabaceae) beans. Econ. Bot. 1990, 44, 28–38. [Google Scholar] [CrossRef]
- Koening, R.; Gepts, P. Allozyme diversity in wild Phaseolus vulgaris: Further evidence for two major centers of genetic diversity. Theor. Appl. Genet. 1989, 78, 809–817. [Google Scholar] [CrossRef] [PubMed]
- Tohme, J.; Gonzalez, D.O.; Beebe, S.; Duque, M. AFLP analysis of gene pools of a wild bean core collection. Crop Sci. 1996, 36, 1375–1384. [Google Scholar] [CrossRef]
- Beebe, S.E.; Skroch, P.W.; Tohme, J.; Duque, E.; Pedraza, M.C.; Nienhuis, F. Structure of genetic diversity among common bean landraces of Middle American origin based on correspondence analysis of RAPD. Crop Sci. 2000, 40, 257–272. [Google Scholar] [CrossRef]
- Duran, L.A.; Blair, M.W.; Giraldo, M.C.; Macchiavelli, R.; Prophete, E.; Nin, J.C.; Beaver, J.S. Morphological and molecular characterization of common bean landraces and cultivars from the Caribbean. Crop Sci. 2005, 45, 1320–1328. [Google Scholar] [CrossRef]
- Singh, S.P.; Gepts, P.; Debouck, D.G. Races of common bean (Phaseolus vulgaris, Fabaceae). Econ. Bot. 1991, 45, 379–396. [Google Scholar] [CrossRef]
- Bitocchi, E.; Nanni, L.; Bellucci, E.; Rossi, M.; Giardini, A.; Zeuli, P.S.; Logozzo, G.; Stougaard, J.; McClean, P.; Attene, G.; et al. Mesoamerican origin of the common bean (Phaseolus vulgaris L.) is revealed by sequence data. Proc. Natl. Acad. Sci. USA 2012, 109, E788–E796. [Google Scholar] [CrossRef] [PubMed]
- Ortwin-Sauer, C. The Early Spanish Men; University of California Press: Berkeley, CA, USA, 1966. [Google Scholar]
- Brucher, O.B.; Brucher, H. The South American wild bean (Phaseolus aborigeneus Burk.) as ancestor of the common bean. Econ. Bot. 1976, 30, 257–272. [Google Scholar] [CrossRef]
- Debouck, D.G.; Smartt, J. Bean. In Evolution of Crop Plants, 2nd ed.; Smartt, J., Simmonds, N.W., Eds.; Longman Scientific and Technical: Harlow, UK, 1995; pp. 287–296. [Google Scholar]
- Santalla, M.; Rodiño, A.P.; De Ron, A.M. Allozyme evidence supporting southwestern Europe as a secondary center of genetic diversity for common bean. Theor. Appl. Genet. 2002, 104, 934–944. [Google Scholar] [CrossRef]
- Pinheiro, C.; Baeta, J.P.; Pereira, A.M.; Dominguez, H.; Ricardo, C. Mineral elements correlations in a Portugese germplasm collection of Phaseolus vulgaris. Integrating Legume Biology for Sustainable Agricultura. In Proceedings of the 6th European Conference on Grain Legumes, Lisbon, Portugal, 12–16 Noviembre 2007; pp. 125–126. [Google Scholar]
- Lioi, L.; Piergiovanni, A.R. European common bean. In Genetic and Genomic Resources of Grain Legume Improvement; Singh, M., Upadhyaya, H.D., Bisht, I.S., Eds.; Elsevier: Amsterdam, The Netherlands, 2013; pp. 11–40. [Google Scholar]
- Boyer, J. Plant productivity and environment. Science 1982, 218, 443–448. [Google Scholar] [CrossRef]
- Cramer, W.; Guiot, J.; Fader, M.; Garrabou, J.; Gatusso, J.P.; Iglesias, A.; Lange, M.A.; Lionello, P.; Llasat, M.C.; Paz, S.; et al. Climate change and interconnected risks to sustainable development in the Mediterranean. Nat. Clim. Chang. 2018, 8, 972–989. [Google Scholar] [CrossRef]
- Fita, A.; Rodriguez-Burruezo, A.; Boscaiu, M.; Prohens, J.; Vicente, O. Breeding and domesticating crops adapted to drought and salinity: A new paradigm for increasing food production. Front. Plant Sci. 2015, 6, 978. [Google Scholar] [CrossRef] [PubMed]
- Santos, M.; Ribeiro, R.M.E.; Pimentel, C. Photosynthetic parameters and leaf water potential of five common bean genotypes under mild water deficit. Biol. Plant. 2009, 53, 229–236. [Google Scholar] [CrossRef]
- Rosales, M.; Rodriguez-Valentin, R.; Olvera-Carrillo, Y.; Acosta-Gallegos, J.; Covarrubias, A. Physiological analysis of common bean (Phaseolus vulgarisL.) cultivars uncovers characteristics related to terminal drought resistance. Plant Physiol. Biochem. 2012, 56, 24–34. [Google Scholar] [CrossRef] [PubMed]
- Beebe, S.; Rao, I.; Blair, M.; Acosta-Gallegos, J. Phenotyping common beans for adaptation to drought. Front. Physiol. 2013, 4, 35. [Google Scholar] [CrossRef] [Green Version]
- Al Hassan, M.; Morosan, M.; Lopez-Gresa, M.; Prohens, J.; Vicente, O.; Boscaiu, M. Salinity-Induced variation in biochemical markers provides insight into the mechanisms of salt tolerance in common (Phaseolus vulgaris) and runner (P. coccineus) beans. Int. J. Mol. Sci. 2016, 17, 1582. [Google Scholar] [CrossRef]
- Morosan, M.; Al Hassan, M.; Naranjo, M.; Loprez-Gresa, M.B.M.; Vicente, O. Comparative analysis of drought responses in Phaseolus vulgaris (common bean) and P. coccineus (runner bean) cultivar. EuroBiotech J. 2017, 1, 247–252. [Google Scholar] [CrossRef]
- Arteaga, S.; Al Hassan, M.; Wijesinghe, C.; Yabor, L.; Llinares, J.; Boscaiu, M.; Vicente, O. Screening for Salt Tolerance in Four Local Varieties of Phaseolus lunatus from Spain. Agriculture 2018, 8, 201. [Google Scholar] [CrossRef]
- IBPGR. Phaseolus vulgaris Descriptors. In Plant Production and Protection Division; FAO: Rome, Italy, 1982; p. 32. [Google Scholar]
- Singh, S. A key for identification of different growth habits of Phaseolus vulgaris L. Annu. Rep. Bean Improv. Coop. 1982, 25, 92–94. [Google Scholar]
- Rodrigo-Miguez, A.P. Caracterización Morfoagronómica y Bioquímica de Judía Común (Phaseolus Vulgaris L.) de España. Ph.D. Thesis, Universidad de Santiago de Compostela, Santiago, Spain, 2000. [Google Scholar]
- Felsenstein, J. Numerical Taxonomy; W.H. Freeman & Company: San Francisco, CA, USA, 1973. [Google Scholar]
- Mohammadin, S.A.; Prasanna, B.M. Analysis of genetic diversity in crop plants—Salient statistical tools and considerations. Crop Sci. 2003, 43, 1235–1248. [Google Scholar] [CrossRef]
- Mantel, N. The detection of disease clustering and generalized regression approach. Cancer Res. 1967, 27, 209–220. [Google Scholar] [PubMed]
- Gil, J.; De Ron, A. Variation in Phaseolus vulgaris in the Northwest of the Iberian Peninsula. Plant Breed. 1992, 109, 313–319. [Google Scholar] [CrossRef]
- Rodiño, P.; Santalla, M.; De Ron, A.; Singh, S. A core collection of common bean from the Iberian peninsula. Euphytica 2003, 131, 165–175. [Google Scholar] [CrossRef] [Green Version]
- Perez-Vega, E.; Campa, A.; De la Rosa, L.; Giraldez, R.; Ferreira, J. Genetic Diversity in a Core Collection Established from the Main Bean Genebank in Spain. Crop Sci. 2009, 49, 1377–1386. [Google Scholar] [CrossRef]
- Vaid, K.; Gupta, V.; Singh, R. Stability analysis in dry bean. Crop Improv. 1985, 12, 28–31. [Google Scholar]
- Escribano, M.; De Ron, A.; Amurrio, J. Diversity in agronomical traits in common bean populaltions from northwestern Spain. Euphytica 1994, 76, 1–6. [Google Scholar] [CrossRef]
- Nienhuis, J.; Singh, S. Combining ability analyses and relationships among yield, yield components and architectural traits in dry bean. Crop Sci. 1986, 26, 21–27. [Google Scholar] [CrossRef]
- Sills, G.; Nienhuis, J. Field plot technique affects snap bean yield evaluation. J. Am. Soc. Hortic. Sci. 1993, 188, 672–674. [Google Scholar] [CrossRef]
- Hosfield, G.; Uebersax, M.; Isleb, T. Seasonal and genotypic effects on yield and physico-chemical seed characteristics related to food quality n dry, edible beans. J. Am. Soc. Hort. Sci. 1984, 109, 182–189. [Google Scholar]
- Escribano, M.; Santalla, M.; Casquero, P.; De Ron, A. Patterns of genetic diversity in landraces of common bean (Phaseolus vulgaris L.) from Galicia. Plant Breed. 1998, 117, 49–56. [Google Scholar] [CrossRef]


| Descriptor IBPGR [25] | Acronym | Unit/Scores |
|---|---|---|
| Quantitative | ||
| Vegetative | ||
| 4.1.1. Leaflet length | (LeafL) | Measured on the terminal leaflet of third trifoliate leaf from pulvinus to leaf tip (cm) |
| Width of the central sheet *** | (Wcshe) | Measured on the terminal leaflet of the third trifoliate leaf (cm) |
| 6.1.1. Hypocotyl length | (HypL) | Average length in cm, from 5 plants. Measured when primary leaves were fully expanded |
| 6.1.9. Plant height | (PlantH) | Average height, in cm, at maturity, from 5 plants. Measured from cotyledon scar to tip of the plant |
| 6.1.10. Stem diameter | (StemD) | Measured in mm at maturity for plants at crop density |
| Inflorescence and pod | ||
| 4.2.2. Days to flowering | (Dflow) | Number of days from emergence to the stage where 50% of plants have set flowers |
| 4.2.3. Flower buds per inflorescence | (FlowBI) | Average number of flower buds from 5 plants, examining one inflorescence from each plant |
| 4.2.7. Pod length | (PodL) | Average length, in cm, of the largest fully expanded immature pod |
| 6.2.9. Inflorescence length | (InfloL) | Average length, in cm, from 5 plants |
| 6.2.10. Pedicel length | (PedL) | Average length, in cm, of older flower from 5 plants, examining one inflorescence from each plant |
| 6.2.18. Pods per plant | (PPlant) | Average from 5 plants at crop density |
| Days to harvest *** | (Dharv) | Time period between seed sowing and mature pods sampling |
| Seed | ||
| 6.3.1. Seeds per pod | (SeedP) | Average number of seeds from one pod, selected from 5 plants |
| 6.3.3. Seed weight | (SeedWh) | Weight of 100 seeds, in grams |
| 6.3.5.1. Length | (SeedL) | Measured parallel to the hilum (mm) |
| 6.3.5.2. Width | (SeedW) | mm |
| 6.3.5.3. Height | (SeedH) | Height, measured from hilum to opposite side (mm) |
| Qualitative | ||
| Vegetative | ||
| Plant type ** | (Planty) | I. determinate bush, II. indeterminate straight, III. indeterminate crawling, IV. indeterminate climbing. |
| Inflorescence and Pod | ||
| 4.2.6. Pod color (from the fully expanded immature pod) | (Pcol) | Dark purple (1), carmine red (2), purple stripe on green (3), carmine tripe on green (4), pale red stripe on green (5), dark pink (6), normal green (7), shiny green (8), dull green to silver gray (9), golden or yellow (10), pale yellow to white (11), other (12) |
| 4.2.8. Pod cross-section | (Pcross) | Very flat (1), pear-shaped (2), round elliptic (3), figure of eight (4), other (5) |
| 4.2.9. Pod curvature (of the fully expanded immature pod) | (Pcurv) | Straight (3), slightly curved (5), curved (7), recurving (9) |
| 4.2.10. Pod suture string | (Psuts) | Stringless (0), few strings (3), moderately stringy (5), very stringy (7) |
| 4.2.11. Pod color at physiological maturity | (Pcmat) | Dark purple (1), red (2), pink (3), yellow (4), pale yellow with colored mottling or stripes (5), persistent white (6) |
| 6.2.12. Position of pods | (PosP) | Base (1), center (2), top (3), combination of 1, 2, and 3 (4), other (5) |
| 6.2.15. Pod beak position | (Pbeakp) | Marginal (1), non-marginal (2) |
| 6.2.15. Pod beak orientation | (Pbeako) | Upward (3), straight (5), downward (7) |
| 6.2.17.2 Dry pod color | (Dpcol) | Dark purple (1), carmine red (2), purple stripe on green (3), carmine stripe on green (4), pale red stripe on green (5), dark pink (6), normal green (7), shiny green (8), dull green to silver gray (9), golden or deep yellow (10), pale yellow to white (11), other (12) |
| Seed | ||
| 4.3.1. Seed coat patterns | (Scoatp) | Absent (0), constant mottled (1), striped (2), rhomboid spotted (3), speckled (4), circular mottling (5), marginal color pattern (6), broad-striped (7), bicolor (8), spotted bicolor (9), pattern around hilum (10), other (11) |
| 4.3.2. Seed coat color | (Scoatdc) | Black (1), brown, pale to dark (2), maroon (3), gray, brownish to greenish (4), yellow to greenish yellow (5), pale-cream to buff (6), pure white (7), whitish (8), white, purple-tinged (9), chlorophyll green (10). green to olive (11), red (12), pink (13), purple (14), other (15) |
| 4.3.4. Brilliance of seed | (BSeed) | Matte (3), medium (5), shiny (7) |
| 4.3.5. Seed shape | (SHseed) | Round (1), oval (2), cuboid (3), kidney-shaped (4), kidney pronounced (5), fastigiate trunk (6) |
| 6.3.2. Apparent seed veining | (Aseed) | Absent (0), Present (1) |
| Dependent Variable | Independent Variable | ||
|---|---|---|---|
| Cultivar | Cycle | Cultivar × Cycle | |
| LeafL (Leaflet length) | 36.42 *** | 0.468 ns | 0.79 ns |
| Wcshe (Width of the central sheet) | 46.42 *** | 1.479 ns | 0.97 ns |
| HypL (Hypocotyl length) | 135.54 *** | 0.480 ns | 28.52 *** |
| PlantH (Plant height) | 492.86 *** | 3.24 ns | 0.28 ns |
| StemD (Stem diameter) | 40.29 *** | 0.055 ns | 9.85 *** |
| FlowBI (Flower buds per inflorescence) | 31.07 *** | 0.09 ns | 2.57 *** |
| PodL (Pedicel length) | 172.61 *** | 2.05 ns | 3.40 *** |
| InfloL (Inflorescence length) | 85.31 *** | 14.21 *** | 32.06 *** |
| PedL (Pedicel length) | 70.89 *** | 1.90 ns | 15.68 *** |
| Pplant (Pods per plant) | 222.09 *** | 3.92 * | 0.58 ns |
| SeedP (Seed per pod) | 31.24 *** | 7.09 ** | 1.07 ns |
| SeedL (Length) | 237.02 | 0.42 | 3.76 *** |
| SeedW (Width) | 73.49 *** | 1.14 ns | 7.47 *** |
| SeedH (Height) | 71.75 *** | 6.35 * | 3.93 *** |
| Yield | 343.70 *** | 2.27 ns | 4.22 *** |
| Component 1 | Component 2 | Component 3 | |
|---|---|---|---|
| LeafL | 0.09 | 0.39 | −0.08 |
| Wcshe | 0.08 | 0.38 | −0.14 |
| HypL | 0.09 | 0.04 | 0.17 |
| PlantH | −0.17 | −0.19 | 0.18 |
| StemD | 0.09 | 0.20 | −0.22 |
| Dflow | 0.11 | 0.05 | 0.12 |
| FlowBI | 0.13 | 0.14 | −0.07 |
| PodL | 0.22 | 0.07 | 0.26 |
| InfloL | 0.13 | −0.21 | −0.41 |
| PedL | 0.14 | −0.19 | −0.39 |
| Pplant | 0.22 | 0.27 | 0.14 |
| Dharv | 0.10 | −0.02 | −0.35 |
| SeedP | 0.03 | 0.35 | 0.19 |
| SeedWh | 0.36 | −0.25 | 0.04 |
| SeedL | 0.33 | −0.18 | 0.28 |
| SeedW | 0.33 | −0.15 | −0.13 |
| SeedH | 0.35 | −0.22 | 0.02 |
| Scoatdc | −0.22 | −0.24 | 0.22 |
| SHseed | 0.20 | −0.23 | 0.23 |
| Aseed | −0.29 | −0.12 | 0.15 |
| Yield | 0.35 | 0.18 | 0.23 |
| Accessions | HypL | PlantH | StemD | LeafL | Wcshe | Dflow | Dharv | FlowBI | InfloL | PedL | Pplant | PodL | SeedP | SeedL | SeedWh | SeedH | SeedW | Yield | |
|---|---|---|---|---|---|---|---|---|---|---|---|---|---|---|---|---|---|---|---|
| All accesions | Mean | 10.53 | 1.70 | 5.18 | 16.51 | 11.48 | 42.54 | 110.25 | 4.17 | 7.65 | 3.77 | 29.15 | 14.26 | 5.09 | 12.96 | 47.14 | 7.77 | 5.94 | 74.53 |
| SD | 3.05 | 0.69 | 1.26 | 3.76 | 3.22 | 6.65 | 23.08 | 1.42 | 2.42 | 1.55 | 17.31 | 4.28 | 1.87 | 3.07 | 17.29 | 1.20 | 1.14 | 61.41 | |
| CV | 28.98 | 40.39 | 24.35 | 22.74 | 28.02 | 15.64 | 20.94 | 34.04 | 31.69 | 41.16 | 59.38 | 30.04 | 36.78 | 23.68 | 36.68 | 15.49 | 19.24 | 82.39 | |
| Range | 2.80 | 0.32 | 2.75 | 9.80 | 5.40 | 28.00 | 71.00 | 1.00 | 2.71 | 1.10 | 5.00 | 5.60 | 1.00 | 7.03 | 17.20 | 4.72 | 3.64 | 2.80 | |
| 19.00 | 2.95 | 8.40 | 26.50 | 20.20 | 55.00 | 157.00 | 8.00 | 14.60 | 8.10 | 72.00 | 28.50 | 9.00 | 21.39 | 81.40 | 11.49 | 8.71 | 242.75 | ||
| Black (3) | Mean | 10.73 | 1.85 | 5.50 | 20.26 | 15.84 | 41.00 | 117.33 | 4.05 | 8.29 | 4.23 | 43.47 | 12.66 | 6.17 | 10.45 | 33.89 | 7.40 | 5.76 | 92.49 |
| SD | 1.23 | 0.32 | 0.70 | 3.53 | 2.51 | 5.57 | 29.69 | 1.43 | 1.88 | 2.06 | 16.97 | 3.36 | 2.20 | 1.74 | 15.67 | 1.01 | 1.19 | 62.28 | |
| CV | 11.50 | 17.44 | 12.77 | 17.44 | 15.83 | 13.58 | 25.30 | 35.35 | 22.67 | 48.64 | 39.03 | 26.53 | 35.65 | 16.64 | 46.25 | 13.59 | 20.71 | 67.33 | |
| Range | 9.1 | 0.99 | 4.2 | 16 | 11 | 36 | 92 | 2 | 5.9 | 1.9 | 23 | 8 | 1 | 7.5 | 19.2 | 5.62 | 4.38 | 34.52 | |
| 12.6 | 2.4 | 6.5 | 26.5 | 20.2 | 47 | 150 | 6 | 12.1 | 8.1 | 72 | 18.5 | 9 | 12.77 | 50.39 | 9.77 | 8.71 | 193.95 | ||
| Brown (8) | Mean | 10.67 | 2.28 | 5.88 | 16.05 | 10.89 | 43.83 | 114.17 | 3.98 | 6.97 | 3.63 | 39.66 | 13.94 | 5.64 | 13.91 | 60.09 | 7.95 | 5.96 | 124.67 |
| SD | 2.70 | 0.38 | 1.41 | 3.48 | 2.43 | 8.86 | 22.99 | 1.39 | 1.46 | 1.48 | 17.69 | 3.76 | 1.68 | 2.95 | 17.82 | 1.47 | 1.34 | 57.97 | |
| CV | 25.30 | 16.82 | 23.99 | 21.68 | 22.28 | 20.22 | 20.14 | 34.88 | 20.98 | 40.84 | 44.62 | 26.99 | 29.75 | 21.23 | 29.65 | 18.47 | 22.56 | 46.50 | |
| Range | 4.5 | 1.75 | 2.9 | 9.8 | 7.8 | 35 | 94 | 1 | 3.8 | 1.1 | 5 | 5.6 | 2 | 9.49 | 37.45 | 5 | 3.64 | 18.97 | |
| 14.5 | 2.95 | 8.4 | 22.4 | 19.2 | 55 | 143 | 6 | 10.9 | 7 | 65 | 21.2 | 8 | 18.69 | 81.4 | 10.74 | 8.16 | 242.75 | ||
| Whitish (10) | Mean | 11.64 | 1.80 | 4.52 | 16.32 | 11.55 | 45.29 | 112.14 | 3.89 | 6.57 | 3.20 | 26.30 | 15.92 | 5.02 | 12.52 | 39.56 | 7.44 | 5.52 | 54.07 |
| SD | 2.93 | 0.20 | 0.84 | 2.92 | 2.78 | 2.69 | 21.07 | 1.49 | 2.89 | 1.32 | 10.51 | 5.25 | 1.89 | 2.84 | 12.86 | 1.06 | 0.92 | 38.14 | |
| CV | 25.21 | 11.34 | 18.47 | 17.90 | 24.05 | 5.94 | 18.79 | 38.20 | 43.95 | 41.34 | 39.96 | 32.99 | 37.71 | 22.70 | 32.50 | 14.28 | 16.71 | 70.54 | |
| Range | 7.8 | 1.2 | 2.75 | 11.1 | 7.2 | 41 | 87 | 2 | 2.71 | 1.1 | 8 | 9.8 | 2 | 7.41 | 19 | 4.72 | 3.89 | 15.14 | |
| 19 | 2.4 | 7.83 | 25 | 19.8 | 50 | 141 | 8 | 14.6 | 7.8 | 47 | 28.5 | 9 | 18.09 | 53.2 | 8.98 | 8.01 | 146.83 | ||
| Yellow to greenish yellow (1) | Mean | 8.56 | 1.79 | 4.33 | 14.04 | 9.44 | 46 | 98.00 | 4.25 | 11.78 | 5.25 | 15.20 | 14.22 | 5.00 | 11.34 | 53.20 | 8.69 | 7.70 | 40.43 |
| SD | 0.74 | 0.02 | 0.69 | 3.48 | 1.23 | - | - | 1.71 | 1.87 | 1.37 | 3.49 | 1.20 | 0.71 | 0.58 | - | 1.15 | 0.38 | 9.29 | |
| CV | 8.65 | 1.34 | 16.03 | 24.80 | 13.08 | - | - | 40.18 | 15.91 | 26.14 | 22.98 | 8.47 | 14.14 | 5.16 | - | 13.23 | 4.90 | 22.98 | |
| Range | 7.8 | 1.75 | 3.67 | 10.1 | 7.3 | 46 | 98 | 2 | 9 | 3.2 | 11 | 12.2 | 4 | 10.16 | 53.2 | 7.22 | 6.99 | 29.26 | |
| 9.5 | 1.81 | 5.3 | 20 | 10.9 | 46 | 98 | 6 | 13 | 6.1 | 20 | 15.2 | 6 | 12.06 | 53.2 | 11.49 | 8.11 | 53.2 | ||
| Gray, brownish to greenish (1) | Mean | 6.18 | 1.80 | 6.04 | 17.68 | 13.50 | 37.00 | 157.00 | 4.33 | 7.67 | 4.05 | 12.00 | 13.95 | 4.50 | 12.23 | 38.60 | 7.90 | 5.62 | 20.84 |
| SD | 1.80 | - | 1.41 | 1.15 | 1.09 | - | - | 1.21 | 0.82 | 0.61 | 3.39 | 0.90 | 0.84 | 0.90 | - | 0.32 | 0.34 | 5.89 | |
| CV | 29.07 | - | 23.43 | 6.53 | 8.10 | - | - | 27.95 | 10.65 | 15.04 | 28.26 | 6.42 | 18.59 | 7.37 | - | 4.07 | 5.99 | 28.26 | |
| Range | 4.8 | 1.8 | 3.62 | 16 | 11.9 | 37 | 157 | 3 | 7 | 3.4 | 8 | 13 | 3 | 10.92 | 38.6 | 7.39 | 5.3 | 13.89 | |
| 9.2 | 1.8 | 7.13 | 19 | 14.6 | 37 | 157 | 6 | 9 | 5 | 16 | 15.3 | 5 | 13.74 | 38.6 | 8.33 | 6.26 | 27.79 | ||
| Maroon (1) | Mean | 13.66 | 2.26 | 4.84 | 19.29 | 14.67 | 51.00 | 110.00 | 3.80 | 6.48 | 2.34 | 51.20 | 17.42 | 5.60 | 15.10 | 63.70 | 8.56 | 7.46 | 182.64 |
| SD | 0.55 | 0.19 | 0.44 | 1.51 | 2.93 | - | - | 0.45 | 0.38 | 0.35 | 7.01 | 3.10 | 0.89 | 0.59 | - | 0.29 | 0.39 | 25.02 | |
| CV | 4.00 | 8.25 | 9.18 | 7.83 | 19.97 | - | - | 11.77 | 5.92 | 14.99 | 13.70 | 17.82 | 15.97 | 3.91 | - | 3.42 | 5.23 | 13.70 | |
| Range | 12.8 | 2.08 | 4.33 | 17 | 9.5 | 51 | 110 | 3 | 6 | 2 | 44 | 12.1 | 4 | 14.14 | 63.7 | 8.09 | 6.77 | 156.95 | |
| 14.2 | 2.5 | 5.36 | 21.2 | 17.8 | 51 | 110 | 4 | 6.9 | 2.9 | 62 | 19.8 | 6 | 16.16 | 63.7 | 8.99 | 8.14 | 221.16 | ||
| Determinate growth habit | |||||||||||||||||||
| Whithish (3) | Mean | 6.97 | 0.54 | 4.76 | 15.70 | 9.98 | 41.00 | 102.00 | 4.63 | 8.74 | 4.97 | 13.36 | 10.36 | 3.41 | 12.06 | 38.33 | 7.58 | 6.00 | 19.44 |
| SD | 3.02 | 0.13 | 0.51 | 4.77 | 2.59 | 3.61 | 4.58 | 1.45 | 2.78 | 1.58 | 4.07 | 2.92 | 1.08 | 3.54 | 20.86 | 1.30 | 0.94 | 13.69 | |
| CV | 43.25 | 23.33 | 10.76 | 30.36 | 25.90 | 8.79 | 4.49 | 31.46 | 31.76 | 31.88 | 30.46 | 28.16 | 31.80 | 29.35 | 54.41 | 17.19 | 15.62 | 70.42 | |
| Range | 2.8 | 0.335 | 4.2 | 9.8 | 5.4 | 38 | 98 | 2 | 4.23 | 2.8 | 6 | 6.5 | 2 | 7.03 | 17.2 | 5.22 | 4.68 | 2.80 | |
| 9.8 | 0.7 | 5.87 | 26 | 14 | 45 | 107 | 6 | 12.5 | 7.1 | 22 | 15.1 | 5 | 17.15 | 58.9 | 9.56 | 7.49 | 47.94 | ||
| Brown (2) | Mean | 12.22 | 0.42 | 5.43 | 13.70 | 7.58 | 30.50 | 76.50 | 5.23 | 9.30 | 3.66 | 13.20 | 16.83 | 4.07 | 16.85 | 60.90 | 8.37 | 6.01 | 32.50 |
| SD | 1.91 | 0.08 | 2.12 | 1.90 | 0.76 | 3.54 | 7.78 | 1.17 | 1.51 | 0.73 | 4.21 | 1.49 | 1.14 | 1.66 | 2.40 | 0.81 | 0.62 | 10.76 | |
| CV | 19.49 | 16.35 | 27.16 | 12.77 | 9.55 | 10.71 | 9.49 | 19.43 | 16.58 | 16.50 | 60.16 | 9.24 | 28.53 | 10.84 | 4.06 | 10.11 | 10.71 | 63.35 | |
| Range | 9 | 0.315 | 3.4 | 10.4 | 6.5 | 28 | 71 | 3 | 7.8 | 2.8 | 7 | 14.5 | 1 | 14.51 | 59.2 | 7.11 | 4.64 | 16.99 | |
| 15 | 0.55 | 8.1 | 16.1 | 9 | 33 | 82 | 6 | 12 | 4.8 | 21 | 19.2 | 5 | 21.39 | 62.6 | 9.67 | 7.04 | 50.97 | ||
| Accessions | HypL | PlantH | StemD | LeafL | Wcshe | Dflow | Dharv | FlowBI | InfloL | PedL | Pplant | PodL | SeedP | SeedL | SeedWh | SeedH | SeedW | Yield | |
|---|---|---|---|---|---|---|---|---|---|---|---|---|---|---|---|---|---|---|---|
| All accessions | Mean | 10.59 | 1.69 | 5.13 | 17.03 | 12.11 | 42.25 | 108.5 | 4.18 | 7.38 | 3.57 | 30.14 | 14.38 | 5.34 | 12.91 | 46.15 | 7.65 | 5.89 | 76.06 |
| SD | 3.03 | 0.66 | 1.06 | 3.87 | 3.26 | 8.41 | 21.86 | 1.51 | 2.97 | 1.62 | 18.02 | 3.98 | 1.76 | 2.97 | 16.56 | 1.04 | 0.99 | 61.71 | |
| CV | 28.65 | 39.02 | 20.73 | 22.75 | 26.88 | 19.92 | 20.15 | 36.15 | 40.2 | 45.37 | 59.78 | 27.67 | 33.02 | 23.01 | 35.89 | 13.6 | 16.77 | 81.13 | |
| Range | 2 | 0.25 | 3.14 | 9.8 | 6.5 | 27 | 70 | 1 | 1.5 | 0.98 | 4 | 6.8 | 1 | 6.59 | 16.98 | 5.41 | 4.03 | 6.99 | |
| 17.8 | 2.98 | 7.87 | 26.5 | 20.5 | 55 | 153 | 9 | 25.54 | 12.22 | 77 | 27.8 | 9 | 21.17 | 76.23 | 10.15 | 9.38 | 232.82 | ||
| Black (3) | Mean | 12.15 | 1.88 | 5.04 | 20.31 | 15.82 | 42.33 | 121.33 | 4.52 | 7.47 | 3.41 | 44.4 | 12.83 | 6.67 | 10.52 | 35.29 | 7.23 | 5.68 | 108.08 |
| SD | 2.95 | 0.18 | 0.97 | 3.44 | 1.68 | 6.43 | 28.18 | 1.36 | 1.92 | 1.52 | 18.71 | 4.31 | 1.83 | 2.04 | 17.4 | 1.01 | 1.13 | 75.21 | |
| CV | 24.28 | 9.39 | 19.31 | 16.96 | 10.6 | 15.19 | 23.23 | 30.16 | 25.7 | 44.61 | 42.13 | 33.62 | 27.39 | 19.43 | 49.3 | 13.91 | 19.83 | 69.58 | |
| Range | 8.9 | 1.7 | 3.9 | 16.2 | 13.6 | 35 | 99 | 2 | 5.5 | 2.1 | 21 | 8 | 4 | 7.24 | 18.374 | 5.76 | 4.1 | 33.56 | |
| 17.8 | 2.4 | 7.87 | 26.5 | 19.5 | 47 | 153 | 6 | 12 | 7.8 | 77 | 19.4 | 9 | 13.32 | 53.13 | 8.99 | 7.78 | 232.82 | ||
| Brown (8) | Mean | 11.93 | 2.27 | 5.34 | 16.91 | 11.84 | 44 | 113.33 | 4.05 | 7.35 | 3.56 | 41.73 | 14.53 | 6.23 | 13.54 | 54.67 | 8.02 | 6.25 | 123.87 |
| SD | 1.3 | 0.41 | 1.19 | 3.9 | 2.78 | 9.01 | 25.08 | 1.69 | 3.73 | 1.78 | 18.74 | 3.42 | 1.55 | 2.45 | 16.18 | 1.08 | 0.91 | 57.58 | |
| CV | 10.92 | 18.15 | 22.27 | 23.04 | 23.5 | 20.48 | 22.13 | 41.82 | 50.74 | 50.06 | 44.91 | 23.51 | 24.85 | 18.12 | 29.61 | 13.41 | 14.53 | 46.48 | |
| Range | 9.8 | 1.6 | 3.35 | 9.8 | 7.8 | 34 | 91 | 2 | 3.8 | 1.9 | 4 | 6.8 | 2 | 9 | 36.18 | 5.46 | 4.27 | 18.688 | |
| 14.5 | 2.98 | 7.83 | 24.5 | 19.2 | 54 | 147 | 9 | 25.54 | 12.22 | 65 | 21.2 | 8 | 17.7 | 76.23 | 9.65 | 9.38 | 217.47 | ||
| Whitish (10) | Mean | 10.63 | 1.81 | 4.88 | 15.95 | 11.79 | 43.86 | 111.29 | 3.39 | 6.04 | 2.87 | 26.09 | 15.5 | 5.1 | 12.56 | 39.39 | 7.43 | 5.43 | 51.36 |
| SD | 2.65 | 0.19 | 0.88 | 3.33 | 3.02 | 8.13 | 20.85 | 1.27 | 2.03 | 1.06 | 10.44 | 4.88 | 1.81 | 2.53 | 11.38 | 0.98 | 0.92 | 30.47 | |
| CV | 24.92 | 10.69 | 17.95 | 20.87 | 25.58 | 18.54 | 18.74 | 37.51 | 33.7 | 36.96 | 40.04 | 31.46 | 35.58 | 20.14 | 28.89 | 13.19 | 16.95 | 59.33 | |
| Range | 5.4 | 1.31 | 3.14 | 11.1 | 7.5 | 27 | 85 | 1 | 3.2 | 0.98 | 9 | 7.9 | 2 | 8.01 | 19.534 | 5.41 | 4.03 | 17.17 | |
| 15.6 | 2.5 | 7.8 | 25.2 | 20.5 | 53 | 138 | 6 | 14.3 | 6 | 45 | 27.8 | 8 | 17.4 | 49.1 | 9.36 | 7.9 | 128.79 | ||
| Yellow to greenish yellow | Mean | 8.22 | 1.8 | 4.88 | 14 | 9.55 | 49 | 98 | 4.4 | 11.48 | 4.28 | 16.2 | 13.08 | 4.8 | 10.49 | 56.1 | 7.85 | 7.27 | 43.62 |
| SD | 0.83 | 0.05 | 0.59 | 3.35 | 1.24 | - | - | 1.52 | 1.43 | 0.47 | 5.89 | 0.27 | 1.1 | 0.67 | - | 0.54 | 0.45 | 15.86 | |
| CV | 10.08 | 2.53 | 12.07 | 23.92 | 12.99 | - | - | 34.47 | 12.43 | 11.01 | 36.36 | 2.05 | 22.82 | 6.38 | - | 6.83 | 6.15 | 36.36 | |
| Range | 7.2 | 1.76 | 3.94 | 10.1 | 7.3 | 49 | 98 | 2 | 9 | 3.9 | 9 | 12.8 | 3 | 9.64 | 56.1 | 6.78 | 6.69 | 24.23 | |
| 9.1 | 1.88 | 5.45 | 20 | 10.9 | 49 | 98 | 6 | 12.5 | 5.1 | 23 | 13.5 | 6 | 11.63 | 56.1 | 8.43 | 7.91 | 61.93 | ||
| Gray, brownish to greenish | Mean | 7.32 | 1.8 | 6.8 | 17.3 | 13.56 | 40 | 125 | 4.6 | 8.58 | 4.4 | 12.8 | 14.96 | 4.6 | 11.93 | 37.05 | 6.86 | 5.22 | 21.82 |
| SD | 1.7 | 0.09 | 0.46 | 1.37 | 0.88 | - | - | 1.14 | 1.06 | 1.01 | 1.92 | 0.47 | 0.52 | 0.82 | - | 0.37 | 0.35 | 3.28 | |
| CV | 23.25 | 5.06 | 6.74 | 7.95 | 6.53 | - | - | 24.79 | 12.4 | 22.9 | 15.03 | 3.16 | 11.23 | 6.85 | - | 5.39 | 6.61 | 15.03 | |
| Range | 5.6 | 1.65 | 6.3 | 15.8 | 12.5 | 40 | 125 | 3 | 6.9 | 3.2 | 10 | 14.5 | 4 | 10.71 | 37.05 | 6.08 | 4.48 | 17.04 | |
| 9.2 | 1.89 | 7.5 | 19.2 | 14.6 | 40 | 125 | 6 | 9.5 | 5.5 | 15 | 15.6 | 5 | 12.91 | 37.05 | 7.39 | 5.65 | 25.56 | ||
| Maroon | Mean | 9.6 | 2.12 | 6.55 | 19.5 | 15.1 | 55 | 110 | 4.33 | 6.4 | 2.6 | 55.2 | 17.68 | 5.67 | 14.18 | 59.01 | 8.15 | 6.82 | 184.58 |
| SD | 2.54 | 0.03 | 0.92 | 1.49 | 3.05 | - | - | 1.86 | 0.23 | 0.4 | 6.61 | 1.68 | 0.82 | 0.79 | - | 0.45 | 0.62 | 22.11 | |
| CV | 26.43 | 1.36 | 14 | 7.66 | 20.21 | - | - | 42.97 | 3.56 | 15.38 | 11.98 | 9.49 | 14.41 | 5.54 | - | 5.49 | 9.14 | 11.98 | |
| Range | 4.8 | 2.1 | 5.53 | 17 | 9.5 | 55 | 110 | 3 | 6.2 | 2.1 | 48 | 14.8 | 4 | 12.75 | 59.01 | 7.26 | 5.6 | 160.50 | |
| 11.5 | 2.15 | 7.31 | 21.2 | 17.8 | 55 | 110 | 8 | 6.8 | 3.1 | 63 | 19.1 | 6 | 15.27 | 59.01 | 8.58 | 7.68 | 210.66 | ||
| Determinate growth habit | |||||||||||||||||||
| Whitish (3) | Mean | 7.28 | 0.54 | 4.81 | 17.59 | 11.03 | 39 | 98.67 | 5 | 8.11 | 4.99 | 14.8 | 10.96 | 3.89 | 12.44 | 34.8 | 7.36 | 5.48 | 21 |
| SD | 3.64 | 0.15 | 0.78 | 4.59 | 1.81 | 3.61 | 7.09 | 1.07 | 3.66 | 2.35 | 2.93 | 2.83 | 0.89 | 3.64 | 15.99 | 1.04 | 0.5 | 11.64 | |
| CV | 49.93 | 28.18 | 16.2 | 26.11 | 16.39 | 9.25 | 7.19 | 21.38 | 45.11 | 47.11 | 19.81 | 25.87 | 22.93 | 29.27 | 45.96 | 14.14 | 9.2 | 55.41 | |
| Range | 2 | 0.251 | 3.82 | 12 | 8 | 35 | 91 | 3 | 1.5 | 2.1 | 10 | 7 | 2 | 6.59 | 16.98 | 5.5 | 4.83 | 6.98 | |
| 13.2 | 0.67 | 6.05 | 26 | 14 | 42 | 105 | 6 | 15 | 10.1 | 21 | 15.5 | 5 | 17.2 | 47.91 | 8.9 | 6.71 | 42.25 | ||
| Brown (2) | Mean | 12.61 | 0.41 | 4.87 | 13.73 | 7.42 | 27.5 | 76 | 5.22 | 9.04 | 4.31 | 14.3 | 15.26 | 4.28 | 17.59 | 70.69 | 8.48 | 6.52 | 42.72 |
| SD | 2.2 | 0.08 | 1.21 | 2.02 | 0.63 | 0.71 | 8.49 | 1.09 | 3.29 | 1.26 | 2.98 | 1.41 | 1.02 | 1.74 | 7.78 | 0.9 | 0.58 | 7.82 | |
| CV | 17.47 | 19.21 | 24.77 | 14.73 | 8.54 | 2.57 | 11.16 | 20.93 | 36.36 | 29.17 | 20.86 | 9.24 | 23.79 | 9.89 | 11 | 10.58 | 8.83 | 18.31 | |
| Range | 7 | 0.285 | 3.49 | 10.4 | 6.5 | 27 | 70 | 3 | 5.1 | 2.3 | 8 | 13.5 | 1 | 14.89 | 65.189 | 7.15 | 5.52 | 25.14 | |
| 15.1 | 0.531 | 7.19 | 16.1 | 8 | 28 | 82 | 6 | 13.1 | 6.2 | 19 | 17.2 | 5 | 21.17 | 76.19 | 10.15 | 7.49 | 54.49 | ||
© 2019 by the authors. Licensee MDPI, Basel, Switzerland. This article is an open access article distributed under the terms and conditions of the Creative Commons Attribution (CC BY) license (http://creativecommons.org/licenses/by/4.0/).
Share and Cite
Arteaga, S.; Yabor, L.; Torres, J.; Solbes, E.; Muñoz, E.; Díez, M.J.; Vicente, O.; Boscaiu, M. Morphological and Agronomic Characterization of Spanish Landraces of Phaseolus vulgaris L. Agriculture 2019, 9, 149. https://0-doi-org.brum.beds.ac.uk/10.3390/agriculture9070149
Arteaga S, Yabor L, Torres J, Solbes E, Muñoz E, Díez MJ, Vicente O, Boscaiu M. Morphological and Agronomic Characterization of Spanish Landraces of Phaseolus vulgaris L. Agriculture. 2019; 9(7):149. https://0-doi-org.brum.beds.ac.uk/10.3390/agriculture9070149
Chicago/Turabian StyleArteaga, Sugenith, Lourdes Yabor, José Torres, Eva Solbes, Enrique Muñoz, María José Díez, Oscar Vicente, and Monica Boscaiu. 2019. "Morphological and Agronomic Characterization of Spanish Landraces of Phaseolus vulgaris L." Agriculture 9, no. 7: 149. https://0-doi-org.brum.beds.ac.uk/10.3390/agriculture9070149