Analysis of the Factors that Influence Olive Oil Demand in the Veneto Region (Italy)


Department of Land, Environment, Agriculture and Forestry, University of Padova, 35020 Legnaro (PD), Italy
*
Author to whom correspondence should be addressed.
Agriculture 2019, 9(7), 154; https://0-doi-org.brum.beds.ac.uk/10.3390/agriculture9070154
Submission received: 28 May 2019
/
Revised: 4 July 2019
/
Accepted: 8 July 2019
/
Published: 11 July 2019
Abstract
:The present study analyzes the demand for extra virgin olive oil of Veneto region consumers in relation to some extrinsic characteristics of the oil, such as the place of production (with particular reference to the Veneto region), the designation of origin, the organic certification, the type of transformation (artisanal or industrial), and the cultivation of olive trees in landscapes that have preserved traditional forms, which are typically the result of irregular plantations or the reduced densities of plants per hectare of cultivated areas. To this aim, a discrete choice experiment was carried out that allowed us to identify the effect of each of the attributes on the choices of the interviewees and to highlight the presence of heterogeneity in consumer preferences. The analysis carried out highlights the presence of a strong segmentation of the extra virgin olive oil (EVOO) market in the Veneto region. In the estimated model, the heterogeneity of preferences is particularly relevant in the case of Protected Denomination of Origin (PDO) production, handicraft milling, and organic production. In contrast, the interviewees’ preferences appear to be very homogeneous for the Italian or Veneto EVOO. The results of our research confirm that the place of production is one of the most important clues considered by consumers when buying EVOO. This effect, however, appears to be less important in the areas where olive tree cultivation occupies only a reduced fraction of the cultivated area. In these situations, people tend to prioritize the consumption of EVOO from other regions where production is more widespread. Olive growing that preserves the traditional landscape appears to have a significant effect on consumer behavior, but only for some market segments.
1. Introduction
Italy is the world’s second largest producer of olive oil after Spain. Approximately 80% of olive oil production in Italy is concentrated in the three most southern regions of the country: Puglia, Sicily, and Calabria.
Due to climatic conditions in northern Italy, the cultivation of the olive tree is much less widespread, even if there are territories in which, due to particular microclimates, it has been possible to cultivate the olive tree since ancient times. This is the case in the Veneto region, which, while contributing only 0.4% of the national production, has two Protected Denomination of Origin (PDO) areas, and in 2016, it was the largest production area in Northern Italy [1]. The two PDOs of Veneto are Garda and Veneto; the latter is distinguished in three sub-denominations linked to the production area as follows: “Valpolicella” in the Verona area (Valpolicella and Monti Lessini); “Del Grappa” in the Treviso area (piedmont del Grappa); “Berici e Euganei” in the Vicenza area (Colli Berici), and in the Padua area (Colli Euganei). It should also be noted that the average price of PDO oil in Veneto is currently among the highest in Italy [2].
Oil consumption of the Veneto region exceeds its production capacity, and its situation can be similar to those countries that, although they produce olive oil, must import a considerable quantity from abroad. Only a few studies have tried to analyze consumers’ attitudes towards the consumption of olive oil in territorial contexts in which a considerable part of the oil purchased comes from areas outside the region of residence. From this point of view, the situation in Veneto may be of particular interest because consumers are aware of the local production of olive oil, but they generally buy oil from the southern regions of the country or from abroad, both through large-scale retail trade and through other direct purchase channels at small mills.
In this regard, it should be recalled that numerous studies have tried to understand the factors behind the purchase of olive oil. Food product demand depends on expected quality, and as highlighted by Steenkamp [3], quality cues and quality attributes are the key elements in determining consumers’ quality expectations. While quality cues can be sensed before product consumption, quality attributes cannot be valued or sensed prior to consumption. Quality cues relate to the product’s physical characteristics (intrinsic cues), such as color and turbidity, or to other characteristics that are not physically part of the product (extrinsic cues), such as price, brand, region, or country of origin. Quality attributes are linked to product experience and can be classified into experience and credence attributes [4,5,6]. Experience attributes can be perceived during consumption, and in the specific context of food, they include taste, smell, and tenderness, while credence attributes, such as health or environmental benefits, cannot be directly evaluated even during consumption, despite playing an important role in consumer judgement. As quality attributes are difficult to know before using the product, consumers use extrinsic cues to infer the quality of the products. This attitude is of particular importance for olive oil consumption considering that in the case of handicraft manufacturing, the oil characteristics can change year by year.
Olive oil is a complex good, and the perception of its quality depends on both intrinsic and extrinsic characteristics [7,8]. The analysis of the effect of such characteristics on food demand has been analyzed in the literature by applying different methodologies. A first classification of the methodologies applied can be done by dividing them among monetary (e.g., hedonic pricing, choice experiments) and non-monetary techniques (e.g., multi-criteria analysis, conjoint analysis, preference rating). The advantage of monetary techniques is their ability to provide information on the premium price given by consumers to a specific characteristic of a product. Among monetary techniques, hedonic pricing [9,10] and choice experiments [11] have been the most widely applied to the olive oil market.
According to the literature, several factors are crucial in influencing purchasing decisions, and the most important are region or country of origin [12,13,14,15,16,17,18,19,20,21,22,23,24,25], certification of origin (PDO or Protected Geographical Indication - PGI) [12,15,16,18,20,23,25,26,27], organic certification [12,18,20,23,26], taste and appearance (color, turbidity, etc.) [13,14,16,17,18,19,21,24,27], packaging [16,17,19,27], and price [28,29].
Reviewing the current literature, the methods of transformation (artisanal or industrial) have only been considered by one study [30], while the characteristics of the territory and the landscape where the olive trees are cultivated have never been considered in the choice experiments that have analyzed the demand of olive oil.
The preservation of the traditional landscape can be of particular interest in the case of minor production realities, such as the Venetian one in which oil production is inserted into landscape contexts that are able to attract important flows of tourists, such as in the Garda Riviera or in the Euganean Hills.
The concept of the traditional rural landscape was introduced in Italy in 2012 by the Decree n. 0017070/2012 of the Ministry of Agriculture, Food, and Forestry. According to such decree and its implementing regulation, traditional rural landscapes “have been established in a given territory for a long time, even many centuries, and appear to have stabilized, or to evolve very slowly. They are generally maintained with practices and techniques requiring few external energy inputs, whether in the form of mechanization and irrigation or of chemical fertilizers and agro-drugs [...]. Their stability, or slow evolution, is evidence of harmonious integration of production, the environment, and culture in a given area or region” [31] (p. 26).
In this regard, it should be recalled that some studies have shown that the quality of the landscape of the place of production can influence the perception of the taste of wine [32] or the purchase choices of wine consumers [33,34] or meat consumers [35].
With reference to other agricultural products, Cosmina et al. [36] analyzed the effect of landscape characteristics on honey demand, and their study demonstrated evidence that only a small fraction of consumers are willing to pay a premium price for the production obtained in a traditional well-preserved landscape.
The purpose of this article is to analyze the demand for extra virgin olive oil (EVOO) of Veneto consumers in relation to some extrinsic characteristics of the oil, such as the place of production (with particular reference to Veneto), the designation of origin, the organic certification, the type of transformation (artisanal or industrial), and the cultivation of olive trees in landscapes that have preserved traditional forms, which are typically the result of irregular plantations or the reduced densities of plants per hectare of cultivated areas.
To this aim, a discrete choice experiment was carried out that allowed us to identify the effect of each of the attributes considered on influencing the choices of the interviewees and to highlight the presence of heterogeneity in consumer preferences.
The research allows us to overcome the substantial lack of investigation into the demand for EVOO produced in regions where the production is rather small, but the oil is characterized by a high quality due to its organoleptic characteristics.
The study is structured as follows: in the next section, the survey method will be described; in the third section, the results of the choice experiment will be illustrated; and finally, the results of the research will be discussed.
2. Materials and Methods
2.1. The Choice Experiment Methodology
The choice experiment (CE) methodology [37,38,39,40] is currently a widely used valuation technique in several fields (transportation, agribusiness, health economics, environmental economics, marketing) and derives its success from the great amount of information it is able to collect in terms of consumers’ preferences. In fact, it allows for the estimation of the willingness to pay (WTP) and the relative importance given by respondents to the attributes considered in the CE. Such an estimation can be performed to study mean sample preferences (multinomial logit models—MNL) [38] and to verify the presence of heterogeneity among respondents (latent class models—LCM, and mixed logit models—RPL) [39,41,42]. A further advantage of such a methodology is its suitability to both ex-ante and ex-post valuations because CE relies on the construction of a hypothetical market where the features of a good or service not yet in existence can be presented to respondents for the valuation exercise. CE data are usually collected by means of a questionnaire, in which, after introducing the hypothetical market where the good or service is presented, respondents are asked to choose their preferred good for each of the proposed bundles. In each bundle (choice set), the respondent is presented with several configurations of the same good differentiated by some of its key characteristics (attributes). Different models can be applied for CE data analysis: multinomial logit [38] models can be applied when preferences are assumed homogeneous among respondents, while mixed logit (RPL) and latent class models (LCM) are useful to test for the existence of heterogeneous preferences. In the analysis of food demand, the respondent’s heterogeneity results are particularly interesting to check for the presence of potential niche markets [43] or to analyze the potential market share of a product according to the distribution of individuals’ WTPs.
Looking at the theoretical pillars of the CE methodology, according to the Lancaster [44] consumer theory, the utility that a consumer derives from a good is the sum of the utilities derived from its characteristics. This condition can be formally expressed in mathematical terms as:
where the utility derived from a person n from the good i depends on a vector of characteristics of the good x and on the socio-economic characteristics S of the person n.
When a person makes a choice between two goods i and j assuming that this choice is made respecting rationality and a budget constrain, the person will choose the good that maximizes his/her utility. Therefore, under the rationality and budget constrain assumption, good i is chosen if the utility derived from it is greater than utility derived from a good j in his/her available choice set as described in Equation (2):
The analysis of utility as an expression of people preferences poses some difficulties. The first difficulty is that in reality it is not possible to observe utility directly. The analyst observes the choice made by a person and can only formulate a model that links the choice made to utility as a function of some “observable” characteristics of both the good studied and the person that performs the choice. Further difficulties include the impossibility to consider all characteristics of a good, measurement errors, and differences in how people value the attributes of the good. To overcome these problems and take into account uncertainty in the estimation of utility, random utility models are applied [45,46]. According to Thurstone [47], individual choices are the result of the value of the attributes chosen and some degree of randomness [38,48,49]. It is therefore possible to represent utility U as formulated in Equation (1) as a random variable:
where is the nonstochastic (observable) part of utility and the stochastic (unobservable) or random component. The random component of utility represents the uncertainty of the analyst about the factors that determined a specific choice. Due to the presence of a stochastic part in the utility function presented in Equation (3), it is only possible to predict choices in terms of probabilities. It is then possible to specify the probability of choosing alternative i over another alternative j by an individual n as [42]:
where is the density of the unobserved portion of utility and the indicator function assumes the following values:
Assuming that each is independently, identically distributed extreme value, the density of the unobservable part of utility drops to:
Therefore, the integral of Equation (4) becomes:
which represents the logit choice probability of person n choosing good i among a set of j options. Equation (7) takes advantage from the fact that the observable part of utility is usually specified to be linear in parameters and therefore , where is a vector of parameters and is a vector of the characteristics of the i-th good. More details about the derivation of Equation (7) from Equation (4) can be found in Train [42].
The parameters are estimated maximizing the following log-likelihood function:
where if person n choses i and zero otherwise. Equation (8) is used in the popular MNL models, while RPL models assume that people might have heterogeneous preferences related to the good features that do not depend on their socio-economic characteristics. In this respect RPL models allow to take into consideration preference heterogeneity assuming the beta parameters vary across people and have a given distribution with density , where refers to the parameters of such distribution (namely the mean and covariance of ). In RPL models the researcher makes assumptions about the distribution of the beta parameters and estimates by means of maximum simulated likelihood (more details are available in Train [42]). The presence of a certain degree of preference heterogeneity relative to the z characteristic of a good can be tested considering the statistical significance of the estimated parameter standard deviation.
An in-depth presentation, including the technical details, of the CE methodology can be found in Hensher, Rose, and Greene [11], Hauber, González, Groothuis-Oudshoorn, Prior, Marshall, Cunningham, Ijzerman, and Bridges [39], Lancsar, Fiebig, and Hole [40], Train [42] and Ben-Akiva, McFadden and Train [41].
2.2. Experimental Design
A CE was developed to analyze consumer preferences with regard to EVOO. The CE design considered five core attributes: price, production area, organic production, protected designation of origin (PDO), milling technology (handicraft or industrial production), and landscape characteristics of the territory. Table 1 illustrates the attributes and levels in detail.
Starting from a full factorial of 72 choice profiles, we reduced the number to 16 with an orthogonal fractional factorial design using SPSS software [11]. The 16 profiles obtained were organized into 8 choice sets with 2 choice options each plus the no choice option.
Data were collected by means of a questionnaire that was divided into four sections: introduction; information about EVOO purchase, consumption and preferences; choice experiment; and socio-economic questions.
2.3. Questionnaire Structure and Data Collection
The questionnaire was pre-tested with focus groups to identify possible issues related to the understanding of the questions, the structure and the representation of the choice experiment.
Between autumn 2012 and spring 2013, two trained interviewers collected 312 completed questionnaires through in-person interviews in the Veneto region in places where people usually buy olive oil (i.e., supermarkets, grocers). To avoid potential sample bias and to collect a representative sample of respondents, questionnaires were submitted equally during all weekdays and during different hours of the day.
In the questionnaire, respondents were asked to express with a score from 1 to 5 what factors they believe contribute to improving the quality of EVOO and what factors they consider when buying it (Table 3). Considering the factors that the interviewees took into account when buying EVOO by means of a k-means cluster analysis, the responses were grouped into two clusters (Table 4).
2.4. Data Analysis
The collected DCE data were analyzed by means of a random parameter logit model to account for the presence of heterogeneity in the respondents’ preferences, and the following utility function was applied:
where X is the vector of the five attribute levels (see Table 1) apart from price, βx is a vector of the n − 1 attribute levels coefficients, W is a vector of the interaction dummies, βopt-out is the opt-out coefficient and βprice is the price coefficient. The use of interaction variables is of particular importance as it permits to find the consumers’ characteristics that influence their consumption behavior. Such information is crucial when designing market strategies. Since it is not possible to know a priori which are the individual characteristics that can affect consumers’ habit, it is usual to select the interaction terms by testing their significance by means of an iterative trial and error approach. In our research to better understand the factors influencing the EVOO demand, five interaction terms were included in the model: a dummy variable for people belonging to cluster 2, a dummy variable for people older than 50 years, a dummy variable for an annual EVOO consumption greater than 22 liters, a dummy variable if the respondent stated that the price of the usually purchased EVOO is greater than 7 €/l, and a dummy variable if the respondents declared to usually purchase EVOO in the supermarket.
In the RPL model specification, we assume that all the parameters, apart from price and the opt-out dummy, are random and have a normal distribution.
Using the beta coefficients estimated through Equation (9), the average WTP (MWTP) of each of the attributes considered is calculated as follows:
While Equation (10) allows for the estimation of the sample MWTPs, the RPL model allows us to deepen the study of respondents’ heterogeneity by estimating their individual WTPs.
From a marketing perspective, the mean value of the premium price for a marginal variation of an attribute is, to a certain extent, useless because to implement a marketing strategy, producers need to know the demand function, that is, the relationship between the premium price and the quantity sold. In other words, producers need to know the market share corresponding to each price. Under the hypothesis that respondents state their WTP for the consumption of one product unit (in this case, one bottle of oil) and not for their annual consumption, the complementary cumulative distribution function (CCDF) of the WTP can be considered a proxy for the market demand function [50,51]. As known, the CCDF represent the probability that a variable takes a value greater than or equal to a given amount that is
In our application F(x) of Equation (11) correspond to the fraction (or percentage) of people that are willing to pay an amount greater than or equal to a given market price. From an economic point of view this percentage corresponds to the market share for the considered olive oil attribute in generating the CCDF.
The CCDF can be derived by analyzing the individual WTPs for each respondent using the RPL model [43,52,53]. To compute the CCDF, the following logistic function was estimated for each attribute level:
where u is the upper bound of the market share (equal to 100), and price corresponds to the individual WTP.
Depending on their market power, producers should choose the price and quantity that maximize their profit. Nevertheless, knowing the CCDF of the WTP provides producers with information that may help improve their marketing strategies: they can determine their market share for each potential market price and consequently compute their potential revenue and profit.
3. Results
3.1. Sample Characteristics and Opinions
Women constitute 61.5% of the sample. The higher prevalence of women is because they generally do the grocery shopping, even if it is not uncommon, especially among younger age groups, that men collaborate in the purchase of food products. With regard to age, the sample is fairly well distributed among the various age groups, although the younger groups and the older groups tend to be more prevalent (Table 2).
With regard to the educational level of the sample, 27.5% had only primary school, while 20% graduated with a university degree. Of the respondents, 41.3% were actively employed, 19.2% were retired, and the other respondents were either students (22.8%) or housewives (12.2%). The households consisted of an average of 2.6 people, which is a figure similar to the regional statistics.
All respondents buy olive oil, which in 91% of cases is extra-virgin olive oil. On average, 37% consume less than one liter of oil per month, and 32% consume one to two liters. The price paid for the purchase of olive oil has considerable variability, but 43% of the sample purchases it at a price lower than or equal to 6 €/l; therefore, it is oil produced by the major commercial brands.
Seventeen percent of respondents said they consume organic oil, and 45% have also purchased PDO oil. Sixty-eight percent stated they know the area where the oil consumed was produced. The production area of the oil consumed by the interviewees is Veneto in 16% of the cases and other Italian regions in 53% of the cases (in particular, Apulia and Tuscany).
The above figure is a consequence of the channel used to buy the olive oil; 71% is bought at the supermarket, and 30% is bought directly from the producer. This fact highlights that the purchase from the producer does not only contain oil from Veneto, but in 20% of the cases, also contains oil from other Italian regions.
Respondents were asked to express, with a score from 1 to 5, what factors they believe contribute to improving the quality of EVOO and what factors they consider when buying it (Table 3).
Among the factors affecting EVOO quality, the most important are the reputation of the sellers and producers (average score 4.35), the place of production (4.10), and the milling procedures (3.98). In contrast, organic production seems to be less important. With reference to the factors considered when buying EVOO, the most important are the origin (3.70) and the price (3.49). In contrast, the less important factors are people’s suggestions and advertising. The factors considered by the consumers when buying EVOO are of particular interest when setting marketing strategies. For example, if price is the most important factor, to increase its market share the producer can only discount the product. In the case in which the consumers consider the olive oil origin important, it will be useful to adopt a labeling strategy. In this respect it is also important to verify the existence of consumers that behave in a similar way with reference to the factors considered in the purchase of olive oil.
To this aim, by means of a k-means cluster analysis, the interviewees were grouped into two clusters (Table 4). The interviewees belonging to cluster 2 are 44% of the sample and consider the origin of EVOO, people’s recommendations, and sellers’ reputation to be less important factors and price to be the most important factor.
3.2. Choice Experiment Results
The results of the experiment are shown in Table 5. The model was estimated with NLOGIT 6 software applying 1,000 Halton draws. The model has a good interpretative capacity of the phenomenon under examination (McFadden pseudo R-squared = 0.275), and all the coefficients have the expected sign and are statistically significant (p > 0.95), with the exception of the landscape.
Three out of six attributes present a high degree of heterogeneity (Veneto PDO, handicraft manufacturing, organic production), which highlights the presence of considerable heterogeneity in interviewees’ preferences regarding the attributes of EVOO being evaluated.
For a correct interpretation of the model, since interaction terms have been inserted, it should first be recalled that the coefficients and WTP reported in the first part of the model refer to participants belonging to cluster 1, who have a low average annual consumption of EVOO, usually buy lower price oil, and buy at least a part of the oil directly from the producers.
For this group of consumers, the most important factor considered in the purchase of EVOO is undoubtedly the place of production, with a marked preference for oil produced in Italy. Although a certain preference for Veneto oil emerges, the difference between the coefficients and between the WTPs is not statistically significant. In other words, these consumers seem to prefer, in a substantially undifferentiated way, Italian oil compared to oil produced in other countries. These consumers are also willing to pay a premium price for oil obtained from artisanal and organic mills. Landscape features do not have a statistically significant effect on their preferences.
Considering the interaction terms, we can first see that those who consume a lot of oil are willing to pay less for the oil produced in Italy or in Veneto, even if it is PDO oil. A lower willingness to pay for the Veneto oil was also found in the case of the respondents belonging to cluster 2, who place a higher importance on the price when they buy oil. On the other hand, respondents who buy EVOO mainly at the supermarket are willing to pay more for Italian and Veneto oil, and especially for PDO oil from Veneto.
Regarding the production techniques, the participants belonging to cluster 2 have virtually a zero WTP. Additionally, in the case of participants in the higher age groups, the WTP for this characteristic is lower, although positive. The highest WTP for artisanal transformation has been demonstrated by those who already buy oil in the higher price range and are probably also used to buying oil from the numerous small mills in the study area.
Although in general, as noted, little interest seems to emerge in the purchase of oil obtained from olive groves in which the traditional landscape has been preserved, a market segment of people willing to pay more for this attribute of oil exists. This segment of the market includes the people belonging to cluster 2 who have an average WTP of 2.95 €/l for EVOO obtained in a traditional rural landscape. Even those who buy oil mainly in the supermarket have expressed a WTP of 2.22 €/l, although in this case, the coefficient is only significant with 90% probability. Finally, as far as organic production is concerned, it emerges from the model that older people have a lower WTP, while those who already spend a high price are willing to spend more on organic EVOO.
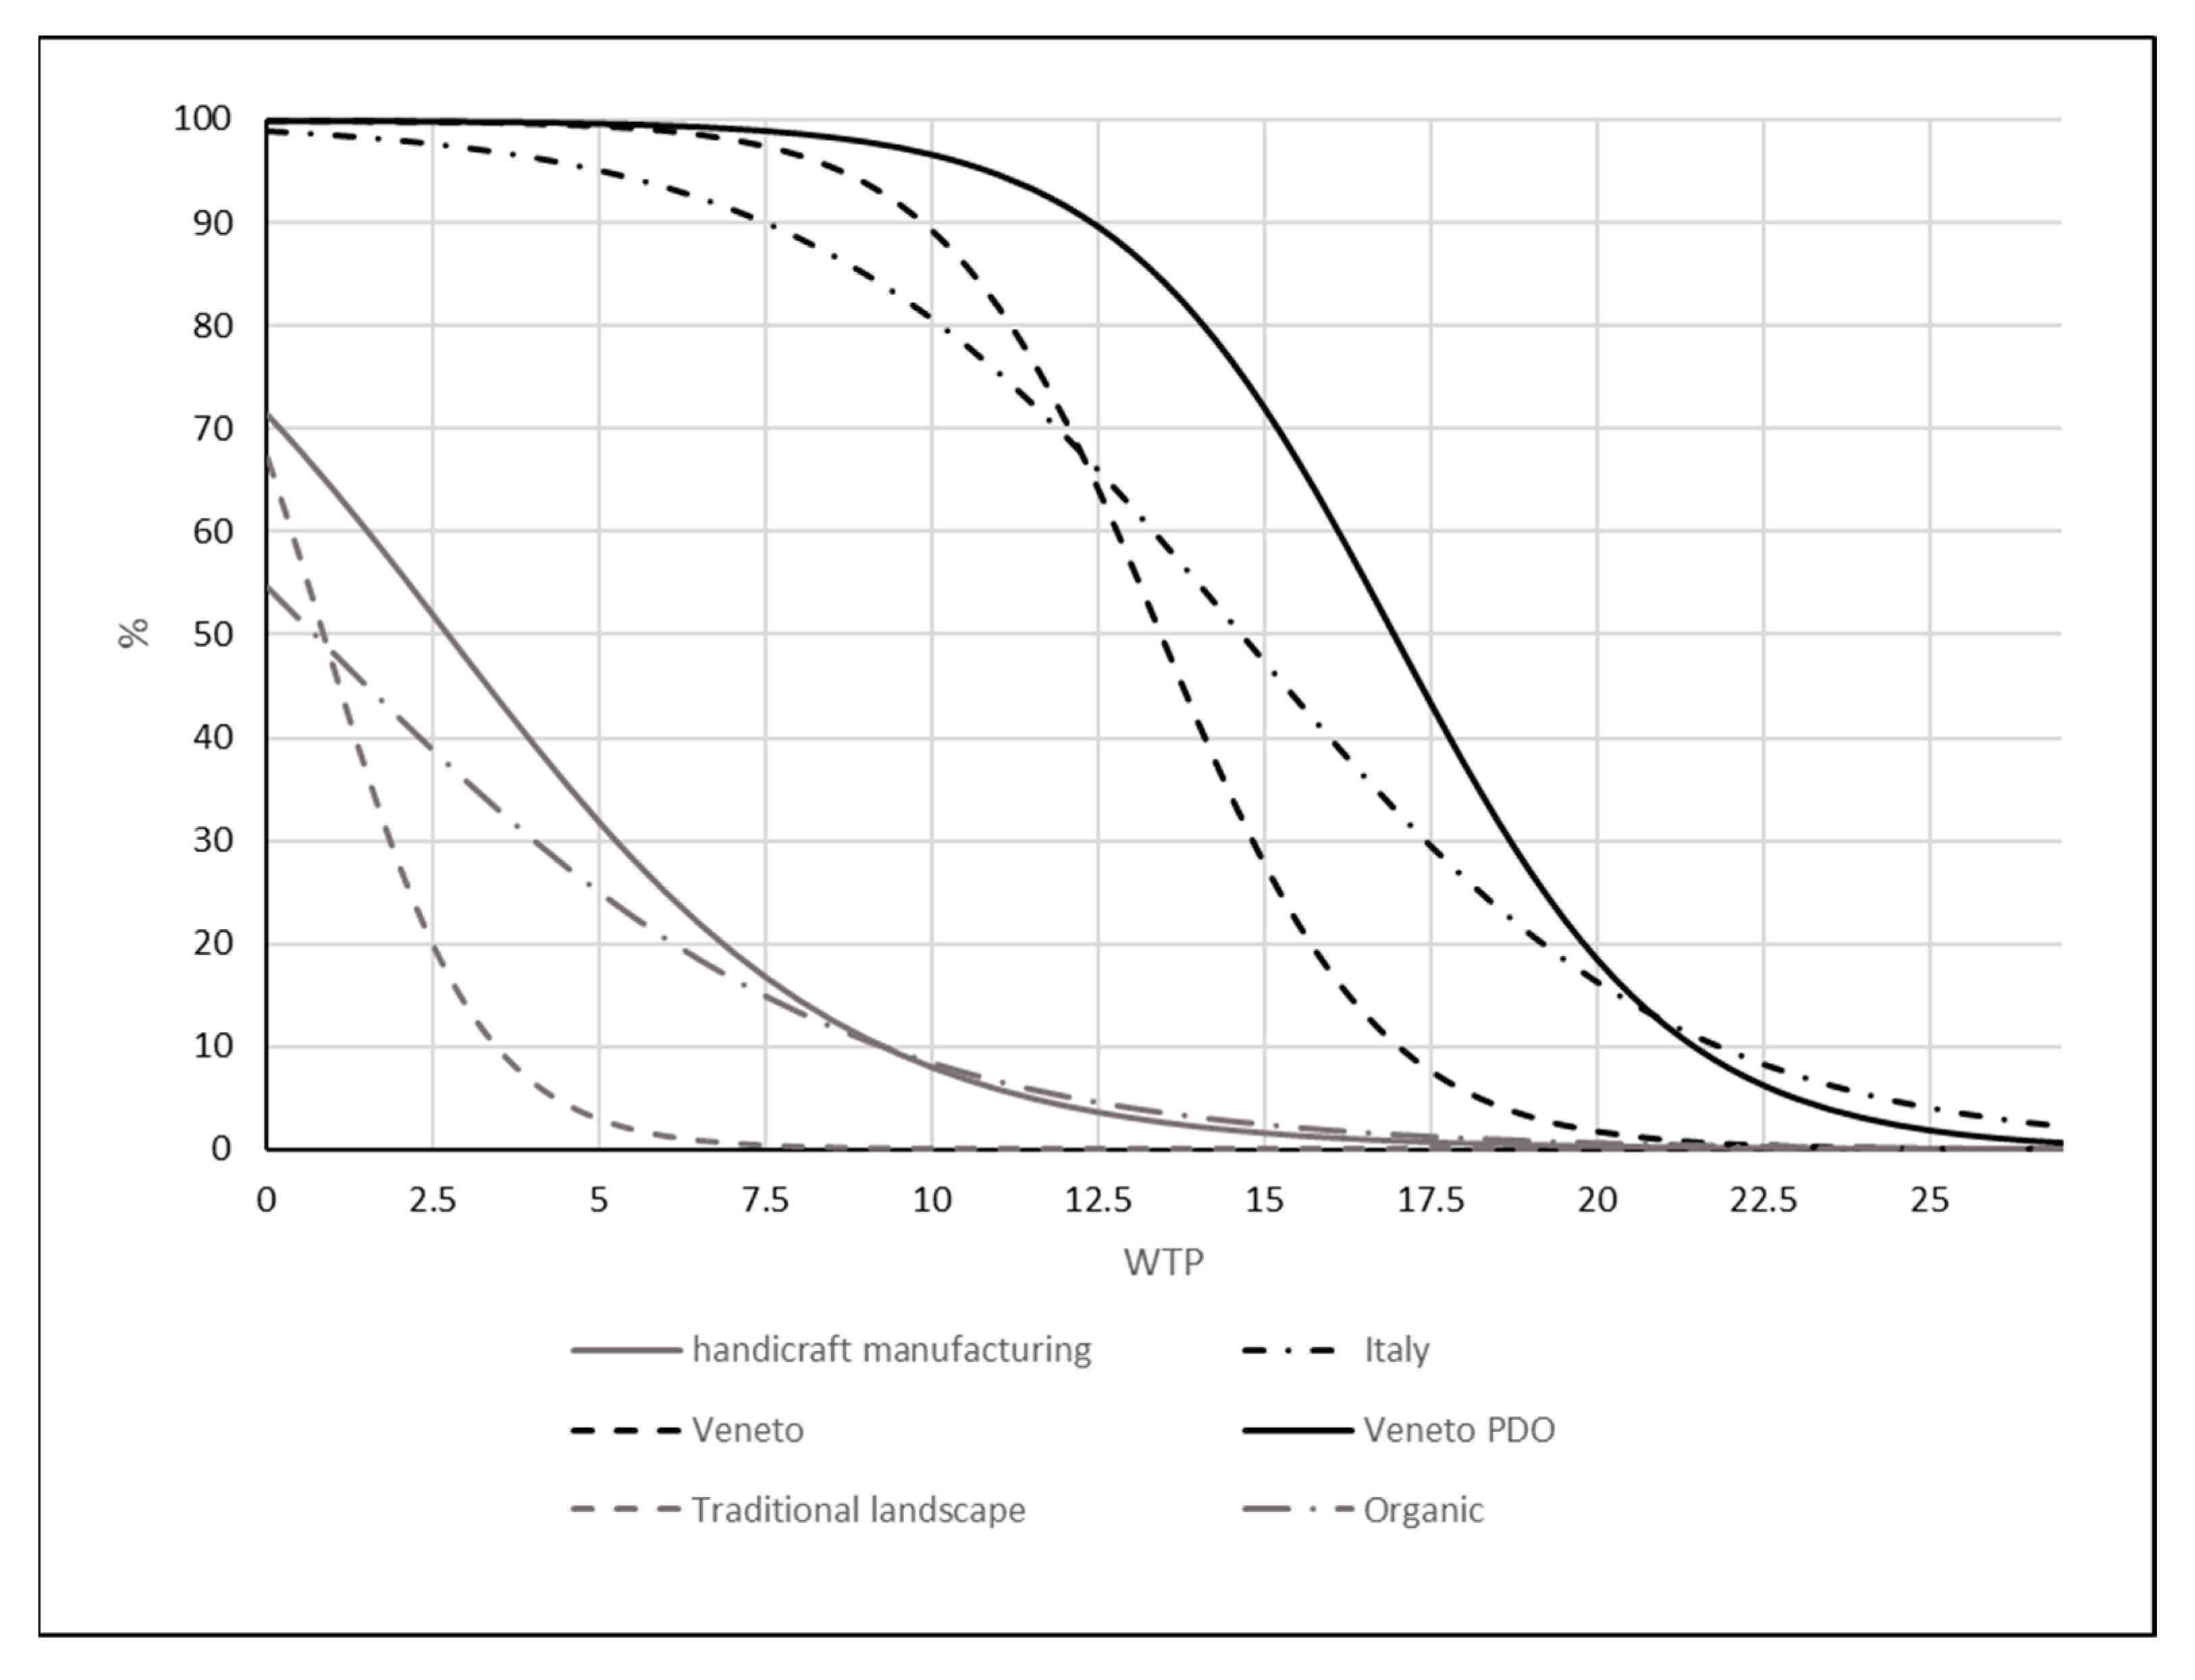
As noted, in addition to the average WTP, the individual WTP was also estimated, and this allowed us to obtain information on the market share of each of the attributes considered in the CE. In Table 6, the estimated logistic models are shown, while in Figure 1, the estimated functions are presented.
From Figure 1 it is possible to have univocal information about the relative importance of the attributes considered in the experiment. In fact, the CCDF is very different for the various attributes. For example, all respondents are willing to pay a premium price to purchase EVOO if its origin is Italy or Veneto, and if it is labelled as Veneto PDOs.
The percentage of respondents willing to pay almost a minimum premium price is instead equal to 71% for the oil obtained through craftsmanship, 67% for the production obtained from olive groves that have preserved the traditional landscape, and 54% for the biological productions. Considering the price at which 50% of the interviewees is willing to pay for EVOO, from Figure 1 it is possible to see that it is equal to 14.6 for the oil produced in Italy, to 13.3 € for the oil produced in Veneto, and to 16.7 € for PDO Venetian oil. This figure is much lower in the case of handicraft manufacturing (2.7 €), traditional landscape (0.7 €), and organic (0.7 €). Moreover, it is possible to see that the CCDFs have a very different shape. The CCDF for traditional landscapes has a much higher slope than that of organic oil; in fact, the percentage of participants willing to pay a premium price of 5 € for the protection of the landscape is 3% for traditional landscapes and 25% for organic oil.
As for the production area and the PDO, it should be noted that virtually all respondents would be willing to pay a premium price of 5 € for Veneto oil, a market share that drops to 95% for Italian oil.
4. Discussion
The analysis carried out highlights the presence of a strong segmentation of the EVOO market in the Veneto region. In the estimated model, the heterogeneity of preferences is particularly relevant in the case of PDO production, handicraft milling, and organic production. In contrast, the interviewees’ preferences seem to be very homogeneous for the Italian or Veneto EVOO. It can be deduced that the tendency to prefer local products is a phenomenon widely shared by consumers. This result is consistent with the findings of other studies involving both olive oil [54] and other agricultural products [55,56,57].
As stressed by Verlegh and Steenkamp [57], the preference according to country of origin has three main components: cognitive, affective, and normative. With reference to the cognitive component, the country of origin represents a ‘‘signal for overall product quality’’ (p. 524). The affective component can be considered as a symbolic meaning of national or regional pride. In this respect, food becomes a symbol of the identity of the people belonging to a certain social group. Finally, the normative component has essentially an altruistic basis and relates to the tendency to favor the local economy and national production.
The place of production is one of the attributes most often considered in studies that have applied CE to evaluate EVOO [12,13,14,15,16,17,18,19,20,21,22,23,24,25]. These studies compared different alternatives related to the place of origin that were generally divided into the region of residence, other regions of the same nation, and other nations (often grouped in a single category related to all foreign countries). In general, it can be seen that when this classification is present, the respondents tend to prefer the EVOO of their own region; on the other hand, the oil produced in their own country is preferred to the foreign one. For example, Yangui, Costa-Font and Gil [23] have shown that residents in Catalonia are willing to pay more for the oil produced in Catalonia, while the oil from the rest of Spain is preferred to the oil that is imported. On the other hand, when the productions obtained in different regions of the same nation were compared, in general, the interviewees tended to favor the oil obtained in the region of residence [12]. It is interesting to note that the results obtained in our survey are partly different from those that emerged in most other research. In fact, the EVOO produced in Veneto is not preferred to that produced in Italy. This result is consistent with the results of the research carried out by Cicia, Del Giudice, and Scarpa [14], which showed that residents in Campania prefer oil produced in Tuscany to that of their region. In the case of Veneto, this result shows that when a product considered to be of high quality is obtained in another region, the preference for the area of residence may be negated. It is not infrequent that residents of the Veneto region buy the EVOO produced in other Italian regions, especially in the south. The renown of a product can therefore significantly reduce the preference generally accorded to local productions.
This data is particularly relevant if we consider that, if some categories of respondents are excluded, the presence of a PDO label does not significantly increase the difference between Veneto and Italian productions. These results are consistent with Grunert and Aachmann [58] findings. These authors, reviewing the literature in this field of research for various types of food, concluded that the effect of PDO on consumer behavior is not univocal, and in many cases, PDO does not have a relevant effect on people’s WTP. With reference to EVOO, many studies analyzed the effect of PDO on consumers’ demand [12,15,16,18,20,23,26,27], but their results are not fully comparable to our findings. In fact, they have rarely considered this feature as one of the possible alternatives to the place of production. PDO in general has a double meaning: on the one hand, it is an indication of the quality of the product that has to be produced following the prescription of the PDO specification rules; on the other, it is an indicator of the place of production. It is evident that without considering PDO and region or country of production at the same time, PDO can assume the meaning of the region of production, and the CE result in this case could be spurious. This makes it difficult to compare the results of some previous studies to our findings. However, Di Vita, D’Amico, La Via, and Caniglia [15] found that PDO seems to play an important role in orienting consumers’ preferences. Panico, Del Giudice, and Caracciolo [18] found that the WTP for PDO certification is quite similar to the WTP for the Italian EVOO. Also Yangui, Costa-Font and Gil [23] highlighted that PDO can play an important role when designing EVOO marketing strategies. The results of our study are not consistent with the findings of these studies, and this probably depends on the insufficient knowledge of the PDO certification of the people living in the Veneto region.
The effect of organic certification has been analyzed by many studies in the past [59]. In general, organic certification has a non-negligible effect on consumer WTP, but individual preferences have a relevant degree of heterogeneity. With reference to EVOO, Aprile, Caputo, and Nayga Jr [26], Menapace, Colson, Grebitus, and Facendola [16], Panico, Del Giudice, and Caracciolo [18] and Yangui, Costa-Font, and Gil [23] found an average WTP of 4.8 €/l, 5.6 €/l, 3.7 €/l, and 3.5 €/l, respectively, figures that are quite similar to our estimate (4.49 €/l). These data seem to confirm that organic production is an important segment of the olive oil market. Considering that our findings highlight that older people have a lower WTP, it is possible to suppose that this market segment will increase in the future. In any case, our research suggests that almost one-half of the interviewees are willing to pay a premium price for the organic EVOO.
To the best of our knowledge, the effect of traditional oil milling has been analyzed only by the research carried out by Dekhili and d’Hauteville [30]. The authors, by means of a CE, found that traditional milling is one of the most important factors considered by the French when buying oil. In contrast, Tunisians place no importance on this attribute and, on the contrary, receive higher utility by the consumption of modern milling procedures. In our research, handicraft milling is as important as the organic production method. Most likely, people living in Europe consider that traditional and handicraft milling is able to better preserve the taste of EVOO, while industrial manufacturing tends to standardize the taste. In this respect, handicraft milling seems to be an important extrinsic cue in the case of EVOO marketing.
To a certain extent, it is possible to state that olive cultivation preserving the traditional landscape has a meaning similar to traditional milling. In fact, in this case, the growing of olive trees is carried out following traditional methods. Typically, the traditional landscape of olive trees is characterized by a lower tree density per hectare and the presence of older trees. The olive harvest is made by hand, and this permits a better quality of the olives and of the oil. As we saw, olive growing preserving traditional landscapes seems to have a significant effect on consumer behavior only for some market segments (e.g., people belonging to cluster 2 and that usually buy olive oil at the supermarket). This result is different from that obtained by other authors, especially with reference to the wine market [32,33,34]. This likely depends on the small olive growing area actually present in the Veneto region, which makes it difficult for people living in the region to have direct knowledge of this type of landscape. In contrast, the vineyards occupy approximately 10% of the cultivated land of the region, and people have the opportunity to see this landscape and how it changes when participating in recreational activities on the countryside.
It is important to consider that the methodology used in this research may have some limitations while analyzing its results. First of all it must be remembered that there can be significant differences between what is stated by people and their actual behavior [60]. This depends on the fact that in reality the consumer is much more influenced by the product price than in hypothetical markets simulations like those used with CE. A further aspect that needs consideration is the role played by taste. It should not be overlooked that the taste of a product plays a crucial role in the purchase of a product and that tasting the product can greatly influence the importance assumed by the characteristics of the food product in conditioning purchase choices [35]. This last aspect might be particularly important in the case of olive oil whose organoleptic characteristics are significantly affected by the place of production. Therefore, in order to have more realistic information on the real importance of the extrinsic characteristics of oil in addressing consumer choices, it would be important to combine the CEs with a sensory study making consumers taste the product.
Despite these limitations it should be pointed out that our research has revealed indications that could be useful for the adoption of marketing strategies for olive oil produced in the Veneto region.
5. Conclusions
The results of our research confirm that the place of production is one of the most important cues considered by consumers when buying EVOO. This effect, however, seems to be less important in the areas where olive tree cultivation occupies only a reduced fraction of the cultivated area. In these situations, people tend to prioritize the consumption of EVOO from other regions where production is more widespread.
Considering the implementation of marketing policies, other labeling strategies (PDO and organic production) seem to be important for some market segments, although it is possible to suppose that in the future, their importance will probably increase. Finally, the research highlights the importance of manufacturing technologies in orienting consumers’ choices. This aspect of the EVOO market has not been investigated in the large majority of previous studies, but in light of our results, more efforts should be devoted by scholars in the future to better understand the role of handicraft milling to promote the market of olive oil.
Author Contributions
T.T. conceived the study and followed the data collection; D.V. and T.T. developed the CE experimental design and performed the data analysis; T.T. contributed Section 1 and Section 3.2; D.V. contributed Section 2, Section 3.1and Section 4.
Funding
This research received no external funding.
Acknowledgments
We thank Alessandro Filon and Massimiliano Citton for their collaboration during the data collection.
Conflicts of Interest
The authors declare no conflict of interests.
References
- ISMEA. Tendenze-Olio di Oliva; 1/2018; ISMEA: Roma, Italy. 2018. Available online: http://www.ismeamercati.it/flex/cm/pages/ServeAttachment.php/L/IT/D/a%252F1%252Fb%252FD.2b7f88f6191487a1e87d/P/BLOB%3AID%3D8837/E/pdf (accessed on 10 July 2019).
- ISMEA. Tendenze-Olio di Oliva; 2/2017; ISMEA: Roma, Italy. 2017. Available online: http://www.ismeamercati.it/flex/cm/pages/ServeAttachment.php/L/IT/D/4%252Ff%252F9%252FD.1c864732886f35073d3a/P/BLOB%3AID%3D7925/E/pdf (accessed on 10 July 2019).
- Steenkamp, J.-B.E.M. Conceptual model of the quality perception process. J. Bus. Res. 1990, 21, 309–333. [Google Scholar] [CrossRef]
- Nelson, P. Information and Consumer Behavior. J. Polit. Econ. 1970, 78, 311–329. [Google Scholar] [CrossRef]
- Andersen, E.S. The evolution of credence goods: A transaction approach to product specification and quality control. In Working Paper; MAPP-Centre for Research on Customer Relations in the Food Sector: Aarhus, Denmark, 1994. [Google Scholar]
- Wilde, L.L. The Economics of Consumer Information Acquisition. J. Bus. 1980, 53, S143–S158. [Google Scholar] [CrossRef]
- Reboredo-Rodríguez, P.; González-Barreiro, C.; Cancho-Grande, B.; Fregapane, G.; Salvador, M.D.; Simal-Gándara, J. Characterisation of extra virgin olive oils from Galician autochthonous varieties and their co-crushings with Arbequina and Picual cv. Food Chem. 2015, 176, 493–503. [Google Scholar] [CrossRef] [PubMed]
- Reboredo-Rodríguez, P.; González-Barreiro, C.; Cancho-Grande, B.; Simal-Gándara, J. Quality of extra virgin olive oils produced in an emerging olive growing area in north-western Spain. Food Chem. 2014, 164, 418–426. [Google Scholar] [CrossRef] [PubMed]
- Bartik, T.J. The Estimation of Demand Parameters in Hedonic Price Models. J. Polit. Econ. 1987, 95, 81–88. [Google Scholar] [CrossRef]
- Court, L.M. Entrepreneurial and Consumer Demand Theories for Commodity Spectra: Part, I. Econometrica 1941, 9, 135–162. [Google Scholar] [CrossRef]
- Hensher, D.A.; Rose, J.M.; Greene, W.H. Applied Choice Analysis: A Primer; Cambridge University Press: Cambridge, UK, 2005; 717p. [Google Scholar]
- Casini, L.; Contini, C.; Marinelli, N.; Romano, C.; Scozzafava, G. Nutraceutical olive oil: does it make the difference? Nutr. Food Sci. 2014, 44, 586–600. [Google Scholar] [CrossRef]
- Chan-Halbrendt, C.; Zhllima, E.; Sisior, G.; Imami, D.; Leonetti, L. Consumer Preferences for Olive Oil in Tirana, Albania. Int. Food Agribus. Manag. Rev. 2010, 13, 55–74. [Google Scholar]
- Cicia, G.; Del Giudice, T.; Scarpa, R. Consumers’ perception of quality in organic food: A random utility model under preference heterogeneity and choice correlation from rank-orderings. Br. Food J. 2002, 104, 200–213. [Google Scholar] [CrossRef]
- Di Vita, G.; D’Amico, M.; La Via, G.; Caniglia, E. Quality perception of PDO extra-virgin olive oil: which attributes most influence Italian consumers? Agric. Econ. Rev. 2013, 14, 46–58. [Google Scholar]
- Menapace, L.; Colson, G.; Grebitus, C.; Facendola, M. Consumers’ preferences for geographical origin labels: evidence from the Canadian olive oil market. Eur. Rev. Agric. Econ. 2011, 38, 193–212. [Google Scholar] [CrossRef]
- Mtimet, N.; Zaibet, L.; Zairi, C.; Hzami, H. Marketing Olive Oil Products in the Tunisian Local Market: The Importance of Quality Attributes and Consumers’ Behavior. J. Int. Food Agribus. Mark. 2013, 25, 134–145. [Google Scholar] [CrossRef]
- Panico, T.; Del Giudice, T.; Caracciolo, F. Quality dimensions and consumer preferences: A choice experiment in the Italian extra-virgin olive oil market. Agric. Econ. Rev. 2014, 15, 253685. [Google Scholar]
- Romo-Muñoz, R.A.; Cabas-Monje, J.H.; Garrido-Henrríquez, H.M.; Gil, J.M. Heterogeneity and nonlinearity in consumers’ preferences: An application to the olive oil shopping behavior in Chile. PLoS ONE 2017, 12, e0184585. [Google Scholar] [CrossRef] [PubMed]
- Scarpa, R.; Del Giudice, T. Market Segmentation via Mixed Logit: Extra-Virgin Olive Oil in Urban Italy. J. Agric. Food Ind. Organ. 2004, 2. [Google Scholar] [CrossRef]
- Van der Lans, I.A.; van Ittersum, K.; De Cicco, A.; Loseby, M. The role of the region of origin and EU certificates of origin in consumer evaluation of food products. Eur. Rev. Agric. Econ. 2001, 28, 451–477. [Google Scholar] [CrossRef]
- Yangui, A.; Costa-Font, M.; Gil, J.M. Revealing additional preference heterogeneity with an extended random parameter logit model: the case of extra virgin olive oil. Spanish J. of Agric. Res. 2014, 12, 15. [Google Scholar] [CrossRef]
- Yangui, A.; Costa-Font, M.; Gil, J.M. The effect of personality traits on consumers’ preferences for extra virgin olive oil. Food Qual. Prefer. 2016, 51, 27–38. [Google Scholar] [CrossRef]
- Finardi, C.; Giacomini, C.; Menozzi, D.; Mora, C. Consumer preferences for country-of-origin and health claim labelling of extra-virgin olive-oil. In Proceedings of the 113rd EAAE Seminar on: A Resilient European Food Industry and Food Chain in a Challenging World, Crete, Greece, 3–6 September 2009. [Google Scholar]
- Ballco, P.; Gracia, A.; Jurado, J. Consumer preferences for extra virgin olive oil with Protected Designation of Origin (PDO). In Proceedings of the X Congress AEEA, Córdoba, Spain, 9–11 September 2015. [Google Scholar]
- Aprile, M.C.; Caputo, V.; Nayga, R.M., Jr. Consumers’ valuation of food quality labels: the case of the European geographic indication and organic farming labels. Int. J. Consum. Stud. 2012, 36, 158–165. [Google Scholar] [CrossRef]
- Erraach, Y.; Sayadi, S.; Gómez, A.C.; Parra-López, C. Consumer-stated preferences towards protected designation of origin (PDO) labels in a traditional olive-oil-producing country: The case of Spain. New Medit 2014, 13, 11–19. [Google Scholar]
- Cicerale, S.; Liem, G.; Keast, R.S.J. Consumer Perception, Attitudes, Liking and Preferences for Olive Oil. In Products from Olive Tree; Boskou, D., Clodoveo, M.L., Eds.; IntechOpen: London, UK, 2016. [Google Scholar] [CrossRef] [Green Version]
- Jiménez-Guerrero, J.F.; Gázquez-Abad, J.C.; Mondéjar-Jiménez, J.A.; Huertas-García, R. Consumer Preferences for Olive-Oil Attributes: A Review of the Empirical Literature Using a Conjoint Approach. In Olive Oil: Constituents, Quality, Health Properties and Bioconversions; Boskou, D., Ed.; IntechOpen: London, UK, 2012. [Google Scholar] [CrossRef] [Green Version]
- Dekhili, S.; D’Hauteville, F. Effect of the region of origin on the perceived quality of olive oil: An experimental approach using a control group. Food Qual. Prefer. 2009, 20, 525–532. [Google Scholar] [CrossRef]
- Agnoletti, M. Italian Historical Rural Landscapes: Cultural Values for the Environment and Rural Development; Springer Science & Business Media: Berlin, Germany, 2012. [Google Scholar] [CrossRef]
- Tempesta, T.; Giancristofaro, R.A.; Corain, L.; Salmaso, L.; Tomasi, D.; Boatto, V. The importance of landscape in wine quality perception: An integrated approach using choice-based conjoint analysis and combination-based permutation tests. Food Qual. Prefer. 2010, 21, 827–836. [Google Scholar] [CrossRef]
- Troiano, S.; Marangon, F.; Tempesta, T.; Vecchiato, D. Organic vs local claims: Substitutes or complements for wine consumers? A marketing analysis with a discrete choice experiment. New Medit 2016, 15, 14–21. [Google Scholar]
- Tempesta, T.; Vecchiato, D.; Djumboung, D.A.; Chinazzi, G. An analysis of the potential effects of the modification of the Prosecco Protected Designation of Origin: a choice experiment. Int. Agric. Policy 2014, 2, 33–48. [Google Scholar]
- Torquati, B.; Tempesta, T.; Vecchiato, D.; Venanzi, S. Tasty or Sustainable? The Effect of Product Sensory Experience on a Sustainable New Food Product: An Application of Discrete Choice Experiments on Chianina Tinned Beef. Sustainability 2018, 10, 2795. [Google Scholar] [CrossRef]
- Cosmina, M.; Gallenti, G.; Marangon, F.; Troiano, S. Attitudes towards honey among Italian consumers: A choice experiment approach. Appetite 2016, 99, 52–58. [Google Scholar] [CrossRef] [Green Version]
- Louviere, J.J.; Woodworth, G. Design and Analysis of Simulated Consumer Choice or Allocation Experiments: An Approach Based on Aggregate Data. J. Mark. Res. 1983, 20, 350–367. [Google Scholar] [CrossRef]
- McFadden, D. Conditional Logit Analysis of Qualitative Choice Behavior. In Frontiers in Econometrics; Zarembka, P., Ed.; Academic Press: New York, NY, USA, 1974; pp. 105–142. [Google Scholar]
- Hauber, A.B.; González, J.M.; Groothuis-Oudshoorn, C.G.M.; Prior, T.; Marshall, D.A.; Cunningham, C.; Ijzerman, M.J.; Bridges, J.F.P. Statistical Methods for the Analysis of Discrete Choice Experiments: A Report of the ISPOR Conjoint Analysis Good Research Practices Task Force. Value Health 2016, 19, 300–315. [Google Scholar] [CrossRef] [Green Version]
- Lancsar, E.; Fiebig, D.G.; Hole, A.R. Discrete Choice Experiments: A Guide to Model Specification, Estimation and Software. Pharm. Econ. 2017, 35, 697–716. [Google Scholar] [CrossRef] [Green Version]
- Ben-Akiva, M.; McFadden, D.; Train, K. Foundations of Stated Preference Elicitation: Consumer Behavior and Choice-based Conjoint Analysis. Found. Trends® Econ. 2019, 10, 1–144. [Google Scholar] [CrossRef] [Green Version]
- Train, K. Discrete Choice Methods with Simulation, 2nd ed.; Cambridge University Press: Cambridge, UK, 2009. [Google Scholar]
- Demartini, E.; Vecchiato, D.; Tempesta, T.; Gaviglio, A.; Viganò, R. Consumer preferences for red deer meat: a discrete choice analysis considering attitudes towards wild game meat and hunting. Meat Sci. 2018, 146, 168–179. [Google Scholar] [CrossRef] [PubMed] [Green Version]
- Lancaster, K.J. A New Approach to Consumer Theory. J. Polit. Econ. 1966, 74, 132. [Google Scholar] [CrossRef]
- Block, H.D. Random Orderings and Stochastic Theories of Responses (1960). In Economic Information, Decision, and Prediction: Selected Essays: Volume I Part I Economics of Decision; Springer: Dordrecht, The Netherlands, 1974; pp. 172–217. [Google Scholar] [CrossRef]
- McFadden, D. The Revealed Preferences of a Government Bureaucracy: Empirical Evidence. Bell J. Econ. 1976, 7, 55–72. [Google Scholar] [CrossRef]
- Thurstone, L.L. A law of comparative judgment. Psychol. Rev. 1927, 34, 273–286. [Google Scholar] [CrossRef]
- Luce, R.D. Individual Choice Behavior: A Theoretical Analysis; Wiley: New York, NY, USA, 1959. [Google Scholar]
- Manski, C.F. The structure of random utility models. Theory Decis. 1977, 8, 229–254. [Google Scholar] [CrossRef]
- Lusk Jayson, L.; Schroeder Ted, C. Auction Bids and Shopping Choices. Adv. Econ. Anal. Policy 2006, 6. [Google Scholar] [CrossRef]
- Lusk, J.L.; Hudson, D. Willingness-to-Pay Estimates and Their Relevance to Agribusiness Decision Making. Appl. Econ. Perspect. Policy 2004, 26, 152–169. [Google Scholar] [CrossRef]
- Torquati, B.; Paffarini, C.; Tempesta, T.; Vecchiato, D. Evaluating consumer perceptions of social farming through choice modelling. Sustain. Product. Consum. 2019, 19, 238–246. [Google Scholar] [CrossRef]
- Vecchiato, D.; Tempesta, T. Public preferences for electricity contracts including renewable energy: A marketing analysis with choice experiments. Energy 2015, 88, 168–179. [Google Scholar] [CrossRef]
- Del Giudice, T.; Cavallo, C.; Caracciolo, F.; Cicia, G. What attributes of extra virgin olive oil are really important for consumers: a meta-analysis of consumers’ stated preferences. Agric. Food Econ. 2015, 3, 20. [Google Scholar] [CrossRef]
- Feldmann, C.; Hamm, U. Consumers’ perceptions and preferences for local food: A review. Food Qual. Prefer. 2015, 40, 152–164. [Google Scholar] [CrossRef]
- Lusk, J.L.; Brown, J.; Mark, T.; Proseku, I.; Thompson, R.; Welsh, J. Consumer Behavior, Public Policy, and Country-of-Origin Labeling. Rev. Agric. Econ. 2006, 28, 284–292. [Google Scholar] [CrossRef]
- Verlegh, P.W.J.; Steenkamp, J.-B.E.M. A review and meta-analysis of country-of-origin research. Journal of Econ. Psychol. 1999, 20, 521–546. [Google Scholar] [CrossRef]
- Grunert, K.G.; Aachmann, K. Consumer reactions to the use of EU quality labels on food products: A review of the literature. Food Control. 2016, 59, 178–187. [Google Scholar] [CrossRef]
- Aschemann-Witzel, J.; Zielke, S. Can’t Buy Me Green? A Review of Consumer Perceptions of and Behavior Toward the Price of Organic Food. J. Consum. Aff. 2017, 51, 211–251. [Google Scholar] [CrossRef]
- Carrington, M.J.; Neville, B.A.; Whitwell, G.J. Why Ethical Consumers Don’t Walk Their Talk: Towards a Framework for Understanding the Gap Between the Ethical Purchase Intentions and Actual Buying Behaviour of Ethically Minded Consumers. J. Bus. Ethics 2010, 97, 139–158. [Google Scholar] [CrossRef]
Figure 1.
Complementary cumulative distribution functions. WTP = Willingness to Pay; PDO = Protected Designation of Origin.
Figure 1.
Complementary cumulative distribution functions. WTP = Willingness to Pay; PDO = Protected Designation of Origin.


Table 1.
Attributes and levels considered in the choice experiment.
| Attributes | Levels |
|---|---|
| Place of production and PDO certification | Abroad, Italy, Veneto, Veneto PDO |
| Production method | Conventional or organic |
| Milling technology | Industrial or handicraft manufacturing |
| Landscape characteristics | Modern or traditional |
| Organic | Yes, no |
| Price | 5, 10, 18 euro per bottle 75 cl |
PDO: protected designation of origin.
Table 2.
Socioeconomic characteristics of the interviewees.
| N. | % | |
|---|---|---|
| Gender | ||
| Women | 192 | 61.5 |
| Men | 120 | 38.5 |
| Total | 312 | 100.0 |
| Age class | ||
| From 20 to 29 | 104 | 33.3 |
| From 30 to 39 | 50 | 16.0 |
| From 40 to 49 | 50 | 16.0 |
| From 50 to 59 | 45 | 14.4 |
| Higher or equal to 60 | 63 | 20.2 |
| Total | 312 | 100.0 |
| Educational level | ||
| Primary school | 31 | 9.9 |
| Middle school | 55 | 17.6 |
| Secondary school | 163 | 52.2 |
| University degree | 63 | 20.2 |
| Total | 312 | 100.0 |
| Occupation | ||
| Employed | 129 | 41.3 |
| Unemployed | 14 | 4.5 |
| Retired | 60 | 19.2 |
| Housewife | 38 | 12.2 |
| Student | 71 | 22.8 |
| Total | 312 | 100.0 |
| Household size | ||
| 1 or 2 | 68 | 21.8 |
| 3 | 88 | 28.2 |
| 4 | 112 | 35.9 |
| 5 | 35 | 11.2 |
| More than 5 | 9 | 2.9 |
| Total | 312 | 100.0 |
Table 3.
Factors affecting olive oil quality and factors considered when buying olive oil.
| Average Score | Std. Dev. | Min | Max | Range | |
|---|---|---|---|---|---|
| Factors affecting olive oil quality | |||||
| Seller and producer reputation | 4.35 | 0.85 | 2 | 5 | 3 |
| Place of production | 4.10 | 0.94 | 1 | 5 | 4 |
| Handcraft milling | 3.98 | 0.92 | 1 | 5 | 4 |
| Harvesting procedures | 3.47 | 0.99 | 1 | 5 | 4 |
| Organic certification | 3.13 | 1.18 | 1 | 5 | 4 |
| Factors considered when buying olive oil | |||||
| Olive oil origin | 3.70 | 1.14 | 1 | 5 | 4 |
| Price | 3.49 | 0.94 | 1 | 5 | 4 |
| Seller reputation | 3.19 | 1.26 | 1 | 5 | 4 |
| Habit | 2.95 | 1.10 | 1 | 5 | 4 |
| Brand | 2.73 | 1.14 | 1 | 5 | 4 |
| Friends’ suggestions | 2.42 | 1.09 | 1 | 5 | 4 |
| Advertising | 1.70 | 0.85 | 1 | 5 | 4 |
Std. Dev.: standard deviation.
Table 4.
Factors considered in the purchase of olive oil per cluster of belonging.
| Cluster | N. | Mean | Std. Dev. | Cohen’s d | |
|---|---|---|---|---|---|
| Price * | 1 | 173 | 3.21 | 0.912 | 0.693 |
| 2 | 139 | 3.83 | 0.851 | ||
| Brand | 1 | 173 | 2.84 | 1.180 | 0.207 |
| 2 | 139 | 2.60 | 1.067 | ||
| Habit * | 1 | 173 | 3.11 | 1.037 | 0.325 |
| 2 | 139 | 2.76 | 1.154 | ||
| Olive oil origin * | 1 | 173 | 4.36 | 0.691 | 1.722 |
| 2 | 139 | 2.88 | 1.039 | ||
| Seller reputation * | 1 | 173 | 3.99 | 0.852 | 2.043 |
| 2 | 139 | 2.19 | 0.916 | ||
| Advertising | 1 | 173 | 1.71 | 0.805 | 0.041 |
| 2 | 139 | 1.68 | 0.895 | ||
| Suggestions from other people * | 1 | 173 | 2.94 | 1.004 | 1.266 |
| 2 | 139 | 1.77 | 0.819 |
* score different with 95% probability.
Table 5.
RPL model results.
| Dependent Variable: Choice (Coded as Binary) | Coeff. | WTP | WTP C.I. (95%) | |||
| Random parameters (latent heterogeneity) ♦ | average | Inf. | Sup. | |||
| Oil produced in Italy | 1.770 *** | 12.498 | 7.969 | 17.026 | ||
| Oil produced in Veneto | 1.869 *** | 13.192 | 8.955 | 17.428 | ||
| PDO oil produced in Veneto | 1.884 *** | 13.298 | 8.986 | 17.610 | ||
| Handicraft manufacturing | 0.832 *** | 5.877 | 2.269 | 9.486 | ||
| Traditional landscape | −0.226 | −1.596 | −4.021 | 0.830 | ||
| Organic | 0.630 ** | 4.449 | 0.795 | 8.103 | ||
| Non-Random Parameters | ||||||
| Opt out | 0.146 | 1.032 | −1.003 | 3.067 | ||
| Price | −0.141 *** | |||||
| Heterogeneity in mean parameter: Variable | ||||||
| Oil produced in Italy x age > 50 years | 0.316 | 2.236 | −1.175 | 5.647 | ||
| Oil produced in Italy x cluster 2 | 0.434 | 3.065 | −0.707 | 6.838 | ||
| Oil produced in Italy x high oil consumption | −0.470 ** | −3.321 | −6.584 | −0.059 | ||
| Oil produced in Italy x purchase of high price oil | −0.856 *** | −6.042 | −10.000 | −2.084 | ||
| Oil produced in Italy x oil purchased in supermarket | 0.634 ** | 4.480 | 0.391 | 8.570 | ||
| Oil produced in Veneto x age > 50 years | 0.140 | 0.994 | −2.119 | 4.107 | ||
| Oil produced in Veneto x cluster 2 | −0.524 ** | −3.700 | −7.062 | −0.337 | ||
| Oil produced in Veneto x high oil consumption | −0.576 *** | −4.066 | −7.046 | −1.085 | ||
| Oil produced in Veneto x purchase of high price oil | 0.149 | 1.054 | −2.632 | 4.740 | ||
| Oil produced in Veneto x oil purchased in supermarket | 0.543 * | 3.839 | −0.034 | 7.712 | ||
| PDO oil produced in Veneto x age > 50 years | 0.147 | 1.042 | −2.107 | 4.191 | ||
| PDO oil produced in Veneto x cluster 2 | −0.359 | −2.535 | −5.968 | 0.897 | ||
| PDO oil produced in Veneto x high oil consumption | −0.367 * | −2.594 | −5.608 | 0.420 | ||
| PDO oil produced in Veneto x purchase of high price oil | 0.091 | 0.645 | −3.091 | 4.381 | ||
| PDO oil produced in Veneto x oil purchased in supermarket | 1.030 *** | 7.273 | 3.354 | 11.193 | ||
| Handicraft manufacturing x age > 50 years | −0.330 * | −2.334 | −5.091 | 0.423 | ||
| Handicraft manufacturing x cluster 2 | −0.816 *** | −5.761 | −8.810 | −2.711 | ||
| Handicraft manufacturing x high oil consumption | 0.050 | 0.359 | −2.313 | 3.031 | ||
| Handicraft manufacturing x purchase of high price oil | 0.680 *** | 4.804 | 1.436 | 8.171 | ||
| Handicraft manufacturing x oil purchased in supermarket | −0.228 | −1.611 | −5.090 | 1.867 | ||
| Traditional landscape x age > 50 years | −0.146 | −1.032 | −2.916 | 0.852 | ||
| Traditional landscape x cluster 2 | 0.414 *** | 2.925 | 0.923 | 4.928 | ||
| Traditional landscape x high oil consumption | −0.083 | −0.588 | −2.376 | 1.200 | ||
| Traditional landscape x purchase of high price oil | 0.066 | 0.472 | −1.676 | 2.621 | ||
| Traditional landscape x oil purchased in supermarket | 0.314 * | 2.220 | −0.047 | 4.487 | ||
| Organic x age > 50 years | −0.890 *** | −6.284 | −9.134 | −3.434 | ||
| Organic x cluster 2 | −0.308 | −2.174 | −5.166 | 0.818 | ||
| Organic x high oil consumption | −0.101 | −0.711 | −3.413 | 1.990 | ||
| Organic x purchase of high price oil | 0.537 ** | 3.795 | 0.443 | 7.147 | ||
| Organic x oil purchased in supermarket | −0.297 | −2.096 | −5.598 | 1.405 | ||
| Derived standard deviations of random parameter distributions | ||||||
| Coeff. | Std. Error | t-value | p-value | |||
| Oil produced in Italy | 0.002 | 0.167 | 0.010 | 0.993 | ||
| Oil produced in Veneto | 0.051 | 0.293 | 0.180 | 0.861 | ||
| PDO oil produced in Veneto | 0.592 *** | 0.178 | 3.320 | 0.001 | ||
| Handicraft manufacturing | 0.495 *** | 0.133 | 3.720 | 0.000 | ||
| Traditional landscape | 0.271 | 0.178 | 1.530 | 0.127 | ||
| Organic | 1.046 *** | 0.104 | 10.060 | 0.000 | ||
*** significant at the 99% level; ** significant at the 95% level; * significant at the 90% level. ♦ Random parameters assumed normally distributed. N = 2496; R-squared = 0.275; Log likelihood = −2742.13; Halton draws = 1000; RPL = random parameter logit; Coeff. = estimated coefficient; WTP = willingness to pay; C.I. = confidence interval.
Table 6.
Estimated complementary cumulative frequency distribution functions.
| R-Squared | F | p-Value | Constant | b1 | |
|---|---|---|---|---|---|
| Handicraft manufacturing | 0.94 | 4565.90 | 0.000 | 0.003719 | 1.399597 |
| Italy | 0.89 | 2390.81 | 0.000 | 0.000112 | 1.358809 |
| Veneto | 0.92 | 3668.66 | 0.000 | 0.000003 | 1.851839 |
| Veneto PDO | 0.96 | 6592.31 | 0.000 | 0.000003 | 1.624760 |
| Traditional landscape | 0.93 | 4107.93 | 0.000 | 0.004912 | 2.333588 |
| Organic | 0.97 | 9521.98 | 0.000 | 0.008318 | 1.292780 |
© 2019 by the authors. Licensee MDPI, Basel, Switzerland. This article is an open access article distributed under the terms and conditions of the Creative Commons Attribution (CC BY) license (http://creativecommons.org/licenses/by/4.0/).
Share and Cite
MDPI and ACS Style
Tempesta, T.; Vecchiato, D. Analysis of the Factors that Influence Olive Oil Demand in the Veneto Region (Italy). Agriculture 2019, 9, 154. https://0-doi-org.brum.beds.ac.uk/10.3390/agriculture9070154
AMA Style
Tempesta T, Vecchiato D. Analysis of the Factors that Influence Olive Oil Demand in the Veneto Region (Italy). Agriculture. 2019; 9(7):154. https://0-doi-org.brum.beds.ac.uk/10.3390/agriculture9070154
Chicago/Turabian StyleTempesta, Tiziano, and Daniel Vecchiato. 2019. "Analysis of the Factors that Influence Olive Oil Demand in the Veneto Region (Italy)" Agriculture 9, no. 7: 154. https://0-doi-org.brum.beds.ac.uk/10.3390/agriculture9070154
Note that from the first issue of 2016, this journal uses article numbers instead of page numbers. See further details here.