Electronic Design of a Cotton Harvester Yield Monitor Calibration System


Agricultural Research Service, United States Department of Agriculture, Lubbock, TX 79403, USA
*
Author to whom correspondence should be addressed.
AgriEngineering 2019, 1(4), 523-538; https://0-doi-org.brum.beds.ac.uk/10.3390/agriengineering1040038
Submission received: 6 September 2019
/
Revised: 8 October 2019
/
Accepted: 18 October 2019
/
Published: 22 October 2019
(This article belongs to the Special Issue Robotics and Automation Engineering in Agriculture)
Abstract
:Several yield monitors are available for use on cotton harvesters, but none are able to maintain yield measurement accuracy across cultivars and field conditions that vary spatially and/or temporally. Thus, the utility of yield monitors as tools for on-farm research is limited unless steps are taken to calibrate the systems as cultivars and conditions change. This technical note details the electronic system design for a harvester-based yield monitor calibration system for basket-type cotton strippers. The system was based upon the use of pressure sensors to measure the weight of the basket by monitoring the static pressure in the hydraulic lift cylinder circuit. To ensure accurate weighing, the system automatically lifted the basket to a target lift height, allowed the basket time to settle, then weighed the contents of the basket. The software running the system was split into two parts that were run on an embedded low-level micro-controller and a mobile computer located in the harvester cab. The system was field tested under commercial conditions and found to measure basket load weights within 2.5% of the reference scale. As such, the system was proven to be capable of providing an on-board auto-correction to a yield monitor for use in multi-variety field trials.
1. Introduction and Overview of the Research and Results of System Performance
Several yield monitors are available for use on cotton harvesters, but none are able to maintain yield measurement accuracy across cultivars and field conditions that vary spatially and/or temporally. Thus, the utility of yield monitors as tools for on-farm research is limited unless steps are taken to calibrate the systems as cultivars and conditions change. This technical note details the electronic design for a harvester-based yield monitor calibration system for basket-type cotton strippers and is one of three technical notes that are in support of a master research paper covering the development and design of the calibration system. This technical note is presented, along with requisite supporting electronic design files, for the purpose of transferring the technology to the research community and general public. In addition to the design files, the technical notes provide documentation describing key strategies and methodology utilized in the design as well as a background summary of the research.
In the process of evaluating the effects of production inputs and practices on crop yield and farm revenue, large-scale field experiments are needed to investigate the treatment effects across varying field conditions. Normally, these investigations require the use of additional labor and expensive ancillary equipment to weigh the crop harvested from a given area. The time required to collect this data reduces harvest productivity and efficiency. In order to reduce the dependence on ancillary equipment and labor, and increase the efficiency of data collection, yield monitors used on grain combines have proven to be reliable tools in on-farm research efforts due to their consistent accuracy and lack of need for variety-specific calibration. However, yield monitors used on cotton harvesters do not exhibit the same utility for on-farm research as they require frequent calibration when varieties or crop conditions change [1,2,3,4,5,6,7].
Cotton yield monitors sense the flow of seed cotton inside conveying ducts or as the material passes into the basket or accumulator on the harvester. Yield flow sensors are generally of two designs: (1) light attenuation [8,9,10] or (2) microwave reflectance (John Deere, 2010) [11]. In either case, the flow of material is related to the amount of light attenuated or microwave energy reflected by the flowing material. Material properties, such as boll size, seed size, foreign matter content, lint turnout, fiber quality, and seed cotton moisture content, are related to the accuracy of cotton yield monitors, all of which, except seed cotton moisture content, are cultivar-specific properties [2,6,7,12]. Setup and operation factors, such as sensor alignment, stray light, temperature, and dust/foreign matter accumulation, also affect the cotton yield monitor performance [13,14,15]. While uncalibrated systems can realistically reflect in-field variability [16], calibration of cotton yield monitors is of utmost importance in producing accurate yield data.
Previous work by Wanjura et al. (2015 and 2016) [17,18] described the development and testing of the system for use on cotton harvesters that measures accumulated cotton weight inside a harvester basket, thus facilitating the frequent calibration of cotton yield monitors without the need for expensive, time-consuming, and often unavailable ancillary mobile scale equipment. The design of the system described in [17,18] is briefly detailed herein, with the main focus of this report being relegated to the final version of the electronic design of the system.
The harvester-based yield monitor calibration system (Wanjura et al., 2015 and 2016) [17,18] measures accumulated cotton weight in a harvester basket based on measurements of hydraulic pressure in the basket lift cylinder circuit. The system was designed and implemented on a John Deere 7460 (John Deere, Moline, IL, USA) basket-type cotton stripper. A model relating hydraulic pressure in the lift cylinder circuit at a single basket position in the dump cycle was developed for basket weights ranging from 27 to 1633 kg (60–3600 lb.). The linear calibration model (R2 = 0.998) was developed from 161 basket loads and exhibited a root-mean-square-error, RMSE, of 9.9 kg (21.8 lb.) with mean absolute error of 0.44% (span). Hydraulic pressure was measured using a pressure transducer with a 0–17,237 kPa (0–2500 psi) pressure range from Omega Engineering (PX409-2.5KG5V-EH, error specification ±0.05% FS = ±8.62 kPa). A pulse-width modulated, proportional directional control valve (model SP08-47C, HydraForce Inc., Lincolnshire, IL, USA) and solenoid-operated check valves (model SV10-29, HydraForce Inc., Lincolnshire, IL, USA) were used in parallel with the harvester hydraulic system to raise the basket to the desired measurement position (13.7° from fully down) and hold it there once motion stopped. Two limit switches mounted at the rear of the harvester basket slowed and stopped the motion of the basket as it approached the target position. During the development of the linear calibration model, a magnetostrictive linear position sensor (MHC1400MN10E3V11, MTS Sensors, Cary, NC, USA; error specification ±0.04% FS = 0.56 mm, repeatability ±0.005% FS = 0.07 mm) measured the extension of the lift cylinders to confirm that the limit switches could repeatedly stop the basket at the desired position. The average lift cylinder extension during calibration model development was 160.53 mm (6.32 in) with a standard deviation of 0.898 mm (0.035 in) which corresponded to a basket rotation angle of 13.7° ± 0.2° from the down position.
Control of the calibration system hydraulic valves and data acquisition were accomplished with custom designed electronics, described herein, that were driven by a custom embedded micro-controller software [19]. A low-level microcontroller, and supporting circuitry, was mounted to a specially-designed printed circuit board that controlled the hydraulic valves during basket positioning and recorded pressure data once the basket was properly positioned. The hydraulic control algorithm raised the basket into position through a two-step process whereby the pulse width-modulated (PWM) directional control valve (DCV) raised the basket at 100% duty cycle until the basket passed the first limit switch. The PWM DCV duty cycle was lowered slowing the basket to about 25% of the original lifting speed as it approached the target position. The DCV was closed and the basket stopped when the basket passed the second limit switch. Simultaneously, the control algorithm closed the check valves on the lift cylinder circuit to isolate the static pressure in the lift cylinders and recorded the pressure after a brief stabilization period (2 sec). A 22-bit analog-to-digital converter was used to capture the pressure transducer analog signal, with help from custom-designed circuitry to minimize the influence of electrical noise and improve accuracy, the design being described herein. A serial communication protocol was implemented between the embedded micro-controller software [19] and the human machine interface (HMI) software [20], that was written as a part of this development, was setup to run on a mobile computer in the harvester cab. The HMI software [20] was programmed to calculate and display the weight of cotton in the basket using the pressure measured in the lift cylinder circuit and the initial calibration model. GPS position data was collected from a Greenstar 3000 receiver (John Deere, Moline, IL, USA) on the harvester and processed by the HMI software [20], which used the GPS position data along with user input of harvester width to calculate the area from which the cotton in the basket was harvested. Seed cotton yield was calculated using the measured cotton weight and harvested area. Cotton ownership information (client, farm, and field) and machine header width (number and spacing of harvesting units) were recorded by the HMI software for each load measured.
The harvester-based yield monitor calibration system was field tested under commercial conditions on four producer-owned and operated cotton strippers. Weight measurement accuracy observed for the system during field testing was characterized by RMSE between 1.7% and 2.3% of the span. Thus, it was concluded that the on-harvester calibration system would provide producers and researchers an accurate tool for use in (1) conducting on-farm research in which total plot yield is the evaluation metric, and (2) in calibrating cotton yield monitors without the need for costly and labor-intensive mobile scale systems. The objective of this article is to describe the design of the main portion of the electronics that when coupled with vehicle spike protection circuitry [21] form the data-acquisition and control sub-system that is driven by embedded micro-controller software [19] and interfaced to by custom human-machine interfacing software [20] that, altogether, in combination form the cotton harvester yield monitor calibration system. All of the electronic design files are included with this technical notes in the supplemental compressed zip file (Supplementary Materials) and is available on the MDPI web-site where this paper is located.
2. Electronic Design
One of the difficulties in placing electronic instrumentation on farm equipment lies in creating robust systems that can handle the wide environmental temperature swings, dust, moisture, and severe vibrations. To mitigate the dust and moisture issues, the electronic design was optimized so that it could be reduced to a single printed circuit board (PCB) that would fit into a hermetically sealed housing. The circuit design also provided the following features:
- The voltage protection circuit from the vehicular noise and potential high-voltage load-dumps;
- Cascaded linear voltage regulation stages that increasingly reduce the noise to ensure accurate measurements are obtained by the sensitive precision analog weighing electronics;
- Micro-controller and communication circuits;
- Relay drivers to allow for micro-controller to perform feedback control to position the basket for precision weighing;
- Optical isolation of the hydraulic solenoid relay drivers;
- Noise isolation between the digital micro-controller and the analog conversion subsections, to ensure the analog sections remain noise-free; and
- An RS232 serial level shifter for robust serial communication from the remotely-mounted weigh system electronics and the client industrial computer.
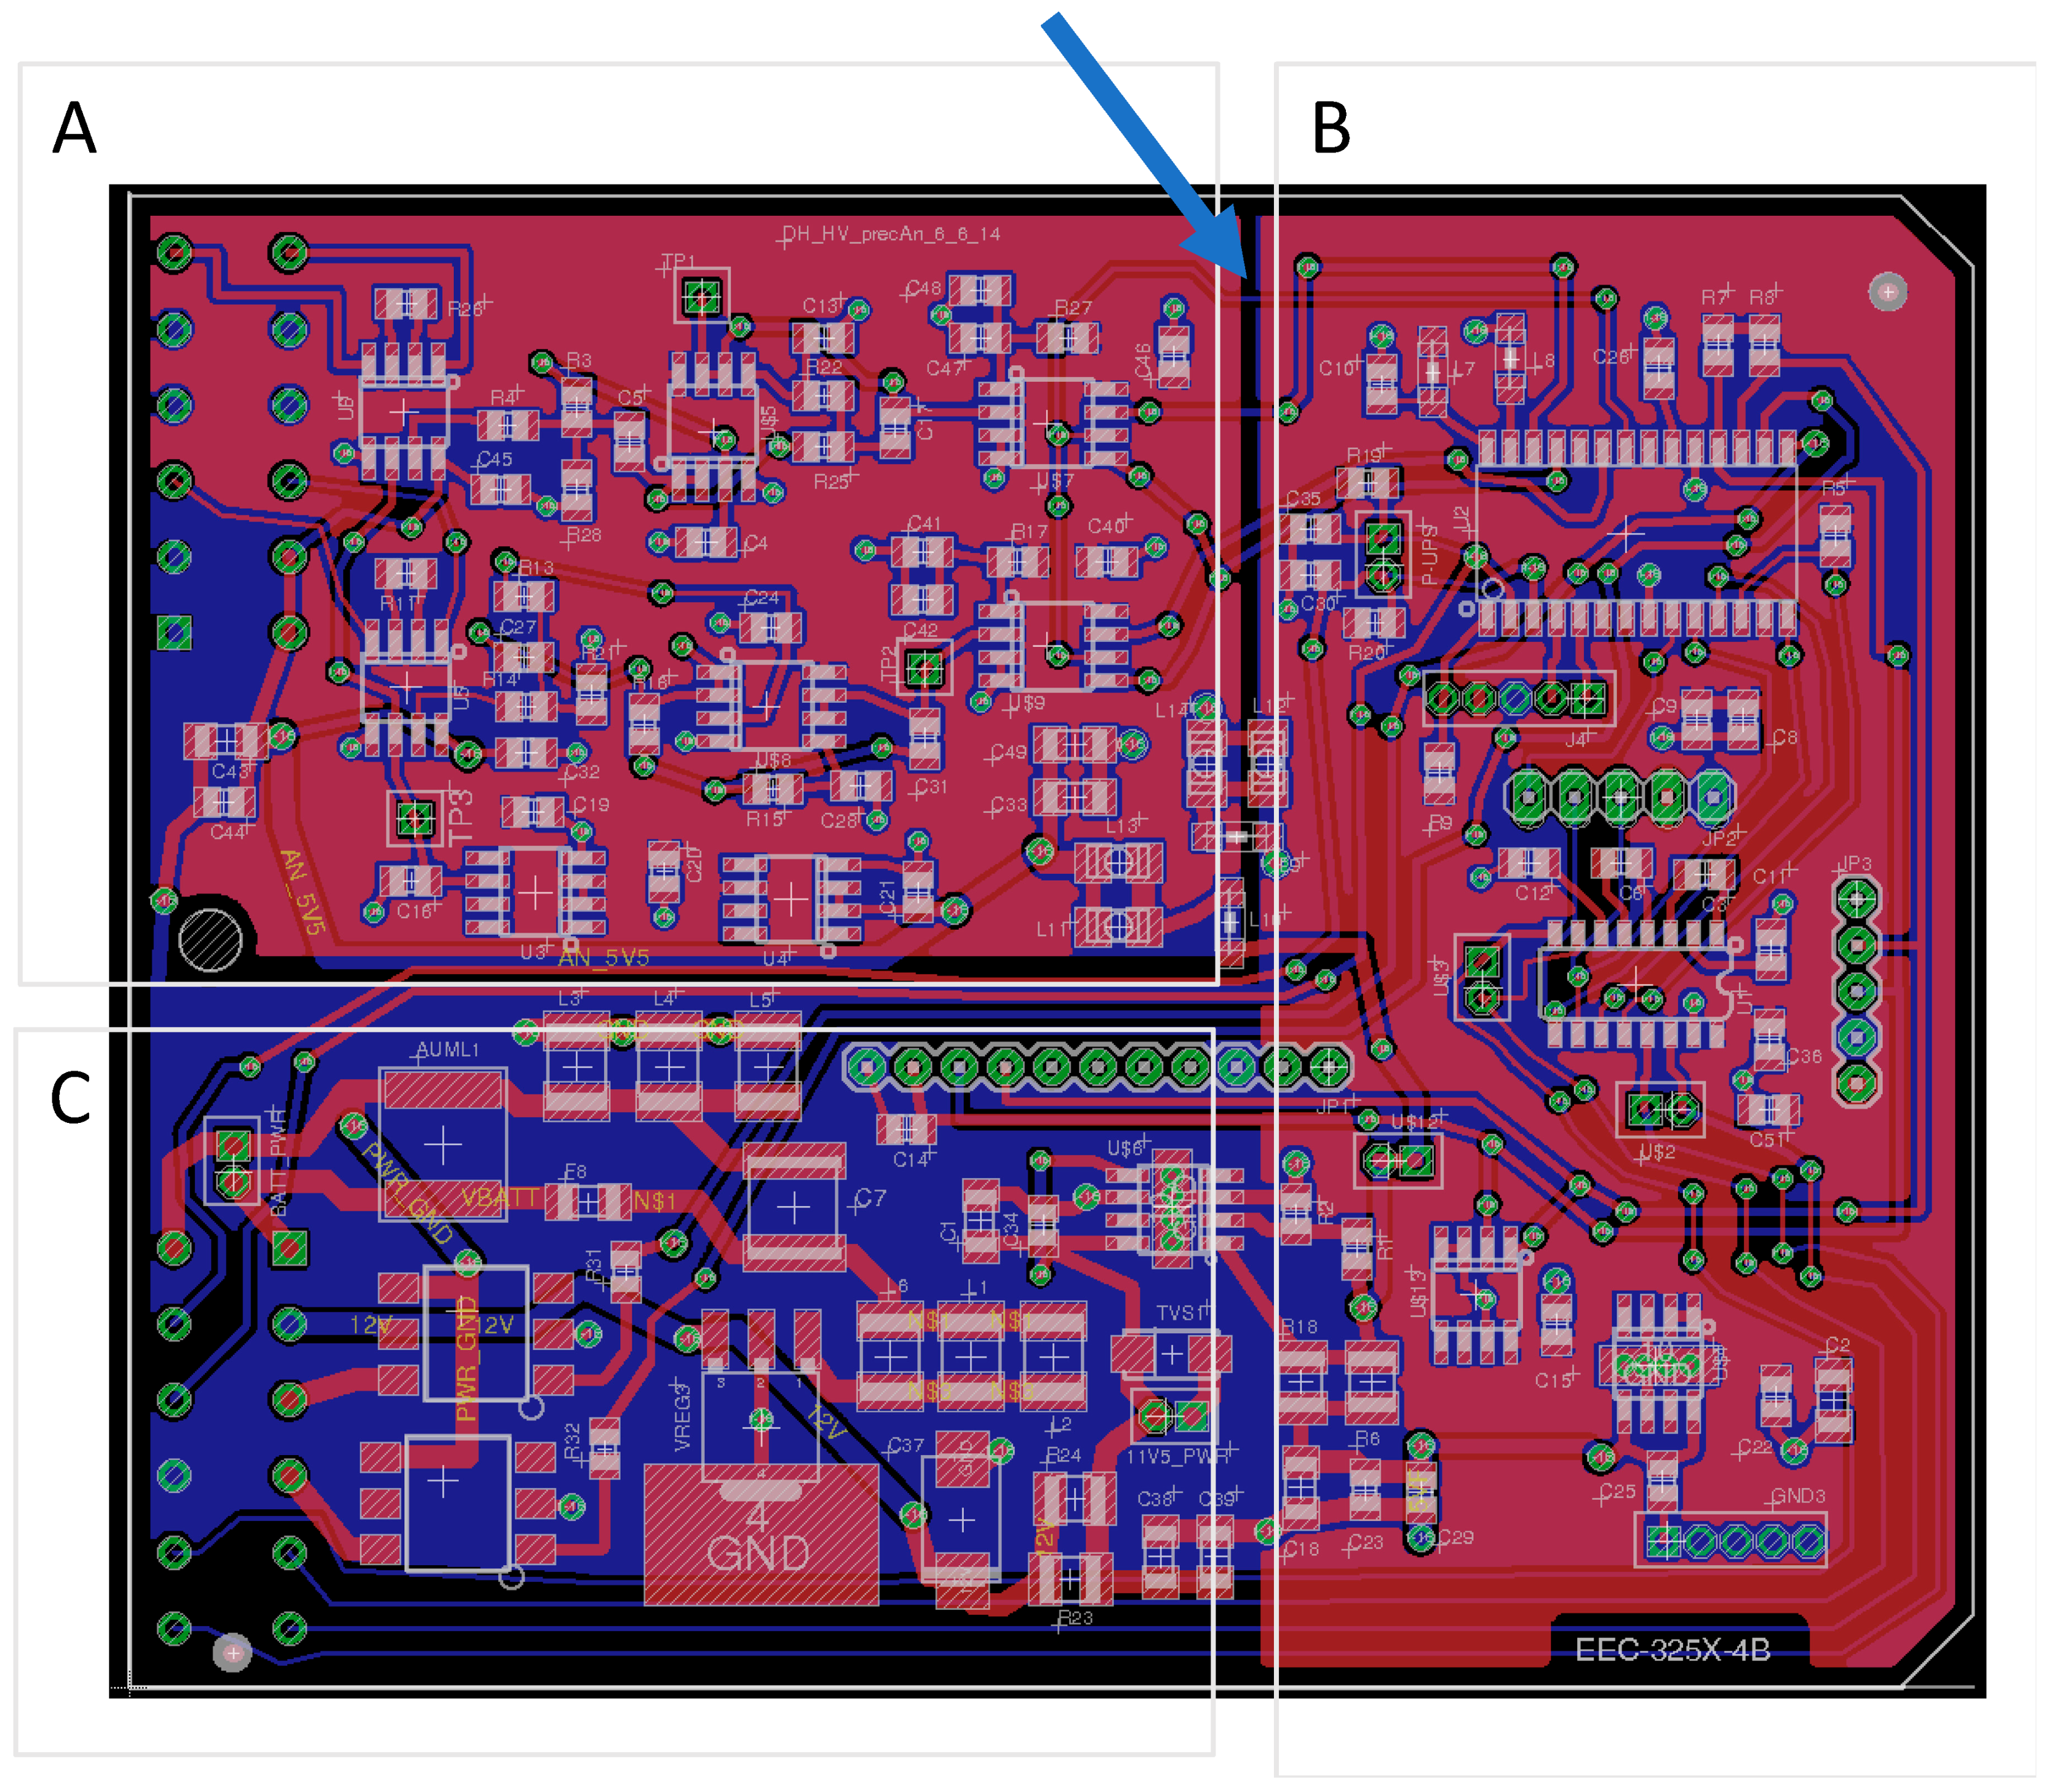
Figure 1 shows a picture of the complete system embedded onto a single PCB. Of note is that the PCB design splits the power planes to provide isolation and noise immunity to the sensitive analog subsection. This can be seen in Figure 1, where the arrow points out the separation between the copper flood-fills (red layer) that form the voltage power planes on the top side of the PCB. Specifically, in section A, the top copper-filled areas (red layer) form the analog 3.3 V power rail and, in section B, the copper-filled areas provides the digital 3.3 V power rail. Section C has no copper-filled power plane due to the density of the component placement.
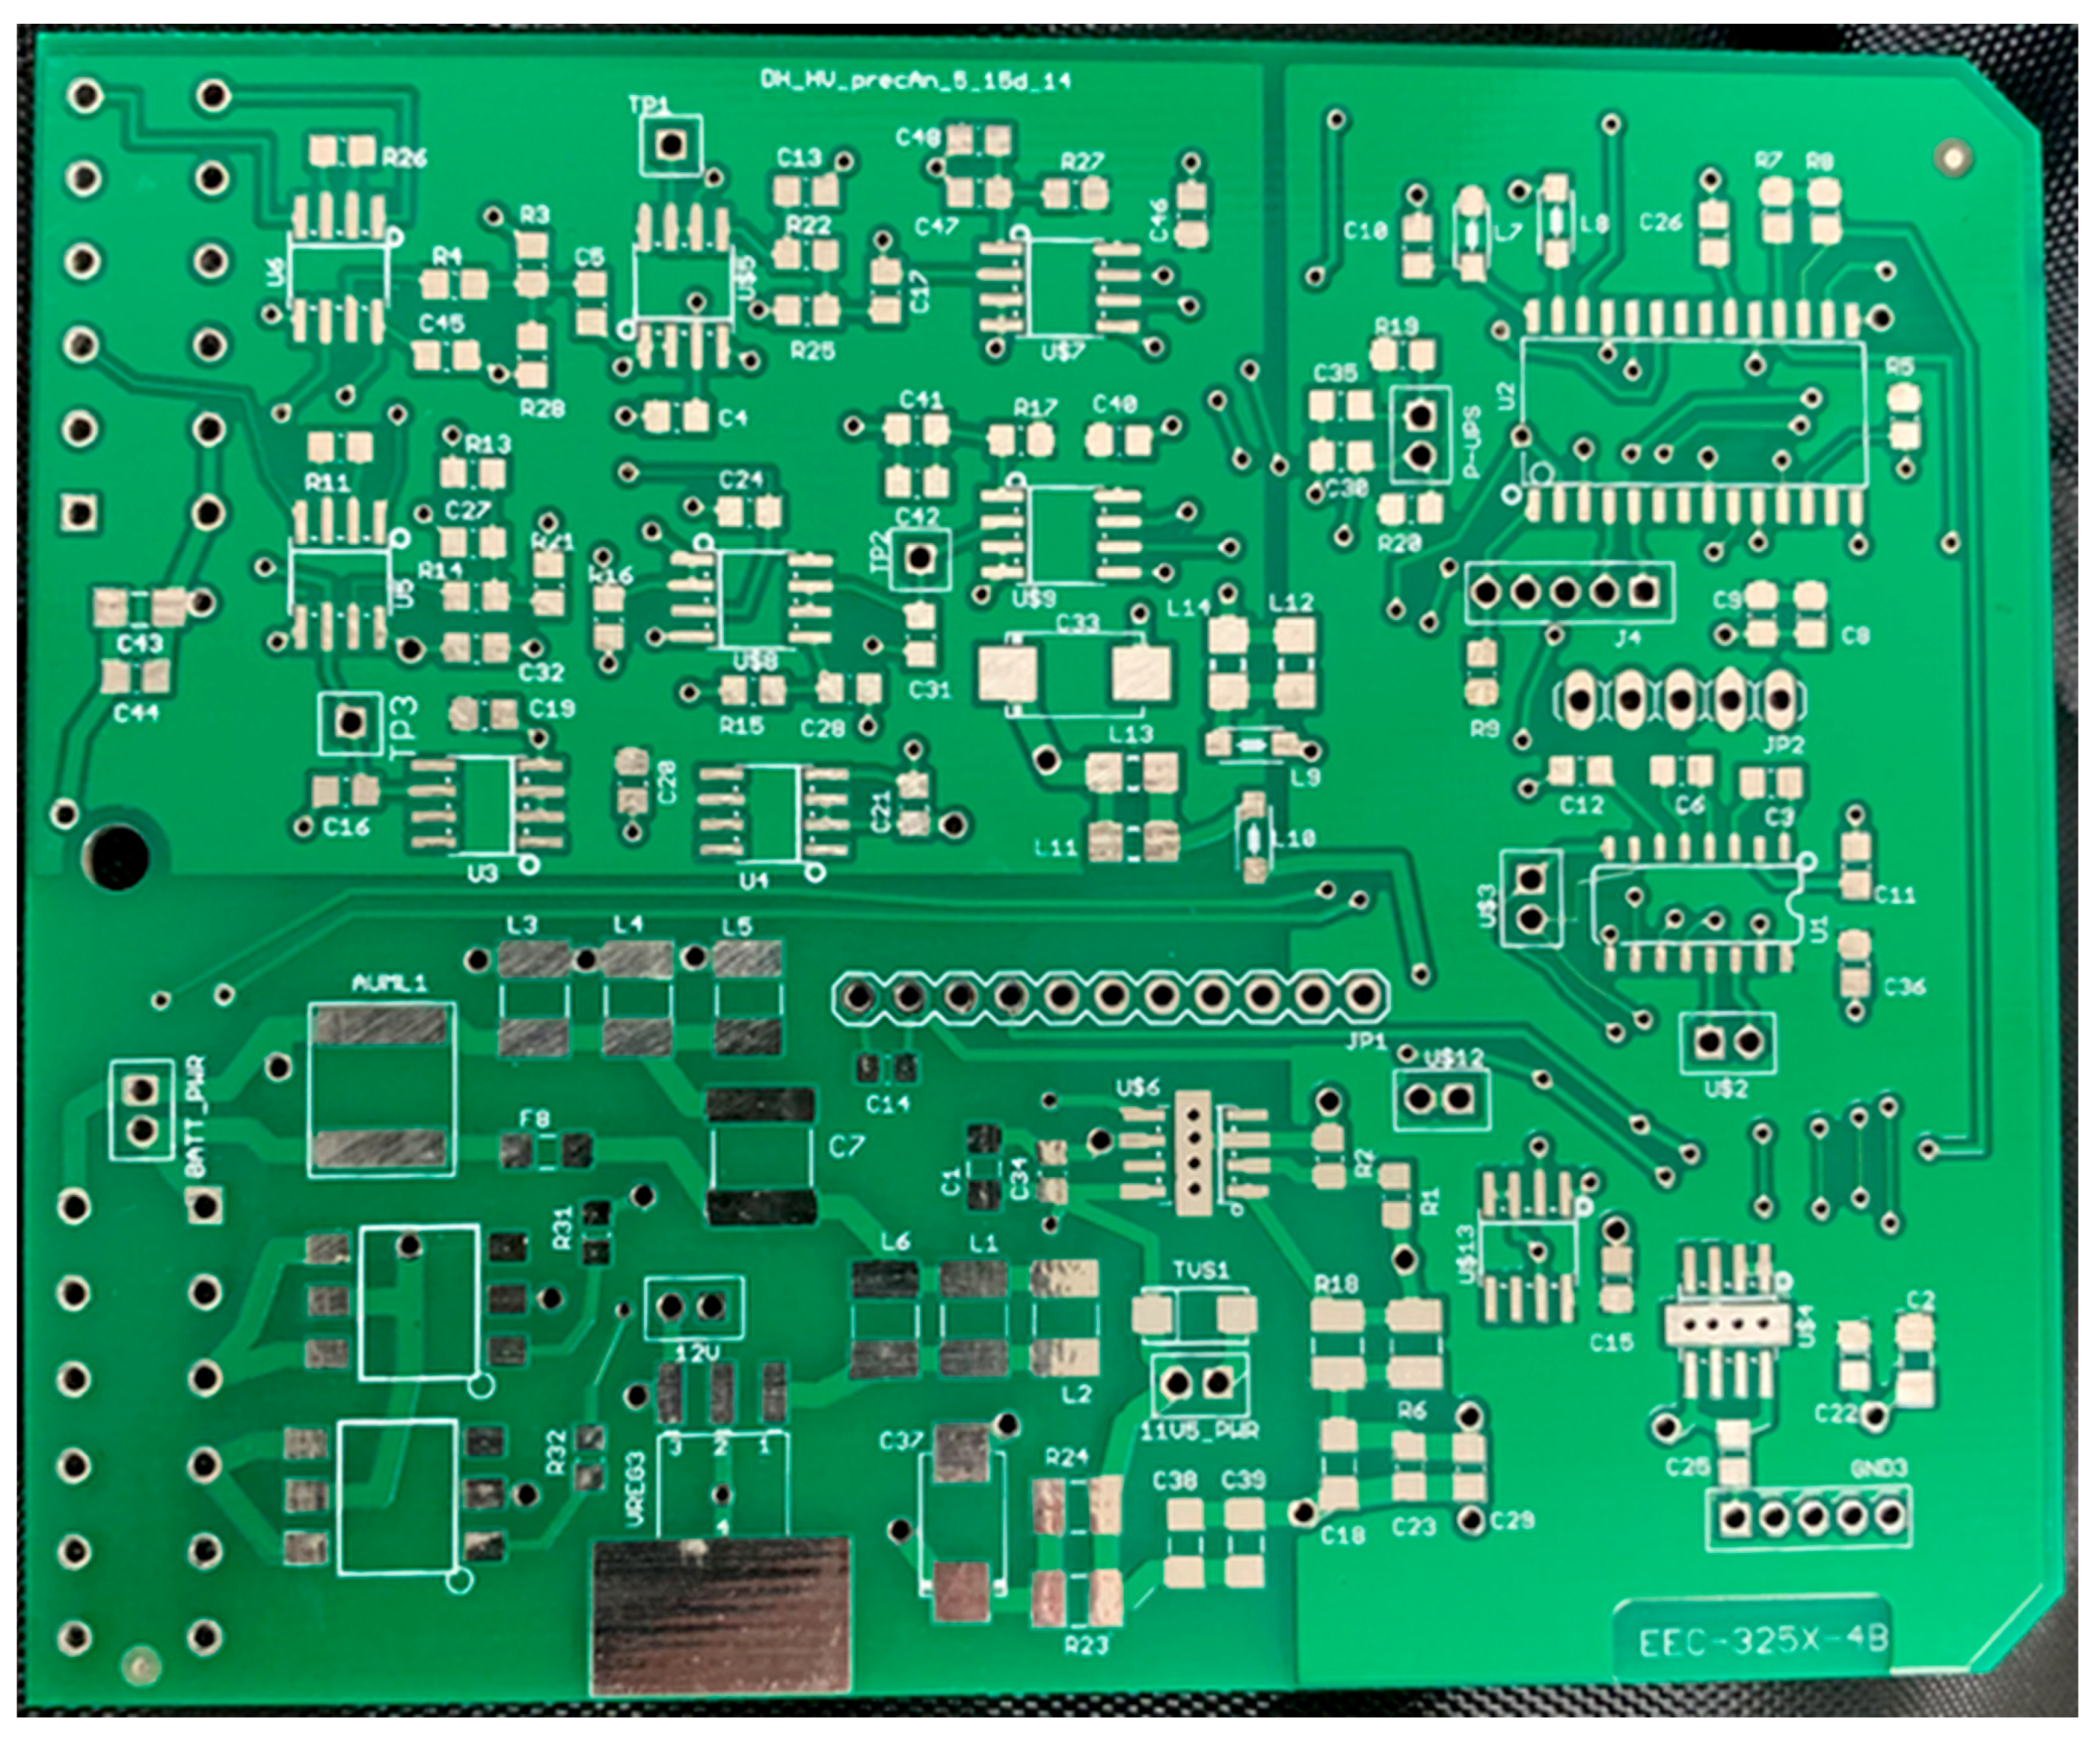
Figure 2 shows a picture of the final two-layer produced PCB for the complete system that was embedded onto a single PCB.
The following sections go into the pertinent details for each of the system’s subsections.
2.1. Voltage Regulation and Vehicular Voltage Spike Protection
Successful data acquisition on mobile platforms, such as tractors, requires the provision of protection for sensitive electronics, as these platforms are inherently rife with electrical transients that have enough energy to cause damage to unprotected instrumentation. Unfortunately, while there are many protection options for industrial applications (i.e., those installed at 120 VAC), off-the-shelf products for mobile protection are extremely limited and, after a survey of commercial offerings (Pelletier et al., 2019) [21], it was determined that all of the commercial offerings failed to provide sufficient protection. To address this critical requirement, to provide protection against the numerous high-voltage transient spikes coming through the harvester’s power supply, the system utilized a two-stage protection configuration:
- Stage 1: An off-board load dump protection circuit (LDPC) (Pelletier et al., 2019) [21] was mounted between the harvester’s battery and the prototype electronic weighing system; and
- Stage 2: An on-board PCB-located secondary voltage spike rejection circuit (VSRC) was designed into the front end of the electrical design.
Use of only stage 1 would provide sufficient protection from damaging levels, sourced from the harvester’s voltage spikes. Stage 1 noise rejection is not adequate to fully reject the voltage spikes, which can then find their way into the sensitive analog instrumentation section and lead to significant measurement errors. Stage 2 provides an additional layer of spike rejection to help ensure that the highest accuracy is obtained in the analog instrumentation section. These spike rejection circuits are located in region C, as detailed in Figure 1.
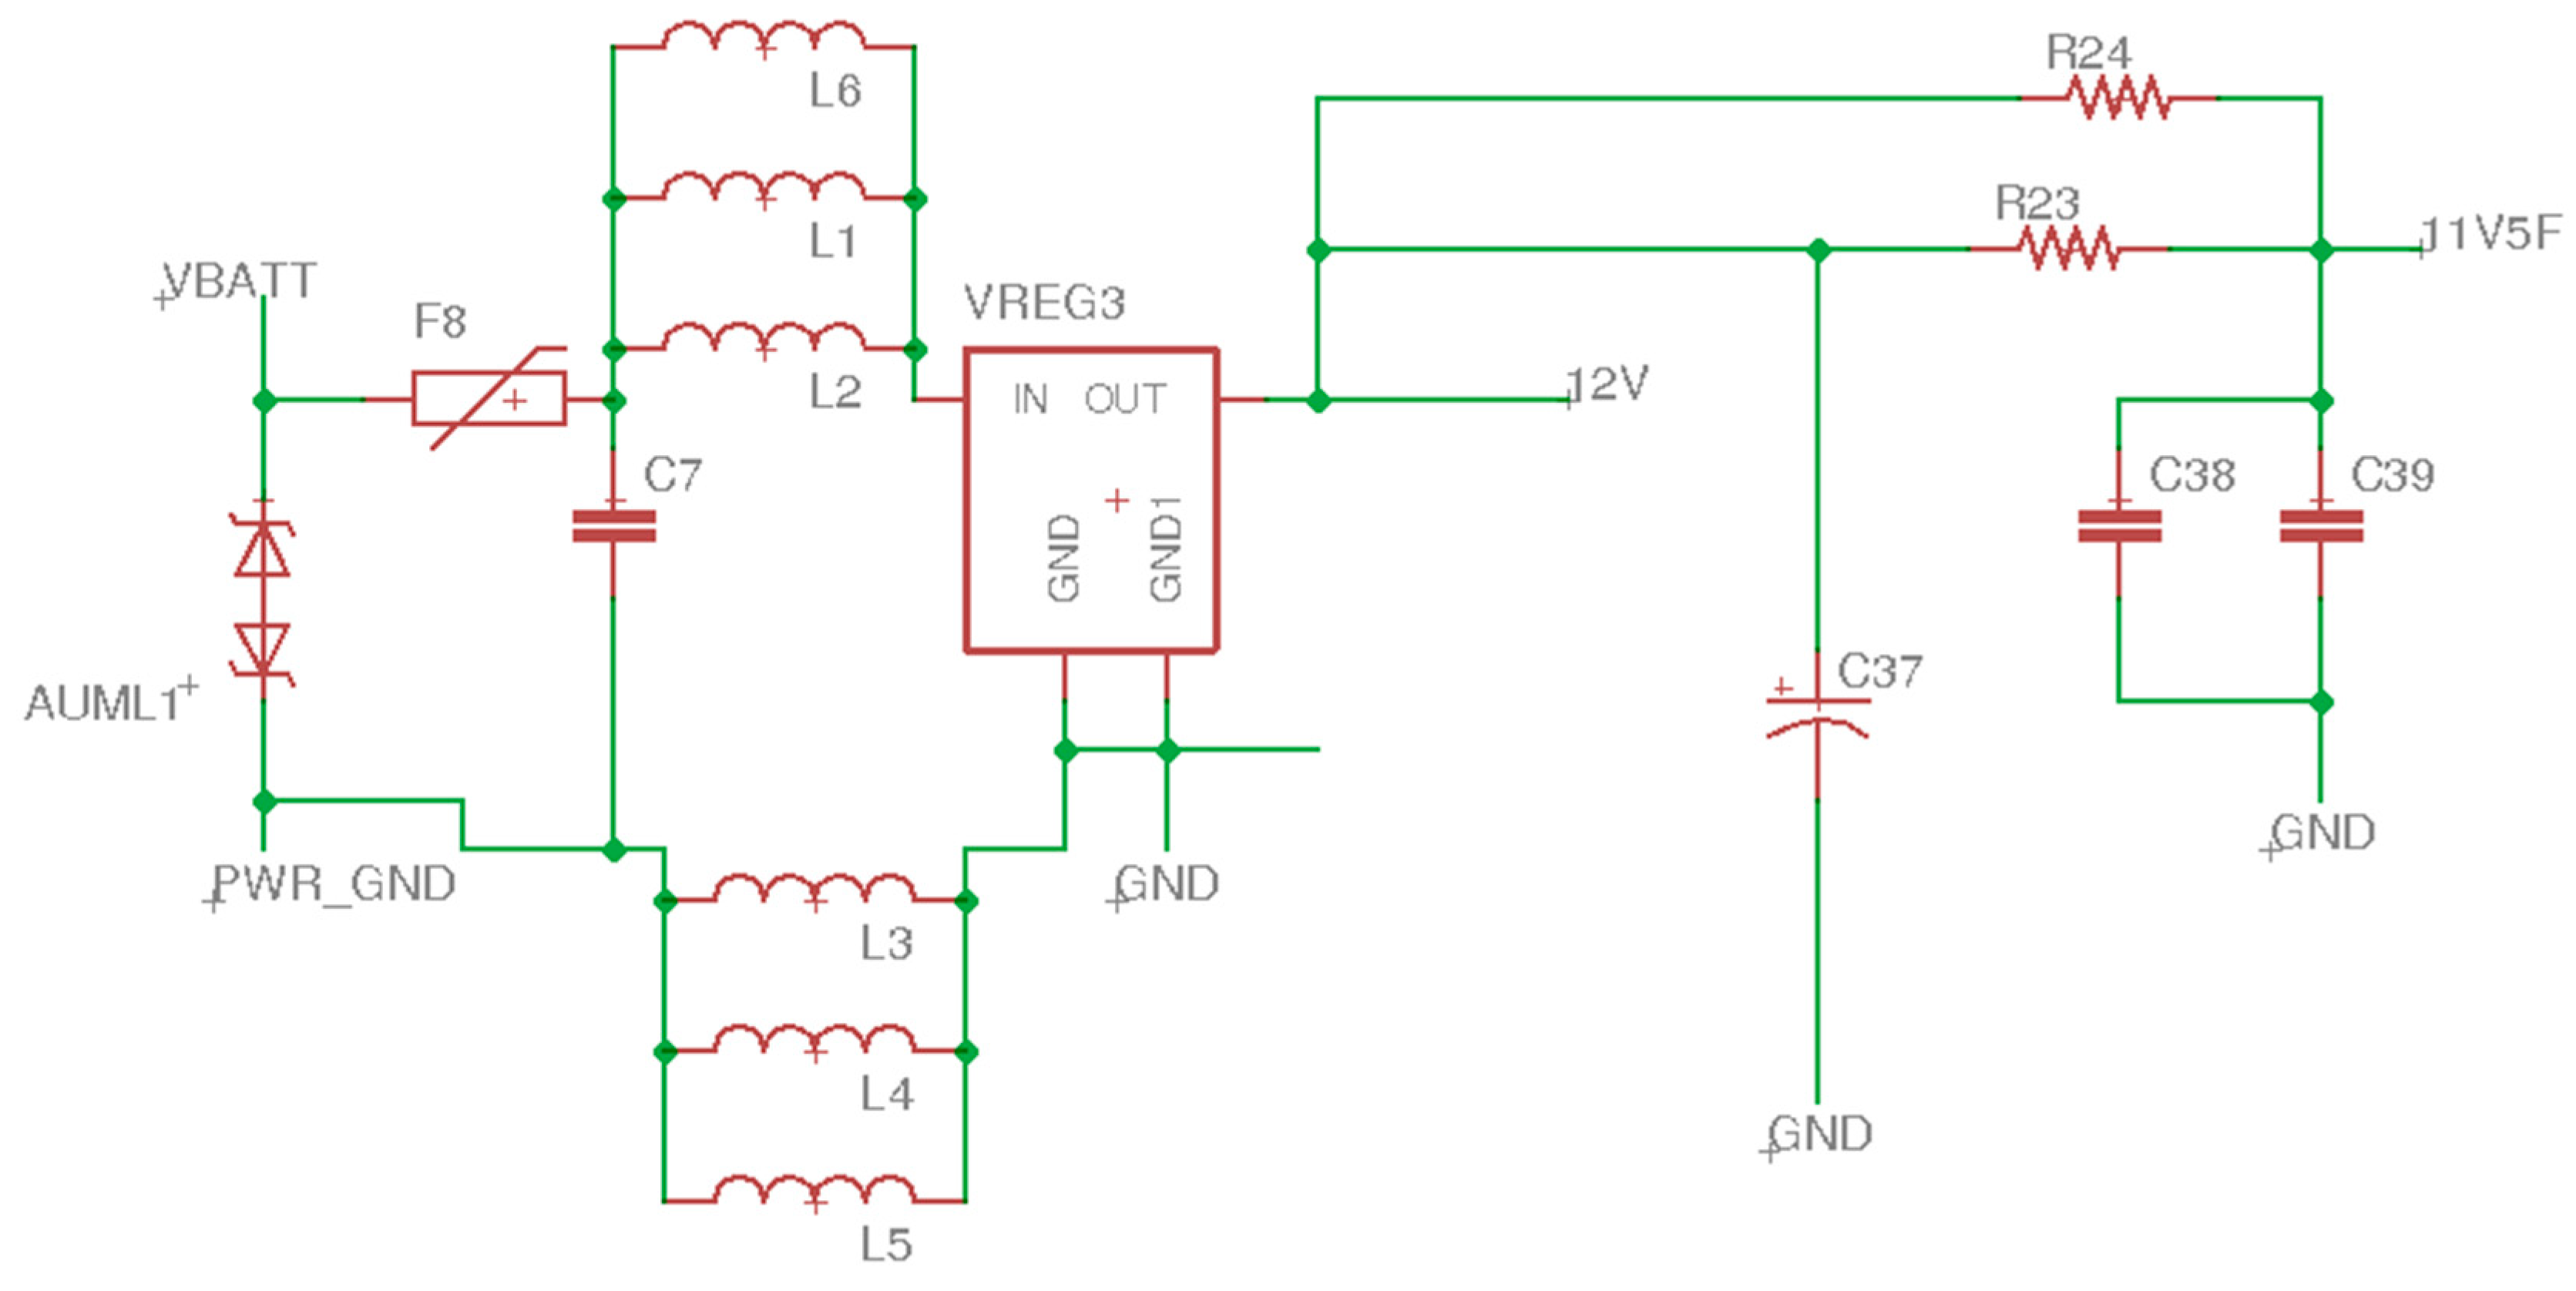
The harvester’s voltage input to the electronic weighing system occurs through the off-board LDPC, which is then fed to the VSRC via the VBATT input pin of the electronic weighing system, (VBATT is defined in the circuit shown in Figure 3). The first line of defense against voltage spikes is an automotive-rated varistor, labeled AUML1 in Figure 3 with the corresponding part number V18AUMLA2220H (Littlefuse, Chicago, IL, USA). Corresponding component values for the schematic shown in Figure 3 are detailed in Table 1. The AUML varistor provides 50 joules of load dump protection to the system and provides the additional protection to the circuit by clipping any high-speed voltage input spikes to no more than 40 V. The next component in the protection chain F8, a resettable fuse, which helps protect against longer-duration load dump spikes. Next in the chain is a set of voltage spike rejection inductors that are placed to block spikes on both the power and ground rails leading into the first stage linear voltage regulator, VREG3. This first-stage regulator was designed around the a linear voltage regulator chip, LM2940 (Texas Instruments, Austin, TX, USA), as it is rated for vehicular applications and provides protection against reverse battery jumps and is rated for an absolute maximum voltage input to 60 V, which is well above the voltage clipping threshold provided by the AUML and the resettable fuse protector.
As the AUML and LM2940 were not likely to remove all the voltage noise spikes, transient voltage suppression diodes (TVS) were also added to the design to help further reduce any fast-transient noise spikes (see Figure 4).
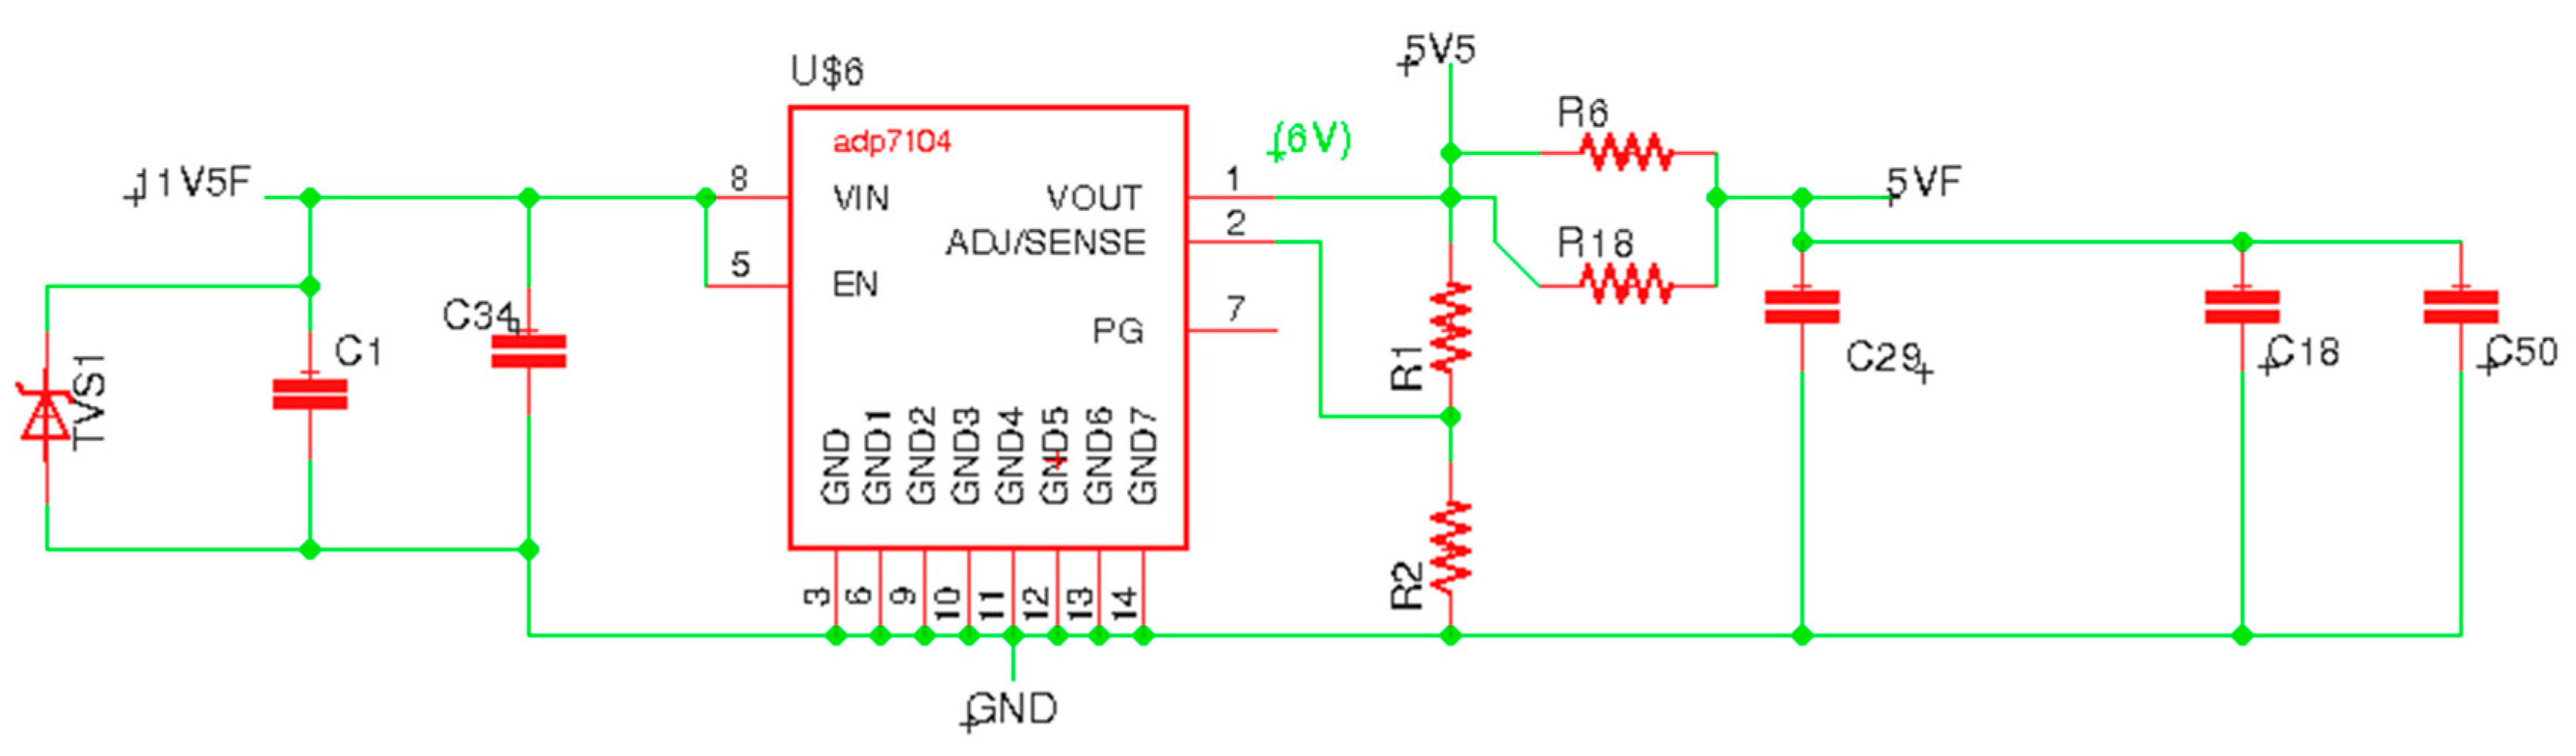
Following the first stage voltage regulation, provided by the LM2940, is a pair of very low-noise precision linear voltage regulators, ADP7104 (Analog Devices, Norwood, MA, USA). The first ADP7104, Figure 4, provides voltage to the 5 V rails which powers a second ADP7104 (see Figure 5) that provides 3.3 V power to the micro-controller. Corresponding component values for the schematics shown in Figure 4 and Figure 5 are detailed in Table 2 and Table 3. This cascaded series of precision linear voltage regulators helps to isolate the digital section from the analog section, which is powered by the first ADP7104, Figure 4. The first ADP7104 also provides voltage to a third-stage set of high precision voltage regulators, shown in Figure 6, that are specifically designed for sensitive analog circuitry. Each layer of linear voltage regulation provides an additional layer of filtering and protection from errant vehicular voltage spikes. The ADP7104 was selected as it is rated to provide up to 500 mA with input voltage to 20 V. The primary feature of interest for this selection was the low-noise design of this integrated-circuit, IC, which has a noise floor that is rated at only 15 µV with a very low drop-out voltage of only 350 mV. Another advantage of this design is the voltage line regulation is within 0.015% and the current load regulation is within 0.2%. It also features a built-in thermal shut-down feature which is helpful when developing and designing prototypes. As the design required unique output voltages, an adjustable version was selected for the first ADP7104, Figure 4.
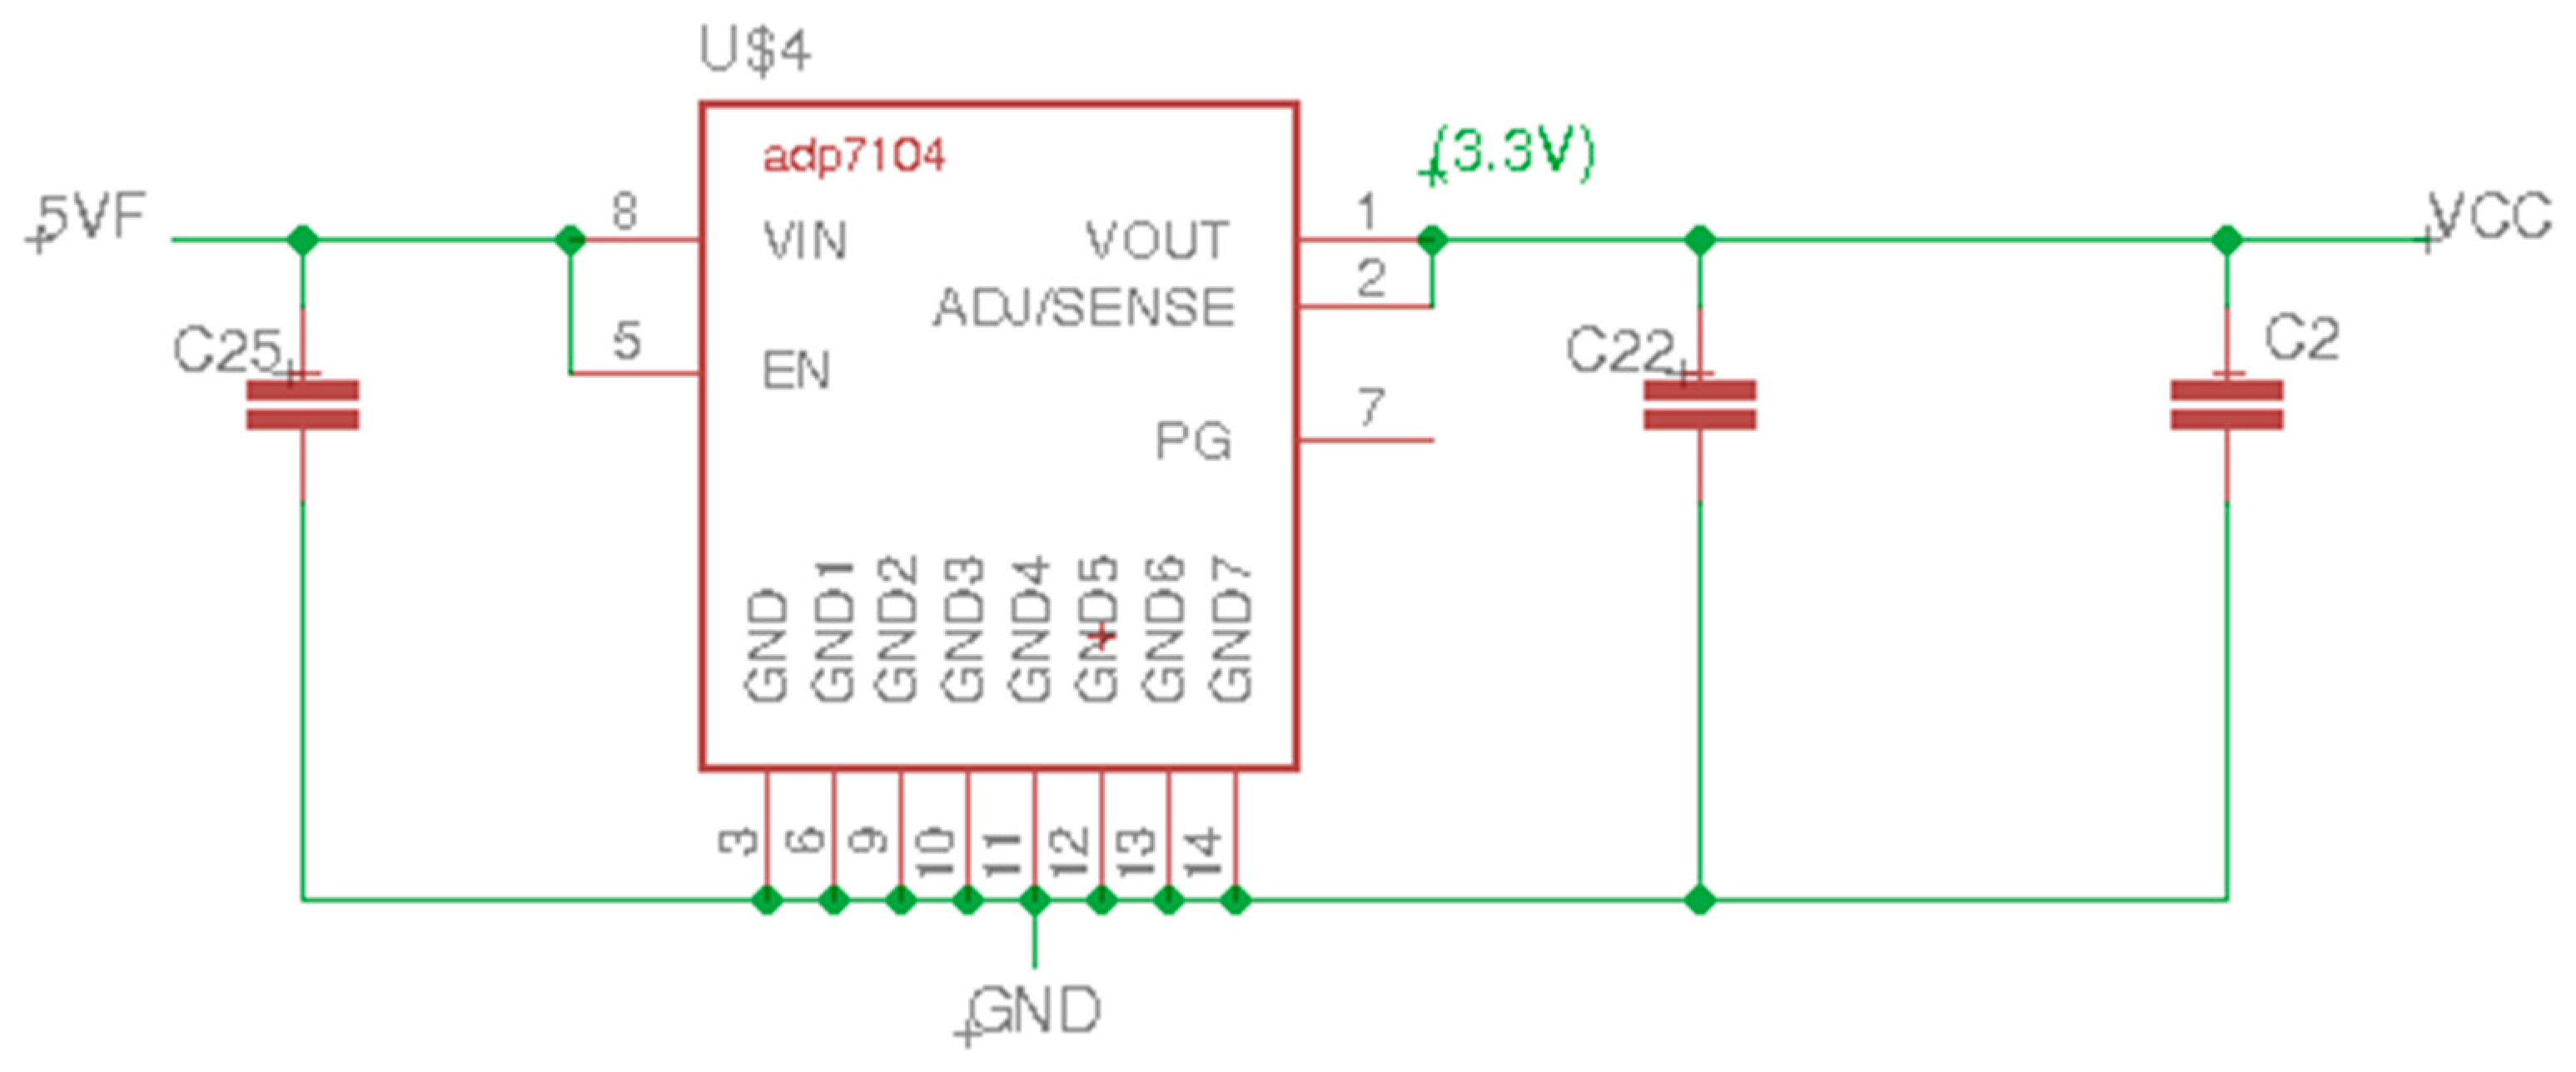
As the second ADP7104 provides a standard 3.3 V to the digital section, the circuit uses a fixed voltage output version of this chip, Figure 5.
2.2. Analog Voltage Subsection
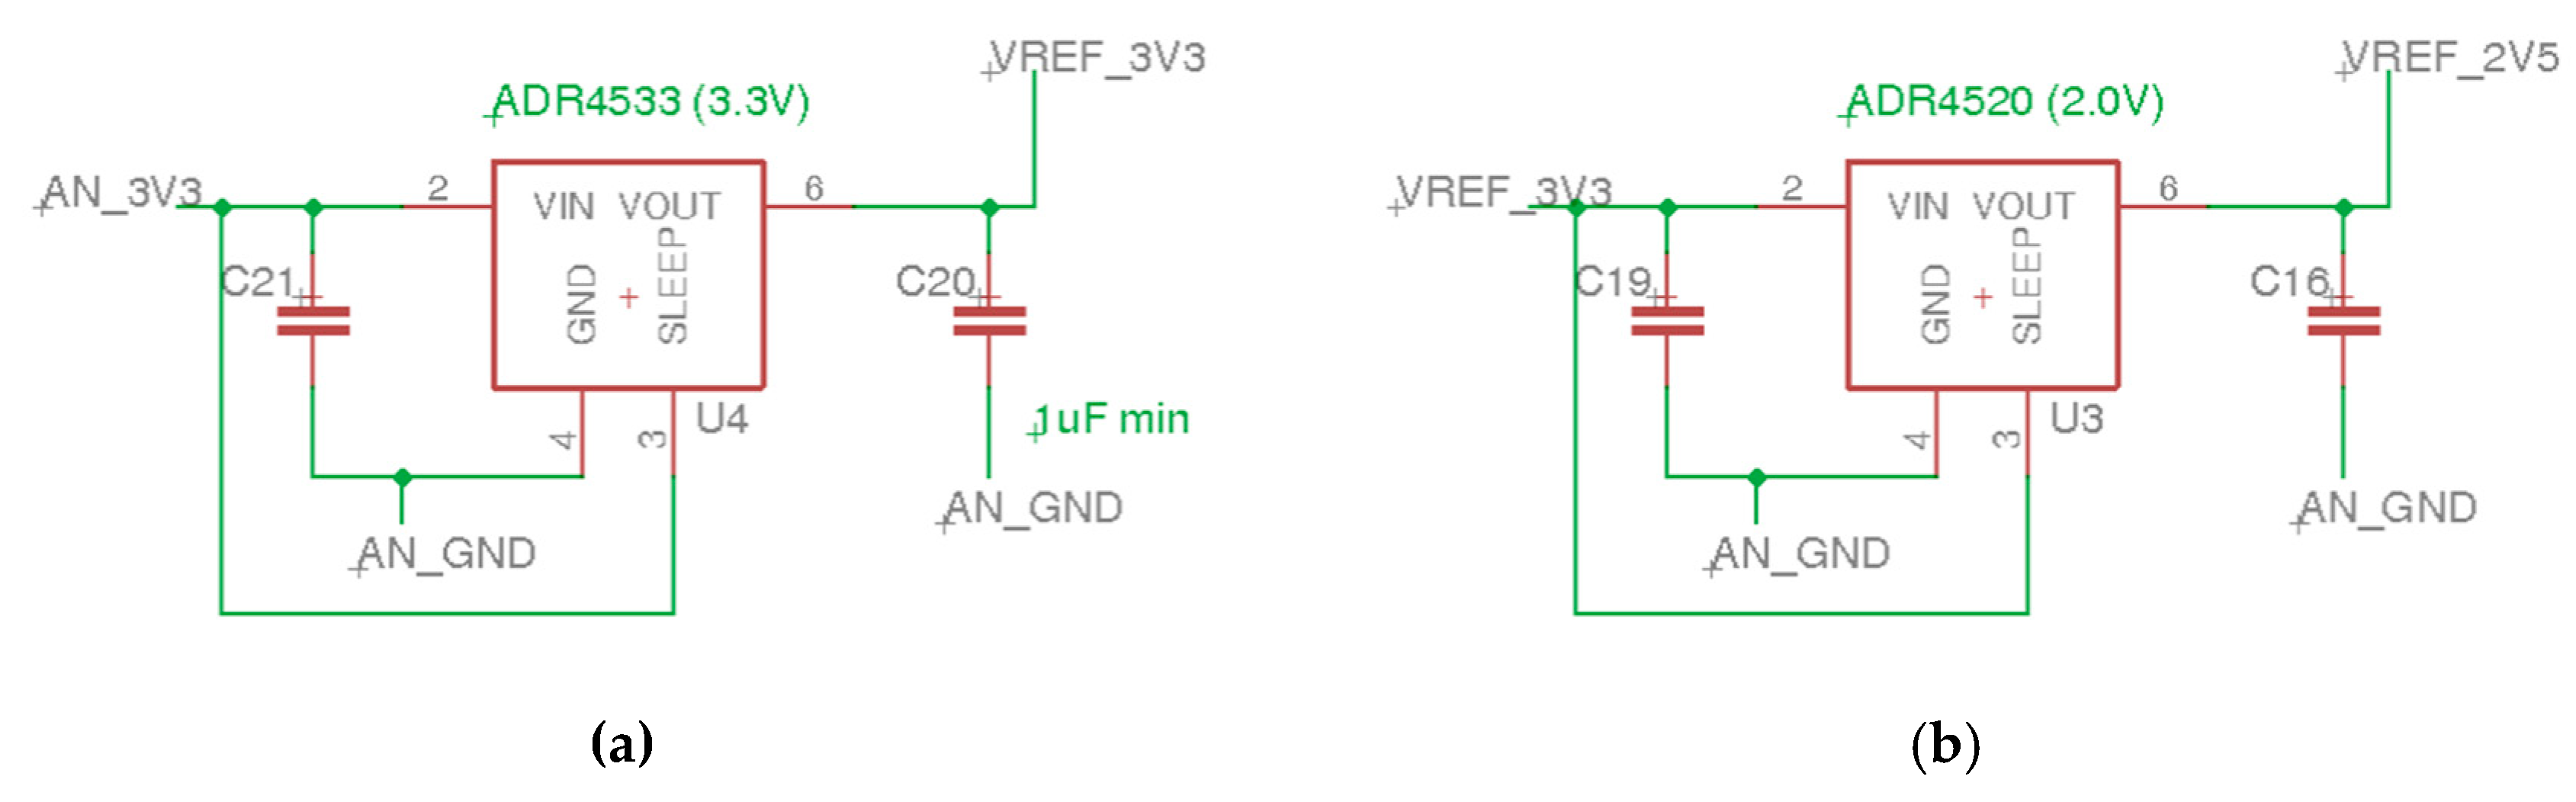
As noted in the previous section, the regulated voltage is provided to the analog subsection by a pair of very low-noise precision high-accuracy voltage reference sources, ADR453x (Analog Devices, Norwood, MA, USA). The ADR453x series of voltage references provides both exceptional voltage accuracy and stability. They feature one of the lowest noise specifications (1 µVpp) that were currently available for a linear voltage regulator at the time of this design. This pair of voltage references (ADR4520, ADR4533), which are detailed in Figure 6, were used to provide the two voltage rails that the analog circuitry requires (2.05 V and 3.3 V). Corresponding component values for the schematic shown in Figure 6 are detailed in Table 4. The 3.3 V voltage reference supplies power to all the analog ICs and the 2.05 V reference supplies the mid-voltage rail to the instrumentation bridge amplifier which was provided to allow for single-supply operation of the bridge amplifiers and the subsequent analog filters.
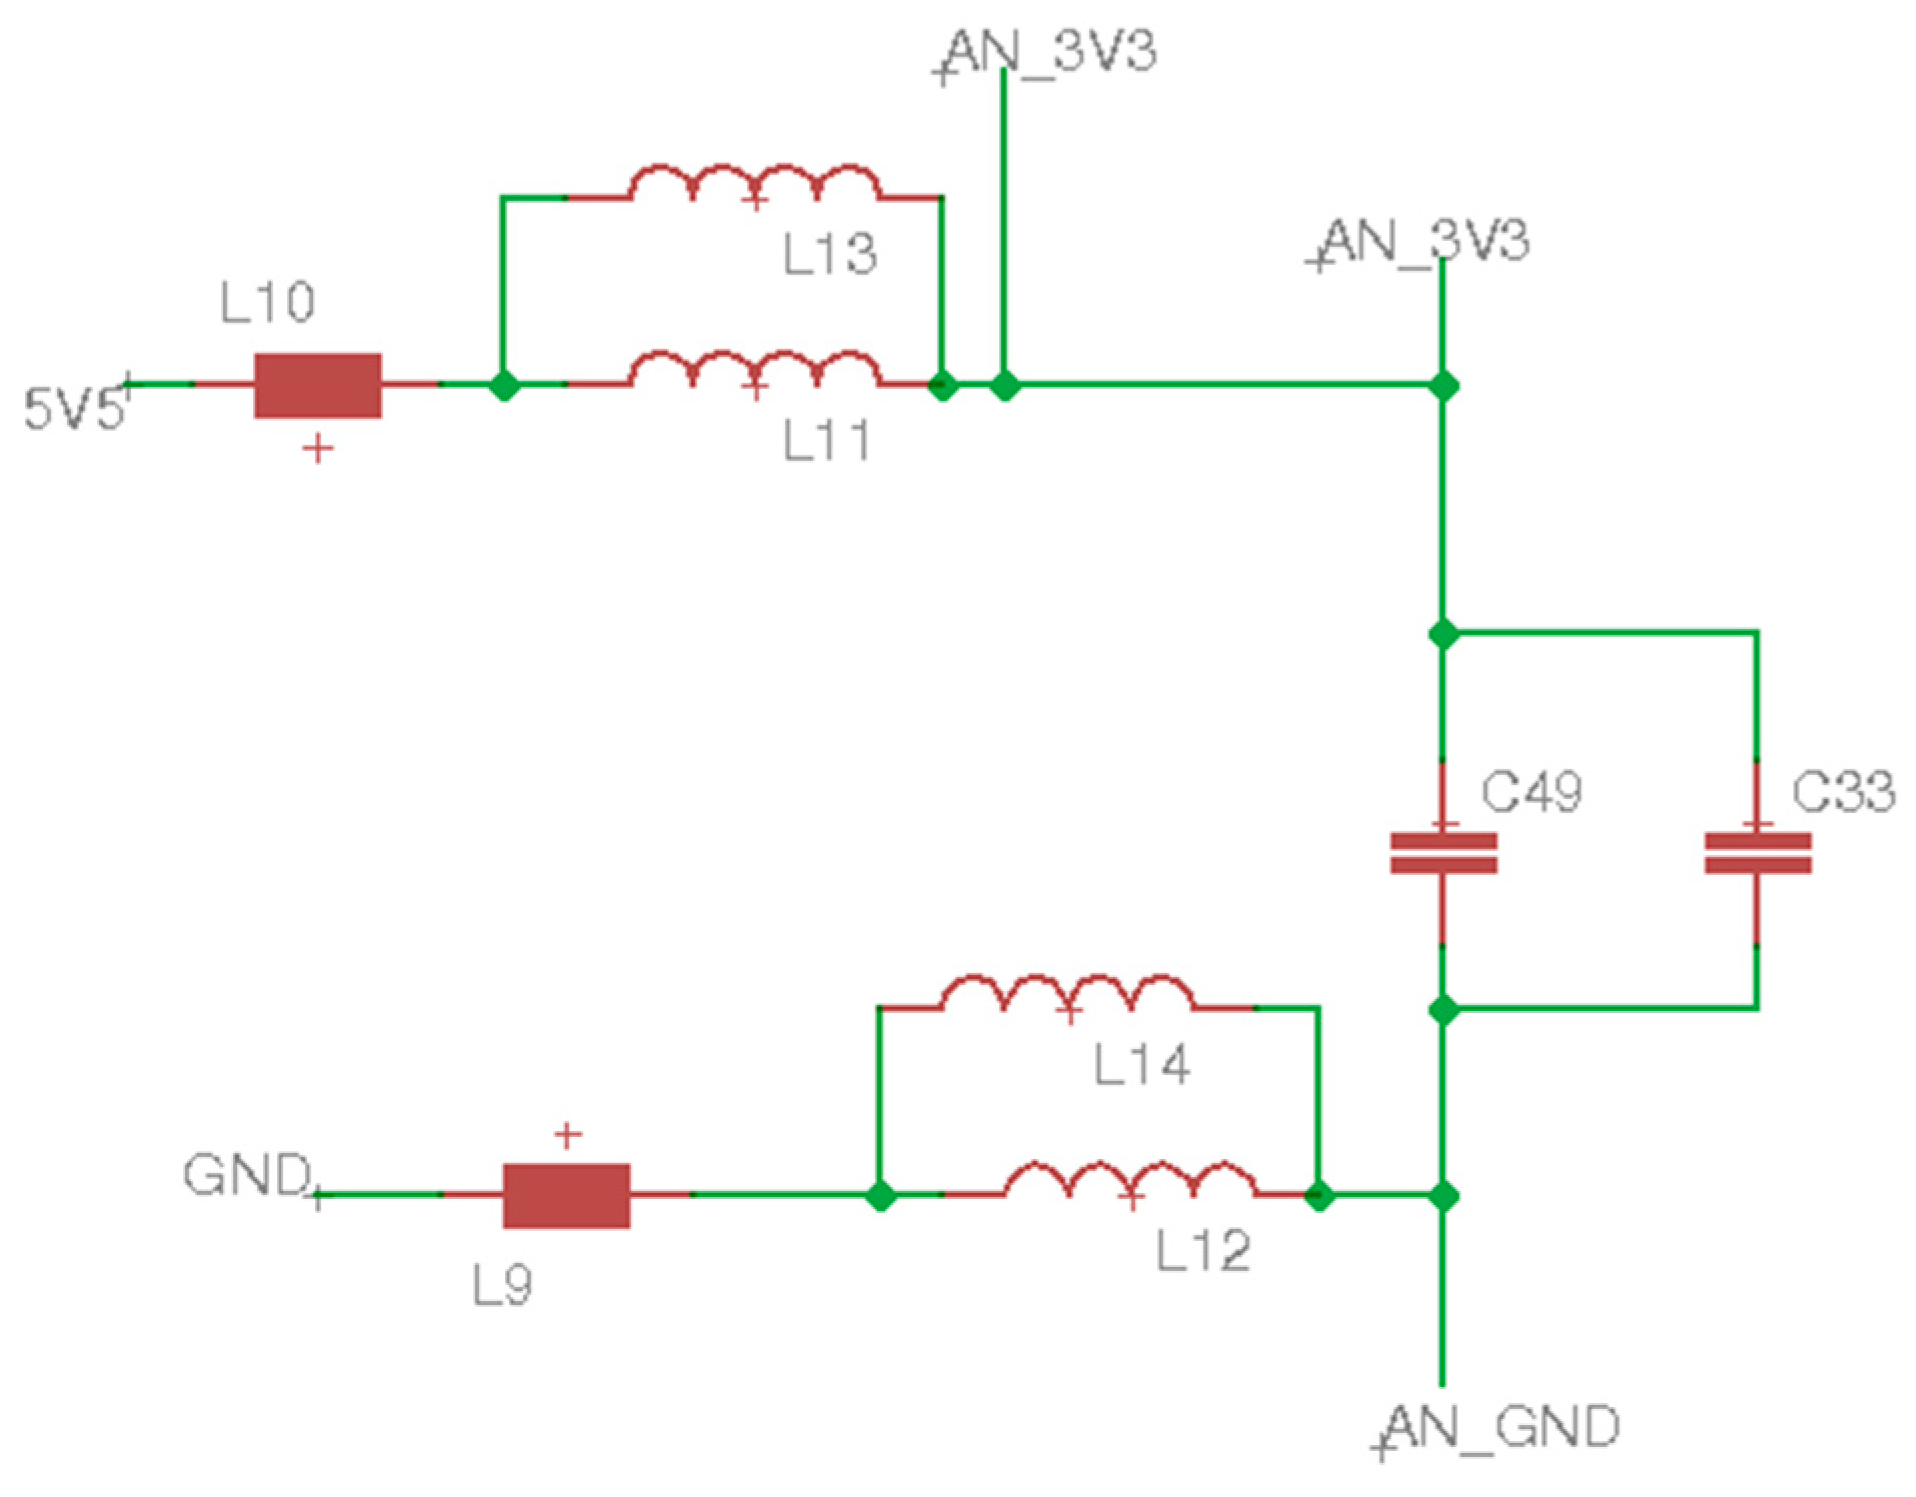
The next protection layer in the design protects the sensitive analog instrument via a set of split power planes that are fed through an LC filter to help reject any voltage spikes generated by the digital sub-systems of the electronic weighing system. Figure 7 shows the input to the analog voltage reference section where the 5.5 V is brought in through noise rejection inductors and capacitors. Corresponding component values for the schematic shown in Figure 7 are detailed in Table 5.
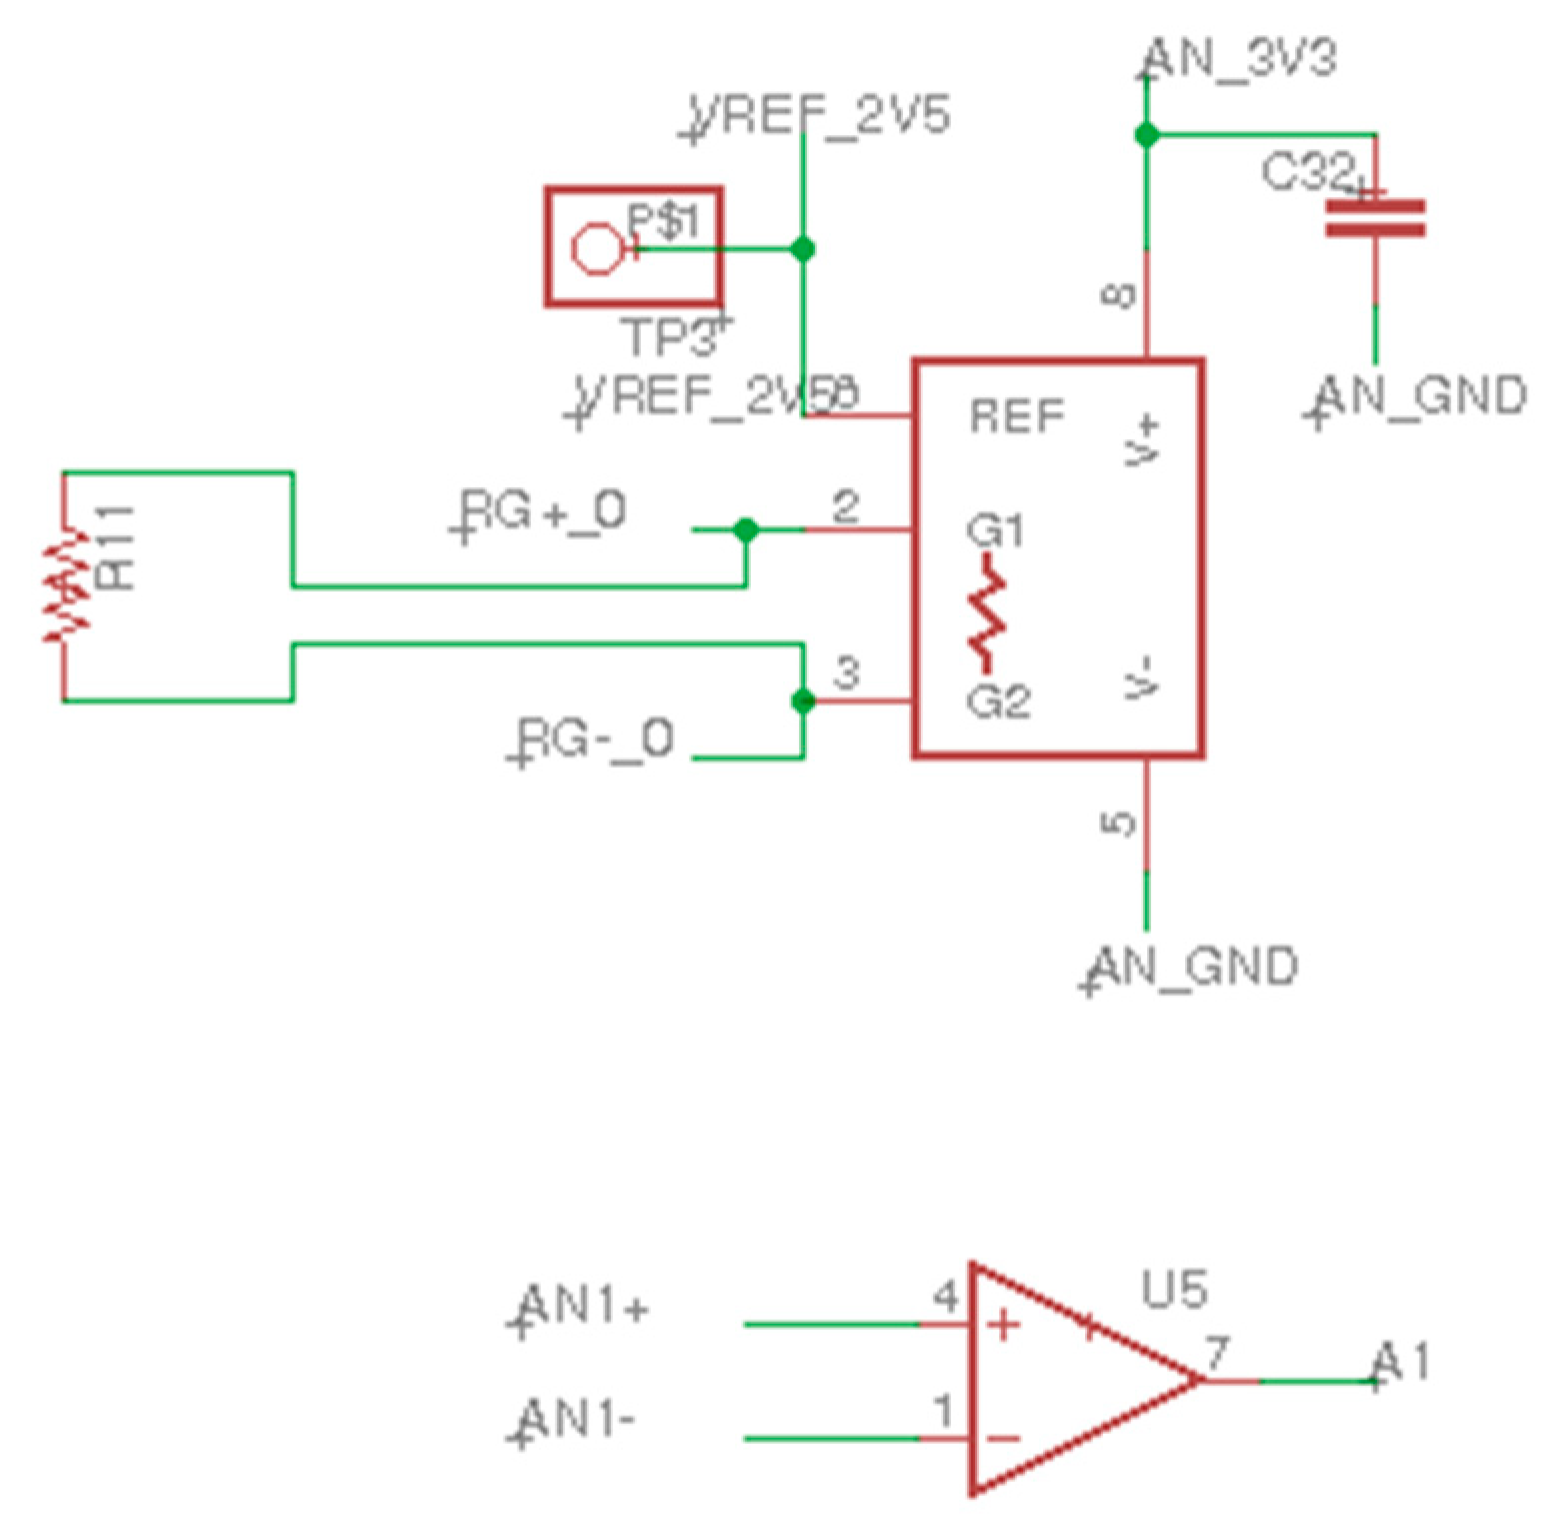
To provide the highest quality capture of the weighing system’s pressure sensors, a precision single-supply bridge amplifier was utilized (see Figure 8) (AD8226; Analog Devices, Norwood, MA, USA) to convert the differential mV signal from the pressure sensor into a high 1 Vpp signal to the filtering stages. Corresponding component values for the schematic shown in Figure 8 are detailed in Table 6. The 3.3 V voltage rail (labeled AN_5V5 in Figure 8) supplies power to the bridge amplifier as well as all the other analog filters, the analog-to-digital converter IC, and the 2.05 V voltage reference.
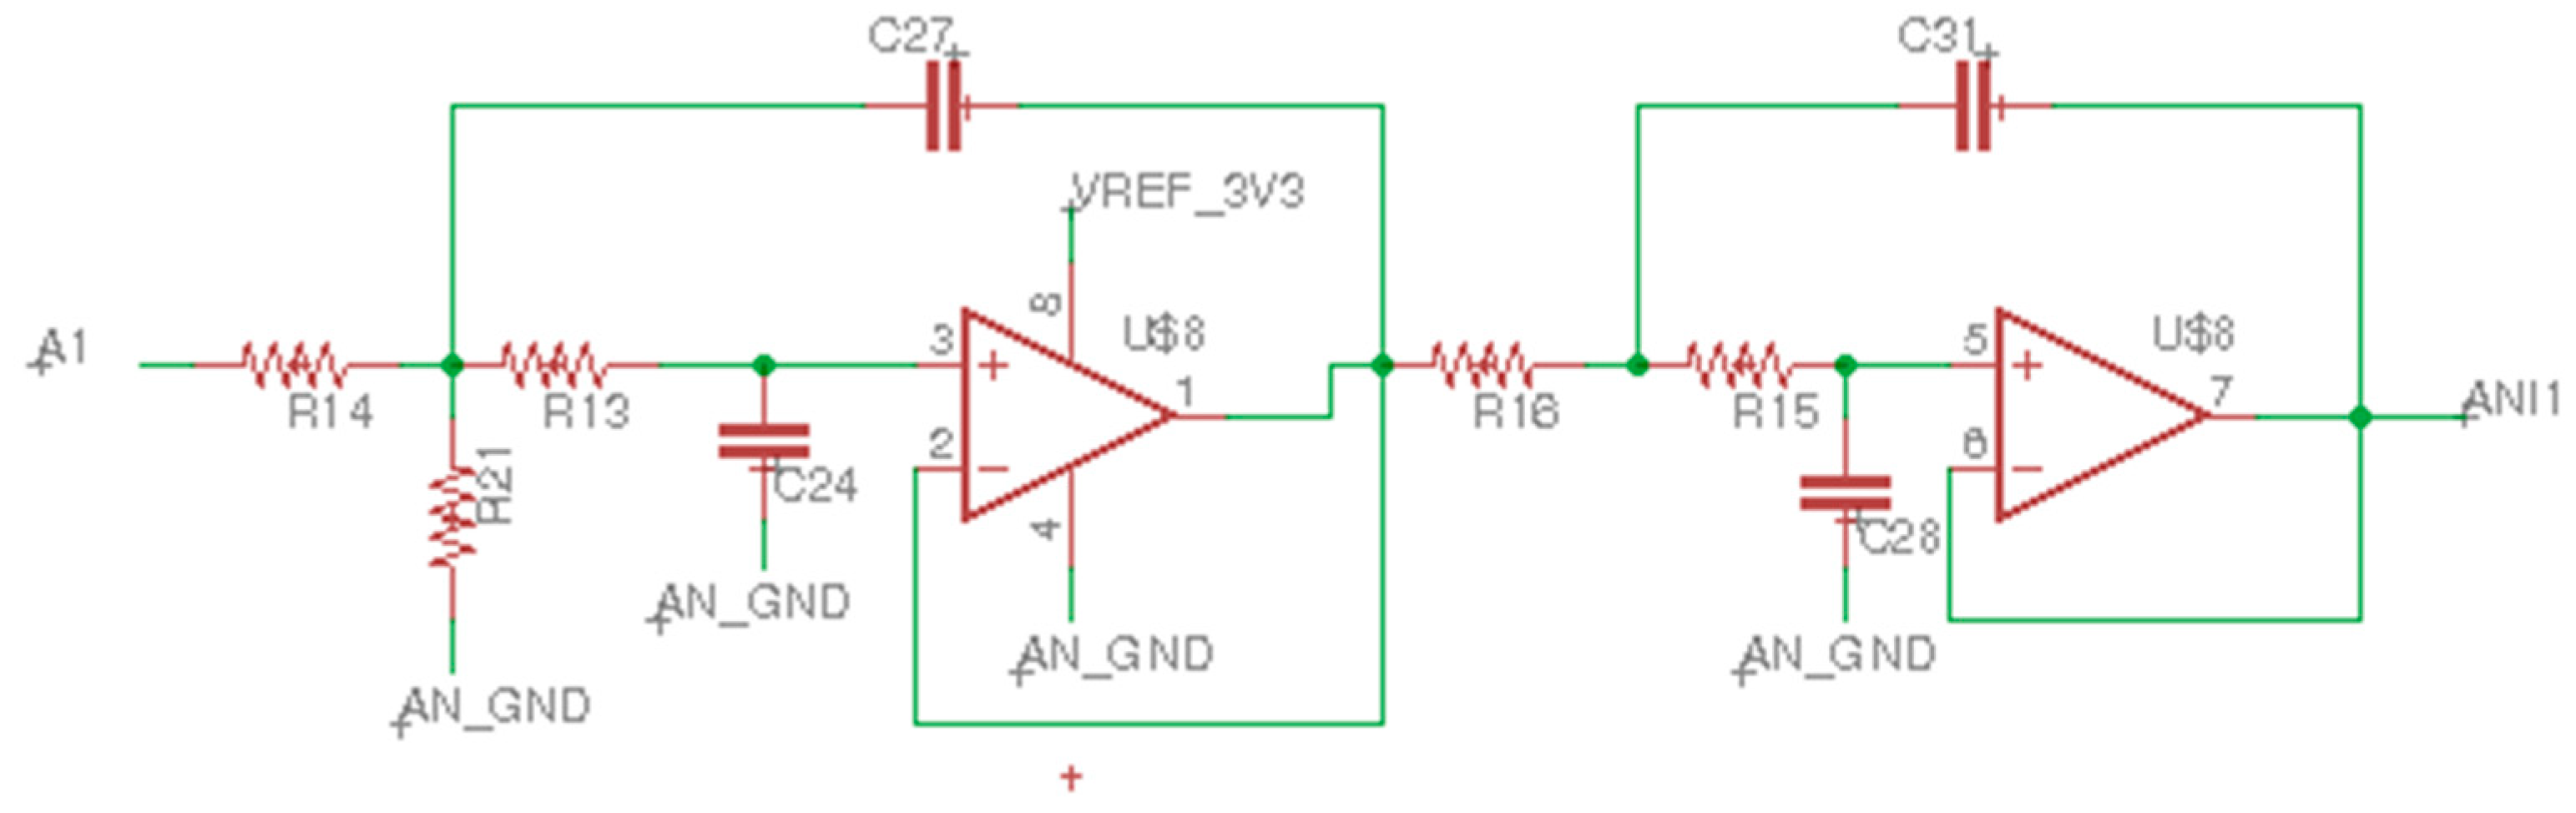
Immediately following the AD8226 bridge amplifier is a pair of unity-gain Sallen–Key low-pass filters (see Figure 9) that are cascaded in series,(Sallen and Key; 1955) [22]. The combined output of these filters provides a corner frequency with the design set to below 1 Hz, as the DC steady-state value is the only reading of interest to the application. Corresponding component values for the schematic shown in Figure 9 are detailed in Table 7.
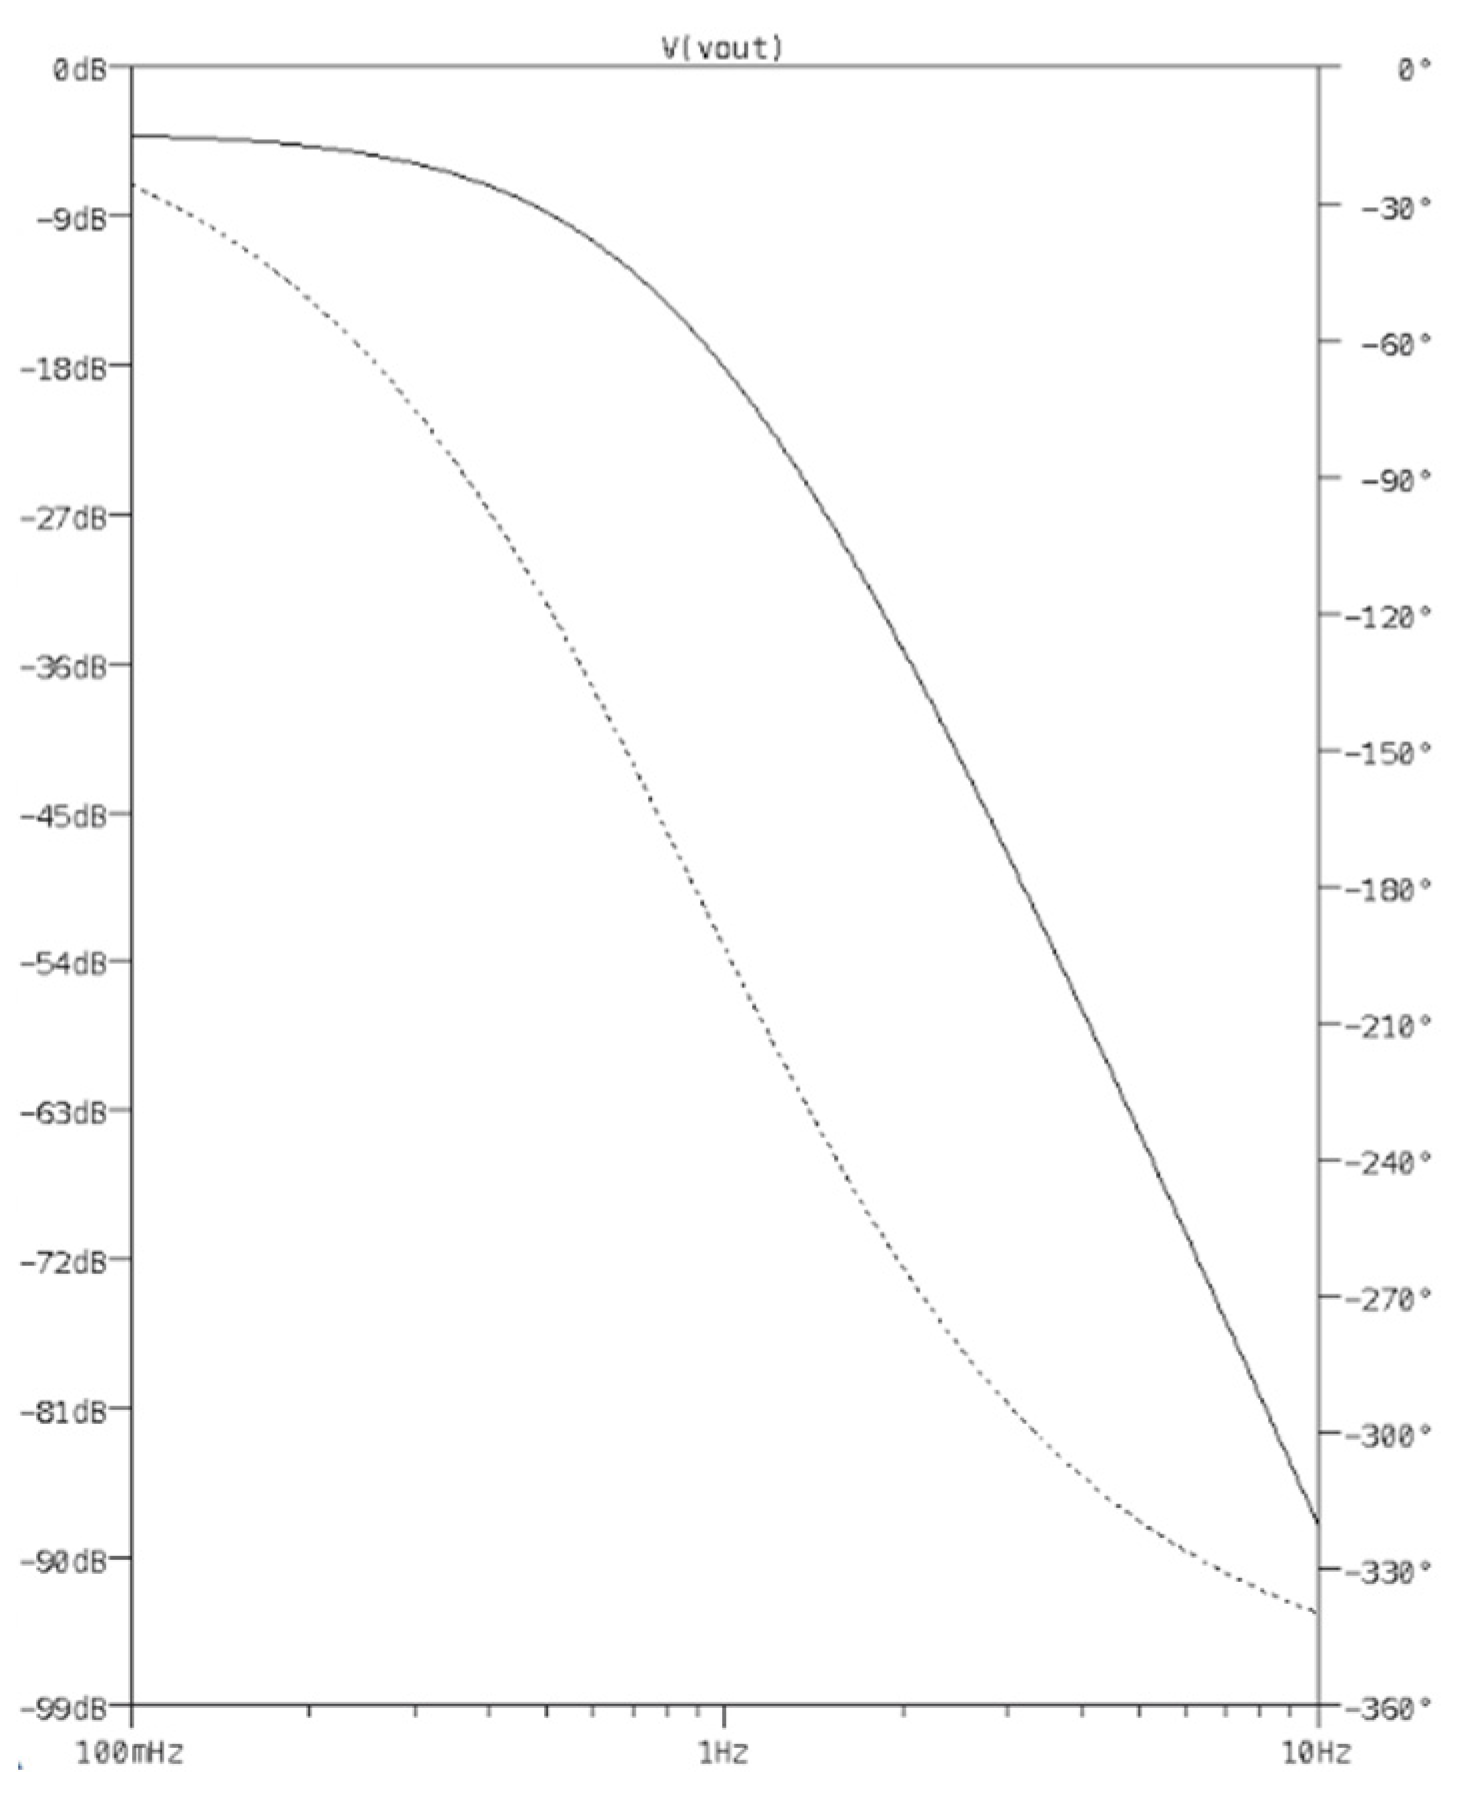
A spice simulation, of both stages of the filters, shows the frequency response providing rejection of noise, above 10 Hz, at greater than 80 dB (see Figure 10).
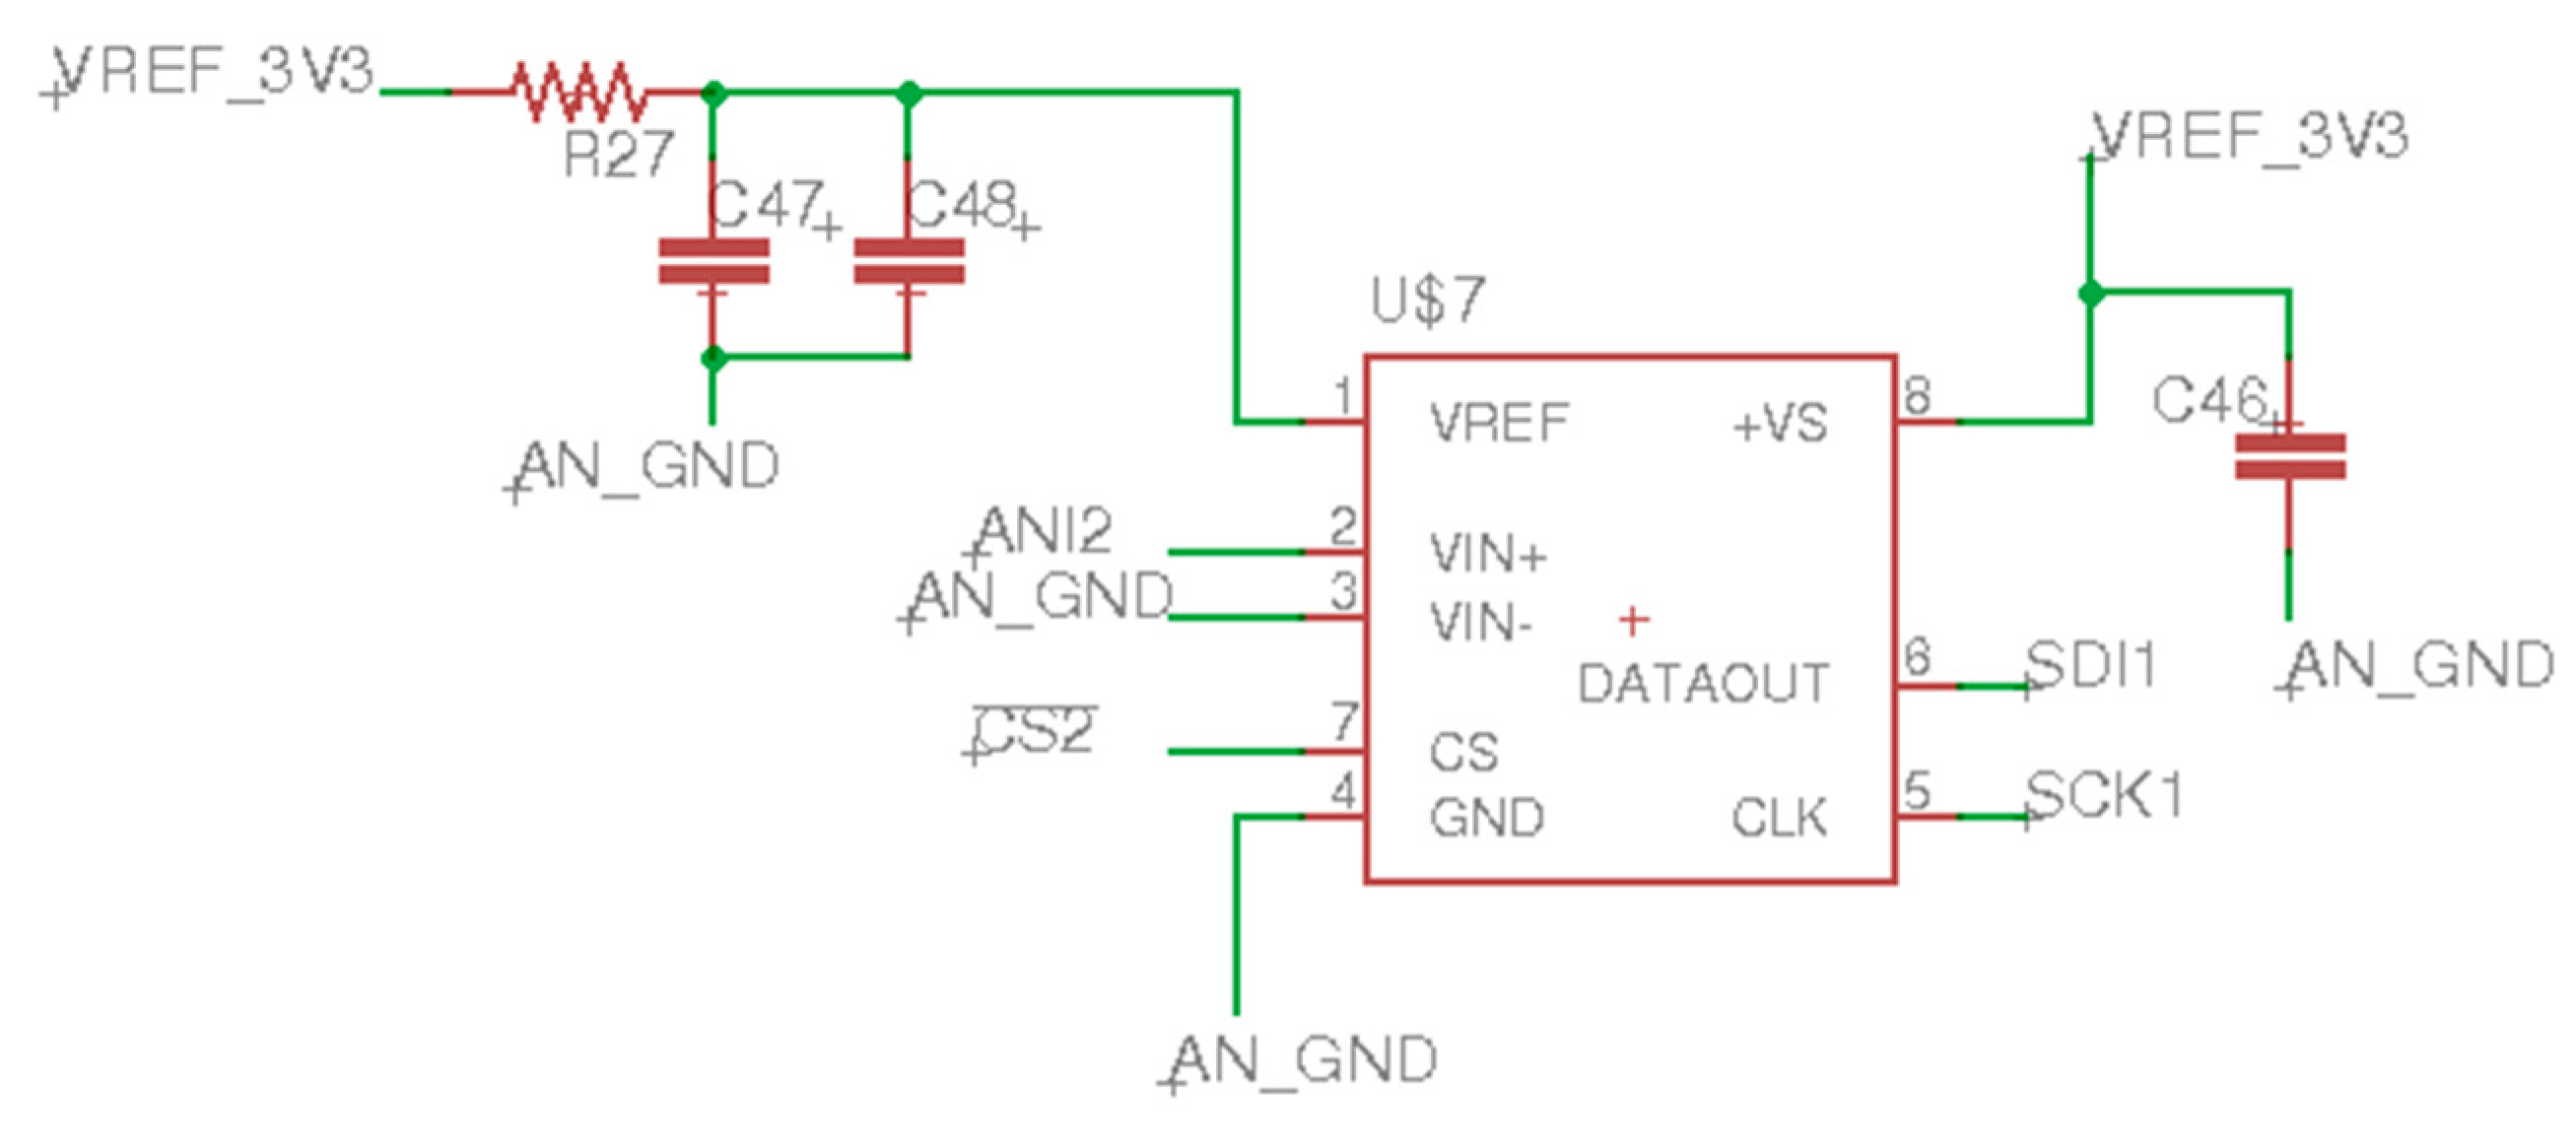
The analog filters are then routed to the input of the 22-bit analog-to-digital converter (ADC), which digitizes the analog signal for the micro-controller (see Figure 11). The interface to the micro-controller is via a synchronous serial interface (SPI).
2.3. Digital Subsection
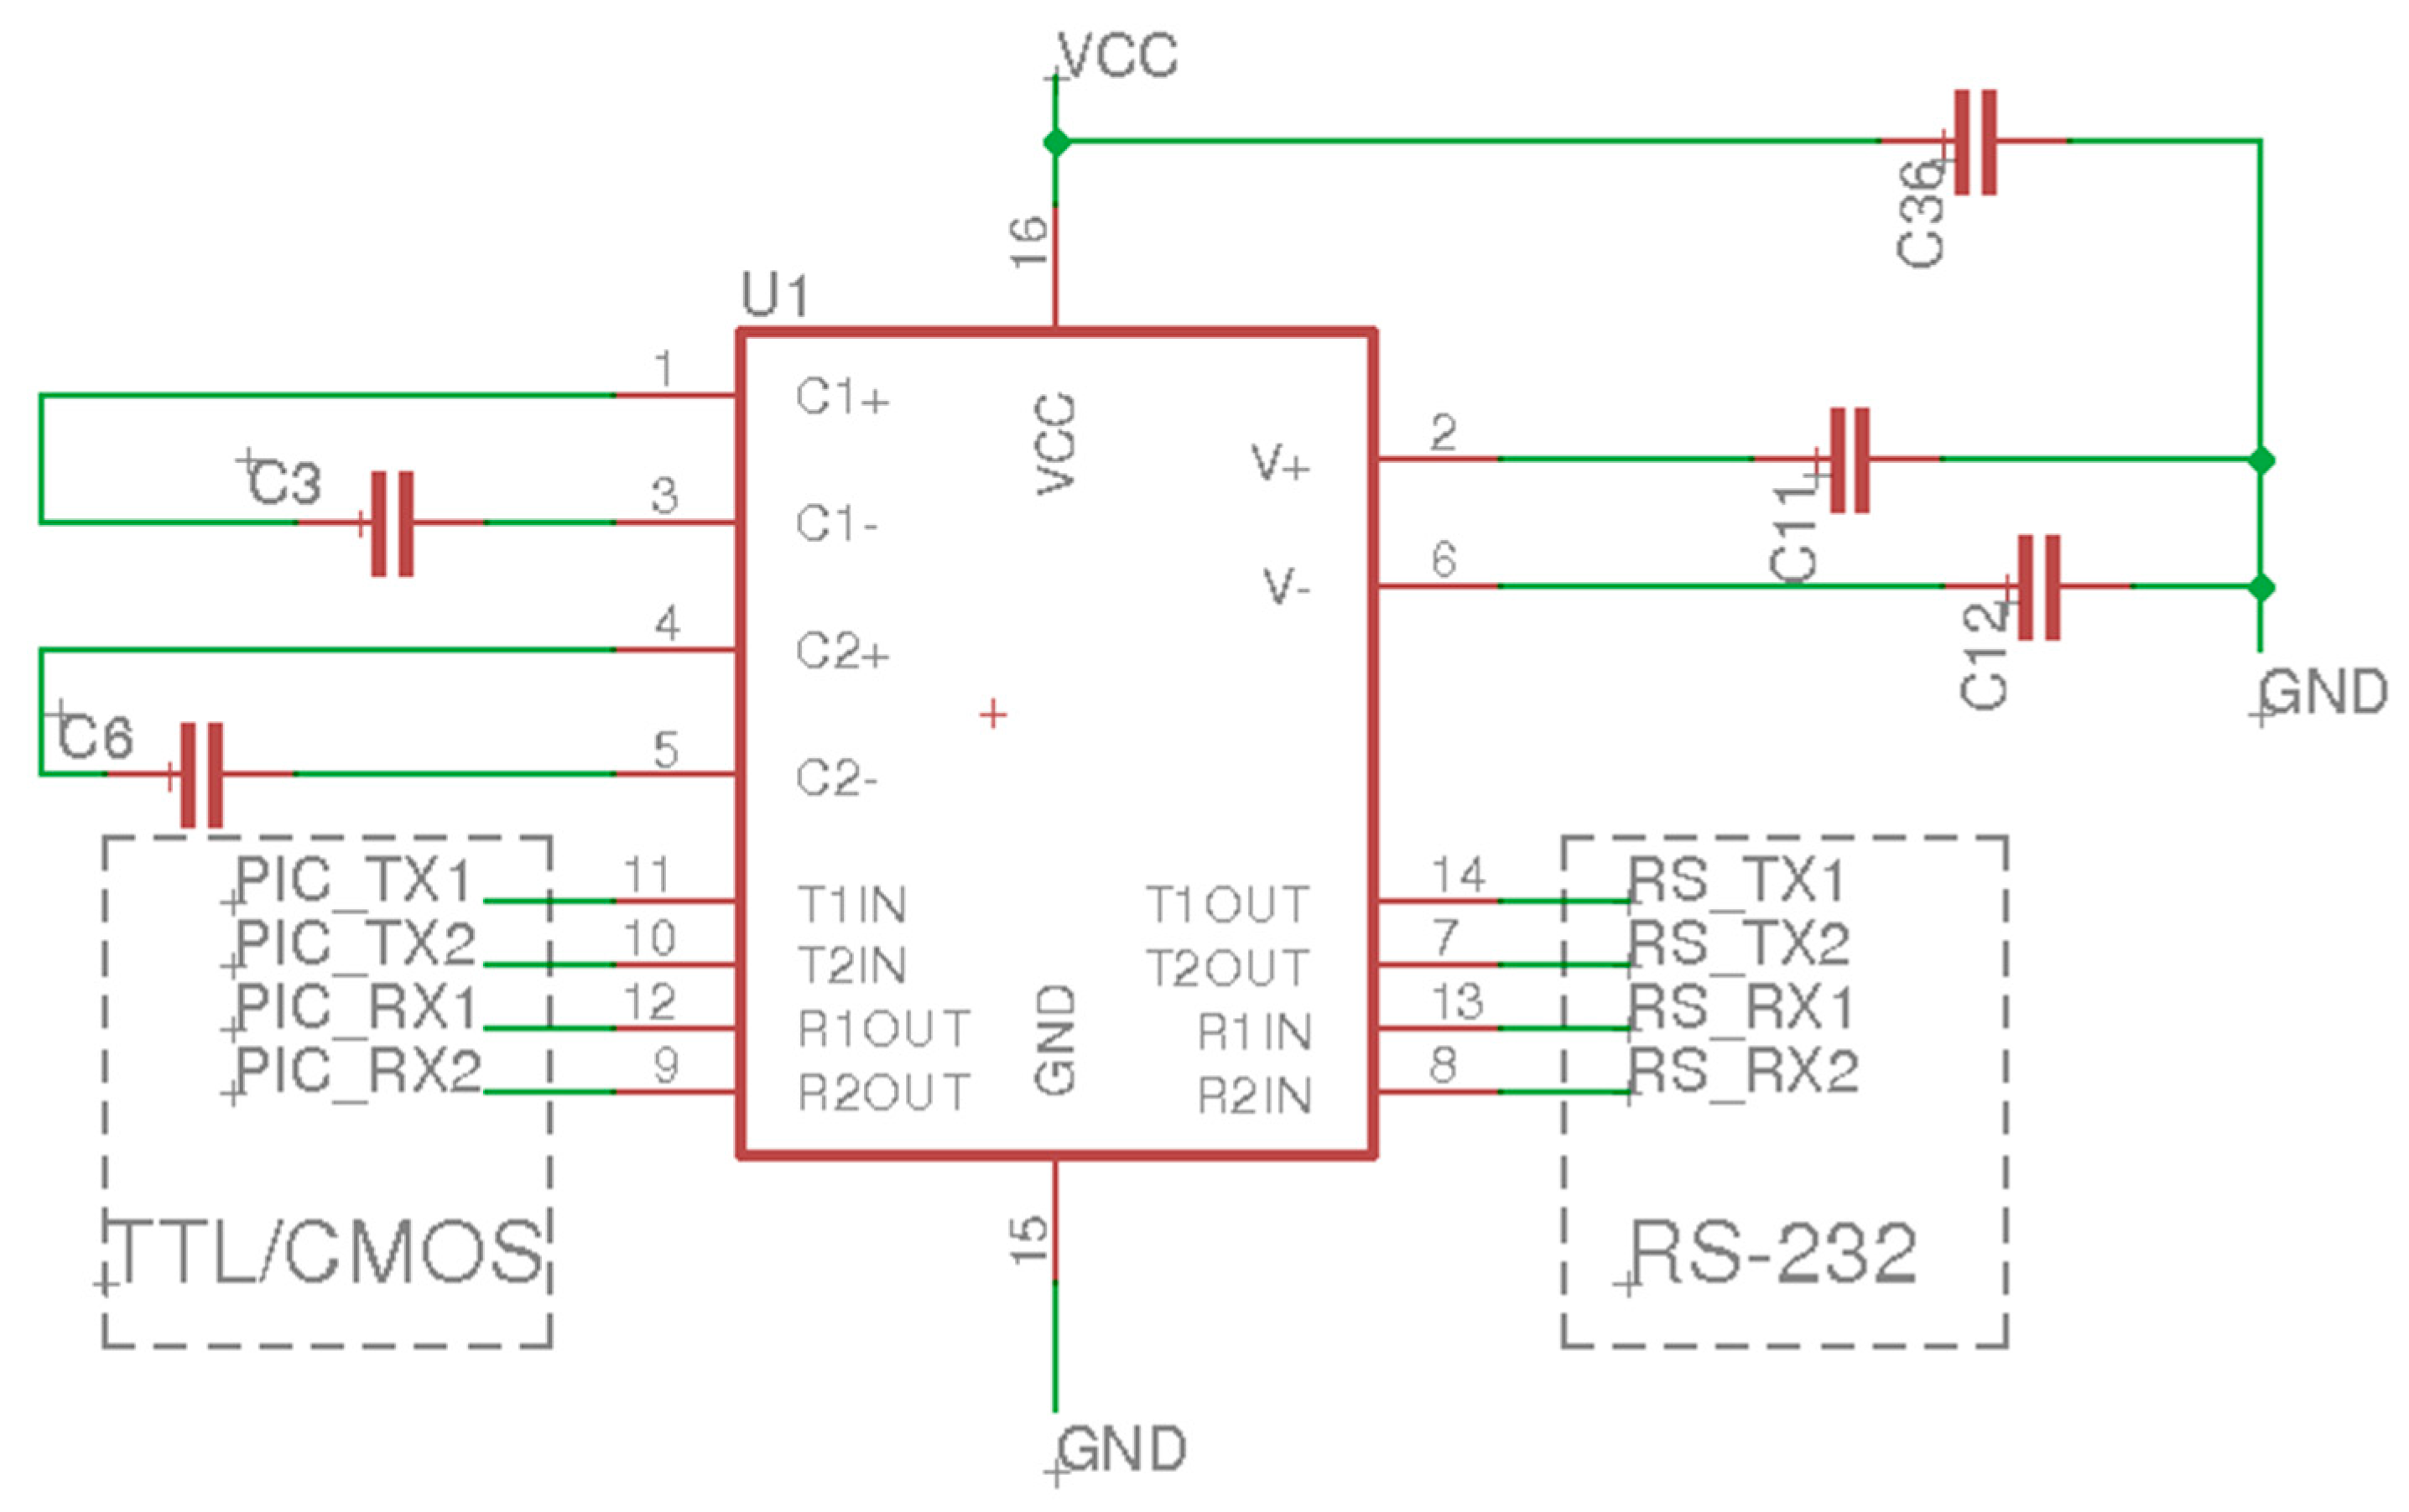
The digital section of the electronic weighing system is comprised of a micro-controller, an RS232 voltage level-shifter, which is used to provide communication back to the industrial PC that provides the operator interface, and a set of solid-state relays. The solid-state relays selected were ones that provide optical isolation and the drive power necessary to interface to the harvester’s hydraulic control valves that are used to actuate the lift cylinders on the basket during the weighing operation. Figure 12 details the RS232 voltage level shifter circuit that was used to convert the micro-controller 3.3 V level serial signals to more robust long distance transmission signaling standard, −12 V to +12 V, that is utilized in the RS232 hardware specification and design. Corresponding component values for the schematic shown in Figure 12 are detailed in Table 9.
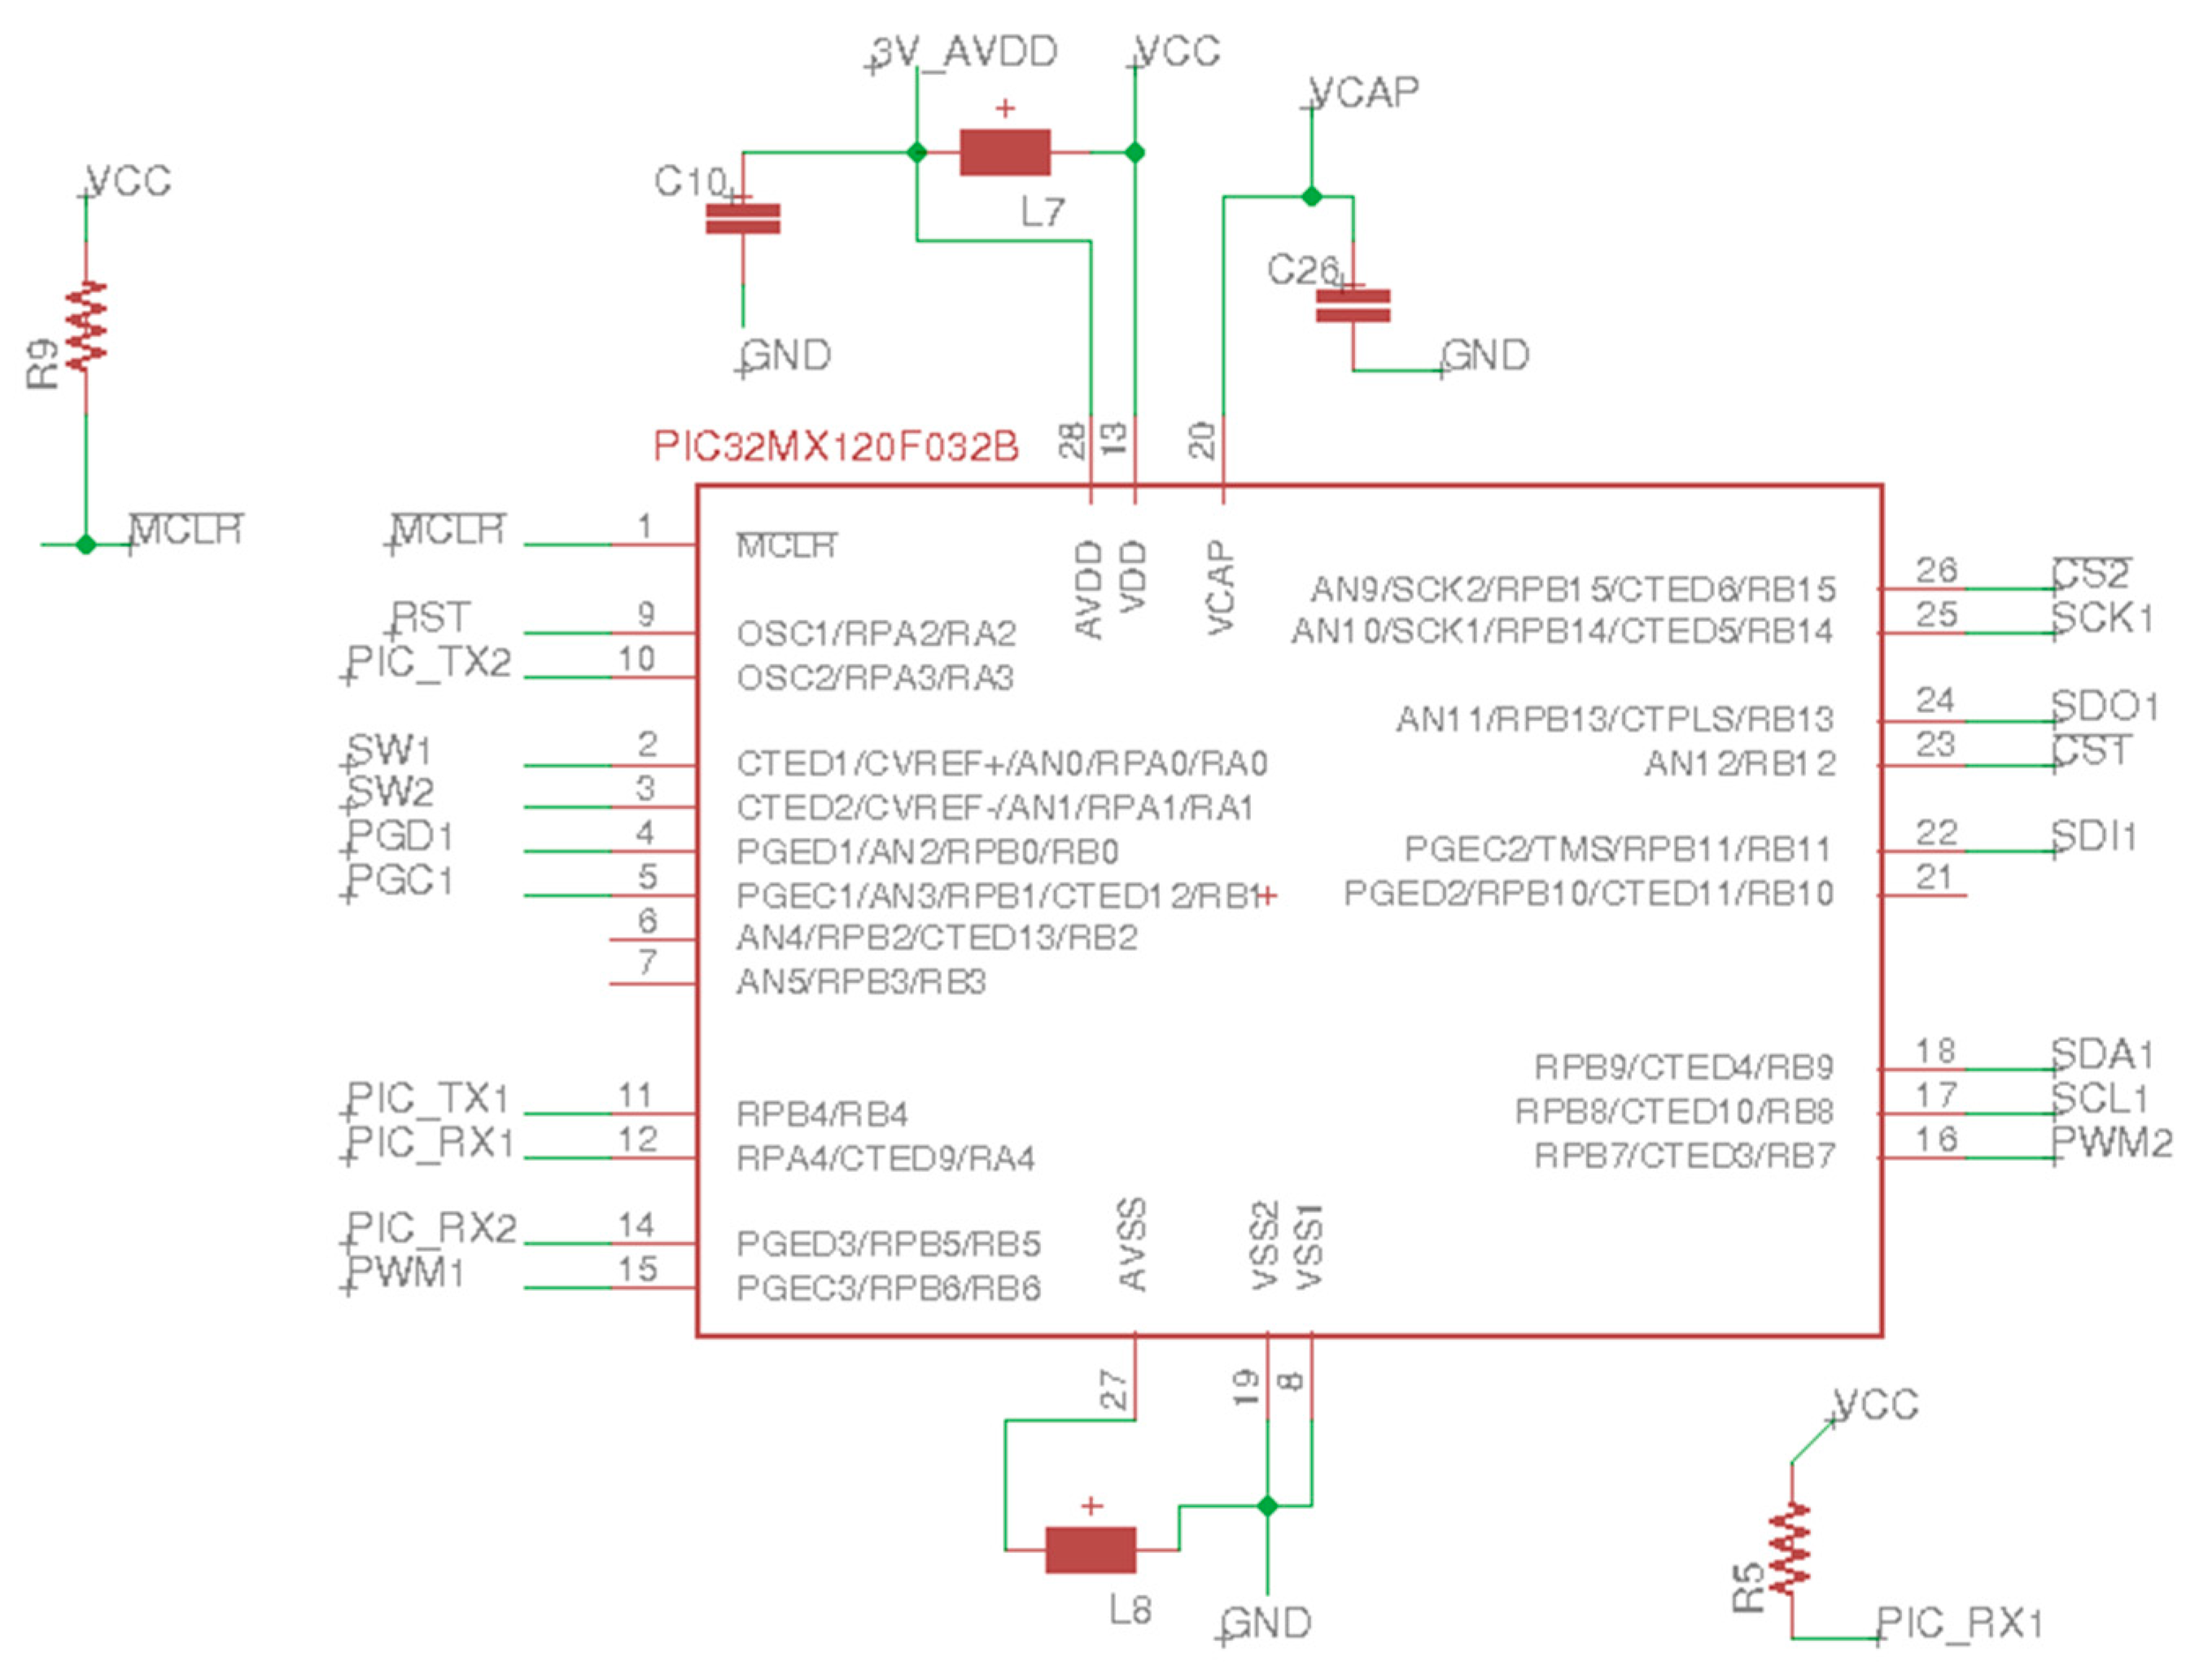
A high-speed 32-bit micro-controller was selected for the design due to the high-speed digital filtering and feed-back control operation desired in the design. As Microchip produces a low 28-pin count version in an easy-to-assemble surface mount form factor, a Pic32MX120F032B (Microchip, Chandler, AZ, USA) was selected for this design (see Figure 13). Corresponding component values for the schematic shown in Figure 13 are detailed in Table 10.
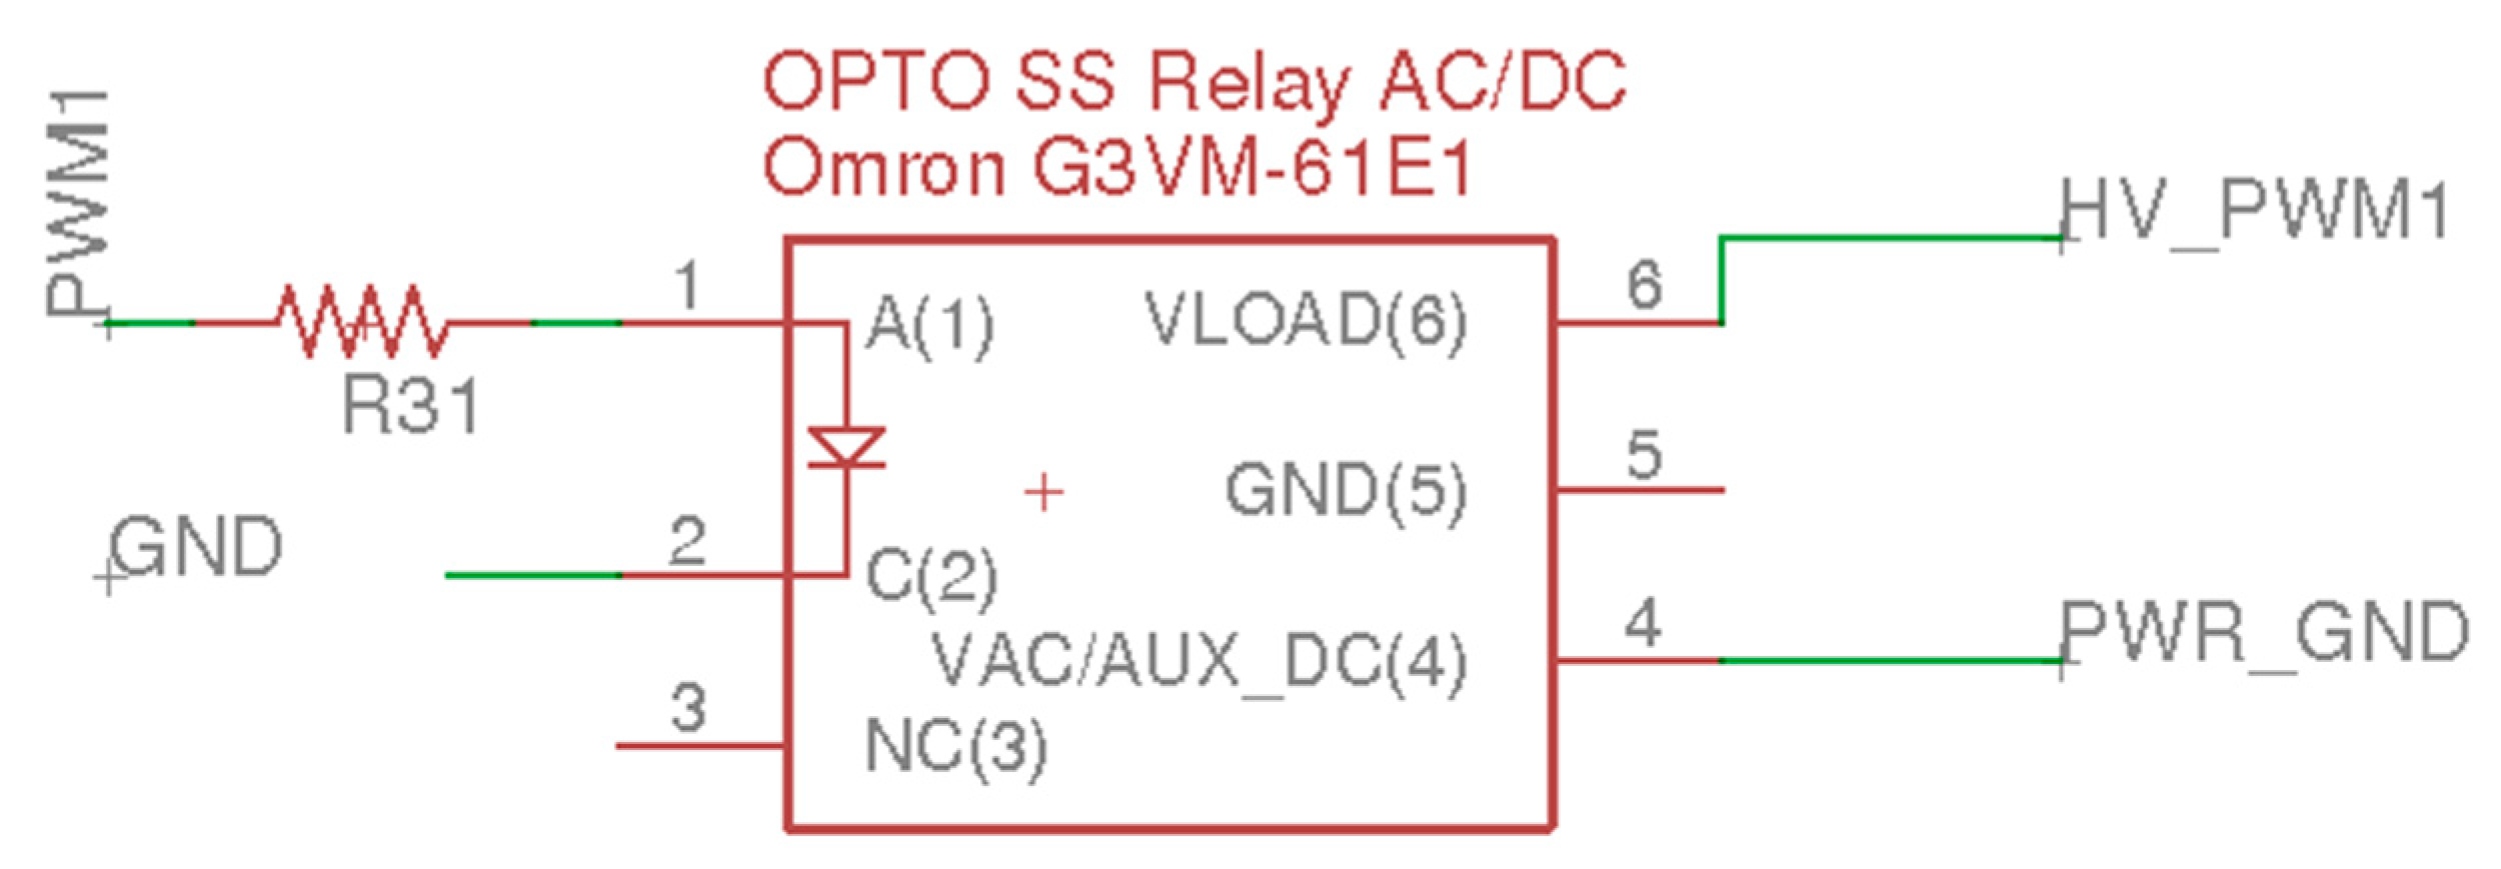
The interface from the 32-bit micro-controller to the hydraulic control valves was provided by using standard digital output (DO) signals through a solid-state relay that provided optical isolation from the harvester’s power supply (G3VM-61; Omron, Kyoto, Japan) (see Figure 14). This design provided the ability to perform pulse-width modulation (PWM) control up to 1 kHz chopping frequency. In Figure 13, PWM1 is connected to the low CMOS voltage digital output provided by the micro-controller. The high voltage side, HV_PWM1, is connected to the hydraulic control valve which is switched to a decoupled ground that is only connected to the harvester’s ground and no-where else on the printed circuit board, thereby providing isolation from the harvester’s noisy power. The other side of the hydraulic control valve is connected directly to harvester’s 12 VDC power. In Figure 14, PWR_GND provides a direct connection to the harvester’s ground when the solid-state relay is activated by the micro-controller, which then internally connects HV_PWM1 to PWR_GND. Corresponding component values for the schematic shown in Figure 14 are detailed in Table 11.
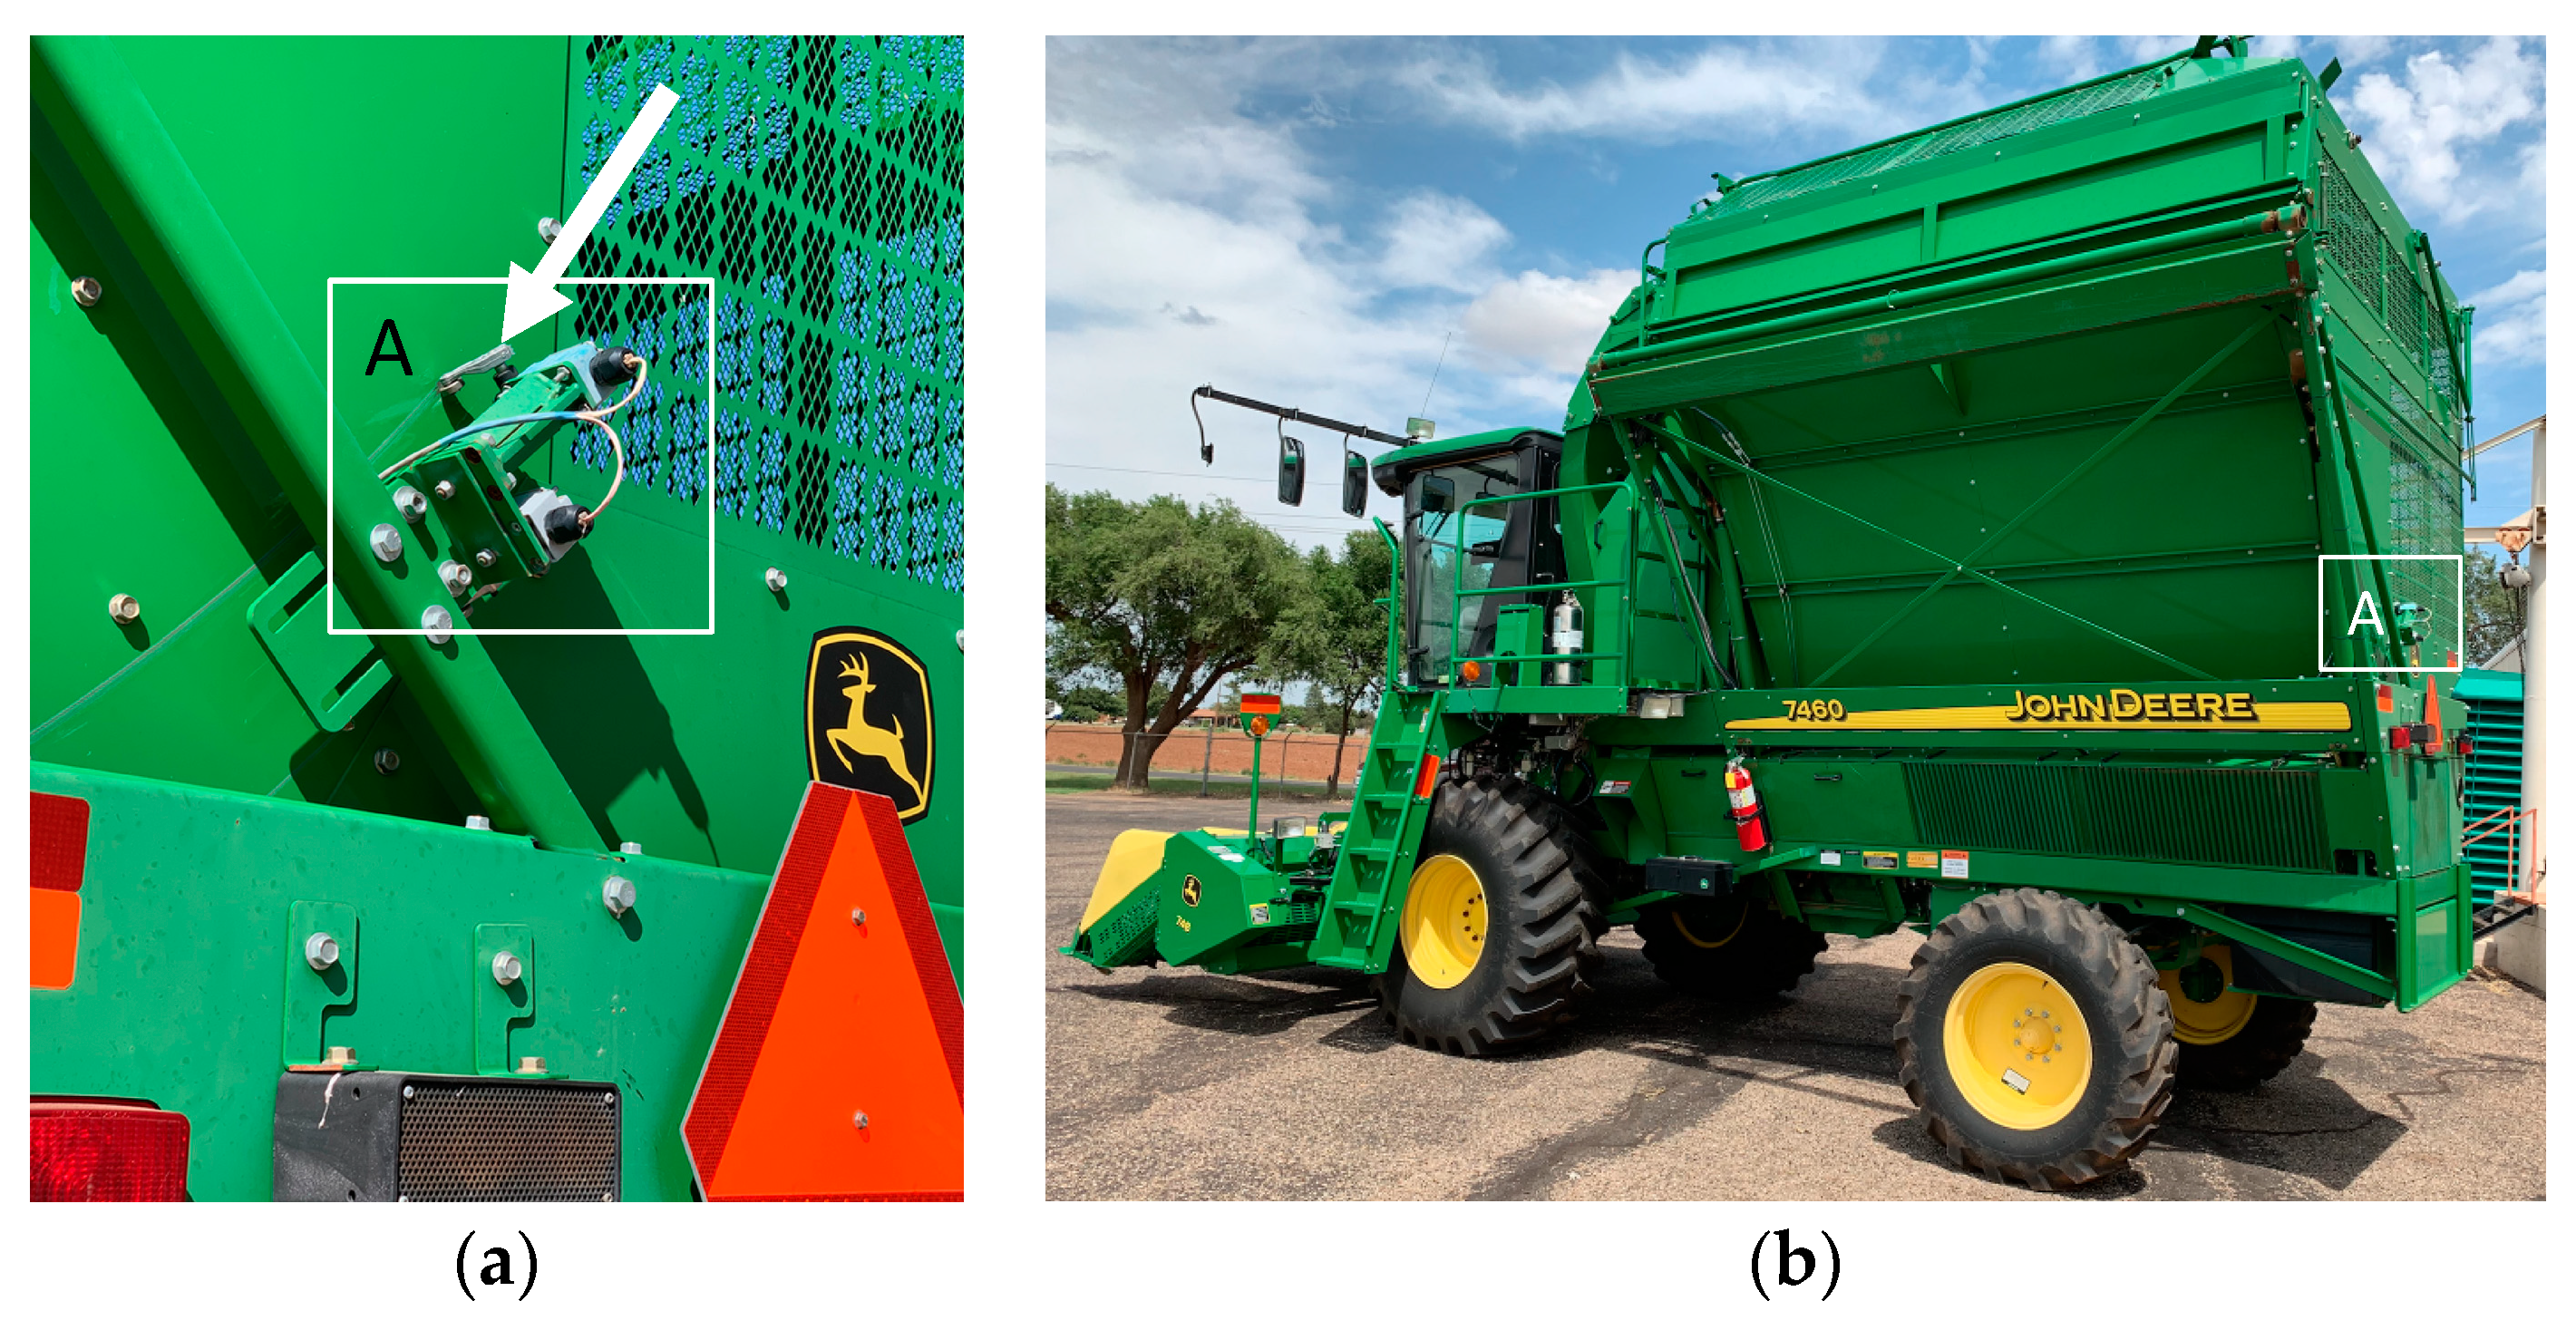
The basket weighing operation utilized a hydraulic feedback control system that consisted of the 32-bit micro-controller that turned on the hydraulic solenoid that provided flow to the harvester basket’s hydraulic lift cylinders. The micro-controller was designed to drive the hydraulic control valves utilizing the solid-state relay circuit (see Figure 14). To achieve a precision location at which to weigh the cotton, the system was configured with limit switches to provide an accurate repeatable location for the weighing operation. The system in use actuated hydraulic cylinders to lift the basket, while the micro-controller monitored a set of limit switches that were mounted at 1/3 of the lift height (see Figure 15). During the lift operation the micro-controller monitors the first limit switch that tells it that the basket is close to the target destination. Once the basket passes the first limit switch position, the micro-controller slows the basket speed by lowering the duty cycle on the PWM control it provides to the solid-state relay driving the hydraulic solenoid. By causing the basket to slowly approach the final target destination, the system was able to park the harvester basket at the same point to within 1 cm every weigh cycle, thereby enabling the instrumentation to obtain a high accuracy estimation of the basket’s load.
In operation, the limit switches open when the trailing edge of the basket passes by the limit switch. The offset distance between the two limit switches allows the first limit switch to provide an early warning feature to the micro-controller to allow it to slow down before the second, final limit switch is reached.
Key details we found during testing of the system, due to the verification of the accuracy of the unit that would invariably occur during a test, prove to be flawless except for a few outliers; then came the detective work to chase down what was causing these outliers. Extensive time was spent in the laboratory to ensure it was not a sporadic software issue, electronic noise, or other glitch. In the end they were found to be of the following causes, not related to the design, but highly important to the operational use:
- Wind during testing would sometimes blow cotton onto the ground when transferring from the harvester to the test’s external instrumented weigh-wagon that was used to verify the experimentally-estimated load weights. Initially the untrained crew did not always put all of the errant cotton into the weigh-wagon. As such, this was not always fully successful until the management team put special emphasis on this aspect of the testing. This added training largely took care of this source of error.
- Wind load itself was found to provide a significant bias to the readings that were solved by providing a software switch to allow for a longer integration time by which to help zero out the wind loading bias. This worked fairly well and was incorporated into the final software design.
- As each trial weight was verified in the external weigh-wagon, initially the crew hand-wrote on a data-sheet the test weights. After review it was found that once in a while the numbers would be inadvertently reversed, leading to wrong values being recorded as to what was supposed to be the gold standard benchmark. This was resolved by adding a ribbon paper print-out to the scale to provide a direct readout that was true to the actual scale weights.
- All of the electronics were potted in epoxy to both ruggedize the units as well as ensure they were environmentally shielded from confounding effects due to moisture and dust. This took care of most of the issues; the rest of the components were specified to provide a NEMA 6 or better water-tight housing which ensured all the components were trouble-free.
- The accuracy of the electronic 22-bit ADC design resulted in electrical performance of 16 bits (if using highly shielded cables, ultra-low noise signal reference voltage sources as the signal) however, in practice, as a system there were many other sources of error that were substantially higher resulting in a system accuracy of 1%. Hence the system was over-designed in retrospect.
3. Conclusions
The electronic design covered in this report is part of a set of designs that, in combination, form the complete working system [19,20,21] that was tested and proven both on the laboratory bench as well as in the field while harvesting [17,18]. The system was found to be stable, robust, and capable of providing high-accuracy weighing suitable for use in field trials as well as post-processing of field-trial plot data. With some minor modifications to the HMI [20] software, the system could be easily extended to dynamically correct yield monitor data as well. Future notes are planned to cover both the hydraulic circuit design as well as the software implementation (both micro-controller as well as the industrial PC operator interface code).
In summary, the system design worked well, and splitting the functionality into separate sections (HMI software as separate from the electronic control system) allowed for a modular design that was easily expandable. The electronic protection systems provided clean uninterrupted power and resulted in a robust, dependable system. This effort was the culmination of three generations in which several organizational structures were explored and, in all, this version was the most compact and easy to deal with. For the purposes of expansion, it is easy to simply add another identical electronic subsystem and interface to it via an additional serial port that is easily added via the USB bus using a USB-to-serial converter. Future work is planned to extend this system to include an optical cotton yield monitor that counts cotton bolls in the pneumatic air ducts.
Supplementary Materials
The associated electronic design files are available online at https://0-www-mdpi-com.brum.beds.ac.uk/2624-7402/1/4/38/s1, as supplementals to this paper. The supplemental files are the electronic design files, Eagle-PCB, and Gerber manufacturing files that can be submitted to a PCB board house for fabrication of the electronic PCB board discussed in this technical note.
Author Contributions
Conceptualization: M.G.P. and J.D.W.; methodology: M.G.P. and J.D.W.; software: M.G.P.; validation: J.D.W. and M.G.P.; formal analysis: M.G.P. and J.D.W.; investigation: M.G.P. and J.D.W.; project administration: G.A.H.
Funding
This research received no external funding.
Conflicts of Interest
Mention of a product or trade-name in this article does not constitute an endorsement by the USDA-ARS over other compatible products. Products or trade names are listed for reference only. USDA is an equal opportunity provider and employer.
References
- Rains, G.C.; Perry, C.D.; Vellidis, G.; Thomas, D.L.; Wells, N.; Kvien, C.K.; Dales, H.D. Cotton Yield Monitor Performance in Changing Varieties; ASAE Paper No. 021160; ASAE: St. Joseph, MI, USA, 2002. [Google Scholar]
- Wilkerson, J.B.; Moody, F.H.; Hart, W.E. Implementation and field evaluation of a cotton yield monitor. App. Eng. Agric. 2002, 18, 153–159. [Google Scholar] [CrossRef]
- Robertson, B.; Cordell, M.; Matthews, S.; Groves, F. Utility of Yield Monitors for On-farm Research. In Proceedings of the 2006 Beltwide Cotton Conference, San Antonio, TX, USA, 3–6 January 2006; National Cotton Council: Memphis, TN, USA, 2006; pp. 1756–1758. [Google Scholar]
- Stewart, A.M.; Wright, I.R.; Deville, S.F.; Woolam, B.W. Comparison of On-Farm Cotton Variety Trial Results when Using Yield Monitors vs. Weigh Wagons. In Proceedings of the 2008 Beltwide Cotton Conference, Nashville, TN, USA, 8–11 January 2008; National Cotton Council: Memphis, TN, USA, 2008; pp. 69–71. [Google Scholar]
- Taylor, R.; Porter, W.; Boman, R.; Osborne, S.; Henderson, W.; Buschermohle, M.; Barnes, E. Using yield monitors to evaluate cotton variety tests. In Proceedings of the 2014 Beltwide Cotton Conference, New Orleans, LA, USA, 6–8 January 2019; National Cotton Council: Memphis, TN, USA, 2014; pp. 494–498. [Google Scholar]
- Wanjura, J.D.; Kelley, M.S.; Taylor, R.K.; Porter, W.M.; Barnes, E.M.; Pelletier, M.G.; Holt, G.A. Evaluation of a cotton stripper yield monitor. In Proceedings of the 2014 Beltwide Cotton Conference, New Orleans, LA, USA, 6–8 January 2019; National Cotton Council: Memphis, TN, USA, 2014; pp. 481–493. [Google Scholar]
- Vories, E.D.; Jones, A.S.; Meeks, C.D.; Stevens, W.E. Variety effects on cotton yield monitor calibration. App. Eng. Agric. 2019, 35, 345–354. [Google Scholar] [CrossRef]
- Gvili, M. Cotton yield sensor produces yield maps. In Proceedings of the 1998 Beltwide Cotton Conference, San Diego, CA, USA, 7–9 January 1998; National Cotton Council: Memphis, TN, USA, 1998; pp. 1655–1657. [Google Scholar]
- Wilkerson, J.B.; Moody, F.H.; Hart, W.E.; Funk, P.A. Design and evaluation of a cotton flow rate sensor. Trans. ASAE 2001, 44, 1415–1420. [Google Scholar] [CrossRef]
- Thomasson, J.A.; Sui, R. Advanced optical cotton yield monitor. In Proceedings of the 2000 Beltwide Cotton Conference, San Antonio, TX, USA, 5–7 January 2000; National Cotton Council: Memphis, TN, USA, 2000; pp. 408–410. [Google Scholar]
- Deere & Company. Cotton mass-flow sensor. Deere & Company: Moline, IL, USA, 2010. Available online: http://salesmanual.deere.com/sales/salesmanual/en_NA/cotton_harvesters/2011/feature/pickers/ams/cotton_mass_flow_sensor.html (accessed on 8 August 2019).
- Head, J.C.; Wilkerson, J.B.; Hart, W.E.; Allen, P.B. Identification and quantification of cotton yield monitor errors. In Proceedings of the 2009 Beltwide Cotton Conference, San Antonio, TX, USA, 5–8 January 2009; National Cotton Council: Memphis, TN, USA, 2009; pp. 374–377. [Google Scholar]
- Walak, F.J.; Khalilian, A.; Dodd, R.B.; Han, Y.J.; Keshlkin, M.; Lippert, R.M.; Hair, W. Cotton yield monitor evaluation, South Carolina—Year 2. In Proceedings of the 1999 Beltwide Cotton Conference, Orlando, FL, USA, 6–8 January 1999; National Cotton Council: Memphis, TN, USA, 1999; pp. 361–364. [Google Scholar]
- Sassenrath–Cole, G.F.; Thomson, S.J.; Williford, J.R.; Hood, K.B.; Thomasson, J.A.; Williams, J.; Woodard, D. Field testing of cotton yield monitors. In Proceedings of the 1999 Beltwide Cotton Conference, Orlando, FL, USA, 6–8 January 1999; National Cotton Council: Memphis, TN, USA, 1999; pp. 364–366. [Google Scholar]
- Sui, R.; Thomasson, J.A. Test of temperature and stray-light effects on mass-flow sensor for cotton yield monitor. App. Eng. Agric. 2002, 18, 429–434. [Google Scholar]
- Thomasson, J.A.; Sui, R. Mississippi cotton yield monitor: Three years of field-test results. App. Eng. Agric. 2003, 19, 631–636. [Google Scholar] [CrossRef]
- Wanjura, J.D.; Pelletier, M.G.; Holt, G.A.; Kelley, M.S. A harvester-based calibration system for cotton yield monitors. In Proceedings of the 2015 Beltwide Cotton Conference, San Antonio, TX, USA, 5–7 January 2015; National Cotton Council: Memphis, TN, USA, 2015; pp. 635–647. [Google Scholar]
- Wanjura, J.; Pelletier, M.; Holt, G.; Kelley, M. Reliability testing of an on-harvester cotton weight measurement system. In Proceedings of the 2016 Beltwide Cotton Conference, New Orleans, LA, USA, 5–7 January 2016; National Cotton Council: Memphis, TN, USA, 2016; pp. 658–670. [Google Scholar]
- Pelletier, M.G.; Wanjura, J.D.; Holt, G.A. Embedded Micro-controller Software Design of a Cotton Harvester Yield Monitor Calibration System. AgriEngineering 2019, in press. [Google Scholar] [CrossRef]
- Pelletier, M.G.; Wanjura, J.D.; Holt, G.A. Man-machine-interface Software Design of a Cotton Harvester Yield Monitor Calibration System. AgriEngineering 2019. forthcoming. [Google Scholar] [CrossRef]
- Pelletier, M.G.; Wanjura, J.D.; Holt, G.A.; Funk, P.A. Methods for Protecting a Personal Computer and Data Acquisition Electronics Installed on Mobile Equipment. AgriEngineering 2019, 1, 2. [Google Scholar] [CrossRef]
- Sallen, R.P.; Key, E.L. A Practical Method of Designing RC Active Filters. IRE Trans. Circuit Theory 1955, 2, 74–85. [Google Scholar] [CrossRef]
Figure 1.
The printed circuit artwork for a vehicular load-dump spike-resistant hydraulic controller and precision 22-bit analog-to-digital converter that forms the heart of the cotton harvester’s basket weighing system. Section A is the analog sub-section, section B is the digital microcontroller section and section C is the power regulation and output solenoid drivers. The air points to the separation of the ground plane that provides isolation for the sensitive analog section from the noise in the digital section.

Figure 2.
The printed-circuit-board, PCB for a vehicular load-dump spike-resistant hydraulic controller and precision 22-bit analog-to-digital converter that forms the heart of the cotton harvester’s basket weighing system.
Figure 2.
The printed-circuit-board, PCB for a vehicular load-dump spike-resistant hydraulic controller and precision 22-bit analog-to-digital converter that forms the heart of the cotton harvester’s basket weighing system.

Figure 3.
The schematic for a vehicular load-dump spike-resistant interface between the harvester’s high-voltage, high-noise 12 Volt-Direct-Current, VDC, power to the systems low-noise linear regulator that was used to convert from the harvester’s 12 VDC power to the system’s first voltage regulation 11.5 VDC stage. Component values for this figure provided in Table 1.

Figure 4.
The schematic of a very low-noise linear regulator that was used to convert from the system’s 11.5 VDC first stage power to the system’s precision 5 V stage. Component values for this figure provided in Table 2.
Figure 4.
The schematic of a very low-noise linear regulator that was used to convert from the system’s 11.5 VDC first stage power to the system’s precision 5 V stage. Component values for this figure provided in Table 2.

Figure 5.
The schematic of the third-stage low-noise linear regulator that was used to convert from the system’s second stage 5 VDC power to the digital 3.3 VDC supply to the micro-controller. Component values for this figure provided in Table 3.
Figure 5.
The schematic of the third-stage low-noise linear regulator that was used to convert from the system’s second stage 5 VDC power to the digital 3.3 VDC supply to the micro-controller. Component values for this figure provided in Table 3.

Figure 6.
The schematic for the Analog Devices precision voltage references (ADR4520) that were used to provide both the 2.0 V reference (a), as well as the 3.3 V power to supply all the analog integrated circuits (b). Component values for this figure are provided in the Table 4.
Figure 6.
The schematic for the Analog Devices precision voltage references (ADR4520) that were used to provide both the 2.0 V reference (a), as well as the 3.3 V power to supply all the analog integrated circuits (b). Component values for this figure are provided in the Table 4.

Figure 7.
The schematic of the LC filters that were used to help isolate the analog plane from the rest of the digital circuits on the printed circuit board. Component values for this figure provided in Table 5.
Figure 7.
The schematic of the LC filters that were used to help isolate the analog plane from the rest of the digital circuits on the printed circuit board. Component values for this figure provided in Table 5.

Figure 8.
The schematic of the bridge amplifier that is connected directly to the bridge-style pressure sensor. Component values for this figure are provided in Table 6.
Figure 8.
The schematic of the bridge amplifier that is connected directly to the bridge-style pressure sensor. Component values for this figure are provided in Table 6.

Figure 9.
The schematic of the two stage unity-gain Sallen–Key low-pass filters [22] that are cascaded in series, as the instrumentation section’s main noise rejection filter that immediately follows the bridge amplifier section. Component values for this figure provided in Table 7.

Figure 10.
Filter response that achieved greater than 80 dB noise-rejection roll-off for the frequency response of both stages of this filter as configured per the schematic in Figure 9.
Figure 10.
Filter response that achieved greater than 80 dB noise-rejection roll-off for the frequency response of both stages of this filter as configured per the schematic in Figure 9.

Figure 11.
The schematic design for the 22-bit analog-to-digital converter, MCP3553, that is used as the final section of the analog subsection. Component values for this figure provided in Table 8.
Figure 11.
The schematic design for the 22-bit analog-to-digital converter, MCP3553, that is used as the final section of the analog subsection. Component values for this figure provided in Table 8.

Figure 12.
The schematic of the low-voltage serial-to-RS232 converter that was used to communicate between the micro-controller and the industrial PC in the harvester’s cab that provided the operator interface. Component values for this figure are provided in Table 9.
Figure 12.
The schematic of the low-voltage serial-to-RS232 converter that was used to communicate between the micro-controller and the industrial PC in the harvester’s cab that provided the operator interface. Component values for this figure are provided in Table 9.

Figure 13.
The schematic of the micro-controller that provided control of the feedback control system used to lift the harvester’s basket to the weigh position as well as provide the control and interface to the system’s 22-bit ADC and communication back to the industrial PC in the harvester’s cab which provided the operator interface. Component values for this figure are provided in Table 10.

Figure 14.
The schematic detail for one of the Omron solid-state relays, SSR (G3VM), that were used to drive the hydraulic solenoids that were plumbed into the tractor’s basket hydraulic lift cylinders. Component values for this figure are provided in Table 11.
Figure 14.
The schematic detail for one of the Omron solid-state relays, SSR (G3VM), that were used to drive the hydraulic solenoids that were plumbed into the tractor’s basket hydraulic lift cylinders. Component values for this figure are provided in Table 11.

Figure 15.
The mounting location of the two limit switches, inset box A in both images, that let the micro-controller know when the basket is in the weigh position. The arrow in the image (a) is pointing to the roller arm on the second, final destination, limit switch that senses when the basket passes this location and has arrived at its target weighing height. Large view (b) shows where on the harvester the limit switch is mounted.


Table 1.
This table holds the components utilized in the schematic detailed in Figure 3.
Table 1.
This table holds the components utilized in the schematic detailed in Figure 3.
| Qty | Value | Parts | Part # | Vendor | Description/Package |
|---|---|---|---|---|---|
| 1 | 15 µF (100 V) | C7 | C5750X7S2A156M250KB | TDK Corp. | Capacitor, 2220 |
| 2 | 15 µF (35 V) | C38, C39 | C3216JB1V156M160AC | Panasonic Elec. | Capacitor, 1206 |
| 1 | 47 µF (35 V) | C37 | T495X476K035ATE300 | Kemet | Capacitor, 2917 |
| 2 | 10 Ohms (½ Watt) | R23, R24 | ERJ-14YJ100U | Panasonic | Resistor |
| 4 | 100 µH (250 mA) | L1, L2, L3, L4, L5, L6 | BRL3225T101K | Taiyo Yuden | Inductor |
| 1 | F8 | 1206L025YR | Littlefuse | 16 V, 250 mA hold, 500 mA trip resettable fuse | |
| 1 | AUML1 | V18AUMLA2220H | Littlefuse | varistor: 18 V cont, 25 joule load dump, |
Table 2.
List of the components utilized in the schematic detailed in Figure 4.
Table 2.
List of the components utilized in the schematic detailed in Figure 4.
| Qty | Value | Parts | Part # | Vendor | Description/Package |
|---|---|---|---|---|---|
| 1 | 0.1 µF (50 V) | C44 | CL21B103KBANNNC | Samsung Elec. | Capacitor, 805 |
| 2 | 2 µF (low ESR) | C29, C34 | T55P335M010C0500 | Vishay Sprague | Capacitor, Low ESR |
| 3 | 15 µF (16 V) | C1, C18, C43 | C2012JB1C156M125AC | TDK Corp. | Capacitor |
| 2 | 10 Ohms (¼ Watt) | R6, R18 | RC1206FR-0710RL | Yageo | Resistor, 1206 |
| 1 | 10 K (¼ Watt) | R1 | RNCP0805FTD10K0 | Stackpole Elec. | Resistor, 0805 |
| 1 | 2.61 K (0.1 Watt) | R2 | RN73C2A2K61BTDF | TE Connectivity | Resistor, 0805 |
| 1 | TVS Diode (15 V) | TVS1 | SMAJ15CA-13-F | Diodes Inc. | |
| 1 | U$6 | ADP7104-ADJ | Analog Devices | Voltage regulator |
Table 3.
List of the components utilized in the schematic detailed in Figure 5.
Table 3.
List of the components utilized in the schematic detailed in Figure 5.
| Qty | Value | Parts | Part # | Vendor | Description/Package |
|---|---|---|---|---|---|
| 2 | 0.1 µF (50 V) | C22, C25 | CL21B103KBANNNC | Samsung Elec. | Capacitor, 0805 |
| 1 | 15 µF (16 V) | C2 | C2012JB1C156M125AC | TDK Corp. | Capacitor |
| 1 | U$4 | ADP7104-3V3 | Analog Devices | Voltage regulator |
Table 4.
List of the components utilized in the schematic detailed in Figure 6.
Table 4.
List of the components utilized in the schematic detailed in Figure 6.
| Qty | Value | Parts | Part # | Vendor | Description/Package |
|---|---|---|---|---|---|
| 2 | 1 µF (10 V) | C16, C20 | CC0805KKX7R6BB105 | Yageo | Capacitor, 0805 |
| 2 | 10 µF (10 V) | C19, C21 | CL21A106KPFNNNG | Samsung Elec. | Capacitor, 0805 |
| 1 | U3 | ADR4520 | Analog Devices | Voltage reference | |
| 1 | U4 | ADR4533 | Analog Devices | Voltage reference |
Table 5.
This table holds the components utilized in the schematic detailed in Figure 7.
Table 5.
This table holds the components utilized in the schematic detailed in Figure 7.
| Qty | Value | Parts | Part # | Vendor | Description/Package |
|---|---|---|---|---|---|
| 2 | 15 µF (16 V) | C33, C49 | C2012JB1C156M125AC | TDK Corp. | Capacitor |
| 6 | 100 µH (250 mA) | L9, L10, L11, L12, L13, L14 | BRL3225T101K | Taiyo Yuden | Inductor |
Table 6.
List of the components utilized in the schematic detailed in Figure 8.
Table 6.
List of the components utilized in the schematic detailed in Figure 8.
| Qty | Value | Parts | Part # | Vendor | Description/Package |
|---|---|---|---|---|---|
| 1 | 0.1 µF (50 V) | C32 | CL21B103KBANNNC | Samsung Elec. | Capacitor, 805 |
| 1 | 249 Ohms (1/8 Watt) | R11 | ERA-6AEB2490V | Panasonic Elec. | Resistor, 0805 |
| 1 | U5 | AD8226 | Analog Devices | Bridge amplifier |
Table 7.
List of the components utilized in the schematic detailed in Figure 9.
Table 7.
List of the components utilized in the schematic detailed in Figure 9.
| Qty | Value | Parts | Part # | Vendor | Description/Package |
|---|---|---|---|---|---|
| 4 | 10 µF (10 V) | C24, C27, C28, C31 | CL21A106KPFNNNG | Samsung Elec. | Capacitor, 0805 |
| 1 | 20.2 K (1/8 Watt) | R13, R14, R15 | ERA-6AEB2052V | Panasonic Elec. | Resistor, 0805 |
| 1 | 80.6 K (1/8 Watt) | R21 | ERA-6AEB8062V | Panasonic Elec. | Resistor, 0805 |
| 1 | U$8 | CS3002 | Cirrus Logic | Precision 22-bit ADC |
Table 8.
List of the components utilized in the schematic detailed in Figure 11.
Table 8.
List of the components utilized in the schematic detailed in Figure 11.
| Qty | Value | Parts | Part # | Vendor | Description/Package |
|---|---|---|---|---|---|
| 2 | 0.1 µF (50 V) | C46, C48 | CL21B103KBANNNC | Samsung Elec. | Capacitor, 0805 |
| 1 | 10 µF (10 V) | C47 | CL21A106KPFNNNG | Samsung Elec. | Capacitor, 0805 |
| 1 | 330 Ohms (1/8 Watt) | R27 | CRGCQ0805F330R | TE Connectivity | Resistor, 0805 |
| 1 | U$7 | MCP3553 | Microchip | Precision 22-bit ADC |
Table 9.
List of the components utilized in the schematic detailed in Figure 12.
Table 9.
List of the components utilized in the schematic detailed in Figure 12.
| Qty | Value | Parts | Part # | Vendor | Description/Package |
|---|---|---|---|---|---|
| 5 | 0.1 µF (50 V) | C3, C6, C11, C12, C36 | CL21B103KBANNNC | Samsung Elec. | Capacitor, 0805 |
| 1 | U1 | MAX3232 | Maxim Semi. | RS232 level shifter |
Table 10.
List of the components utilized in the schematic detailed in Figure 13.
Table 10.
List of the components utilized in the schematic detailed in Figure 13.
| Qty | Value | Parts | Part # | Vendor | Description/Package |
|---|---|---|---|---|---|
| 1 | 1 µF (10 V) | C10 | CC0805KKX7R6BB105 | Yageo | Capacitor, 0805 |
| 1 | 10 µF (10 V) | C26 | CL21A106KPFNNNG | Samsung Elec. | Capacitor, 0805 |
| 1 | 10 K (¼ Watt) | R5 | RNCP0805FTD10K0 | Stackpole Elec. | Resistor, 0805 |
| 2 | 100 µH (250 mA) | L7, L8 | BRL3225T101K | Taiyo Yuden | Inductor |
| 1 | PIC32MX120F032B | PIC32MX120F032B | Microchip | 32-bit micro-controller |
Table 11.
List of the components utilized in the schematic detailed in Figure 14.
Table 11.
List of the components utilized in the schematic detailed in Figure 14.
| Qty | Value | Parts | Part # | Vendor | Description/Package |
|---|---|---|---|---|---|
| 1 | 2.61 K (0.1 Watt) | R31 | RN73C2A2K61BTDF | TE Connectivity | Resistor, 0805 |
| 1 | OPTO SS Relay | G3VM-61E1 | Omron | Optoisolating solid-state relay |
© 2019 by the authors. Licensee MDPI, Basel, Switzerland. This article is an open access article distributed under the terms and conditions of the Creative Commons Attribution (CC BY) license (http://creativecommons.org/licenses/by/4.0/).
Share and Cite
MDPI and ACS Style
Pelletier, M.G.; Wanjura, J.D.; Holt, G.A. Electronic Design of a Cotton Harvester Yield Monitor Calibration System. AgriEngineering 2019, 1, 523-538. https://0-doi-org.brum.beds.ac.uk/10.3390/agriengineering1040038
AMA Style
Pelletier MG, Wanjura JD, Holt GA. Electronic Design of a Cotton Harvester Yield Monitor Calibration System. AgriEngineering. 2019; 1(4):523-538. https://0-doi-org.brum.beds.ac.uk/10.3390/agriengineering1040038
Chicago/Turabian StylePelletier, Mathew G., John D. Wanjura, and Greg A. Holt. 2019. "Electronic Design of a Cotton Harvester Yield Monitor Calibration System" AgriEngineering 1, no. 4: 523-538. https://0-doi-org.brum.beds.ac.uk/10.3390/agriengineering1040038