1. Introduction
Air quality concerns continue to propagate globally due to their negative impacts on animal, human, and ecosystem health. Particulate matter (PM) is a specific constituent of air pollution that has increasingly garnered concern due to the growing body of scientific evidence of the impact it has on the environment and human health [
1,
2,
3,
4,
5]. PM is broken down into categories based on the size fractions of the particles. Coarse PM (PM
10) is defined as having an aerodynamic diameter equal to or less than 10 μm, while fine PM (PM
2.5) has an aerodynamic diameter of 2.5 μm and smaller. Of the two size fractions, PM
2.5 is of greater concern with respect to human health effects, as the smaller diameter of the particles allows it to penetrate deeper into the lungs where it becomes difficult for the body to expel. When PM
2.5 reaches the lower regions of the lungs, the particles can become embedded in the tissues of the bronchi and bronchioles. The toxins often carried with the fine particles can then diffuse into the bloodstream via the alveoli [
6].
PM emissions can be further categorized as either primary or secondary based on the source and formation process of the particles. Primary particles are released directly by a source as a particle and include, for example: biomass burning emissions, diesel exhaust, and dusts from soil [
7,
8]. Secondary particles are formed in the atmosphere through chemical reactions with gases containing sulfate, nitrate, ammonia, and various organic compounds. This process is often referred to as gas-to-particle conversion and occurs by either condensation or direct nucleation. Condensation is the process by which mass is added onto an existing particle, and nucleation is where a precursor gas is converted into a fine aerosol [
9]. The precursor gases are either acidic or basic and neutralize in the presence of each other, forming either secondary organic aerosols (SOAs) or secondary inorganic aerosols (SIAs), depending on the nature of the precursor gases. The formation of SOAs and SIAs results in aerosols that are small in diameter and typically fall within the PM
2.5 size fraction.
In an animal housing and production facility, the formation of secondary aerosols is dominated by the neutralization of basic ammonia (NH
3) gas with acidic sulfur and nitrogen gases [
9,
10]. Enclosed animal production facilities, which are common in Canadian animal husbandry operations, provide an environment suitable for the generation and accumulation of ammonia and acid gases. Ammonia is produced from the microbial breakdown of the nitrogen-laden manure and excreta and, as such, is typically found in higher concentrations inside the barn or manure storage facilities than after land application outdoors or when composted [
11,
12]. Ammonia emissions are, however, not limited to agricultural practices alone. For example, in Canada, the mining, manufacturing, oil and gas, and power generation sectors also contribute to emissions [
13].
Acid gases include sulfuric acid (H
2SO
4), nitric acid (HNO
3), and hydrochloric acid (HCl), all of which are transferred into the barn from the exterior [
4] or are the reaction products of gases released from treated water and/or feed [
14]. When NH
3 reacts with any of these acid gases, it creates ammonium salts that are classified as SIAs [
14,
15]. When these gases neutralize and form aerosols, the resulting SIAs include: ammonium sulphate ((NH
4)
2SO
4), ammonium bisulfate (NH
4HSO
4), ammonium nitrate (NH
4NO
3), and ammonium chloride (NH
4Cl) [
7] In poultry production, the formation mechanisms of these reactions are dependent on the environmental conditions within the animal housing unit, the exterior environmental conditions, seasonal variability, and the animal’s stage of growth [
14].
Concentration exposure standards and limits for PM, which are specific to air quality, vary from country to country and are set with the intention of protecting human health and reducing the impact on ecosystems [
1]. The 24-h mean exposure standard for PM
2.5 has been set by the World Health Organization and the European Commission at 25 μg/m
3 [
16,
17], while in Canada and the United States the 24-h PM
2.5 mean exposure concentration is currently set at 27 μg/m
3 and 35 μg/m
3, respectively [
18,
19,
20].
While the 24-h mean exposure concentration for PM
2.5 has been established by various governing bodies, the emissions of PM
2.5 from animal production facilities are not restricted by regulations in Canada, Europe [
21], or the US [
22]. Quantifying the extent of PM
2.5 emissions from agriculture can help to strengthen the overall understanding of its impact on human health and the surrounding environment. Currently, secondary PM
2.5 from agricultural emission sources is not estimated by Canadian governing bodies and therefore has not been directly reported in pollution summary reports [
13]. PM and NH
3 emissions from the agriculture sector are currently determined based on monitoring data and emission factors [
13]. For poultry production specifically, PM
2.5 data presented in the Air Pollution Emission Inventory (APEI) report is based on emission factors developed previously [
23,
24]. Animal production estimates of PM
2.5 from non-poultry species are determined from primary dust measurements that do not specify secondary emissions or precursor gas species. In Canada, agriculture has contributed 94% of the country’s ammonia emissions according to the national pollutant emission inventories since 2017 [
13,
25]. If sufficient acid gases are present during the release of ammonia, there is a significant potential that the impact from the generated SIA on the PM
2.5 regional and national inventories is underestimated [
1]. The European Union has reported similar ammonia emission’s to Canada. In 2015, it was reported that 92% of ammonia emissions across the 28 countries were from the agricultural sector [
26]. From a global health perspective, the World Health Organization (WHO) estimated that a total of 4.2 million premature deaths were caused by ambient PM
2.5, which is an increase from the 3.1 million deaths estimated in 2010 [
5,
27]. This significant increase in death signals a growing need to continually monitor and report emissions from all sources in an effort to understand source apportionment and ultimately reduce global mortalities.
Due to the complex manner in which secondary aerosols form, there is a need to develop new, or modify existing, measurement tools for monitoring and analyzing PM
2.5 emissions from barn environments with high aerosol concentrations. By doing so, a greater understanding of the formation and behavior of the generated SIAs can be developed. When sampling PM in the atmosphere, annular denuder systems (ADS) are an approved system of the United States Environmental Protection Agency (US EPA) that are used to measure aerosol contaminants. Prescribed methodologies for using the ADS apparatus are outlined by [
28,
29]. The ADS is a dual-purpose measurement device with the etched glass denuders collecting the acid and base gaseous species and the dual stage filter pack, which is located after the last denuder, collecting the fine particulates. Typically, the ADS is deployed in the ambient atmosphere where low concentrations of both the acid and base gases are expected. However, inside animal production facilities, where NH
3 concentrations are typically much greater than the acid gas concentrations, the ADS apparatus needs to be modified in order to measure concentrations of both acid and base gases as well as capture PM
2.5 in the dual stage filter pack. As part of an ongoing study of emissions from within poultry houses, the behavior of particulates was explored using the US EPA prescribed ADS set-up and compared to the adapted methodology established by [
14]. Applications outside of this specific scope, e.g., pesticide application and its impact on the applicator [
30,
31], manure and compost applications [
11], and emission measurements near or inside industrial facilities not related to the agriculture sector, can also benefit from this exploration.
Under the US EPA-prescribed ADS method, either two or three denuders are connected in series, followed by a dual stage filter pack, as depicted in
Figure 1 below. Sampling occurs over the course of hours depending on the environment but is typically in the order of 12 to 48 h.
Due to the high NH
3 concentrations in poultry barns, which can exceed 25 ppm (equivalent to 19 × 10
3 μg/m
3 when converted at standard temperature and pressure), the number of denuders collecting basic gases needs to be increased while simultaneously decreasing the sampling time [
14,
23,
24]. As a result, the ADS set-up and methodology presented in previous works [
14] consisted of connecting nine annular denuders in series with the first two denuders coated with a basic solution to capture acid gases, followed by seven acid coated denuders to capture the elevated concentrations of NH
3 and finishing with the dual stage filter pack to collect PM [
14,
24]. It has previously been shown that seven acid-coated denuders were required when ammonia concentrations were upwards of 25 ppm and when using a sampling period of one hour without having any gaseous ammonia leaving the system [
14]. Due to the physical length of the adapted system, four denuders were connected end-to-end followed by a Teflon U-bend connecting the next four denuders and followed by a second Teflon U-bend to connect the last denuder, followed lastly by the dual stage filter pack [
14]. This allowed the ADS to be housed inside a protective cabinet during sampling inside, or adjacent to, a poultry facility.
Figure 2 below depicts this adapted ADS set-up.
While both modified ADS set-ups can adequately capture the acid and base gases, the issue of accurately measuring PM
2.5 has not been established with more than the prescribed number of denuders in series. The US EPA prescribed methodology limits the number of denuders connected in series to two or three, as longer sampling trains allow more time for particulate matter to diffuse, absorb, and deposit onto the glass denuder walls. In the ADS set-up using the nine denuders shown in
Figure 2, there is also the possibility of particles collecting in the U-bends before they reach the filter pack due to inertial impaction. Hence, the primary focus of this study was to evaluate the behavior of PM
2.5 aerosols through the ADS set-ups prescribed by the US EPA (
Figure 1) and in previous works (
Figure 2).
2. Materials and Methods
To assess the behavior of PM
2.5 aerosol deposition within the ADS, based on the set-up design as per
Figure 1 and
Figure 2 above, an experiment was designed to assess aerosol concentration on the individual surfaces. Previous field trials using the 9-ADS sampling configuration shown above in
Figure 2 demonstrated that, in poultry housing facilities, the concentration of chloride aerosols was significant when compared to sulfur and nitrate aerosols [
14,
32]. While NH
3 gas is prevalent in and around poultry housing facilities [
9,
10,
11,
12,
13,
14,
33,
34,
35], the presence of chloride anion aerosols were found to contribute approximately 90% of the inorganic aerosol species on average inside a broiler facility [
32].
A PALAS aerosol generator (model AGK 2000) was used with the required salt solution of potassium chloride (KCl) at a recommended concentration of 20% diluted in MilliQ water [
36]. Due to the significant concentration of chloride aerosols found in poultry housing facilities [
32], the KCl solutions required by the PALAS aerosol generator was able to act as a surrogate source of aerosols in a laboratory setting to demonstrate particulate behavior within the adapted ADS. The aerosol generator nebulizes the liquid by means of a binary atomizer nozzle. Pressure, to control the flow, is set by the user and can range between 0 and 400 kPa. For this series of experiments, the pressure was set at 250 kPa to produce a flow rate of approximately 7 L/min. At this flow rate and salt solution concentration, the diameters of the particles generated ranged from 0.26 μm to 12.41 μm, with 98% of the aerosols being less than 2.5 μm according to particle distribution information provided by PALAS [
36]. As KCl is neither a strong acidic nor basic solution, meaning that it is not attracted to either surface coating treatment, the aerosols would presumably not interact with the denuder walls based on the coating solution used.
The outlet of the aerosol generator was placed inside a large, custom built mixing chamber (0.94 m length by 0.42 m width by 0.51 m height), which used two internal fans to thoroughly mix the generated aerosols with incoming ambient air. Ambient air from within the lab was used to mix with the aerosol gas stream as there was no existing sources of particulates or pollutants. The ambient air, prior to entering the mixing chamber was passed through a HEPA filter (model Aerostar 2247, >99.97% efficiency at 0.3 μm) to remove any ambient particles. A 3 m Teflon sampling line was used to draw air from the mixing chamber to the inlet of the ADS system at atmospheric pressure. The length of the sampling line was minimized as much as possible but was restricted by the physical layout of the lab space and would also mimic the general layout of an ADS taking measurements at an animal housing facility.
The procedure used for coating the denuders as well as the subsequent sampling, extraction, and analysis methods followed the US EPA Compendium Methods IP-9 and IO-4.2 [
28,
29]. One modification to this methodology was the use of 1% phosphorous acid solution, in lieu of the prescribed citric acid solution, to capture gaseous NH
3. It was demonstrated that phosphorous acid to be more effective at neutralizing ammonia gas in high concentration environments [
14]. The acid gases were captured on the denuder walls using a sodium carbonate solution as per the US EPA Compendium instructions. All ADS trials used a URG 2.5 μm cut-off cyclone, located at the inlet to the ADS, to remove particles with diameters larger than the desired 2.5 μm.
Every ADS trial employed a dual stage filter pack at the end of the sampling train to capture the particulates. The first filter consisted of a 1 μm Fluoropore Membrane Teflon Filter that collected all particles except for NH4Cl and NH4NO3 as these two aerosols can disassociate back into their precursor gaseous species. The second filter, a Whatman 0.8 μm Nylon membrane filter, was then used to trap these two particulate species. A URG-3000-02C Mass Flow Accumulator (dry gas meter) was connected to the filter pack to measure the volume of air passing through the ADS. To complete the ADS, a URG-3000-02BAM Outdoor Sampling pump was used to draw the aerosol laden air from the mixing chamber in through the ADS and was connected to the outlet of the dry gas meter and set to a constant flow rate of 10 L/min for the duration of each trial. Each trial conducted in the lab was done under full ambient room lighting.
Two ADS denuder configurations were evaluated for particle behavior and included: three denuders in a straight series, as prescribed by the US EPA (
Figure 1) and nine denuders in series as used by [
14] with two Teflon U-bends (
Figure 2) To determine the effects that the U-Bends and coating treatments had on the potential to intercept particles on each surface type, each denuder configuration was tested with all denuders coated with either the acid or base coating along with a control case that used no coating on any of the denuders. Each combination of denuder train length and coating was used to measure PM
2.5 concentrations in triplicate to assess variability in the results.
Sampling for each trial occurred over a one-hour period during the day inside the lab. Three trials were run during a single day grouping together the same coating type. When each trial was completed, the extractions from the denuders, filters, and U-bends (when applicable) were analyzed using a Dionex Ion Chromatograph (IC) Model ICS-2000 accompanied by a Dionex AS-40 Automated Sampler. The Anion column was a Dionex IonPac AS18 4 x 250 mm, while the Cation column was a Dionex IonPac CS16 5 x 250 mm. During the analysis of anions, a 25 mM potassium hydroxide eluent was used, and for cation analysis, a 30 mM methanesulfonic acid eluent was used. All chemicals used to mix the eluent solutions were sourced from Fisher Scientific. Using a series of known ion standard dilutions, calibration curves were established to determine the identity and concentrations of ions in the extracted samples. The ion standard used for calibration was the Dionex Seven Anion Standard II solution prepared by Thermo Scientific.
While using the PALAS aerosol generator, solidified salt crystals can form on the various surfaces and inside the mixing chamber. To ensure this build-up was not causing any blockages within the sampling system, the Teflon tube, cyclone, filter casing, and inner chamber walls were checked for salt build-up after each individual trial and were cleaned if necessary. At the end of each triplicate trial (one day of sampling), all surfaces of the chamber were cleaned with deionized water and dried.
After sampling was complete, any Cl
− particulates that adhered to the denuder walls and collected on the filters were extracted in preparation for analysis using the ion chromatograph. The denuder surfaces were extracted using 20 mL of MilliQ water as per the methodology developed in the previous research that was conducted [
14]. The extraction fluid was then stored in individual 30 mL Teflon containers (one per each denuder) and refrigerated until analysis using the IC could be conducted, which was approximately 1–2 weeks after the trial was completed. Each filter was subsequently extracted following the US EPA Compendium Methods IP-9 and IO-4.2 procedure and were then stored [
28,
29]. As the Teflon U-Bends are not part of the standard ADS set-up, the extraction method used was similar to that used for the denuders using 20 mL of MilliQ water to flush any particles that were deposited on the surface of the U-bends. The rinsing fluid was then stored in individual 30 mL Teflon containers, refrigerated, and later analyzed using the IC as per the US EPA Compendium Methods IP-9 and IO-4.2 procedure for denuder surface extracts [
28,
29].
After the initial IC results were analyzed, it was determined that the Cl− concentration on the Teflon filters was greater than the standard calibration concentrations. To adjust for this, the filter extraction fluid samples were diluted to 0.1 mL of extraction solution into 100 mL of MilliQ water prior to IC analysis to obtain concentration outputs within the calibration concentration range.
When the experiments were completed, an adaptation of the two ADS designs was tested. A 5-ADS set-up, shown below in
Figure 3, was subjected to the same experimental procedure to determine if adding additional denuders in series, without a Teflon U-bend, would alter the observed trends. This design was tested as it could prove to be a useful adaptation for field trials that require more than three denuders in series. Physical limitations that present themselves during field trials (ex. dimensions of cabinet used to protect the ADS both inside and outside animal housing facilities) are prohibitive to having more than 5 denuders in series without introducing an interruption to the air flow in the form of a Teflon U-bend. The number of denuders available for testing at one given time also presents a challenge when thinking ahead to field trial applications. As outlined earlier, having seven annular denuders in series is ideal for capturing ammonia at a poultry facility. However, a 7-ADS set-up in a single vertical line would not be possible in the field. Therefore, to test the impact of additional denuders in series while respecting the constraints of a field application, a 5-ADS set-up was tested. Additionally, when testing in the field using a 5-ADS set-up, the sampling time would also be reduced to prevent ammonia breakthrough in the system. The sampling time is at the control of the sampler and can therefore be adjusted.
Statistical Analysis
To compare the results between coating types, each coating treatment (acid, base, and no-coating) for each ADS set-up was subjected to a 1-h sampling run, as outlined above, three times. Once the aerosol concentration data were gathered, statistical hypothesis testing was conducted between the means of the chloride aerosol concentrations for each coating treatment. This was done by performing a
t-test for two sample means using Microsoft Excel’s built in data analysis tool. The
t-test was as follows: two samples for unequal variance were used with a 95% confidence interval to compare the mean aerosol concentration of each coating treatment to determine if there was a significant difference. If the
p-value of the
t-test comparison proved significant (
p-value < 0.05) the null hypothesis of no difference could be rejected, suggesting that the means are likely different, therefore indicating that the treatment type had an impact on the aerosol concentrations measured. Once this analysis was completed, the same procedure was used to determine if there was an impact on the aerosol concentration based on the different ADS set-up design and the system elements. The same
t-test and confidence intervals were applied to the analysis. The version of Excel used in the analysis was Microsoft Excel for Mac, Version 16.32 (19120802) [
37].
3. Results
Results from the analysis of Cl
− concentrations following the prescribed US EPA methodology are presented in
Table 1. The table outlines the percentage of Cl
− collected on each system element based on the total Cl
− concentration measured from the ADS as a whole. Presenting the data as a percent Cl
− collected on each surface was done in part due to the high concentrations measured on the Teflon filter and to better illustrate the average concentration of aerosol collected on each system element with respect to the system as a whole. The 3-ADS set-up shows that Cl
− aerosols were found primarily on the Teflon filter for all three coating treatments. The combined percentage of the two filters shows that between 99.3% and 99.5% of the Cl
− aerosol concentration was extracted from these system elements. The remaining Cl
− was distributed across the three denuders, ranging from 0.519% to 0.674%.
The percentage of Cl
− presented in
Table 1 highlights the small percentage of Cl
− collected within each individual denuder (D1 through D3).
Figure 4 shows this information with respect to the distribution of Cl
− across the three denuders by plotting the average percent concentration measured from the three denuders for the given coating type. The plot shows how the Cl
− aerosols are being deposited on the denuder walls within the system before entering the dual-stage filter pack and how the coating type is possibly affecting this behavior. The standard deviations presented in
Table 1 are shown as error bars for each denuder. Where the error bar moves into the negative percent range, only the positive bar has been shown.
The general trend observed in
Figure 4 for the acid and base coated denuders is that D1 is subjected to higher concentrations as compared to D2 and D3. The opposite trend is observed for the denuders with no coating. However, when using the ADS according to the US EPA methodology, the denuders will have either the acid or base coating applied to the denuder walls; therefore, this trend will be of minimal concern.
After the behavior of Cl
− aerosols within the 3-ADS set-up was established, a comparison was made to the methodology used in previous works at poultry housing facilities shown above in
Figure 2 [
14]. The results of the analysis are presented in
Table 2 and
Figure 5. The methodology outlined by [
14] was altered for the purposes of this experiment with all nine denuders being coated with the same treatment for each series of triplicate trials (a phosphorous acid–acid coating, a sodium carbonate base coating, or no coating) to better understand particle deposition on the individual system elements, as was done for the 3-ADS set-up discussed previously.
The percentage of Cl
− presented in
Table 2 similarly highlights the small percentage of Cl
− collected within each individual denuder.
Figure 5 shows this information with respect to the distribution of Cl
− across the nine denuders, as was depicted above for the prescribed ADS set-up. The plot shows how the Cl
− aerosols are being deposited on the denuder walls within the system before entering the two Teflon U-Bends and, finally, it shows the how the coating treatment type may possibly be affecting this behavior.
Upon initial review of the data in
Table 2, the two Teflon U-Bends collected more Cl
− aerosols as compared to the denuder walls across the three coating treatments. The filters, as expected, collected the bulk of the Cl
− at 87.2% of the total on average. As with the 3-ADS set-up, the majority of Cl
− was found on the filters, however, the percentages are lower, ranging from 84.0% to 90.0%. The two U-Bends collected between 7.79% and 12.75% of the Cl
− aerosol and the remaining being found on the denuder surfaces. The denuders collected between 2.25% and 3.26% of the Cl
− aerosol. As with the 3-ADS set-up, there was a greater concentration of Cl
− found on D1 as compared to the remaining denuders and a general decrease in concentration that can be observed in
Figure 5. Having the two U-Bends located within the ADS set-up and an additional six denuders in series reduced the Cl
− concentration found on the filter surfaces by 12.2% on average.
In
Figure 5, the overall observed trend is that Cl
− concentration on the denuder walls is highest for the first denuder but then fluctuates in magnitude in the following denuders, with the last denuder having the smallest fraction collected. It is also apparent that the acid coating on the first denuder in
Figure 5 is removing a larger percentage of aerosols as compared to the other coating treatments and the remaining acid-coated denuders (D2 to D9), as was similarly found with the 3-ADS set-up. The location of the two U-bends is indicated by the dashed vertical lines in
Figure 5 and indicates where the flow path is re-directed 180 degrees through them. It was demonstrated that the U-bends are collecting more Cl
− aerosols as compared to the denuder walls with an average difference of 7.20%.
The results from the Cl
− aerosol concentration deposition on the proposed adapted 5-ADS set-up are presented in
Table 3 and
Figure 6.
The percentage of Cl
− presented in
Table 3 shows the small percentage of Cl
− collected within each individual denuder, as was similarly found with the 3-ADS set-up.
Figure 6 shows how the Cl
− concentration across the five denuders is distributed.
The trends observed using the 5-ADS configuration show similarities with what was observed for the 3-ADS configuration presented previously. The average Cl
− concentration, as a percentage, found on the filters ranged from 98.7% to 99.4%, with the remaining found on the denuders. Similar trends with Cl- aerosol deposition across the five denuders was observed in
Figure 6 as compared to the 3-ADS set-up shown in
Figure 4.
To compare the concentration percentages found on all three set-up designs (3-ADS, 9-ADS, and 5-ADS), the statistical analysis described above in the Methods section was performed looking at the chloride concentrations found on the denuder surfaces.
Table 4 shows the resulting two-tailed
p-values from the
t-tests that were performed to compare two samples with unequal variances and a 95% confidence interval.
Based on the results presented in
Table 4, there were no significant results indicating that the concentration means on the denuder surfaces are not likely to be different due to the coating treatment type with respect to each individual ADS set-up. This information therefore allows an overall average to be used to compare the percent concentrations for each system element across the three design alternatives. The same
t-tests comparing the mean values of unequal variances with a 95% confidence interval were conducted.
Table 5 indicates the resulting
p-values obtained from this analysis.
The results presented in
Table 5 demonstrate significant results indicating that the concentration means on the denuder surfaces are likely to be different due to ADS set-up design. Specifically, the results show that when comparing the system elements based on design set-up, the 9-ADS set-up does appear to have an impact on the aerosol concentration percentage. This is due to the U-Bends and additional denuders in the 9-ADS set-up. This information indicates that there is an impact on aerosol concentration based on the previous 9-ADS design used for gathering data at poultry facilities [
14]. However, there does not appear to be an impact of adding additional denuders in series to the US EPA prescribed ADS set-up as there was no significance in the results comparing the 3-ADS and 5-ADS set-ups, both of which do not have U-Bends.
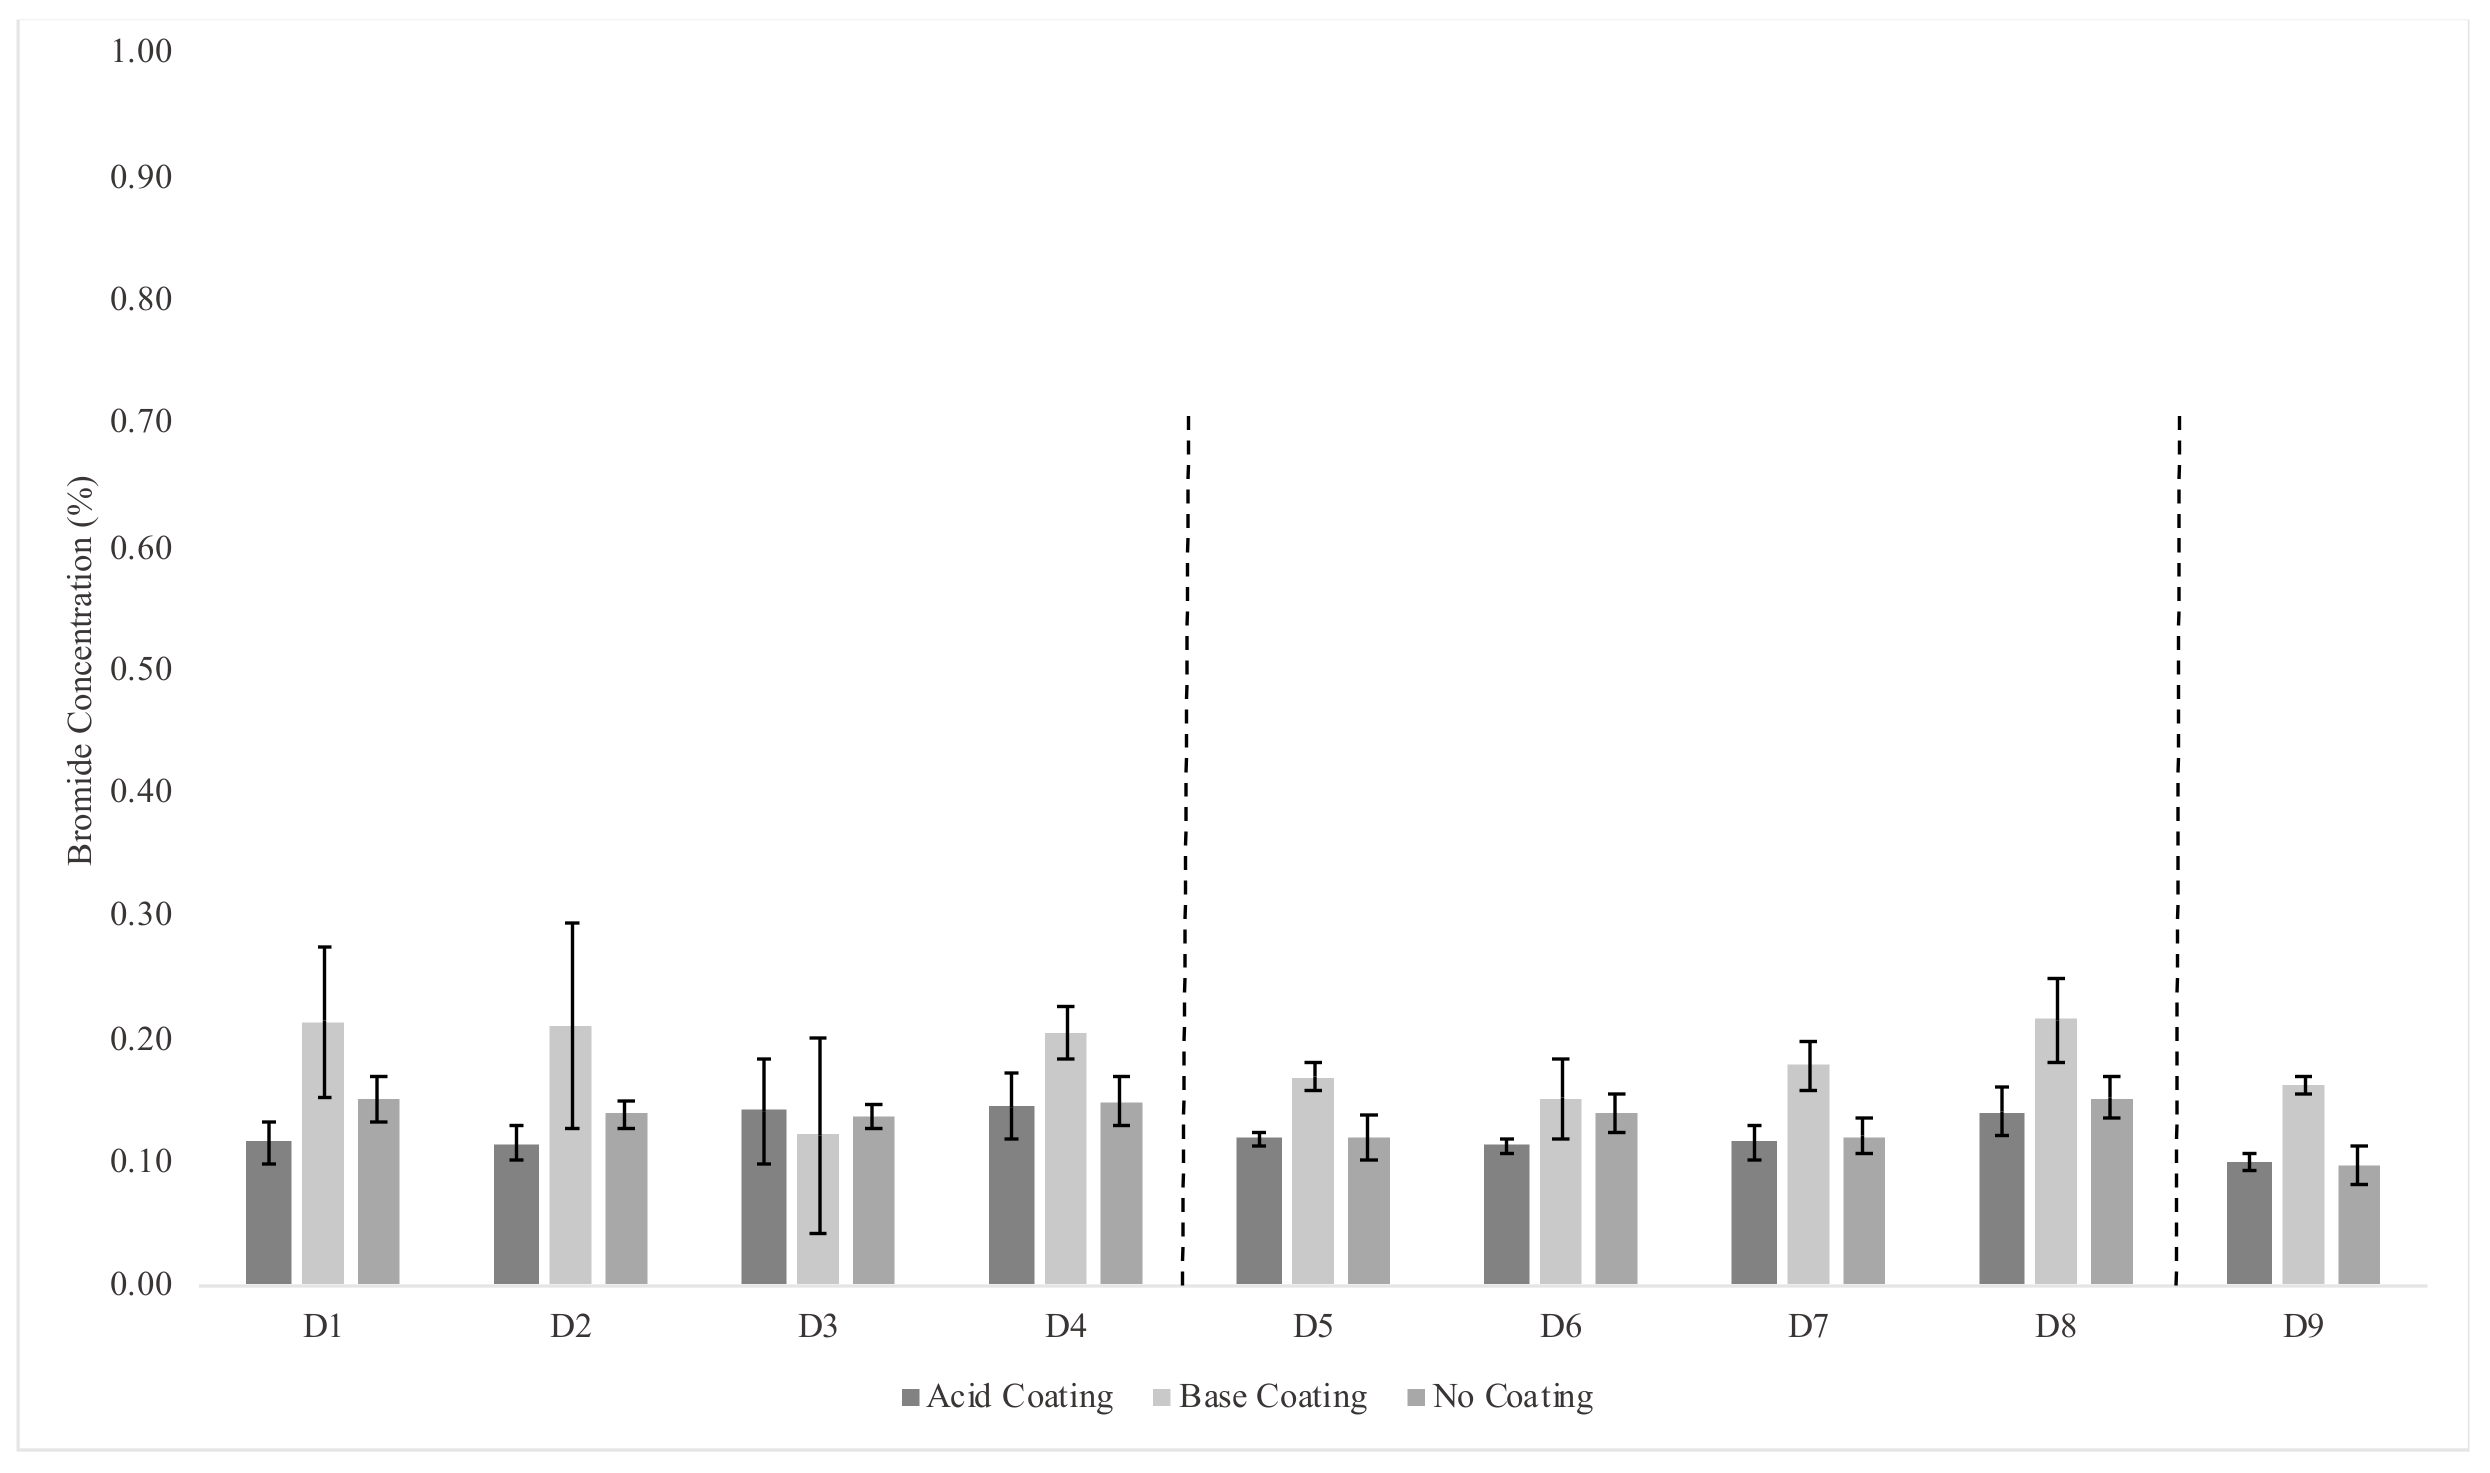
To further explore the behavior of particle deposition on the denuder walls in the 9-ADS configuration, a 20% KBr solution was then used in the PALAS aerosol generator and while replicating the experimental procedure used previously with the KCl solution. While the bromide salt solution is not recommended for use in the PALAS aerosol generator, the bromide anion is one that can be readily identified and measured using the IC with available standards for calibration and was therefore used to infer any differences in behavior that may be attributed to the specific aerosol species. The Br
− percent concentration and distribution across the 9-ADS set-up is shown in
Table 6.
The behavior of the Br
− aerosol shows a difference in the results as compared to the Cl
− and Br
− ion concentrations on the different system element surfaces. The bulk of particle deposition still occurred on the Teflon filter and the two U-bends for both salts. However, the remaining ion deposition on the denuder walls varies between the two aerosols. To better visualize the results, the percent accumulation outlined in
Table 6 is presented in
Figure 7. This graph shows the percentage of ion concentration measured on each denuder surface of the total collected on the denuder wall surfaces for the three different coating treatments.
The overall percent Br
− concentration measured on the denuder walls was less than what was found when using the Cl
− solution, and the overall trend of Br
− deposition across the denuders is more consistent than what was observed with the Cl
− aerosol shown in
Figure 5. The same statistical analysis comparing means between the coating type was also conducted for the Br
− concentrations trials and found that there was significance between the acid and base coating samples, and between the base and no coating samples (
p-values > 0.05). This suggests that the interaction of the Br
− aerosol with the denuder walls coated in the basic solution has a possible impact on the concentrations as compared to the other surfaces.
It was observed with the Cl
− aerosol that the concentrations across the nine denuders decreased from D1 to D9, with the highest concentration being found on the first denuder. This trend was not as apparent for the Br
− aerosol. The reason for the different behaviors of the aerosol salts (KCl vs. KBr) is not readily known, however, as the aerosols are being formed from electrolyte solutions, the possibility for coagulation due to an electrical charge between particles and the coating solutions is possible but was not measured or assessed in this experiment. It was previously demonstrated that the behavior of KCl aerosols with respect to the relationship between charge and ion concentration for this type of aerosol is as follows: the aerosol’s charge increased as the ion concentration increased [
38]. This could indicate that particle charge is playing a role in the KCl aerosol behavior that differentiates it from the KBr aerosol. However, it is not known how KBr behaves as an aerosol with respect to its charge and concentration to determine if this is having an impact.


