Parameter Calibration of Pig Manure with Discrete Element Method Based on JKR Contact Model

College of Engineering, Jiangxi Agriculture University, Nanchang 330045, China
*
Author to whom correspondence should be addressed.
AgriEngineering 2020, 2(3), 367-377; https://0-doi-org.brum.beds.ac.uk/10.3390/agriengineering2030025
Submission received: 6 June 2020
/
Revised: 2 July 2020
/
Accepted: 2 July 2020
/
Published: 6 July 2020
Abstract
:The conversion of pig manure into organic fertilizer has become a research hotspot in agricultural engineering, and many types of pig manure processing machinery have been derived. The discrete element method (DEM) can be used in the research of pig manure processing machinery to study the interaction between pig manure and machinery, which makes the research more direct and accurate. In order to introduce the discrete element method into the research of pig manure processing machinery, a reliable parameter basis for discrete element simulation is necessary, taking the angle of repose (AoR) as the reference and based on the hertz-mindlin with JKR contact model and Plackett–Burman experiment design. Three parameters with significant influence on the AoR are screened out from nine parameters related to pig manure. By conducting Box–Behnken experiment design, the quadratic polynomial regression equation between the AoR and three significant parameters is established. According to the parameters predicted by the quadratic polynomial regression equation, the discrete element simulation of AoR is conducted. The simulation result of AoR (38.54°) is close to the experimental result (38.65°) with a relative error of 0.28%, indicating that the regression equation can predict the relevant parameters of pig manure according to the AoR.
1. Introduction
With the development of animal husbandry and large-scale pig breeding, pig manure emission density has increased in recent years. A large amount of pig manure seriously affects the air quality of pig houses and the health of pigs. In addition, it was discharged directly causing pollution to the human living environment, i.e., the atmosphere, soil, and water [1]. To treat the pollution and recycle pig manure, pig manure processing machinery has gradually become a research hotspot [2,3,4]. However, the current research on pig manure processing machinery is not comprehensive. For instance, in the study of pig manure fermenting machine, the finite element method simulation is used to study the fermenting condition of pig manure [5], but the finite element method can only study the temperature of fermenting machine. Indeed, the temperature of pig manure cannot be studied directly because it may reduce the accuracy of simulation. For another example, in the study of the equipment for drying pig manure, it is also difficult to study the drying degree and the motion curve of pig manure [6]. Taking the discrete element method (DEM) as the study method, it can directly simulate the speed, force, temperature, and motion curve of pig manure, making the research more direct and intuitive. In order to introduce the discrete element method into the relevant research of pig manure processing machinery, the first step is to calibrate the discrete element parameters of pig manure, which provides a research idea and the parameter basis of DEM for the research of pig manure processing machinery.
As a typical discrete material, pig manure is suitable for DEM research. Considering the wet and viscous characteristics of pig manure, JKR contact model is suitable for the simulation study of pig manure. JKR particle contact model, proposed by Johnson et al. [7], introduced the concept of Surface energy between particles. It is applicable to simulate Van der Waals’ force between micro particles or cohesion between wet particles. Since the JKR contact model is proposed, it has been introduced into the simulation study of different kinds of particles by researchers, and the simulation results of these studies are consistent with the experimental results, such as the discrete element model parameter calibration for cohesive soils [8], the study on mechanical drag reduction in paddy field operation [9], discrete element parameter calibration of vermicomposting nursery substrate [10], simulation and experiment of spin-jet lotus root excavator [11], simulation and experiment of mixing efficiency of a concrete ribbon mixer [12] etc.
Angle of repose (AoR) refers to the slope of a material accumulation body when material is naturally accumulated. Since the formation and value of AoR are closely related to the property parameters of materials, AoR is frequently used as the evaluation index of parameter calibration test to represent the contact mechanical behavior of materials [13,14,15,16,17]. As a viscous and wet material, pig manure shows its contact mechanical parameters change with the change of water content, and which can be reflected by the change of AoR. Thus, with water content as the medium, the change of AoR can reflect the change of contact parameters of pig manure, and finally realize the discrete element parameters calibration of pig manure. In this paper, based on the literature of discrete element parameter calibration, combining with the contour of a pig manure accumulation body, a discrete element parameter calibration method based on the AoR is proposed. With JKR particle contact model, the discrete element parameters are calibrated.
2. Materials and Methods
2.1. Material of Pig Manure Accumulating Experiment
In pig manure accumulating experiment, the pig manure was taken from Yonghui pig farm in Jiangxi Province of China, the pigs were hybrid sows, the average weight of pig was about 200 kg, and the feed was mixed feed for pregnant sow.
In this research, Minitab 2016 was used to carry out the Plackett-Burman experiment design and Box-Behnken experiment design. Then, EDEM 2.7, the discrete element simulation software, was used to simulate the parameters in the table of experiment design. So, the simulation result of AoR was obtained.
2.2. Experimental Equipment
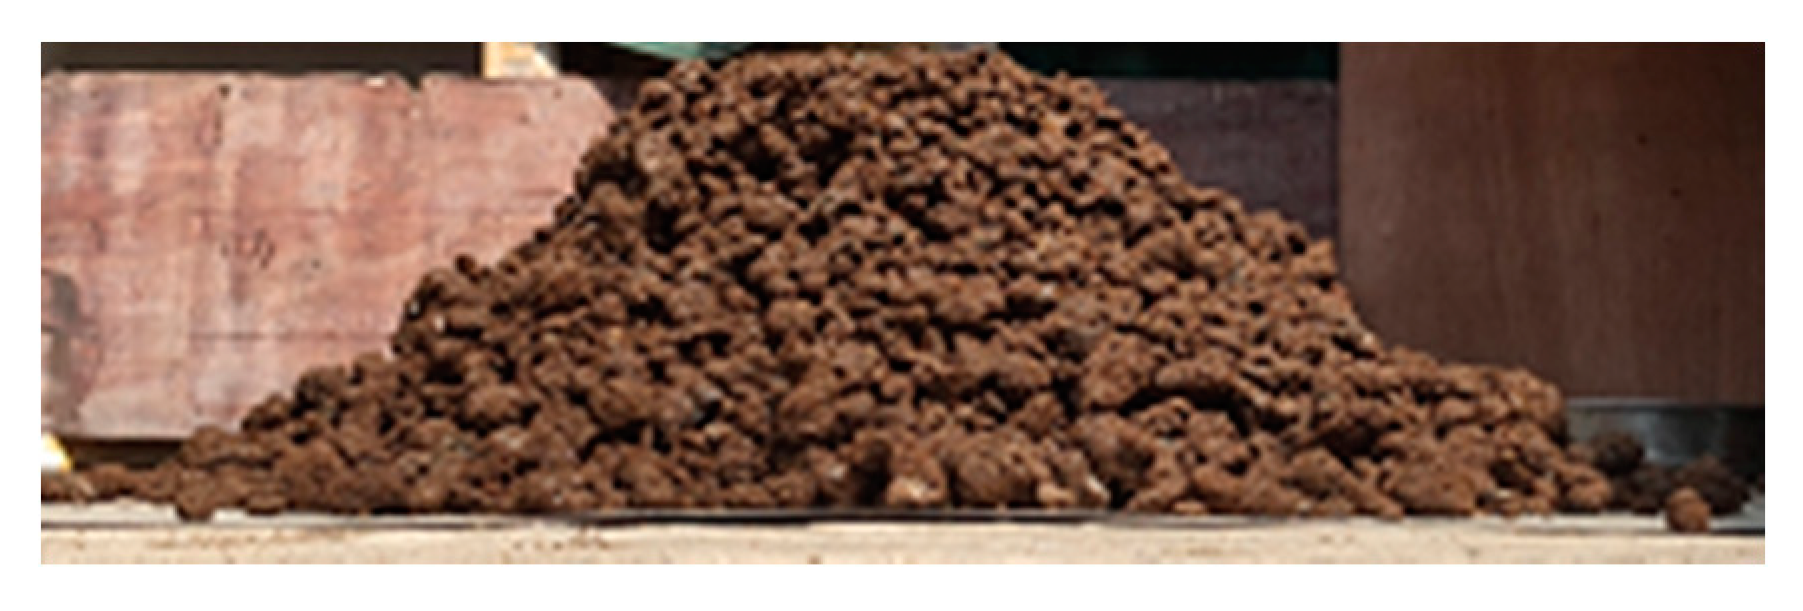
By referring to several widely used material accumulating methods, combining with the characteristics of large particles and viscosity of pig manure, the hollow barrel method is selected to be the accumulating method of this experiment. Hollow barrel method refers to that the materials are filled in a hollow barrel, with the hollow barrel lifting with uniform speed, the material free fall to form the AoR. The experimental equipment is shown in Figure 1. The barrel is made of 304 stainless steel, with a diameter of 0.5 m, a thickness of 2 mm and a height of 0.5 m. The hollow barrel is connected by a rope to the lower end of the electric drive pusher, and that is fixed to the bracket to keep it vertical. Then, when the electric drive pusher is switched on, the hollow barrel rises at a uniform speed of 45 mm/s until all pig manure is naturally accumulated on the horizontal steel plate. The camera is placed in a horizontal position to take pictures of the pig manure accumulation body, which is used to extract the value of AoR.
2.3. Experimental Equipment Model and Particle Model
By contrasting the experimental equipment, the simplified experimental equipment model is shown in Figure 2. Only the hollow barrel model and the horizontal steel plate model are retained.
To improve the simulation accuracy, the appearance of particle model must be close to the real material. The particle model of pig manure is shown in Figure 3. Through observation, pig manure can be roughly divided into the following four shapes: cuboid, rectangular pyramid (RP), right rectangular pyramid (RRP), and triangular pyramid (TP). Also, according to the size of pig manure, it is divided into three sizes: large particles (30–40 mm, LP), medium particles (20 mm–30 mm, MP) and small particles (10–20 mm, SP). Randomly taking part of the pig manure as the sample, the digital Vernier caliper is used to measure the size of pig manure. Three hundred pig manure particles of each size are selected for shape distinction and external size measurement, and the weight of each shape and size of pig manure particles is recorded to obtain the proportion of different shapes and sizes of pig manure in the population. For the pig manure of the same shape and size, its geometric dimensions are averaged to represent all the pig manure under the same shape and size level. The weight distribution of pig manure of different shapes and sizes is shown in Table 1, and the average size of pig manure of different shapes and sizes is shown in Table 2.
The meaning of codes: RP (rectangular pyramid), RRP (right rectangular pyramid), TP (triangular pyramid).
In Table 2, the cuboid has three parameters, L, W, and H which denote length, width, and height of cuboidal pig manure, respectively. Four parameters (L, W, HoP, T) are to be measured for establishing a pig manure particle model shaping like a rectangular pyramid (RP). L and W mean the length and width of the base of RP. HoP and T mean the height of pyramid and thickness of the base of RP, as shown in Figure 4. The meaning of RRP (L, W, HoP, T) and TP (L, HoP, T) is similarly to RP (L, W, HoP, T), and they are not described in this article.
The experimental results are shown in Figure 5. To ensure the efficiency and accuracy of the simulation, the time step is set to be 10% of the Rayleigh time step. The mesh size is two times of the minimum particle radius. The time of simulation is set to 60 s to ensure the complete formation of AoR.
2.4. Method for Measuring AoR
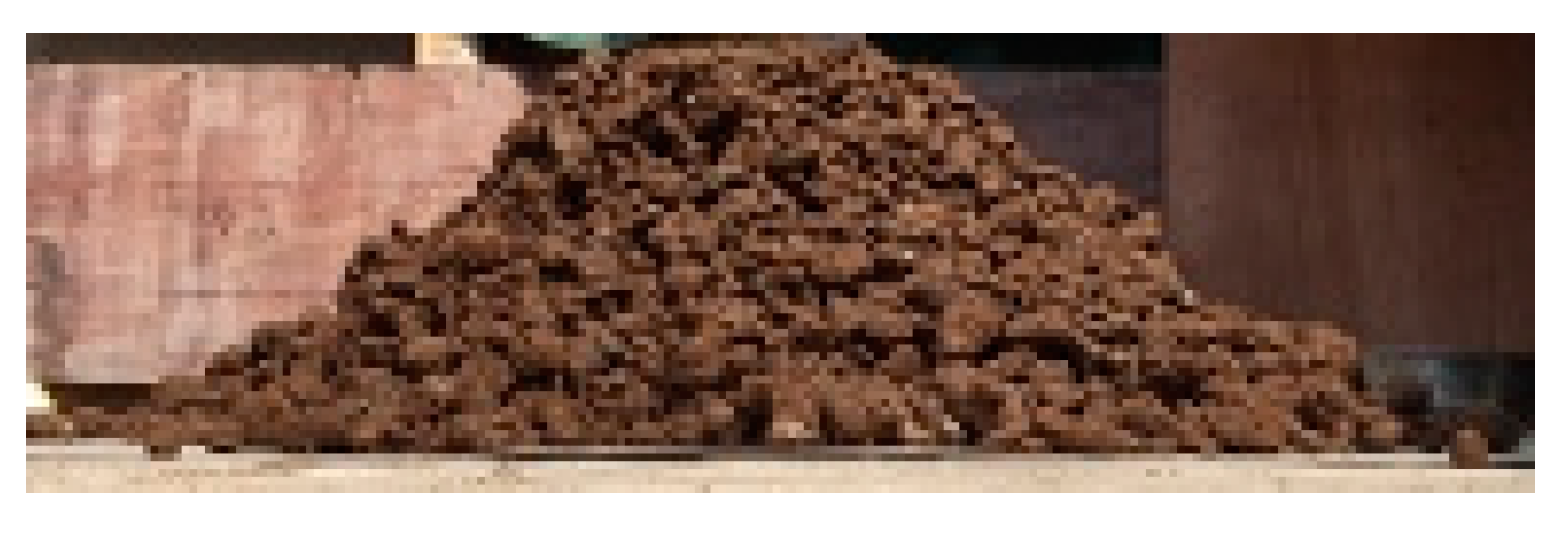
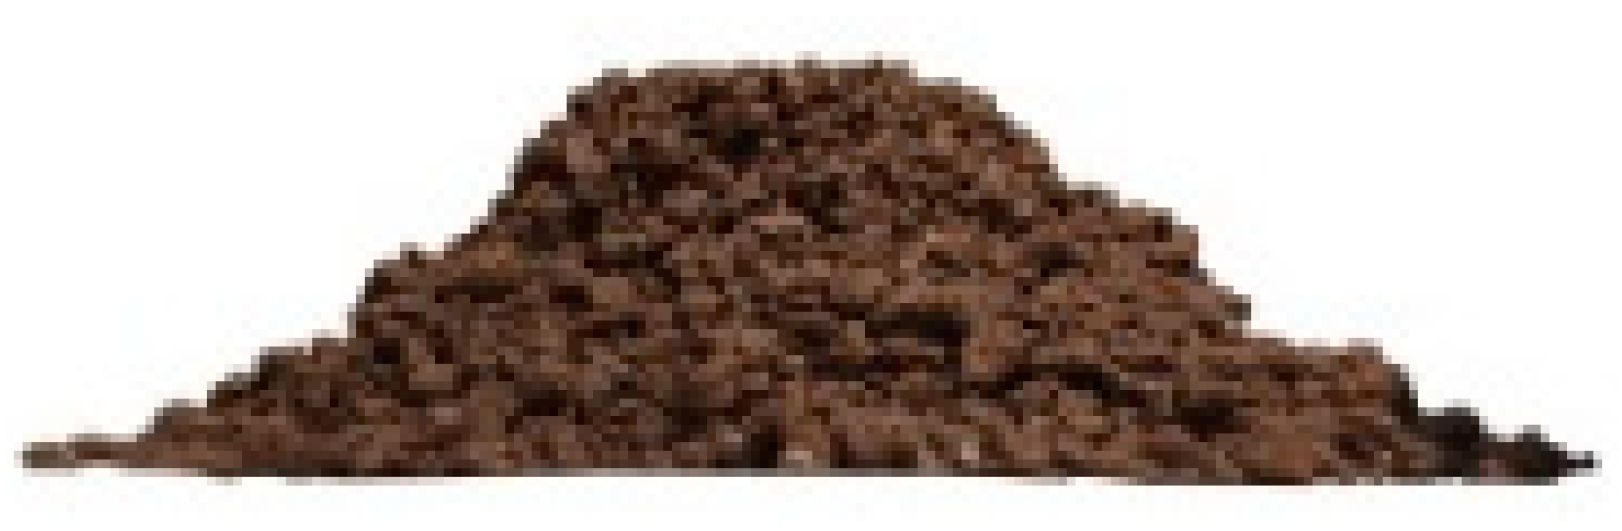
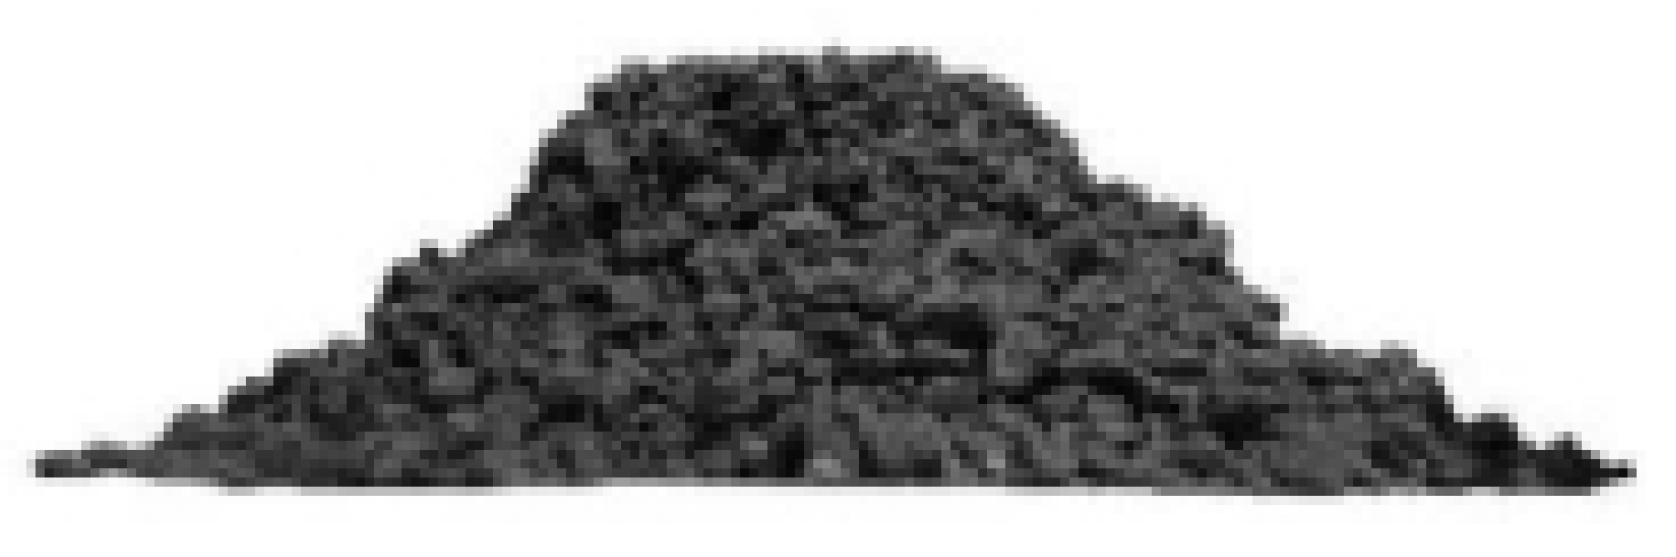
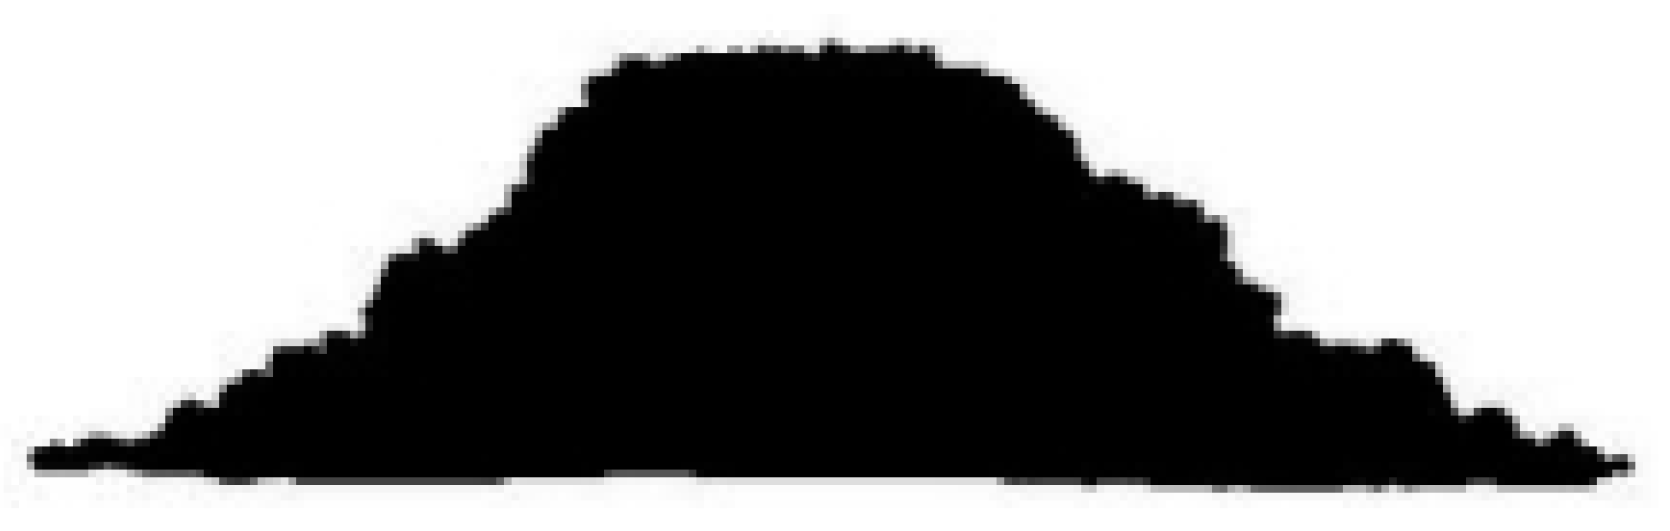
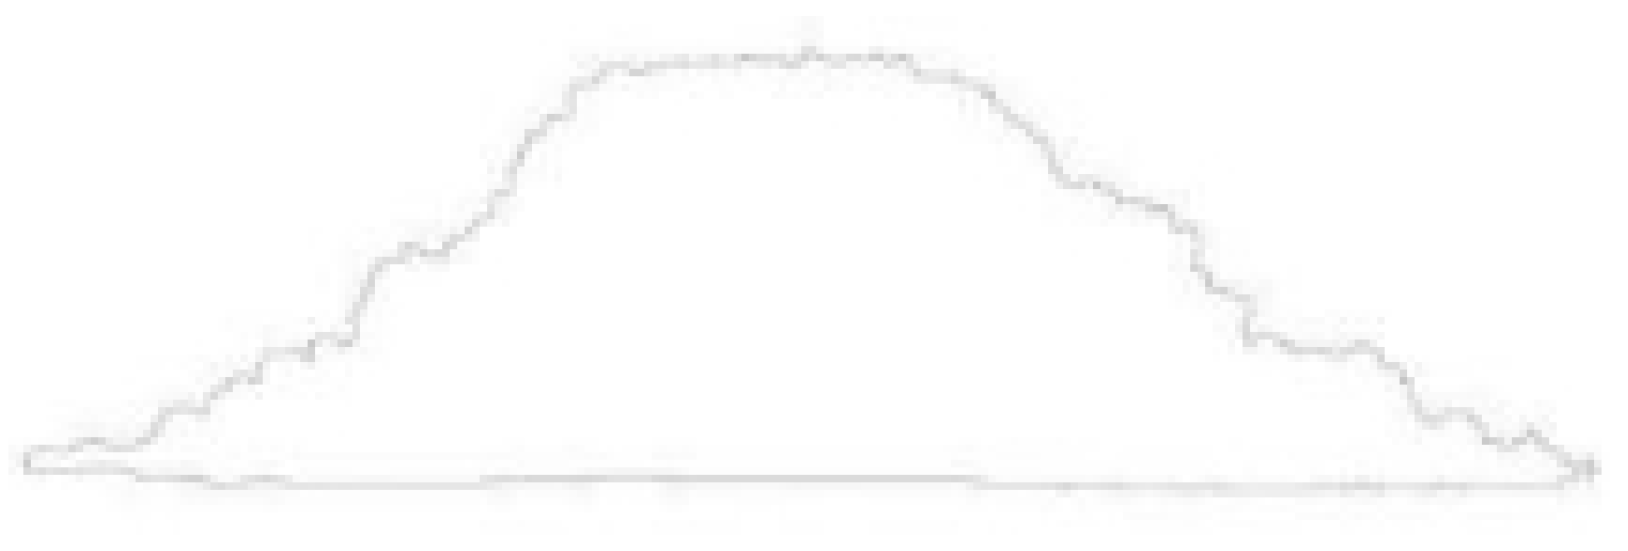
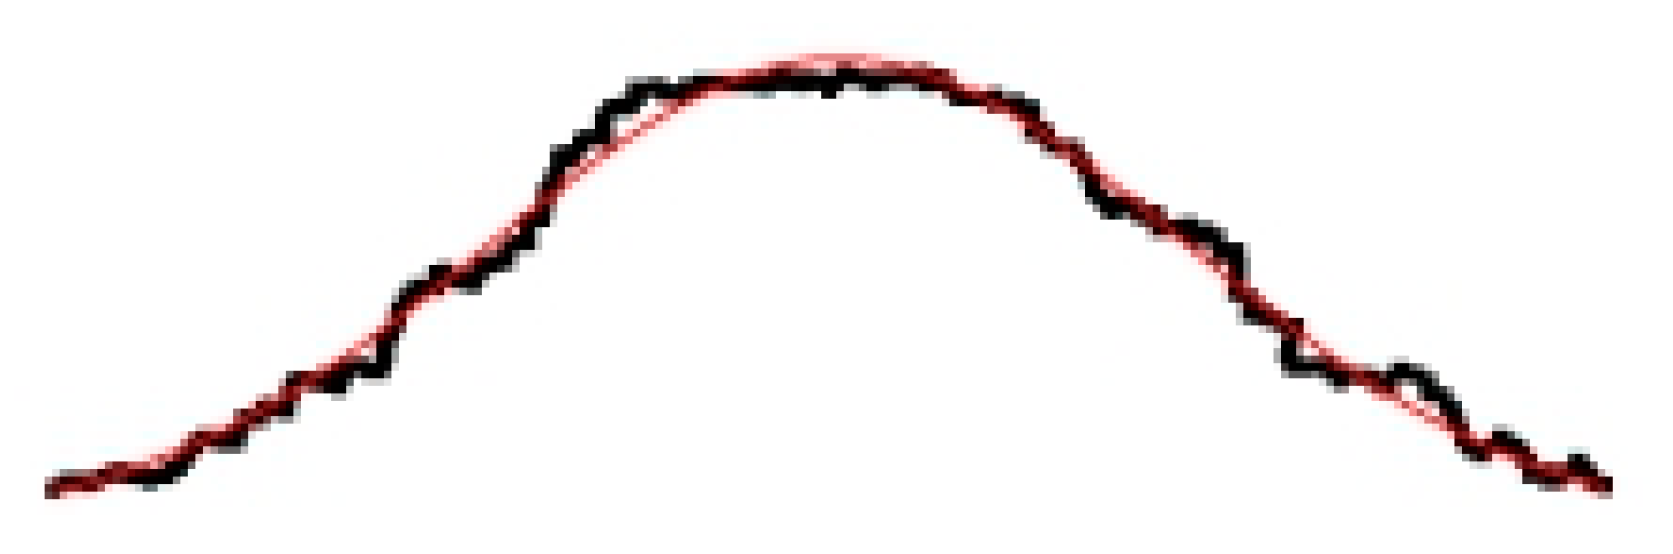
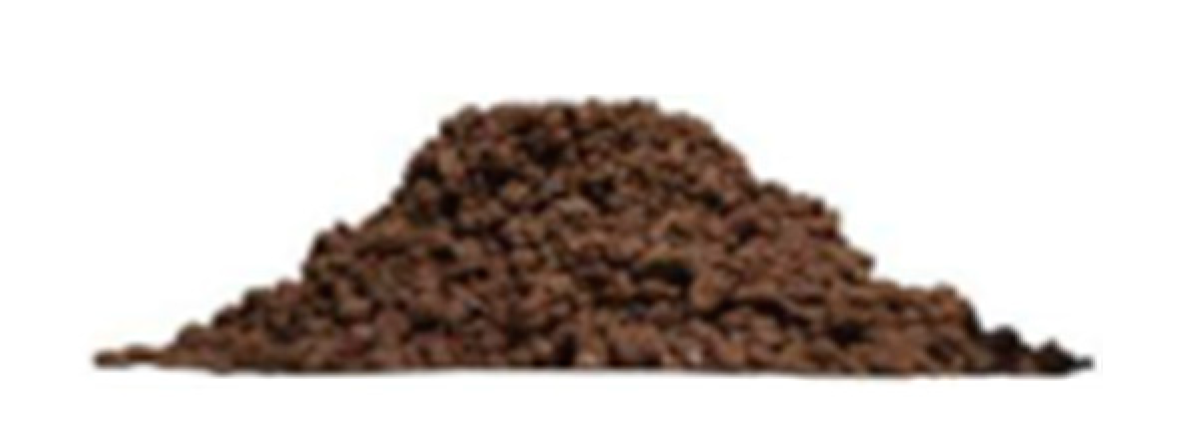
Observing the image of accumulation body, the contour lines at both ends of the accumulation body are approximately concave curve, and the contour lines in the middle are approximately convex curve. According to this characteristic of pig manure accumulation body, by referring to the calibration method of AoR of vermicomposting nursery substrate [10], gaussian distribution is used to fit the contour of pig manure accumulation body. The gaussian distribution curve at the inflection point is close to a straight line. After fitting, the tangent line at the inflection point is found, and the angle between the tangent line and the horizontal line is taken as AoR. The specific method is as follows: Photoshop cs5 is used to extract the image of the accumulation body from the image of experimental result, as shown in the Figure 6 and Figure 7. Then Matlab 2015b is used to grayscale the image of accumulation body, as shown in Figure 8. Then the binary image is carried out from the grayscale image, as shown in Figure 9. After that, Photoshop cs5 is used again to extract the contour curve of the accumulation body from the binary image, as shown in Figure 10. Finally, Digitizer, a picture processing tool of Origin 2018, is used to obtain the coordinate points of contour curve, and gaussian distribution curve is used to fit the contour curve of accumulation body, as shown in Figure 11. The first and second derivatives of the gaussian distribution function are taken to determine the coordinates of the inflection point, the slope of the tangent line at the inflection point and the value of AoR. In order to unify the measurement method of AoR, this method is used to measure the AoR in the discrete element simulation of the pig manure accumulating experiment.
The general equation of the Gaussian distribution is Equation (1), in which are all constant.
According to the method of extracting AoR of vermicomposting nursery substrate accumulation body, the calculation formula of AoR is as follows:
According to Origin, the fitting results of the contour curve of the accumulation body are as follows: = −26.65509, = 582.89207, = 511.99708, = 216464.37203. According to the fitting result, R-Square (COD), the determining coefficient of the fitting curve generated by Origin, is 0.98496. The correction determination coefficient which is named Adj. R-Square, is 0.98477. It shows that the gaussian distribution function has a good fitting effect on the curve of accumulation body. By taking the fitting results into the Equation (2) for calculating AoR, the AoR of pig manure at the water content of 57.29% is 38.65°.
2.5. Experimental Design of Discrete Element Parameter Optimization Calibration
Currently, the research on DEM of pig manure is not enough, especially in the literature of discrete element parameter calibration of pig manure. Considering that the physical characteristics of pig manure and soil are relatively similar, reference can be made to the literature on the calibration of discrete element parameters of soil. By referring to the discrete element parameter calibration literature of soil [8,10,18,19,20,21,22,23,24,25,26,27,28,29,30,31,32,33,34], the value range of each parameter in the experiment design of discrete element parameter optimization calibration is determined, as shown in the Table 3. Other parameters are as follows: the Poisson’s ratio of steel is 0.3, the shear modulus of steel 7.9 × 10¹⁰ Pa, the density of steel 7850 kg/m3, and the gravitational acceleration 9.81 m/s2.
Considering that there are many parameters involved in the calibration, with the AoR as the target value, the Plackett-Burman experiment design is carried out to screen out the three factors that have the most significant influence on AoR. Then Box–Behnken experiment design is carried out to establish the regression model between three significant parameters and AoR.
3. Results and Analysis
3.1. Plackett-Burman Experiment Design
The experiment design results of simulations are shown in Table 4. In Table 4, the meaning of each alphabet character is shown below: A for particle Poisson’s ratio, B for particle shear modulus/Mpa, C for particle collision recovery coefficient, D for particle–particle static friction coefficient, E for particle—particle rolling friction coefficient, F for particle–steel collision recovery coefficient, G for particle—steel static friction coefficient, H for particle–steel rolling friction coefficient, I for JKR surface energy/(J/m3), and J for AoR/(°).
Minitab is used again to conduct significance analysis on the experiment design result, and the analysis results are shown in Table 5. According to Table 5, the three factors that have the most significant influence on AoR are particle-particle coefficient of static friction, particle–particle coefficient of rolling friction, and the particle–steel static friction coefficient.
3.2. Box-Behnken Experiment Design
According to the three significant factors from the Plackett–Burman experiment design, the Box-Behnken experiment design is carried out. By observing the simulation results of Table 4, a lot of simulation results are found more than 80°. To ensure the accuracy of the prediction of the regression equation, the target value (38.65°) should be within the range of the results of Box–Behnken test. Thus, for non-significant parameters, among the non-significant of positive factors, low level ones are taken. For non-significant parameters, among the non-significant of negative factors, high level ones are taken [35]. Finally, the quadratic polynomial regression equation of AoR and three significant parameters is established. The data of each group in Box–Behnken experiment design are imported into EDEM for simulating AoR. The results of experiment design are shown in Table 6.
Minitab is used to analyze the test results and establish the quadratic polynomial regression equation between the AoR and particle—particle rolling friction coefficient (), particle—steel static friction coefficient () and particle—particle static friction coefficient (). The quadratic polynomial regression equation is as shown in Equation (3).
In Equation (3), means AoR, and , the determination coefficient of the regression equation, is 0.9367. , the correction determination coefficient of the regression equation, is 0.8226. The analysis of variance is carried out for the quadratic polynomial regression equation. The results of variance analysis are shown in Table 7. The p value of the regression equation is 0.016, and the p value of the lack-of-fit is 0.004. In summary, the regression equation fits well and has high reliability, so it can be used to predict AoR.
To verify the validity of the regression equation, the measured AoR value of 38.65° is taken as the target value. By using Minitab’s response optimizer tool, the optimal solution is found under the condition that the value range of factors is not limited. Five groups of solutions with the highest prediction accuracy are obtained. The solution with the most accurate prediction is selected as the optimal solution from the five groups of solutions. The optimization solution is imported into EDEM for the simulation of pig manure accumulating experiment. The simulation result is 38.54°, which is close to the experimental result, and the relative error is 0.28%. The simulation results and actual accumulation body images are shown in Figure 12 and Figure 13. Since there is little difference between the simulation results and the experimental results, the regression equation is considered to be effective.
In this study, the density of pig manure was 760 kg/m3, and the bulk density was 550 kg/m3, and the total weight of pig manure is 23.1 kg. After experiment, four pieces of pig manure are randomly selected to test the water content, and the water content are 57.77%, 58.49%, 50.60%, and 62.30%, respectively. The average water content is 57.29%. Corresponding to the average water content, the measured AoR is 38.65°. Moreover, the optimal solution is as follows: the value of particle–particle rolling friction coefficient is 0.5, the value of particle–steel static friction coefficient is 0.596759, and the value of particle–particle static friction coefficient is 0.2. Values of other non-significant parameters are as follows, Poisson’s ratio 0.5, shear modulus 1.0Mpa, density 760 kg/m3, particle–particle collision recovery coefficient 0.1, particle–steel collision recovery coefficient 0.1, particle–steel rolling friction coefficient 0.04, and JKR surface energy 3.5 J/m2.
4. Discussion
Current studies on pig manure processing machinery mainly focus on structural design and finite element method analysis. The interaction between pig manure and machinery cannot be studied. As a result, studies on pig manure processing machinery are not comprehensive enough. In this paper, DEM is proposed to study pig manure processing machinery. The discrete element simulation can directly study the temperature, stress, and motion curve of pig manure in the machinery, making the research on pig manure processing machinery more comprehensive, intuitive, and accurate. In order to introduce discrete element method into the research of pig manure processing machinery, the most important and fundamental step is to calibrate a group of discrete element parameters. However, the literature on the calibration of discrete element parameters of pig manure is lacking, which makes it impossible to use discrete element method in the study of pig manure processing machinery. In this paper, the discrete element parameters of pig manure are calibrated. Based on the calibrated parameters, the pig manure accumulating experiment is simulated to obtain the simulated AoR. Compared with the measured AoR, the relative error is 0.28%, indicating that the calibrated discrete element parameters can restore the contact mechanical properties of real pig manure in the discrete element simulation. The calibration of discrete element parameters provides a basis for the application of the discrete element method in the study of pig manure processing machinery. Also, this paper provides a method of discrete element parameter calibration which can be used as a reference in discrete element parameter calibration research of other animal manure. There are some inadequacies in this research. The quadratic polynomial regression equation between discrete element parameters of pig manure and AoR is established by the Box–Behnken experiment design, and the regression equation successfully predicted the discrete element parameters when the water content of pig manure is 57.29%. While the water content of pig manure is different, theoretically, the regression equation can also predict the discrete element parameters. However, this has not been verified in this article. In addition, there is another inadequacy in this research. In fact, when applied with sufficient force, the real pig manure will break up, but in this study, the pig manure particle model is unbreakable, no matter how much force there is. So, this characteristic of real pig manure has not been restored, which may affect the simulation accuracy, however it can be improved with further research. API, a function in EDEM, can be used to make a new the pig manure particle model that consist of small particles. There is an internal force between these small particles to keep particles cohesive, and when a sufficient force applies to the new pig manure particle model, it can be broken up.
Author Contributions
Conceptualization, R.L.; methodology, W.Y. (Weiping Yang) and R.L.; software, W.Y. (Weiping Yang), R.L., and W.Y. (Wenjie Yu); formal analysis, writing—original draft preparation, review and editing, visualization, W.Y. (Wenjie Yu). All authors have read and agreed to the published version of the manuscript.
Funding
This work is supported by the National Natural Science Foundation of China (NSFC), No. 31960683: “Investigation of Mechanism about Ventilation Mode Synergistic Construction on the Pig House Environment and the Growth Performance of Pigs” (lead agency: National natural science foundation of China).
Acknowledgments
The authors appreciated Kai Zhang of Zengxin technology, and Shan Gao of animal science school, Jiangxi Agriculture University, for their meticulous efforts in conducting the experiment.
Conflicts of Interest
The authors declare no conflict of interest.
References
- Huang, F. Design of Environmental and Healthy Fattening House for Pig and Analysis of Energy Efficiency. Master’s Thesis, Hunan Agriculture University, Changsha, China, 2017. [Google Scholar]
- Jia, W. Studies on the Evaluation of Nutrient Resources Derived from Manure and Optimized Utilization in Arable Land of China. Ph.D. Thesis, China Agriculture University, Beijing, China, 2014. [Google Scholar]
- Li, L.J. Effects of Bamboo Charcoal on Nitrogen Conservation and Greenhouse Gas Emissions Reduction during Swine Manure Composting. Master’s Thesis, Zhejiang University, Hangzhou, China, 2012. [Google Scholar]
- Liu, D. The Experimental Research on Anaerobic Fermentation Characteristics of Mixed Livestock Manure. Master’s Thesis, Northeast Agriculture University, Harbin, China, 2008. [Google Scholar]
- Yuan, X.; Fan, G.C.; Chen, L.; Gao, Q.H.; Zhang, X.P.; Zhang, Y.Z. Design and Experiment of High Temperature and Rapid Fermentation Equipment for Livestock and Poultry Excrement. Trans. Chin. Soc. Agric. Mach. 2018, 49, 413–418. [Google Scholar]
- Zhang, X.M. Study on the Drying Process and Equipment for Organic Fertilizer Pellets. Ph.D. Thesis, China Agriculture University, Beijing, China, 2017. [Google Scholar]
- Johnson, K.L.; Kendall, K.; Roberts, A.D. Surface energy and the contact of elastic solids. Math. Phys. Sci. 1971, 324, 301–313. [Google Scholar]
- Wu, T.; Huang, W.F.; Chen, X.S.; Ma, X.; Han, Z.Q.; Pan, T. Calibration of discrete element model parameters for cohesive soil considering the cohesion between particles. J. South China Agric. Univ. 2017, 38, 93–98. [Google Scholar]
- Wu, L.; Qi, S.; Song, Y.Q.; Xin, M.J.; Liu, C.H.; Kong, A.J.; Jiao, Z.B.; Liu, F.; Ren, W.T. A DEM analysis on drag reduction characteristics of paddy field machinery surface with bionic microarchitectures. J. Shenyang Agric. Univ. 2017, 48, 55–62. [Google Scholar]
- Luo, S.; Yuan, Q.X.; Gouda, S.; Yang, L.Y. Parameters calibration of vermicomposting nursery substrate with discrete element method based on JKR contact model. Trans. Chin. Soc. Agric. Mach. 2018, 49, 343–350. [Google Scholar]
- Wu, H.; Xia, J.F.; Zhang, G.Z.; Wang, P.T.; Lao, S.F.; Zhang, X.M. Design and experiment of spin-jet flow type lotus root digging machine based on DEM-Fluent. Trans. Chin. Soc. Agric. Eng. 2018, 34, 9–14. [Google Scholar]
- Liao, Z.C.; Gao, W.; Liu, L.; Jiang, S.Q.; Tan, Y.Q. Mixing efficiency of a concrete ribbon mixer and DEM simulation. Chin. J. Process. Eng. 2019, 19, 668–675. [Google Scholar]
- Wen, X.Y.; Yuan, H.F.; Wang, G.; Jia, H.L. Calibration method of friction coefficient of granular fertilizer by discrete element simulation. Trans. Chin. Soc. Agric. Mach. 2019, 51, 115–122, 142. [Google Scholar]
- Li, Y.X.; Li, F.X.; Xu, X.M.; Shen, C.P.; Meng, K.P.; Chen, J.; Chang, D.T. Parameter calibration of wheat flour for discrete element method based on particle scaling. Trans. Chin. Soc. Agric. Eng. 2019, 35, 320–327. [Google Scholar]
- Xiang, W.; Wu, M.L.; Lv, J.N.; Quan, W.; Ma, L.; Liu, J.J. Calibration of simulation physical parameters of clay loam based on soil accumulation test. Trans. Chin. Soc. Agric. Eng. 2019, 35, 116–123. [Google Scholar]
- Hou, J.M.; Li, J.P.; Yao, E.C.; Bai, J.B.; Yang, Y.; Zhu, H.J. Calibration and analysis of discrete element parameters of typical castor. J. Shenyang Agric. Univ. 2019, 50, 565–575. [Google Scholar]
- Cao, B.; Li, W.H.; Wang, N.; Bai, X.Y.; Wang, C.W. Calibration of discrete element parameters of the wet barrel finishing abrasive based on JKR model. Surf. Technol. 2019, 48, 249–256. [Google Scholar]
- Dai, F.; Song, X.F.; Zhao, W.Y.; Zhang, F.W.; Ma, H.J.; Ma, M.Y. Simulative calibration on contact parameters of discrete elements of covering soil on whole plastic film mulching on double ridges. Trans. Chin. Soc. Agric. Mach. 2019, 50, 49–56. [Google Scholar]
- Shi, L.R.; Zhao, W.Y.; Sun, W. Parameter calibration of soil particles contact model of farmland soil in northwest arid region based on discrete element method. Trans. Chin. Soc. Agric. Eng. 2017, 33, 181–187. [Google Scholar]
- Wang, X.L.; Hu, H.; Wang, Q.J.; Li, H.W.; He, J.; Chen, W.Z. Calibration method of soil contact characteristic parameters based on DEM theory. Trans. Chin. Soc. Agric. Mach. 2017, 48, 78–85. [Google Scholar]
- He, Y.M.; Xiang, W.; Wu, M.L.; Quan, W.; Chen, C.P. Parameters calibration of loam soil for discrete element simulation based on the repose angle of particle heap. J. Hunan Agric. Univ. Nat. Sci. 2018, 44, 216–220. [Google Scholar]
- Zhao, J.Z. Simulation and Experimental Investigation of Potato Digging Shovel Working Resistance Based on Discrete Element Method. Master’s Thesis, Shenyang Agricultural University, Shenyang, China, 2017. [Google Scholar]
- Zhang, R.; Han, D.L.; Ji, Q.L.; He, Y.; Li, J.Q. Calibration methods of sandy soil parameters in simulation of discrete element method. Trans. Chin. Soc. Agric. Mach. 2017, 48, 49–56. [Google Scholar]
- Zhou, H.; Li, D.; Liu, Z.Y.; Li, Z.Y.; Luo, S.C.; Xia, J.F. Simulation and experiment of spatial distribution effect after straw incorporation into soil by rotary burial. Trans. Chin. Soc. Agric. Mach. 2019, 50, 69–77. [Google Scholar]
- Chen, C.P.; Quan, W.; Wu, M.L.; Zhang, W.T. Parameter optimization of vertical soil filling hole-forming parts for rapeseed transplantation based on discrete element method. J. Hunan Agric. Univ. Nat. Sci. 2019, 45, 433–439. [Google Scholar]
- Li, J.W.; Tong, J.; Hu, B.; Wang, H.B.; Mao, C.Y.; Ma, Y.H. Calibration of parameters of interaction between clayey black soil with different moisture content soil-engaging component northeast China. Trans. Chin. Soc. Agric. Eng. 2019, 35, 130–140. [Google Scholar]
- Ma, S.; Xu, L.M.; Xing, J.J.; Yuan, Q.C.; Yu, C.C.; Duan, Z.Z.; Chen, C.; Zeng, J. Development of unilateral cleaning machine for grapevine buried by soil with rotary impeller. Trans. Chin. Soc. Agric. Eng. 2018, 34, 1–10. [Google Scholar]
- Wang, W.W.; Zhu, C.X.; Chen, L.Q.; Li, Z.D.; Huang, X.; Li, J.C. Design and experiment of active staw-removing anti-blocking device for maize no-tillage planter. Trans. Chin. Soc. Agric. Eng. 2017, 33, 10–17. [Google Scholar]
- Liu, X.M.; Du, S.; Yuan, J.; Li, Y.; Zou, L.L. Analysis and experiment on selective harvesting mechanical end –effector of white asparagus. Trans. Chin. Soc. Agric. Mach. 2018, 49, 110–120. [Google Scholar]
- Wang, X.Z.; Yue, B.; Gao, X.J.; Zheng, Z.Q.; Zhu, R.X.; Huang, Y.X. Discrete element simulations and experiments of disturbance behavior as affected by mounting height of subsoiler’s wing. Trans. Chin. Soc. Agric. Mach. 2018, 49, 124–136. [Google Scholar]
- Huang, Y.X.; Hang, C.G.; Yuan, M.C.; Wang, B.T.; Zhu, R.X. Discrete element simulation and experiment on disturbance behavior subsoiling. Trans. Chin. Soc. Agric. Mach. 2016, 47, 80–88. [Google Scholar]
- Liu, Q.; Xu, L.F.; Liu, X.X.; Lv, Z.Q.; Song, Y.P.; Li, C.P. Research on dynamic behavior during mechanic pulling of carrot based on discrete element method. J. Chin. Agric. Mech. 2018, 39, 61–65. [Google Scholar]
- Li, L.L.; Li, G.Y.; Zhang, Y.H.; Yuan, H.Y. Simulation analysis of the working process and soil loosening effect of the arc deep pine shovel by discrete element method. Jiangsu Agric. Sci. 2018, 46, 201–204. [Google Scholar]
- Diao, H.L.; Zhang, Y.P.; Diao, P.S.; Zhao, N. Design and experiment of a no-tillage and wide band wheat planter with subsoilsbased on EDEM. J. Agric. Mech. Res. 2017, 39, 58–62. [Google Scholar]
- Feng, M.Q. Fermentation, Structure Characterization and Functional Characteristics of Exopolysaccharides from Lactobacillus Plantarum. Ph.D. Thesis, Nanjing Agricultural University, Nanjing, China, 2012. [Google Scholar]
Figure 1.
Equipment.

Figure 2.
Equipment model.

Figure 3.
Four different shapes of pig manure and its particle models.

Figure 4.
Pig manure external dimensions: HoP, T.

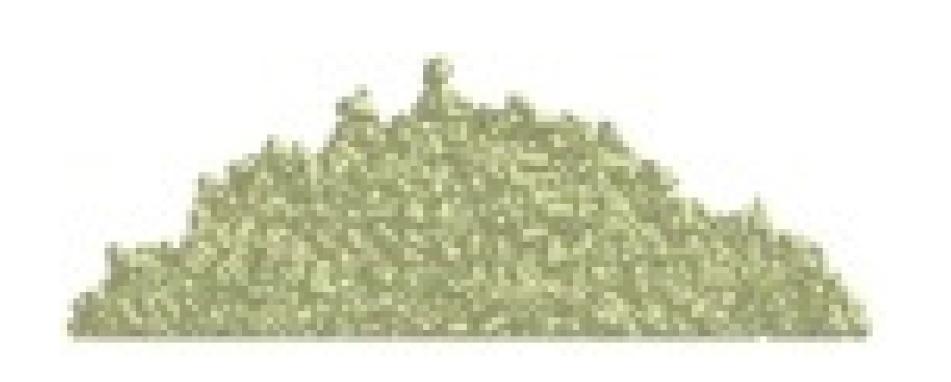
Figure 5.
Image of accumulation body.

Figure 6.
Experimental result.

Figure 7.
The accumulation body.

Figure 8.
Grayscale image.

Figure 9.
Binary image.

Figure 10.
Contour curve of the accumulation body.

Figure 11.
The fitting result of gaussian distribution function.

Figure 12.
Measured AoR 38.65°

Figure 13.
Simulation result 38.54°


Table 1.
Distribution table of pig manure (weight ratio).
| Shape | Cuboid | RP | RRP | TP | |
|---|---|---|---|---|---|
| Size | |||||
| LP | 6.99% | 18.16% | 17.24% | 11.55% | |
| MP | 3.40% | 8.84% | 8.39% | 5.62% | |
| SP | 2.57% | 6.67% | 6.33% | 4.24% | |
Table 2.
Mean size table of pig manure (unit: mm).
| Shape | Cuboid | RP | RRP | TP | |
|---|---|---|---|---|---|
| Size | (L, W, H) | (L, W, HoP, T) | (L, W, HoP, T) | (L, HoP, T) | |
| LP | 36.63, 27.81, 16.16 | 36.00, 28.85, 24.89, 19.54 | 36.29, 27.80, 23.65, 17.37 | 36.88, 31.09, 23.67 | |
| MP | 25.53, 21.94, 12.88 | 25.87, 20.64, 16.59, 12.54 | 25.63, 20.39, 16.39, 11.67 | 24.93, 21.60, 16.89 | |
| SP | 14.32, 10.99, 6.69 | 14.71, 11.64, 10.19, 7.52 | 15.45, 12.02, 9.93, 6.66 | 13.59, 11.07, 8.42 | |
Table 3.
Discrete element parameter level.
| Parameters | Code | Low Level | High Level |
|---|---|---|---|
| Particle poisson’s ratio | A | 0.2 | 0.5 |
| Particle shear modulus/Mpa | B | 1 | 1.5 |
| Particle collision recovery coefficient | C | 0.1 | 0.6 |
| Particle—particle static friction coefficient | D | 0.2 | 1.16 |
| Particle—particle rolling friction coefficient | E | 0.1 | 0.5 |
| Particle—steel collision recovery coefficient | F | 0.1 | 0.6 |
| Particle—steel static friction coefficient | G | 0.2 | 0.6 |
| Particle—steel rolling friction coefficient | H | 0.04 | 0.4 |
| JKR surface energy/(J/m3) | I | 3.5 | 10.5 |
Table 4.
Plackett-Burman experiment design.
| Serial Number | A | B | C | D | E | F | G | H | I | J |
|---|---|---|---|---|---|---|---|---|---|---|
| 1 | 0.5 | 1.0 | 0.6 | 0.2 | 0.1 | 0.1 | 0.6 | 0.4 | 10.5 | 89.30 |
| 2 | 0.5 | 1.5 | 0.1 | 1.16 | 0.1 | 0.1 | 0.2 | 0.4 | 10.5 | 88.45 |
| 3 | 0.2 | 1.5 | 0.6 | 0.2 | 0.5 | 0.1 | 0.2 | 0.04 | 10.5 | 89.50 |
| 4 | 0.5 | 1.0 | 0.6 | 1.16 | 0.1 | 0.6 | 0.2 | 0.04 | 3.5 | 90.00 |
| 5 | 0.5 | 1.5 | 0.1 | 1.16 | 0.5 | 0.1 | 0.6 | 0.04 | 3.5 | 32.84 |
| 6 | 0.5 | 1.5 | 0.6 | 0.2 | 0.5 | 0.6 | 0.2 | 0.4 | 3.5 | 88.50 |
| 7 | 0.2 | 1.5 | 0.6 | 1.16 | 0.1 | 0.6 | 0.6 | 0.04 | 10.5 | 87.90 |
| 8 | 0.2 | 1.0 | 0.6 | 1.16 | 0.5 | 0.1 | 0.6 | 0.4 | 3.5 | 52.69 |
| 9 | 0.2 | 1.0 | 0.1 | 1.16 | 0.5 | 0.6 | 0.2 | 0.4 | 10.5 | 64.40 |
| 10 | 0.5 | 1.0 | 0.1 | 0.2 | 0.5 | 0.6 | 0.6 | 0.04 | 10.5 | 54.25 |
| 11 | 0.2 | 1.5 | 0.1 | 0.2 | 0.1 | 0.6 | 0.6 | 0.4 | 3.5 | 88.15 |
| 12 | 0.2 | 1.0 | 0.1 | 0.2 | 0.1 | 0.1 | 0.2 | 0.04 | 3.5 | 89.80 |
Table 5.
Significance analysis of Plackett-Burman experiment design parameters.
| Model Variable | Effect | Coefficient | p |
|---|---|---|---|
| Constant term | 76.315 | 0.000 | |
| A | −4.850 | −2.425 | 0.083 |
| B | 5.817 | 2.908 | 0.060 |
| C | 13.333 | 6.667 | 0.012 |
| D | −13.870 | −6.935 | 0.011 |
| E | −25.237 | −12.618 | 0.003 |
| F | 5.103 | 2.552 | 0.076 |
| G | −17.587 | −8.793 | 0.007 |
| H | 4.533 | 2.267 | 0.094 |
| I | 5.303 | 2.652 | 0.071 |
Table 6.
Box-Behnken experiment design.
| Serial Number | a | b | c | AoR/(°) |
|---|---|---|---|---|
| 1 | 0.1 | 0.2 | 0.68 | 87.90 |
| 2 | 0.5 | 0.2 | 0.68 | 28.63 |
| 3 | 0.1 | 0.6 | 0.68 | 89.10 |
| 4 | 0.5 | 0.6 | 0.68 | 23.64 |
| 5 | 0.1 | 0.4 | 0.2 | 88.10 |
| 6 | 0.5 | 0.4 | 0.2 | 46.77 |
| 7 | 0.1 | 0.4 | 1.16 | 89.80 |
| 8 | 0.5 | 0.4 | 1.16 | 36.36 |
| 9 | 0.3 | 0.2 | 0.2 | 85.30 |
| 10 | 0.3 | 0.6 | 0.2 | 47.47 |
| 11 | 0.3 | 0.2 | 1.16 | 31.34 |
| 12 | 0.3 | 0.6 | 1.16 | 36.34 |
| 13 | 0.3 | 0.4 | 0.68 | 33.70 |
| 14 | 0.3 | 0.4 | 0.68 | 35.49 |
| 15 | 0.3 | 0.4 | 0.68 | 34.09 |
Table 7.
Analysis of variance of quadratic polynomial regression model of Box-Behnken test.
| Source | DOF | SSAdj | MSAdj | F | p |
|---|---|---|---|---|---|
| Model | 9 | 9119.55 | 1013.28 | 8.22 | 0.016 |
| Linear | 3 | 6870.96 | 2290.32 | 18.57 | 0.004 |
| a | 1 | 6022.53 | 6022.53 | 48.83 | 0.001 |
| b | 1 | 167.63 | 167.63 | 1.36 | 0.296 |
| c | 1 | 680.81 | 680.81 | 5.52 | 0.066 |
| Square | 3 | 1743.74 | 581.25 | 4.71 | 0.064 |
| a2 | 1 | 1335.44 | 1335.44 | 10.83 | 0.022 |
| b2 | 1 | 55.38 | 55.38 | 0.45 | 0.533 |
| c2 | 1 | 515.24 | 515.24 | 4.18 | 0.096 |
| 2-way interaction | 3 | 504.84 | 168.28 | 1.36 | 0.354 |
| ab | 1 | 9.58 | 9.58 | 0.08 | 0.792 |
| ac | 1 | 36.66 | 36.66 | 0.30 | 0.609 |
| bc | 1 | 458.60 | 458.60 | 3.72 | 0.112 |
| Error | 5 | 616.95 | 123.35 | ||
| Lack-of-fit | 3 | 614.95 | 204.98 | 231.35 | 0.004 |
| Pure error | 2 | 1.77 | 0.89 | ||
| Total | 14 | 9736.28 |
The meaning of DOF, SSAdj, MSAdj is shown below: DOF (degree of freedom), SSAdj (sum of squares, adjusted), MSAdj (mean sum of squares, adjusted).
© 2020 by the authors. Licensee MDPI, Basel, Switzerland. This article is an open access article distributed under the terms and conditions of the Creative Commons Attribution (CC BY) license (http://creativecommons.org/licenses/by/4.0/).
Share and Cite
MDPI and ACS Style
Yu, W.; Liu, R.; Yang, W. Parameter Calibration of Pig Manure with Discrete Element Method Based on JKR Contact Model. AgriEngineering 2020, 2, 367-377. https://0-doi-org.brum.beds.ac.uk/10.3390/agriengineering2030025
AMA Style
Yu W, Liu R, Yang W. Parameter Calibration of Pig Manure with Discrete Element Method Based on JKR Contact Model. AgriEngineering. 2020; 2(3):367-377. https://0-doi-org.brum.beds.ac.uk/10.3390/agriengineering2030025
Chicago/Turabian StyleYu, Wenjie, Renxin Liu, and Weiping Yang. 2020. "Parameter Calibration of Pig Manure with Discrete Element Method Based on JKR Contact Model" AgriEngineering 2, no. 3: 367-377. https://0-doi-org.brum.beds.ac.uk/10.3390/agriengineering2030025