Article

Variations in Physicochemical Characteristics of Olive Oil (cv ‘Moroccan Picholine’) According to Extraction Technology as Revealed by Multivariate Analysis

1
Laboratory of Biology, Ecology, and Health, FS, Abdelamlek Essaadi University, Tetouan 93002, Morocco
2
Laboratory of Materials Engineering and Environment, Department of Chemistry, Faculty of Sciences Dhar Mahraz Fez, Sidi Mohamed Ben Abdellah University, Fez 30003, Morocco
3
Biotechnology Analytical Sciences and Quality Control Team, Polydisciplinary Faculty of Taroudant, University Ibn Zohr, Agadir 80000, Morocco
*
Author to whom correspondence should be addressed.
Submission received: 6 September 2022 / Revised: 3 October 2022 / Accepted: 4 October 2022 / Published: 10 October 2022

Abstract

:
Olive oil is an important component of Mediterranean diet widely, consumed thanks to its numerous health-healing properties. Its quality is dependent upon a set of factors (genotypic, environmental, agronomic practices, ripening, etc). These are well documented, but little is known about the impact of extraction technology on ‘Moroccan Picholine’ olive oil quality. In this paper, physicochemical traits of olive oil (cv ‘Moroccan Picholine’) were investigated according to extraction technology namely super pressure (SP), 2-phase (2P), and 3-phase (3P) systems as well as traditionally extracted oil (Alwana Oil, AO). The obtained results revealed significant differences (p < 0.05) in terms of the studied physicochemical traits. The investigated oil samples were classified as extra-virgin olive oil. Oil samples from super pressure and AO marked by high records of peroxide value, acidity, K270, fatty acids and trans fatty acids likely due to partial oxidation during extraction. AO was marked by high MUFA, stigmasterol, brassicosterol, 2P displayed high SFA and β-sitosterol, and 3P had high PUFA, SFA, ∆7-avenasterol, and ∆7-stigmasterol. These results were confirmed by principal component analysis, cluster analysis and artificial neural networks. In conclusion, continuous systems (2- and 3-phase) produced olive oil of better quality as compared to super-pressure and traditionally extracted oil.

1. Introduction

Olive oil is an important component of the Mediterranean diet. Its consumption is linked to numerous health-healing properties. Olive cultivation is spread in the northern and southern hemispheres, and it is mainly concentrated in the Mediterranean basin. Olive oil global production accounts for 3,097,803 tons according to the latest release of FAOSTAT [1]. Following these statistics, Spain is the top producer (1,129,803 tons) followed by Italy (336,581 tons), Greece (290,476 tons), Tunisia (239,500 tons), Morocco (204,200 tons), and Turkey (217,800 tons).
Taounate province (central northern Morocco) produces around 200,000 tons with over 3000 of continuous and discontinuous extraction systems, and olive cultivation is of a great socio-economic importance. ‘Moroccan Picholine’ is the most popular cultivar, accounting for about 95% of the provincial and national olive patrimony. There are also other cultivars, mainly ‘Haouzia’, ‘Menara’, ‘Picholine Languedoc’, ‘Arbosana’, ‘Dahbia’, ‘Meslala’, ‘Arbequina’, and ‘Picual’ [2]. The quality and chemical composition of olive oil can be influenced also by the geographical provenance and its related variables such as altitude, soil characteristics, climatic conditions, as well as agronomic practices such as fertilization, irrigation, etc. as outlined in Inglese et al. [3] and Romero et al. [4].
Environment conditions are responsible for wide variations in olive tree physiology, and therefore fruit quality and extracted oils. Hadiddou et al. [5] evaluated agronomic performances of 14 Mediterranean cultivars under two contrasting water regimes and two cultivation sites in Morocco (Taounate and Ouazzane). These authors conclude that irrigation enhances oil content (OC) and results in higher yield per tree and olive weight, with increasing averages of 14.5 and 3.5%, respectively. It has been also suggested that the cultivars ‘Leccino’, ‘Menara’, ‘Manzanille’ and ‘Haouzia’ are more suitable for rainfed olive growing due to their higher yields achieved under rainfed conditions [5]. More recently, García-Garví et al. [6], while investigating effects of regulated deficit irrigation on the quality of ‘Arbequina’ extra-virgin olive oil (EVOO), observed that the application of some deficit irrigation treatments resulted in increasing total phenolic content (TPC), oleic acid, and total monounsaturated fatty acids (MUFA). Similar results were reported in olive oil from ‘Moroccan Picholine’ conducted under two water regimes (rained and fully irrigated conditions) and olives harvested at different ripening stages [7]. In fact, OC increases during ripening but tends to decrease under full irrigation. According to the same study, ripening index effect is predominant over irrigation regime in determining the main basic quality indices and pigments, while TPC was strongly influenced by the water regime. At advanced ripening stages, low values of peroxide value (PV), UV absorption coefficient at 232 nm (K232), pigments (carotenoids and chlorophylls) and TPC are reported, while acid value (AV) increases. Full irrigation induces a reduction of TPC and AV, but it leads to high pigments content [7].
Along with impact of the environment, genotypic variations, agronomic practices, ripening stage, and extraction technology (ET) induce important variations in terms of olive oil quality attributes. ET is one of main postharvest factors affecting olive oil quality as it determines initial quality attributes and oil autoxidation resistance [8]. Extraction system effects on olive oil quality have been investigated in different countries in the Mediterranean basin and abroad [8,9,10,11]. These works outlined important variations induced by extraction technologies on routinely measured quality indices, shelf life, fatty acid profile, and for the presence of minor compounds like phenolics and pigments (carotenoids and chlorophylls). Extraction processes and conditions, as well as their impact on nutritional quality of olive oil, were reviewed [12,13]. Following the work of these authors, the olive oil extraction process is known to have an extreme importance in determining the sensory and nutritional profiling of the product. For each extraction step, contents of some compounds like phenolics and volatiles, can be significantly altered depending on the extraction machines employed. A set of mechanical processes such as crushing, malaxation, and centrifugation, and the addition of amounts of water seem to influence endogenous enzymes activities (pectinase, lipase, lipoxygenase, hydroperoxidelyase, beta-glucosidase, etc). These are responsible for phenolic and aroma variations, among others effects as discussed in Clodoveo et al. [13].
Some preliminary investigations were carried out to investigate effects of ET on ‘Moroccan Picholine’ olive oil quality [14,15]. While comparing the behavior of some quality indices according to ET, storage time, and conditions, El Yamani et al. [14] found that ET impacts significantly (p < 0.001) on the studied parameters and is the main variability source in AV, K232, and carotenoids. Following the same authors, a 2-phase system (2P) presents lower values of AV, PV, K232, K270 (UV absorption coefficient at 270 nm), but higher values of carotenoids and TPC, as compared to 3-phase (3P) and super-pressure (SP) systems. In another study involving ‘Moroccan Picholine’ virgin olive oil (VOO) from three extractions systems (2P, 3P, and SP), two crop seasons, and three sites (northeast of Morocco), the obtained outcomes proved that extraction systems had a very highly significant effect (p < 0.001) on chlorophylls (Chl), carotenoids (Car,) and TPC, and a highly significant impact on oxidative stability (OS, p < 0.001). Among extraction systems, 2P was marked by the highest levels of TPC, carotenoids, and OS, while the greatest content of chlorophylls was found in SP. Apart from these preliminary studies, there are no previous reports comparing ‘Moroccan Picholine’ oil quality according to extraction systems as well as to traditionally extracted olive oil namely, “Alwana oil” (AO), especially in terms of fatty acid and sterol profile. Hence, the originality of this work, which had as goals, (i) to determine olive oil physicochemical traits from the main Moroccan cultivar ‘Moroccan Picholine’ under local conditions of Taounate as one of the main productive provinces nationwide, and (ii) to compare three extraction systems and traditionally extracted oil from the same cultivar.

2. Materials and Methods

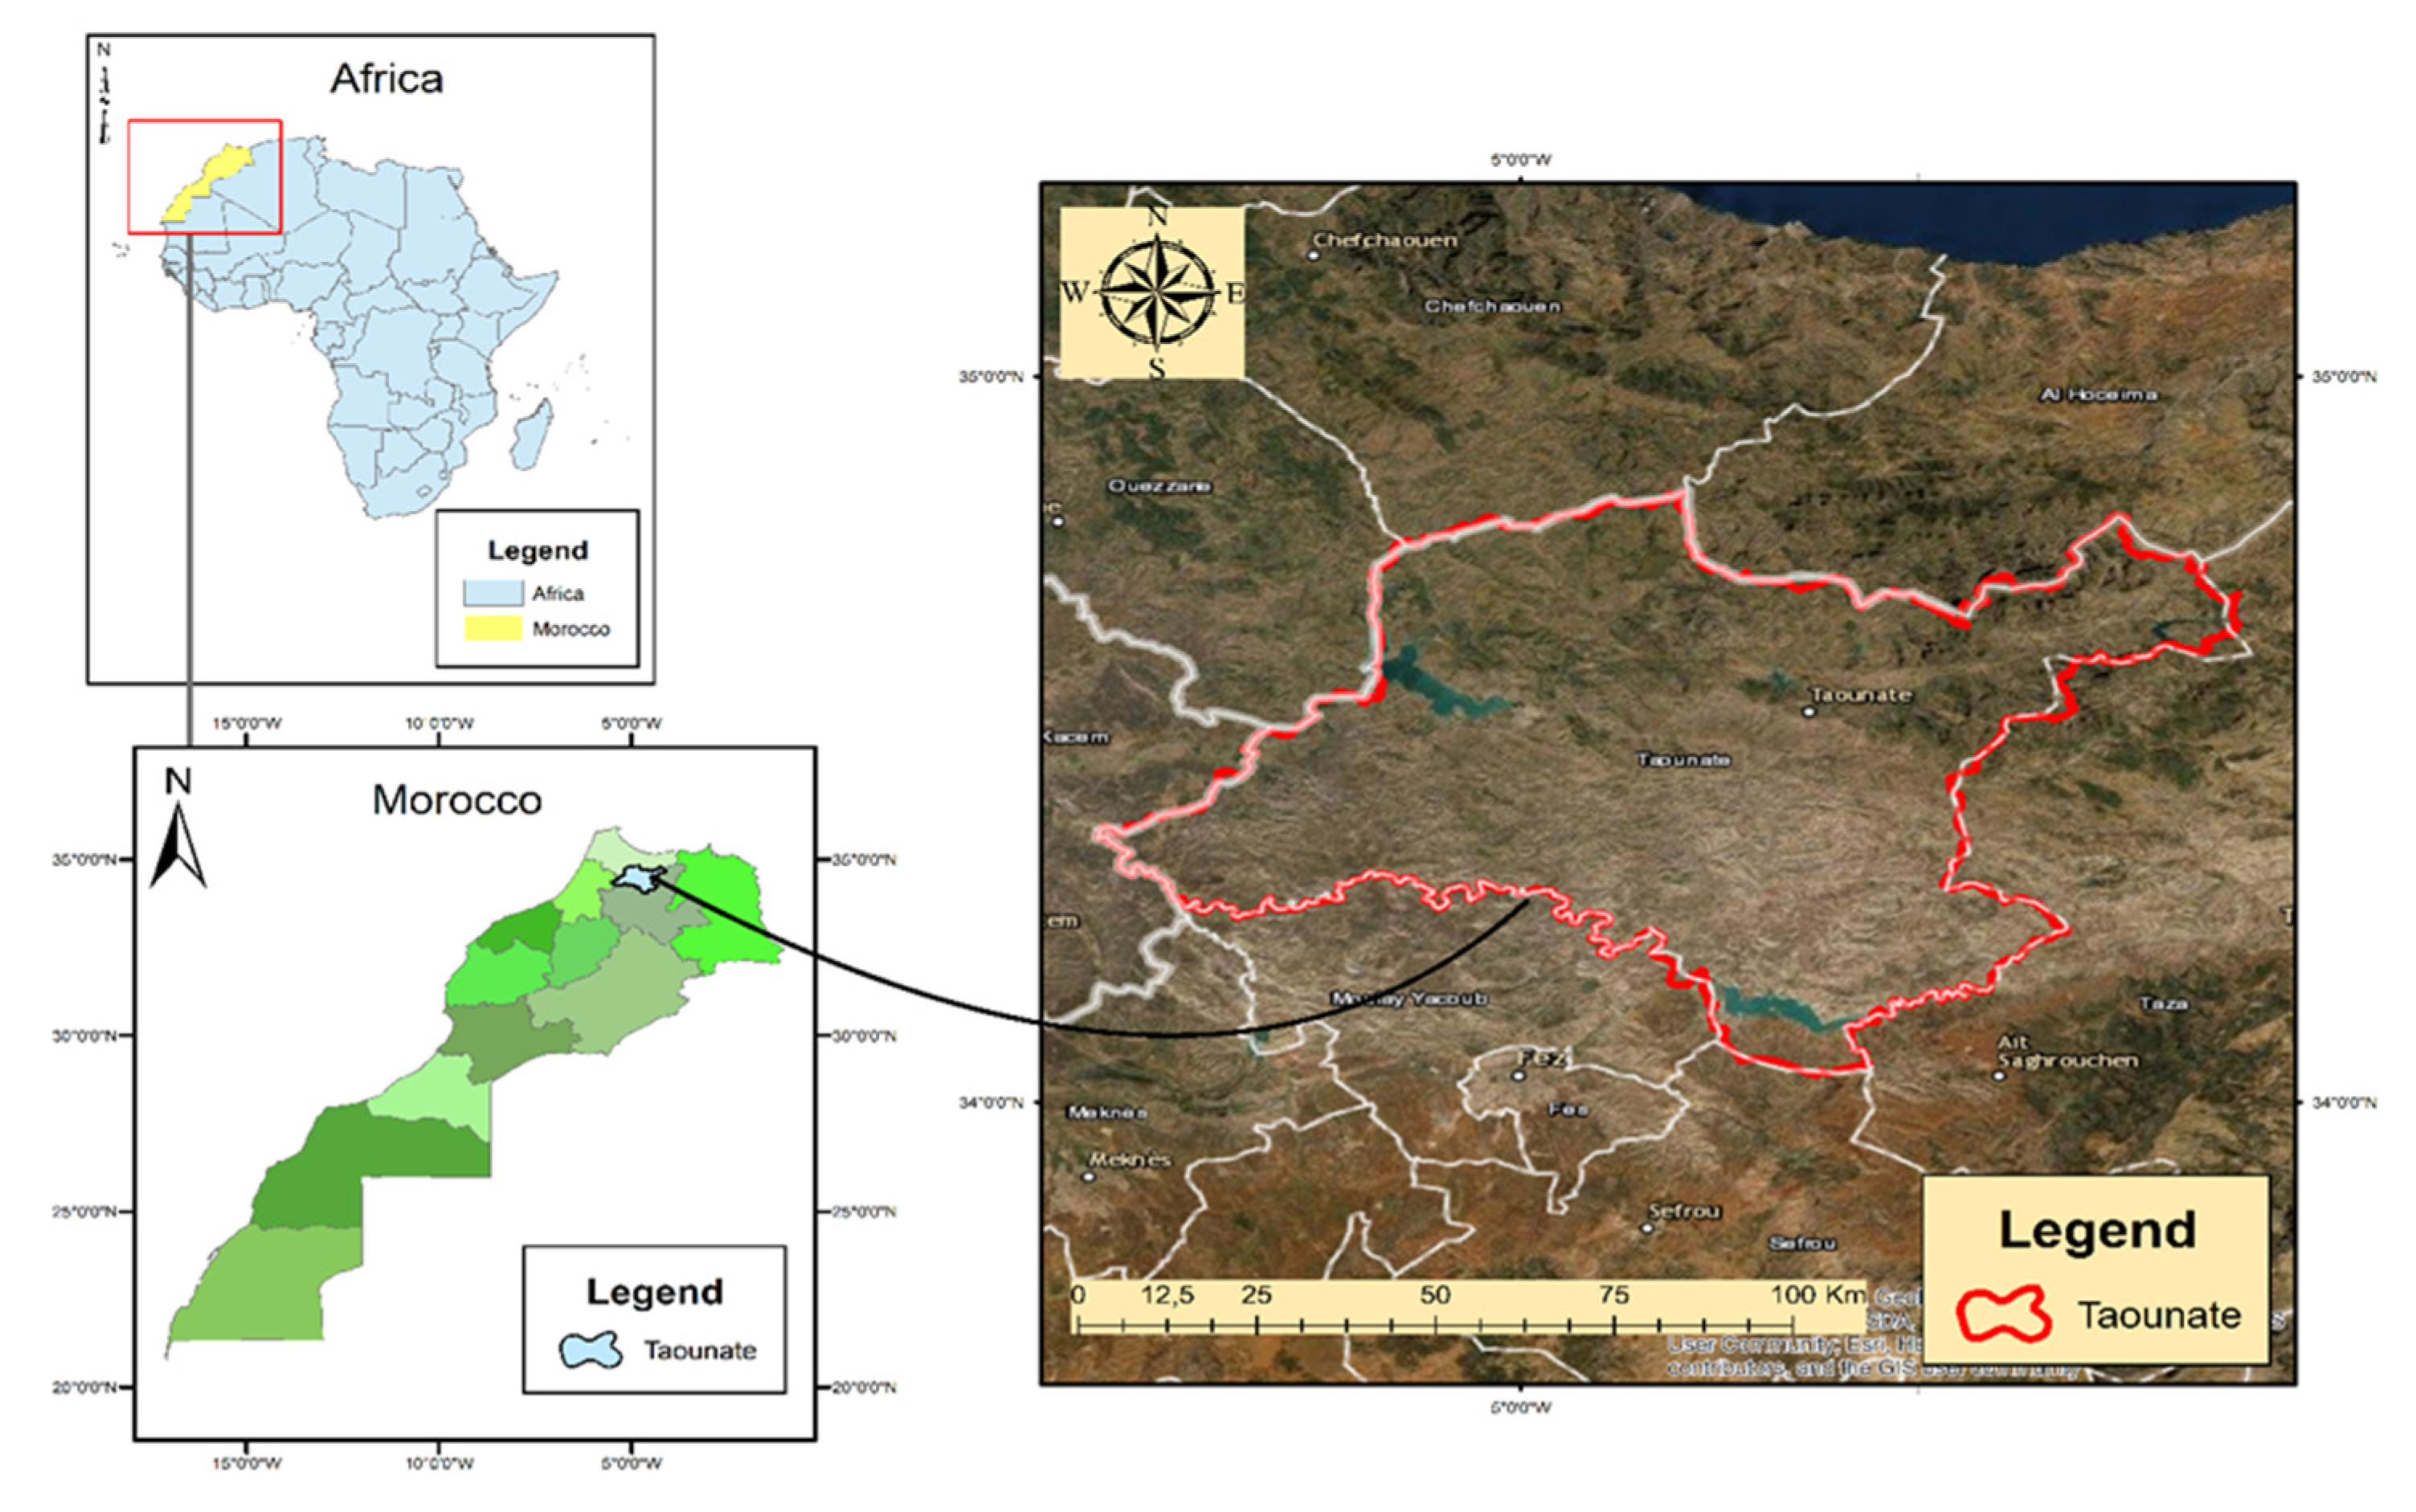
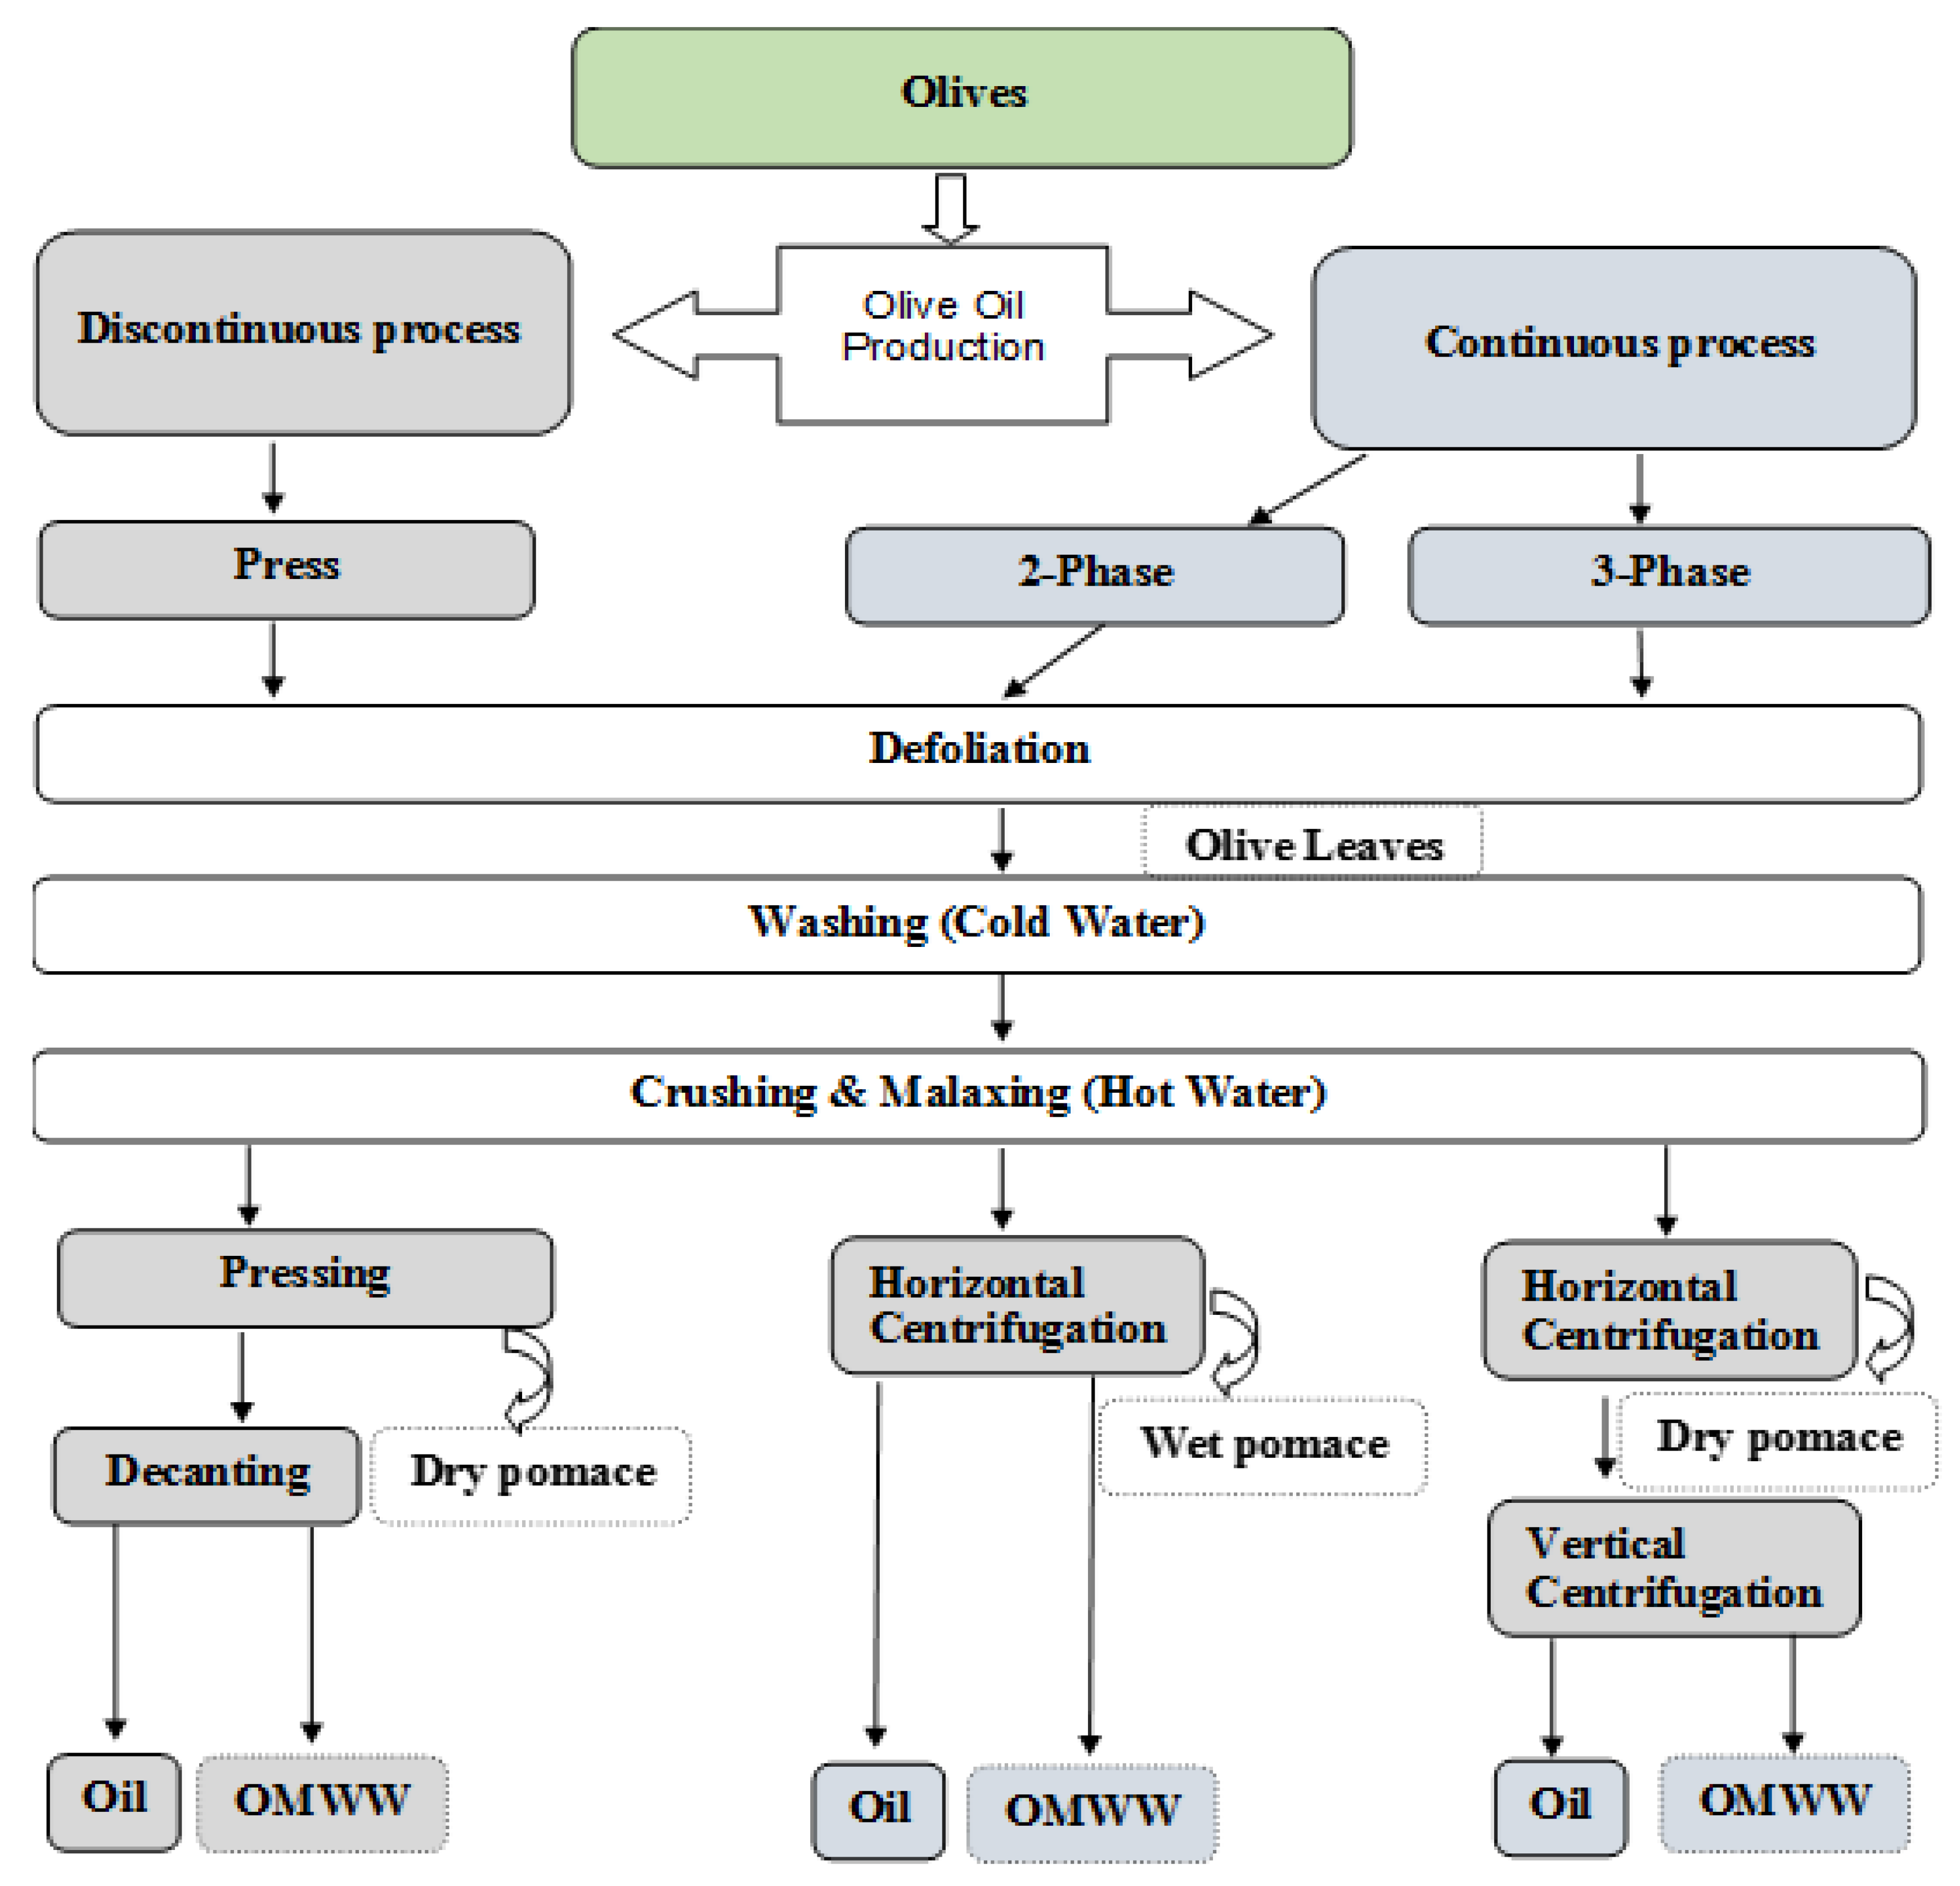
2.1. Sampling of Olive Oils

Sampling of olive oil was carried out in three districts (Tissa, Ain Aicha, and Ain Madiouna) belonging to Taounate province (34°31′48″ N, 4°42′36″ W) in central northern Morocco (Figure 1). Taounate province is characterized by a Mediterranean climate type, humid in winter but semi-arid in summer, according to the Köppen–Geiger classification. It receives 472 mm of annual precipitation, with an average temperature of 14.2 °C. For each district, we selected three local olive mills with three distinct (SP, 2P, and 3P) systems. Olive oil samples were collected at the end of November of the 2020 crop season. At sampling, olive fruits (cv. ‘Moroccan Picholine’) were at the same ripening stage (BBCH 89) according to the olive BBCH phenological scale defined by Rosetti et al. [16]. In fact, olives were at 5–6 ripening index, reaching the cultivar typical color, being turgid and thus suitable for oil extraction. Extraction processes and differences among the three extraction systems are given in our previous work (Figure 2) [17]. The collected samples were brought immediately to the laboratory in dark glass bottles consisting of 250 mL and stored at 4 °C until further analysis.
AO is a traditionally extracted olive oil following an ancestral method derived from heritage similar to that used in food argan oil extraction [18]. About 5 kg of olive fruits (BBCH 89), as previously described, were obtained from a local olive grove of ‘Moroccan Picholine’ cultivar conducted under rainfed conditions. Roasting was carried out in a ventilated oven (Precision Scientific Co., Waltham, MA, USA) for 12 h at a temperature not over than 120 °C. After that, roasted olives were ground, according to a local practice, between two stones. Small amounts (about 250 mL) of hot water were thereafter added to the mixture gradually until reaching a paste. Roasting allows the manufacturer to decrease olives’ moisture level and therefore makes grinding more efficient with low particle size, volume surface mean diameter, specific energy consumption, etc., as evidenced in Mohite et al. [19]. The obtained paste was poured into a 4.75 mm IS sieve (ASTM No. 4) and pressed for 3 h using a traditional press. For 5 kg of fruits, 700 mL of AO were obtained. The oil was kept at 4 °C for further analysis.

2.2. Evaluation of Quality Indices

Determination of free fatty acids or acid value (AV), peroxide value (PV), and UV specific extinction coefficients at 232 nm (K232) and 270 nm (K270) were performed according to the analytical methods as described in Regulations of the Commission of European Union, with slight modifications [20]. AV was expressed as % of oleic acid, was evaluated by the titration of a mixture of oil sample (10 g) and ethanol (80 mL) with an ethanolic potassium hydroxide at 0.1 N. PV was expressed as milliequivalents of active oxygen per a kilogram of oil (mEq O2 kg−1). It was measured on a sample of 5 g of olive oil, which was dissolved into 60 mL of isooctane–acetic acid (3:2, v/v). The mixture was then left to react, in darkness, with a saturated solution of potassium iodide. Iodine released by the peroxides was then titrated using a standardized solution of sodium thiosulphate solution (Na2S2O3) using starch as an indicator. K232 and K270 were determined using a 1% solution of olive oil dissolved into cyclohexane (1 g per 100 mL) and of a 1 cm path length. K232 and K270 were calculated based on UV absorbance at λ = 232 and λ = 270 nm, respectively. A UV-visible spectrophotometer (RAYLEIGH, UV-1800, Beijing Rayleigh Analytical Instrument Corporation (BRAIC), Beijing, China) was used for measurements.

2.3. Fatty Acid Determination

Fatty acids were firstly converted into their corresponding fatty acid methyl esters (FAME) via a transesterification following the standard method ISO [12966-2:2017]. About 0.1 g of each oil sample was introduced into a 10 mL screw-top test tube and 2 mL of isooctane was added and vigorously shacked. Thereafter, 0.1 mL of a methanolic solution of potassium hydroxide solution (2N) was added and stirred for 1 min. The obtained solution was allowed to stand during 2 min. The solution became clear and then cloudy due to separation of glycerol. Sodium chloride solution (2 mL) was then added, and the mixture was shacked. Isooctane layer formed was extracted and transferred into a sample vial. To this, 1 g of sodium hydrogen sulfate was added and shaken. Fatty acid composition was determined using a gas chromatograph (Agilent-6890) coupled to flame ionization detector (GC-FID). The capillary column CP-Wax 52CB was used (30 m × 250 μm i.d., and 0.25 μm film thickness). Helium was the carrier gas used with a flow rate of 1 mL min−1. Temperatures of the oven, injector, and detector were fixed at 185, 200, and 230 °C, respectively. Injection volume was 1 µL, and was carried out in a split mode with a split ratio of 1:50 as described in Ibourki et al. [21].

2.4. Sterol Evaluation

Sterol composition was determined according to ISO 12228-1:2014 [22]. Derivatives of sterol were evaluated using a gas chromatography instrument (an Agilent Technologies, Varian 3800). It is equipped with a VF-1 ms (30 m and 0.25 mm i.d.). The column temperature was maintained at 270 °C, while temperatures of the injector and detector were both set at 300 °C. Carrier gas used was helium with a flow rate of 1.6 mL min−1. Identification of individual peaks was performed via available standards by comparing known retention times of the sterols in EVOO. Three independent injections (1 μL each) were undertaken for each sample. Data were expressed as g of sterols per 100 g of oil sample [23].

2.5. Data Statistical Analyses

All measurements were performed at least in triplicate and then averaged. A least significant difference (LSD) test was used compare mean values at the 5% mark as a probability level. Principal component analysis (PCA), cluster analysis (CA), artificial neural network (ANN) as well as a correlations matrix were carried out on mean values. Such multivariate statistical approaches were chosen based on previous works [22,23,24,25,26,27,28]. Computations were carried out using STATGRAPHICS Centurion XVII package (Stat point Technologies, Inc., Warrenton, VA, USA).

3. Results and Discussion

3.1. Mean Values Comparison

Routinely measured quality indices are presented in Table 1. As can be seen, there were significant differences (p < 0.05) among different extraction techniques as well as traditionally extracted oil AO. Regarding humidity, both 3-phase system and 2-phase systems showed their superiority, while AO displayed the lowest humidity value (about 25% of the value observed in the case of 3P system). This could be assigned to water amounts added during extraction, which depend upon extraction system used. AV ranged from 0.54 (AO) to 0.72% (SP), while PV values were found to be between 16.10 (2P system) and 19.40 mEqO2 kg−1 (3P system). The greatest records of K232 (2.281) and K270 (0.154) were presented by SP. The lowest values were reported in AO (K232 = 1.182) and 2P (K270 = 0.117). Basic quality indices of olive oil from the ‘Moroccan Picholine’, grown under rainfed conditions according to extraction systems, were investigated. Important variations were found among extraction systems as well as traditionally extracted oil (AO). Values of quality indices including moisture, acid value, peroxide value, and both UV extinction coefficients were in line with the published literature for ‘Moroccan Picholine’ and other Mediterranean cultivars grown in various environments [9,15,29,30,31,32]. Such differences could be ascribed to a set of factors such as genotypic, pedoclimatic conditions, ripening degree, extraction technology and conditions, etc. Values of basic quality indices were below limits set by IOC [24], demonstrating that the studied olive oils belong to the EVOO category. Expectedly, oil samples from 3P system was marked by higher levels of humidity, which could be ascribed to higher amounts of water added during extraction. Similar results were found by Khdair et al. [33], who studied impact of extraction technology on olive oil quality from Jordan. These authors reported higher values of PV, Acidity, K232, K270 in traditional systems (super-pressure) as compared to two-phase and three-phase systems. Likewise, similar trends were observed for olive oil from Jordan [33]. Stillitano et al. [10] observed the superiority of classical extraction technology (pressing system) over innovative extraction techniques in terms of basic quality indices for oil olive from Italy. Our results coincided also with findings of Issaoui et al. [9] for olive oil from several cultivars grown in Tunisia. Low values of AV, PV, K232, and K270, observed generally in continuous extraction systems, could be ascribed to various variables involved in extraction processes including crushing machinery, temperatures applied, contact duration with water as well as water volume added [8]. Khdair et al. [33] reported relatively higher values of basic quality indices, especially for traditional extraction systems as compared to ours. This could be explained, according to the same authors, by the fact that local conventional mills are very old, and their practices do not respect any cleanness rules or quality controls.
Following Khdair et al. [33], olive oils obtained from the two-phase mills were classified as extra-virgin olive oil. Conversely, olive oils obtained from the three-phase mill were ranged from extra to ordinary virgin olive oil. On the contrary, olive oils obtained from the three conventional mills were classified as a lampante virgin olive oil. The two-phase decanters produce high quality olive oils with higher contents of total polyphenols, which makes them more resistant to oxidation during storage. However, oxidative stability can be enhanced through adding natural antioxidant recovered from plants and food by-products, as recently reviewed in Fadda et al. [34].
The most important components in vegetable oils are fatty acids (Table 2). It is note worth mention that the characteristics, stability, and nutritive value of a given vegetable oil depend strongly upon the fatty acid composition.
According to these outcomes, the 3P system presented the highest values of C16:0, C16:1, C18:2, C18:3, SFA and PUFA, as well as the lowest records of C18:0, C18:1, C20:0, and MUFA. AO showed the greatest values of C18:0, C18:1, C18:1, C20:0, C21:0 and MUFA, but the smallest contents of C16:0, C16:1, C18:2, C18:3, SFA, and PUFA. Trans fatty acids content varied between 0.09 ± 0.01 (SP) and 0.04 ± 0.01 (AO). Regarding trans fatty acids, the greatest value was found in the super-pressure system, while the lowest one was displayed by traditionally extracted oil (AO). Our values of trans fatty acids were below the limits set by European norms. Values of fatty acids and were comparable with the published literature on olive oil from ‘Moroccan Picholine’ as well as other Mediterranean cultivars [9,29,32]. However, important variations existed according to genotype, geographic area, and extraction technology, among others. Fatty acid composition was dominated by MUFA (mainly C18:1), followed by SFA (mostly C16:0 and C18:0), and finally PUFA (C18:2). As reported in our results, Issaoui et al. [9] found high levels of C18:1 and MUFA in the pressure system, whereas the greatest contents of C16:0, C16:1, C18:2, C18:3, SFA, PUFA were achieved in the case of continuous systems, dual-phase and triple-phase decanter centrifugation. Likewise, other authors [8,9,10,11] also reported similar trends among extraction systems, with higher MUFA but lower SFA and PUFA for pressure system. Such variations are in agreement with the published literature and could attributed to a set of mechanical processes such crushing, malaxation, and centrifugation, amounts of water added seem to influence endogenous enzymes activities (pectinase, lipase, lipoxygenase, hydroperoxidelyase, beta-glucosidase, etc) as discussed in Clodoveo et al. [13].
Phytosterols, otherwise referred to as sterols, are the second class of compounds found in olive oil after fatty acids. Mean values of sterol composition is reported in Table 3. As evidenced in these outcomes, there were significant differences among extraction techniques in terms of sterols except for brassicasterol and β-sitosterol. 3P system showed its superiority for cholesterol, ∆7-stigmasterol, and ∆7-avenasterol, while the greatest values of campesterol found 2P. The greatest value of β-sitosterol was shared between 2P system and SP. AO mas marked by the lowest values of campesterol, β-sitosterol, ∆7-stigmasterol, and ∆7-avenasterol. Continuous systems (2P and 3P) were marked by high β-sitosterol and values of ratio defined by campesterol/stigmasterol. These results were in agreement with the published literature [9]. This differential distribution of sterols among extraction systems could be assigned to many factors such crushing machinery, malaxation, temperatures applied, exposure to atmospheric oxygen, contact duration with water as well as water volume added [12,13].

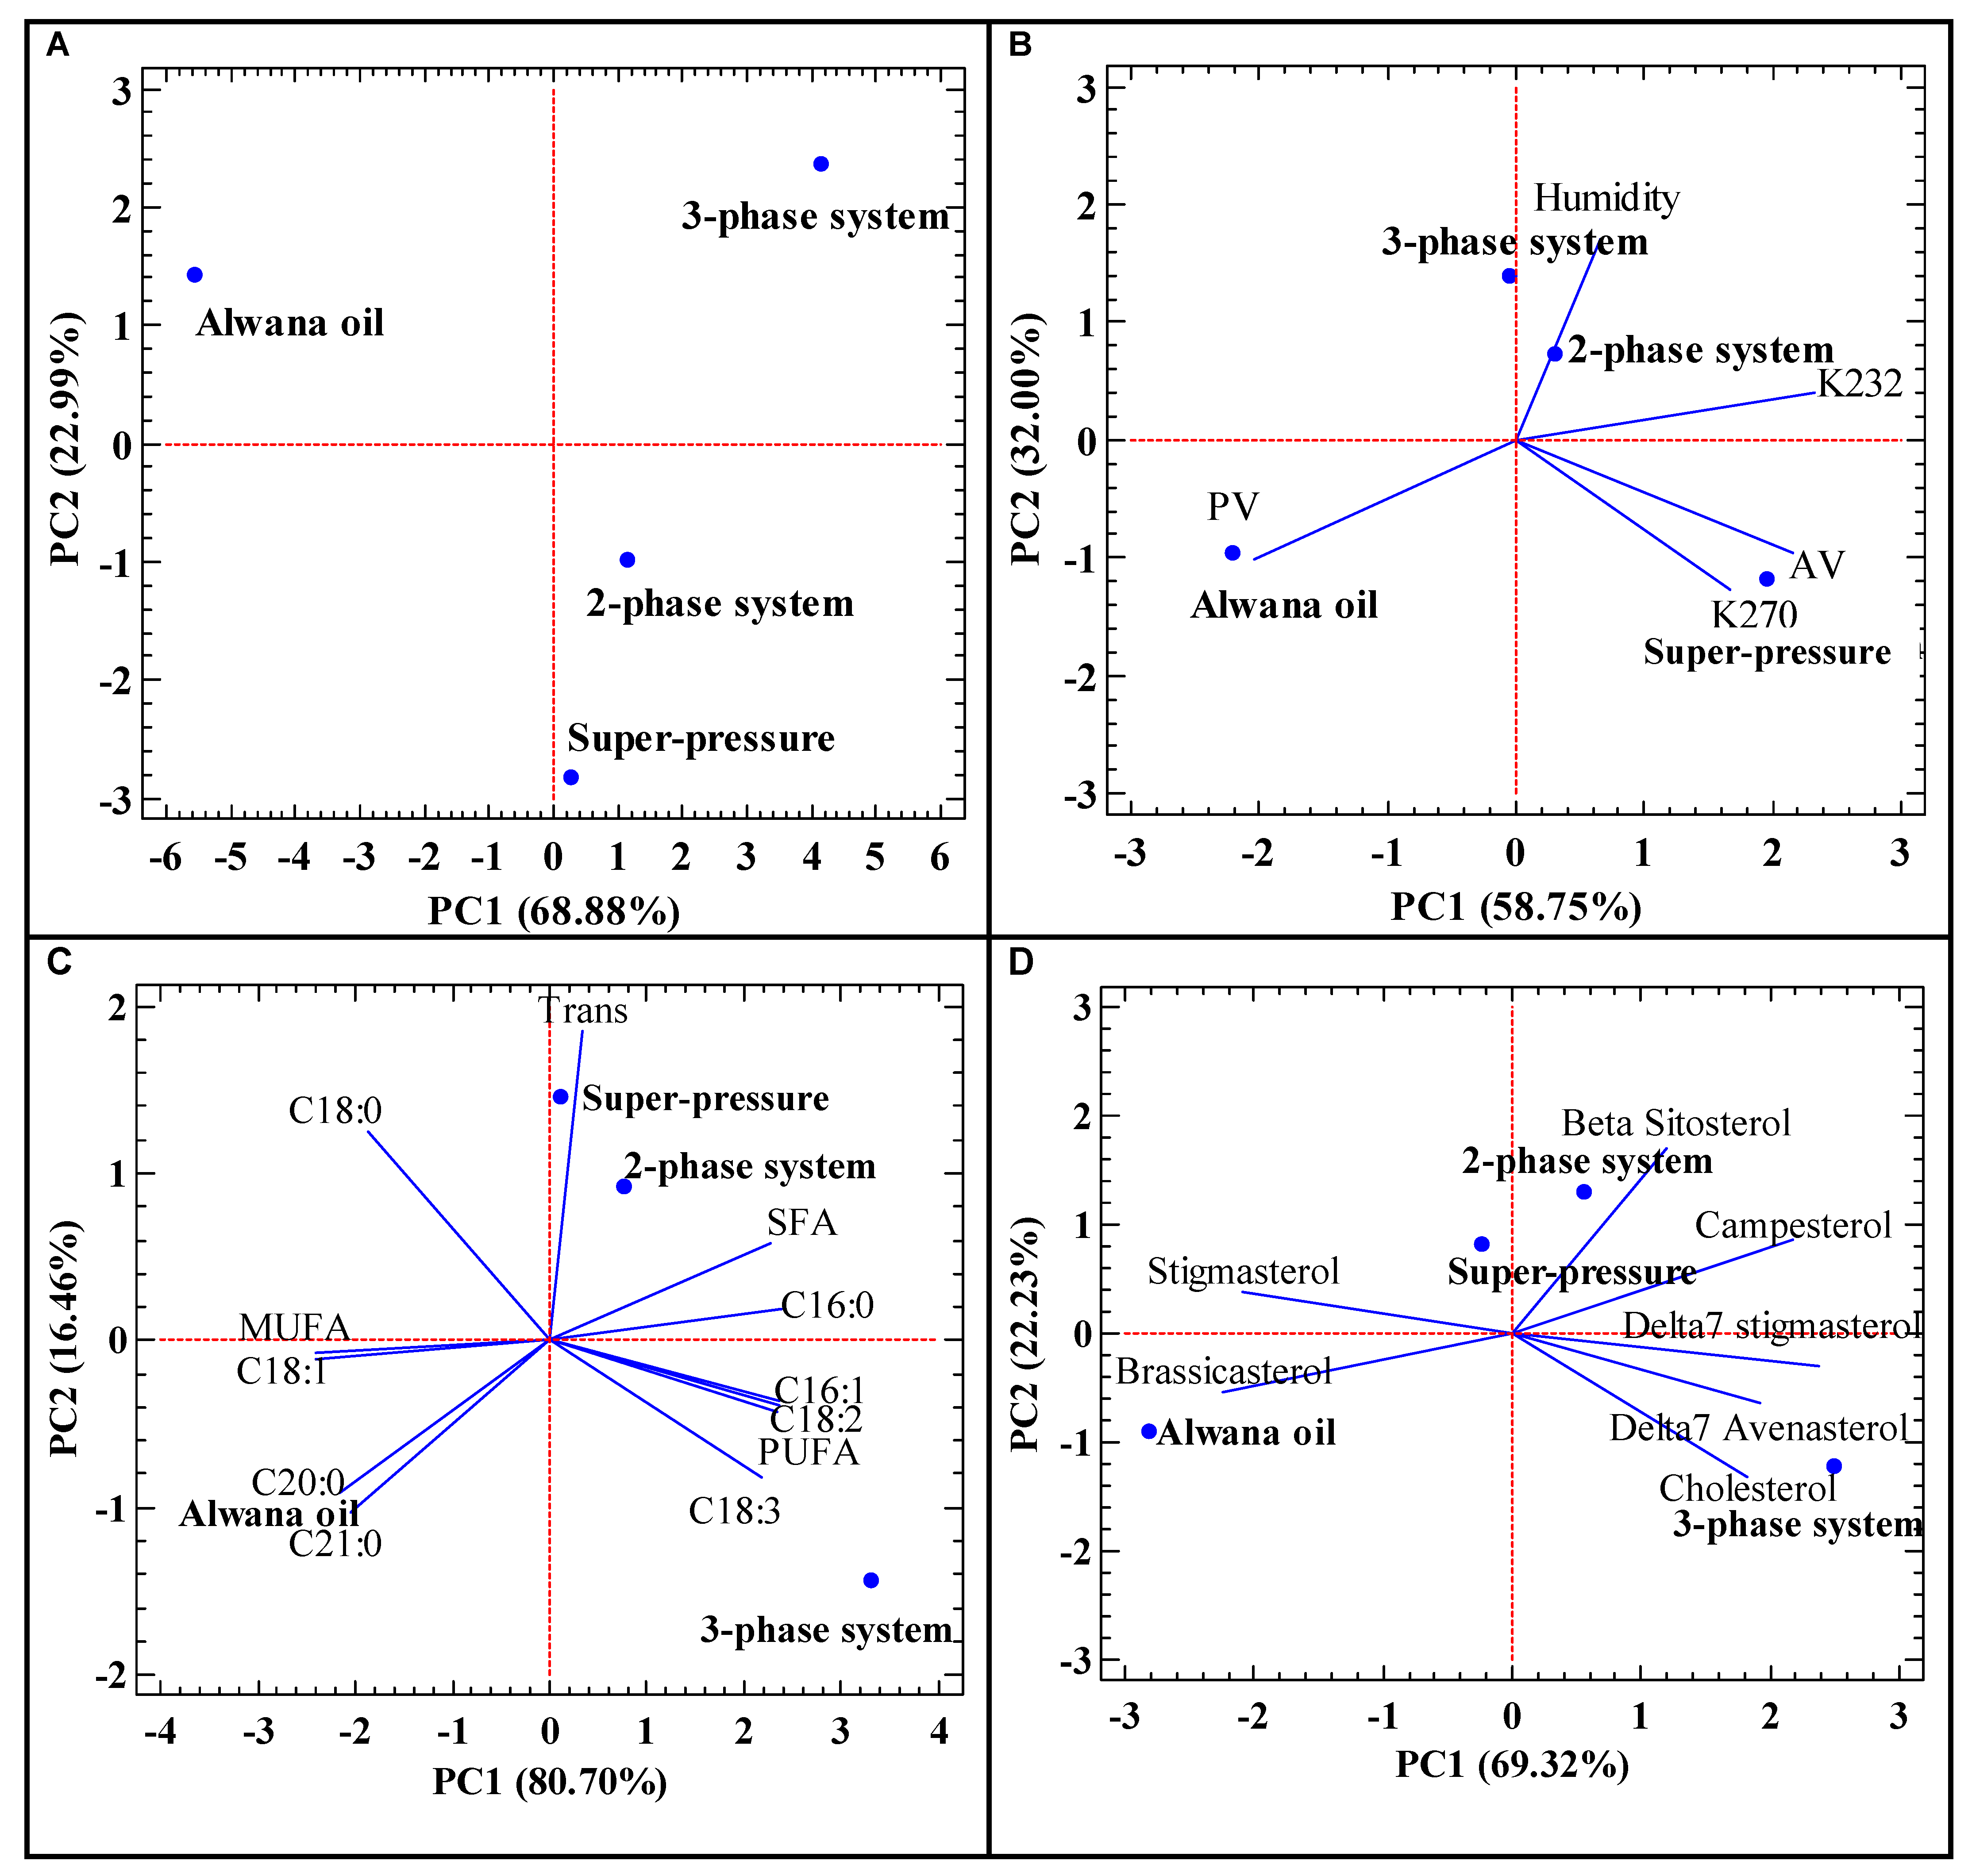
3.2. Principal Component Analysis

PCA was used, in the current work, as a multivariate statistical approach for a possible separation of extraction techniques based on the studied dependent variables (basic quality indices, fatty acid, and sterol profile). According to PCA outcomes, the first two components (PCs) allowed us to explain over 90% of total data variability. These two PCs were retained as the main components. As can be seen in Figure 3A, the four extraction techniques were separated through the first two PCs, accounting for about 92% of data variability. Figure 3B shows mean values of routinely measured quality indices, plotted against extraction techniques distributed on the surface made by PC1 and PC2. Furthermore, both 3-phase and 2-phase systems interacted with higher values of humidity. On the positive direction of PC1 (58.75%) was distributed the mean value of super-pressure system with higher values of AV, K232, and K270, while AO (“Alwana oil”) was associated with the highest value of PV on the negative side of the same component (PC1). As evidenced in Figure 3C, dependent variables are fatty acids; PC1 (80.70%) allowed the separation of traditionally extracted oil (“Alwana oil”) toward the negative side of PC1 from the three remaining systems (2P, 3P, and SP). These were plotted the on positive side of PC1. Moreover, super-pressure system was linked to higher level of trans fatty acids, while the 2-phase system was marked by higher contents of SFA and C16:0. Likewise, the 3-phase system interacted with great contents of C16:1, C18:2, PUFA, C18:3 as well as SFA, and finally AO (“Alwana oil”) was marked by higher records of C18:0, C18:1, C20:0, C21:0 as well as MUFA. In Figure 3D, dependent variables are sterols and the total data variation explained by the first two components exceeded 91%. There was a distribution of extraction techniques according to PC1 (69.32%). Both 2-phase (associated with higher β-sitosterol and campestrol) and 3-phase (higher records of cholesterol, ∆7-stigmasterol, and ∆7-avenasterol) were distributed towards the positive side of PC1. AO (“Alwana oil”) was plotted on the negative side of the same component, with the best records of stigmasterol and brassicasterol. PCA was applied in previous studies to investigate vegetable oil physiochemical traits and their variability [35,36]. Our results were in agreement with previously published works regarding the use of PCA to discriminate extraction techniques [11,14]. In fact, Lechhab et al. [37] used PCA to reveal effects of pedoclimatic factors on the phenolic composition of ‘Moroccan Picholine’ olive oil. PCA is also widely used in many scientific fields like food science and chemometrics, among others [25,26,27,28].

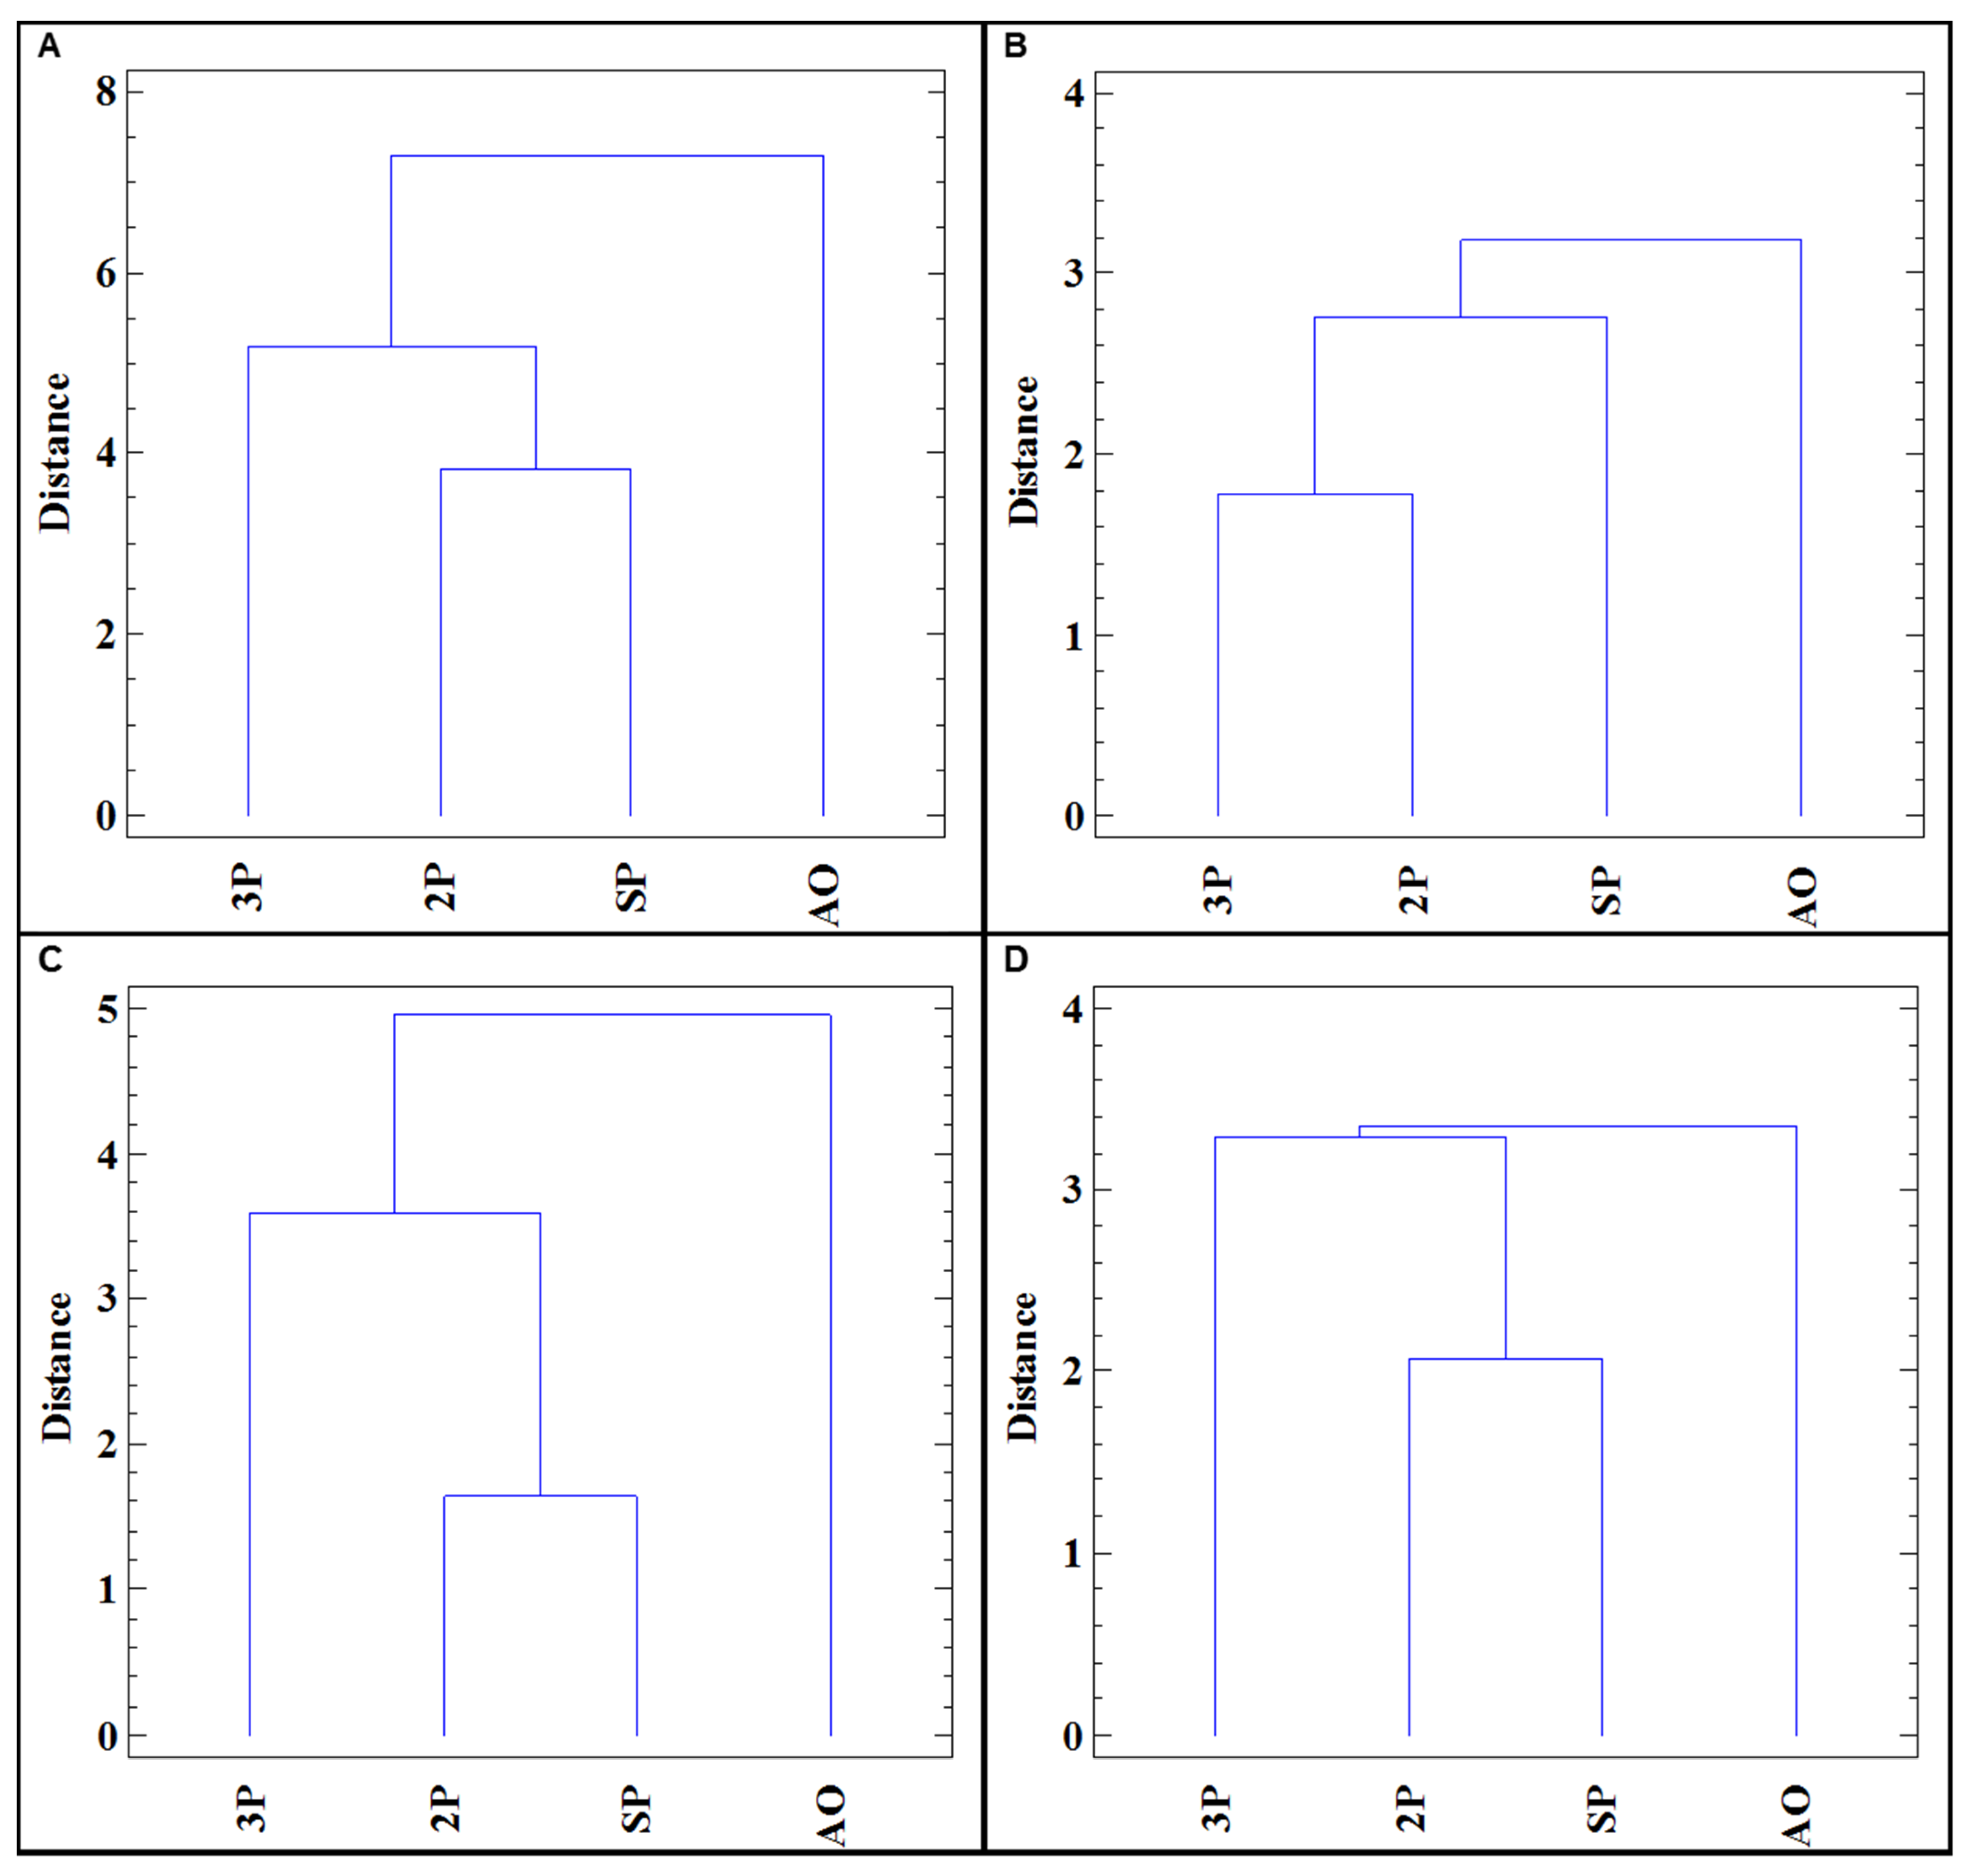
3.3. Cluster Analysis

Cluster analysis (CA) was performed, firstly on all the investigated quality attributes. CA was also carried out separately on mean values of basic quality indices (humidity, AV, PV, K232, and K270), fatty acids, sterols, as well as CA had the objective to examine similarity among extraction techniques as well as traditionally extracted oil. The outcomes of CA are illustrated in Figure 4. Based on these outcomes, analyzed oil samples from different extraction methods showed important variations. When considering all the investigated quality attributes (Figure 4A), it seems that oil samples were divided into two groups. The first one consists of AO, while the second had two clusters consisting of 3P system on one hand and 2P together with SP on the other hand (with a Euclidian distance was about 3.75). Figure 4B shows CA based on basic quality indices, and it appears that there were two main clusters. The first one contains AO, while the second was divided into two sub-clusters. These consisted of SP on one hand, and 2P along with 3P (with a Euclidian distance of 1.8) on the other hand. Similarly, Figure 4C presents CA based on the fatty acid profile. Following these results, there were two main clusters. The first one consisted of AO, while the second had two sub-clusters whose Euclidean distance was around 3.6. The first sub-cluster was a 3P system, while 2P together with SP formed the second the sub-cluster with 1.6 as a Euclidian distance. Finally, Figure 4D shows CA based on sterol composition. As it can be observed in this figure, two main clusters can be distinguished; the first contained AO and the second showed two sub-clusters, with a Euclidian distance of about 3.3. The first sub-cluster was 3P system and the second contained both 2P and SP at about 2 as a Euclidian distance. CA was used together with ANN, PCA, and other modeling approaches to study pattern variation in vegetable oils including olive oil [38,39,40,41]. Our outcomes are supported by those of De Luca et al. [42], who used derivative FTIR spectroscopy for classification of Moroccan olive oils based on CA output.

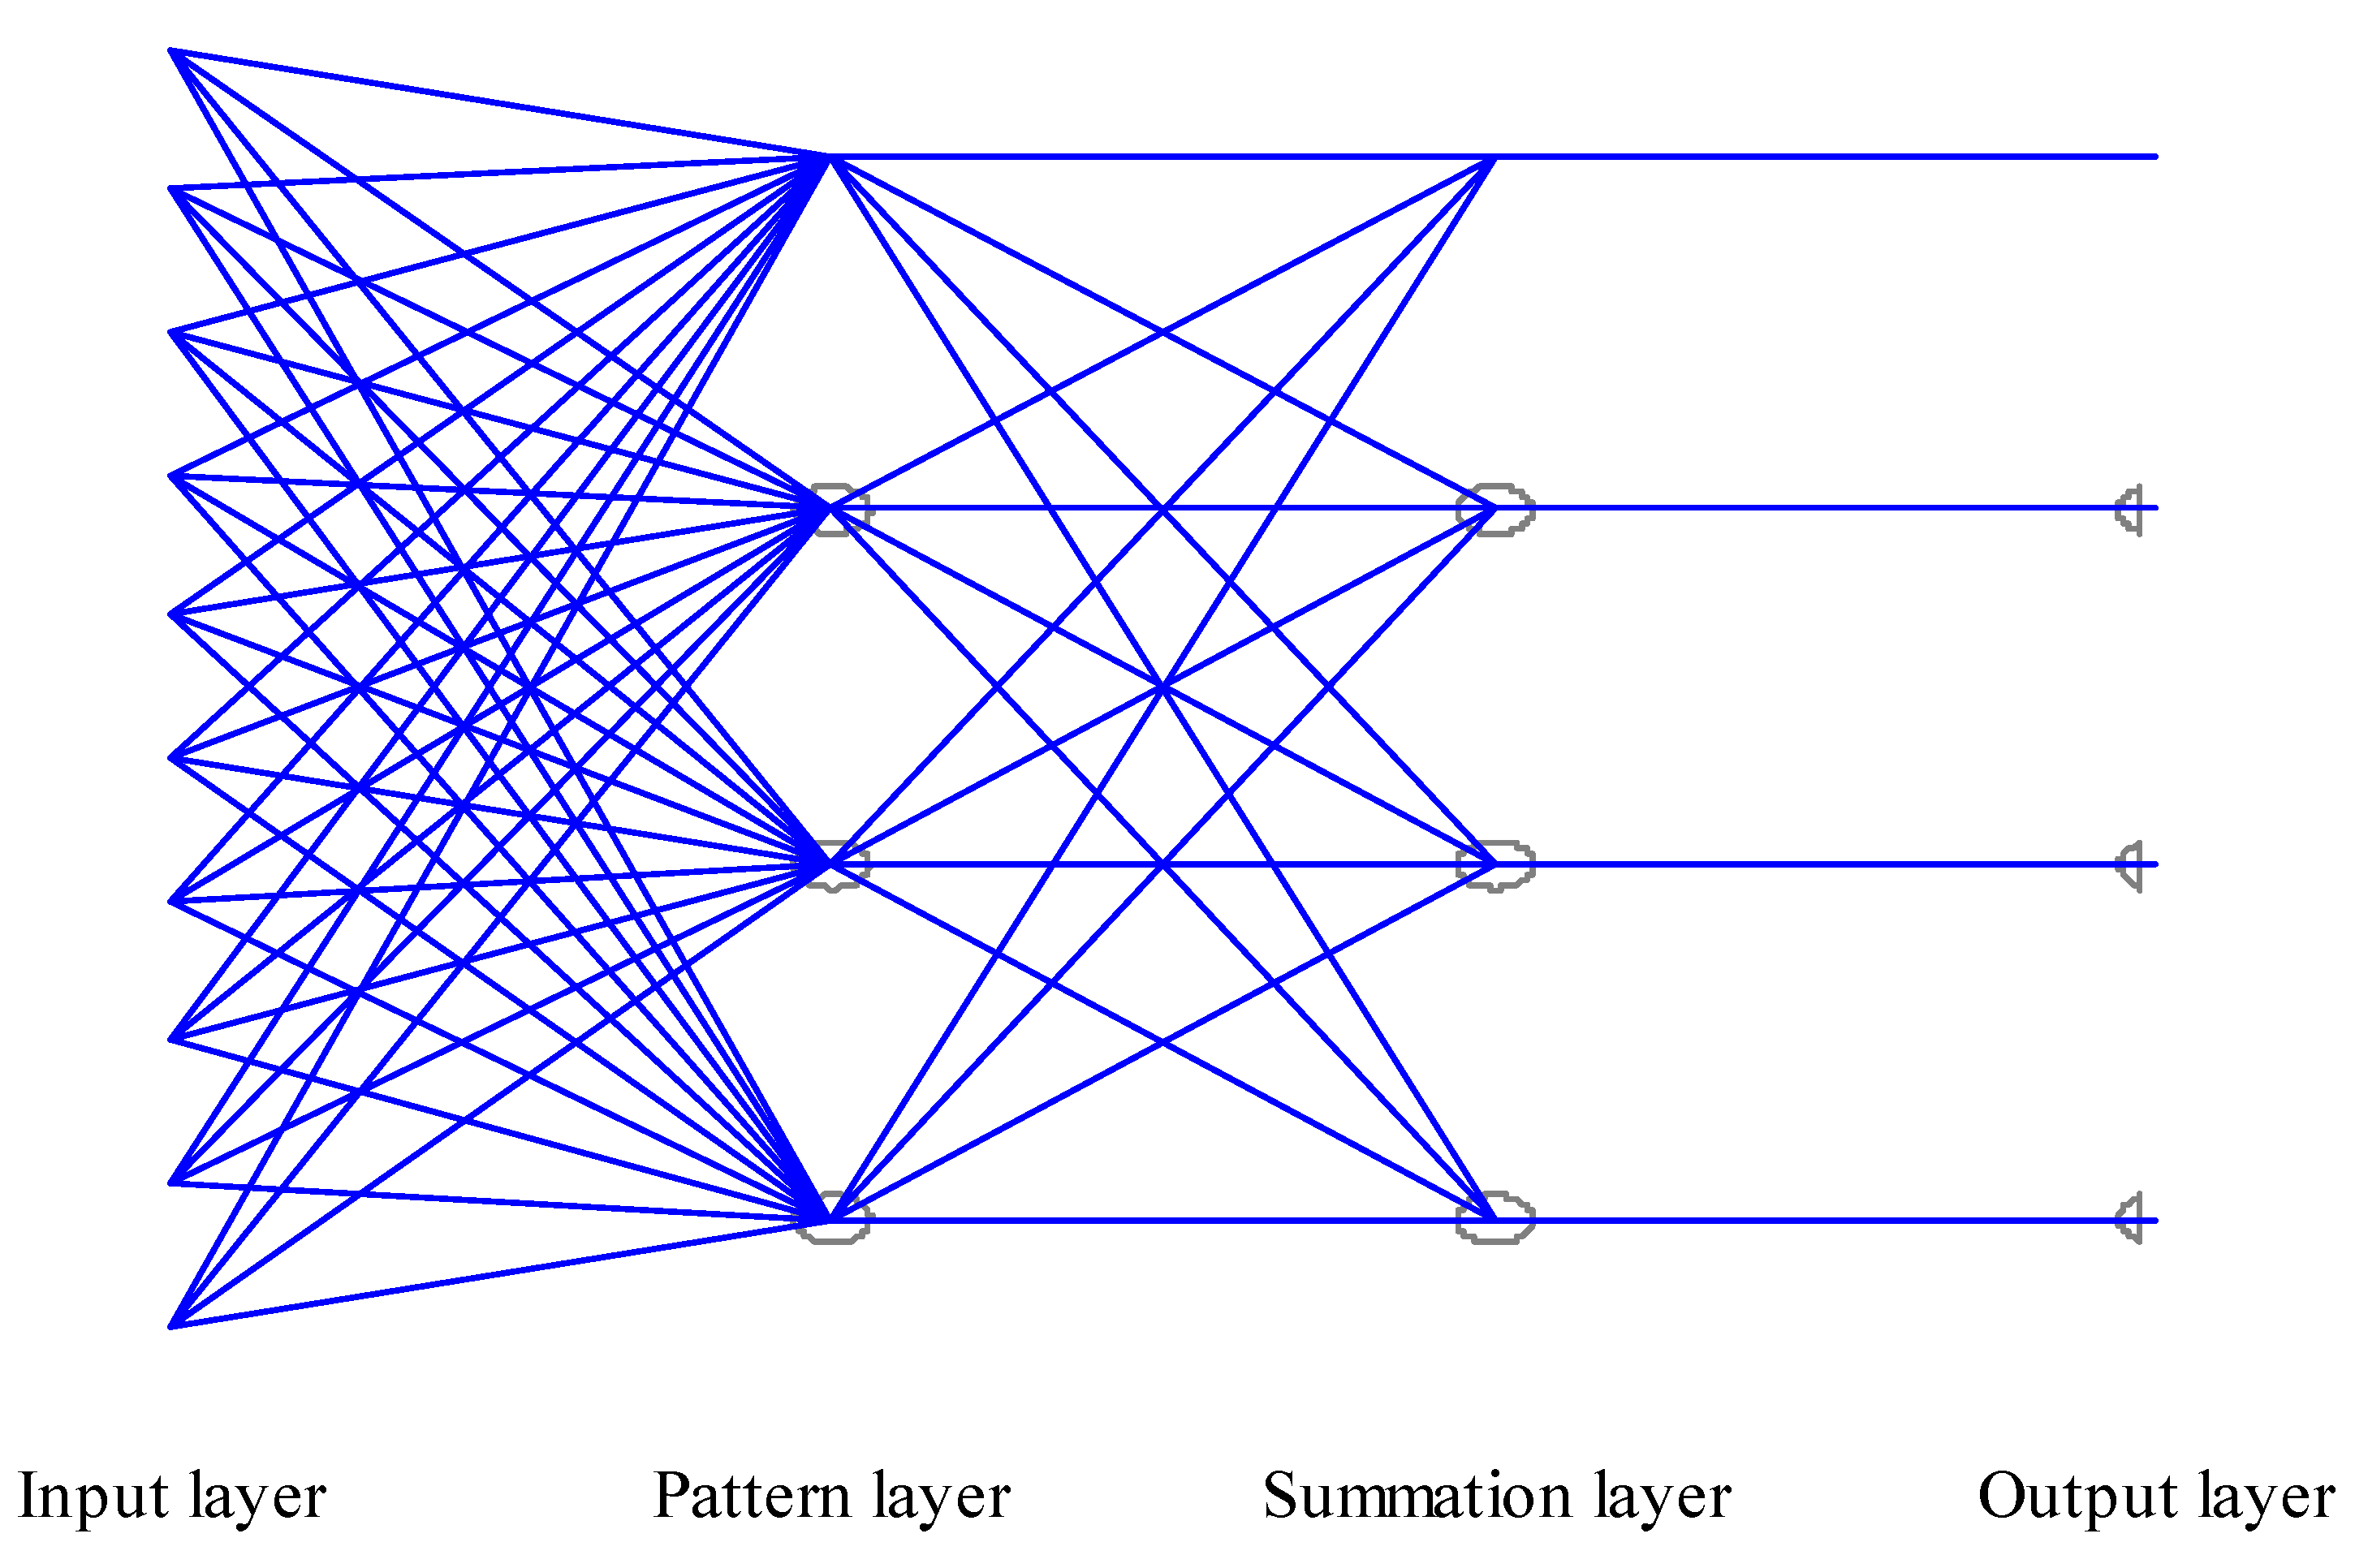
3.4. Artificial Neural Network (ANN)

ANN was carried out based on mean values of fatty acid as input layers. ANN is a supervised pattern recognition approach and at the heart of machine learning algorithms. In the field of food science, ANN based models are used for classification, prediction as well as clustering [35]. In this multivariate method, data set is divided into two sub-sets namely training and test sets with the aim to examine the success of the performed models. In our study, ANN was performed to classify olive oil samples from different extraction technologies. As evidenced in Figure 5, input layer consisted of fatty acids as independent variables (also 10 neurons), hidden layer consisted of 4 pattern and then summation neurons and finally an output layer whose neurons number was 4, which coincide with the 4 kind of extractions methods. Multivariate analysis such as ANN along with PCA and CA were used to reduce data dimensionality and classify olive oil based physicochemical traits of oil samples. These multivariate statistical approaches are widely used in discriminate and classify vegetable oils according to genotypic variations, extraction technology, and geographic area, among others [35,36,37,38,39]. More recently Cervera-Gascó et al. [40] have used successfully ANN as a tool to predict and identify monovarietal olive oils from Spain. ANN and PCA were successfully used for classification of Turkish olive oil based on analytical parameters by Gumus et al. [35].

3.5. Correlation Study

Pearson correlation was carried out on mean values to analyze possible associations among studied dependent variables (Table 4). As evidenced in these outcomes, important negative and positive correlations were highlighted among the studied olive oil physicochemical traits. Regarding basic quality indices, K232 and K270 were positively linked to each other. They also correlated positively with AV. This was positively associated to PV and humidity. Likewise, PV was negatively correlated to the remaining basic quality indices. SFA (mainly C16:0 and C18:0) were positively correlated with C16:0, C16:1, C18:0, C18:0, C18:2, C18:3, and K232 on one hand and negatively associated with C18:1, C20:0, C21:0, and PV on the other hand. MUFA were positively linked to C18:0, C18:1, C20:0, C21:0, and PV. In contrast, MUFA were negatively correlated with SFA, C18:3, C18:2, C16:0, C16:1, K232, and humidity levels. PUFA was correlated positively to SFA, humidity level and negatively linked to MUFA as well as PV. Trans fatty acids were correlated positively to K232, K270, and AV. Cholesterol was positively associated with MUFA, but negatively with PUFA and humidity level. Brassicasterol was positively correlated with MUFA and PV, but it was negatively associated with PUFA, SFA, humidity, and K232. Campesterol was negatively linked to brassicasterol, MUFA, and PV, but positively linked to SFA, K232, and humidity. Stigmasterol was negatively correlated with campesterol, cholesterol, PUFA, and PV, but it was positively correlated with brassicasterol and MUFA. β-sitosterol was negatively correlated with brassicasterol, MUFA, and PV, but negatively linked to trans, SFA, K232, and AV. ∆7-stigmasterol was correlated negatively to stigmasterol, brassicasterol, MUFA, and PV, but it was positively correlated to campesterol, cholesterol, PUFA, SFA, and humidity. Finally, ∆7-avenasterol was negatively linked to MUFA but positively associated with ∆7-stigmasterol, cholesterol, PUFA, and humidity content.
These important correlations highlighted among the studied parameters could be a basis for simple and multiple regressions models, especially in the case of strong correlations. The main basic quality indices were positively linked to each other, in agreement with the published literature [35]. In fact, oxidation products like hydroperoxides and corresponding derivatives (evaluated through AV and PV) are conjugated diene and triene. These absorb at 232 and 270 nm, respectively. Hydroperoxides, as primary oxidation products, absorb light at 232 nm and they are unstable and quickly converted into secondary products of oxidation (mainly diketones along with unsaturated ketones), absorbing at 270 nm. This could explain the positive associations among K232, K270, and AV. Moisture level (humidity) presents low or insignificant correlations with basic quality indices. However, it has been suggested that vegetable oil moisture content has to be monitored cautiously to avoid oxidation [43]. Also, some important correlations were reported among fatty acids as well as among fatty acids and sterols [27,36,44]. In particular, the interesting highly and strong negative association between MUFA (mainly oleic acid) and PUFA (mostly linoleic acid). As discussed in Sakar et al. [36], oleic acid seems to be controlled by its conversion to linoleic acid, likely involving the enzyme oleic desaturase. This has been assumed to controls the variation of these fatty acids.

4. Conclusions

In this paper, effects of extraction techniques on olive oil from cv ‘Moroccan Picholine’ were investigated via multivariate analysis. Based on routinely measured quality indices, our oil samples were classified as EVOO. Significant differences (p < 0.05) were revealed among extraction processes as revealed by PCA, CA and ANN. Oil olive obtained by continuous extraction techniques (2P and 3P) showed its high quality as compared to that from the remaining techniques (traditionally extracted oil). Indeed, oil samples from super pressure and “Alwana” oil marked by high records of PV, AV, K270, trans fatty acids likely due to partial oxidation during extraction. AO was marked by high MUFA, stigmasterol, brassicasterol; the 2-phase system displayed greater levels of SFA and β-sitosterol; and finally the 3-phase presented higher PUFA and SFA, ∆7-avenasterol, and ∆7-stigmasterol. There were strong positive and negative correlations, which could be a basis for simple and multiple regression models. Olive oil samples were separated and classified with PCA, CA, and ANN. Further investigations are needed for modelling quality parameters in ‘Moroccan Picholine’ cultivar using ANN.

Author Contributions

Conceptualization, E.H.S.; methodology, E.H.S. and S.G.; software, E.H.S.; validation, E.H.S., A.K. and Z.A.; formal analysis, E.H.S., J.G., S.G., and A.Z.; investigation, E.H.S., J.G.; resources, E.H.S., A.Z.; data curation, A.K. and Z.A.; writing—original draft preparation, E.H.S., S.G.; writing—review and editing, E.H.S.; visualization, S.G.; supervision, E.H.S. All authors have read and agreed to the published version of the manuscript.

Funding

This research received no external funding.

Institutional Review Board Statement

Not applicable.

Informed Consent Statement

Not applicable.

Data Availability Statement

Not applicable.

Acknowledgments

Authors are grateful to local growers and owners of industrial olive mills for their kind assistance during sampling.

Conflicts of Interest

The authors declare no conflict of interest.

Abbreviations

2P2-phase extraction system
3P3-phase extraction system
ANNArtificial neural network
AOAlwana oil (traditionally extracted olive oil)
AVAcid value
BBCHBiologische Bundesanstalt, Bundessortenamt and CHemical industry (a phenological scale)
CACluster analysis
CarCarotenoids
ChlChlorophylls
ETExtraction technology
EVOOExtra-virgin olive oil
FAMEFatty acid methyl ester
K232UV absorption coefficient at λ = 232
K270UV absorption coefficient at λ = 270
LSDLeast significant difference
mEq Milliequivalents
MUFAMonounsaturated fatty acid
OCOil content
OMWWOlive mill wastewater
OSOxidative stability
PCPrincipal component
PCAPrincipal component analysis
PUFAPolyunsaturated fatty acid
PVPeroxide value
SDStandard deviation
SFASaturated fatty acid
SPSuper-pressure
TPCTotal phenolic content
UVUltraviolet
VOOVirgin olive oil

References

  1. FAOSTAT. FAO Statistical Yearbook; FAO: Rome, Italy, 2022. [Google Scholar]
  2. PDA (Provincial Direction of Agriculture). Report of the Provincial Direction of Agriculture; PDA: Taounate, Morocco, 2021.
  3. Inglese, P.; Famiani, F.; Galvano, F.; Servili, M.; Esposto, S.; Urbani, S. Factors affecting extra-virgin olive oil composition. Hortic. Rev. 2011, 38, 83–147. [Google Scholar] [CrossRef]
  4. Romero, N.; Saavedra, J.; Tapia, F.; Sepúlveda, B.; Aparicio, R. Influence of agroclimatic parameters on phenolic and volatile compounds of Chilean virgin olive oils and characterization based on geographical origin, cultivar and ripening stage. J. Sci. Food Agr. 2016, 96, 583–592. [Google Scholar] [CrossRef] [PubMed]
  5. Hadiddou, A.; Oukabli, A.; Moudaffar, C.; Mamouni, A.; Gaboun, F.; Mekaoui, A.; H’ssaini, L.; El Fechtali, M. Evaluation des performances de production de 14 variétés d’olivier (Olea europaea L.) nationales et méditerranéennes dans deux systèmes contrastés de culture (pluvial et irrigué) au Maroc. Al Awamia 2013, 127, 22–43. [Google Scholar]
  6. García-Garví, J.M.; Sánchez-Bravo, P.; Hernández, F.; Sendra, E.; Corell, M.; Moriana, A.; Burgos-Hernández, A.; Carbonell-Barrachina, Á.A. Effect of Regulated Deficit Irrigation on the Quality of ‘Arbequina’ Extra Virgin Olive Oil Produced on a Super-High-Intensive Orchard. Agronomy 2022, 12, 1892. [Google Scholar] [CrossRef]
  7. El Yamani, M.; Sakar, E.H.; Boussakouran, A.; Rharrabti, Y. Influence of ripening index and water regime on the yield and quality of ‘Moroccan Picholine’ virgin olive oil. OCL 2020, 27, 19. [Google Scholar] [CrossRef]
  8. Amirante, P.; Clodoveo, M.L.; Leone, A.; Tamborrino, A.; Patel, V.B. Influence of different centrifugal extraction systems on antioxidant content and stability of virgin olive oil. In Health and Diseas Prevention; Preedy, V.R., Watson, R.R., Eds.; Academic Press Ltd.: Cambridge, MA, USA; Elsevier Science Ltd.: London, UK, 2010; pp. 85–93. [Google Scholar] [CrossRef]
  9. Issaoui, M.; Gharbi, I.; Flamini, G.; Cioni, P.L.; Bendini, A.; Gallina Toschi, T.; Hammami, M. Aroma compounds and sensory characteristics as biomarkers of quality of differently processed Tunisian virgin olive oils. Int. J. Food Sci. Technol. 2015, 50, 1764–1770. [Google Scholar] [CrossRef]
  10. Stillitano, T.; Falcone, G.; De Luca, A.I.; Piga, A.; Conte, P.; Strano, A.; Gulisano, G. A life cycle perspective to assess the environmental and economic impacts of innovative technologies in extra virgin olive oil extraction. Foods 2019, 8, 209. [Google Scholar] [CrossRef] [Green Version]
  11. Ben-Hassine, K.; Taamalli, A.; Rezig, L.; Yangui, I.; Benincasa, C.; Malouche, D.; Kamoun, N.; Mnif, W. Effect of processing technology on chemical, sensory, and consumers’ hedonic rating of seven olive oil varieties. Food Sci. Nutr. 2022, 10, 863–878. [Google Scholar] [CrossRef]
  12. Clodoveo, M.L. An overview of emerging techniques in virgin olive oil extraction process: Strategies in the development of innovative plants. J. Agric. Eng. 2013, 44, 297–305. [Google Scholar] [CrossRef]
  13. Clodoveo, M.L.; Hbaieb, R.H.; Kotti, F.; Mugnozza, G.S.; Gargouri, M. Mechanical strategies to increase nutritional and sensory quality of virgin olive oil by modulating the endogenous enzyme activities. Compr. Rev. Food Sci. 2014, 13, 135–154. [Google Scholar] [CrossRef]
  14. El Yamani, M.; Sakar, E.H.; Boussakouran, A.; Rharrabti, Y. Effect of storage time and conditions on the quality characteristics of ‘Moroccan Picholine’ olive oil. Biocatal. Agric. Biotechnol. 2022, 39, 102244. [Google Scholar] [CrossRef]
  15. El Yamani, M.; Sakar, E.H.; Mansouri, F.; Serghini-Caid, H.; Elamrani, A.; Rharrabti, Y. Effect of pigments and total phenols on oxidative stability of monovarietal virgin olive oil produced in Morocco. Riv. Ital. Sostanze Gr. 2019, 96, 17–24. [Google Scholar]
  16. Rosetti, M.V.; Flemmer, A.C.; Hernández, L.F. A detailed description of morphological and anatomical characters of olive (Olea europaea) fruits in relation to phenological growth stages. Ann. Appl. Biol. 2019, 174, 402–412. [Google Scholar] [CrossRef]
  17. Sakar, E.H.; Gharby, S. Olive Oil: Extraction Technology, Chemical Composition, and Enrichment Using Natural Additives. In Olive Cultivation, 2nd ed.; Yonar, T., Ed.; IntechOpen: London, UK, 2022; pp. 1–18. [Google Scholar] [CrossRef]
  18. Gharby, S.; Harhar, H.; Farssi, M.; Taleb, A.A.; Guillaume, D.; Laknifli, A. Influence of roasting olive fruit on the chemical composition and polycyclic aromatic hydrocarbon content of olive oil. OCL 2018, 25, A303. [Google Scholar] [CrossRef] [Green Version]
  19. Mohite, A.M.; Mishra, A.; Sharma, N. Effect of Different Grinding Processes on Powder Characteristics of Tamarind Seeds. Agric. Res. 2020, 9, 262–269. [Google Scholar] [CrossRef]
  20. European Union Commission. 2020 Annual Report: The EU Agri−Food Fraud Network and the Administrative Assistance and Cooperation System; European Union Commission: Brussels, Belgium, 2021; pp. 1–21.
  21. Ibourki, M.; Azouguigh, F.; Jadouali, S.M.; Sakar, E.H.; Bijla, L.; Majourhat, K.; Gharby, S.; Laknifli, A. Physical Fruit Traits, Nutritional Composition, and Seed Oil Fatty Acids Profiling in the Main Date Palm (Phoenix dactylifera L.) Varieties Grown in Morocco. J. Food Qual. 2021, 2021, 5138043. [Google Scholar] [CrossRef]
  22. ISO. ISO12966-2: 2017; Animal and Vegetable Fats and Oils. Gas Chromatography of Fatty Acid Methyl Esters—Part 2: Preparation of Methyl Esters of Fatty Acids. International Organization for Standardization: Geneva, Switzerland, 2017.
  23. Seçilmiş, Ş.S.; Koçak Yanık, D.; Fadiloğlu, S.; Göğüş, F. A comparative study on performance of industrial and microwave techniques for sunflower oil bleaching process. Food Chem. 2021, 365, 130488. [Google Scholar] [CrossRef]
  24. IOC (Interantional Olive Coucil). IOC Standards, Methods and Guides. International Olive Council. Available online: https://www.internationaloliveoil.org/what-we-do/chemistry-standardisation-unit/standards-and-methods/ (accessed on 25 December 2021).
  25. Bijla, L.; Aissa, R.; Bouzid, H.A.; Sakar, E.H.; Ibourki, M.; Gharby, S. Spent coffee ground oil as a potential alternative for vegetable oil production: Evidence from oil content, lipid profiling, and physicochemical characterization. Biointerface Res. Appl. Chem. 2022, 12, 6308–6320. [Google Scholar] [CrossRef]
  26. Bijla, L.; Ibourki, M.; Ait Bouzid, H.; Sakar, E.H.; Aissa, R.; Laknifli, A.; Gharby, S. Proximate Composition, Antioxidant Activity, Mineral and Lipid Profiling of Spent Coffee Grounds Collected in Morocco Reveal a Great Potential of Valorization. Waste Biomass Valor. 2022, 1–16. [Google Scholar] [CrossRef]
  27. Boukyoud, Z.; Ibourki, M.; Gharby, S.; Sakar, E.H.; Bijla, L.; Atifi, H.; Matthäus, B.; Laknifli, A.; Charrouf, Z. Can the water quality influence the chemical composition, sensory properties, and oxidative stability of traditionally extracted argan oil? Mediterr. J. Nutr. Metab. 2021, 4, 383–399. [Google Scholar] [CrossRef]
  28. Ibourki, M.; Bouzid, H.A.; Bijla, L.; Aissa, R.; Sakar, E.H.; Ainane, T.; Gharby, S.; Hammadi, A.E. Physical fruit traits, proximate composition, fatty acid and elemental profiling of almond [Prunus dulcis Mill. DA Webb] kernels from ten genotypes grown in southern Morocco. OCL 2022, 29, 13. [Google Scholar] [CrossRef]
  29. Mansouri, F.; Moumen, A.B.; Belhaj, K.; Richard, G.; Fauconnier, M.L.; Sindic, M.; Caid, H.S.; Elamrani, A. Effect of crop season on the quality and composition of extra virgin olive oils from Greek and Spanish varieties grown in the Oriental region of Morocco. Emir. J. Food Agr. 2018, 30, 549–562. [Google Scholar] [CrossRef]
  30. Bajoub, A.; Carrasco-Pancorbo, A.; Ajal, E.A.; Maza, G.B.; Fernández-Gutiérrez, A.; Ouazzani, N. Contribution to the establishment of a protected designation of origin for Meknès virgin olive oil: A 4-years study of its typicality. Food Res. Int. 2014, 66, 332–343. [Google Scholar] [CrossRef]
  31. Bajoub, A.; Hurtado-Fernández, E.; Ajal, E.A.; Fernández-Gutiérrez, A.; Carrasco-Pancorbo, A.; Ouazzani, N. Quality and chemical profiles of monovarietal north Moroccan olive oils from “Picholine Marocaine” cultivar: Registration database development and geographical discrimination. Food Chem. 2015, 179, 127–136. [Google Scholar] [CrossRef]
  32. El Qarnifa, S.; El Antari, A.; Hafidi, A. Effect of maturity and environmental conditions on chemical composition of olive oils of introduced cultivars in Morocco. J. Food Qual. 2019, 2019, 1854539. [Google Scholar] [CrossRef] [Green Version]
  33. Khdair, A.I.; Ayoub, S.; Abu-Rumman, G. Effect of pressing techniques on olive oil quality. Am. J. Food Technol. 2015, 10, 176–183. [Google Scholar] [CrossRef]
  34. Fadda, A.; Sanna, D.; Sakar, E.H.; Gharby, S.; Mulas, M.; Medda, S.; Yesilcubuk, N.S.; Karaca, A.C.; Gozukirmizi, C.K.; Lucarini, M.; et al. Innovative and Sustainable Technologies to Enhance the Oxidative Stability of Vegetable Oils. Sustainability 2022, 14, 849. [Google Scholar] [CrossRef]
  35. Gumus, Z.P.; Ertas, H.; Yasar, E.; Gumus, O. Classification of olive oils using chromatography, principal component analysis and artificial neural network modelling. J. Food Meas. Charact. 2018, 12, 1325–1333. [Google Scholar] [CrossRef]
  36. Sakar, E.H.; El Yamani, M.; Boussakouran, A.; Ainane, A.; Ainane, T.; Gharby, S.; Rharrabti, Y. Variability of oil content and its physicochemical traits from the main almond [Prunus dulcis Mill. DA Webb] cultivars grown under contrasting environments in North-Eastern Morocco. Biocatal. Agric. Biotechnol. 2021, 32, 101952. [Google Scholar] [CrossRef]
  37. Lechhab, T.; Salmoun, F.; Lechhab, W.; El Majdoub, Y.O.; Russo, M.; Camillo, M.R.T.; Trovato, E.; Dugo, P.; Mondello, L.; Cacciola, F. Determination of bioactive compounds in extra virgin olive oils from 19 Moroccan areas using liquid chromatography coupled to mass spectrometry: A study over two successive years. Eur. Food Res. Technol. 2021, 247, 2993–3012. [Google Scholar] [CrossRef]
  38. Chen, S.; Du, X.; Zhao, W.; Guo, P.; Chen, H.; Jiang, Y.; Wu, H. Olive oil classification with Laser-induced fluorescence (LIF) spectra using 1-dimensional convolutional neural network and dual convolution structure model. Spectrochim. Acta A Mol. Biomol. Spectrosc. 2022, 279, 121418. [Google Scholar] [CrossRef] [PubMed]
  39. Sakar, E.H.; El Yamani, M.; Rharrabti, Y. Variability of oil content and its physicochemical traits from five almond (Prunis dulcis) cultivars grown in northern Morocco. J. Mater. Environ. Sci. 2017, 8, 2679–2686. [Google Scholar]
  40. Cervera-Gascó, J.; Rabadán, A.; López-Mata, E.; Álvarez-Ortí, M.; Pardo, J.E. Development of the POLIVAR model using neural networks as a tool to predict and identify monovarietal olive oils. Food Control. 2022, 143, 109278. [Google Scholar] [CrossRef]
  41. Gharby, S.; Hajib, A.; Ibourki, M.; Sakar, E.H.; Nounah, I.; El Moudden, H.; Elibrahimi, M.; Harhar, H. Induced changes in olive oil subjected to various chemical refining steps: A comparative study of quality indices, fatty acids, bioactive minor components, and oxidation stability kinetic parameters. Chem. Data Collect. 2021, 33, 100702. [Google Scholar] [CrossRef]
  42. De Luca, M.; Terouzi, W.; Ioele, G.; Kzaiber, F.; Oussama, A.; Oliverio, F.; Tauler, R.; Ragno, G. Derivative FTIR spectroscopy for cluster analysis and classification of Morocco olive oils. Food Chem. 2011, 124, 1113–1118. [Google Scholar] [CrossRef]
  43. Oubannin, S.; Bijla, L.; Gagour, J.; Hajir, J.; Aabd, N.A.; Sakar, E.H.; Salama, M.A.; Gharby, S. A Comparative Evaluation of Proximate Composition, Elemental Profiling and Oil Physicochemical Properties of Black Cumin (Nigella sativa L.) Seeds and Argan (Argania spinosa L. Skeels) Kernels. Chem. Data Collect. 2022, 41, 100920. [Google Scholar] [CrossRef]
  44. Vecka, M.; Staňková, B.; Kutová, S.; Tomášová, P.; Tvrzická, E.; Žák, A. Comprehensive sterol and fatty acid analysis in nineteen nuts, seeds, and kernel. SN Appl. Sci. 2019, 1, 1531. [Google Scholar] [CrossRef]
Figure 1. Map showing the sampling area, Taounate province (central northern Morocco).
Agriengineering 04 00059 g001
Figure 2. Scheme of discontinuous and continuous extraction systems. OMWW = olive mill wastewater according to Sakar and Gharby [17].
Agriengineering 04 00059 g002
Figure 3. Principal component projections for the first three components that most impact the investigated olive oil physicochemical traits taken together (A), basic quality indices (B), fatty acids (C), and sterols composition (D). Blue segments represent dependent variables and points plotted represent mean values. AV = acid value, PV = peroxide value, UV absorption coefficients K232 and K270, SFA = saturated fatty acids, MUFA = monounsaturated fatty acids, and PUFA = polyunsaturated fatty acids.
Agriengineering 04 00059 g003
Figure 4. Dendrogram performed based on Euclidean distance in studied almond genotypes. (A) = dependent variables are all studied parameters, (B) = based quality indices (AV, PV, humidity, K232, and K270), (C) = fatty acids, and (D) = sterols.
Agriengineering 04 00059 g004
Figure 5. Structure of ANN model to classify oil samples from different extraction technologies as well as Alwana oil (traditionally extracted olive oil).
Agriengineering 04 00059 g005
Table 1. Mean values of routinely measured quality indices: namely humidity, acid value (AV), peroxide value (PV), UV absorption coefficients K232 and K270. Results are expressed as mean ± SD (n = 9). Within each column, values followed by the same letter are not significantly different at p < 0.05.
Extraction SystemHumidity (%)AV
(% Oleic Acid)
PV
(mEq O2 kg−1)
K232K270
3P 0.15 ± 0.02 a0.64 ± 0.01 bc19.40 ± 0.02 a1.853 ± 0.01 bc0.144 ± 0.02 b
2P0.08 ± 0.01 b0.70 ± 0.02 b16.10 ± 0.04 c2.160 ± 0.02 a0.117 ± 0.01 b
SP 0.07 ± 0.01 b0.72 ± 0.03 a18.50 ± 0.03 b2.281 ± 0.04 a0.154 ± 0.04 a
AO0.04 ± 0.01 c0.54 ± 0.02 c18.99 ± 0.02 b1.182 ± 0.03 c0.140 ± 0.05 b
IOC Standard [24]-<0.8<20<2.5<0.20
Table 2. Mean values of fatty acids in olive oil (cv ‘Moroccan Picholine’) according to the extraction system. Results are expressed as mean ± SD (n = 9). Within each column, values followed by the same letter are not significantly different at p < 0.05. SFA = saturated fatty acids, MUFA = monosaturated fatty acids, and PUFA = polysaturated fatty acids.
Extraction
System
C16:0
(%)
C16:1
(%)
C18:0
(%)
C18:1
(%)
C18:2
(%)
C18:3
(%)
C20:0
(%)
C21:0
(%)
SFA
(%)
MUFA
(%)
PUFA
(%)
Trans
(%)
3P 12.46 ± 0.01 a0.93 ± 0.01 a2.29 ± 0.01 b68.6 ± 0.01 c14.62 ± 0.01 a1.08 ± 0.01 a0.30 ± 0.01 b0.26 ± 0.01 b15.31 ± 0.01 a69.53 ± 0.01 d15.16 ± 0.01 a0.06 ± 0.01 c
2P11.88 ± 0.01 ab0.73 ± 0.01 b2.85 ± 0.01 a70.3 ± 0.01 b12.73 ± 0.01 b0.9 ± 0.01 b0.31 ± 0.01 b0.25 ± 0.01 b 15.29 ± 0.01 a71.03 ± 0.01 c 13.68 ± 0.01 b0.08 ± 0.01 b
SP 11.46 ± 0.01 ab0.72 ± 0.01 b2.83 ± 0.01 a71.3 ± 0.01 b12.57 ± 0.01 b0.91 ± 0.01 b0.30 ± 0.01 b0.26 ± 0.01 b14.85 ± 0.01 b72.02 ± 0.01 b13.13 ± 0.01 b0.09 ± 0.01 a
AO9.89 ± 0.01 b 0.55 ± 0.01 c2.90 ± 0.01 a74.9 ± 0.01 a 10.79 ± 0.01 c0.82 ± 0.01 c0.40 ± 0.01 a0.30 ± 0.01 a13.49 ± 0.01 c75.45 ± 0.01 a11.06 ± 0.01 c0.04 ± 0.01 d
Table 3. Mean values of sterols in olive oil (cv ‘Moroccan Picholine’) according to extraction system. Results are expressed as mean ± SD (n = 9). Within each column, values followed by the same letter are not significantly different at p < 0.05.
Extraction SystemCholesterol
(%)
Brassicasterol
(%)
Campesterol
(%)
Stigmasterol
(%)
β-Sitosterol
(%)
∆7-Stigmasterol
(%)
∆7-Avenasterol
(%)
3P 0.19 ± 0.02 a0.09 ± 0.02 a3.66 ± 0.04 a0.69 ± 0.01 c94.1995 ± 0.01 a0.4195 ± 0.01 a0.5495 ± 0.01 a
2P0.09 ± 0.01 b0.09 ± 0.01 a3.68 ± 0.02 a0.79 ± 0.01 b94.2995 ± 0.01 a0.3295 ± 0.01 ab0.2795 ± 0.01 b
SP 0.09 ± 0.02 b0.09 ± 0.01 a3.55 ± 0.01 a0.99 ± 0.01 a94.2995 ± 0.01 a0.3295 ± 0.01 ab0.4295 ± 0.01 a
AO0.09 ± 0.01 b0.09 ± 0.03 a3.14 ± 0.05 b0.99 ± 0.01 a94.0995 ± 0.01 a0.2495 ± 0.01 b0.2395 ± 0.01 b
Table 4. Correlation coefficients (Pearson correlation) among the studied olive oil physiochemical traits. * Significant at 0.05 probability level, ** Significant at 0.01 probability level, *** Significant at 0.001 probability level.
AVHumidityK232K270PVC16:0C16:1C18:0C18:1C18:2C18:3C20:0C21:0SFAMUFAPUFATransCholesterolBrassicasterolCampesterolStigmasterolβ Sitosterol∆7 Stigmasterol∆7 Avenasterol
AV −0.1450.7490.899−0.5050.1960.0440.267−0.1580.061−0.099−0.523−0.4530.304−0.1680.0510.991 **−0.355−0.0440.3270.4110.7320.0720.244
Humidity 0.323−0.157−0.5460.8690.979 *−0.959 *−0.8950.972 *0.996 **−0.644−0.5650.741−0.8850.976 *−0.2080.931−0.7850.710−0.8830.1870.974 *0.860
K232 0.444−0.9480.7290.507−0.079−0.6920.5350.320−0.930−0.9280.837−0.7040.5220.774−0.022−0.6800.855−0.2410.983 **0.5210.404
K270 −0.178−0.011−0.0220.1550.031−0.021−0.083−0.258−0.1180.0220.030−0.0250.841−0.2160.2430.0320.5550.3820.0080.348
PV −0.889−0.6920.2960.862−0.719−0.5260.983 *0.998 **−0.964 *0.872−0.707−0.531−0.2050.879−0.974 *0.535−0.920−0.699−0.482
C16:0 0.941−0.696−0.999 ***0.953 *0.852−0.928−0.8990.976 *−0.999 ***0.9480.1810.628−0.958 *0.965 *−0.8130.6410.9420.738
C16:1 −0.894−0.957 *0.999 ***0.977 *−0.783−0.7040.845−0.951 *0.999 ***−0.0120.847−0.8460.820−0.8410.3750.999 ***0.884
C18:0 0.734−0.877−0.968 *0.4250.314−0.5230.719−0.8850.355−0.995 **0.580−0.4840.7890.076−0.888−0.864
C18:1 −0.967 *−0.8780.9080.874−0.963 *0.999 ***−0.964 *−0.137−0.6700.952 *−0.9490.832−0.598−0.957 *−0.759
C18:2 0.969 *−0.804−0.7300.865−0.962 *0.999 ***0.0090.827−0.8640.842−0.8420.4080.998 **0.873
C18:3 −0.636−0.5390.717−0.8680.973 *−0.1720.939−0.7440.685−0.8380.1740.975 *0.899
C20:0 0.977 *−0.970 *0.915−0.794−0.524−0.3330.870−0.974 *0.556−0.870−0.792−0.632
C21:0 −0.972 *0.884−0.719−0.482−0.2260.903−0.982 *0.576−0.903−0.709−0.469
SFA −0.968 *0.8570.3120.445−0.964 *0.999 ***−0.7320.7810.8470.608
MUFA −0.958 *−0.149−0.6540.956 *−0.956 *0.829−0.614−0.951 *−0.748
PUFA −0.0020.836−0.8570.833−0.8440.3930.999 ***0.876
Trans −0.444−0.0630.3410.4170.7790.0150.142
Cholesterol −0.5220.404−0.778−0.1740.8400.819
Brassicasterol −0.958 *0.870−0.636−0.840−0.525
Campesterol −0.7090.8060.8230.579
Stigmasterol −0.174−0.824−0.523
βa Sitosterol 0.3880.232
∆7 stigmasterol 0.894
∆7 Avenasterol
Publisher’s Note: MDPI stays neutral with regard to jurisdictional claims in published maps and institutional affiliations.

