Article

Ventilation Operating Standard for Improving Internal Environment in Pig House Grafting Working Conditions Using CFD

Department of Rural Construction Engineering, College of Agriculture & Life Sciences, Jeonbuk National University, Jeonju 54896, Republic of Korea
*
Author to whom correspondence should be addressed.
Submission received: 12 July 2023 / Revised: 3 August 2023 / Accepted: 4 August 2023 / Published: 14 August 2023

Abstract

:
Many farms utilize closed-type livestock systems to enhance productivity and facilitate effective environmental management. However, the confined nature of these closed spaces poses an increased risk of exposure to harmful gases and organic dust for both workers and livestock. Additionally, the introduction of outside air through ventilation systems can lead to temperature fluctuations within the breeding environment, resulting in potential productivity issues. This research paper employs computational fluid dynamics (CFD) to develop ventilation operation management plans that address both the working environment and the breeding environment simultaneously. The proposed plans are designed to be easily implemented in practical farm settings. The findings of this study, based on the simulation analysis, indicate that while ventilation is effective in reducing harmful gases and improving the working environment, its efficiency decreases after the initial 3 min of operation. Furthermore, uncontrolled ventilation can cause sudden temperature changes, which may adversely affect the well-being of the livestock. However, when upgraded ventilation structures are implemented, significant improvements in the working environment (an average of 27.3% improvement) can be achieved while maintaining temperature stability for the livestock. These results highlight the importance of referring to the provided ventilation operation management table before commencing work, as it enables workers to improve the working environment while minimizing the potential impact of ventilation on the breeding environment.

1. Introduction

The Korean livestock industry has experienced rapid growth, leading to a significant increase in both the number of livestock and meat consumption. However, this growth has also resulted in a decrease in the number of livestock farms and a shift towards large-scale and intensive operations. To manage productivity and control environmental factors such as temperature, humidity, and ventilation, the majority of farms now adopt closed-type livestock pens. While these closed spaces allow for effective management, they also present challenges such as increased livestock manure and odor, as well as higher levels of fine dust. Consequently, there is an elevated risk of workers and animals being exposed to harmful gases and organic dust within these facilities [1,2]. In light of the increasing number of occupational accidents among farmers, ensuring the working safety and welfare of workers has become a paramount concern [3]. Farmers may not possess a complete understanding of the potential hazards and safety risks associated with agricultural work, leading to a lack of adequate precautions.
Livestock facilities commonly generate harmful gases, including ammonia and hydrogen sulfide. Among these, hydrogen sulfide is highly toxic, and exposure to high concentrations can even result in fatalities. When highly concentrated hydrogen sulfide disperses from livestock excrement or slurry due to pig movement and rapid changes in internal airflow, there is a significant risk of workers being exposed to these dangerous gases [4]. Ammonia is a colorless and irritating toxic gas. Even at low concentrations, ammonia can cause irritation to the eyes and lungs, resulting in inflammation, sneezing, and excessive salivation. Inhaling harmful gases and organic dust can cause acute and chronic poisoning, as well as various serious health issues such as bronchitis, pneumonia, asthma, coughing, allergies, headaches, and dizziness [5,6,7,8,9,10,11].
Among the methods available for reducing harmful gases, the ventilation system offers both technical and economic advantages. It has the capability to directly remove harmful gases by discharging them outside and can be implemented using the existing infrastructure. However, the introduction of outside air through ventilation can cause rapid temperature changes in the livestock breeding environment, which can negatively impact the immune system, respiratory health, and overall productivity of the animals [12,13,14]. Therefore, when implementing ventilation, it is essential to analyze the resulting thermal environment changes.
There has been limited research on strategies for operating ventilation systems to enhance the working environment in the agricultural field. Moreover, studies that simultaneously consider both the breeding environment and the working environment are even scarcer. Therefore, there is a need for monitoring the internal environment and conducting simulation-based research that takes into account the working environment for workers as well as the animal-centric breeding environment. To improve the working environment, it is common practice to increase the ventilation volume to expel more harmful gases. However, increasing the ventilation volume also leads to greater temperature variations within the livestock breeding area, potentially causing issues in the breeding environment. Additionally, it is crucial to analyze the working and breeding environments concurrently since the ventilation volume and temperature inside the facility are highly correlated. Monitoring the working environment and breeding environment simultaneously poses challenges, as workers enter and exit the area periodically while the pigs remain relatively constant. Therefore, utilizing simulation techniques becomes an effective approach to gather diverse environmental data, such as temperature and location variations within the facility.
Relying solely on field experiments to gather data on the breeding and working environments presents several challenges, including limitations related to time, space, the ability to maintain stable experimental conditions, and restricted measurement points. However, by combining field measurements with computational fluid dynamics (CFD), it becomes possible to overcome these challenges and acquire a substantial amount of qualitative and quantitative data. Such data can be utilized for research purposes, such as investigating automatic environmental control within smart farms and developing management algorithms. CFD simulations have been widely used to study airflow in livestock houses. Research was conducted on the ventilation effect and changes in temperature and humidity through a 3D simulation model that included the shape of the pigs and the ventilation structure of the pig house [15,16,17,18,19]. Specifically, the impact of the thermal environment was analyzed, such as the effect of temperature differences on pig productivity [20,21,22,23,24]. While research focused on livestock workers has been less, some studies have suggested that the internal concentration of ammonia and fine dust can affect the health of the workers [17,25]. Research to monitor and improve the livestock facility environment has primarily been focused on ammonia, with various facility structures undergoing field monitoring [26,27,28,29,30,31,32]. Some studies used CFD to analyze the amount of ammonia released from the floor according to the shape of the floor [33,34]. Recently, uncertainty quantification (UQ) has been applied to simulations to optimize results [35,36,37]. However, specific research that simultaneously considers the on-site breeding environment and working environment has been extremely rare so far.
This research aims to propose a ventilation control standard that considers both the working environment and the breeding environment in a pig house simultaneously by efficiently reducing the concentration of harmful gases at the workers’ height. The study involves measuring and identifying the concentration levels of harmful gases to which workers are exposed during specific tasks in the pig house. The ventilation efficiency by the combination of inlet and outlet systems is evaluated using computational fluid dynamics (CFD).

2. Materials and Methods

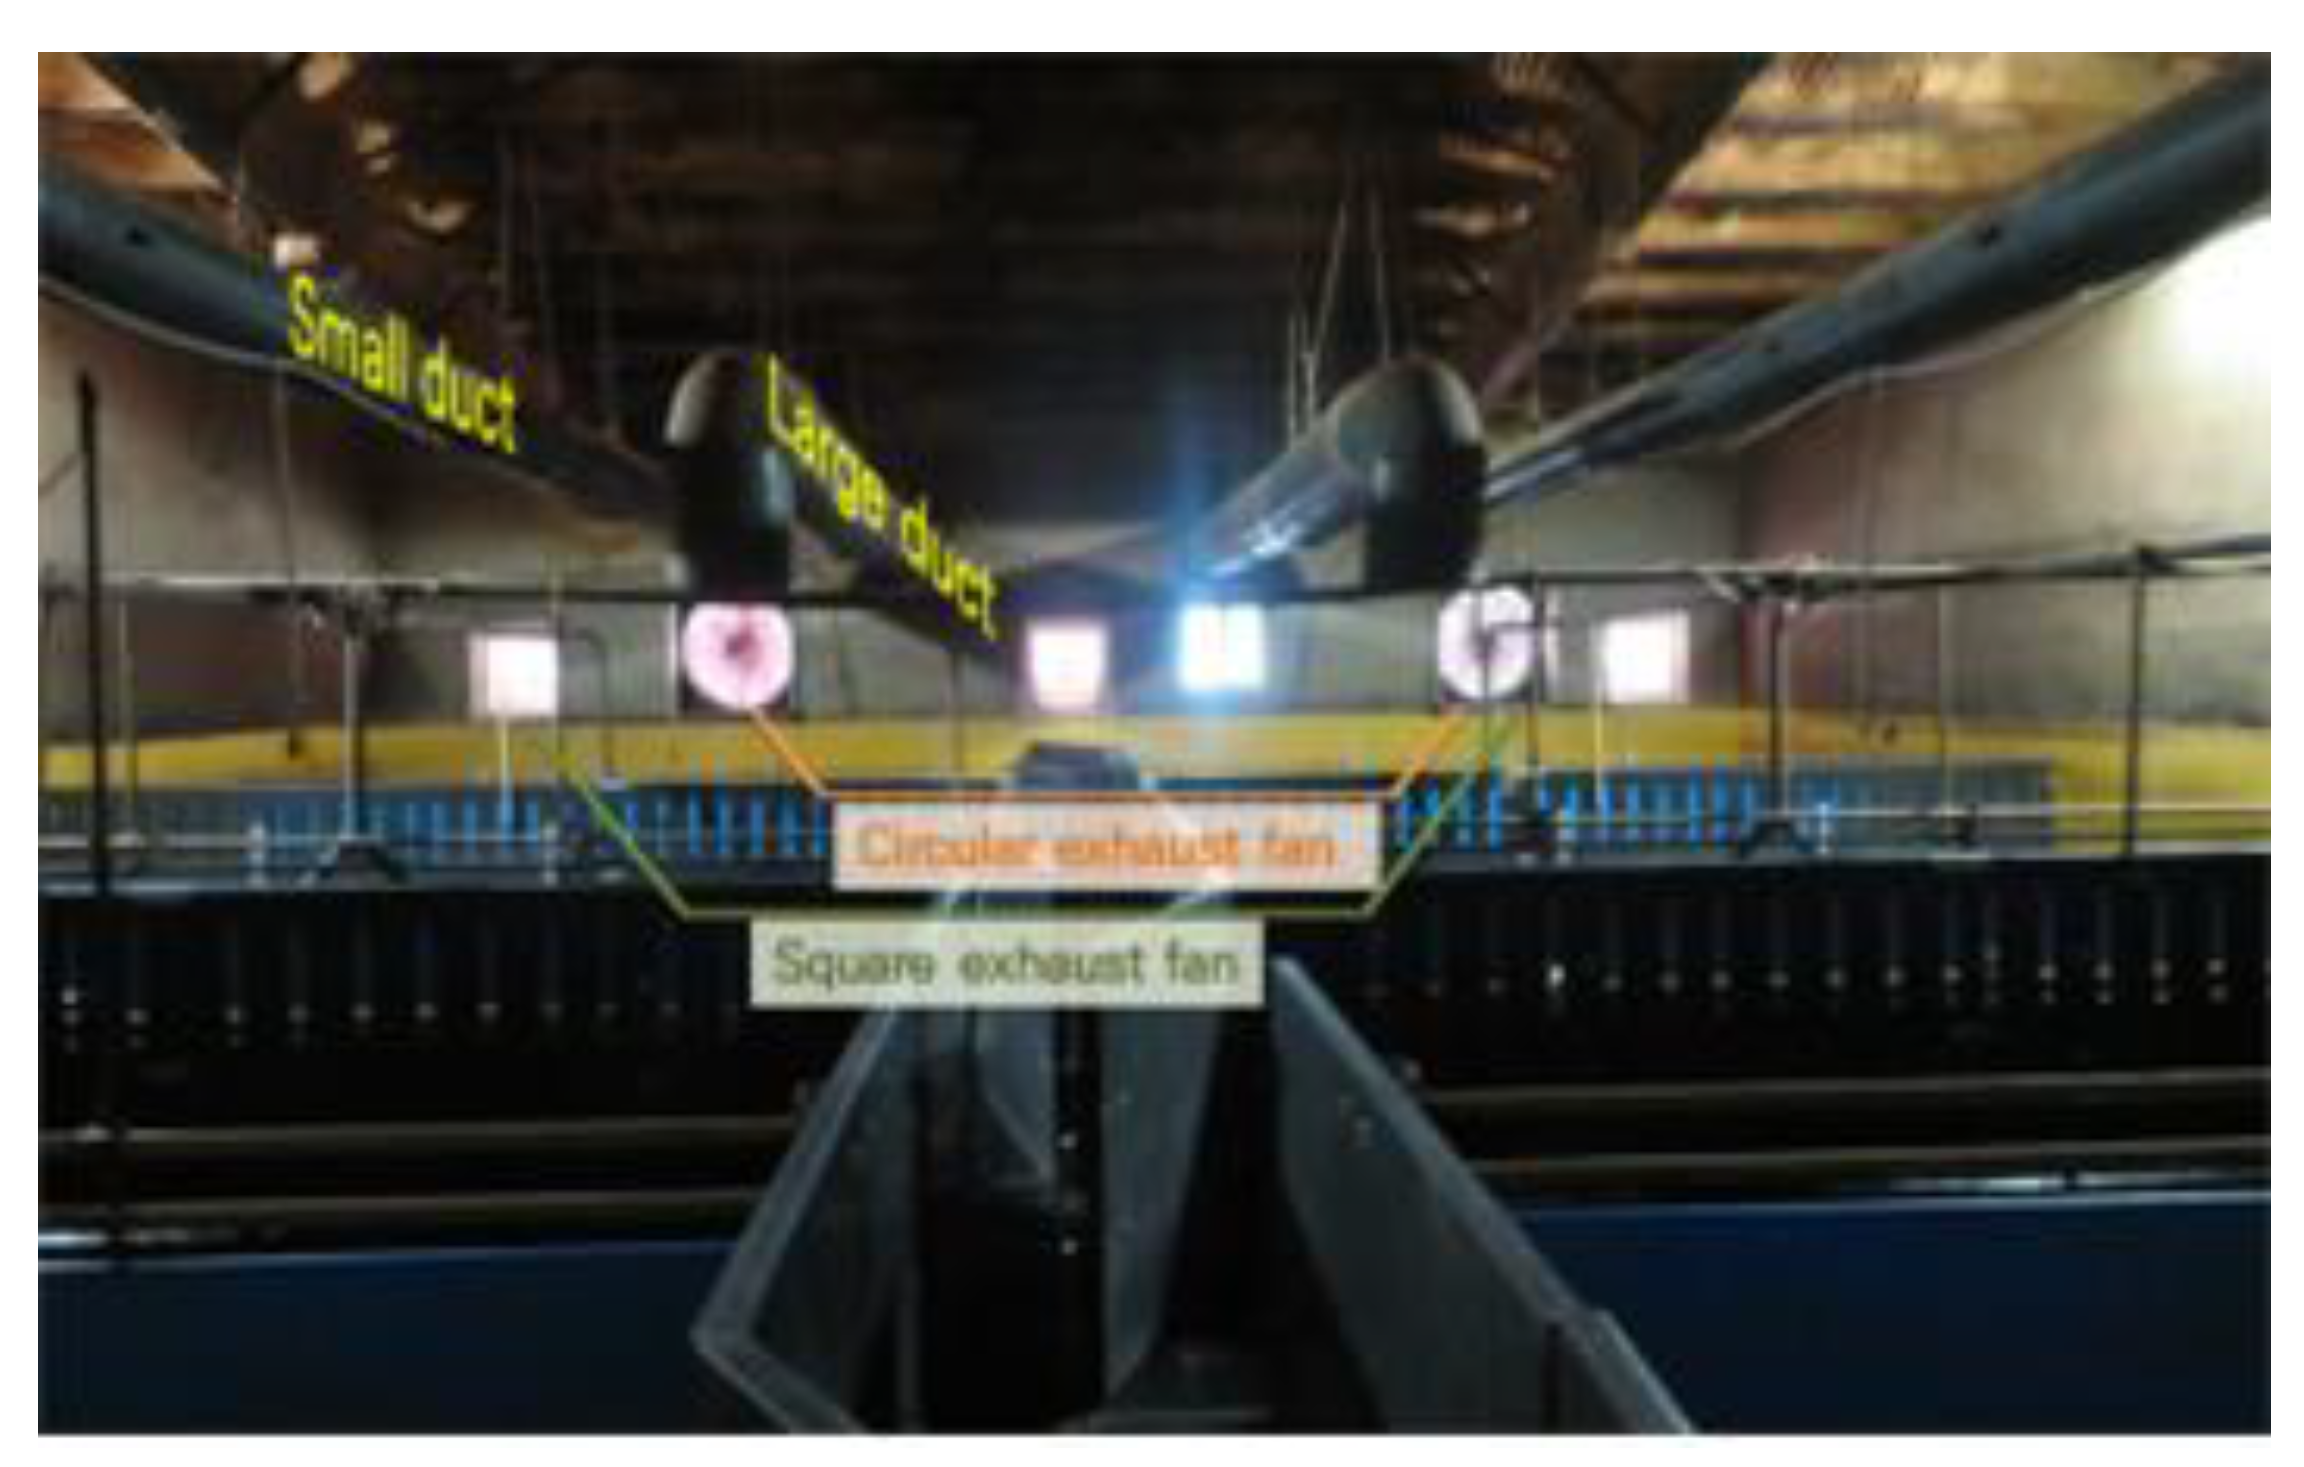
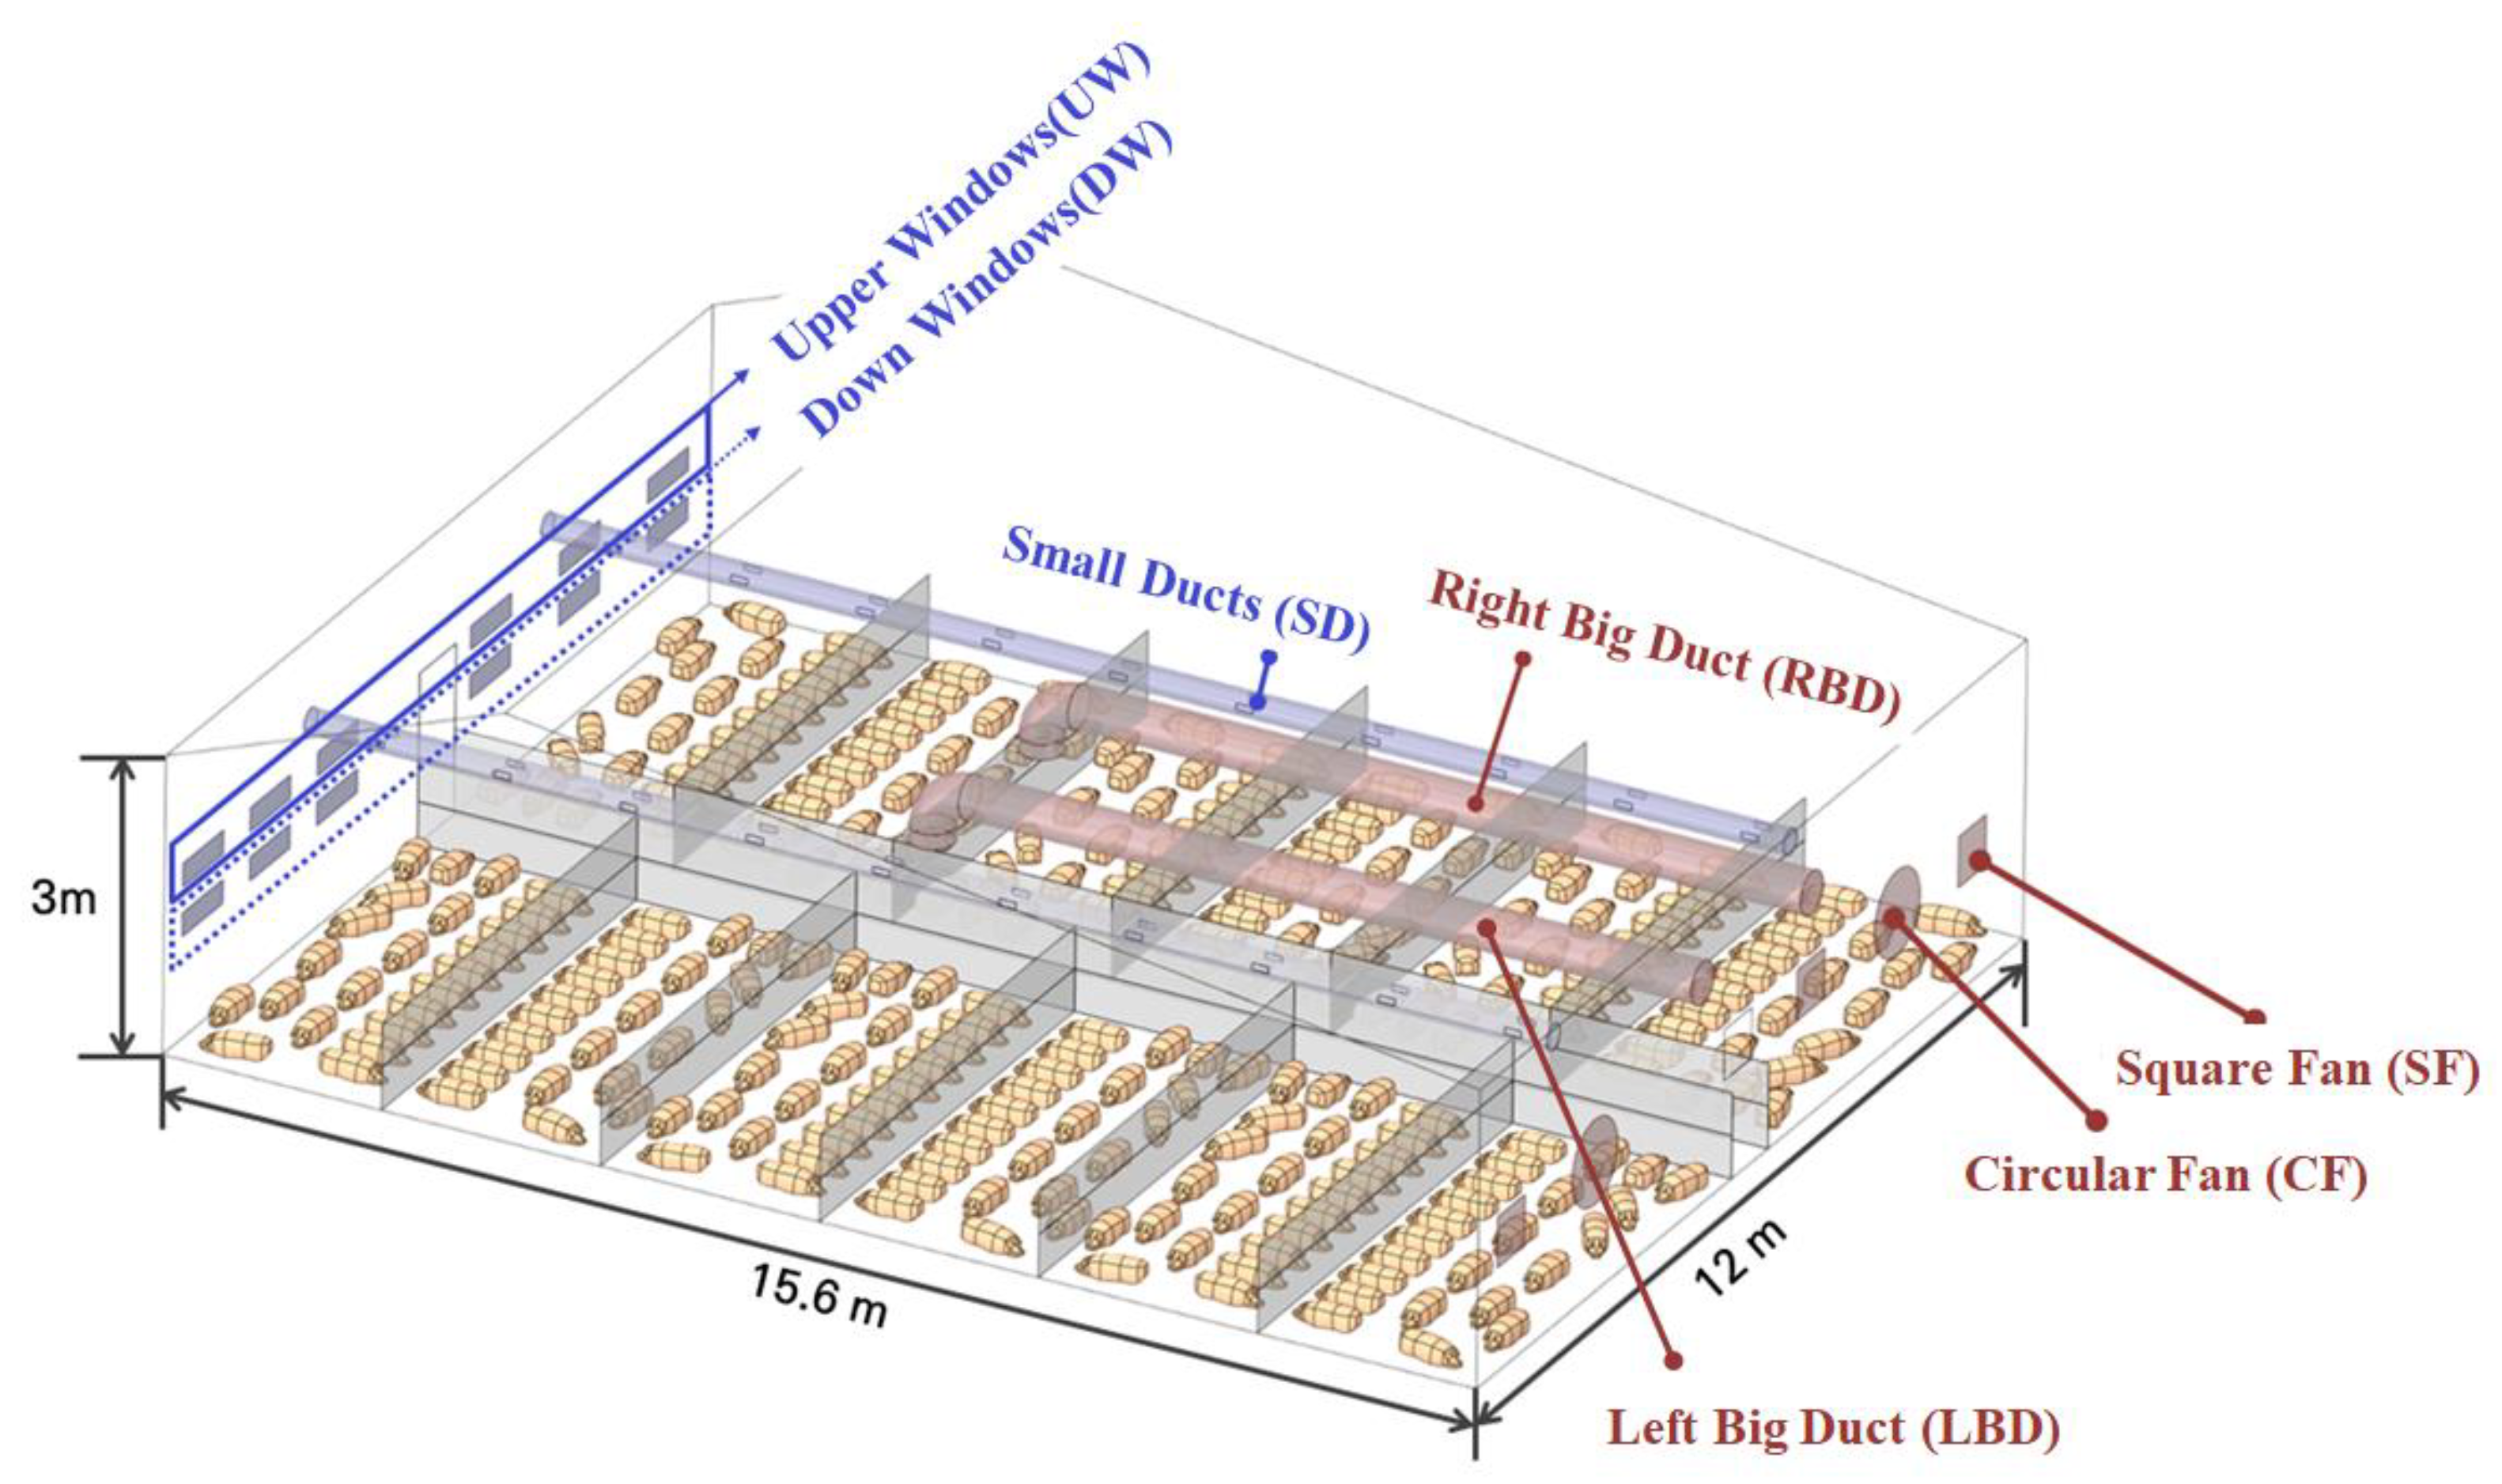
2.1. Experimental Pig House

The experiment was conducted in a commercial pig house with a capacity of 15,000 pigs, located in Yeonggwang-gun, Jeollanam-do, Korea. A pigpen that had a relatively high mortality rate was chosen based on interviews with the farm manager. The dimensions of the selected pigpen are 12 m in width, 15.6 m in length, and 3.2 m in height. Inside the pigpen, there is a central corridor that is 0.8 m wide, and the pigpen is divided into 12 compartments by 1 m-high walls. Each compartment can accommodate around 18 to 25 fattening pigs. The pigpen has a total capacity for 300 pigs. There are 12 windows (6 upper and 6 lower) that allow outside air to flow into the pigpen through the corridor. Additionally, two duct inlets, each with a diameter of 0.94 m, are installed on the left and right sides of the pigpen to distribute air evenly throughout (Figure 1). On the outer wall, there are two circular exhaust fans with a diameter of 1 m each, as well as three square fans with a length of 0.6 m per side. These fans are used for extracting air from the pigpen. Furthermore, two 1.5 m-diameter ducts (duct outlets) are installed on the left and right sides, extending from the outside to the center of the pigpen. These ducts serve the purpose of both removing harmful gases to the outside and allowing fresh air to enter (Figure 2). The ventilation system is operated by utilizing different combinations of inlets and outlets based on the season and internal temperature and humidity conditions.

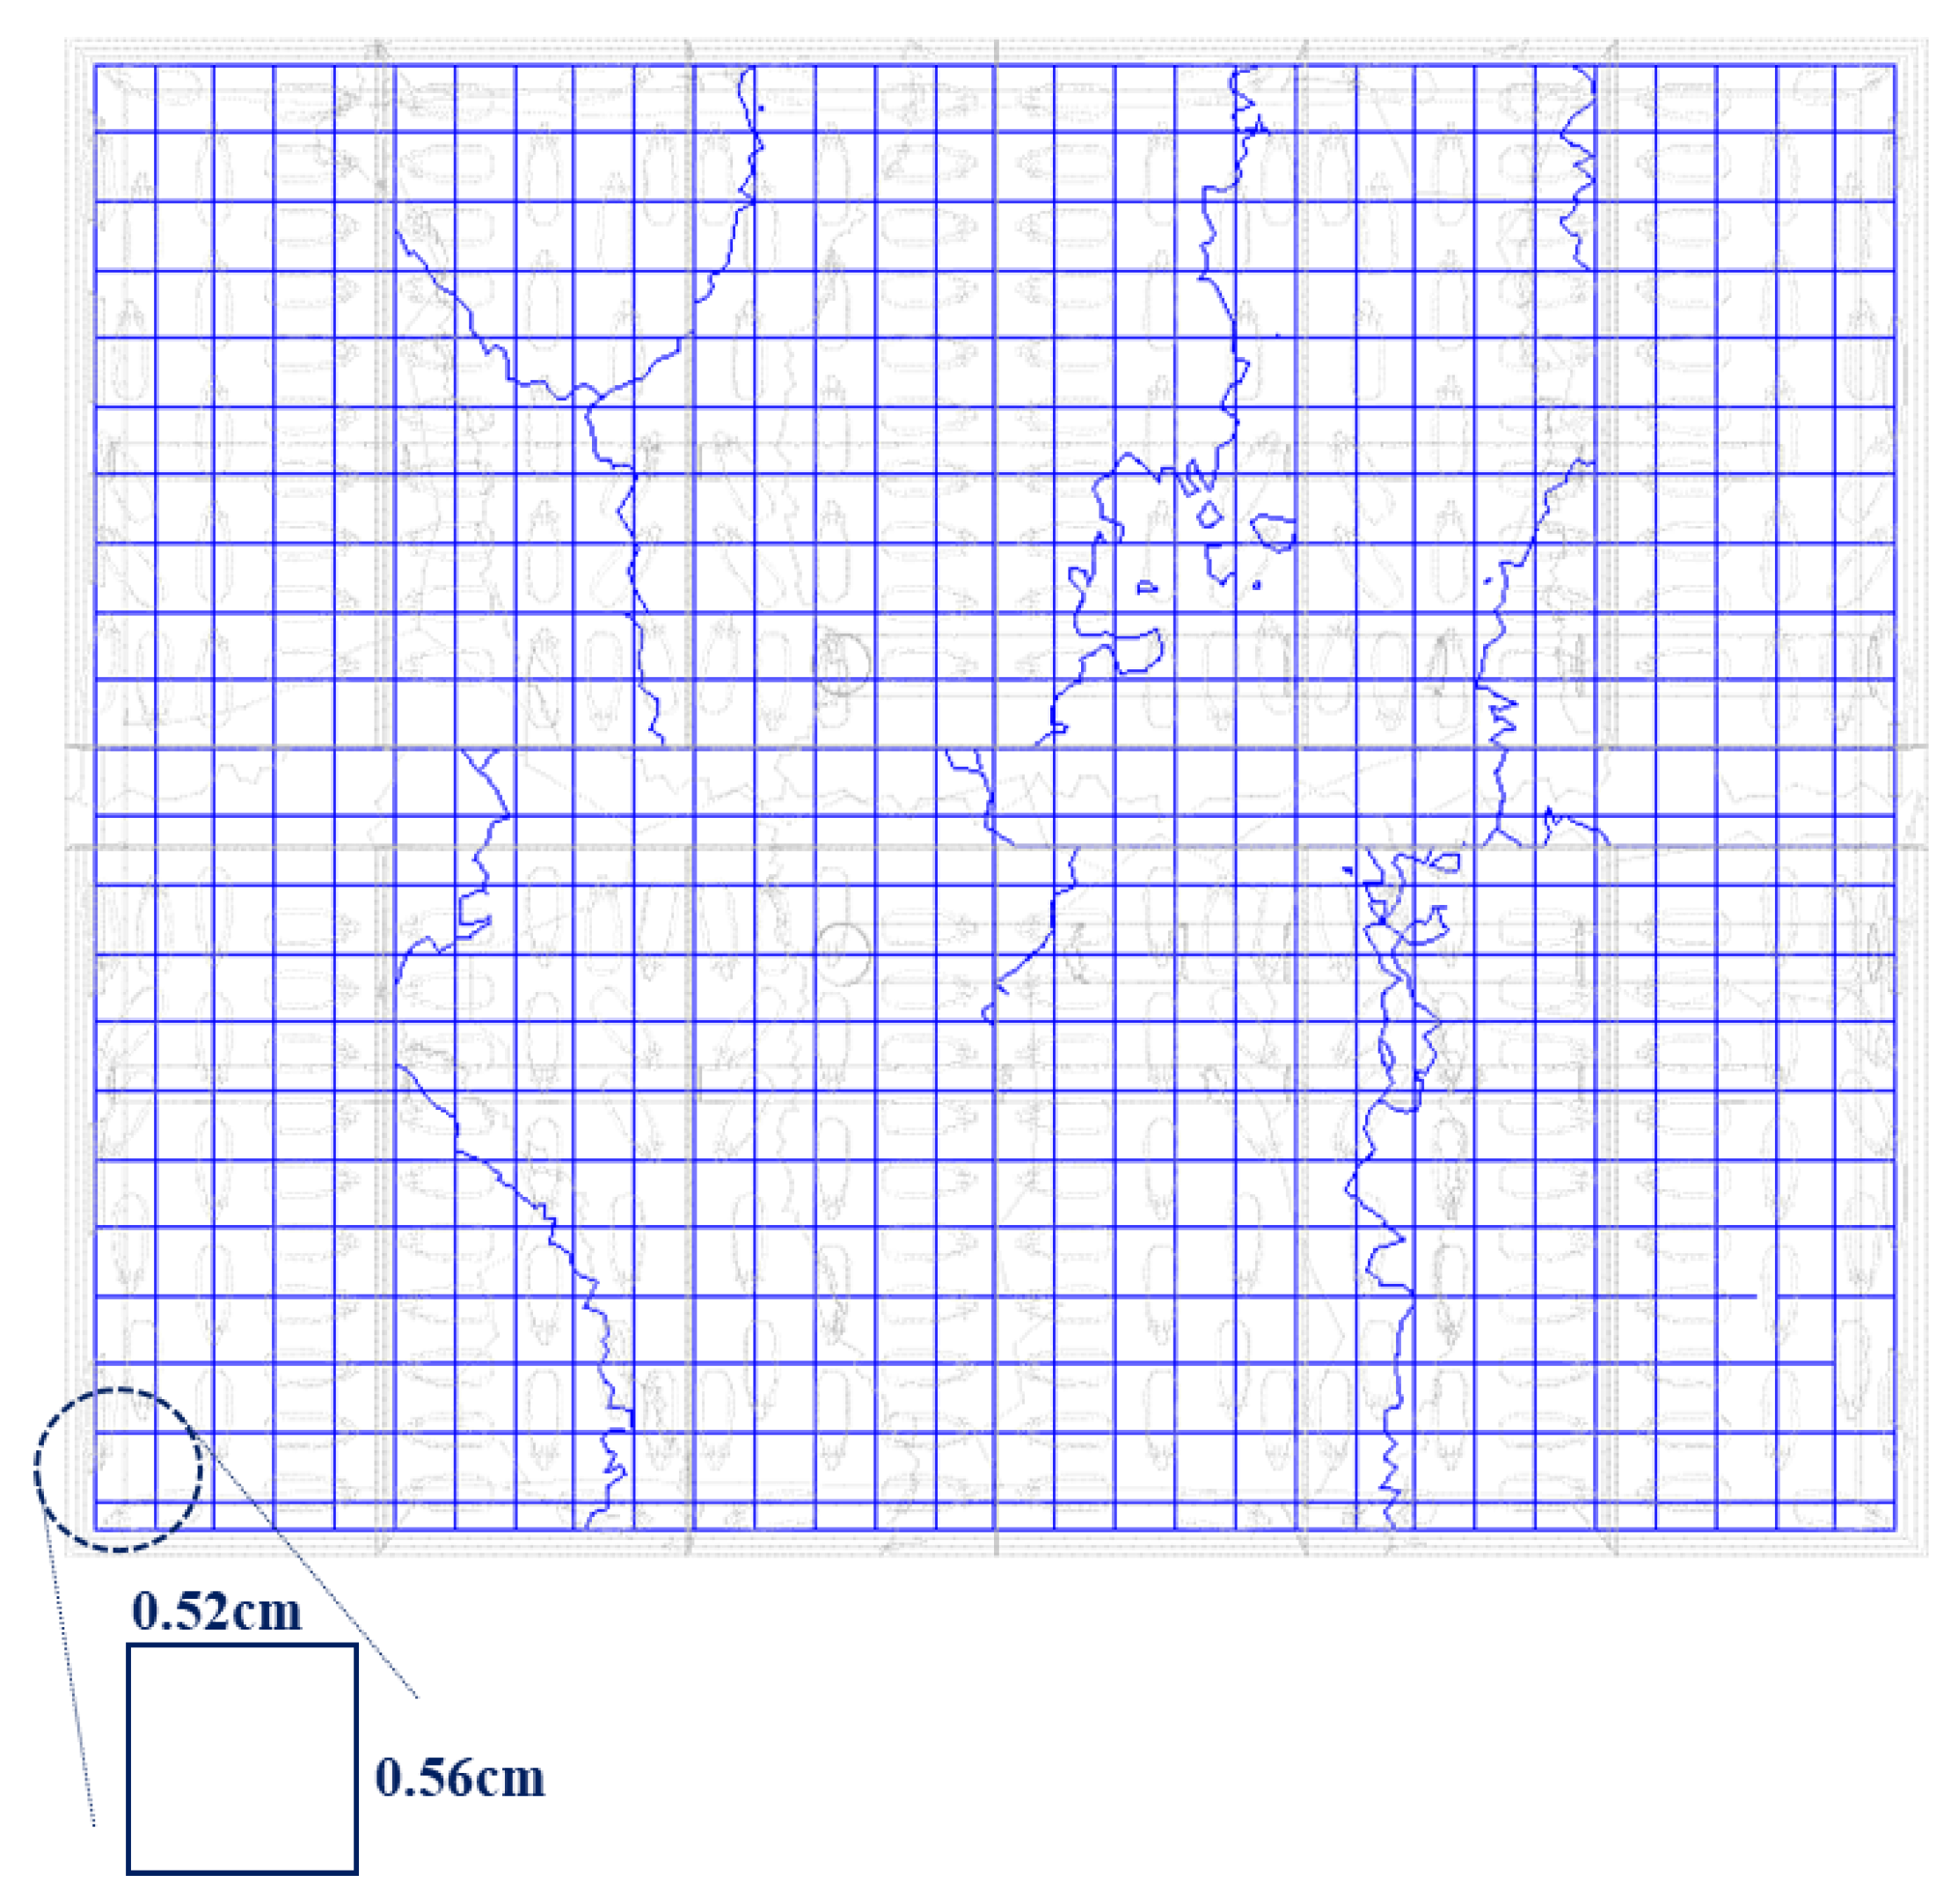
2.2. Computational Fluid Dynamics

Computational fluid dynamics (CFD) encompasses three main steps: pre-processing, main computational processing, and post-processing. In the pre-processing step, the outer shape of the experimental object and the grid of the target area are designed. In the main computational processing step, the target area is analyzed using numerical analysis techniques, employing equations such as the Navier–Stokes equations. Finally, in the post-processing step, the results of the analysis are qualitatively and quantitatively evaluated. To begin the CFD analysis, the object is designed as a 3D model. Grid design and boundary conditions are then specified. The calculations are conducted using FLUENT software (version 18.1., ANSYS Inc., Rochester, NY, USA) [38], employing the principles of mass conservation, energy generation and movement, and the law of momentum conservation on each grid. Numerical analyses for fluid and energy flow are based on mass, momentum, and energy conservation laws. The conservation equations are Equations (1)–(3).
Mass conservation equation:
ρ t ,   ρ v = S m
Energy conservation equation:
t ρ E ,   v ( ρ E ,   P ) = K e f f T h J ,   ( τ e f f v ) ,   S h
Momentum conservation equation:
ρ t ρ v ,   ρ = S m v v = P ,   τ ,   ρ g , F
where ρ is the density (kg m−3), v is the velocity (m s−1), S m is a mass source term based on the chemical reaction (kg m−2), E is the total energy (kg m2 s−2 kg−1), P is the static pressure (kg m−1 s−2), K e f f is the effective conductivity (kg m−1 s−3 K−1), T is the temperature (K), τ is the stress tensor (kg m−1 s−2), τ e f f is the effective stress tensor (kg m−1 s−2),   J i is the component of diffusion flux, S h is the enthalpy rise based on the chemical reaction or radiation (kg m−1 s−3), g is the gravitational acceleration (m s−2), and F   is the external force vector (kg m s−2).
In this study, we used the CFD model previously validated by field experimental data [13]. The shape and boundary conditions of the CFD simulation model were designed by the experimental pig house. We used tetrahedron-shaped meshes to design complex pig shapes and structures in the pig house. The grid size is very important to simulation accuracy and computation time. We designed the grid by referring to a previous study that evaluated the grid independence test [15]. The minimum size of the grid was 0.05 cm, and a denser grid was used in the aerodynamically important part. The turbulence model was determined by a validation test in the same experimental pig house as the previous research [13]. Among the four different turbulence models, the realizable k-ε model was selected, which showed the highest correlation (R2 value of 0.859) in terms of air velocity and temperature distribution. The specific boundary conditions used for the CFD model were outlined in Table 1.

2.3. Tracer Gas Decay Method

The tracer gas decay (TGD) method was used to compute regional ventilation efficiency using the CFD simulation [16,17,18,19]. The conventional method used for calculating the internal ventilation rate was based on the mass flow rate calculation. This determines the air replacements per unit hour, assuming that all the air entering the pig house was used to replace the air by ventilation. While the mass flow rate calculation method offers the advantage of a straightforward calculation for determining the ventilation volume of the entire facility, it does not allow for the analysis of regional ventilation effects. Consequently, it is not suitable for evaluating the ventilation volume of individual compartments within the pig house or the dilution effect of harmful gases. It does not provide insights into the flow behavior inside the facility, which can vary based on the combination of ventilation structures.
The tracer gas decay method (TGD method) has been utilized to calculate the regional ventilation efficiency by analyzing the change in tracer gas concentration over time. The TGD method involves measuring the concentration of tracer gases such as CO2, SF6, etc., at multiple points in field experiments to determine ventilation efficiency. By using a simulation, we can obtain more qualitative and quantitative data than in the field. In this research, the data obtained from the CFD simulation were quantitatively analyzed for regional ventilation efficiency in pig house by region using the TGD method. The air exchange rate (AER, min−1) was used as a unit to denote the amount of ventilation, representing the number of times the incoming air from the outside replaces the entire indoor air. In the CFD simulation, carbon dioxide was uniformly distributed at a concentration of 2000 ppm inside the pig house, while the air entering from outside contained 400 ppm of carbon dioxide.
A E R M R F = v i A i V × 60 = v 0 A 0 V × 60
A E R T G D = l n C 0 C t t t 0
where A E R M R F is the air exchange rate of mass flow (min−1), A E R T G D is the air exchange rate of tracer gas decay(min−1), V is the volume of the pig house (m3), v 0 , v i are the velocities at the inlet and outlet (m·s−1), A 0 , A i are the vent areas of the inlet and outlet (m2), and C 0 ,   C t   are the concentrations of the tracer gas at t 0 , t time (ppm).

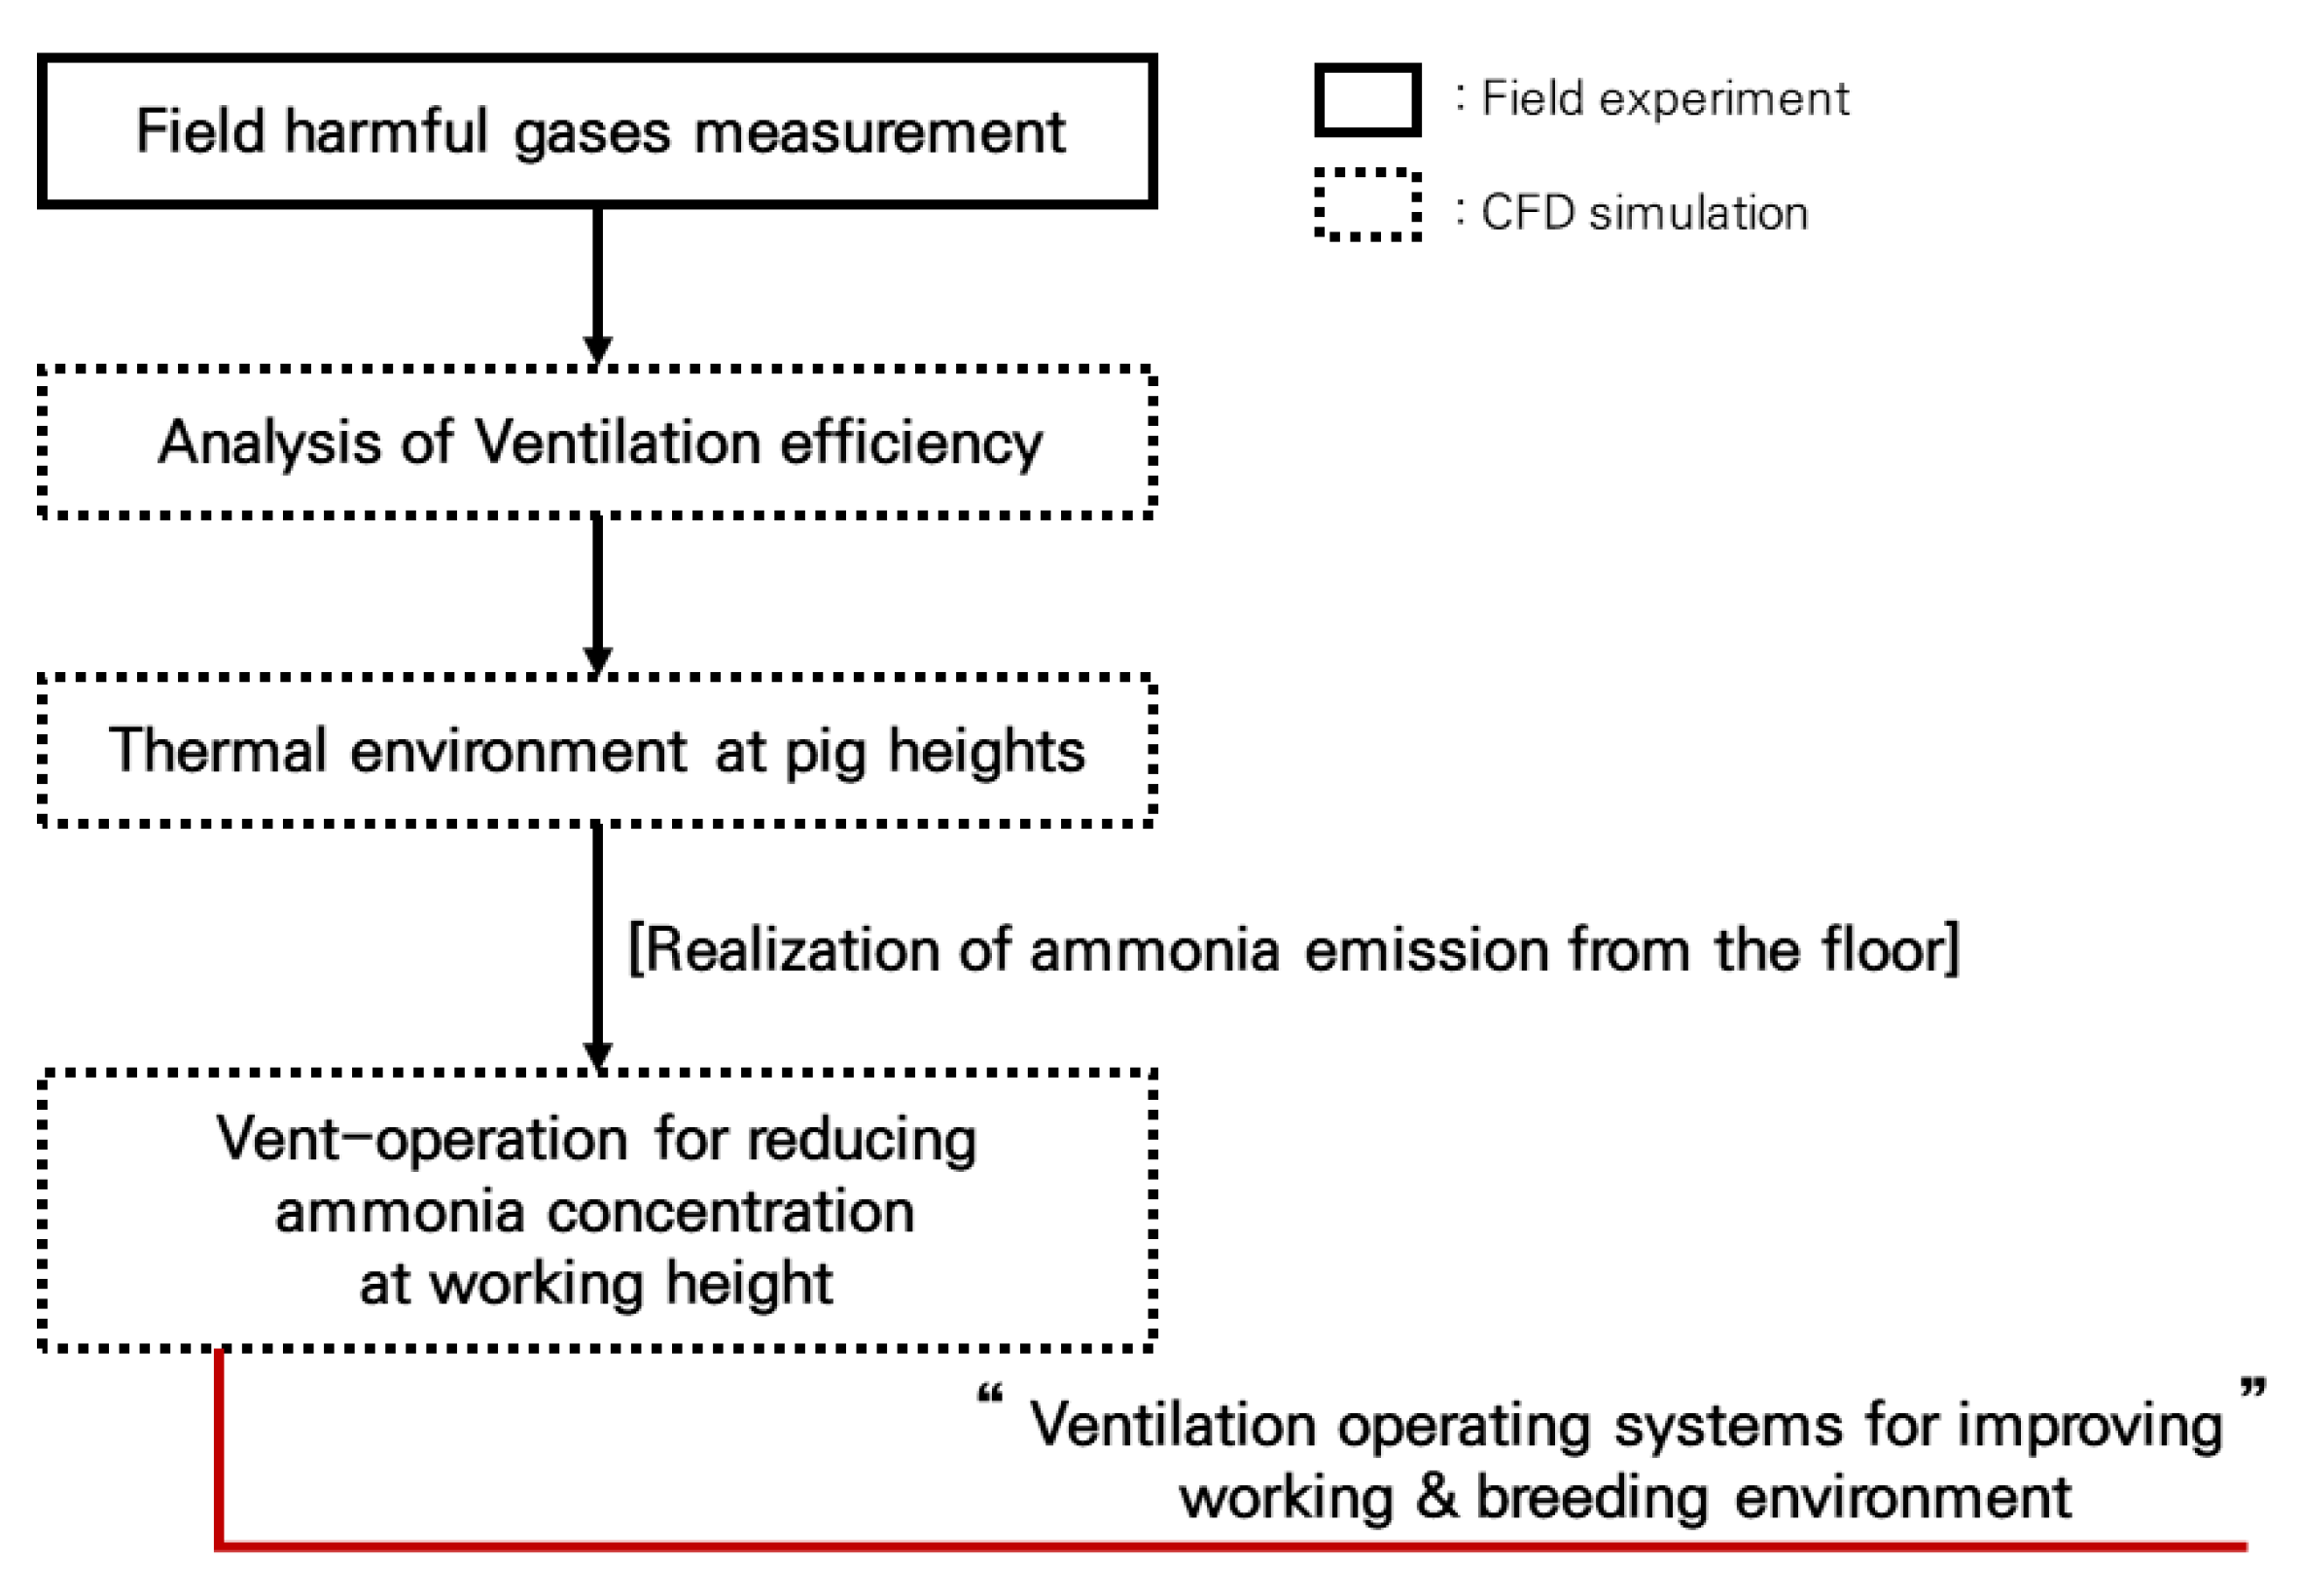
2.4. Experimental Procedure

A ventilation operating standard was suggested based on the field monitoring of gas concentration and CFD modeling according to various combinations of ventilation systems as shown in Figure 3. The first step involves measuring the concentration of harmful gases to which workers were exposed during various tasks performed in the pig house. The CFD model was initially initialized in the steady state, then modeled in the unsteady state for the ventilation efficiency analysis using the TGD method. Using this model, the ventilation efficiency was analyzed for different combinations of ventilation openings within the pigpen to select an upgraded ventilation operation method that effectively reduced harmful gases at the workers’ height. To enhance the accuracy of the analysis, the selected ventilation system considered the ammonia emission from the floor. The analysis took into account the changes over time during ventilation, as well as the thermal environment of the pig herd. This is important because sudden temperature changes can impact the breeding environment for the pigs. By implementing the ventilation operation plan, which aimed to reduce harmful gases such as ammonia concentration, the extent of harmful gas removal by the ventilation system for improving the working environment was analyzed. Additionally, the thermal environment of the pig herd was utilized to develop the ventilation operation standard table that aimed to enhance both the working and breeding environments.

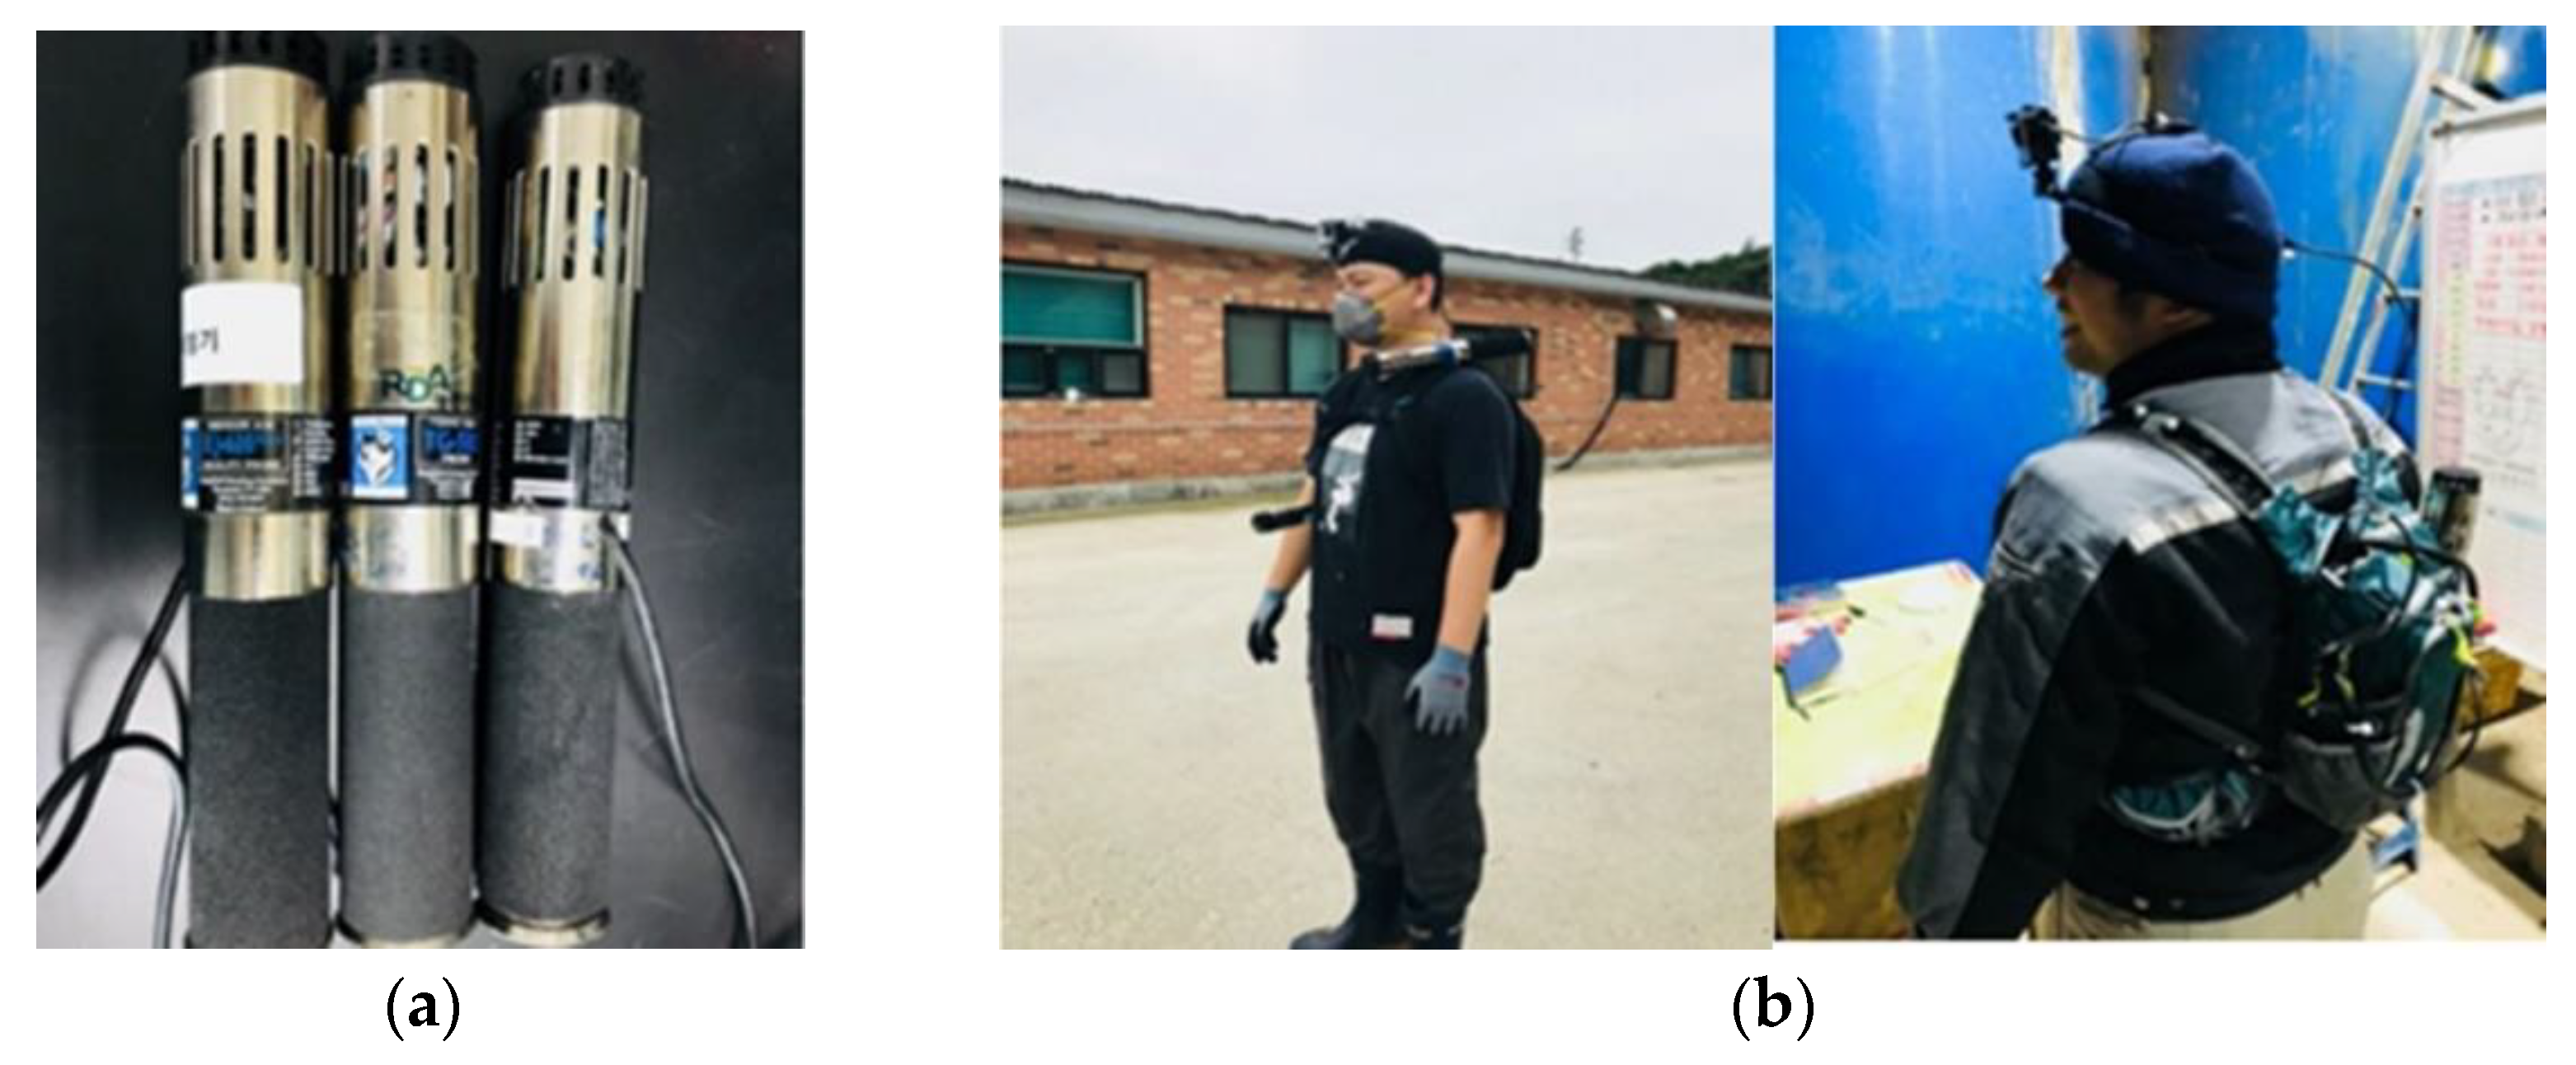
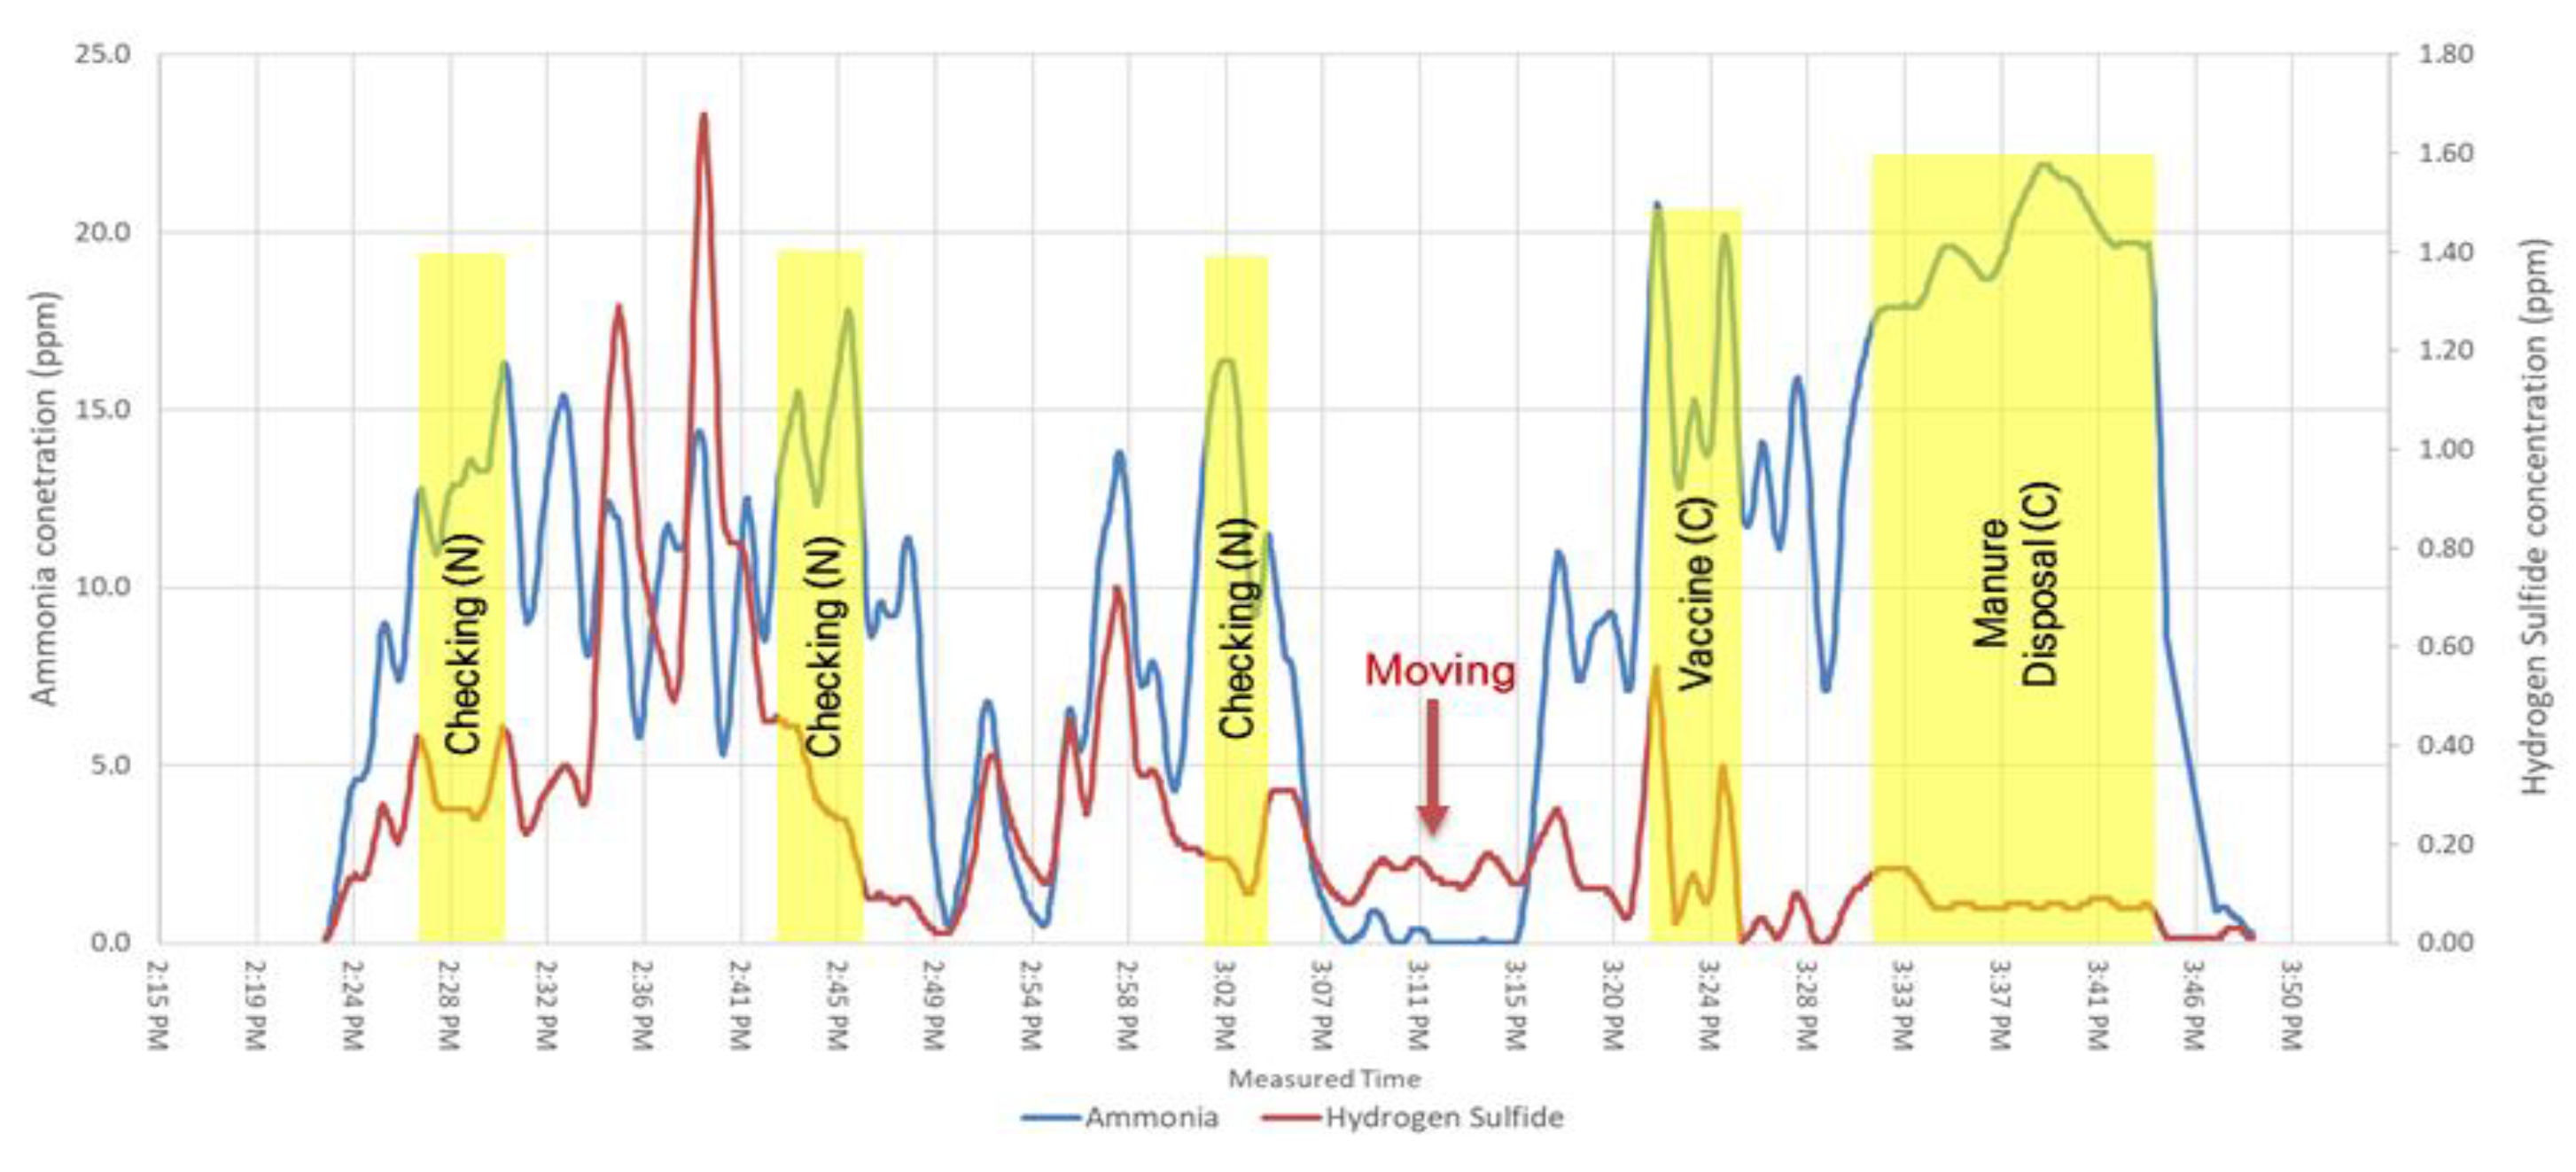
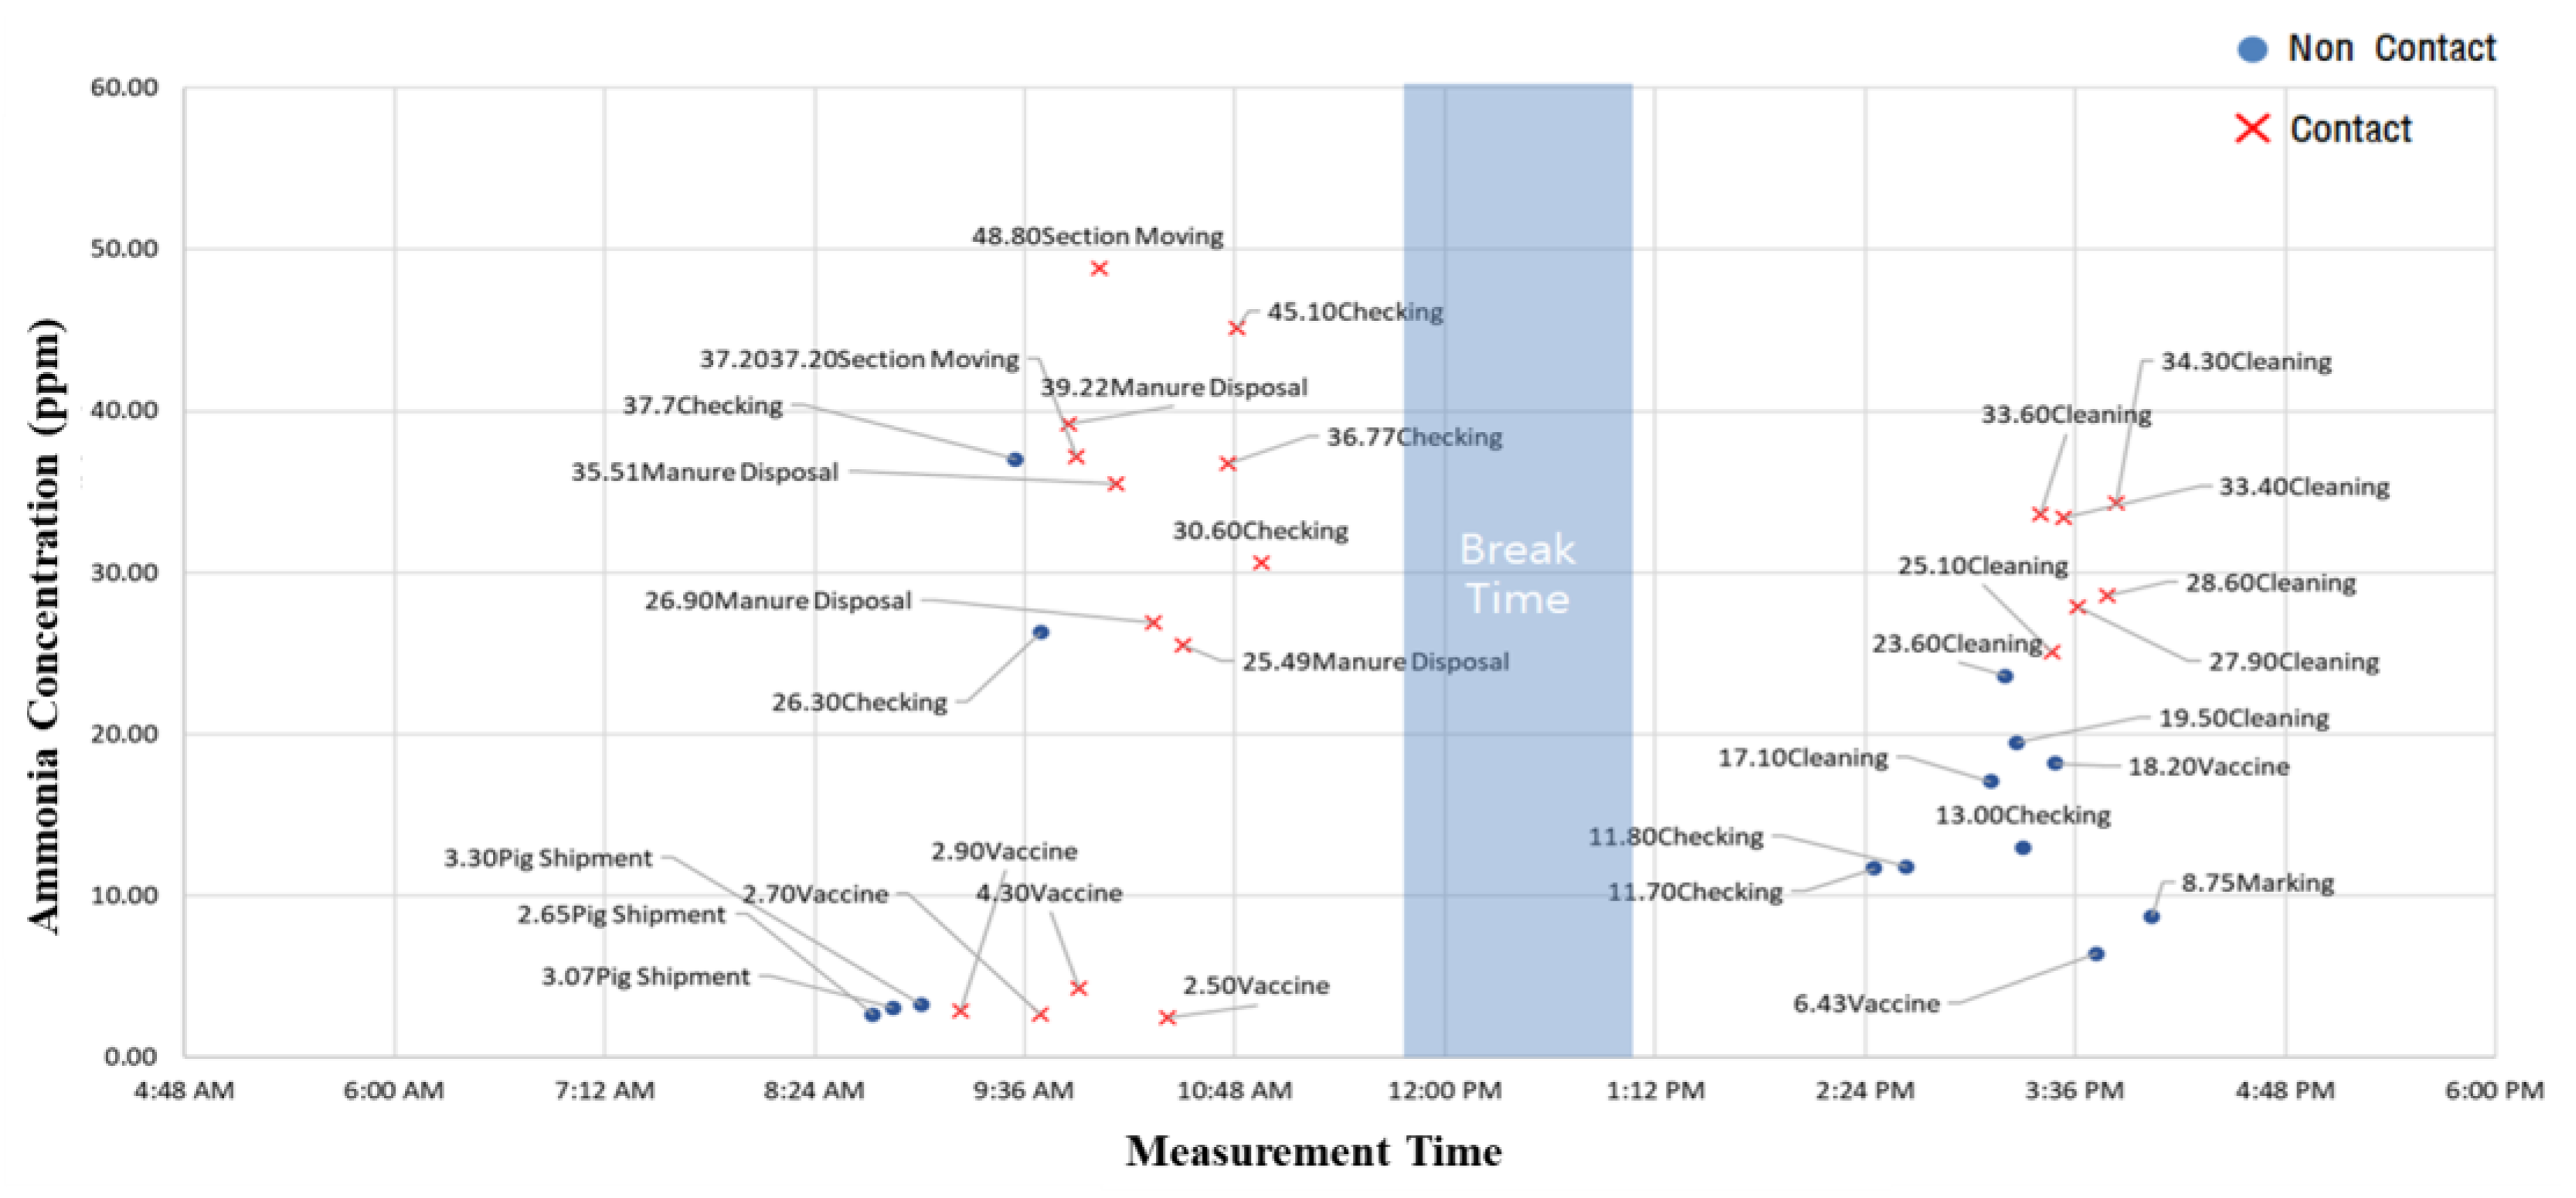
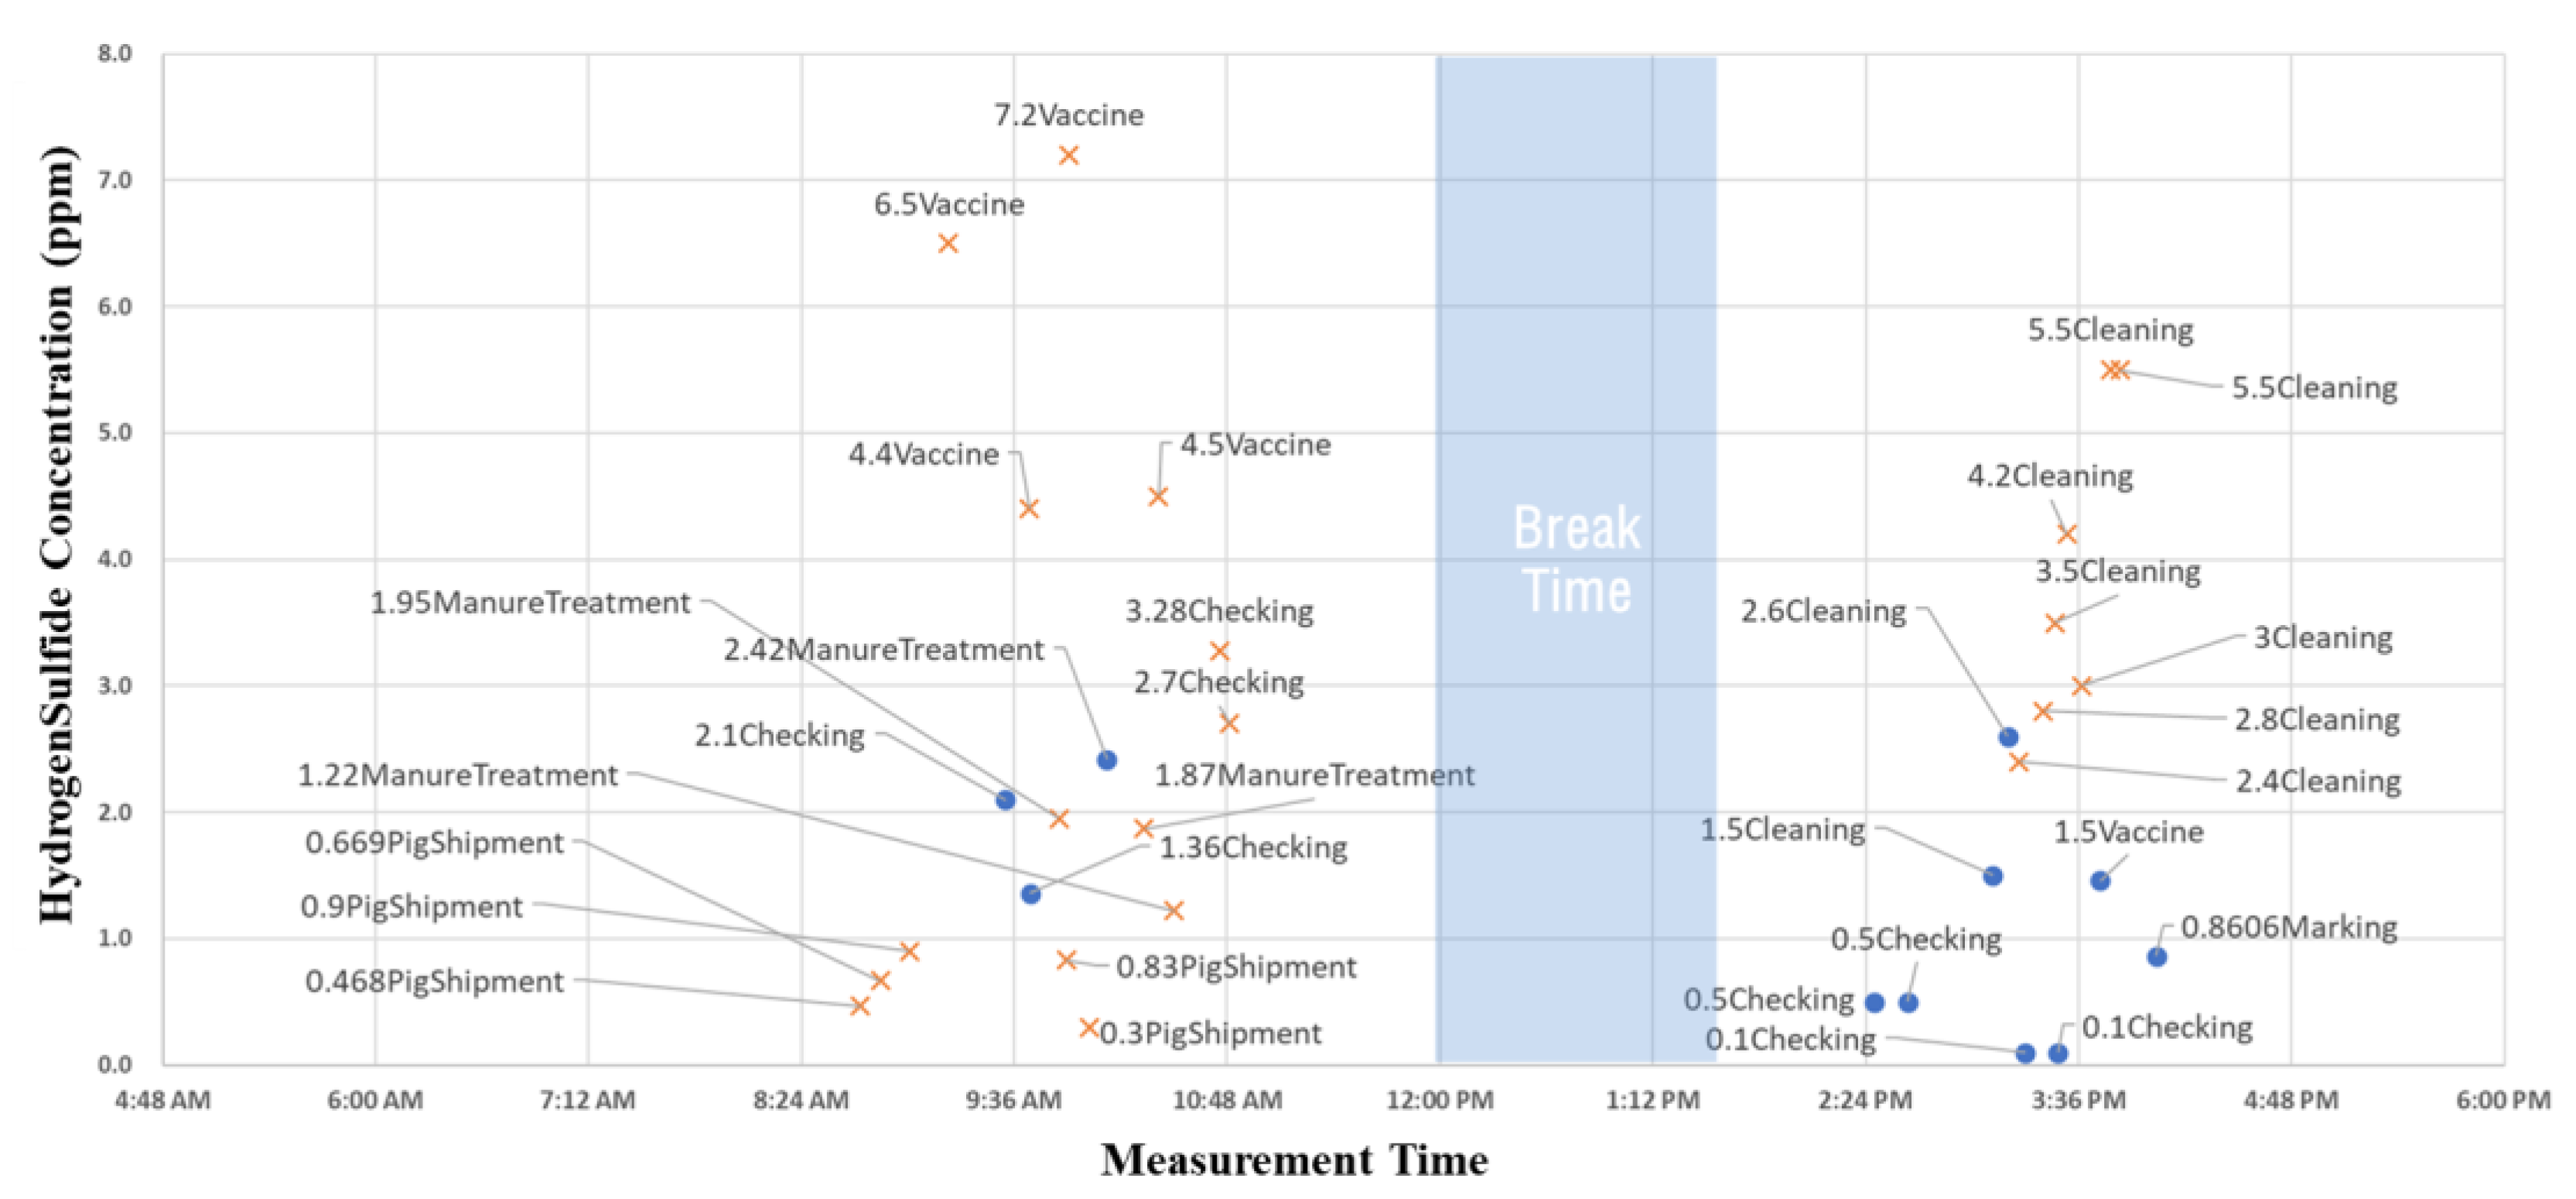
2.4.1. Field Monitoring of Harmful Gas Concentrations

The concentration of harmful gases to which workers are directly exposed was measured at the height of their respiratory system during different types of work performed inside the pigpen. The measurements were conducted for both morning and afternoon daily working routines, with break time between 12 pm and 1 pm. To assess the exposure level for workers, ammonia and hydrogen sulfide sensors were attached at shoulder height, which is approximately the same height as the worker’s respiratory tract (Figure 4). The working tasks were categorized as either contact work or non-contact work, depending on their interaction with the pigs. During contact work with pigs, more gases were dispersed from the floor due to animal movements. The concentrations of harmful gases were analyzed by considering the characteristics of each working task.

2.4.2. CFD Analysis for Ventilation Efficiency and Thermal Environment

The ventilation system in the experimental pigpen was characterized by combinations of vent openings with multiple inlets and outlets that could be operated in various configurations to assess the ventilation efficiency. The outlet ventilation system was comprised of three small, square-shaped fans (SF) measuring 0.6 × 0.6 m, two circular fans (CF) with a diameter of 1.0 m, and a large duct located on the upper right side of the pigpen (RBD, right big duct). These outlet components were labeled alphabetically from A to H. The inlet ventilation system consisted of a large duct on the left-hand side (LBD, left big duct), two small, elongated ducts positioned on the upper side of the pigpen (SD, small duct), and a total of 12 windows (UW/LW, upper window and lower window) located at the end of the pigpen. These inlet components were grouped numerically from 1 to 5. The ventilation efficiency of a total of 42 ventilation systems, comprising different combinations of exhaust structures (outlets) and inflowing structures (inlets), is evaluated and presented in Table 2.
In order to improve the working environment and minimize the impact to the pig, an analysis of the thermal conditions was conducted based on the ventilation period. An optimal ventilation level was identified to provide a suitable breeding environment while ensuring the removal of harmful gases inside the pigpen. When ventilation begins, outside air enters into the pigpen, resulting in a sudden change in the thermal environment, which can lead to respiratory diseases or decreased immunity. Therefore, it is crucial to analyze both the ventilation efficiency in reducing harmful gases and the thermal conditions of the pig breeding environment. The height of the pig herd was set at 0.5 m, where the pigs breathe.
The CFD model was designed with a combination of regular tetrahedrons, triangular-shaped tetrahedrons, grids, regular hexahedrons, and square-shaped hex-dominant grids to represent the complex shapes found in the pigpen following the previous validated modeling approaches [20,21,22]. Dense meshes were used for aerodynamically important areas of the pigpen, such as inlets, outlets, or regions near complex structures, to enhance model accuracy [39,40,41,42,43,44]. The calculation area was subdivided into smaller sections for analyzing the ventilation efficiency and thermal conditions. The frequency analysis was performed by dividing the height of the breeding environment into a total of 630 compartments, each with a consistent size of 0.52 × 0.56 cm (Figure 5). When the temperature difference compared to the average temperature of the pigpen is less than 3 °C, it is considered a suitable temperature. Temperature difference levels were categorized into three levels: the warning level, caution level, and normal level were defined based on the proportions of compartments representing suitable temperatures, with less than 60% of the total area, less than 70%, and more than 70%, respectively.
The ventilation efficiency of each region was analyzed for 42 different combinations of ventilation systems in order to identify which system could efficiently ventilate harmful gases at the worker’s height. When the outlets remained the same, the ventilation efficiency was high due to the increasing inlet area by additionally opening the six lower windows located on the corridor wall. Replacing the exhaust vents from three square-shaped fans with two larger circular fans installed for the summer season led to increased ventilation efficiency at the worker’s height. As high ventilation efficiency is crucial for effectively diluting harmful gases, these two ventilation schemes were selected for improving the working environment.

2.4.3. CFD Analysis for Ventilation Efficiency and Thermal Environment

To develop a ventilation operation standard that simultaneously considers the work environment and breeding environment based on CFD-computed results, it is essential to analyze the combination of ventilation system, ventilation efficiency, which can reduce harmful gases over the ventilation time, and the temperature difference affecting the pigs. Considering easy accessibility for farmers in the field, a single sheet that visualizes, simplifies, and presents the ventilation operation standard was suggested by combining the multiple analyses from the CFD model. By utilizing the double linear interpolation method through a polynomial regression analysis, the reduction rate of harmful gases in the working environment and the results of the thermal environment analysis for the breeding environment were presented together for each ventilation system.

3. Results and Discussion

3.1. Field Monitoring for Harmful Gas Concentrations

To analyze the exposure of workers to gas concentrations inside the pigpen, a comprehensive analysis was conducted using measured data from gas detectors attached at the height of the worker’s shoulder and image data captured during the measurements. The work performed in the pig house was categorized into morning and afternoon work including shipment, animal manure treatment, vaccine administration, condition checking, cleaning, and marking. During the continuous monitoring of gas concentrations including ammonia and hydrogen sulfide, each datum was obtained based on the average concentrations during each task performed as shown in Figure 6. Each work was further classified as either a “contact” work if the worker directly contacted the pigs or a “non-contact” work if there is no direct contact with the pigs.
Each data point in Figure 7 and Figure 8 represents the average ammonia and hydrogen sulfide concentrations monitored at the worker’s height during the working time. During contact work such as general checking, manure treatment, and cleaning tasks, ammonia concentrations was higher compared to non-contact work. Generally, workers were exposed to ammonia concentrations ranging from late 20 ppm to 40 ppm during contact work. During the shipment task of pigs, workers were exposed to low ammonia concentrations of 5 ppm or lower due to increments of ventilation by opening whole doors in the pigpen. The average exposure to ammonia was further analyzed by the type of work. The highest ammonia concentration was observed when workers moved pigs between compartments within the pigpen, with an average exposure of 43.0 ppm. Other tasks associated with relatively high ammonia concentrations included manure treatment (31.8 ppm), condition checking (26.5 ppm), and cleaning (27.0 ppm). On the other hand, marking (8.8 ppm) and vaccine injection (6.2 ppm) resulted in relatively low ammonia exposure. The average ammonia concentration during the shipment of pigs was 3.0 ppm, indicating a low exposure level despite the direct contact with pigs. This can be attributed to the fact that the task is mainly performed in the corridor outside the pigpen. The average levels of ammonia exposure were compared between contact work and non-contact work. Contact work had an average ammonia concentration of 24.7 ppm, which was 1.58 times higher than the average concentration of 15.6 ppm observed in non-contact work.
The average exposure to hydrogen sulfide by working type was also analyzed (Figure 8). The highest hydrogen sulfide concentration was observed during the vaccine injection task, with an average exposure of 4.0 ppm. Internal cleaning, manure treatment, and condition checking tasks resulted in average exposures of 3.4 ppm, 1.9 ppm, and 1.5 ppm, respectively. The average levels of hydrogen sulfide exposure were compared between contact work and non-contact work. Non-contact work had an average exposure of 1.1 ppm, while direct contact work had an average exposure of 3.0 ppm, indicating an approximately 2.73-fold higher concentration in contact work. It should be noted that while hydrogen sulfide tends to be concentrated on the floor of the pigpen, the measurements in our experiment were taken at the worker’s shoulder height, which corresponds to the height of the worker’s respiratory system.

3.2. CFD Analysis for Ventilation Efficiency and Thermal Environment

The ventilation efficiency analysis was conducted through a CFD simulation for a total of 42 ventilation systems in the experimental pigpen at a height of 1.5 m (representing the worker’s respiratory tract location) and 0.5 m (representing the pig’s respiratory tract location). Table 2 provides the minimum, average, and maximum ventilation efficiencies at the corresponding heights, along with the individual analysis of ventilation efficiencies on the corridor side. Among the 50 ventilation combinations, the top 20% of structures that exhibited the highest ventilation efficiency at both the worker’s height and the pig’s height commonly utilized both upper and lower windows as inlets. These combinations demonstrated an average airflow exchange rate (AER·m−1) of 0.34 at the worker’s height and 0.4 AER·m−1 at the pig’s height. Comparing these values with the average value of 0.28 AER·m−1 for the previously operated ventilation system, a 24% improvement in ventilation efficiency at the worker’s height and a 43% improvement at the pig’s height are observed at the same ventilation capacity with changing combinations of vents.
In cases where a single-floor window inlet structure was used, the analysis revealed higher ventilation efficiency when the upper windows were employed rather than the lower windows. Specifically, when only the upper windows were utilized, the average ventilation efficiency was 10.7% higher at the worker’s height and 17.8% higher at the pig’s height compared to using only the lower windows. Conversely, when both the upper and lower windows were utilized, the overall ventilation efficiency improved compared to using a single-floor window. This showed an average improvement of 25% at the worker’s height and an average improvement of 45% at the pig’s height. The larger improvement at the pig’s height was attributed to the height of the inlet windows. Regarding the exhaust structure, the analysis results demonstrated that the ventilation efficiency improved in all ventilation structure combinations when two circular fans, which were previously only used in summer, were utilized instead of the three square-exhaust fans. On average, the efficiency improvement was 10.8% at the worker’s height and 12% at the pig’s height. While the three square fans were located on the walls of the left and right sides of the pigpen and in the center close to the corridors, the two circular fans were positioned in the center of the pigpen where the pigs were reared, resulting in higher ventilation efficiencies. Based on the ventilation efficiency analysis mentioned above, the airflow pattern based on the inlet and outlet combinations significantly affected the levels of ventilation efficiency for reducing harmful gases at both the worker’s and the pig’s heights.
Table 3 presents the thermal distribution analysis for uniformity and stability during the ventilation period. The temperature difference levels are indicated by different colors: white for normal, gray for caution, and black for warning. When the exhaust system was changed from the (B, LW) case to the (B, LW, CF) case, there was an increase in the proportion of sections representing small temperature changes of less than 3 °C. This increase was particularly significant in the case of a ventilation efficiency of 0.75 AER. The analysis indicated that increasing the inlets by opening the lower windows had an impact on the ammonia reduction rate. The change in the ventilation system using larger exhaust fans may lead to temperature drops affecting the breeding environment of the pigs.

3.3. Ventilation Operating Standard for Improving Working and Breeding Environments

When the ventilation was continuously operated for a long duration, it could lead to temperature drops affecting the thermal environment in the pigpen. The ventilation time is an important factor, not only for removing harmful gases but also for controlling internal thermal conditions. Figure 9 illustrates the ammonia reduction rate based on the ventilation capacity and time for each system. The maximum ammonia reduction rate increased significantly from 28.8% at a ventilation time of 60 s to 42.6% at a ventilation time of 180 s. However, there was no significant increase beyond 180 s, with the reduction rate remaining at 42.5% at a ventilation time of 300 s. Additionally, as the ventilation time increased, the temperature drop in the herd of pigs progressed from the caution to warning level. Therefore, the most efficient ventilation time for reducing ammonia gas can be determined to be up to 3 min, considering the balance between ammonia reduction and thermal stability.
Figure 10 illustrates the ventilation operating standard, which represented the appropriate ventilation volume and ventilation time in a single diagram, for the experimental pig house considering different ventilation structures for reducing harmful gases and controlling the breeding environment. It is possible to know the working and breeding environments in advance through the ventilation operating standard. For example, in Figure 10a, when ventilation was performed for 180 s with a ventilation volume of 0.85 AER/min, the removal rate of harmful gases at the worker’s height was high, but the temperature at the pig’s height was at the caution level. When the ventilation rate was maximum, the reduction rate of harmful gases was the highest for all cases. However, it is important to consider that the maximum ventilation rate can lead to sudden temperature drops, which can be problematic for the breeding environment. In the case of the existing ventilation system, the reduction rates of harmful gases were relatively low: 1.4% at 0.55 AER, 13.9% at 0.75 AER, and 23% at 1.0 AER. As the ventilation rate increased, the breeding environment deteriorated to the level of caution and warning in terms of thermal stability. This indicates that it is necessary to consider a balance between reducing harmful gases and maintaining a stable breeding environment when selecting the appropriate ventilation system.
Among the upgraded ventilation systems, the increased inlet area with the lower windows showed the highest ammonia gas reduction rate, averaging 27.7%, while the average reduction rates for different ventilation volumes were 16.2% at 0.55 AER, 29.3% at 0.75 AER, and 37.5% at 1.0 AER. When the ventilation efficiency was only considered to achieve the highest performance in reducing harmful gases, it also led to sudden temperature drops at the pig height. In most cases, the temperature differences reached warning levels within 1 min of ventilation time. Consequently, this ventilation system could cause problems for breeding conditions while removing harmful gases from the working environment (Figure 10b). When more exhaust fans were used with two large circular fans, the results showed a relatively low improvement in the working environment, averaging 12.1%. Specifically, this system achieved working environment improvement effects of 1.6% at 0.55 AER, 12.8% at 0.75 AER, and 22% at 1.0 AER (Figure 10c).
The ventilation system with increased inlets was effective in improving the working environment due to its successful reduction of harmful gases, while the system with increased outlets minimized the adverse effects on the breeding environment. When both upgraded measures were applied together, an overall improvement effect of 27.3% was achieved; ammonia reduction rates of 16.5% at 0.5 AER, 28.3% at 0.75 AER, and 37.2% at 1.0 AER (min−1). As for temperature differences, the level did not exceed the warning threshold in most cases. By applying both upgraded ventilation structures, a high level of working environment improvement (27.3% improvement for workers) and temperature stability for the herd of pigs was achieved (Figure 10d).

4. Conclusions

This study comprehensively analyzed both the breeding environment and working environment, which should be considered simultaneously. Field measurements have shown that workers were exposed to high ammonia concentrations of 43 ppm on average when moving pigs inside the pigpen. When the worker performed a task that involved direct contact with pigs, they were exposed to a 1.58-fold higher ammonia concentration compared with that of non-contact work.
CFD (computational fluid dynamics) was used to make the optimal ventilation operation standard for improving both the working and breeding environments simultaneously in a pig house. Among 50 combinations of ventilation systems, the upgraded ventilation system was chosen considering the gas reduction rate and thermal stability. For this, it is important to appropriately adjust the ventilation volume and ventilation time, along with improvements in the ventilation structure. It is difficult to analyze this in real time on-site, and it is necessary to create standards for automatic control. Since the control standard always changes depending on the structure, it is important to set standards according to the structure. In this study, a single diagram was presented that could be evaluated on-site for the existing structure and three improved structures. The results can be used to make a livestock environment management algorithm for using IoT-based automatic precision control in the future, and for making precision agricultural systems considering upgraded working and breeding environments, simultaneously.

Author Contributions

Investigation, H.-J.S.; Writing-original draft, B.-W.O.; writing—review and editing, I.-H.S. All authors have read and agreed to the published version of the manuscript.

Funding

This research was funded by Korea Institute of Planning and Evaluation for Technology in Food, Agriculture and Forestry (IPET) through 2025 Livestock Industrialization Technology Development Program grant number [321085053SB010]. And The APC was funded by Ministry of Agriculture, Food and Rural Affairs (MAFRA).

Data Availability Statement

No new data were created or analyzed in this study. Data sharing is not applicable to this article.

Conflicts of Interest

The authors declare no conflict of interest.

References

  1. Thorne, P.S.; Ansley, A.C.; Perry, S.S. Concentrations of bioaerosols, odors, and hydrogen sulfide inside and downwind from two types of swine livestock operations. J. Occup. Environ. Hyg. 2009, 6, 211–220. [Google Scholar] [CrossRef] [Green Version]
  2. Gautam, R.; Heo, Y.; Lim, G.; Song, E.; Roque, K.; Lee, J.; Kim, Y.; Cho, A.; Shin, S.; Kim, C. Altered immune responses in broiler chicken husbandry workers and their association with endotoxin exposure. Ind. Health 2017, 56, 10–19. [Google Scholar] [CrossRef] [PubMed] [Green Version]
  3. Park, K.-H.; Jeong, B.-Y. Characteristics and causes of musculoskeletal disorders for employees aged 50 years or older. J. Ergon. Soc. Korea 2009, 28, 139–145. [Google Scholar] [CrossRef]
  4. Chapin, A.; Boulind, C.; Moore, A. Controlling odor and gaseous emission problems from industrial Swine facilities. Yale Environ. Prot. Clin. Handb. 1998. [Google Scholar]
  5. Bruce, J. Ventilation and Temperature Control Criteria for Pigs. Environ. Asp. Hous. Anim. Production. 1981, 197–216. [Google Scholar]
  6. Donham, K.J.; Scallon, L.J.; Popendorf, W.; Treuhaft, M.W.; Roberts, R.C. Characterization of dusts collected from swine confinement buildings. Am. Ind. Hyg. Assoc. J. 1986, 47, 404–410. [Google Scholar] [CrossRef] [PubMed]
  7. Kim, C.-B.; Won, J.-U.; Roh, J.-H.; Lee, K.-H.; Lee, H.-J.; Lee, H.-S.; Lee, H.-J. Study on manifestation of allergic symptoms by cultivation of Cyperus exaltatus & manufacture of hwamunsok. J. Agric. Med. Community Health 1995, 20, 187–195. [Google Scholar]
  8. Dutkiewicz, J. Bacteria and fungi in organic dust as potential health hazard. Ann. Agric. Environ. Med. 1997, 4, 11–16. [Google Scholar]
  9. KIM, G.S.; Kim, E.A.; Lee, S.H.; Pakr, H.S. A Study on Risk Factors of Grain Dust-Induced Occupational Asthma in Grain Feedmill Workers. Korean J. Occup. Environ. Med. 1997, 9, 628–640. [Google Scholar] [CrossRef]
  10. Lim, H.-S.; Bae, G.-R.; Kim, D.-H.; Jun, K.-H. Respiratory symptoms occurring among mushroom farmers. J. Agric. Med. Community Health 1998, 23, 259–268. [Google Scholar]
  11. Bottcher, R.W. An environmental nuisance: Odor concentrated and transported by dust. Chem. Senses 2001, 26, 327–331. [Google Scholar] [CrossRef] [PubMed] [Green Version]
  12. Eom, H.-J. Beware of swine respiratory diseases in winter. Feed J. 2006, 4, 106–110. [Google Scholar]
  13. Oh, B.-W.; Lee, S.-W.; Kim, H.-C.; Seo, I.-H. Analysis of working environment and ventilation efficiency in pig house using computational fluid dynamics. J. Korean Soc. Agric. Eng. 2019, 61, 85–95. [Google Scholar] [CrossRef]
  14. Lee, S.-W.; Kim, H.-C.; Seo, I.-H. Monitoring of Internal Harmful Factors According to Environmental Factors in Pig Farm. J. Korean Soc. Agric. Eng. 2020, 62, 105–115. [Google Scholar] [CrossRef]
  15. Bjerg, B.; Svidt, K.; Zhang, G.; Morsing, S.; Johnsen, J.O. Modeling of air inlets in CFD prediction of airflow in ventilated animal houses. Comput. Electron. Agric. 2002, 34, 223–235. [Google Scholar] [CrossRef]
  16. Seo, I.-H.; Lee, I.-B.; Hong, S.-W.; Hwang, H.-S.; Bitog, J.P.; Yoo, J.-I.; Kwon, K.-S.; Ha, T.-H.; Kim, H.-T. Development of a CFD model to study ventilation efficiency of mechanically ventilated pig house. J. Korean Soc. Agric. Eng. 2008, 50, 25–37. [Google Scholar] [CrossRef] [Green Version]
  17. Seo, I.-H.; Lee, I.-B.; Moon, O.-K.; Hong, S.-W.; Hwang, H.-S.; Bitog, J.P.; Kwon, K.-S.; Ye, Z.; Lee, J.-W. Modelling of internal environmental conditions in a full-scale commercial pig house containing animals. Biosyst. Eng. 2012, 111, 91–106. [Google Scholar] [CrossRef]
  18. Hong, S.-W.; Exadaktylos, V.; Lee, I.-B.; Amon, T.; Youssef, A.; Norton, T.; Berckmans, D. Validation of an open source CFD code to simulate natural ventilation for agricultural buildings. Comput. Electron. Agric. 2017, 138, 80–91. [Google Scholar] [CrossRef]
  19. Li, H.; Rong, L.; Zhang, G. Reliability of turbulence models and mesh types for CFD simulations of a mechanically ventilated pig house containing animals. Biosyst. Eng. 2017, 161, 37–52. [Google Scholar] [CrossRef]
  20. Wang, K.; Wang, X.; Wu, B. Assessment of hygrothermal conditions in a farrowing room with a wet-pad cooling system based on CFD simulation and field measurements. Trans. ASABE 2014, 57, 1493–1500. [Google Scholar] [CrossRef]
  21. Rong, L.; Nielsen, P.V.; Bjerg, B.; Zhang, G. Summary of best guidelines and validation of CFD modeling in livestock buildings to ensure prediction quality. Comput. Electron. Agric. 2016, 121, 180–190. [Google Scholar] [CrossRef]
  22. Berckmans, D. General introduction to precision livestock farming. Anim. Front. 2017, 7, 6–11. [Google Scholar] [CrossRef] [Green Version]
  23. Kim, R.-W.; Lee, I.-B.; Ha, T.-H.; Yeo, U.-H.; Lee, S.-Y.; Lee, M.-H.; Park, G.-Y.; Kim, J.-G. Development of CFD model for predicting ventilation rate based on age of air theory using thermal distribution data in pig house. J. Korean Soc. Agric. Eng. 2017, 59, 61–71. [Google Scholar] [CrossRef]
  24. Li, H.; Rong, L.; Zhang, G. Numerical study on the convective heat transfer of fattening pig in groups in a mechanical ventilated pig house. Comput. Electron. Agric. 2018, 149, 90–100. [Google Scholar] [CrossRef]
  25. Kwon, K.-S.; Lee, I.-B.; Ha, T. Identification of key factors for dust generation in a nursery pig house and evaluation of dust reduction efficiency using a CFD technique. Biosyst. Eng. 2016, 151, 28–52. [Google Scholar] [CrossRef]
  26. Reynolds, A. A model for predicting airborne dust concentrations within a ventilated airspace. J. Agric. Eng. Res. 1997, 66, 103–109. [Google Scholar] [CrossRef]
  27. Rong, L.; Elhadidi, B.; Khalifa, H.; Nielsen, P.V. CFD modeling of airflow in a livestock building. IAQVEC 2010, 2010, 7. [Google Scholar]
  28. Rong, L.; Elhadidi, B.; Khalifa, H.E.; Nielsen, P.V.; Zhang, G. Validation of CFD simulation for ammonia emissions from an aqueous solution. Comput. Electron. Agric. 2011, 75, 261–271. [Google Scholar] [CrossRef]
  29. Saha, C.K.; Wu, W.; Zhang, G.; Bjerg, B. Assessing effect of wind tunnel sizes on air velocity and concentration boundary layers and on ammonia emission estimation using computational fluid dynamics (CFD). Comput. Electron. Agric. 2011, 78, 49–60. [Google Scholar] [CrossRef]
  30. Wu, W.; Zhang, G.; Bjerg, B.; Nielsen, P.V. An assessment of a partial pit ventilation system to reduce emission under slatted floor—Part 2: Feasibility of CFD prediction using RANS turbulence models. Comput. Electron. Agric. 2012, 83, 134–142. [Google Scholar] [CrossRef]
  31. Bjerg, B.; Cascone, G.; Lee, I.-B.; Bartzanas, T.; Norton, T.; Hong, S.-W.; Seo, I.-H.; Banhazi, T.; Liberati, P.; Marucci, A. Modelling of ammonia emissions from naturally ventilated livestock buildings. Part 3: CFD modelling. Biosyst. Eng. 2013, 116, 259–275. [Google Scholar] [CrossRef]
  32. Wu, W.; Zong, C.; Zhang, G. Comparisons of two numerical approaches to simulate slatted floor of a slurry pit model–large eddy simulations. Comput. Electron. Agric. 2013, 93, 78–89. [Google Scholar] [CrossRef]
  33. Zong, C.; Zhang, G. Numerical modelling of airflow and gas dispersion in the pit headspace via slatted floor: Comparison of two modelling approaches. Comput. Electron. Agric. 2014, 109, 200–211. [Google Scholar] [CrossRef]
  34. Rong, L.; Nielsen, P.V.; Zhang, G. Experimental and numerical study on effects of airflow and aqueous ammonium solution temperature on ammonia mass transfer coefficient. J. Air Waste Manag. Assoc. 2010, 60, 419–428. [Google Scholar] [CrossRef] [PubMed] [Green Version]
  35. Xia, L.; Zou, Z.-J.; Wang, Z.-H.; Zou, L.; Gao, H. Surrogate model based uncertainty quantification of CFD simulations of the viscous flow around a ship advancing in shallow water. Ocean Eng. 2021, 234, 109206. [Google Scholar] [CrossRef]
  36. Cravero, C.; De Domenico, D.; Marsano, D. The use of uncertainty quantification and numerical optimization to support the design and operation management of air-staging gas recirculation strategies in glass furnaces. Fluids 2023, 8, 76. [Google Scholar] [CrossRef]
  37. Cravero, C.; De Domenico, D.; Marsano, D. Uncertainty Quantification Analysis of Exhaust Gas Plume in a Crosswind. Energies 2023, 16, 3549. [Google Scholar] [CrossRef]
  38. Fluent, A. R2 User’s Guide. Available online: https://forum.ansys.com/uploads/846/SCJEU0NN8IHX.pdf (accessed on 23 June 2021).
  39. Seo, I.-H.; Lee, I.-B.; Moon, O.-K.; Kim, H.-T.; Hwang, H.-S.; Hong, S.-W.; Bitog, J.; Yoo, J.-I.; Kwon, K.-S.; Kim, Y.-H. Improvement of the ventilation system of a naturally ventilated broiler house in the cold season using computational simulations. Biosyst. Eng. 2009, 104, 106–117. [Google Scholar] [CrossRef]
  40. Kwon, K.-S.; Lee, I.-B.; Hwang, H.-S.; Bitog, J.P.; Hong, S.-W.; Seo, I.-H.; Choi, J.-S.; Song, S.-H.; Moon, O.-K. Analysis on the optimum location of an wet air cleaner in a livestock house using CFD technology. J. Korean Soc. Agric. Eng. 2010, 52, 19–29. [Google Scholar] [CrossRef] [Green Version]
  41. Lee, S.-Y.; Lee, I.-B.; Kwon, K.-S.; Ha, T.-H.; Yeo, U.-H.; Park, S.-J.; Kim, R.-W.; Jo, Y.-S.; Lee, S.-N. Analysis of Natural Ventilation Rates of Venlo-type Greenhouse Built on Reclaimed Lands using CFD. J. Korean Soc. Agric. Eng. 2015, 57, 21–33. [Google Scholar] [CrossRef] [Green Version]
  42. Lee, S.-Y.; Lee, I.-B.; Kim, R.-W. Evaluation of wind-driven natural ventilation of single-span greenhouses built on reclaimed coastal land. Biosyst. Eng. 2018, 171, 120–142. [Google Scholar] [CrossRef]
  43. Sun, H.; Keener, H.M.; Deng, W.; Michel, F.C., Jr. Development and validation of 3-d CFD models to simulate airflow and ammonia distribution in a high-rise™ hog building during summer and winter conditions. Agric. Eng. Int. CIGR J. 2004, 6. [Google Scholar]
  44. Rong, L.; Aarnink, A. Development of ammonia mass transfer coefficient models for the atmosphere above two types of the slatted floors in a pig house using computational fluid dynamics. Biosyst. Eng. 2019, 183, 13–25. [Google Scholar] [CrossRef]
Figure 1. Experimental pigpen with mechanical ventilation systems including five different exhaust fans and duct inlets.
Agriengineering 05 00086 g001
Figure 2. Ventilation system operated during spring season with combinations of various outlets (red) and inlets (blue).
Agriengineering 05 00086 g002
Figure 3. Research procedure for modeling ventilation efficiency considering regional thermal conditions.
Agriengineering 05 00086 g003
Figure 4. Research procedure for modeling ventilation efficiency considering regional thermal conditions. (a) NH3 and H2S sensors and (b) installation of sensors at worker’s shoulder.
Agriengineering 05 00086 g004
Figure 5. Divided sectors for analysis of thermal environment at 1.5 m height.
Agriengineering 05 00086 g005
Figure 6. Ammonia and hydrogen sulfide concentrations monitored at shoulder height in pig room (yellow section at working time).
Agriengineering 05 00086 g006
Figure 7. Average ammonia concentration during contact & non-contact works in pig house.
Agriengineering 05 00086 g007
Figure 8. Average hydrogen sulfide concentration during contact & non-contact works in pig house.
Agriengineering 05 00086 g008
Figure 9. NH3 reduction rate and ventilation time for each ventilation structure combination (red box is time of sharply increasing reduction rate). (a) 0.55AER; (b) 0.75AER; (c) 1.0AER.
Agriengineering 05 00086 g009
Figure 10. A ventilation diagram representing appropriate ventilation volume and time considering internal gas reduction at working height (solid line) with numeric values representing thermal suitability ratios at pig height (dot line) in colors as follows: white, yellow, and red refer to normal, caution, and warning conditions, respectively. (a) Basic (Standard); (b) Upgrade ① (B, LW); (c) Upgrade ② (B, CF); (d) Upgrade ①, ② (B, LW, CF).
Agriengineering 05 00086 g010
Table 1. Boundary conditions for the CFD simulation model of the experimental pig house.
ContentValue
Number of meshesabout 4.5 million
Mesh sizeMinimum size 0.05 (cm)
Mesh designTetrahedron
Boundary conditionsVelocity inlet and pressure outlet
Turbulence modelRealizable k-ε
Input temperature291.8 (K)
Output temperature289.5 (K)
Inside initial temperature297.8 (K)
Pig heat flux210.9 (W·m−1)
Ventilation rate (air exchanges)0.55 (m−1)
Velocity at the inlet vent3.71 (m·s−1)
NH3 concentration at work height (1.5 m)38.7 (ppm)
Table 2. Result of ventilation efficiency considering various combinations of ventilation structures. The meanings of symbols are as follows: SF (square fan), CF (circular fan), RBD (right big duct), LBD (left big duct), SD (small duct), UW (upper window), and LW (lower window).
CaseOutletInletHuman Height (1.5 m)Pig Height (0.5 m)
Min.Avg.Max.Min.Avg.Max.
StandardSF, RBDLBD, SD, UW0.240.280.320.240.280.35
A-1SF, CF, RBDLBD, SD, UW, DW0.250.350.450.250.350.47
A-2SF, CF, RBDSD, UW, DW0.250.350.410.230.410.47
A-3SF, CF, RBDUW, DW0.240.350.390.230.400.47
A-4SF, CF, RBDUW0.260.310.340.260.280.34
A-5SF, CF, RBDDW0.250.250.310.240.240.37
B-1SF, RBDLBD, SD, UW, DW0.270.370.440.260.430.47
B-2SF, RBDSD, UW, DW0.250.280.310.230.280.31
B-3SF, RBDUW, DW0.250.340.360.250.390.43
B-4SF, RBDUW0.230.290.320.230.310.32
B-5SF, RBDDW0.230.280.310.220.290.38
C-1SFLBD, SD, UW, DW0.280.360.430.260.410.46
C-2SFSD, UW, DW0.260.350.420.260.400.47
C-3SFUW, DW0.270.360.430.260.420.47
C-4SFUW0.240.310.330.250.310.32
C-5SFDW0.260.250.310.250.220.37
D-1CF, RBDLBD, SD, UW, DW0.300.420.520.290.500.57
D-standardCF, RBDLBD, SD, UW0.250.280.330.240.280.37
D-2CF, RBDSD, UW, DW0.250.370.420.240.420.47
D-3CF, RBDUW, DW0.260.370.440.250.420.48
D-4CF, RBDUW0.230.300.320.220.310.32
D-5CF, RBDDW0.260.270.310.250.250.38
E-1CFLBD, SD, UW, DW0.260.390.450.460.440.25
E-2CFSD, UW, DW0.290.330.470.280.350.49
E-3CFUW, DW0.270.370.430.250.420.48
E-4CFUW0.240.300.330.230.320.33
E-5CFDW0.260.280.320.260.250.38
F-1SFCF, RBD, SD0.240.260.340.260.260.38
F-2SFCF, RBD, UW, DW0.230.320.440.240.360.46
F-3SFCF, RBD, LBD, SD, UW, DW0.240.290.440.240.380.47
F-4SFCF, SD0.250.280.350.250.230.36
F-5SFCF, UW, DW0.210.330.550.220.490.60
F-6SFCF, LBD, SD, UW, DW0.220.310.460.210.370.47
G-1SF, RBD–LBDSD, UW, DW0.230.340.410.230.410.47
G-3SF, RBD–LBDUW, DW0.240.310.380.240.320.43
G-4SF, RBD–LBDUW0.220.290.330.210.290.31
G-5SF, RBD–LBDDW0.250.260.310.250.240.38
H-1SFRBD, LBD, SD, UW, DW0.260.350.430.240.410.45
H-3SFRBD, LBD, UW, DW0.270.350.420.260.400.45
H-4SFRBD, LBD, UW0.230.270.320.210.260.35
H-5SFRBD, LBD, DW0.250.290.350.230.300.40
Table 3. Temperature analysis at pig height (0.5 m) on improving ventilation system cases.
CaseVent. R.
(AER−1)
0.550.751.0
Vent. T.
(°C)
x < 33 ≤ x < 5x < 33 ≤ x < 5x < 33 ≤ x < 5
Basic
(Standard)
60 s82.916.573.326.36931
180 s75.923.764.63359.238.4
300 s84.615.46134.949.545.9
Upgrade-1
(B, LW)
60 s66.331.644.149.867.832.2
180 s60.832.239.75341.656
300 s663033.056.239.458.1
Upgrade-2
(B, CF)
60 s80.217.373.825.969.830.2
180 s8118.964.933.756.241
300 s82.714.66729.244.950.5
Upgrade-3
(B, LW, CF)
60 s65.232.165.733.368.731.3
180 s67.129.471.426.740.555.7
300 s63.532.560.638.739.455.4
Disclaimer/Publisher’s Note: The statements, opinions and data contained in all publications are solely those of the individual author(s) and contributor(s) and not of MDPI and/or the editor(s). MDPI and/or the editor(s) disclaim responsibility for any injury to people or property resulting from any ideas, methods, instructions or products referred to in the content.

