1. Introduction
The welfare of chickens in a production environment depends on several conditions on the farm and the birds’ health. Van Veen et al. [
1] verified with laying hen producers that the activity and movement of the hens are important indicators to assess health and well-being. In this direction, several studies have sought to better understand the behavior of animals to infer welfare [
2,
3,
4].
Human monitoring of animal behavior can be exhaustive and imprecise [
5,
6,
7]. In this field, computer vision has gained space for using non-invasive sensors and ensuring good accuracy in analyzes [
8,
9,
10,
11,
12].
The ability of chickens to walk may indicate lameness [
13,
14,
15], while the level of agitation of the flock may indicate stress to the rearing environment [
16]. Thus, tracking chickens in a production environment has several applications for health and comfort diagnosis that can support mitigating measures and reduce losses in production [
12].
Computer vision systems based on deep learning techniques make it possible to automatically discover data representations more easily, enabling the extraction of location and distance measurements [
7]. The automatic detection of chickens housed on shavings bedding using computer vision cannot be considered a trivial task, as in the monitored area, there are variations in brightness, shadows, concealment by equipment, and the distortion of the camera lens itself [
17]. In this sense, several studies propose different methods of detecting birds [
12,
16,
18].
Several studies sought to track chickens in different rearing environments [
6,
18,
19,
20,
21,
22]. A common problem in tracking organisms is the loss of detection caused by traditional methods, causing ID changes during tracking. Banerjee et al. [
23] tested the Strong Simple Online Real Time Tracking (Strong SORT) model on C. elegans worms and verified the effectiveness of the Id maintenance method. Young-Chul et al. [
24] describe the use of a combination of association based on the proximity of Cartesian coordinates using the Hungarian algorithm and an association based on visual characteristics to maintain the trajectory of the detected object.
The BoT-SORT algorithm [
25], which uses a Kalman filter and a Hungarian algorithm and is associated with the track model in Yolo, presents itself as a new possibility to track objects using a one-step detection method. We hypothesize that this tool can efficiently maintain the identification of chickens in flocks, making it possible to extract important information that may indicate states of agitation and the well-being of individuals and the flock. Our system is different from others, such as Deep-Sort [
26], which is state-of-the-art in object tracking and leverages Deep Learning using a large residual network to extract features related to the appearance of an object. BoT-SORT is used to extract object movement variables such as speed, acceleration, and displacement, where these attributes were used to maintain tracking and ignore detection failures of the bird and the behavior we wanted to observe.
This study aimed to develop an intelligent system to automatically identify chickens in flocks whose housing density represents a challenge for computer vision, track the paths taken by each bird, and extract information such as distances and movement speeds of individuals.
2. Materials and Methods
2.1. Experiment and Video Recording
This study utilised a 15-minute video of 20 chickens housed in a reduced-scale shed. The camera was situated atop the aviary to capture bird images from an overhead perspective. The entire shed area was monitored by a POWER
® camera, model AP2688W, equipped with an analog Charge-Coupled Device (CCD) image sensor. Eighty layers of the Lohmann lineage were monitored from 10 June to 8 September 2020. The birds were 29 weeks old at the beginning of the experiment and were obtained from a commercial farm. The chickens were randomly divided into four groups of 20 birds each. The feed was administered daily in the amount of 110 g/bird. Access to water was free. Light management was similar to that adopted by the original farm, with a photoperiod of 17 h of light. Four models of small-scale warehouses were used, with usable dimensions of 140 cm × 300 cm and 150 cm in height, arranged in an east-west orientation. The birds were housed on a 15 cm high wood chip bed. Each henhouse had two nest boxes (40 cm × 40 cm × 40 cm) installed side by side, a pendulum feeder (Φ 30 cm), and four nipple drinkers. The complete experiment was described by Fernandes et al. [
16].
2.2. Dataset and Hardware Setup
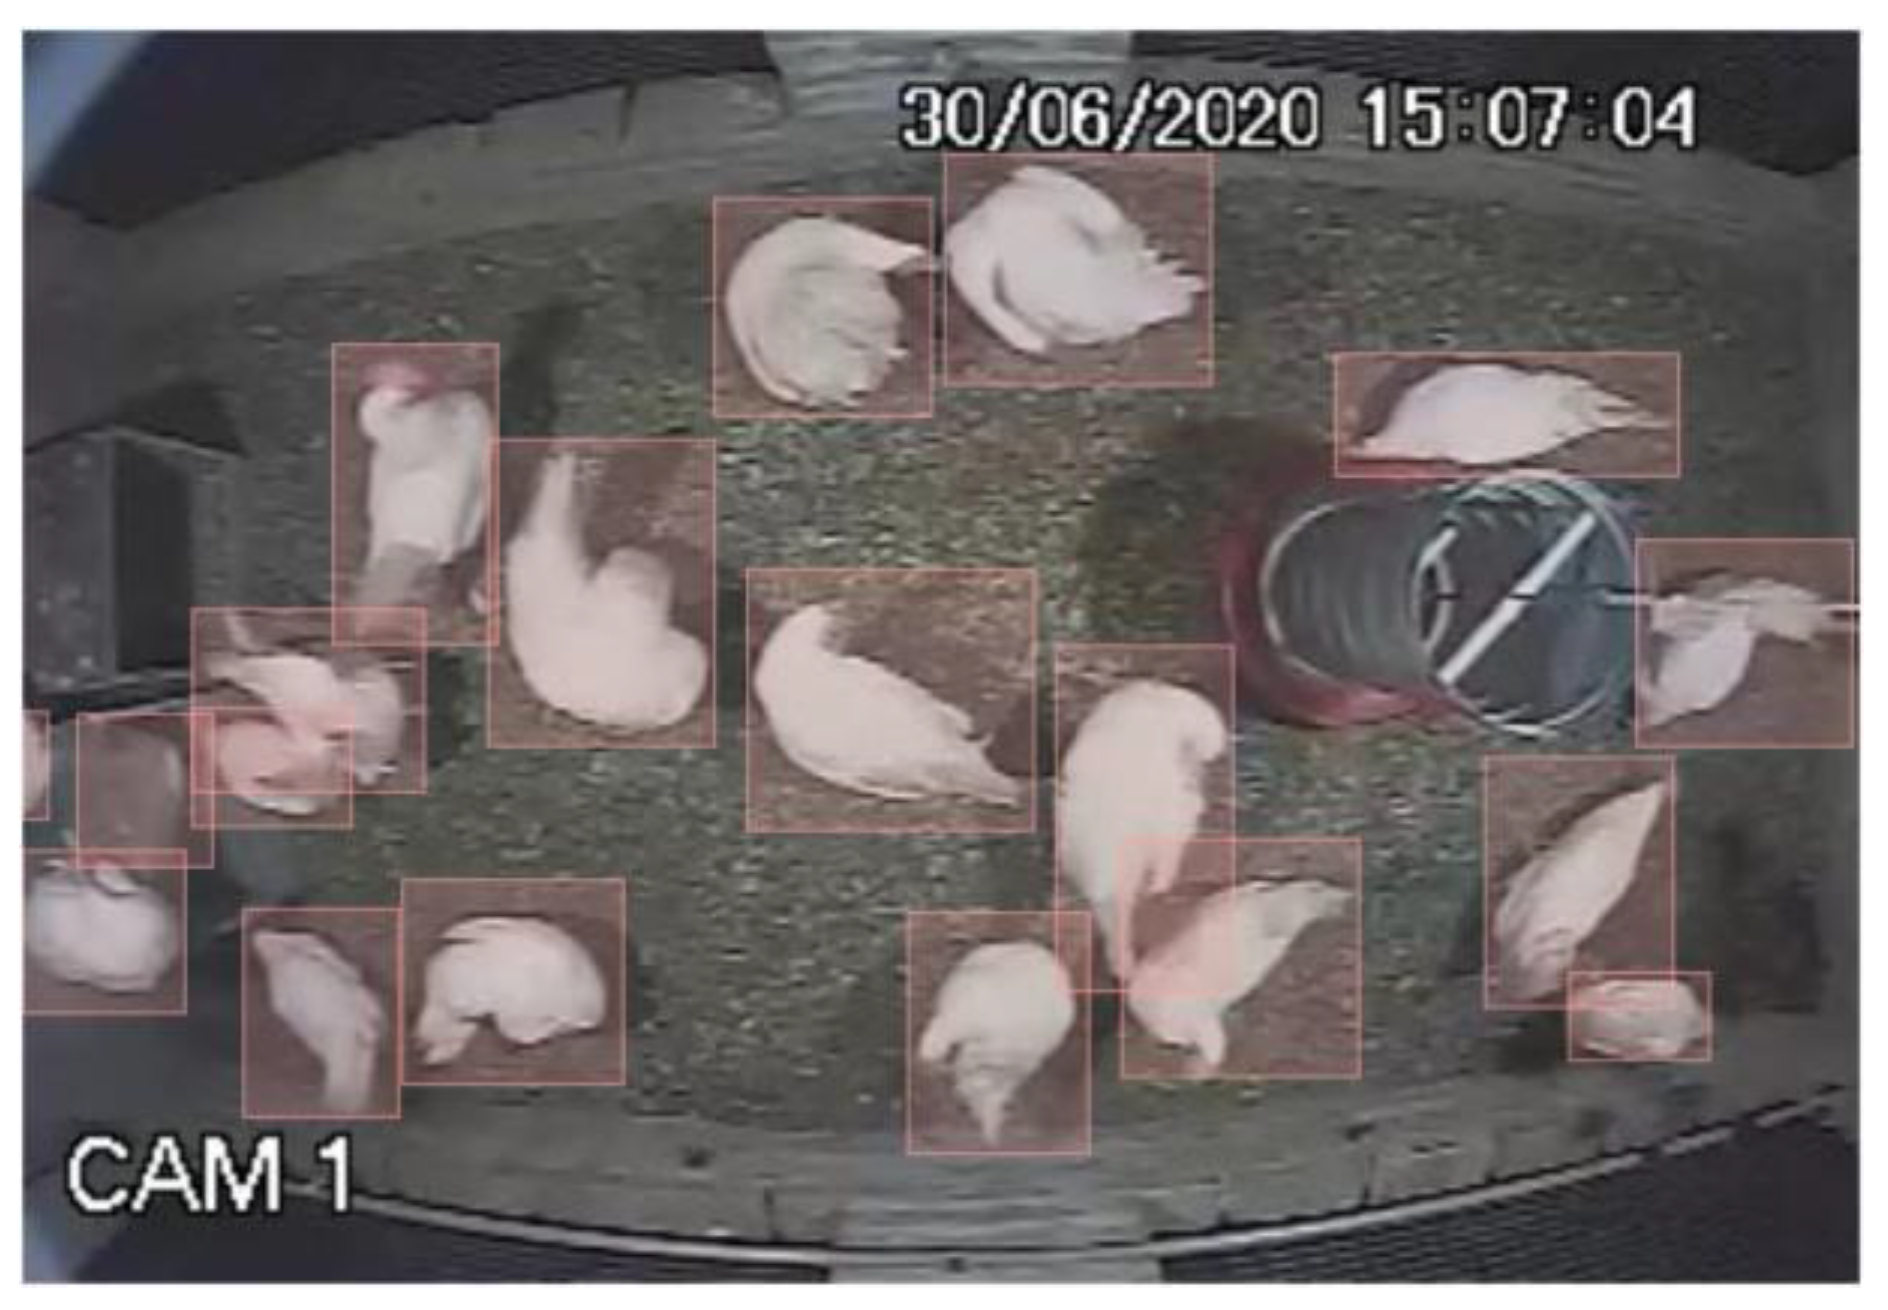
From the set of all videos recorded in the experiment, 3623 frames were randomly extracted, divided into 3123 for training, 259 for testing, and 241 for validation. The images are 352 × 240 pixels, and the capture rate was 30 fps. In each frame, all the birds appearing in the image were marked, using the Label Studio (
https://labelstud.io/, accessed on 5 June 2023) tool (
Figure 1). The coordinates of the birds’ bounding boxes were saved in text files and, together with the images, formed the dataset for generating the Yolo model [
27,
28,
29,
30,
31].
The hardware configuration of the computer utilized in this study is detailed in
Table 1. The scripts for processing the videos were developed and executed using Python 3.9.16, and the Pytorch 1.13.1 framework was employed for deep learning purposes.
2.3. Detection Model—Yolo v8n
A Yolo v8n model was generated and trained using the specified dataset for 50 epochs. Model performance was evaluated using the following metrics.
where
is the average precision for each class and
is the number of classes. In this study,
equals
.
As described in Equation (4), the loss function was utilized to evaluate how the algorithm modeled the data set and achieved the desired outcome.
where
,
,
are the losses of location, trust and class;
increase weight for loss in bounding box coordinates;
if the chicken in box
and cell
match,
where not;
it’s just the opposite;
,
,
are the coordinates
of the location, width and height of the
bouding box;
reduces loss when detecting background;
is the total number of classes, which in our model is equal to 1;
denotes the conditional class probability for the class
in the cell
.
2.4. Tracking Algorithm
The BoT-SORT multi-object tracking model of Yolo v8n was utilized in this study, which employs a state vector based on the Kalman filter and Hungarian algorithm [
25].
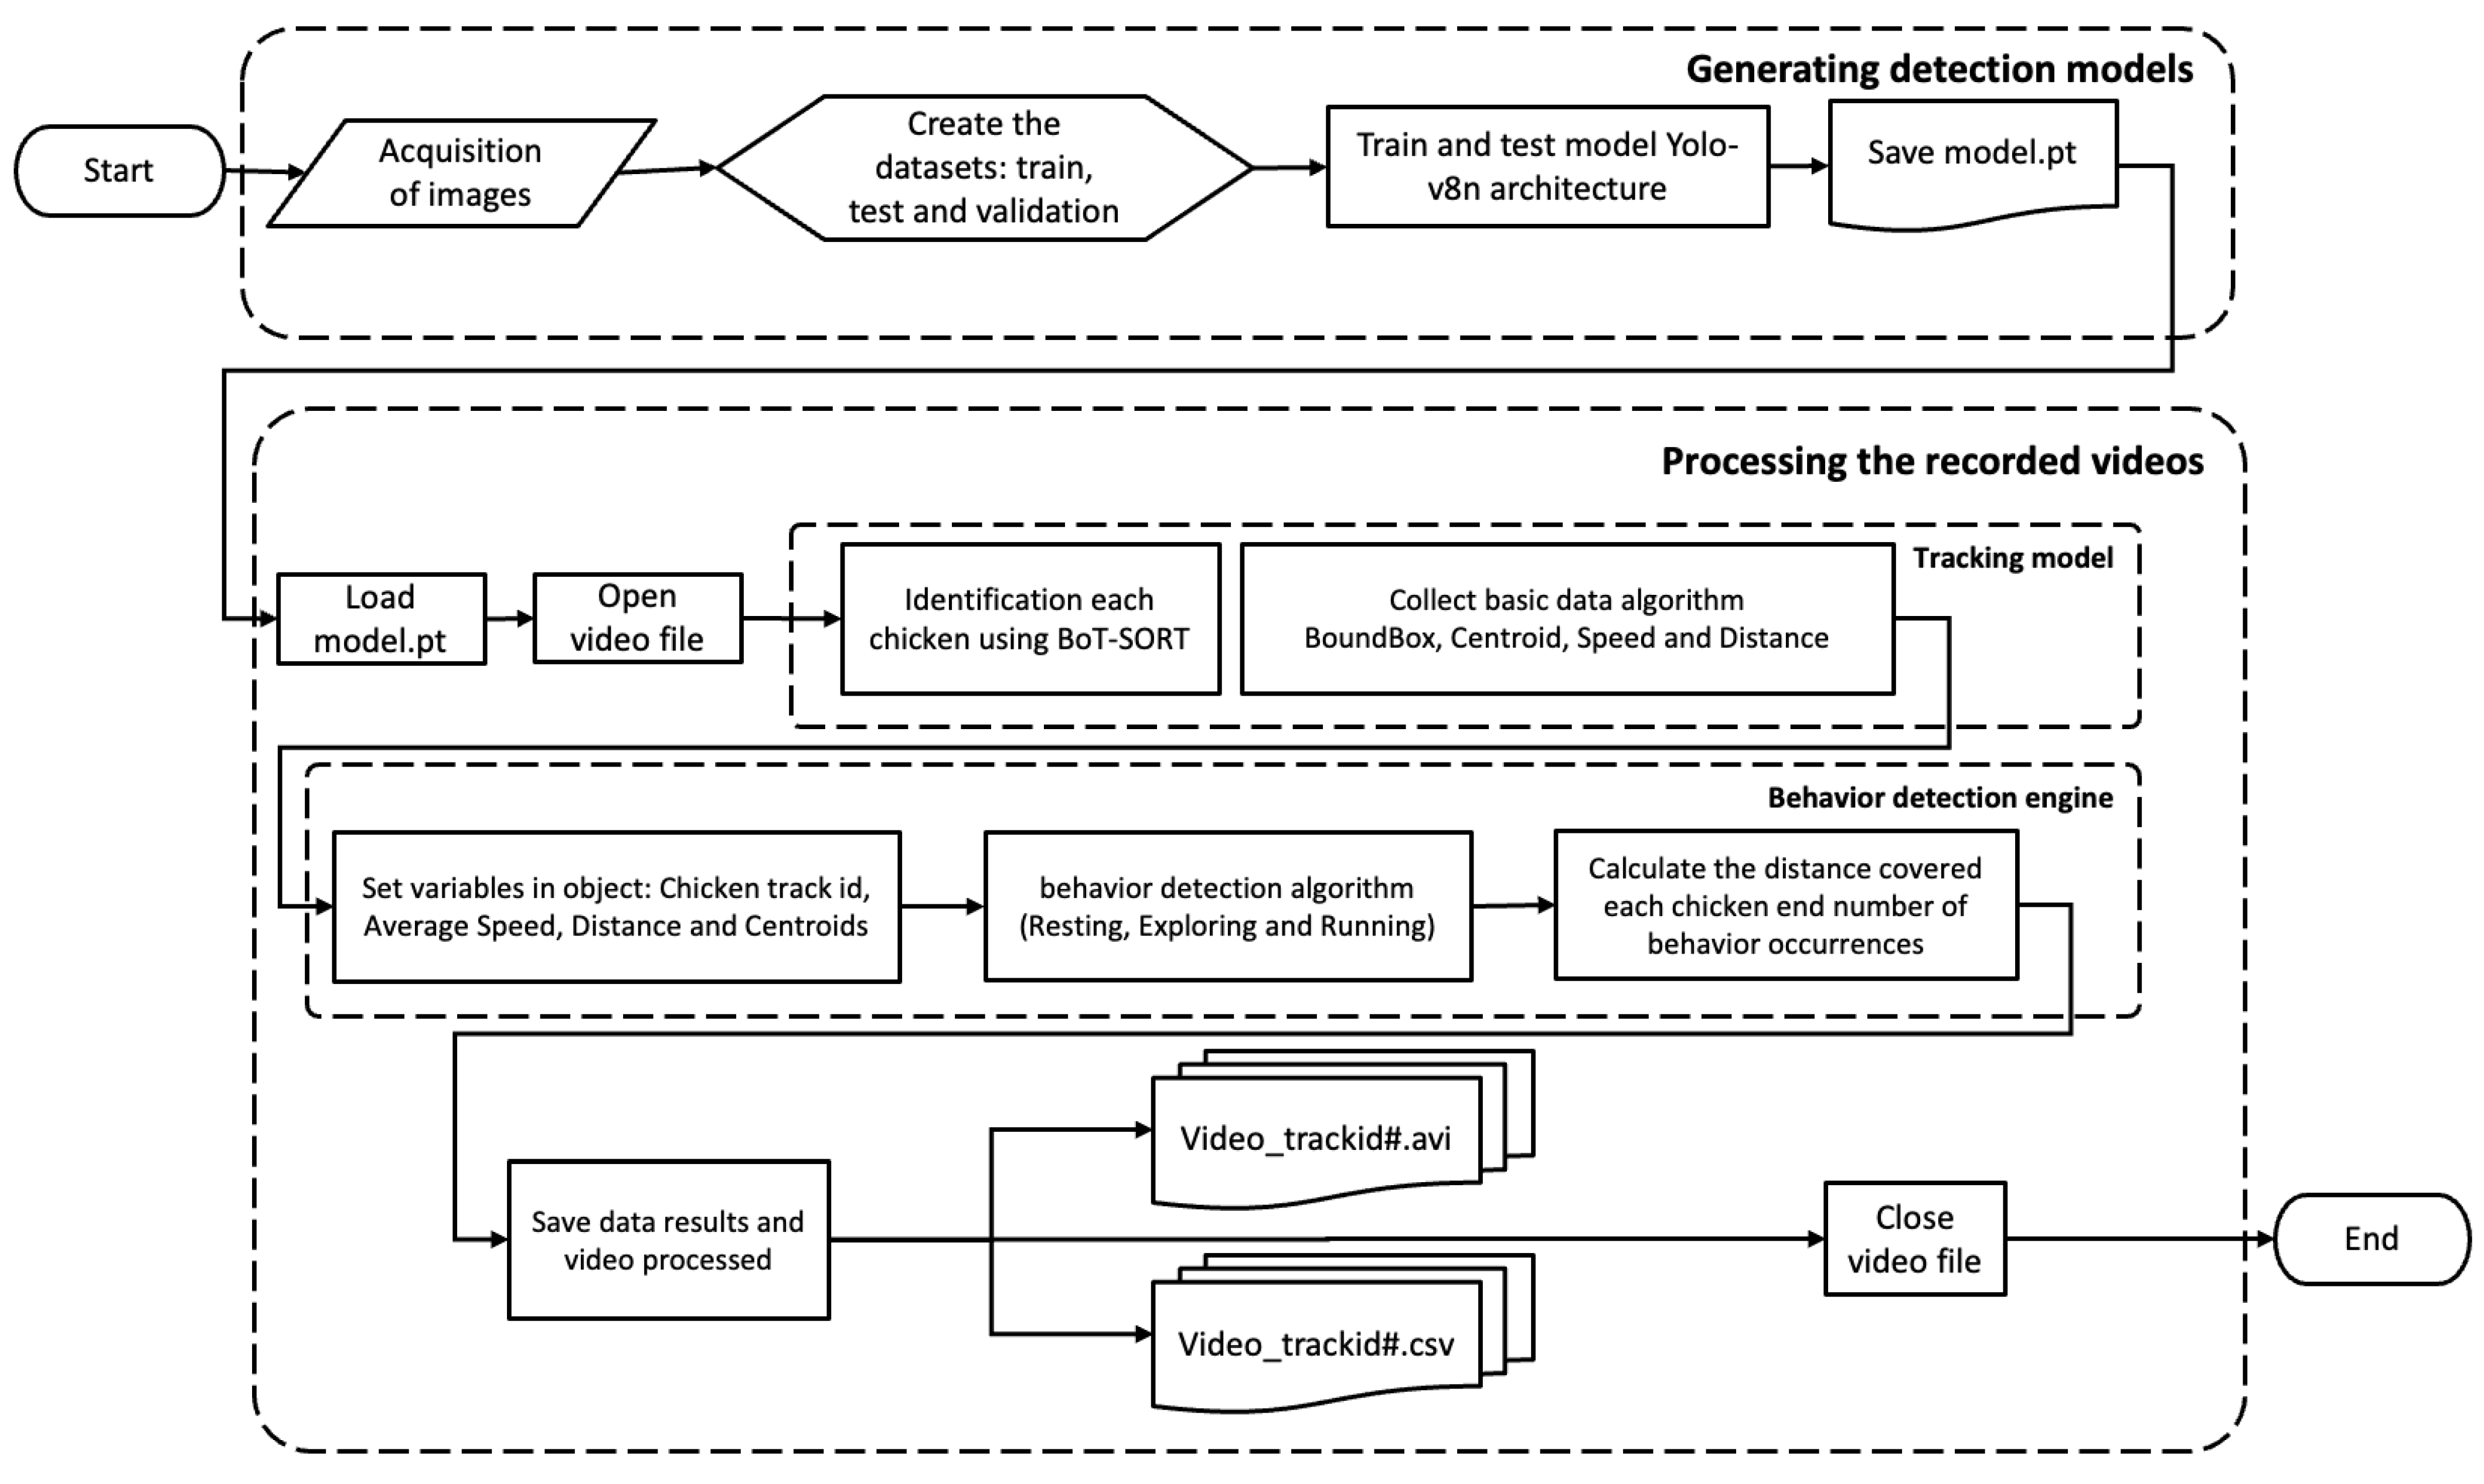
The tracking model was elaborated through a map of stages for the execution of the system, described in
Figure 2.
For the chicken tracking task, the default Kalman filter is based on a linear observation model and constant velocity movement, governed by the following linear stochastic difference equations, available at Aharon et al. [
25].
where
is the transition matrix for the discrete-time of
for
;
is the matrix with observed values;
e
are random variables that represent the process and measurement noise, respectively.
The process noise covariance matrix
and the measurement noise covariance matrix
can change at each step in time. The Kalman filter consists of predicting the current time and updating over time according to the equations given below.
For each time step , the Kalman filter estimates the state and the covariance matrix , and later updates the later estimated state given the observation and the covariance matrix , calculated based on the Kalman gain .
For the BoT-SORT model, the Kalman Filter state vector is described in Equation (12) and the measurement vector in Equation (13), which is implied in the corrections of the process noise covariance matrices (
) and measurement noise covariance (
) shown in Equations (14) and (15), respectively [
16].
where
and
are the coordinates of the chicken’s bounding box; w and h are the width and height of the bounding box
and
is the current and previous state;
,
and
are the standard deviations of the noise factors.
2.5. Measurement of Distance and Velocity of Travel
The distance covered was calculated from the coordinates of the centroids of each bird between two frames using the Euclidean method.
where
is the distance between two points, the first being captured in the frame
and the second in the frame
,
and
are the coordinates of the point in the frame
and
and
are the coordinates of the point in the frame
.
Therefore, for every two frames, we calculate the distance traveled by a chicken centroid and accumulate these values during the complete shooting. However, these values are expressed in pixels and cannot be compared with other distances from other videos due to differences in camera placement and image resolution. To make the measurements comparable, we convert pixels into centimeters using a ratio rule from a known measurement of the scene.
Birds were identified as they appeared on the scene. When the bird left the scene, the path data for that identification was closed so that the same bird, when it returned to the scene, received a new identification. Thus, the distances covered were recorded for each identification.
where are
is the distance traveled by a chicken with the identification
by the number of sequential frames that this identification was maintained.
The speed was calculated from the distances covered by the
, according to the equation below.
where
is the speed of the bird identified by
,
is the distance traveled by the bird
and
is the time between frames (in our work
s).
2.6. Distinction of Running, Exploring, and Resting Behaviors
In the process of detecting chickens in the images, different values of displacements in time were established to differentiate three movement states: resting, exploring, and running. Initially, a noise filter was applied to eliminate erroneous identifications, along with the definition of limits that demarcate the transitions from one behavior to another.
To classify the behaviors, a minimum frame count was defined to indicate the beginning of a new behavior in chickens. Specifically, “Resting” requires a minimum of 5 frames, “Exploring” requires four frames, and “Running” requires three frames. Furthermore, to qualify for detection of one of these behaviors, a bird must maintain a minimum “lifetime” of 18 frames. This implies that the identified bird, designated by its unique track_Id, must be present in the video for at least 18 consecutive frames.
Using these data, the velocity parameter was employed to distinguish the behaviors. This involved calculating the average instantaneous velocity over the last ten frames. For the “Resting” behavior, a speed of 1 cm/frame or less was used as a limit, considering that the resting chicken can move only the head or other body parts, leading to changes in the position of the centroid, even if it remains still or without displacement.
For the “Exploring” behavior, velocities were defined that vary between more than 1 cm/s and less than 100 cm/s, determined in the analysis of the results. “Running” behavior was classified when the velocity was greater than 100 cm/s. To increase accuracy and reduce false positives when identifying “Running” behavior, an additional criterion has been implemented. This criterion measured the distance between the initial and final positions within a vector containing centroids of the last ten associated frames when the reference velocity was exceeded, and we only considered when the distance measured between the extremes was greater than 20 cm. In our tests, this condition differentiated the “Running” behavior from other behaviors with fast movements and without significant movement of the hen.
3. Results
3.1. Yolo Tracking Model
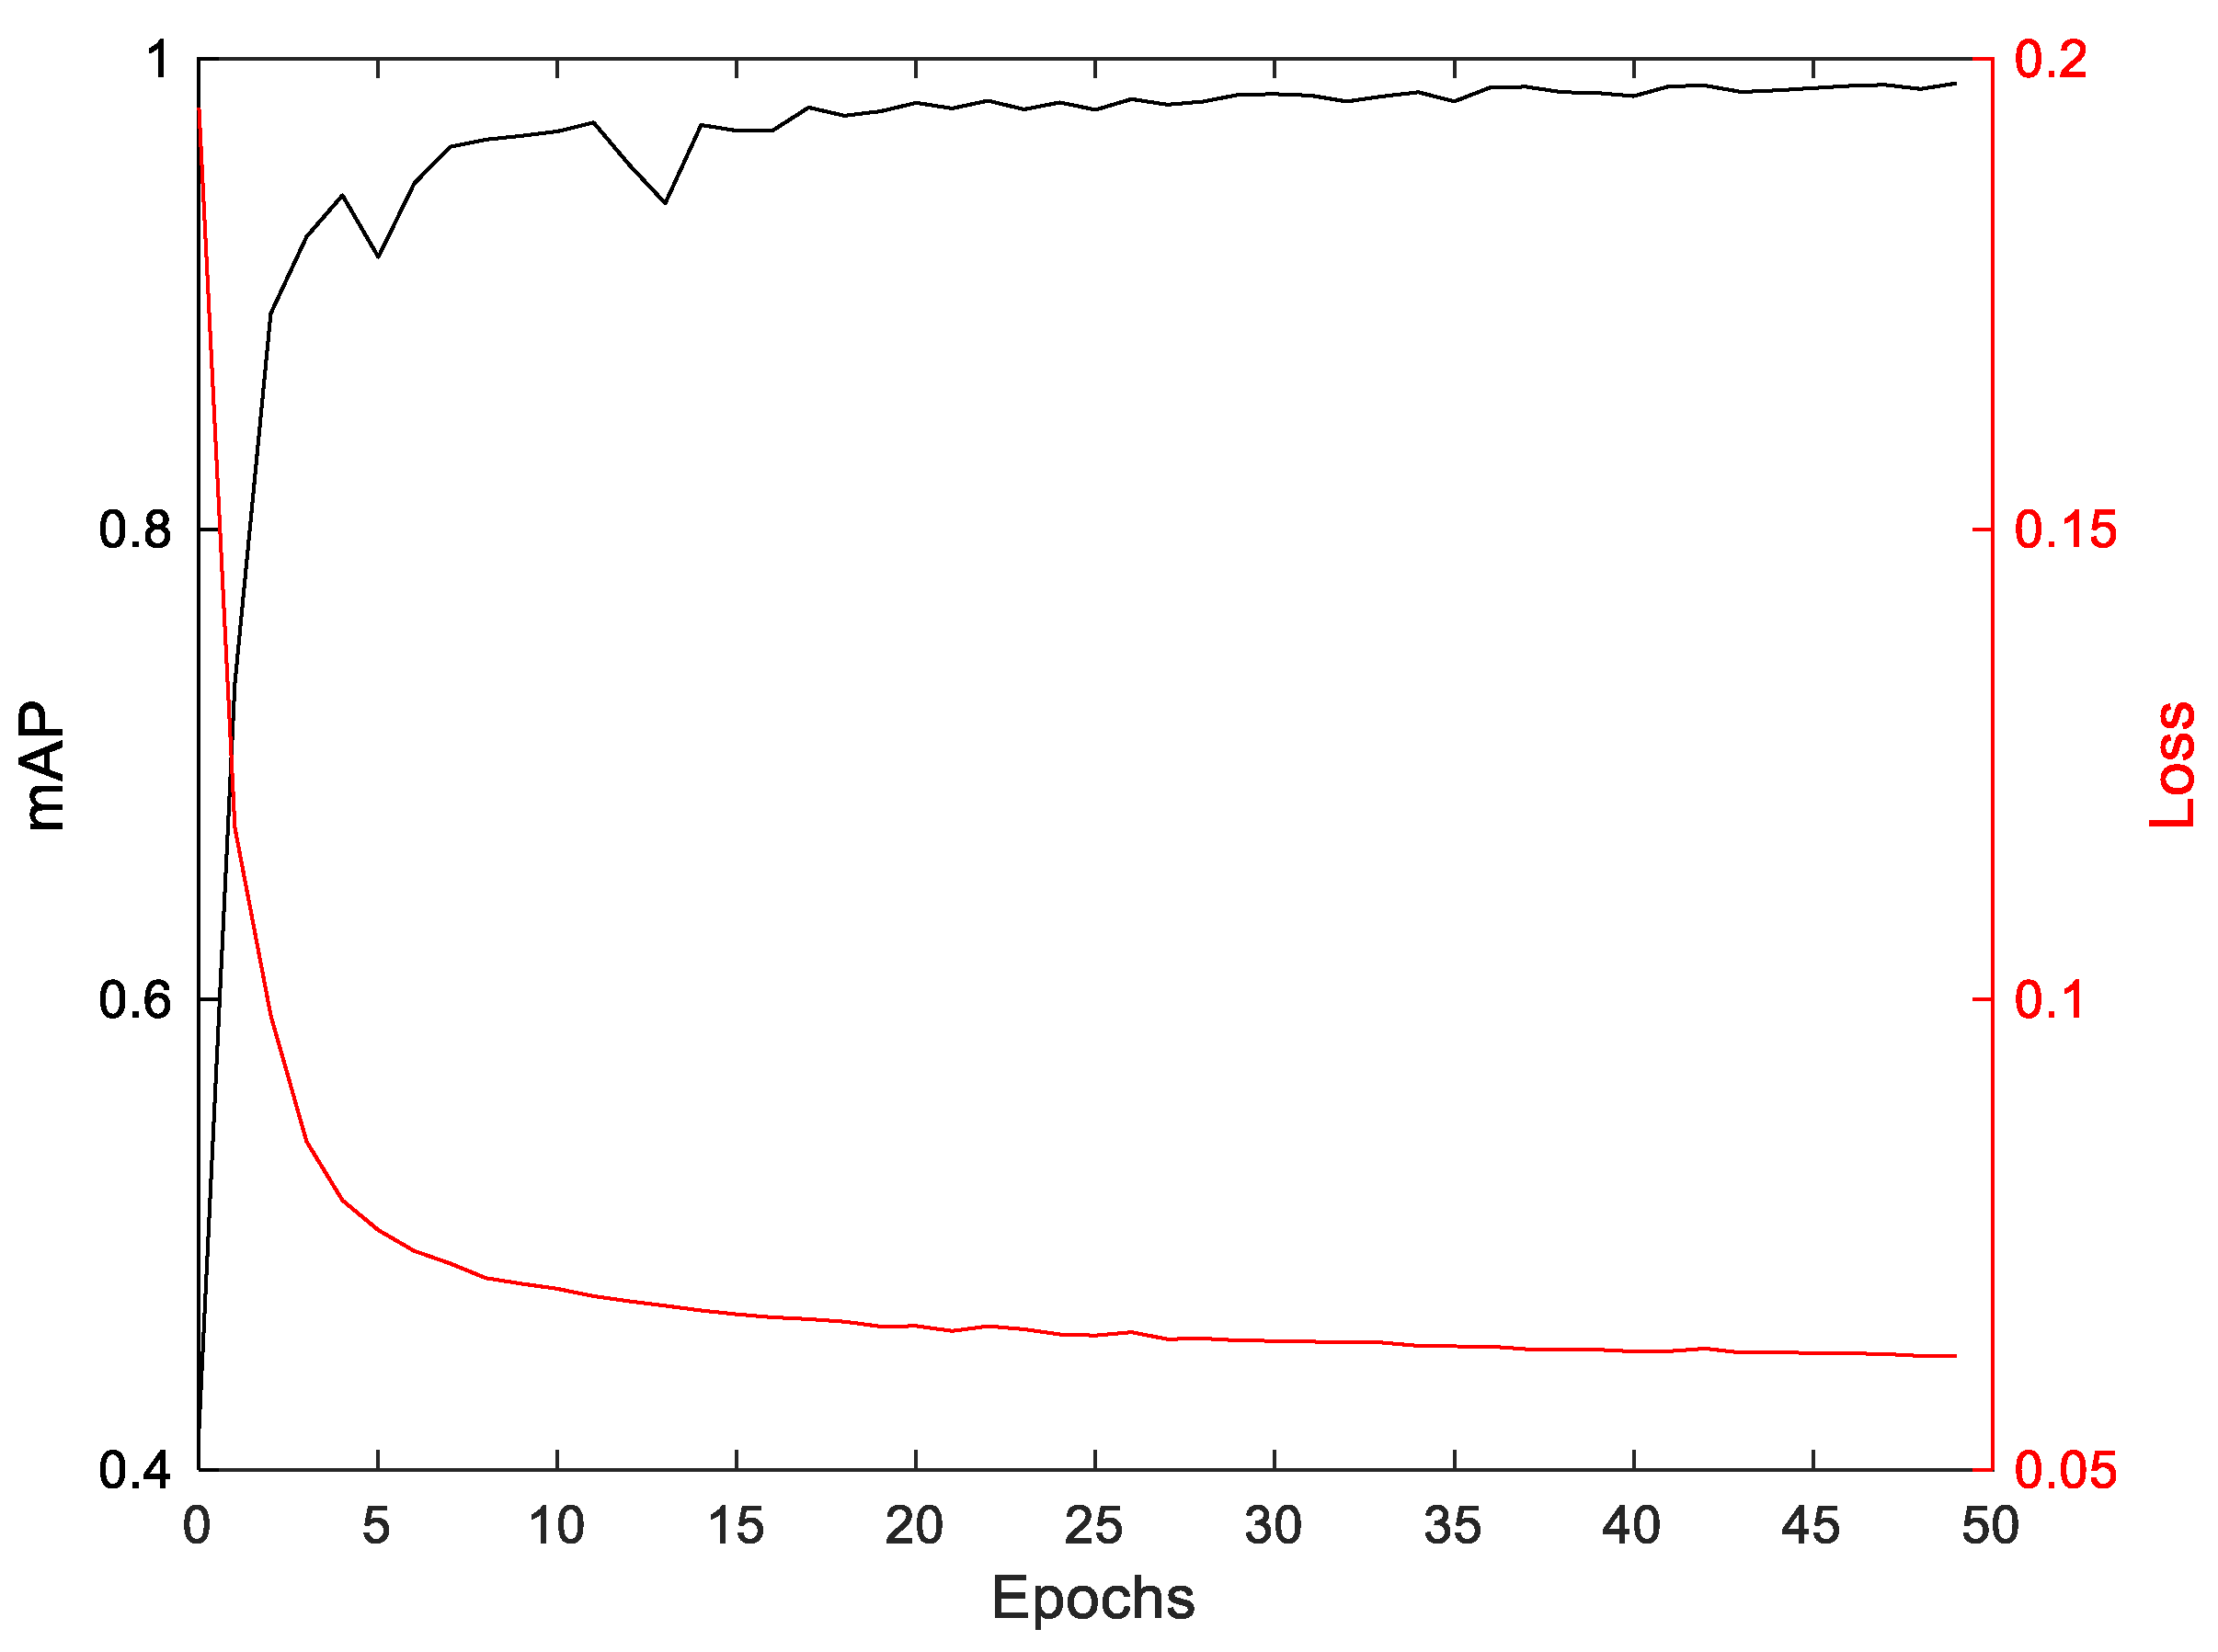
Figure 3 shows the mAP (mean average precision) and Loss plots of the generated Yolo v8n model. The model achieved 98.5% accuracy. These plots depict the evolution of mAP and loss throughout training, offering a detailed view of the model’s performance in chicken identification. The model demonstrated robustness, as the mAP curve remained stable above 98% despite a decrease in the loss curve starting from epoch 15. This suggests the model continues to identify chickens with high precision after an initial training phase.
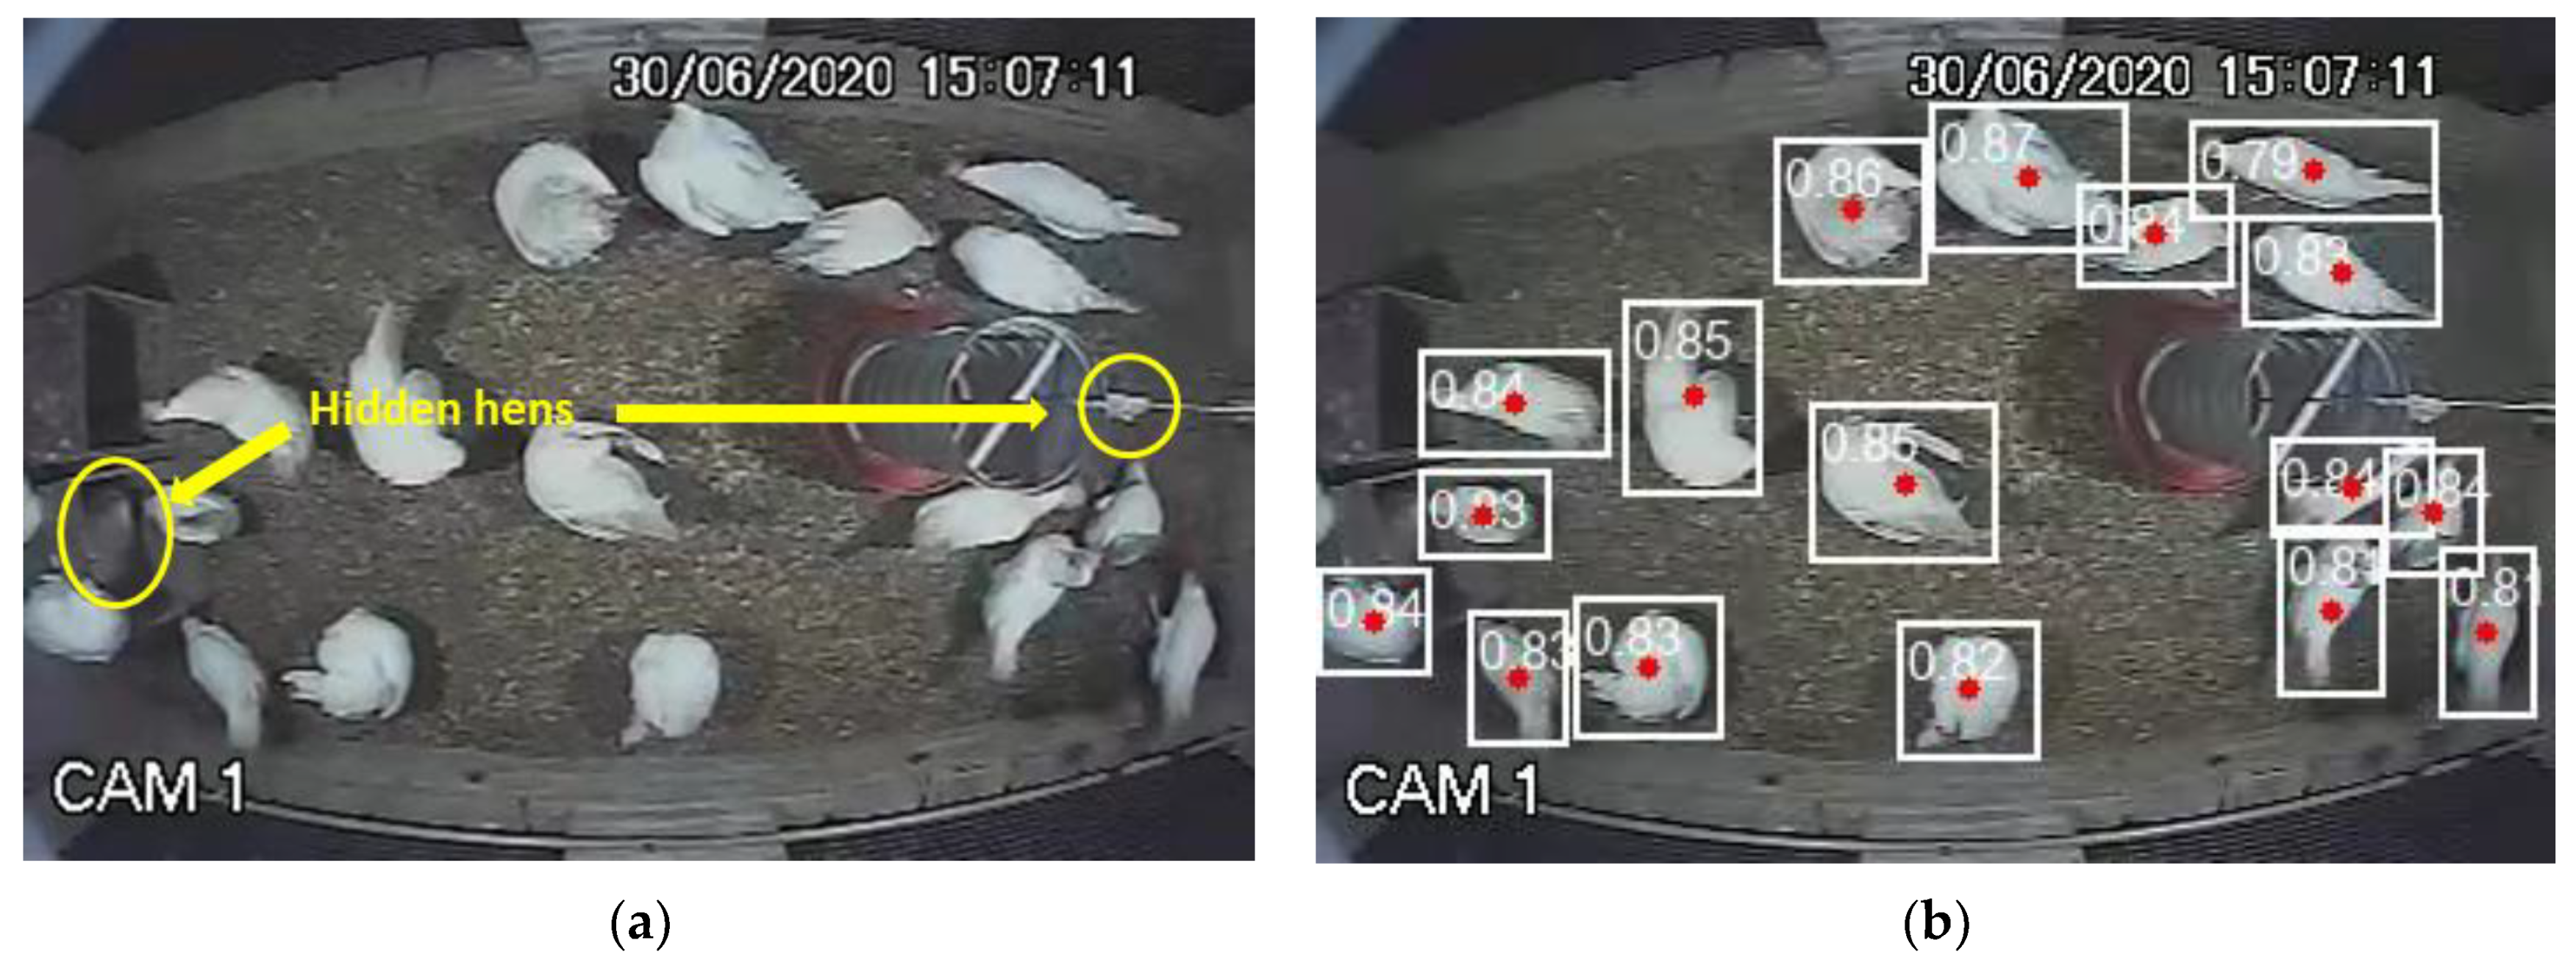
As illustrated in the images presented in
Figure 4, our system was capable of detecting chickens within the nest, albeit with less certainty. Moreover, certain areas, such as those behind the feeder, remained concealed. Additionally, the impact of camera lens distortion on image quality at the periphery also merits consideration.
The quality of detection of chickens is fundamental for successful tracking. Chickens that can be confused with background, or vice versa, generate centroid coordinates that have the potential to interfere with the identification of birds by the Kaman filter. This is a crucial point in the development of the tracking system.
3.2. Appearing and Hiding of Chickens
We had problems hiding the chickens in the scene during our tracking tests. In
Figure 4, we highlight two common places where the chicken identification is lost in the image due to obstruction of objects. In
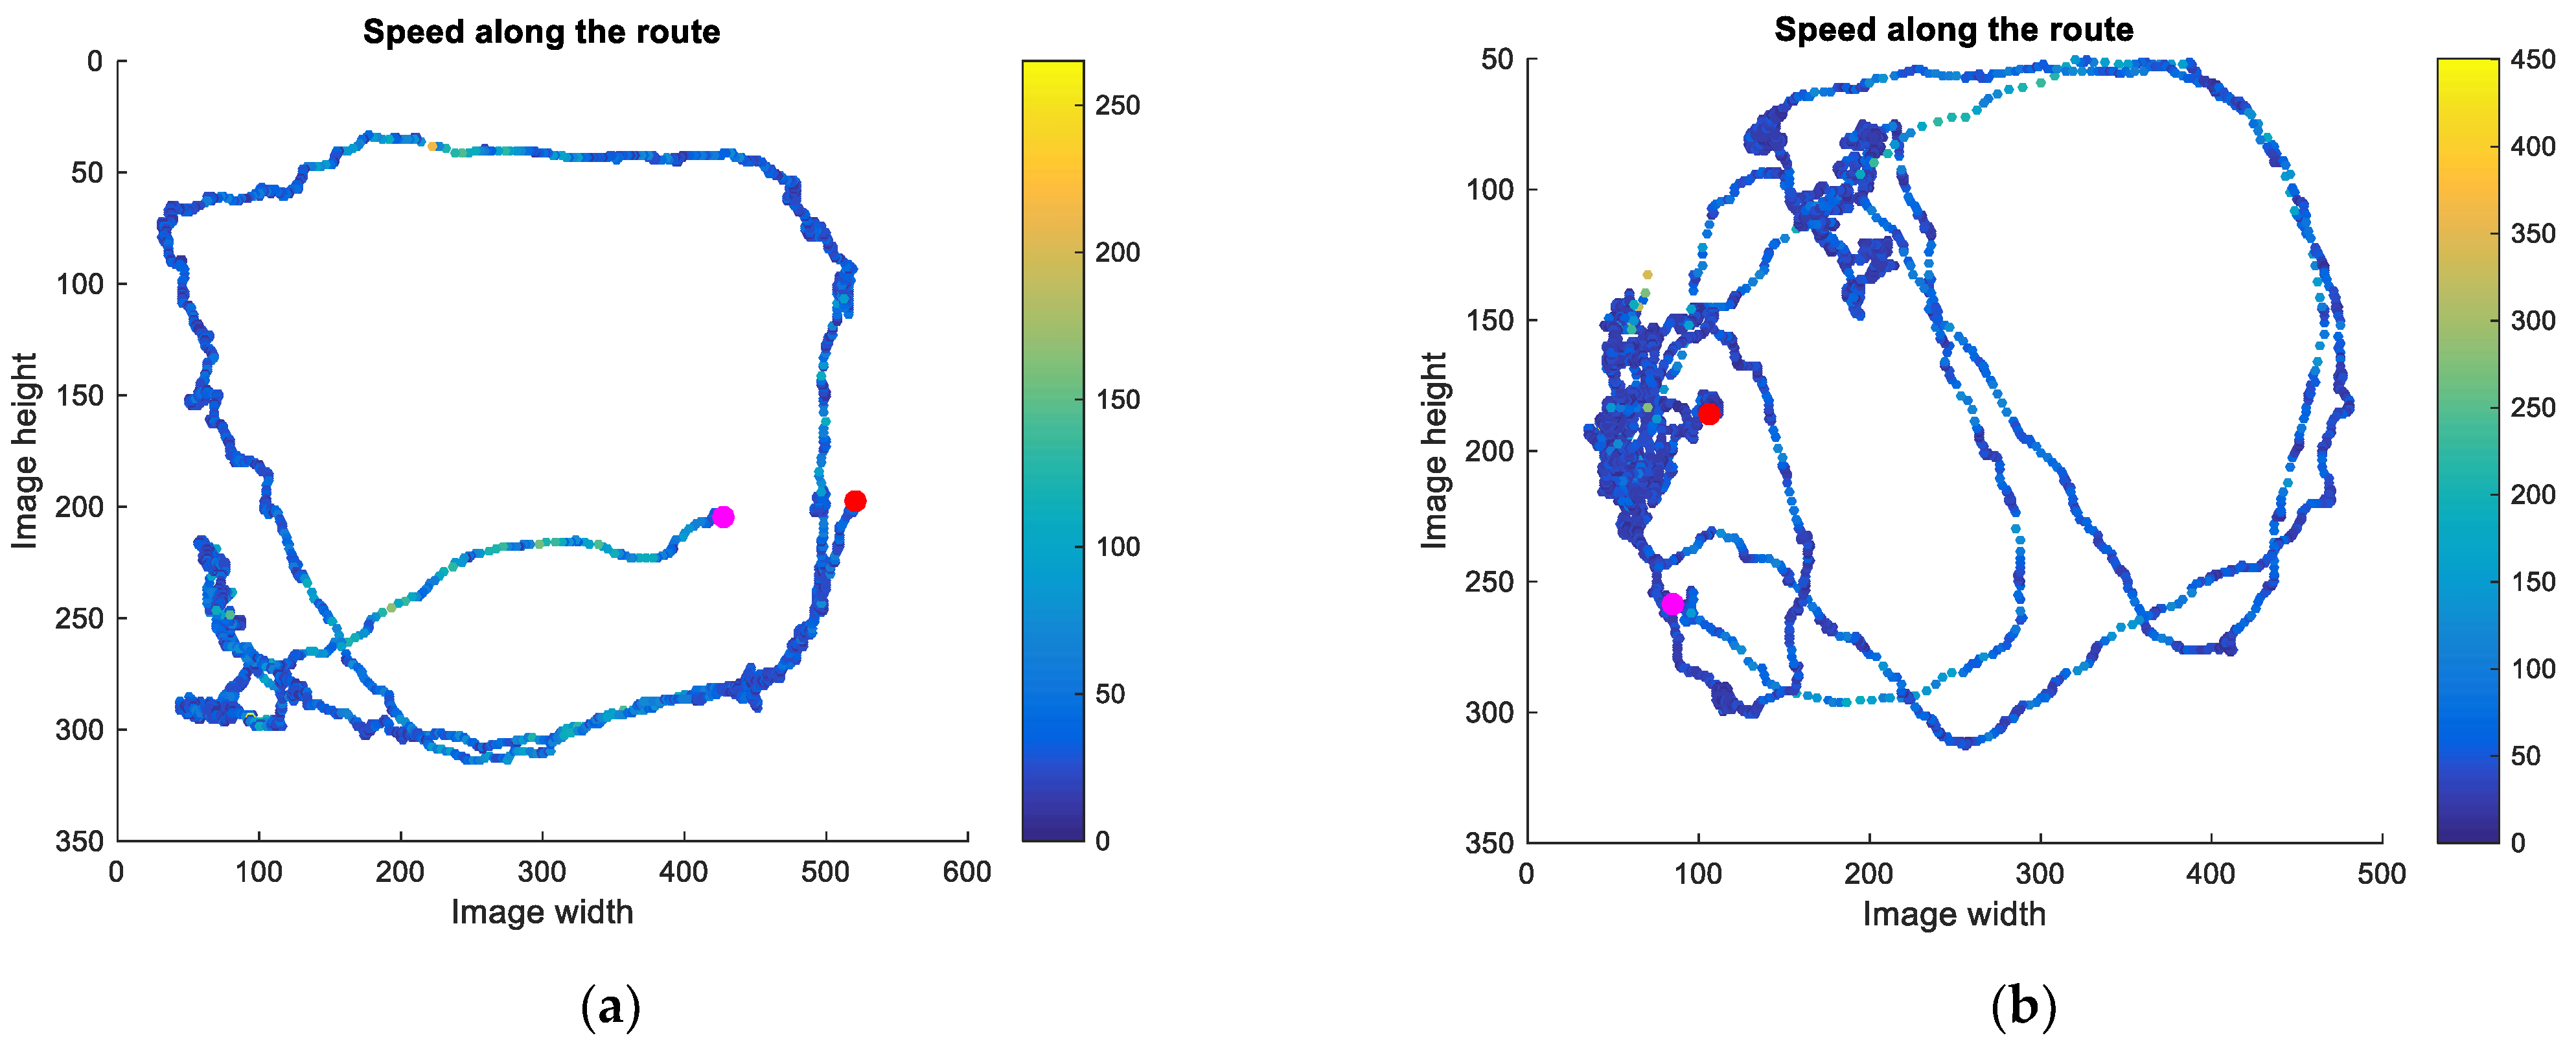
Figure 5, we show the example of the path of two chickens that appeared and disappeared in the scene near the feeder and near the nest.
Markings in magenta and red correspond respectively to the first and last coordinates of chicken detection in the video, that is, the beginning and end of the mapped path. Along the way, the more yellow the marking, the faster the chicken travels. We can observe that the places of emergence and disappearance of chickens in
Figure 5 are close to the nest or feeder. This was due to the already mentioned fact that we lost the identification of the bird when it left the scene, entered the nest, or passed behind the feeder. This condition is expected in the case of monitoring chickens in commercial farms, as the camera capture area will be smaller than the area of the shed, and, therefore, there will be the appearance and disappearance of chickens (same individuals or not) along the edges of the image. Thus, we decided to work with this feature, allowing our methodology to be applied in commercial breeding conditions in the future.
3.3. Direction of Displacement and Minimum Displacement
In the path graphs, we observe that there are times when the bird walks faster, and in others, there is minimal movement, suggesting that the bird is standing still, expressing some natural behavior.
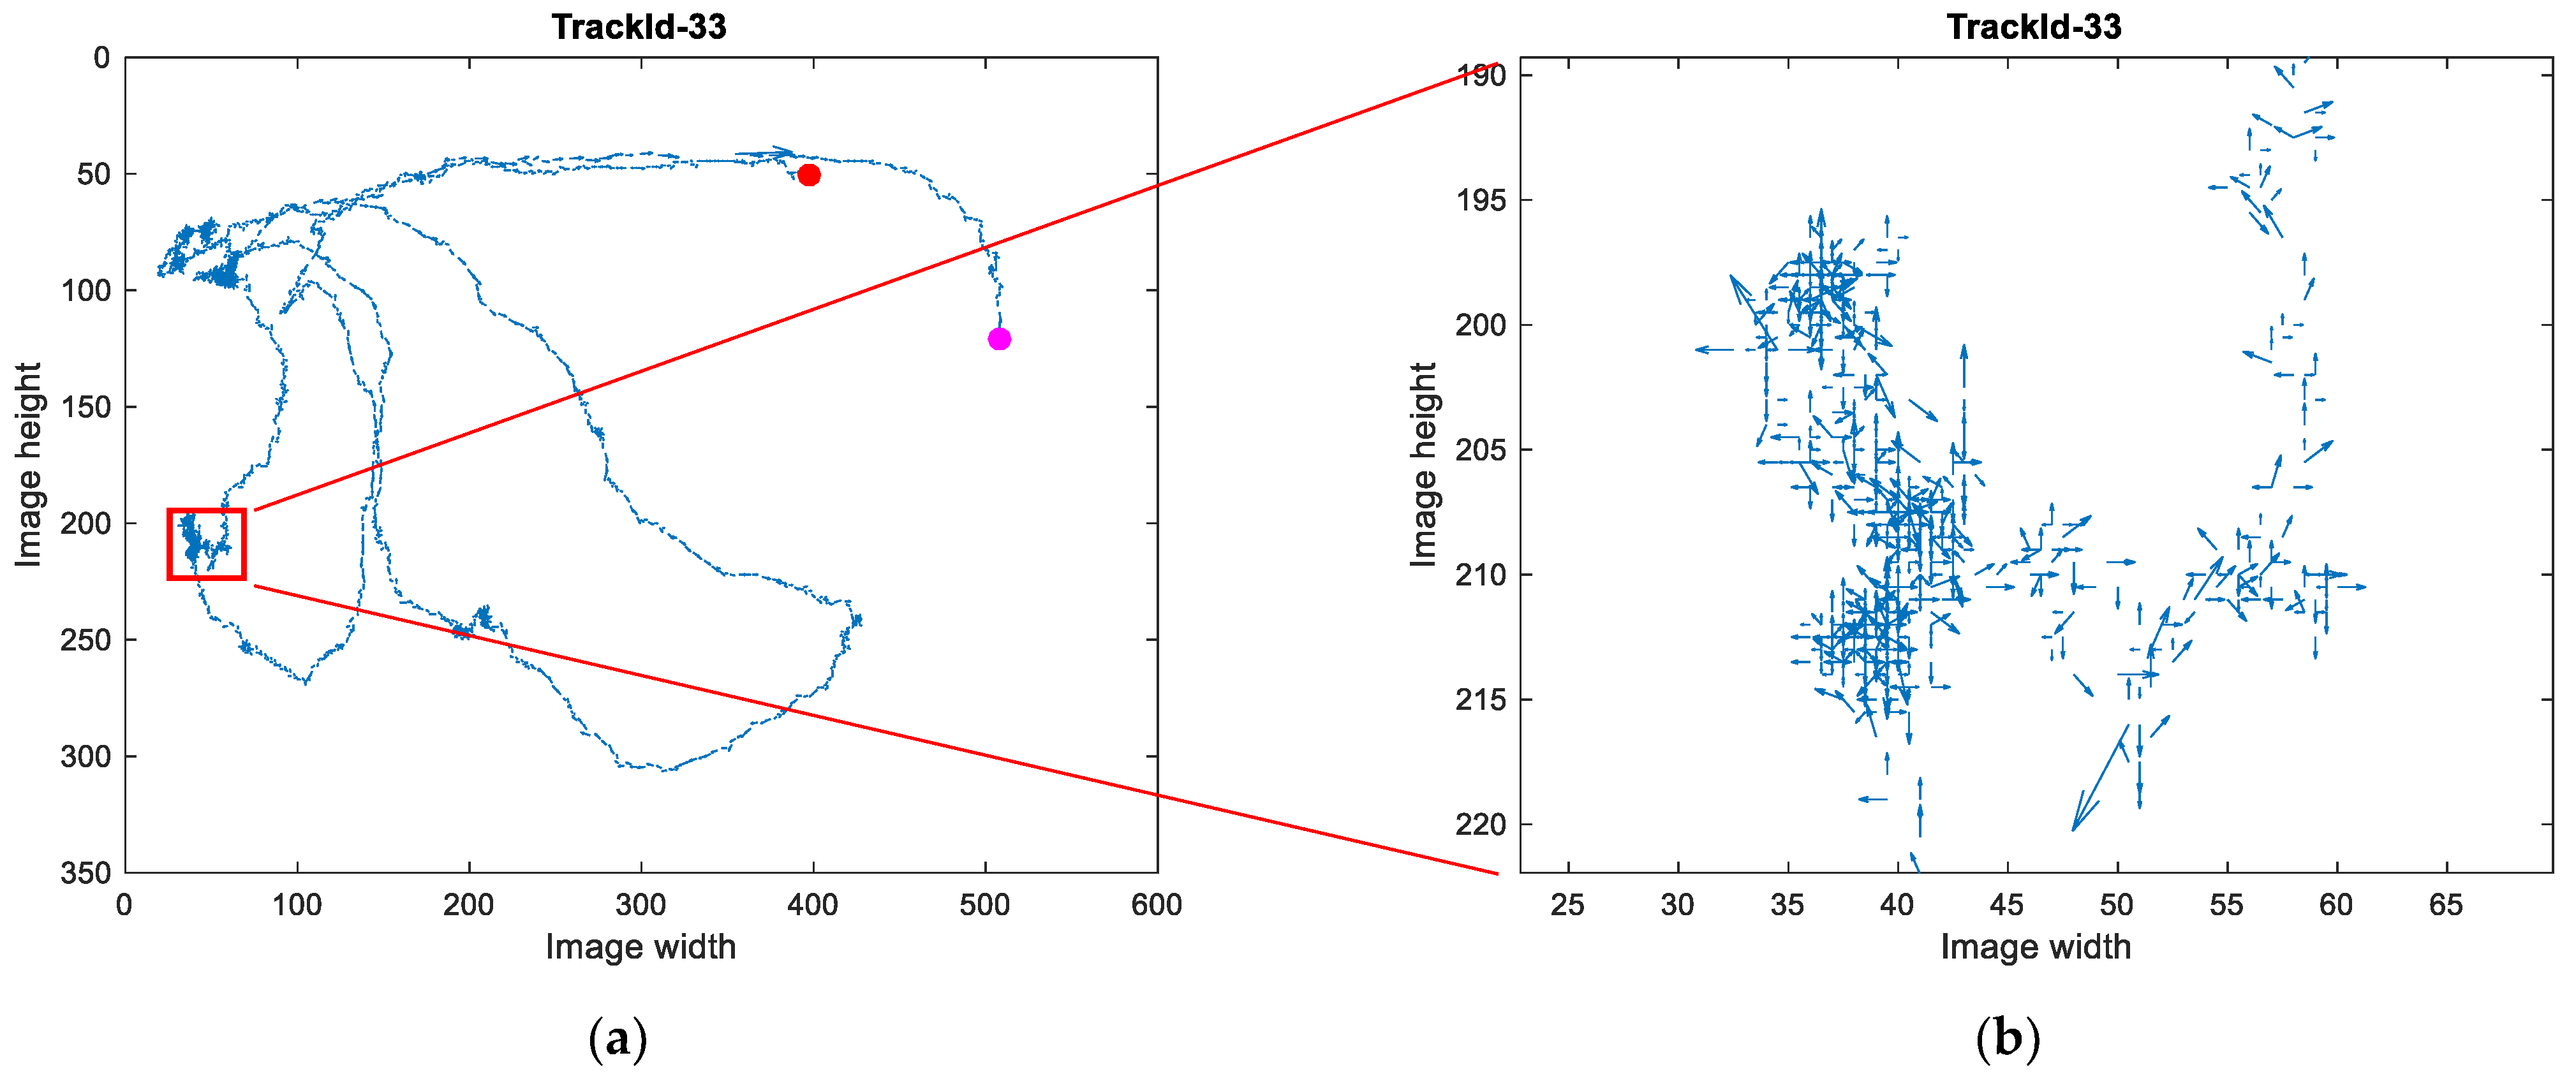
As can be seen in
Figure 6, our processing considered small lateral displacements, accumulating as distances covered by the birds. However, situations like the one illustrated can refer to a bird standing still, resting, or expressing some natural behavior. Therefore, our code considers distances greater than 1 cm/frame as displacement of the bird. The variation in the displacement direction also seems to contribute to the identification of the hen’s state of movement, so we also started to observe this information.
3.4. Measures to Determine the State of Movement
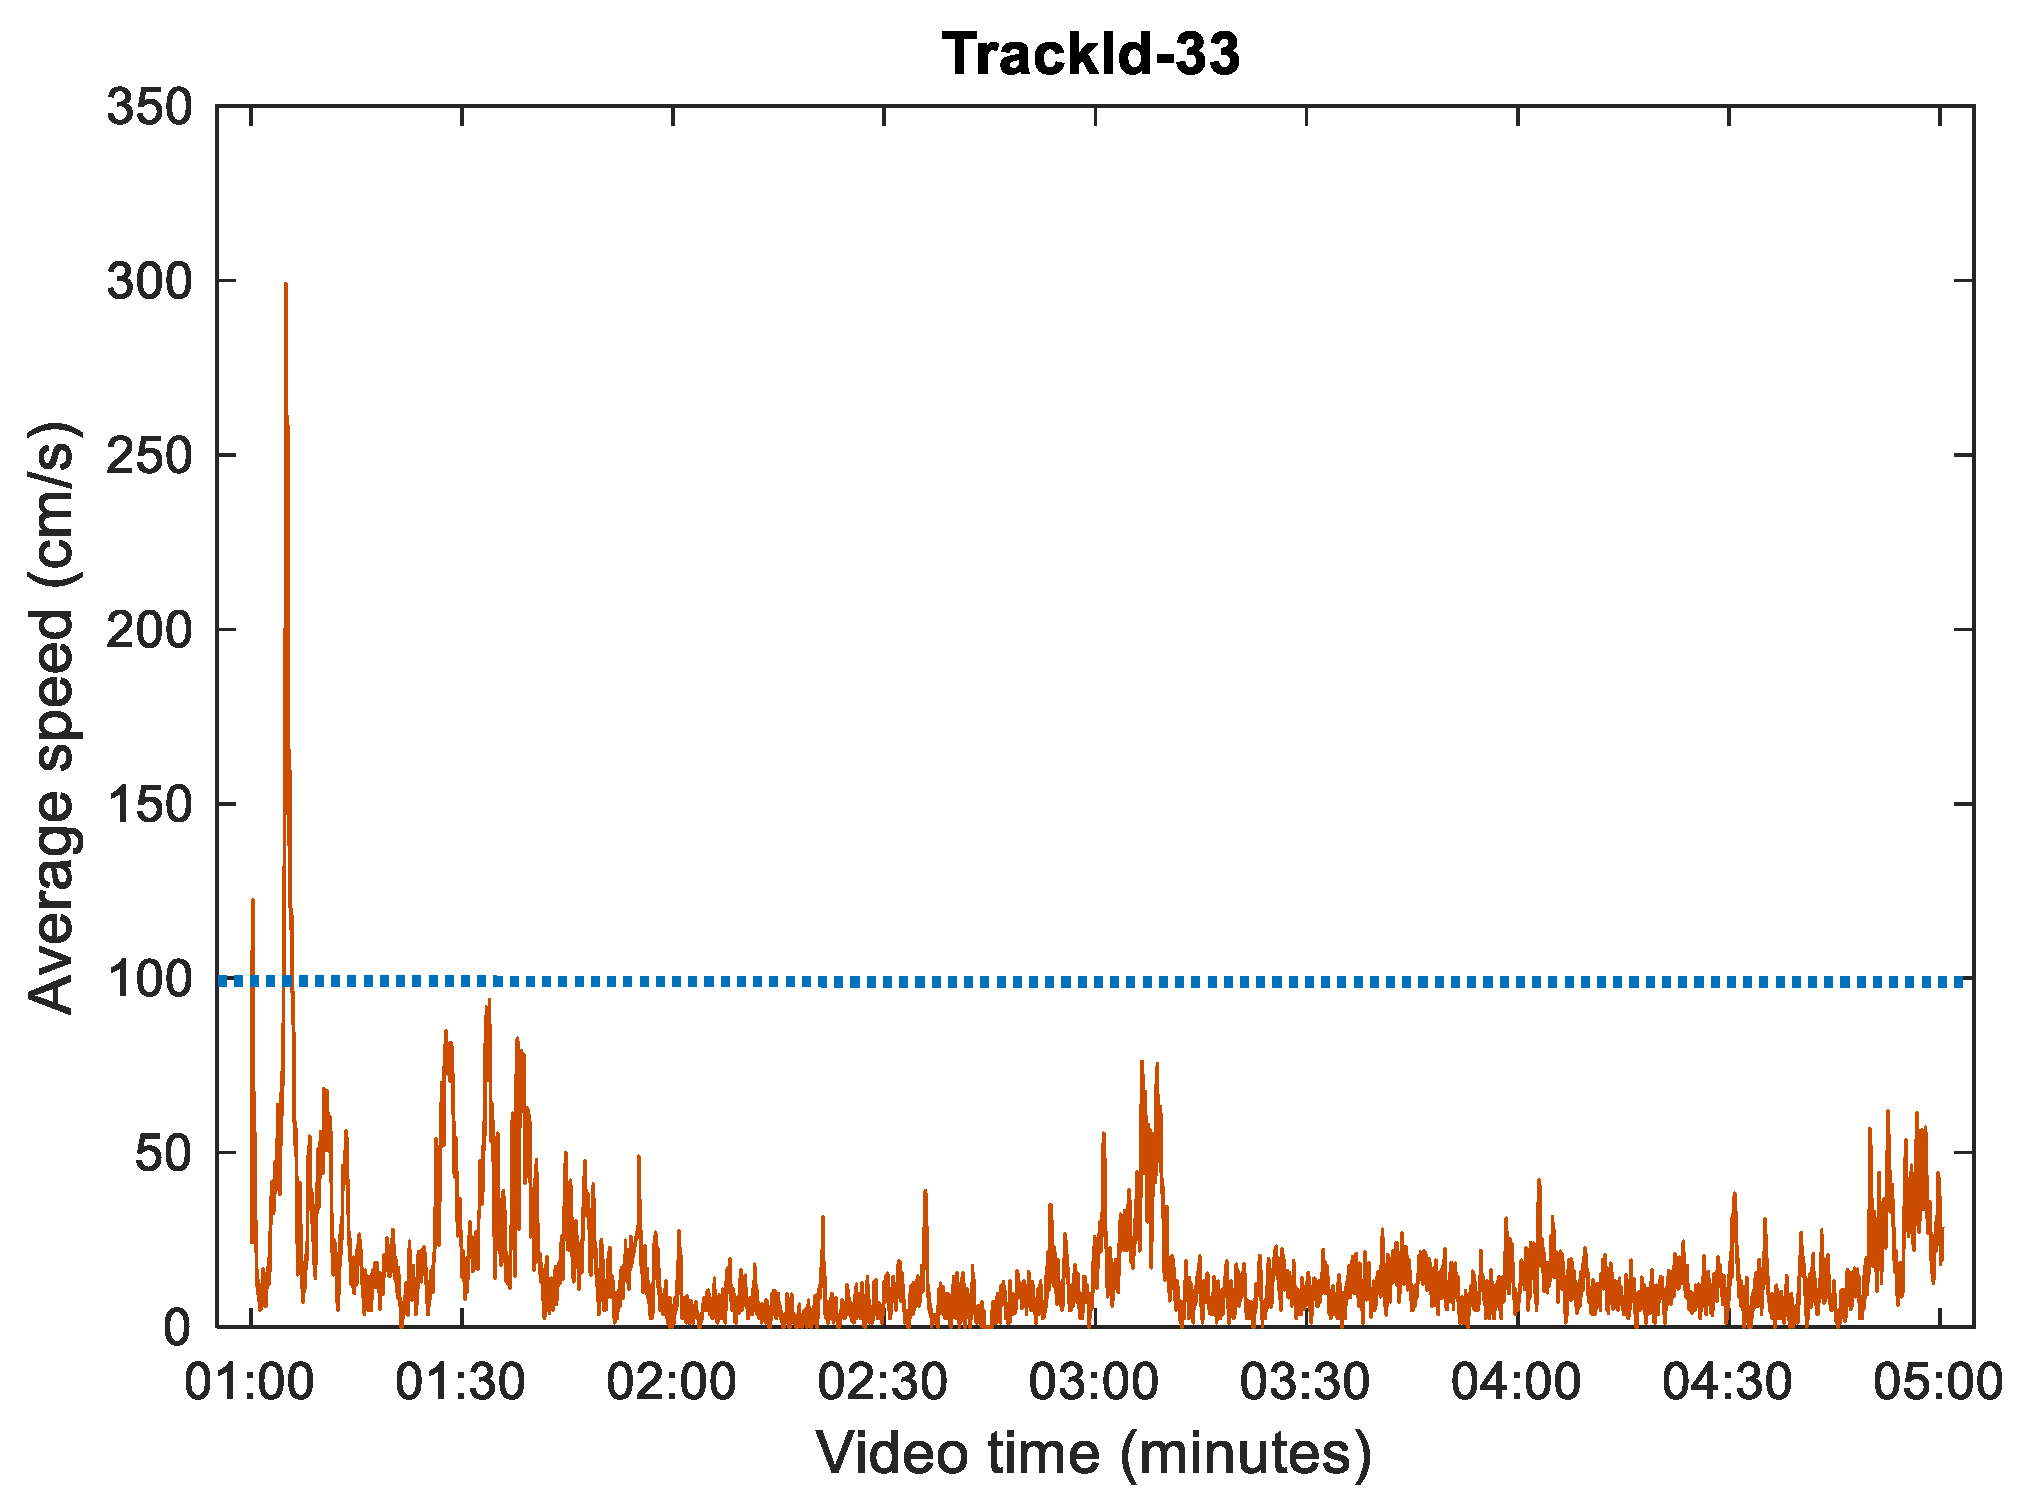
Once the correction was made, we looked for metrics indicating when a bird was standing still, walking, or running. Analyzing the velocity graph in
Figure 7, we observed that the velocity of this displacement varied at values below 100 cm/s when the bird was walking and peaked much above this value when the bird ran.
Figure 7 presents a graph depicting the variation in velocity during the time a bird was tracked by our model. This particular bird was selected for analysis as it exhibited all three behaviors during the tracking period. At the onset of tracking, a spike in speed is observed, confirmed in the original video as indicative of the running behavior. This pattern was also observed in other birds, and a velocity threshold of 100 cm/s was established for classifying running behavior in our code. Resting behavior is characterized by the bird remaining completely stationary, disregarding any minor displacements (<1 cm/frame). Consequently, any movement detected with a velocity between 0 and 100 cm/s was classified as exploring behavior. To minimize any transitional effects between behaviors, the average speed of the last ten frames (0.33 s) was considered.
3.5. Movement Analysis
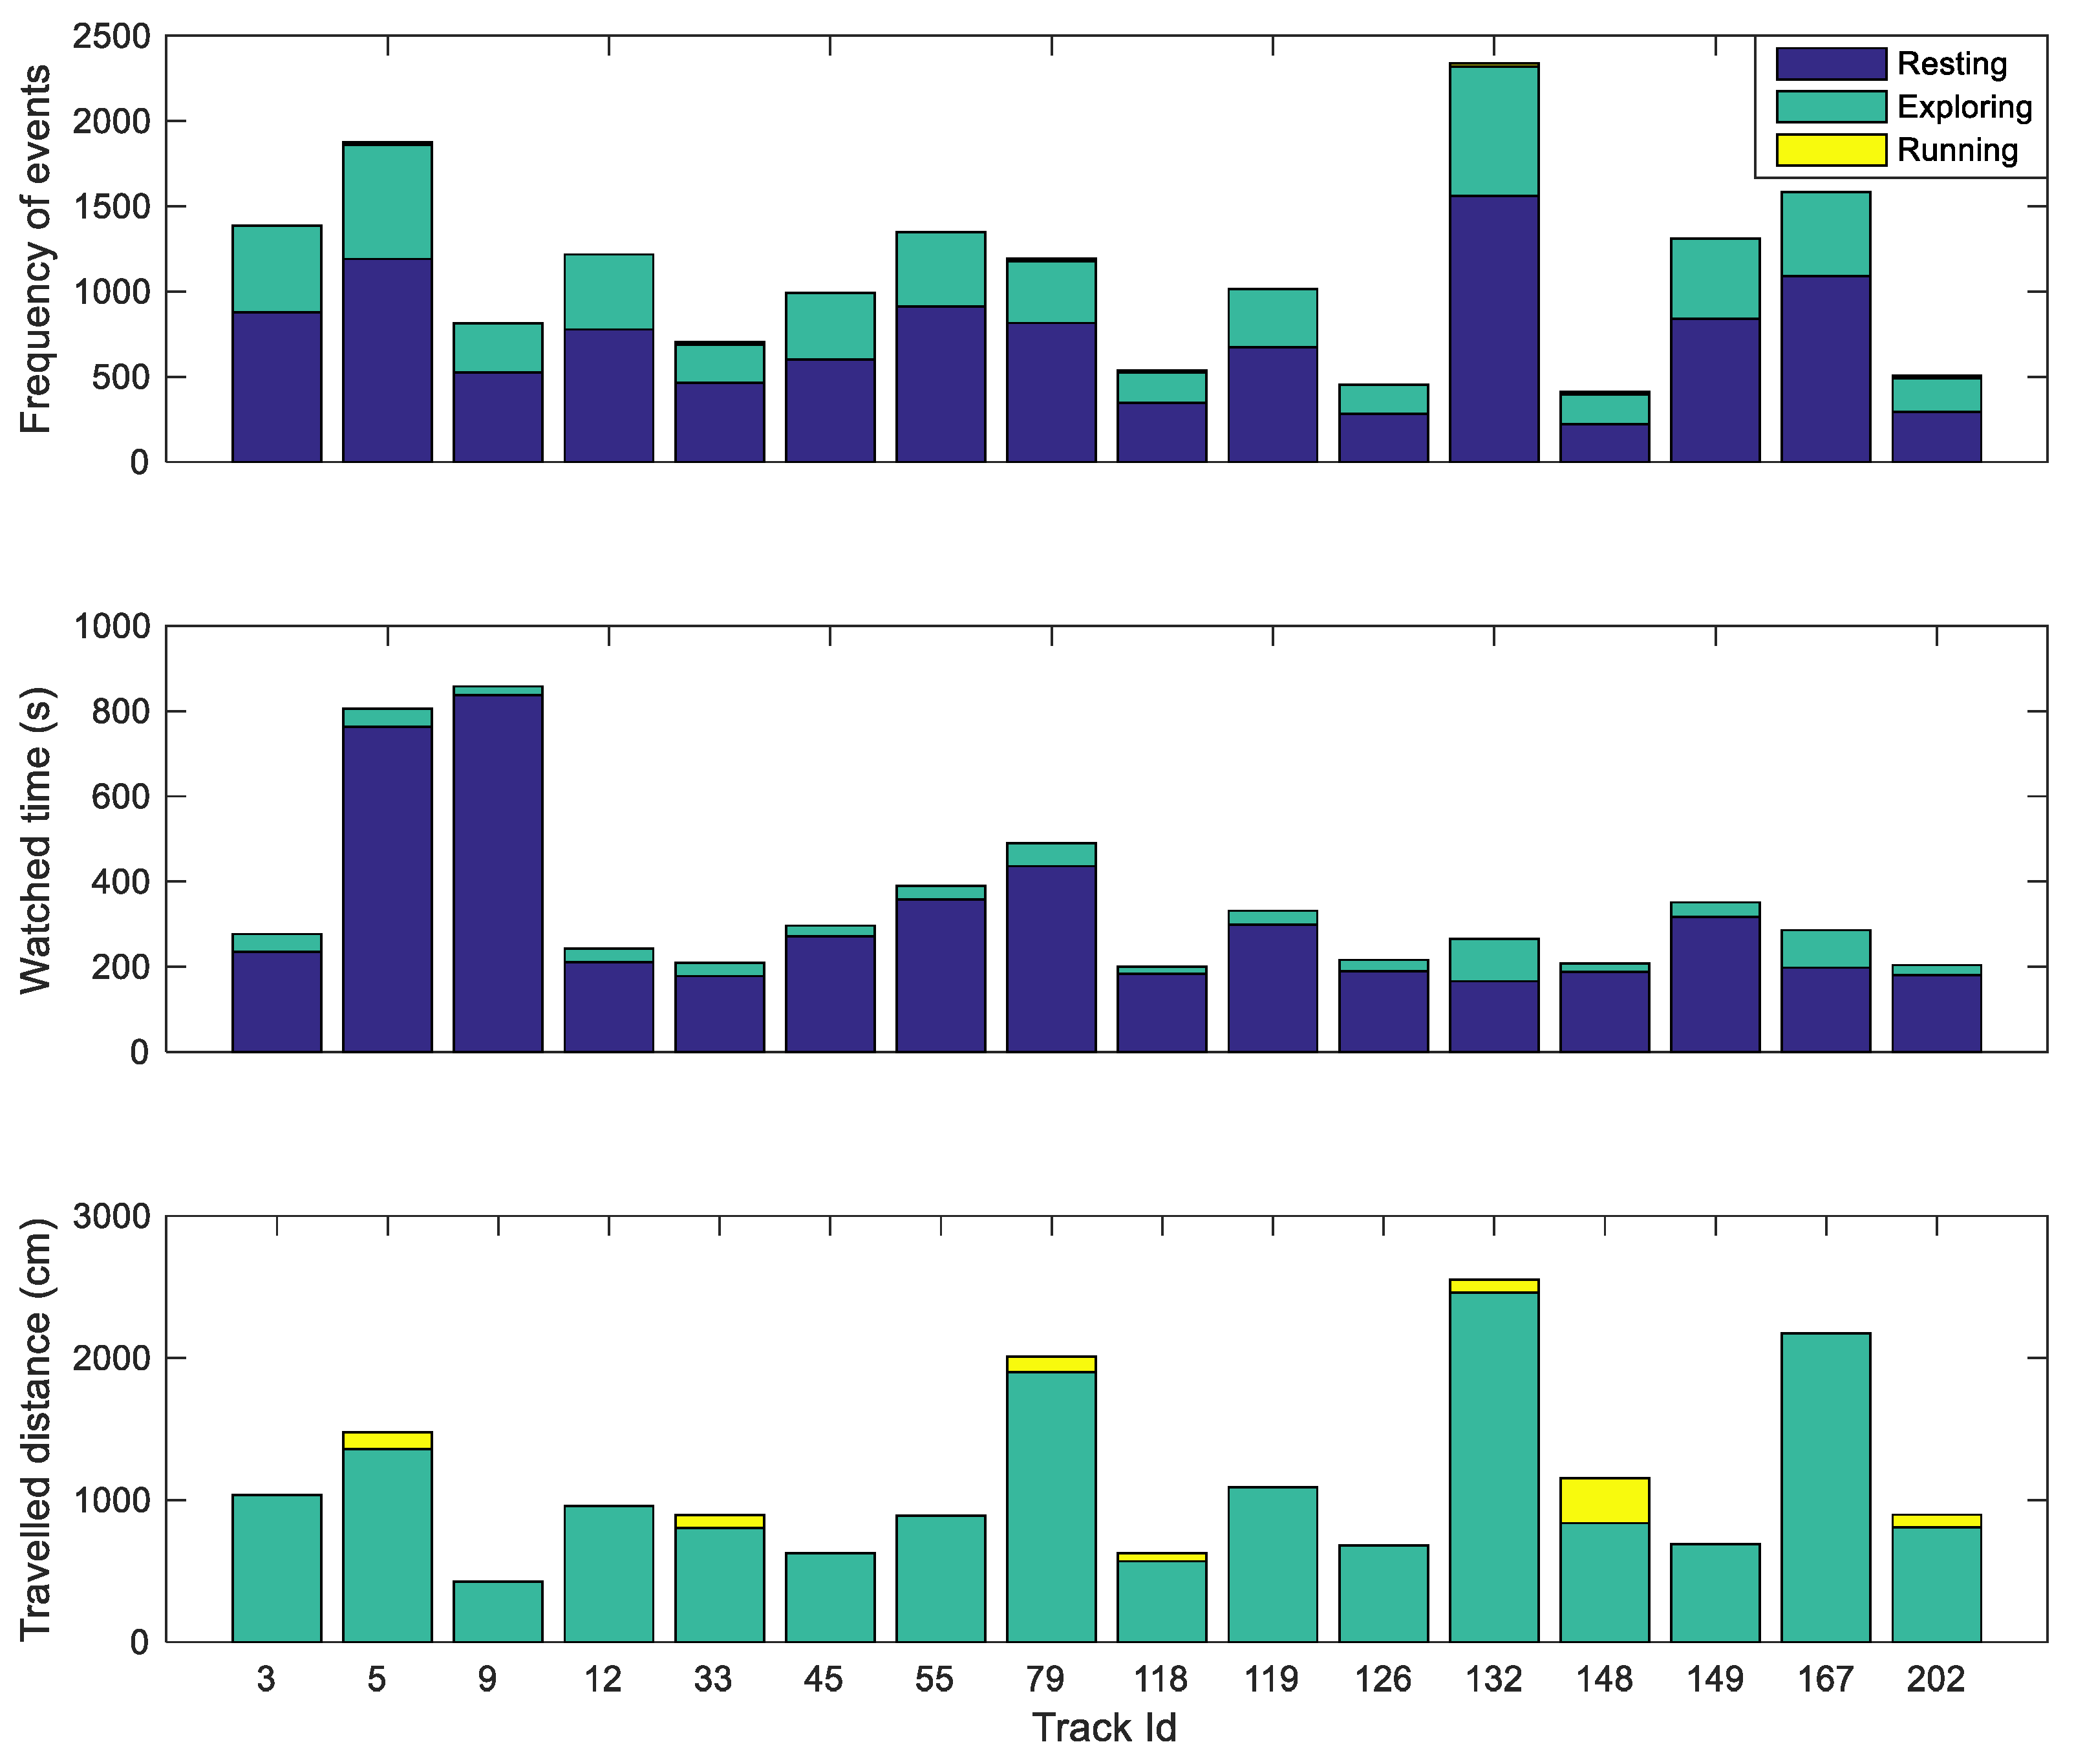
Our surveillance and tracking system can identify a “new chicken” instantly. As previously reported, there are covered regions in our footage, and we found that there are chickens that remain with the same identification for a very short time. There are also those that, during the nesting behavior, even if they maintain the identification, remain still during the entire vigil. Our objective is to develop an intelligent system capable of automatically identifying chickens in flocks whose rearing density. In this sense, we focused our attention on chickens that walked more than 300 cm and were monitored by our system for more than 200 s without losing identification, and we made the graphs shown in
Figure 8.
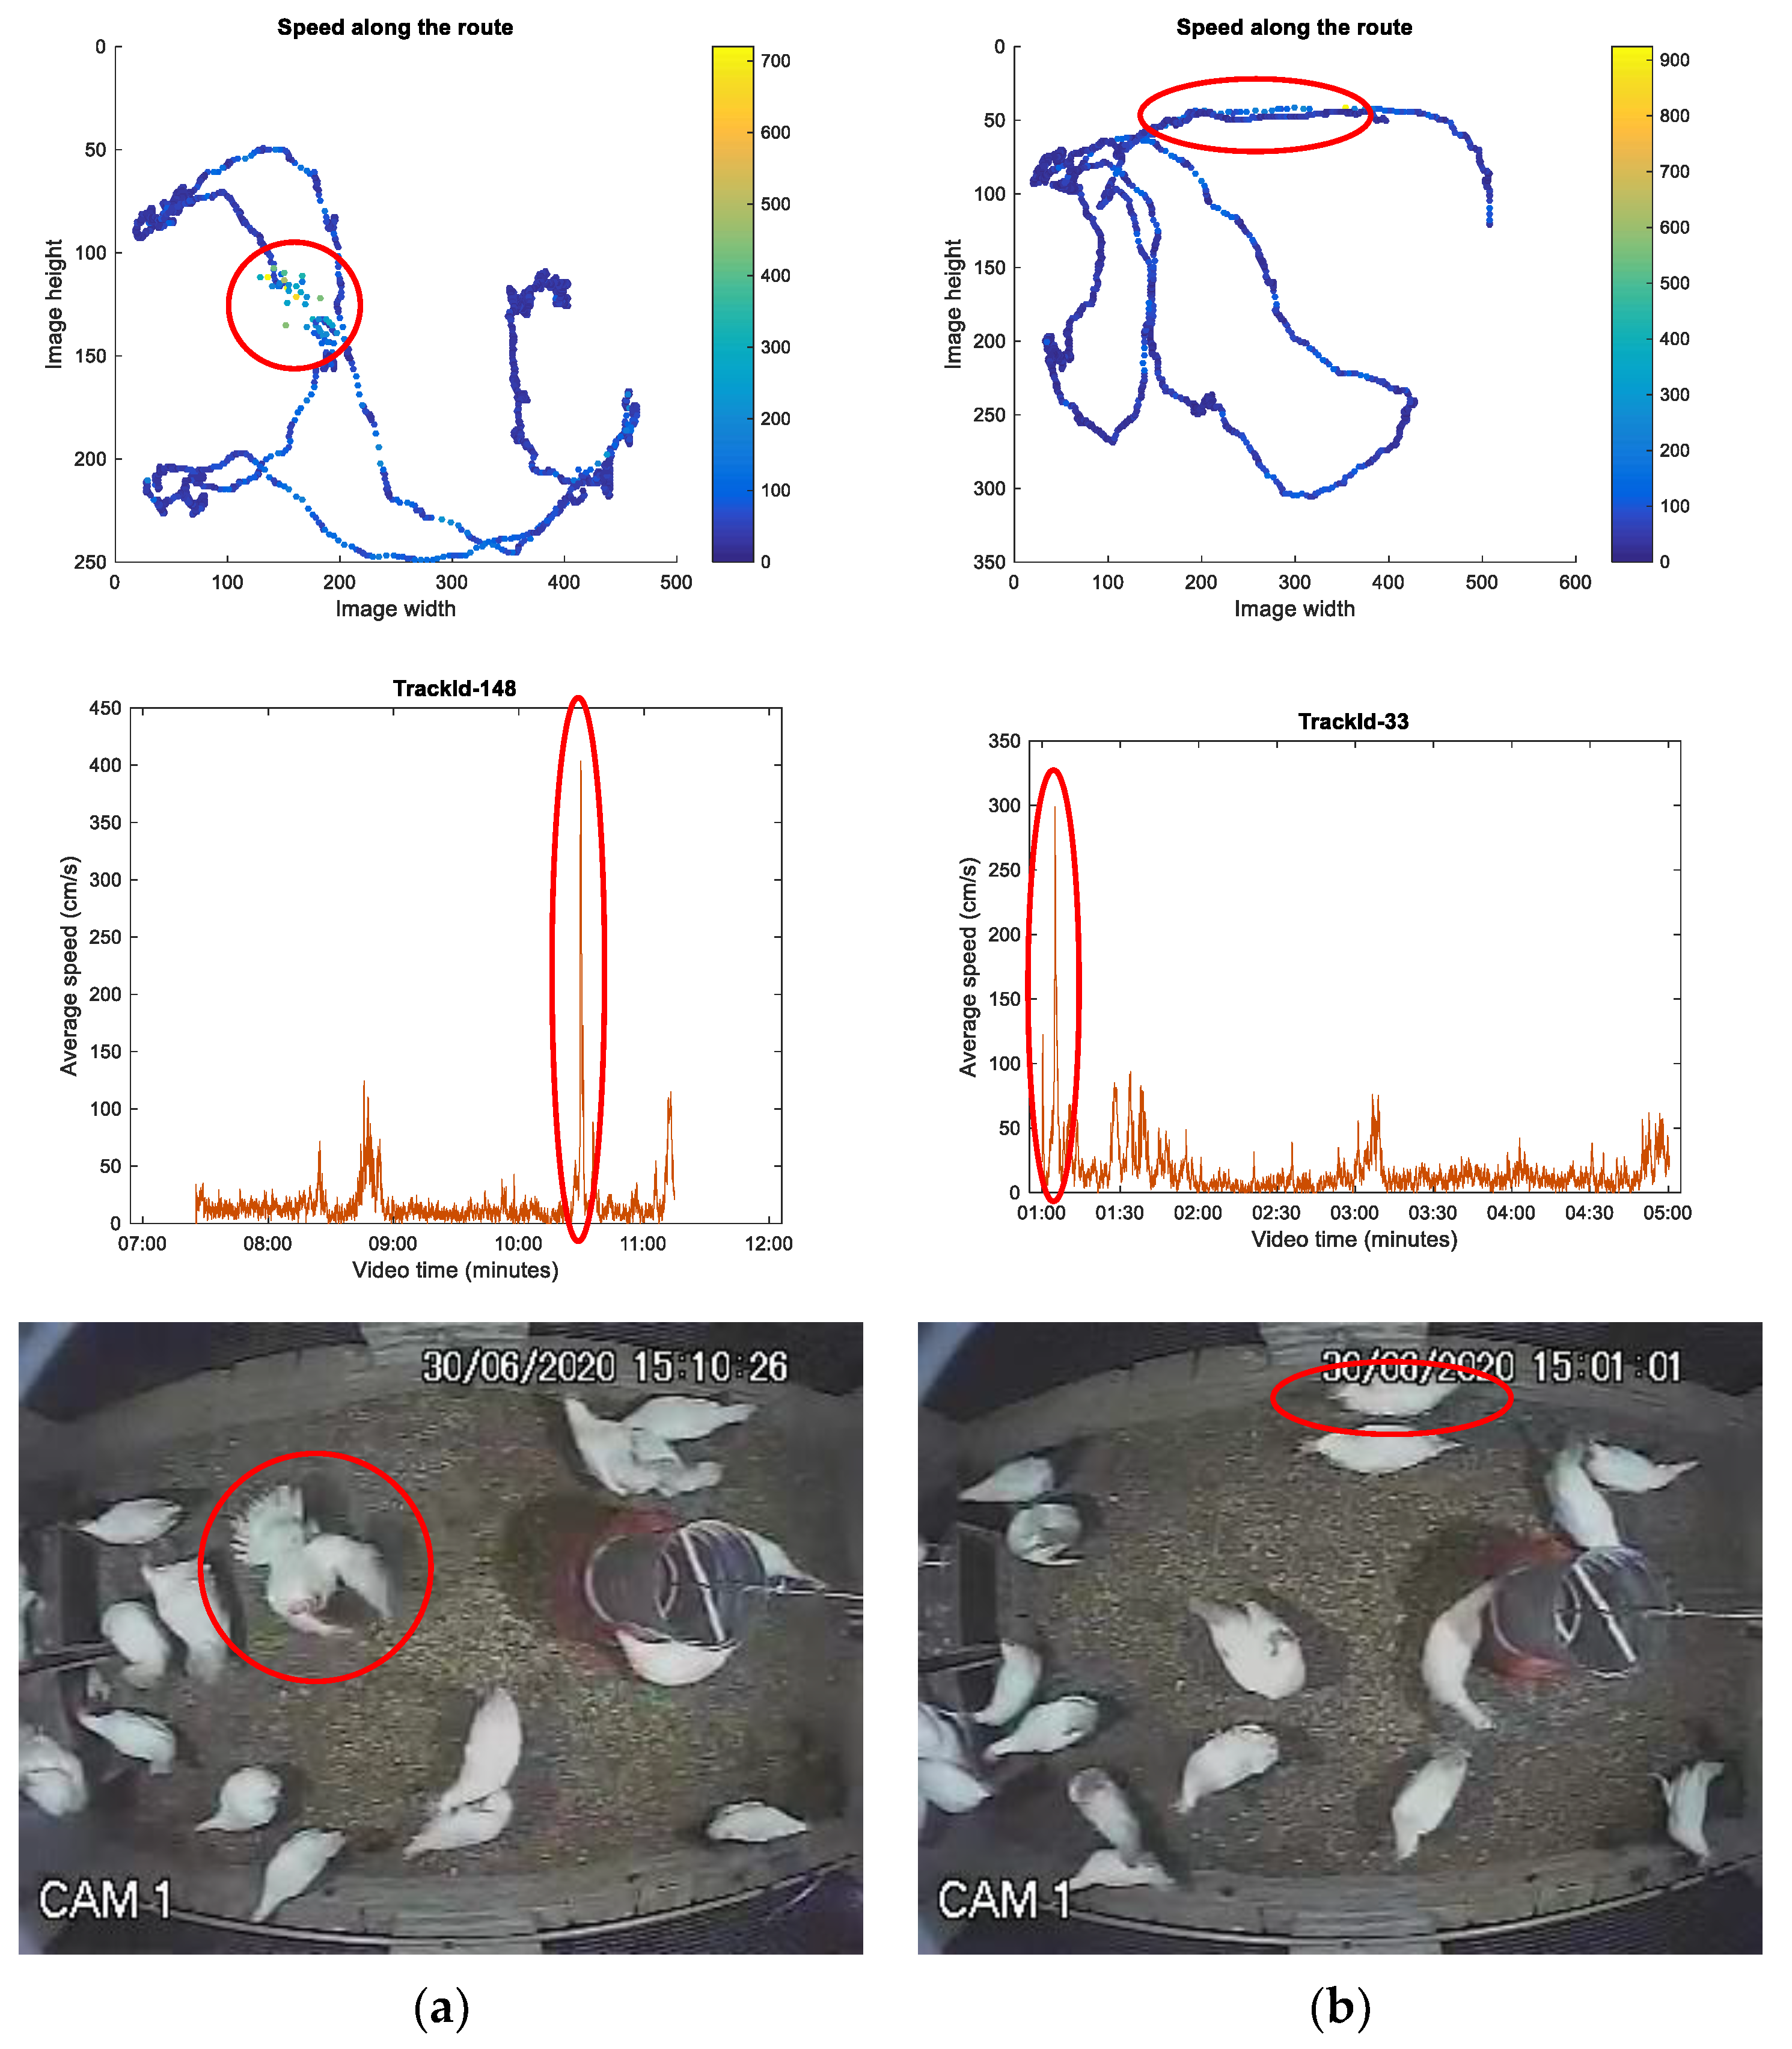
The chicken with track_Id = 148 caught our attention, which had a greater displacement per run than the other birds. Analyzing the trajectory graph, we noticed that in the region where the chicken supposedly ran, the direction vectors were misaligned. Unlike what happened with the chicken track_Id = 33, during the peak velocity, the direction vectors were aligned. We searched the video for the exact frames of each chicken for these occurrences and verified that chicken 33 ran at that moment and chicken 148 flapped its wings.
Figure 9 shows the graphs and frames, highlighting the observed differences.
As observed in
Figure 9, the peaks in speed are highly similar for distinct behaviors, indicating that this measure alone is insufficient for distinguishing between these behaviors. Based on these observations, the variation in the direction of movement of the birds was analyzed and compared with their speed. The tangent angle of the chicken’s displacement vector for each analyzed frame indicates the intensity of the change of direction of the chicken’s path. It was observed that when this route change is abrupt and associated with high speed, there is a high possibility that the bird is opening its wings. When the speed is high and there is no change in route, it is assumed that the chicken is running. When the route changes but the speed is considered normal, it is assumed that the bird has simply changed direction and continued walking.
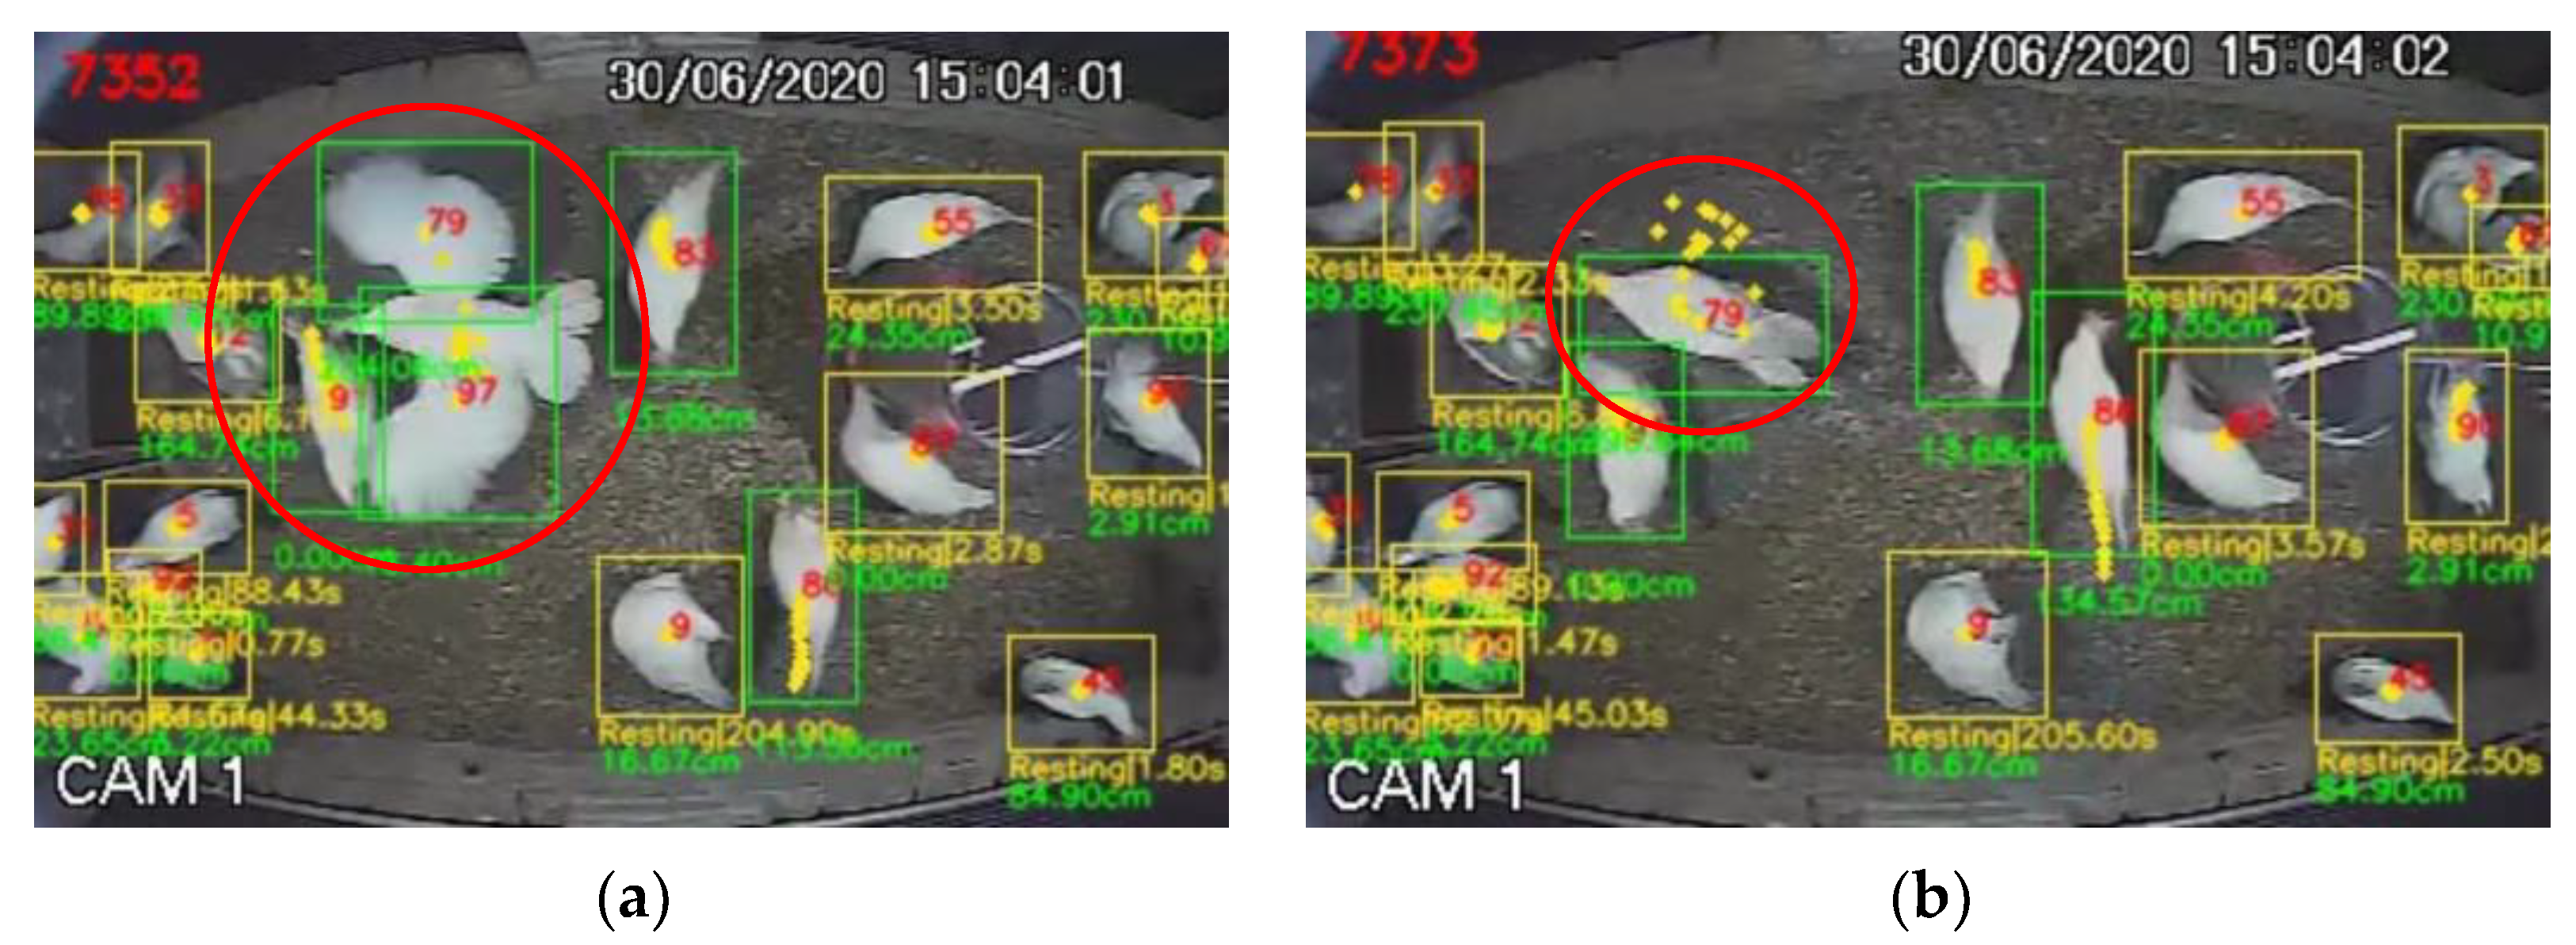
For the running chicken, we used the measurement of the distance between the centroids of the extreme points during the last ten frames. This approach allows the detection of the directionality of the bird’s movement. Consideration of speed is of fundamental importance, as it constitutes a discriminating factor between the “Exploring” and “Running” states. In
Figure 10, during flapping, the chicken identification track_Id = 79 is segregated into two identifications (track_Id = 79 and track_Id = 97). After the expression of the behavior, identification 97 ceases to exist. During flapping, there is a rapid change in the positioning of the centroid of the original identification (track_Id = 79), resulting in a speed that falls within the predefined limits for the “Running” and “Exploring” states. The generation of new identifications in different bird regions during wing flapping can also cause deviations in the centroids, mimicking the presence of another bird. The finding of a distance between the centroids of these identifications above 20 cm characterizes the “Running” behavior. To mitigate the influence of spurious identifications, we adopted a rule requiring a minimum number of 18 frames (called “lifetime”) in which the bird remains in the video. The limit of 18 frames was chosen based on observations since birds frequently performed movements that caused abrupt changes in the image centroid. This strategy aims to reduce confusion between genuine behaviors and artifactual occurrences.
We implemented these rules in our code (pseudo-code in
Appendix A). The processed video that classifies bird movement with all these metric considerations is shown in the
Supplementary Material.
In
Table 2, we show a summary of the time spent by the birds resting, exploring, and running, which can be used to analyze the state of welfare or health of the birds in time intervals of interest.
Table 2 presents a summary of data obtained from the entire 15-minute video. This summary can be generated for any desired time interval. It was observed that the birds spend most of their time stationary, resting or engaging in other natural behaviors that do not involve movement. The majority of the route traveled by the bird is spent exploring. A few instances of running behavior were observed, and it was verified that this behavior is expressed for very short periods.
We found no reference values for these behaviors in the literature. However, we hypothesize that by extracting precise measurements of these behaviors, it will be possible to establish reference values for each lineage, allowing the welfare of chickens submitted to different housing environments to be compared.
4. Discussion
Proposing automatic, accurate, and non-invasive approaches to monitoring animals in production is necessary to improve the efficiency and welfare of animals in housing [
32]. In this sense, several studies have used convolutional neural networks (CNN) to detect and classify chicken behavior. Neethirajan [
19] and Yang et al. [
20] demonstrated the feasibility of using Yolo to detect chickens in several videos, suggesting applications such as counting and tracking. Yang et al. [
20] classified six behaviors using Yolo-v5 with accuracies ranging from 72.3% to 95.3%. Li et al. [
33] developed a computer vision system to detect chickens in feeders and drinkers. Nasiri et al. [
32] estimated feeding time for broilers using Yolo-v3 to detect when heads were within the feeder area.
Individual and group behavior are important indicators of the welfare and health of birds [
34,
35,
36]. Our work provides a breakthrough for tracking chickens, demonstrating that the Kalman filter and the BoT-SORT algorithm efficiently maintain the identification of birds in our videos, where the density and overlapping of bodies were a challenge for computer vision.
The BoT-SORT algorithm is highly effective in maintaining accurate identification of chickens throughout the tracking process. With our tracking algorithm, we could carry out a detailed analysis of the distances covered and the movement speeds of the chickens. This ability to identify and categorize movement behaviors makes it possible to analyze bird behavior in different environmental conditions.
Measuring the distances covered individually by the hens can indicate the activity level of the flock of individuals and can also be used to assess the gait score [
37]. Campbell et al. [
2] found that aviary resources were used differently by individual hens and that understanding these usage patterns by both individuals and the group will allow the optimization of cageless housing system designs. Jaihumi et al. [
13] developed a Yolo v5 model to assess the mobility of broilers, and Fernández et al. [
6] found an association between activity level and patterns of aviary occupancy with hock and leg injuries in broilers using computer vision.
By observing movement patterns, we could detect significant differences between individuals in the monitored group of chickens. These individual distinctions in movements are necessary to assess bird welfare and health. For example, we can identify birds exhibiting anomalous behaviors indicative of health problems or discomfort, allowing for early intervention to ensure appropriate treatment.
Collins [
38] observed that some chickens walked greater distances than others. The motivation for moving laying hens may differ from that of broilers. However, in our results, we also observed that there are hens that moved more and at greater speeds than others. Taylor et al. [
39] found a relationship between chickens that covered greater distances and increased welfare, and these animals had lower weight, better gait scores, and lower corticosterone responses. Considering chickens under the same rearing model, the observed differences in movement measured by our tracking system may indicate more adapted individuals.
The movement measurements obtained and the tracking algorithm developed in this study provide a solid basis for future investigations. This model can assess the welfare and health of chickens and classify and understand other natural behaviors, thus contributing to significant advances in poultry farming and animal welfare research. Such information is essential to improve poultry farming practices, ensuring a healthier and more comfortable environment for these animals.
Limitations and Suggestions for Future Studies
Our tracking method is limited in regions where the camera is obstructed, such as behind equipment, edges of images, and inside nests. Obstruction of the image by equipment was also observed in other studies [
21]. In our tests, we preferred not to deal with this problem because, in commercial situations, there will be regions where the bird will leave the camera’s field of view. We understand it is better to use strategies to analyze the data recorded this way, as already discussed in other works.
Our footage was low resolution and heavily distorted around the edges. The use of high-resolution cameras with less edge distortion can improve the detection accuracy, the conversion scale from pixels to centimeters, and, consequently, the measurements of the distances covered by the birds. Addressing these distortions can give greater accuracy in displacement measurements. More complex images are subject to greater chances of computational model confusion [
20]. In this field, it is still necessary for work to demonstrate the stability of a flock tracking system and longer filming times.
We adopted criteria to reduce confusion in classifying the running behavior with other natural behaviors. We raised the hypothesis that these criteria can be better worked to contribute to the classification of natural behaviors. Dawkins [
40] and Kashima et al. [
41] proposed that behavior can be used to estimate the need and health of animals, highlighting that behavior analysis should have a more prominent role when used with new technologies. Thus, other studies that seek to classify individual or group behaviors autonomously are necessary and will constitute the future of industrial poultry for monitoring the welfare and health of chickens.
5. Conclusions
Our model obtained a mean average precision of 98.5% in detecting chickens, and the BoT-SORT algorithm was efficient in maintaining the identification of these birds during tracking. From the tracking, it was possible to analyze the distances covered and the speeds of the chickens, which made it possible to classify their movement behaviors. Movement speeds above 100 cm/s of chickens with a lifetime of more than 18 frames were sufficient to differentiate running behavior from exploring behavior. In this study, the tests showed that the chickens spent approximately 85% of their time resting, 10% of their time exploring the environment, and 6% running. Our algorithm and the measures extracted to classify chicken movement contribute to the assessment of chicken welfare and health.


 ,
, 


