Article

Comparative Yield, Fiber Quality and Dry Matter Production of Cotton Planted at Various Densities under Equidistant Row Arrangement

1
State Key Laboratory of Cotton Biology, Institute of Cotton Research of Chinese Academy of Agricultural Sciences, Anyang 455000, China
2
State Key Laboratory of Cotton Biology, Zhengzhou Research Base, Zhengzhou University, Zhengzhou 450001, China
*
Author to whom correspondence should be addressed.
Submission received: 20 December 2019 / Revised: 31 January 2020 / Accepted: 3 February 2020 / Published: 5 February 2020
(This article belongs to the Special Issue Herbaceous Field Crops Cultivation)

Abstract

:
The number of cotton plants grown per unit area has recently gained attention due to technology expense, high input, and seed cost. Yield consistency across a series of plant populations is an attractive cost-saving option. Field experiments were conducted to compare biomass accumulation, fiber quality, leaf area index, yield and yield components of cotton planted at various densities (D1, 1.5; D2, 3.3; D3, 5.1; D4, 6.9; D5, 8.7; and D6, 10.5 plants m−2). High planting density (D5) produced 21% and 28% more lint yield as compared to low planting density (D1) during both years, respectively. The highest seed cotton yield (4662 kg/ha) and lint yield (1763 kg/ha) were produced by high plant density (D5) while the further increase in the plant population (D6) decreased the yield. The increase in yield of D5 was due to more biomass accumulation in reproductive organs as compared to other treatments. The highest average (19.2 VA gm m−2 d−1) and maximum (21.8 VM gm m−2 d−1) rates of biomass were accumulated in reproductive structures. High boll load per leaf area and leaf area index were observed in high planting density as compared to low, while high dry matter partitioning was recorded in the lowest planting density as compared to other treatments. Plants with low density had 5% greater fiber length as compared to the highest plant density, while the fiber strength and micronaire value were 10% and 15% greater than the lowest plant density. Conclusively, plant density of 8.7 plants m−2 is a promising option for enhanced yield, biomass, and uniform fiber quality of cotton.

1. Introduction

Cotton is an important cash crop grown worldwide as a major source of fiber [1]. Cotton is perennial but commercially grown as an annual crop and has indeterminate growth. China is the largest cotton-producing country in the world by contributing about 30% of the world’s cotton production [2]. Henan Province is one of the major cotton growing provinces of China, with more than 400 thousand hectares of land [3]. Plant density determination is one of the most important practices for increasing yield of cotton [4]. Plant density is the key factor for optimizing structures and increasing the photosynthetic capacity of the cotton canopy. High planting density has become common in cotton production systems. It has been reported that both too high and too low plant density reduces cotton yield by affecting light penetration and moisture availability, further influencing plant height, architecture, boll behavior, and crop maturity. An optimum plant density not only improves the yield and fiber quality of cotton but also reduces input costs by minimizing seed rate and fertilizer application without decreasing yield [5]. Low plant density produced a higher number of heavy bolls per plant, while both the number and weight of bolls reduced with increasing plant density [6,7]. Currently, suggested and practiced plant densities in China are 5.3 × 10⁴ to 7.5 × 10⁴ plants ha−1 in the Yellow River Valley [8], 3.0 × 10⁴ plants ha−1 in the Yangtze River Valley [9], and 22.7 × 10⁴ plants ha−1 in the Northwest region. The difference between the plant densities among various locations is due to difference in climatic conditions which affect the yield and fiber quality of cotton.
Biomass accumulation in the cotton plant during the early growth period is an important factor for final yield determination. More biomass accumulation in early stages helps in better establishment of a crop while accumulation at late growth stages increases assimilation to the reproductive organs, resulting in a higher yield and quality of cotton [10]. Cotton plants accumulate more biomass in vegetative organs due to its indeterminate nature. More assimilate accumulation to vegetative and reproductive organs increases the shedding of fruit and leaves [11,12]. At maturity, the aboveground biomass becomes lower than the total due to the shedding of leaves and fruits [13]. Previous studies have confirmed that optimum plant density is the critical factor for establishing optimal canopy structure and leaf area index (LAI). Optimal LAI determines light penetration in the canopy [14,15,16]. Several researchers have examined the relationship between the plant density, LAI, and cotton production [17,18,19] and found that an increase in plant density results in higher LAI, while too-high LAI caused shading and reduced the yield [20,21]. Both LAI and yield increases slowly with an increase in plant density [22]. Fiber quality indicators including fiber strength, fitness, length, uniformity index, and fineness are negatively affected by environmental and genetic factors as well as poor management practices at flowering and boll formation stages [23,24]. Similarly, fiber quality is affected by plant density, irrigation, fertilization, and weather changes [23,25]. This study is conducted with the aim to assess the response of cotton yield and fiber quality, biomass accumulation, and partitioning of various plant densities to identify technological alternatives to make efficient use of land and increase yield and profitability of cotton.

2. Materials and Methods

2.1. Experimental Site

The study was conducted in 2016 and 2017 at the experimental station of the Institute of Cotton Research of Chinese Academy of Agricultural Sciences in Anyang, Henan, China (36°06′ N, 114°21′ E). The soil was medium loam in texture with a total N of 0.65 g kg−1, P of 0.01 g kg−1 and K of 0.11 g kg
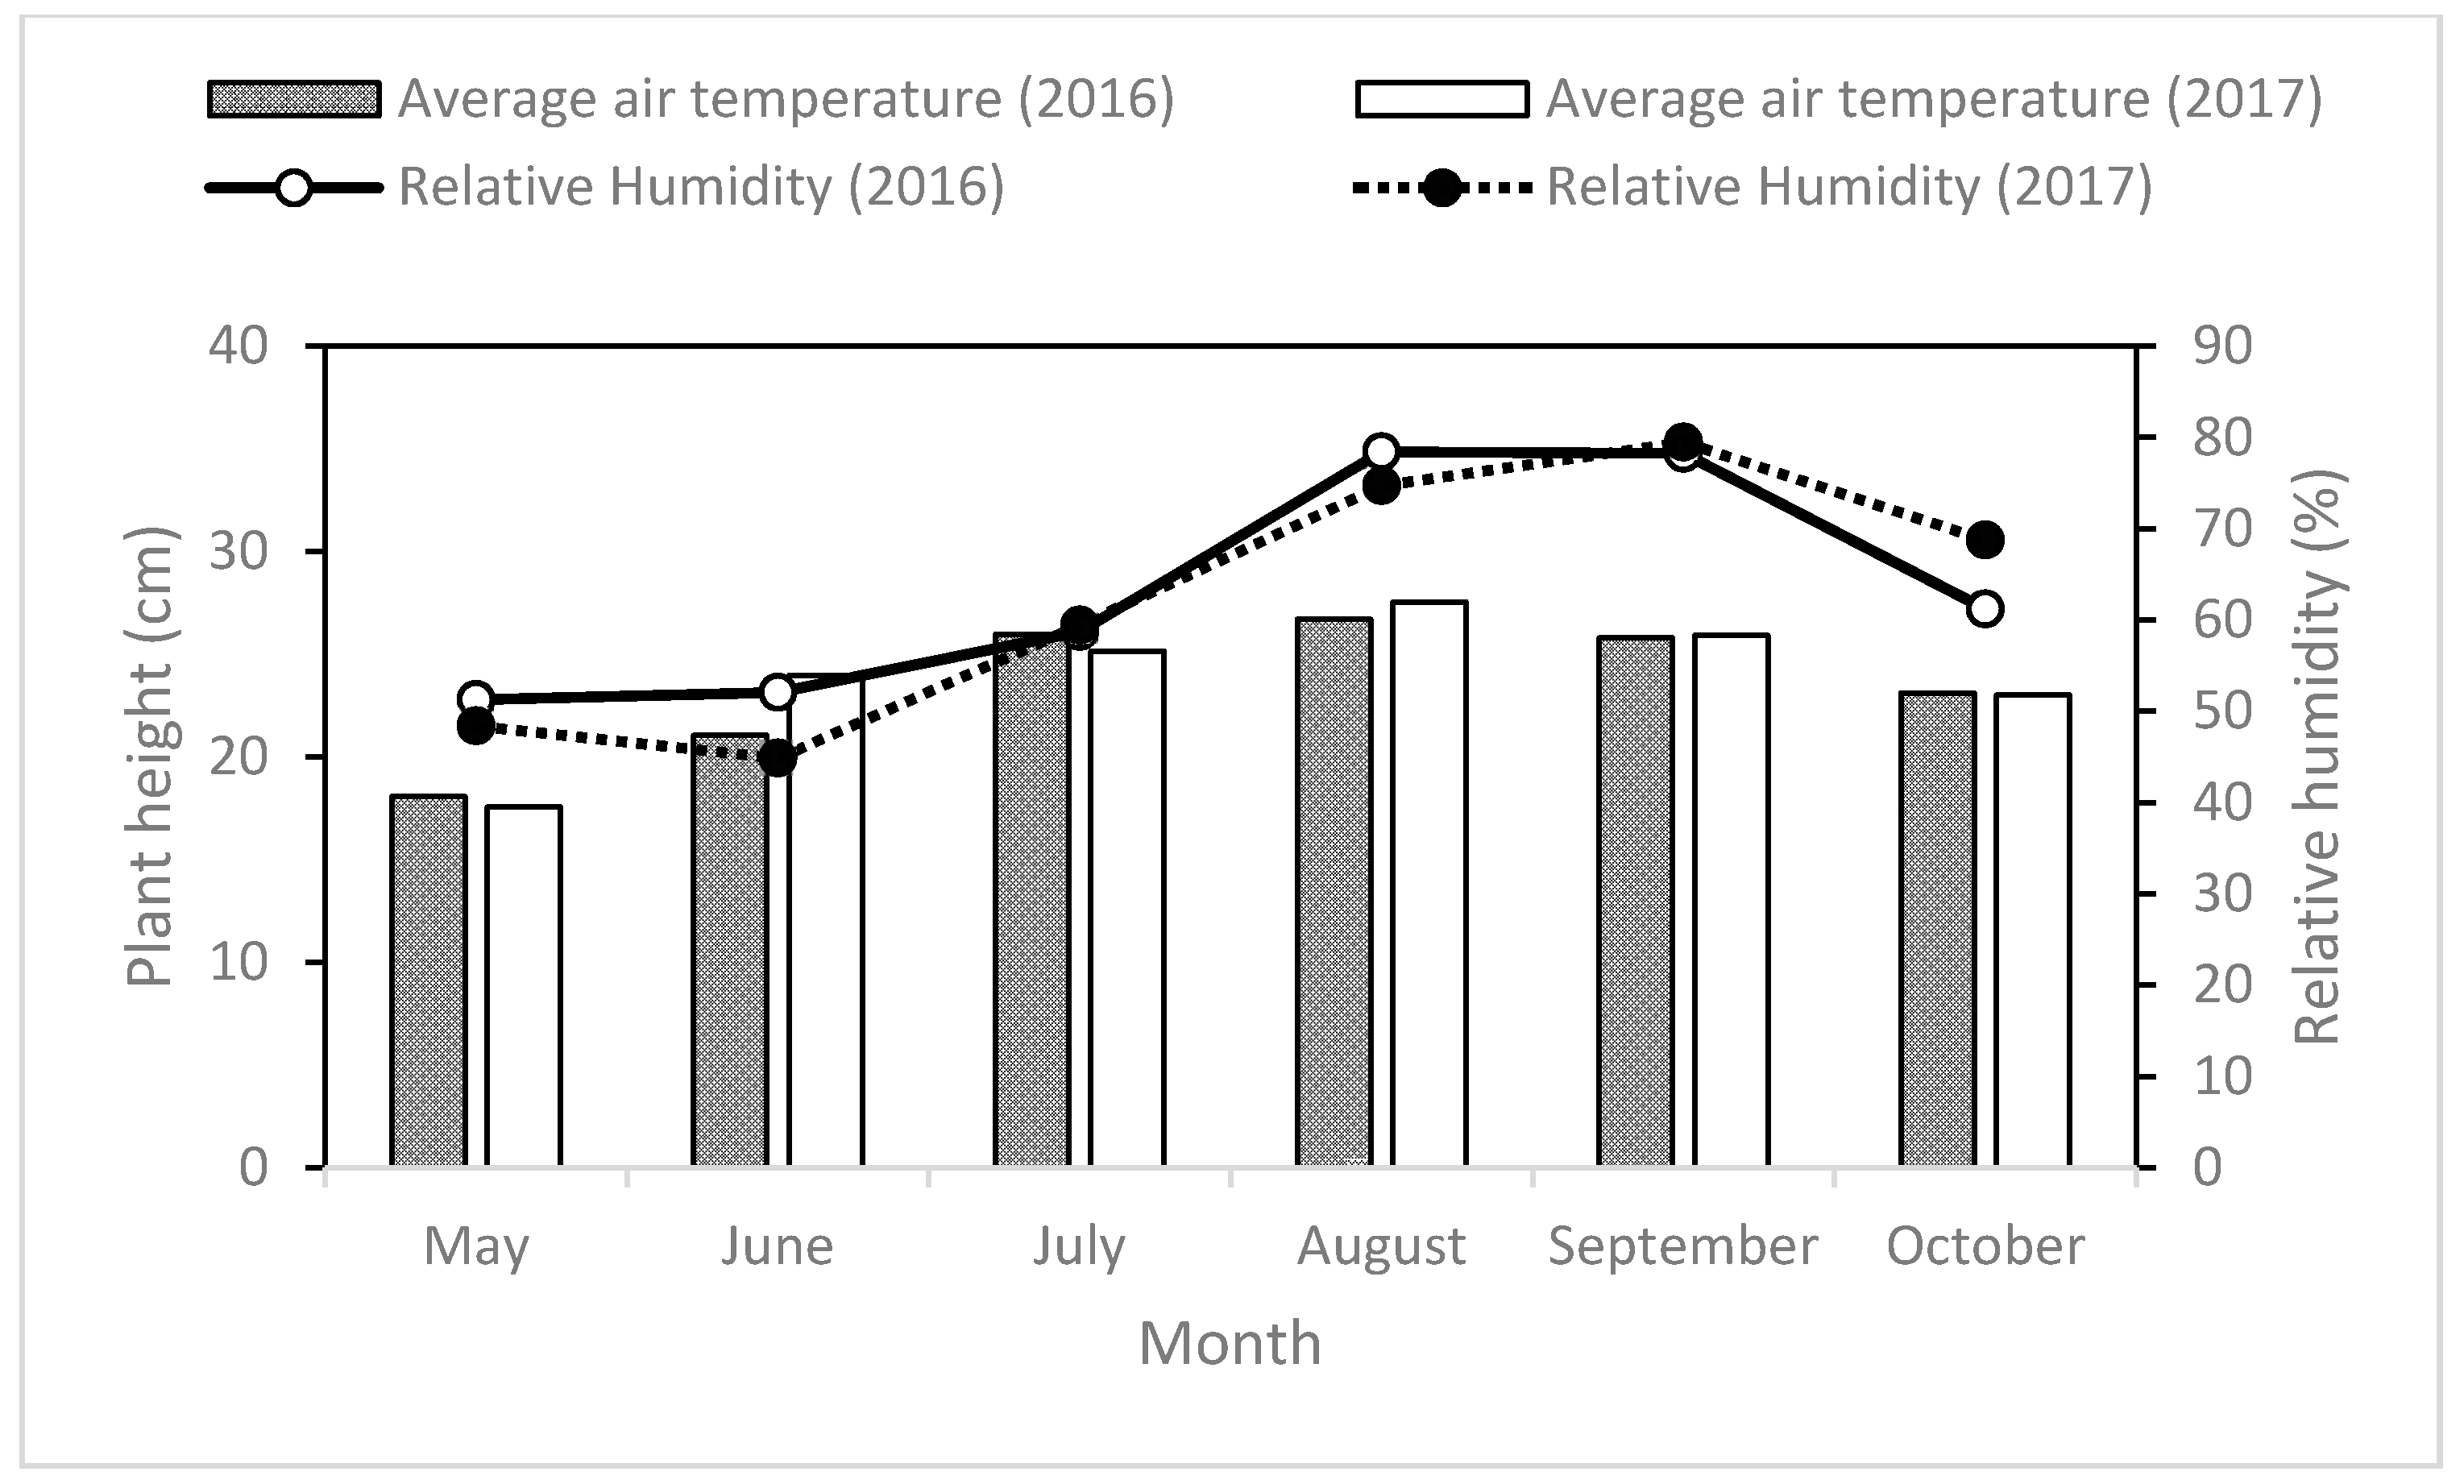
−1. The monthly average temperature and relative humidity data of both years of cotton growing seasons are presented in Figure 1. The average temperature during the cotton growing season was 22 °C and 23 °C in 2016 and 2017, respectively. Annual rainfall was 713 mm in 2016 and 585 mm in 2017. Annual sunshine hours were 1737 h in 2016 and 1838 h in 2017. The average air temperature at the seedling and reproductive stages was cooler as compared to other growth stages. The overall cotton growing season in 2016 was cooler with more rainfall as compared to 2017.

2.2. Experimental Design

The experiment was conducted in a randomized complete block design (RCBD). Six plant densities (D1, 1.5; D2, 3.3; D3, 5.1; D4, 6.9; D5, 8.7; and D6, 10.5 plants m−2) were plotted randomly in three replications on clay loam soil. Each experimental plot area was 64 m2 with 8 m in length and width. Each plot consisted of 10 rows, with a row spacing of 0.8 m, which was constant for all plant densities. Seeds of cotton mid maturity cultivar SCRC28 were sown by hand on flat beds with plastic mulching to conserve soil moisture from evaporation. Plastic mulch was removed after one month of full emergence. Seedlings were thinned to the required plant densities after three weeks of emergence. During both years, the land was prepared by ploughing, and irrigated in early spring before sowing. Sowing was done during the growing season on 22 April in 2016 and 2017.
A basal dose of 225 kg N ha−1, 150 kg P2O5 ha−1, and 225 kg K2O ha−1 was applied to the field before sowing. Irrigation was applied by flooding during the flowering stage at a total volume of approximately 45 m3. Crop management practices such as weeding, hoeing, pesticides, and irrigation were performed in a timely manner to enhance crop growth.

2.3. Data Collection

Data were recorded on cotton leaf area index, biomass accumulation at critical stages of crop growth, fiber quality, yield and yield components (boll m−2 and boll weight) during 2016 and 2017 at different days after emergence.

2.3.1. Yield and Yield Components

Seed cotton yield (kg/ha) and lint yield (kg/ha) were recorded by hand-harvesting three times from each treatment. The boll moisture was reduced to less than 11% by air-drying and seed cotton of 100 bolls at first harvest were sampled for boll weight. Weight of single boll was calculated by dividing total seed cotton yield of 100 bolls by the total number of bolls. Lint percentage was calculated from lint yield of 100 bolls divided by seed cotton weight of 100 bolls.

2.3.2. Biomass Accumulation and Partitioning

The dry weight of cotton plants was recorded seven times during the growing season with an interval of 15 days at 42 days after emergence (DAE), 57 DAE, 72 DAE, 87 DAE, 102 DAE, 117 DAE, and 132 DAE. Three plants from each plot of three replications were uprooted randomly and dissected into the underground part (roots), leaves, stem, and reproductive structures. Samples were quickly placed for 30 min in an electric fan-assisted oven at 105 °C in order to stop metabolism. Samples were dried at 80 °C for 48 h to attain a constant weight. Dry matter partitioning was calculated by the ratio of the dry weight of reproductive organs (DWRO) (squares, flowers, green, and open bolls) to plant total biomass while boll load was calculated by dividing DWRO by leaf area. A logistic regression equation was used to describe biomass accumulation [26].
Y = A 1 + be kt
In Equation (1) Y (kg) is the biomass, A (kg) the maximum biomass, t (d) is the number of days after emergence (DAE) while a and b are constants.
From Formula (1), the following equations were calculated:
t o = lnb k ( t o = t )
t 1 = lnb ln ( 2 + 3 ) k
t 2 = lnb + ln ( 2 + 3 ) k
V M = Ak 4
t = t 2 t 1
V A = Y 2 Y 1 t
In the above equations, VM (kg ha−1 d−1) is the highest rate of biomass accumulation, and t (d) is the maximum biomass fast accumulation period. Y1 and Y2 are the biomass at t1 and t2. VA indicates the average biomass accumulation from t1 to t2 and ∆t (d) is the total period of average biomass accumulation.

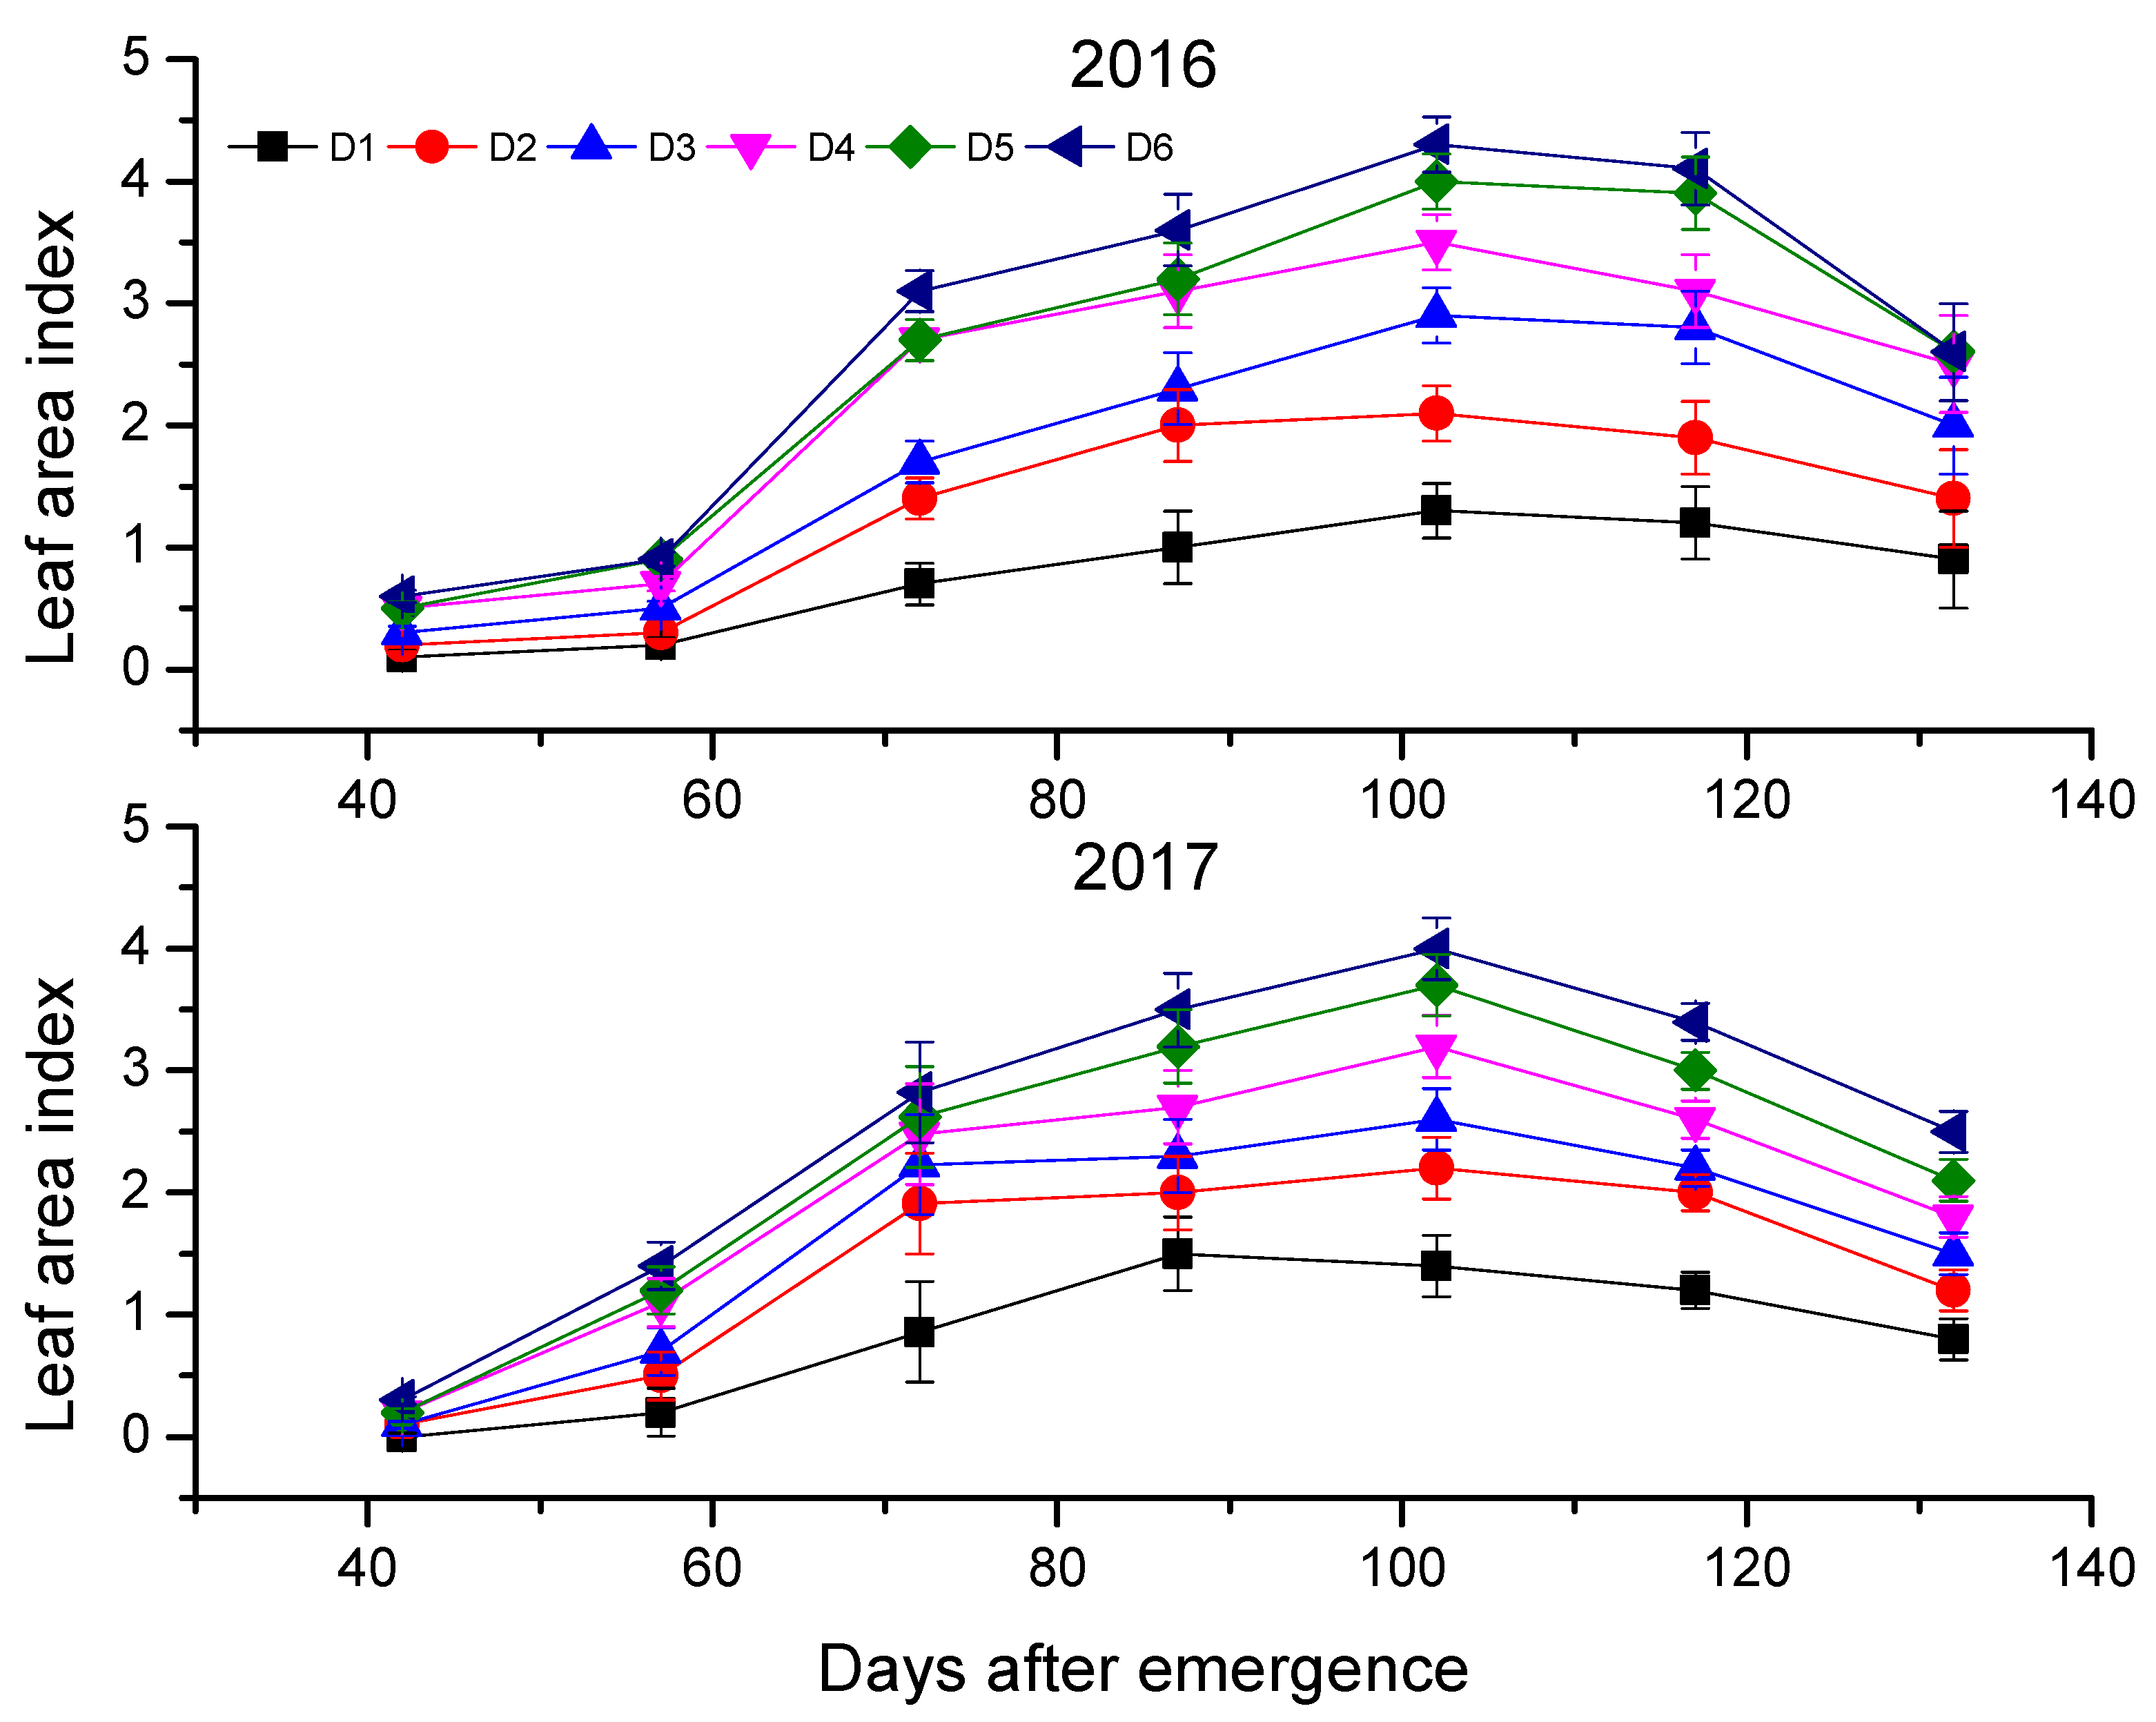
2.3.3. Leaf Area Index

LAI of cotton plants were calculated by taking photos of leaves through a scanning machine (Phantom p800xl, MiCROTEK, Shanghai, China) and leaf area was calculated by using Image-Pro Plus 7.0 (Media Cybernetics, Rockville, MD, USA). The LAI was determined by dividing the total plant leaf area per unit ground area.

2.3.4. Fiber Quality

Fiber quality, including fiber length (mm), fiber uniformity, fiber strength (cN tex−1), and fiber micronaire, were assessed by the Supervision, Inspection and Test Center of Cotton Quality, Ministry of Agriculture, in Anyang, Henan province of China using a high volume instrument (HVI-900) (Changing Technologies, Mainland, China) according to the internationally accepted ICC standard.

2.3.5. Statistical Analysis

Microsoft Excel 365 (Microsoft, Bothell, WA, USA) as used for the processing of data. SPSS 19.0 (SPSS Inc. Chicago, IL, USA) and Origin 2016 (OriginLab Corporation, Northampton, MA, USA) were used for the analysis of data. Figures were plotted by using Origin 2016. Duncan’s multiple range test at 5% probability level was used to test differences among mean values.

3. Results

3.1. Yield and Yield Components

Yield and yield components of cotton varied with plant density. Seed cotton yield and lint yield along with yield components were significantly affected by plant density except boll weight and lint percentage in both years (Table 1 and Table 2). During both years, D5 plant density (PD) produced the highest seed cotton and lint yield as compared to other plant densities. Highest seed cotton yield of 4662 kg ha−1 and highest lint yield 1763 kg ha−1 was produced by D5, which was followed by D4, D6, D3, D2, and D1. The highest lint percentage (43.5%) was recorded at D1, followed by D2, D3, D4, D5, and D6. The boll density per unit ground area generally increased with increasing plant density but the boll density of individual plants decreased with increasing plant density. More number of bolls m−2 (105.4) was produced by D6 in 2016, while in 2017 more bolls m−2 (75.7) was produced by D5. During both years, bigger bolls were produced by D1 as compared to other treatments.

3.2. Biomass Accumulation

Cotton plant biomass accumulation (CPB) was significantly affected by plant density and followed a normal logistic model by DAE (Figure 2). CPB increased as plant density increased and differences were found between the different densities. The D6 plant density had more CPB accumulation as compared to D1, D2, D3, D4, and D5 during both years. Vegetative organ biomass (VOB) during 2016 and 2017 was positively affected by plant density (Table 3 and Table 4). The VOB increased linearly with the increase in plant density. The highest PD, D6, produced more VOB as compared to other plant densities while individual plant VOB decreased as density increased due to resource competition among plants. Reproductive growth of cotton started from the appearance of the first square. Less biomass accumulated to reproductive organs of cotton which increases linearly with further growth. Treatment D5 produced more ROB in 2016 and 2017, followed by D6, D4, D3, D2, and D1.

3.3. Simulation of Biomass Accumulation

Simulation of biomass accumulation based on Equation (1) followed the logistic function and all the biomass accumulation were significant. Calculation from Equations (2)–(7) based on Table 2 illustrates the day of starting and termination of cotton biomass fast accumulation period (FAP) during 2016 and 2017. The averaged highest speed for CPB in all plant densities were 68 and 114 DAE in 2016, and 56 and 98 in 2017, with the highest average (VA = 16 and 14 gm m−2 d−1) and maximum rate (VM = 18 and 15 gm m−2 d−1) (Table 5 and Table 6).
Cotton plant biomass accumulation was found significant among plant densities. In 2016, a fast accumulation period in D5 started at 65 DAE and terminated at 113 DAE, which lasts for 48 DAE with the ighest average (19.2 VA gm m−2 d−1) and maximum rate (22 VM gm m−2 d−1) at 89 DAE. The lengthiest fast accumulation period for CPB was noted in D6, which lasts for 49 DAE with the average rate of 18.8 VA gm m−2 d−1 (Table 5).
The fast accumulation period of CPB in 2017 for D6 started earlier at 50 DAE and terminated at 94 DAE, while D1 FAP terminated last at 107 DAE. The highest average (15.6 VA gm m−2 d−1) and maximum rate (17.8 VM gm m−2 d−1) were noted in D5, followed by D4, D6, D3, D2, and D1 (Table 6).
Vegetative organ biomass responded positively to plant density. The earliest and highest FAP of VOB in both years was observed at D6 with the average rate (12 and 10.7 VA gm m−2 d−1), which lasts for 39 and 32 DAE, and maximum rate (13.5 and 12.2 VM gm m−2 d−1), which lasts for 72 and 55 DAE in 2016 and 2017, respectively. Both average and maximum VOB accumulation rates of D6 were 62%, 23%, 25%, 16%, and 11% higher than D1, D2, D3, D4, D5 in 2016 and 52%, 24%, 8%, 17%, and 13% higher than D1–D5 in 2017 (Table 5 and Table 6).
The highest average rate (11.5 VA gm m−2 d−1) of reproductive structures biomass was observed in D5, which started at 80 DAE and terminated at 117 DAE and lasted for 37 DAE, with a maximum rate (13 VM gm m−2 d−1) at 99 DAE in 2016 (Table 4). Both average and maximum ROB accumulation rates of D5 were observed to be higher as compared to D1, D2, D3, D4, and D5. The earliest FAP in D5 began at 80 DAE, while the last terminated FAP was observed in D1, which ended at 125 DAE. In 2017, initial FAP of ROB began in D5 which lasted for 31 DAE and terminated at 101 DAE, with the highest average rate (11 VA gm m−2 d−1) and maximum rate (12.6 VM gm m−2 d−1) at 86 DAE, followed by D6, D4, D3, D2, and D1 (Table 5 and Table 6).

3.4. Dry Matter Partitioning (DWRO/PB)

Dry matter partitioning, as indicated by the ratio of the dry weight of reproductive organs to plant biomass (DWRO/PB), increase slowly as the plant changes from one growth stage to another and peak stage of dry matter partitioning was observed at 120 DAE during 2016 and 2017 (Figure 3). During different growth stages, significant differences were observed between treatments (Table 7). The DWRO/PB of D1 was observed to be higher as compared to other treatments.

3.5. Boll Load (DWRO/LA)

Boll load, as indicated by the ratio of the dry weight of reproductive organs by leaf area (DWRO/LA), was found to be significantly higher in D6 as compared to other treatments and significant differences were observed between different treatments (Table 8). The DWRO/LA increased gradually with an increase in plant density and changing from one growth stage to another (Figure 4). At 132 DAE, DWRO/LA of D6 was 14%–82% and 4%–76% higher than treatment D1–D6 during 2016 and 2917, respectively.

3.6. Leaf Area Index

The leaf area index (LAI) at different days after emergence is shown in Figure 5. The LAI of D6 was higher during both years as compared to other treatments and increased linearly as plant density increased (Table 9). The LAI increased with the growth of the cotton plants and reached a peak at 102 DAE and then decreased linearly. LAI of high plant density reached 4.3 in 2016 and 4 in 2017, while in the case of lower plant density, it reached up to 1.3 in 2016 and 1.5 in 2017. In the last growth stages, no significant differences were observed in plant densities D4–D6.

3.7. Fiber Quality

Fiber quality parameters were significantly influenced by plant density in both years (Table 10). An increase in plant density led to longer fiber length while decreasing strength and micronaire value. Low planting density had low length and greater strength and micronaire value as compared to high treatments. The fiber length of high plant density D5 and D6 were statistically similar while the length of D5 was 5% and 7% longer than the lowest planting density in both years, respectively. Fiber strength of lowest plant density was recorded to be 9% and 10% higher, while micronaire was observed to be 15% and 9% higher as compared to the highest planting density in 2016 and 2017, respectively. Planting density had no significant effect on fiber elongation and uniformity index during both growing seasons.

3.8. Economic Analysis

The net returns were affected by different plant density. Net returns were determined on the basis of production cost and returns from the cotton crop. The highest net returns were obtained from D5 (1750 USD ha−1 and 1393 USD ha−1) during 2016 and 2017, respectively, while the lowest was obtained from D1 (Table 11). Seed and labor cost mostly affected net returns. More labor was required for low plant densities due to more vegetative branches as compared to high plant densities.

4. Discussion

The main purpose of this study is to explore and compare different plant densities in response to cotton yield, leaf area index, dry matter partitioning, and fiber quality at different growth stages. Higher plant density is the key management practice for obtaining greater numbers of bolls per unit area, but in most cases, the yield enhances up to an optimum density, after which further increase in plant population decreases yield. Different regions of China have different optimum densities and lint production, which depends on climatic conditions along with other management practices. The Xinjiang autonomous region has the recommended PD of 21.0 × 10⁴ to 24.0 × 10⁴ plants ha−1 [27]; followed by Yellow River Valley with a PPD of 3.0 × 10⁴, 4.5 × 10⁴, and 6.0 × 10⁴ plants ha−1 for hybrid Bt cotton, indigenous Bt cotton, and Bt cotton, respectively [28,29], and for late sowing, PD is 7.5 × 10⁴ ha−1 [30]; while in the Yangtze River Valley where hybrid seeds are commonly used, it has the PD of 3.0 × 10⁴ plants ha−1 [31]. Our results are consistent with previous studies that have shown that cotton yield increases up to a certain limit with increasing PD, while too low and too high plant density cause a reduction in yield [32]. In this study, yield and yield components were significantly affected by plant density, excluding boll weight and lint percentage. High yield and yield components were noted in plant density D5. Yield and number of bolls produced by a single plant of the treatment D5 was lower as compared to other treatments but was more based on per unit area. These results are consistent with Mao et al. [33], who reported that high plant population increase bolls m−2 while the weight of individual bolls decreases.
More biomass production is the foundation of high yield [34,35,
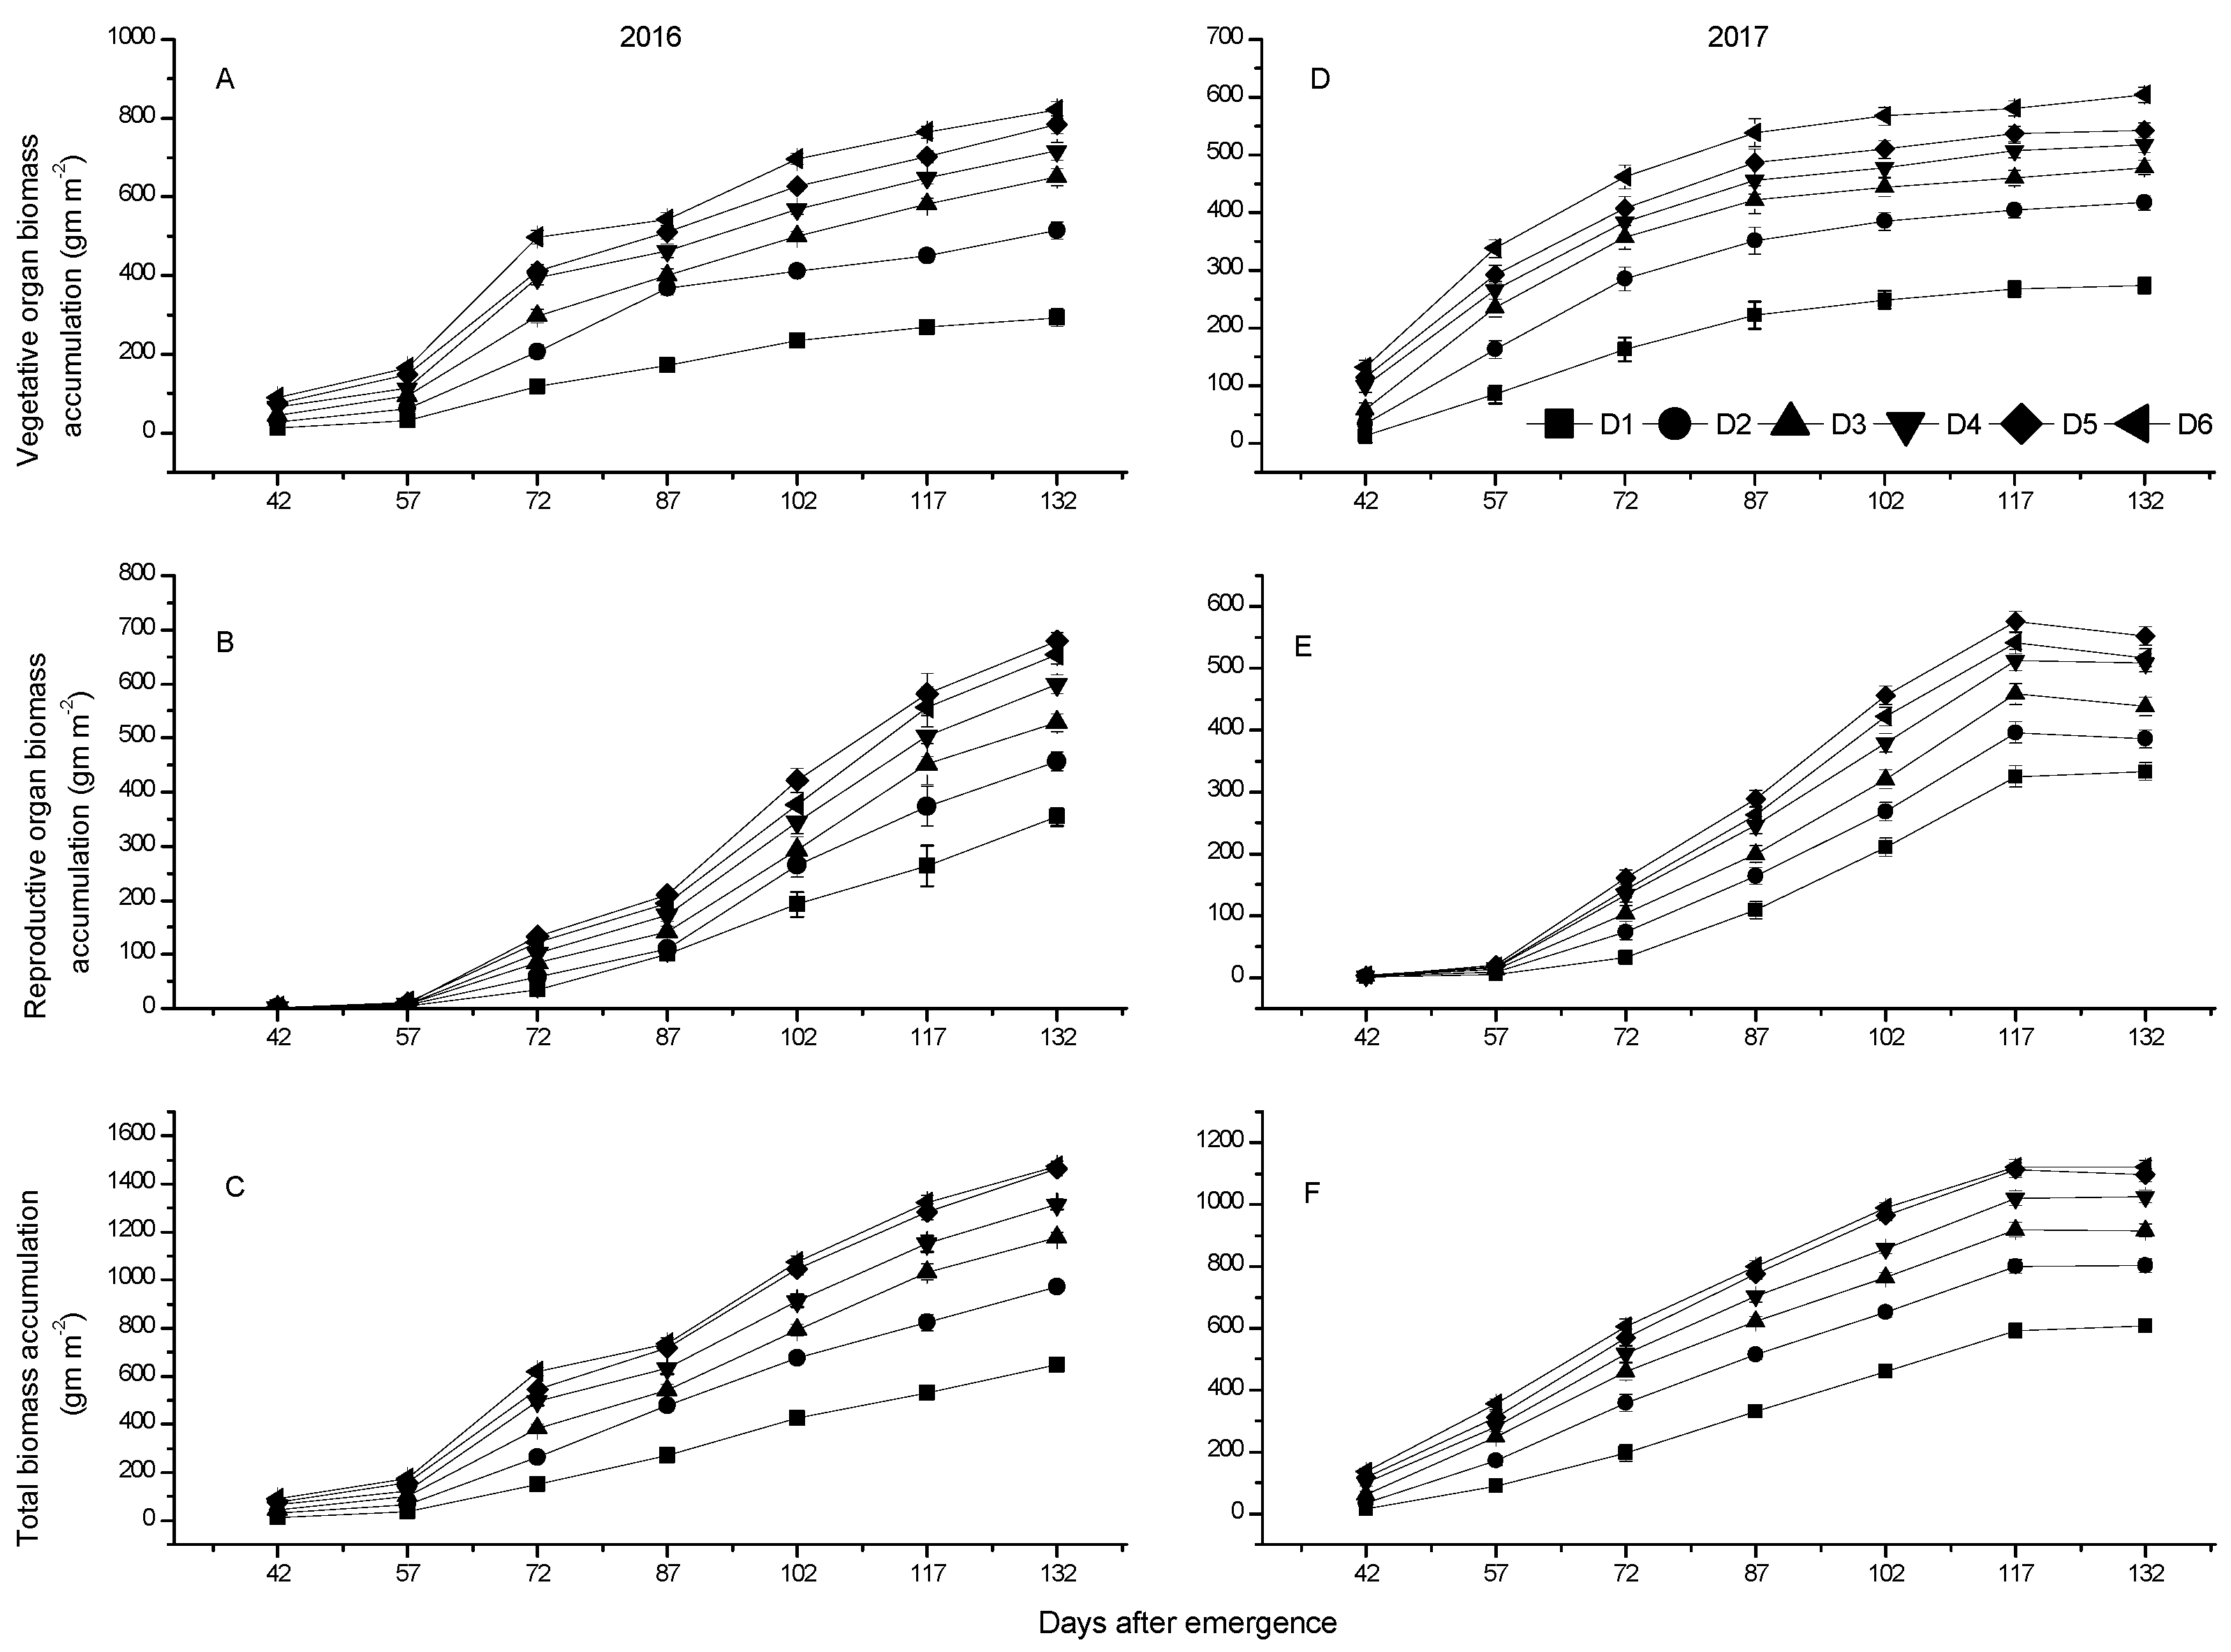
36]. In this study, biomass accumulation was higher in 2016 as compared to 2017, which might be due to differences in environmental conditions. Total plant biomass and vegetative organ biomass accumulation were high in higher plant density while higher reproductive organ biomass was accumulated in D5 as compared to other treatments. In early growth stages of the cotton plant, plant density did not affect reproductive structure biomass accumulation, while after 87 DAE ROB, accumulation was influenced significantly. High biomass accumulation in high plant density was due to a greater number of plants per unit ground area with more vegetative growth. Our results are in line with other researchers who also reported that high plant density resulted in high biomass production [37,38]. Both high and low plant density lead to reductions in reproductive organ biomass. The less ROB production in high population might be due to less light penetration to the lower parts of plants, followed by a reduction in temperature and increased relative humidity in the cotton canopy, which enhanced fruit shedding as compared to other plant densities [39].
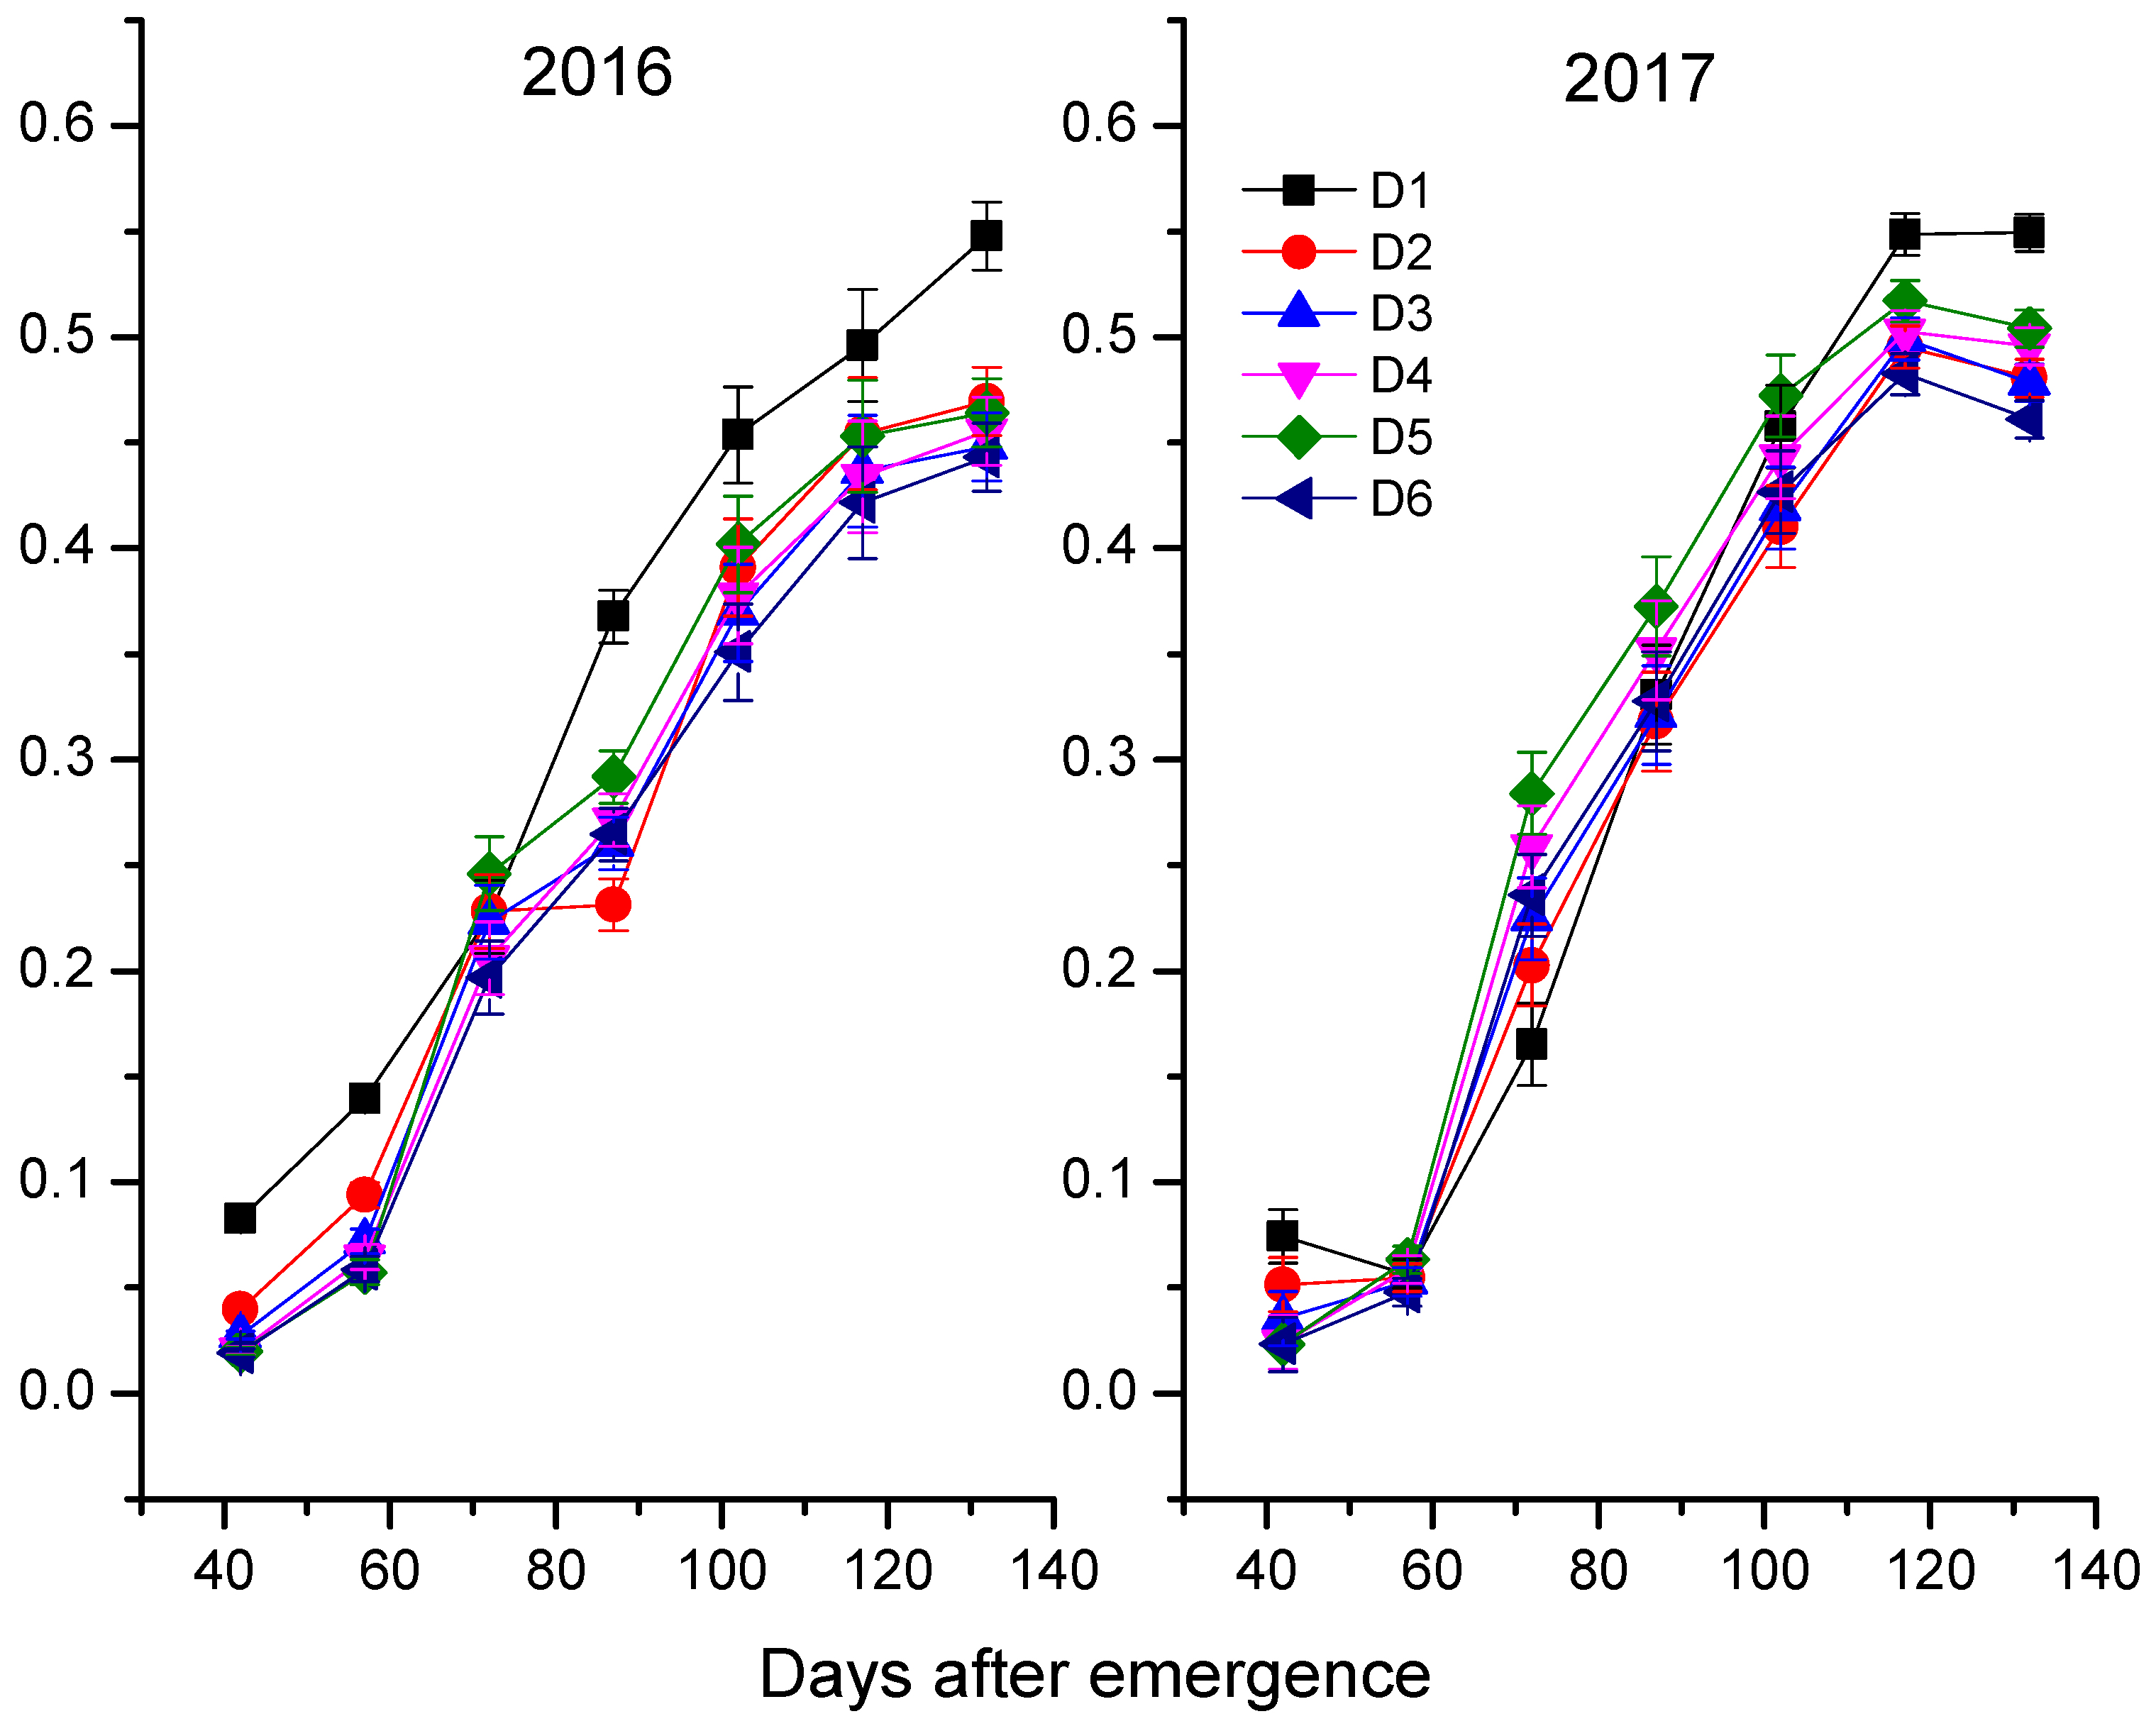
The ratio of dry weight of reproductive organs to plant biomass (DWRO/PB) also affected the yield of cotton [40]. In this study, the highest ratio was obtained in the lowest plant density D1 as compared to other treatments which showed less differences. Similar results were previously obtained by Dai et al. [
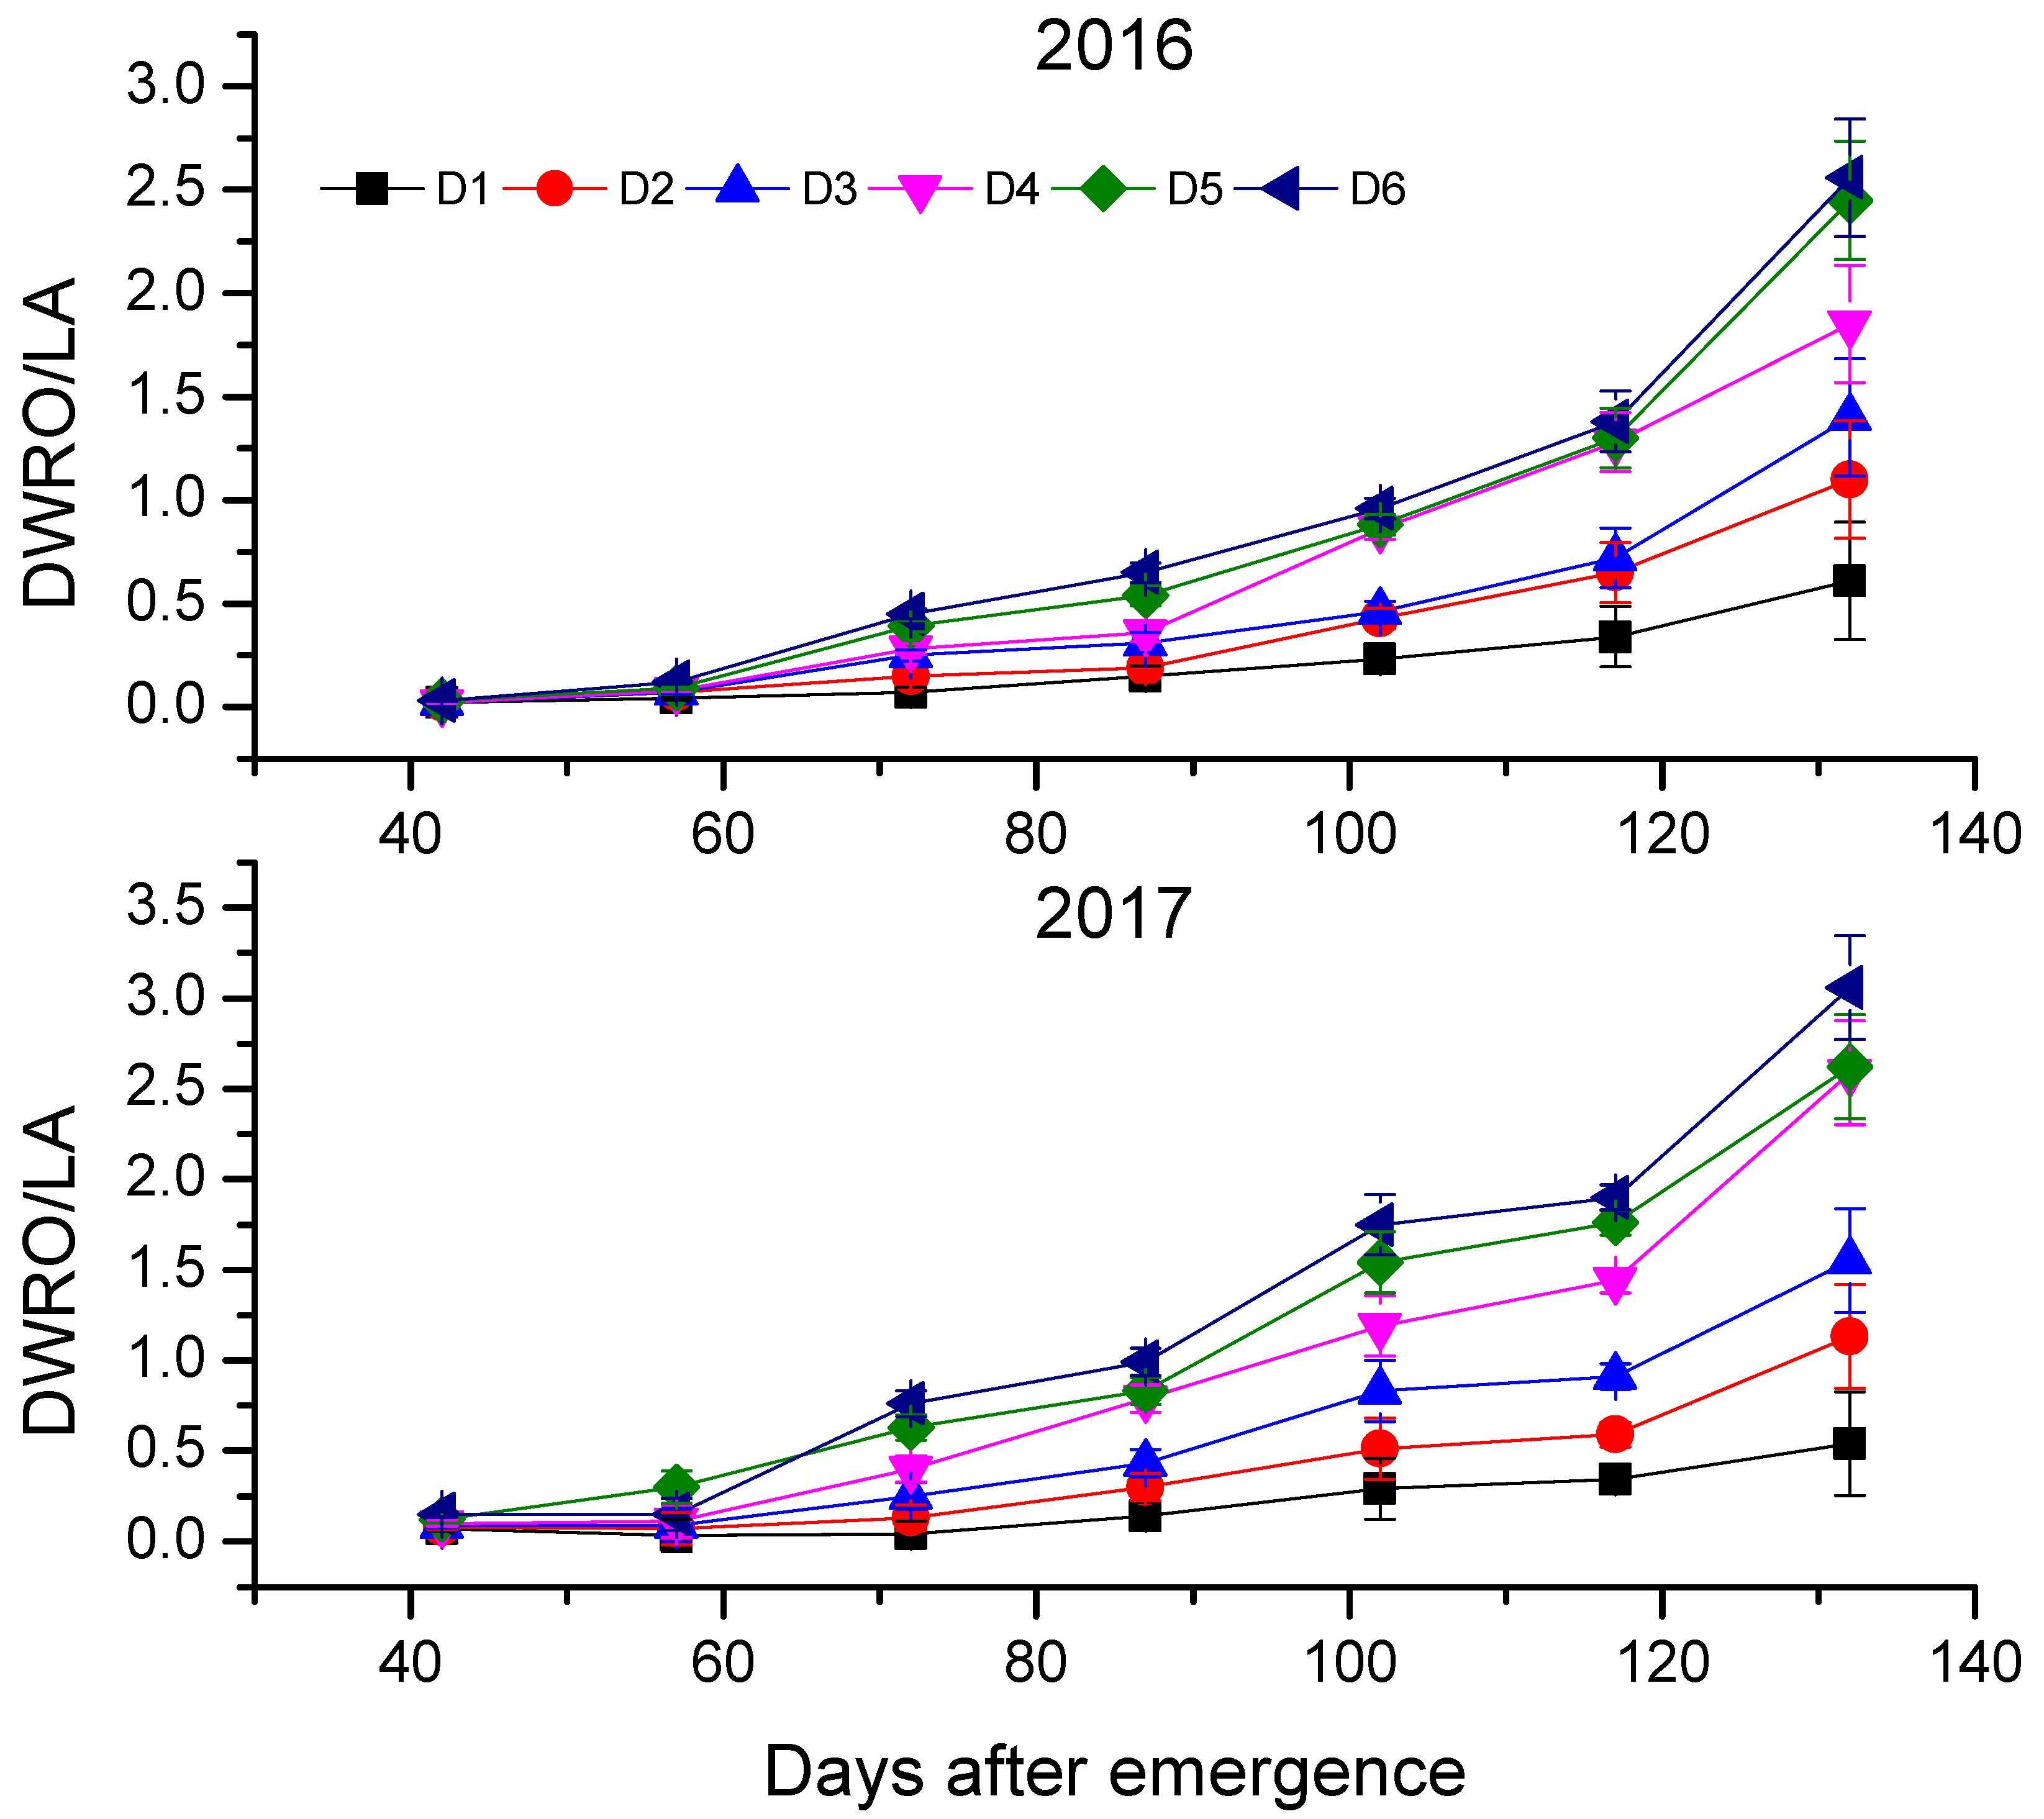
37], who also reported high DWRO/PB in the lowest density. Boll load is also an important indicator of lint yield. In this study, a high and significant ratio of dry weight of reproductive organs per leaf area (DWRO/LA) was observed in high plant densities (D4–D6), mostly in the late growth stages. Our results are supported by Dong et al. [30], where high boll load led to an increase in leaf senescence and a decrease in cotton yield and quality. The high DWRO/LA in late growth stages is due to high competition for nutrients and assimilates between vegetative and reproductive growth after the bloom stage [40].
Leaf area index is an important factor that affects biomass production of cotton [41]. LAI is also one of the physiological parameters which determine crop yield and predict crop production up to some extent. For obtaining high yield, it is necessary to maintain optimum LAI for more light penetration and high light use efficiency, mostly at late growth stages: that is, the flowering and boll setting stages [22].
Cotton fiber is the extension of seed epidermal cells. Fiber quality indicators are affected by plant density and environmental factors [10]. In the present study, cotton fiber indicators were significantly affected by plant density. Low plant density had high strength and micronaire value as compared to high plant density, while the length of low plant density is shorter as compared to high and moderate plant density. Our results are in agreement with previous research that have reported high strength and micronaire and short fiber length at low planting density [5,33]. The lower fiber quality at high planting density may be due to less photosynthesis, which reduces carbohydrate supply for fiber formation. For obtaining good quality fiber, cultivar selection is of great importance, while managing plant populations to maintain genetic potential is the secondary part [42,43].
Economic benefit plays an important role in the success of agriculture business. In the Yellow River Valley, due to fast urbanization, high labor costs and a shortage of labor have become a challenge to traditional intensive cotton production [2]. Labor cost specifically affects the profitability of the cotton crop. High density has less vegetative branches as compared to high plant density, which needs less labor for vegetative branch removal and other field management.

5. Conclusions

In the present study, planting density positively affected yield, fiber quality, and dry matter accumulation and partitioning of cotton crop under equidistant row arrangement. Optimum or moderate plant density (8.7 plants m−2) resulted in high reproductive organ biomass accumulation at later growth stages as compared to other treatments. More reproductive organ biomass accumulation in this density increased the yield of cotton. Good quality fiber was obtained at low and moderate plant densities as compared to higher ones. In conclusion, 8.7 plants m−2 is regarded to be an optimum plant density in term of high yield, uniform fiber quality, and dry matter accumulation. The finding of this research offers an alternative to cotton growers who use conventionally wider rows and lower plant population ha−1.

Author Contributions

Y.L. and Z.W. designed the experiment. W.D., S.X., M.X. and H.C. conducted the experiment. Y.L., F.X. and G.W. helped and provided useful suggestions during experiment. N.K. processed and analyzed data and wrote first draft. Y.L. and L.F. revised and edited the manuscript. All authors have read and agreed to the published version of the manuscript.

Funding

We are thankful for the financial support by National Natural Science Foundation of China (31601264). The funder had no role in design, data collection and decision to publish or preparation of manuscript.

Acknowledgments

We highly acknowledge the help of technicians of the research station of institute of cotton research Chinese Academy of agricultural sciences.

Conflicts of Interest

The authors declare no conflict of interest.

References

  1. Constable, G.A.; Bange, M.P. The yield potential of cotton (Gossypium hirsutum L.). Field Crops Res. 2015, 182, 98–106. [Google Scholar] [CrossRef]
  2. Dai, J.; Dong, H. Field Crops Research Intensive cotton farming technologies in China: Achievements, challenges and countermeasures. Field Crops Res. 2014, 155, 99–110. [Google Scholar] [CrossRef] [Green Version]
  3. Zhang, H.; Tian, W.; Zhao, J.; Jin, L.; Yang, J.; Liu, C.; Yang, Y.; Wu, S.; Wu, K.; Cui, J.; et al. Diverse genetic basis of field-evolved resistance to Bt cotton in cotton bollworm from China. Proc. Natl. Acad. Sci. USA 2012, 109, 10275–10280. [Google Scholar] [CrossRef] [PubMed] [Green Version]
  4. Bednarz, C.W.; Nichols, R.L.; Brown, S.M. Plant density modifications of cotton within-boll yield components. Crop Sci. 2006, 46, 2076–2080. [Google Scholar] [CrossRef] [Green Version]
  5. Zhi, X.Y.; Han, Y.C.; Li, Y.B.; Wang, G.P.; Du, W.L.; Li, X.X.; Mao, S.C.; Lu, F.E. Effects of plant density on cotton yield components and quality. J. Integr. Agric. 2016, 15, 1469–1479. [Google Scholar] [CrossRef] [Green Version]
  6. Siebert, J.; Stewart, A. Influence of Plant Density on Cotton Response to Mepiquat Chloride Application. Agron. J. 2006, 98, 1634–1639. [Google Scholar] [CrossRef]
  7. Bednarz, C.W.; Bridges, D.C.; Brown, S.M. Analysis of cotton yield stability across population densities. Agron. J. 2000, 92, 128–135. [Google Scholar] [CrossRef]
  8. Dong, H.; Li, W.; Eneji, A.E.; Zhang, D. Nitrogen rate and plant density effects on yield and late-season leaf senescence of cotton raised on a saline field. Field Crops Res. 2012, 126, 137–144. [Google Scholar] [CrossRef]
  9. Yang, G.; Tang, H.; Nie, Y.; Zhang, X. Responses of cotton growth, yield, and biomass to nitrogen split application ratio. Eur. J. Agron. 2011, 35, 164–170. [Google Scholar] [CrossRef]
  10. Khan, A.; Kong, X.; Najeeb, U.; Zheng, J.; Kean, D.; Tan, Y.; Akhtar, K.; Munsif, F.; Zhou, R. Planting Density Induced Changes in Cotton Biomass Yield, Fiber Quality, and Phosphorus Distribution under Beta Growth Model. Agronomy 2019, 9, 500. [Google Scholar] [CrossRef] [Green Version]
  11. Wingler, A.; Purdy, S.; MacLean, J.A.; Pourtau, N. The role of sugars in integrating environmental signals during the regulation of leaf senescence. J. Exp. Bot. 2006, 57, 391–399. [Google Scholar] [CrossRef] [Green Version]
  12. Marcelis, L.F.M.; Heuvelink, E.; Baan Hofman-Eijer, L.R.; Den Bakker, J.; Xue, L.B. Flower and fruit abortion in sweet pepper in relation to source and sink strength. J. Exp. Bot. 2004, 55, 2261–2268. [Google Scholar] [CrossRef] [Green Version]
  13. Khan, A.; Najeeb, U.; Wang, L.; Tan, D.K.Y.; Yang, G.; Munsif, F.; Ali, S.; Hafeez, A. Planting density and sowing date strongly influence growth and lint yield of cotton crops. Field Crops Res. 2017, 209, 129–135. [Google Scholar] [CrossRef]
  14. Kaggwa-Asiimwe, R.; Andrade-Sanchez, P.; Wang, G. Plant architecture influences growth and yield response of upland cotton to population density. Field Crops Res. 2013, 145, 52–59. [Google Scholar] [CrossRef]
  15. Mariscal, M.J.; Orgaz, F.; Villalobos, F.J. Modelling and measurement of radiation interception by olive canopies. Agric. For. Meteorol. 2000, 100, 183–197. [Google Scholar] [CrossRef]
  16. Galanopoulou-Sendouka, S.; Sficas, A.G.; Fotiadis, N.A.; Gagianas, A.A.; Gerakis, P.A. Effect of Population Density, Planting Date, and Genotype on Plant Growth and Development of Cotton1. Agron. J. 1980, 72, 347. [Google Scholar] [CrossRef]
  17. Sarlikioti, V.; De Visser, P.H.B.; Marcelis, L.F.M. Exploring the spatial distribution of light interception and photosynthesis of canopies by means of a functionalstructural plant model. Ann. Bot. 2011, 107, 875–883. [Google Scholar] [CrossRef] [PubMed] [Green Version]
  18. Mao, L.; Zhang, L.; Zhao, X.; Liu, S.; van der Werf, W.; Zhang, S.; Spiertz, H.; Li, Z. Crop growth, light utilization and yield of relay intercropped cotton as affected by plant density and a plant growth regulator. Field Crops Res. 2014, 155, 67–76. [Google Scholar] [CrossRef]
  19. Tetio-Kagho, F.; Gardner, F.P. Responses of Maize to Plant Population Density. I. Canopy Development, Light Relationships, and Vegetative Growth. Agron. J. 1988, 80, 930. [Google Scholar] [CrossRef]
  20. Xu, W.; Liu, C.; Wang, K.; Xie, R.; Ming, B.; Wang, Y.; Zhang, G.; Liu, G.; Zhao, R.; Fan, P.; et al. Adjusting maize plant density to different climatic conditions across a large longitudinal distance in China. Field Crops Res. 2017, 212, 126–134. [Google Scholar] [CrossRef]
  21. Srinivasan, V.; Kumar, P.; Long, S.P. Decreasing, not increasing, leaf area will raise crop yields under global atmospheric change. Glob. Chang. Biol. 2017, 23, 1626–1635. [Google Scholar] [CrossRef] [PubMed] [Green Version]
  22. Flénet, F.; Kiniry, J.R.; Board, J.E.; Westgate, M.E.; Reicosky, D.C. Row spacing effects on light extinction coefficients of corn, sorghum, soybean, and sunflower. Agron. J. 1996, 88, 185–190. [Google Scholar] [CrossRef]
  23. Chen, Z.; Niu, Y.; Zhao, R.; Han, C.; Han, H.; Luo, H. The combination of limited irrigation and high plant density optimizes canopy structure and improves the water use efficiency of cotton. Agric. Water Manag. 2019, 218, 139–148. [Google Scholar] [CrossRef]
  24. Baytar, A.A.; Peynircioğlu, C.; Sezener, V.; Basal, H.; Frary, A.; Frary, A.; Doğanlar, S. Identification of stable QTLs for fiber quality and plant structure in Upland cotton (G. hirsutum L.) under drought stress. Ind. Crops Prod. 2018, 124, 776–786. [Google Scholar] [CrossRef]
  25. Zhang, D.; Luo, Z.; Liu, S.; Li, W.; Dong, H. Effects of deficit irrigation and plant density on the growth, yield and fiber quality of irrigated cotton. Field Crops Res. 2016, 197, 1–9. [Google Scholar] [CrossRef]
  26. Khan, N.; Han, Y.; Xing, F.; Feng, L.; Wang, Z.; Wang, G. Plant Density Influences Reproductive Growth, Lint Yield and Boll Spatial Distribution of Cotton. Agronomy 2019, 10, 14. [Google Scholar] [CrossRef] [Green Version]
  27. Xia, Y.Q. A probe into planting density for cotton high yielding. Xinjiang Agric. Sci. 2008, 45, 70–71. [Google Scholar]
  28. Dong, H.; Li, Z.; Tang, W.; Zhang, D. Evaluation of a Production System in China that Uses Reduced Plant Densities and Retention of Vegetation Branches. J. Cotton Sci. 2005, 9, 1–9. [Google Scholar]
  29. Dong, H.Z.; Li, W.J.; Tang, W.; Li, Z.H.; Zhang, D.M. Crop/Stress Physiology Effects of Genotypes and Plant Density on Yield, Yield Components and Photosynthesis in Bt Transgenic Cotton. J. Agron. Crop Sci. 2006, 139, 132–139. [Google Scholar] [CrossRef]
  30. Dong, H.; Li, W.; Tang, W.; Li, Z.; Zhang, D.; Niu, Y. Yield, quality and leaf senescence of cotton grown at varying planting dates and plant densities in the Yellow River Valley of China. Field Crops Res. 2006, 98, 106–115. [Google Scholar] [CrossRef]
  31. Wang, R.Q.; Pang, C.Q.; Yang, G.Z. Effect of NPK fertilizer and density on cotton lint yield. China Cott. 2009, 36, 8–12. [Google Scholar]
  32. Ali, M.; Ali, L.; Sattar, M. Response of seed cotton yield to various plant populations and planting methods. J. Agric. Res. 2010, 48, 163–169. [Google Scholar]
  33. Mao, L.; Zhang, L.; Evers, J.B.; van der Werf, W.; Liu, S.; Zhang, S.; Wang, B.; Li, Z. Yield components and quality of intercropped cotton in response to mepiquat chloride and plant density. Field Crops Res. 2015, 179, 63–71. [Google Scholar] [CrossRef]
  34. Tiwari, R.S.; Picchioni, G.A.; Steiner, R.L.; Jones, D.C.; Hughs, S.E.; Zhang, J. Genetic variation in salt tolerance at the seedling stage in an interspecific backcross inbred line population of cultivated tetraploid cotton. Euphytica 2013, 194, 1–11. [Google Scholar] [CrossRef]
  35. Jones, M.A.; Wells, R. Dry matter allocation and fruiting patterns of cotton grown at two divergent plant populations. Crop Sci. 1997, 37, 797–802. [Google Scholar] [CrossRef]
  36. Boquet, D. Cotton in Ultra-Narrow Row Spacing: Plant Density and Nitrogen Fertilizer Rates. Agron. J. 2005, 97, 279–287. [Google Scholar] [CrossRef]
  37. Dai, J.; Li, W.; Tang, W.; Zhang, D.; Li, Z.; Lu, H.; Eneji, A.E.; Dong, H. Manipulation of dry matter accumulation and partitioning with plant density in relation to yield stability of cotton under intensive management. Field Crops Res. 2015, 180, 207–215. [Google Scholar] [CrossRef]
  38. Brodrick, R.; Bange, M.P.; Milroy, S.P.; Hammer, G.L. Physiological determinants of high yielding ultra-narrow row cotton: Biomass accumulation and partitioning. Field Crops Res. 2012, 134, 122–129. [Google Scholar] [CrossRef]
  39. Darawsheh, M.K.; Chachalis, D.; Aivalakis, G.; Khah, E.M. Cotton row spacing and plant density cropping systems. II. Effects on seedcotton yield, boll components and lint quality. J. Food Agric. Environ. 2009, 7, 262–265. [Google Scholar]
  40. CRI (Cotton Research Institute Chinese Academy of Agricultural Sciences). Cultivation of Cotton in China; Shanghai Science and Technology Press: Shanghai, China, 2013. [Google Scholar]
  41. Tsimba, R.; Edmeades, G.; Millner, J.; Kemp, P. The effect of planting date on maize grain yields and yield components. Field Crops Res. 2013, 150, 135–144. [Google Scholar] [CrossRef]
  42. Bednarz, C.W.; Shurley, W.D.; Anthony, W.S.; Nichols, R. Yield, quality, and profitability of cotton produced at varying plant densities. Agron. J. 2005, 97, 235–240. [Google Scholar]
  43. Ragsdale, P.I.; Smith, C.W. Germplasm potential for trait improvement in upland cotton: Diallel analysis of within-boll seed yield components. Crop Sci. 2007, 47, 1013–1017. [Google Scholar] [CrossRef]
Figure 1. Monthly average air temperature and relative humidity in the 2016 and 2017 growing seasons.
Agronomy 10 00232 g001
Figure 2. Vegetative organ biomass accumulation (A,D), reproductive organ biomass accumulation (B,E), and total organ biomass accumulation (C,F) of 2016 and 2017 cotton growing seasons.
Agronomy 10 00232 g002
Figure 3. Ratio of dry weight of reproductive organs to plant biomass (DWRO/PB) in 2016 and 2017 growing seasons.
Agronomy 10 00232 g003
Figure 4. Ratio of dry weight of reproductive organs per leaf area (DWRO/LA) in 2016 and 2017 growing seasons.
Agronomy 10 00232 g004
Figure 5. Leaf area index of cotton at different planting densities in 2016 and 2017.
Agronomy 10 00232 g005
Table 1. Comparison of boll m−2 and boll weight (g) at various plant densities in 2016 and 2017 in the cotton growing season.
TreatmentBoll (m2)Boll Weight (g)
Year 2016
Plant Density (PD)
D164.3f6.2a
D272.7e5.8a
D382.4d5.7a
D490.1c5.7a
D599b5.7a
D6104.4a5.6a
Year 2017
Plant Density (PD)
D146.5e6a
D251.3d6a
D359.5c5.9a
D464.4b5.9a
D575.7a5.7ab
D666.4b5.6b
ANOVA
Y0.15090.3616
D0.00610.5045
Y × D0.0001<0.0001
Means followed by the same letters within the same category are statistically similar according to Duncan’s multiple range test at p < 0.05.
Table 2. Comparison of seed cotton and lint yield of various plant densities in 2016 and 2017 in the cotton growing season.
TreatmentSeed Cotton Yield (kg ha−1)Lint Yield (kg ha−1)Lint Percentage (%)
D13258e1389e42.8a
D23598d1490d41.6ab
D33989c1574c39.5bc
D44304b1669b38.8c
D54662a1763a37.9c
D64259b1609bc37.8c
ANOVA
Y0.0008<0.00010.8173
D0.00050.00020.0700
Y × D0.18270.77460.2969
Means followed by the same letters within the same category are statistically similar according to Duncan’s multiple range test at p < 0.05.
Table 3. Analysis of variance for the effect of year (Y) and plant density (PD) on biomass accumulation.
Source42 DAE57 DAE72 DAE87 DAE102 DAE117 DAE132 DAE
Fp-ValueFp-valueFp-ValueFp-ValueFp-ValueFp-ValueFp-Value
VOB
Y9.8080.02652.9450.0011.4850.2770.1260.7378.8590.03113.9830.01321.4220.006
D18.0480.00310.9690.01029.0710.00180.4600.00024.9080.00216.8790.00414.0330.006
Y × D4.4210.00714.299<0.00015.6520.0021.7100.17814.539<0.000127.077<0.000121.498<0.0001
ROB
Y39.2830.00214.1000.01315.2110.01131.2270.00319.7090.0071.3600.29627.3050.003
D5.1360.0483.5050.09754.7300.00020.0540.003140.225<0.000161.4400.00025.1620.001
Y × D2.8780.0415.8080.0021.8420.1504.1770.0090.5880.7090.8800.5136.9750.001
CPB
Y10.2140.02450.0510.0016.4040.052108.1920.0005.0920.0745.8020.06123.8510.005
D17.7330.00310.4360.01167.9430.000602.531<0.0001103.482<0.000126.5730.00117.4840.003
Y × D4.4920.00713.345<0.00013.0510.0330.5010.7723.9560.01211.936<0.000133.702<0.0001
Table 4. Regression of cotton plant biomass accumulation at growing seasons 2016 and 2017.
ItemsTreatmentRegression EquationR2
Cotton plant biomass (2016)D1Y = 697.81055/(1 + 348.84488e−0.06161t)0.9925 ***
D2Y = 1011.12157/(1 + 310.52754e−0.06365t)0.9909 ***
D3Y = 1302.14044/(1 + 174.95064e−0.05567t)0.9878 ***
D4Y = 1435.81604/(1 + 134.01637e−0.05418t)0.9783 ***
D5Y = 1575.89801/(1 + 138.95428e−0.05546t)0.9844 ***
D6Y = 1594.84306/(1 + 111.53485e−0.05384t)0.9741 ***
Vegetative organ biomassD1Y = 295.33909/(1 + 298.23496e−0.06989t)0.9879 ***
D2Y = 484.50669/(1 + 743.27663e−0.08699t)0.9796 ***
D3Y = 651.12066/(1 + 143.02059e−0.06253t)0.9782 ***
D4Y = 701.83792/(1 + 131.19935e−0.06514t)0.9569 ***
D5Y = 773.54645/(1 + 108.47096e−0.06237t)0.9738 ***
D6Y = 807.8694/(1 + 122.95547e−0.06699t)0.9549 ***
Reproductive organ biomassD1Y = 403.53388/(1 + 1096.07473e−0.06673t)0.9918 ***
D2Y = 494.27754/(1 + 2706.97502e−0.07808t)0.9956 ***
D3Y = 591.54947/(1 + 1594.68086e−0.07241t)0.9943 ***
D4Y = 668.08731/(1 + 1195.61028e−0.07009t)0.9946 ***
D5Y = 741.0549/(1 + 1078.67833e−0.07091t)0.9915 ***
D6Y = 734.4757/(1 + 978.71309e−0.06826t)0.9929 ***
Cotton plant biomass (2017)D1Y = 648.96068/(1 + 258.79492e−0.06442t)0.9936 ***
D2Y = 838.50226/(1 + 150.01915e−0.06353t)0.9886 ***
D3Y = 951.32332/(1 + 103.58331e−0.06163t)0.9857 ***
D4Y = 1070.21853/(1 + 83.38347e−0.05897t)0.9918 ***
D5Y = 1144.95086/(1 + 95.96115e−0.06213t)0.9936 ***
D6Y = 1165.41818/(1 + 74.52055e−0.05987t)0.9938 ***
Vegetative organ biomassD1Y = 268.83729/(1 + 327.895e−0.08594t)0.9911 ***
D2Y = 404.49245/(1 + 299.20271e−0.0908t)0.9883 ***
D3Y = 460.00848/(1 + 292.09854e−0.09749t)0.9855 ***
D4Y = 505.9789/(1 + 101.20589e−0.08053t)0.9898 ***
D5Y = 534.94333/(1 + 88.38951e−0.07954t)0.9911 ***
D6Y = 586.38098/(1 + 97.73996e−0.08321t)0.9890 ***
Reproductive organ biomassD1Y = 354.07086/(1 + 8856.53541e−0.09421t)0.9938 ***
D2Y = 415.62152/(1 + 2397.24183e−0.08411t)0.9860 ***
D3Y = 473.372/(1 + 1661.97624e−0.08182t)0.9825 ***
D4Y = 539.06687/(1 + 1185.99181e−0.07956t)0.9877 ***
D5Y = 582.96854/(1 + 1712.18326e−0.08643t)0.9869 ***
D6Y = 548.10109/(1 + 1929.68342e−0.08696t)0.9867 ***
***, significant at the 0.001 probability level.
Table 5. Eigen values of cotton biomass accumulation at growing season 2016.
ItemsTreatmentFast Accumulation PeriodFastest Accumulation Point
t1 (DAE)t2 (DAE)∆t (d)VA (gm m−2 d−1)VM (gm m−2 d−1)at DAE
Cotton plant biomassD173.7116.442.89.410.795.0
D269.5110.841.414.116.190.2
D369.1116.447.315.918.192.8
D466.1114.748.617.119.490.4
D565.2112.747.519.221.889.0
D663.1112.048.918.821.587.6
Average67.8113.946.115.718.090.8
Vegetative organ biomassD162.7100.437.74.55.281.5
D260.991.130.39.210.576.0
D358.3100.442.18.910.279.4
D454.695.140.410.011.474.9
D554.096.342.210.612.175.1
D652.291.539.311.913.571.8
Average57.195.838.79.210.576.5
Reproductive organ biomassD185.2124.639.55.96.7104.9
D284.4118.133.78.59.6101.2
D383.7120.036.49.410.7101.8
D482.3119.937.610.311.7101.1
D579.9117.137.111.513.198.5
D681.6120.238.611.012.5100.9
Average82.8120.037.19.410.7101.4
t1 is the starting and t2 is the termination point of the fast accumulation period (FAP). ∆t is the total duration of FAP. VA is the average and VM is the maximum rate of biomass accumulation during FAP. DAE represents days after emergence.
Table 6. Eigen values of cotton biomass accumulation at growing season 2017.
ItemsTreatmentFast Accumulation PeriodFastest Accumulation Point
t1 (DAE)t2 (DAE)∆t (d)VA (gm m−2 d−1)VM (gm m−2 d−1)at DAE
Cotton plant biomassD165.8106.740.99.210.586.2
D258.199.641.511.713.378.9
D353.996.742.712.914.775.3
D452.797.344.713.815.875.0
D552.394.742.415.617.873.5
D650.094.044.015.317.472.0
Average55.598.242.713.114.976.8
Vegetative organ biomassD152.182.730.65.15.867.4
D248.377.329.08.19.262.8
D344.771.727.09.811.258.2
D441.073.732.78.910.257.3
D539.872.933.19.310.656.3
D639.270.931.710.712.255.1
Average44.274.930.78.69.959.5
Reproductive organ biomassD182.5110.528.07.38.396.5
D276.9108.231.37.78.792.5
D374.5106.732.28.59.790.6
D472.4105.533.19.410.789.0
D570.9101.430.511.012.686.1
D671.9102.130.310.411.987.0
Average74.8105.730.99.110.390.3
t1 is the starting and t2 is the termination point of fast accumulation period (FAP). ∆t is the total duration of FAP. VA is the average and VM is the maximum rate of biomass accumulation during FAP. DAE represents days after emergence.
Table 7. Analysis of variance for the effect of year (Y) and plant density (PD) on dry matter partitioning.
Source42 DAE57 DAE72 DAE87 DAE102 DAE117 DAE132 DAE
Fp-ValueFp-ValueFp-ValueFp-ValueFp-ValueFp-ValueFp-Value
Y9.3710.0283.7690.1100.1780.6918.5960.03315.6020.011205.7640.000013.1130.015
D64.2000.00001.0090.4961.1120.4551.4150.3563.2310.11223.3950.00218.2300.003
Y × D0.5910.70726.3560.0005.7200.0026.1890.0011.9040.1390.2490.9351.4980.235
Table 8. Analysis of variance for the effect of year (Y) and plant density (PD) on boll load.
Source42 DAE57 DAE72 DAE87 DAE102 DAE117 DAE132 DAE
Fp-ValueFp-ValueFp-ValueFp-ValueFp-ValueFp-ValueFp-Value
Y59.2100.0011.9840.2183.3920.1259.4910.0279.9090.0254.7920.0804.1610.097
D1.9020.2492.0380.2278.9390.0169.6280.0138.7250.01620.3580.00232.8060.001
Y × D5.2080.0031.5650.2156.9460.0017.1860.0015.6310.0024.3000.0081.1380.373
Table 9. Analysis of variance for the effect of year (Y) and plant density (PD) on leaf area index.
Source42 DAE57 DAE72 DAE87 DAE102 DAE117 DAE132 DAE
Fp-ValueFp-ValueFp-ValueFp-ValueFp-ValueFp-ValueFp-Value
Y25.0010.00415.0400.0120.4130.5490.0300.8692.0680.2107.0160.04512.4210.017
D5.5910.04116.2890.00420.7850.00237.8730.00176.8690.00020.4440.00228.8310.001
Y × D7.6780.0001.5730.2131.2370.3290.8960.5031.0320.4263.1750.0290.6350.676
Table 10. Comparison of fiber quality parameters of various densities of growing seasons 2016 and 2017.
TreatmentLengthStrength ElongationUniformity IndexMicroniare
(mm)(cN/tex)(%)(%)
D128.86c31.26a6.40a84.77b5.33a
D229.40bc30.97ab6.28a84.83b4.93b
D329.52bc30.10b6.25a85.17ab4.83bc
D429.82b29.10c6.24a85.47ab4.80bc
D530.63a28.80c6.20a86.07a4.70c
D630.60a28.33c6.22a85.53ab4.63c
ANOVA
Y0.11700.07980.0000<0.00010.0001
D0.80300.00010.51640.01090.0007
Y × D0.06140.97760.44470.92680.8639
Means followed by the same letters within the same category are statistically similar according to Duncan’s multiple range test at p < 0.05.
Table 11. Cotton yield, production cost, and net returns of 2016 and 2017.
TreatmentLint YieldReturns from CottonProduction CostNet Returns
Kg ha−1USD ha−1USD ha−1USD ha−1
20162017201620172016201720162017
D1145913203040270524292389611316
D2158813913310285023252257985593
D31685146335102998229722591213739
D41762157636713230226922321402998
D518431683384034492090205617501393
D61726149335893061213721021452959
Production cost includes fertilizer, seed, and labor cost. Labor cost includes labor for planting, management, and harvesting. One labor unit per day cost was 6.02 USD in 2016 and 5.92 USD in 2017. Wholesale lint price of 1 kg was 2.08 USD in 2016 and 2.05 USD in 2017. Values were converted from Chinese Yuan to USD according to the official rate (USD 1 = 6.65 yuan in 2016 and 6.76 yuan in 2017).

