Article

Genotype by Location Effects on Yield and Seed Nutrient Composition of Common Bean

1
Department of Agronomy, Iowa State University, Agronomy Hall, Ames, IA 50011, USA
2
Plant Soil and Microbial Sciences Department, Michigan State University, East Lansing, MI 48824, USA
3
Department of Soil and Crop Sciences, Colorado State University, Fort Collins, CO 80523-1173, USA
*
Authors to whom correspondence should be addressed.
Submission received: 23 January 2020 / Revised: 19 February 2020 / Accepted: 26 February 2020 / Published: 3 March 2020

Abstract

:
Common bean (Phaseolus vulgaris L.) is an important staple food crop in households worldwide. Genotype and location influence phenotypic nutrient composition. However, there are limited data on the magnitude of this variation for common bean yield and nutritive value. The objective of this study was to determine the effect of location on yield and seed nutritional composition. Four globally important varieties (dark red kidney/‘Montcalm’, great northern /‘Taurus’, black /‘Eclipse’ and yellow Mayocoba/‘MY06326’) were planted for two years in four locations (Iowa, Colorado, Michigan, in the USA, and Masaka, Uganda). Yield and seed weight differed among locations and varieties. Yield in Colorado and Michigan was 42% and 56% higher than in Iowa and 76% and 81% greater than in Uganda, respectively. Eclipse had greater yield than Taurus (6%), MY06326 (16%), and Montcalm (35%). Concentration of P, K, Mg, S, and crude protein (CP) differed among varieties. Montcalm had 18%, 7%, and 4% greater P concentration and 13%, 9%, and 5% greater CP than Eclipse, MY06326 and Taurus, respectively. The location × variety interaction was significant only for seed Zn concentration. Despite differences in edaphic factors among locations, elemental concentrations other than Zn were comparatively stable among locations. Stability in seed elemental concentrations across locations and environments is important knowledge for better understanding human nutrition and malnutrition.

1. Introduction

Common bean (Phaseolus vulgaris L.) is one of the most important and oldest cultivated crops worldwide. The vital cultural and economic role of common bean is evident in its widespread consumption and use as a cash crop for income generation. Fifty percent of all grain legumes consumed worldwide are common beans [1]. Common bean is a major protein source for humans in many Latin American and East African countries, including Brazil, Mexico, Rwanda and Uganda [2]. Unfortunately, common bean per capita consumption in sub-Saharan Africa has remained stagnant for the last three decades [1]. Like other legumes, most varieties of common bean have greater concentrations of iron and zinc than cereals. These nutrients are retained throughout harvesting and processing unlike losses that occur with milled grains [3]. Common bean is also a nitrogen fixer, highly adaptable and productive in a wide range of environments. The crop is a highly profitable cash crop [1,2]. Many national bean research programs have invested in continuous development and release of high-yield, drought-resilient, disease-resistant, and nutrient-dense common bean cultivars [2].
Common bean is indigenous to the Americas. Germplasm is classified into two gene pools (Andean and Middle American) and three races within each gene pool [4]. Larger seeded commercial market classes including dark red kidney, Peruvian, white kidney and cranberry beans belong to the Andean gene pool [4]. Mesoamerican races, Durango, and Jalisco belong to the Middle American gene pool, which tends to have small to medium-sized seeds, and includes the market classes of great northern, black, pinto, small red, navy, and pink [4].
The influence of location on common bean yield and grain elemental composition is not well defined, nor are the implications that these variations have on human nutrition. In other grain legumes, such as chickpeas (Cicer arietinum L.), genotype-by-environment interactions were shown to impact grain nutritional traits, including fatty acids and tocopherols [5], and processing traits, such as de-hulling efficiency and seed splitting [6]. In common bean, iron and zinc content and concentration in the seed are influenced by both genotype and environment [2]. For instance, high-zinc seeds grown in zinc-deficient soils produce seed with lower Zn concentrations [7]. Graham also emphasized the role of plant genes in nutrient uptake from the soil and transport within the plant to the seed and loading traits [8]. Some plants have the potential to modify their rhizosphere to enhance micronutrient availability and uptake by excretion of H+ ions or organic acids [9]. The strategy of common bean particularly enables the crop to acquire nutrients from the soil by rhizosphere acidification, using iron reductase to reduce iron and an iron transporter for mineral cross-membrane root uptake [10].
Although seeds store nutrients to enable embryo growth for the next generation, those nutrients are essential to sustain root growth and thereafter, roots should have enough absorbing surface to acquire soil nutrients to supply and meet growing plant needs [7]. In nutrient-deficient soils, plants have difficulties in storing adequate nutrients in the seeds [7]. Differences in yield, seed nutritional and anti-nutritional compound concentrations, and cooking characteristics in common bean are attributable to differences in genotype and environmental factors, especially soil characteristics. Soil chemical and physical properties, including pH and organic matter, showed significant effects on nutrient solubility and root absorption of nutrients [9,11,12]. For instance, a 30- to 45-fold decrease in Zn concentration in soil solution was reported for every unit increase in soil pH between 5.5 to 7.0 [9]. Such increases in soil pH were also associated with subsequent decreases in Zn concentration in plant tissues [9,13]. Therefore, the potential for crops to acquire soil nutrients and accumulate those nutrients in edible parts are influenced by the genotype and environment in which they are grown, and the interaction of genotype with environment or location.
The effect of environment/soil (location) and genotype interactions on nutritional composition of plant edible parts manifests itself in human nutrient deficiencies. For instance, widespread Zn deficiency in humans is typical in regions of the world where soils are Zn-deficient [12]. The combination of mineral fertilizer, organic inputs and improved germplasm are therefore encouraged as Integrated Soil Fertility Management [14]. In the USA, common bean types are each given a single concentration for each element without regard for potential differences due to production location [15]. Previous research has not been conclusive on the stability of common bean seed elemental composition. The objective of our study was to determine the effect of location on yield and seed nutritional composition in four genotypes of common bean.

2. Materials and Methods

2.1. Experiment Locations and Site Descriptions

In 2017 and 2018, field trials were conducted in Iowa, Colorado, and Michigan, USA, and in Masaka, Uganda. In Iowa, the field trials were located on The Iowa State University Sorenson Farm (42°00′35.7″ N, 93°44′47.1″ W) site near Boone. As is customary in Iowa, these fields are drained by ditches and underground perforated pipes due to otherwise slow natural drainage [16]. The area receives an average of 974 mm of annual rainfall [17]. Soil samples were collected from 0–30 cm before planting and analyzed for pH, nitrate, available P and K (Mehlich-3), and organic matter (Soil and Plant Analysis Laboratory, Iowa State University). The predominant soils at the Sorenson Farm were Canisteo loam (Fine-loamy, mixed, superactive, mesic Typic Hapludolls) [18]. There was no known production history of common beans on this farm.
The field trials at Colorado State University ARDEC Farm (40°38′59.35″ N, 104°59′49.33″ W) were located near Fort Collins, Colorado, USA. The farm receives on average 408 mm of annual rainfall [17]. Soil samples were collected before planting and analyzed (American Agricultural Laboratory, Nebraska) for pH and other nutrients to determine the appropriate fertilizer recommendations for bean production [19]. The predominant soils at the site were Fort Collins loam (Fine-loamy, mixed, mesic Aridic Haplustalfs) [18].
The Michigan State University Montcalm research farm is located near Lakeview, MI (43°21′08.39″ N, 85°10′45.58″ W). Soil samples collected before planting were analyzed (Soil and Plant Nutrient Laboratory, Michigan State University). The predominant soils at the site were Tekenink-Elmdale loamy sands (course-loamy, mixed, semiactive, mesic Typic Glossudalf) [18].
In Uganda, field trials were established in the Masaka district, at the Kamenyamigo, Mukono Zonal Agricultural Research and Development Institute (0°18′12.78″ S, 31°39′56.19″ E). Soil samples were collected from 0-30 cm from each plot and analyzed for pH, nitrate, available P and K (Mehlich-3), and organic matter (Crop Nutrition Laboratory Service Ltd., CropNuts, Nairobi, Kenya). Soils at the site were characterized as Ferralsols according to FAO [20], but have not been characterized for US Soil Taxonomy. The site receives an average of 367 and 291 mm of rainfall in the March-April-May (MAM) and September-October-November (SON) growing seasons, respectively [21]. Elevation, annual precipitation, and previous crop are provided in Table 1.

2.2. Experimental Design and Site Management

A randomized complete block design was used at all four locations with four common bean varieties and three replicates. The common bean varieties were ‘Montcalm’ (dark red kidney bean), ‘MY06326’ (yellow Mayocoba bean), ‘Taurus’ (great northern bean), and ‘Eclipse’ (black bean).
Preplant fertilization and tillage varied among locations (Table 1). Sites were chosen in part due having disparate soils, production practices, and common bean management recommendations [22,23,24]. Seeds at all locations were inoculated with appropriate rhizobia just prior to planting. An EL-type inoculant (peat-based) (INTX Microbials, LLC, Kendall, IN, USA) was used in Iowa, Colorado, and Michigan, and the Mak-bio-N fixer inoculant (peat-based) (Makerere University, Kampala) was used in Uganda. The same seeding rate was used at all four locations. Row spacing and planting depths are provided in Table 1. Plots in Iowa were planted at a depth of 3.2 cm using a Heavy Duty Grain Drill (HDGD) plot planter (Almaco, Nevada, IA, USA). Plots in Colorado were planted at a depth of 2.54 cm using a Wintersteiger Plot King 2000 (Wintersteiger, Salt Lake City, UT, USA). In Michigan, plots were planted at a depth of 3.8 cm using a White 6100 row unit (Great Plains, Salina, KS, USA). Experimental plots in Uganda were planted in furrowed rows at 3.8 cm depth using the string and stake technique [24]. Seeds were planted at 10 cm between each other in a row and covered with soil.
Due to geographic differences in weed and insect pests, management of these varied among locations (Table 1). A fungicide application consisting of mancozeb and metalaxyl was made each season in Uganda, but other locations did not require disease control measures. Pesticide applications in US locations were with tractor-mounted application equipment, whereas in Uganda pesticide applications were made with backpack sprayers.
The experiment relied solely on natural rainfall in Iowa. In Colorado, the experiment was furrow-irrigated with approximately 50 mm ha−1 water in 2018 on 15 and 25 June, 12 and 19 July, and 15 August. In Michigan, plots were irrigated by center pivot for a total of 137 mm of water over 10 applications in 2017, while 127 mm was applied over 11 applications in 2018. In Uganda, plots were irrigated by hand at 52,794 L ha−1 on 19 and 23 December and 2 and 15 January 2018 for the beans planted in 2017. However, rainfall was adequate in 2018 and irrigation was unnecessary.

2.3. Data Collection and Analysis

At full maturity (R9), stand counts were taken and beans were harvested from a 1 m2 quadrat in each plot, oven-dried overnight at 60 °C, and weighed. Additionally, 100 seeds from each plot were hand-counted, dried, and weighed to determine individual seed weight. Concentrations of N, P, K, Na, Fe, Zn, Mn, Mg, S, and Al were determined for samples from Iowa, Colorado and Michigan at the Soil and Plant Analysis Laboratory (Iowa State University) in 2017 and at Agsource Laboratories in Lincoln, Nebraska in 2018. Grain samples from Uganda were analyzed at Crop Nutrition Laboratory in Nairobi, Kenya. Crude protein (CP) concentration was calculated as N concentration × 6.25.
Data were analyzed by generalized linear mixed models using PROC GLIMMIX in SAS® 9.4 (SAS Institute Inc., Cary, NC, USA). Varieties and locations were treated as fixed effects. Random effects were year × location, replicate (year × location), and year × location × variety. The PDIFF procedure with a Tukey–Kramer test was used to test for differences among means where F-tests were significant for main effects or their interactions. Differences between means were evaluated at a significance level of p < 0.05. Pearson’s correlation coefficients were determined with the PROC CORR procedure in SAS 9.4. Selected parameters were analyzed further with regression analyses by the PROC REG procedure in SAS 9.4.

3. Results

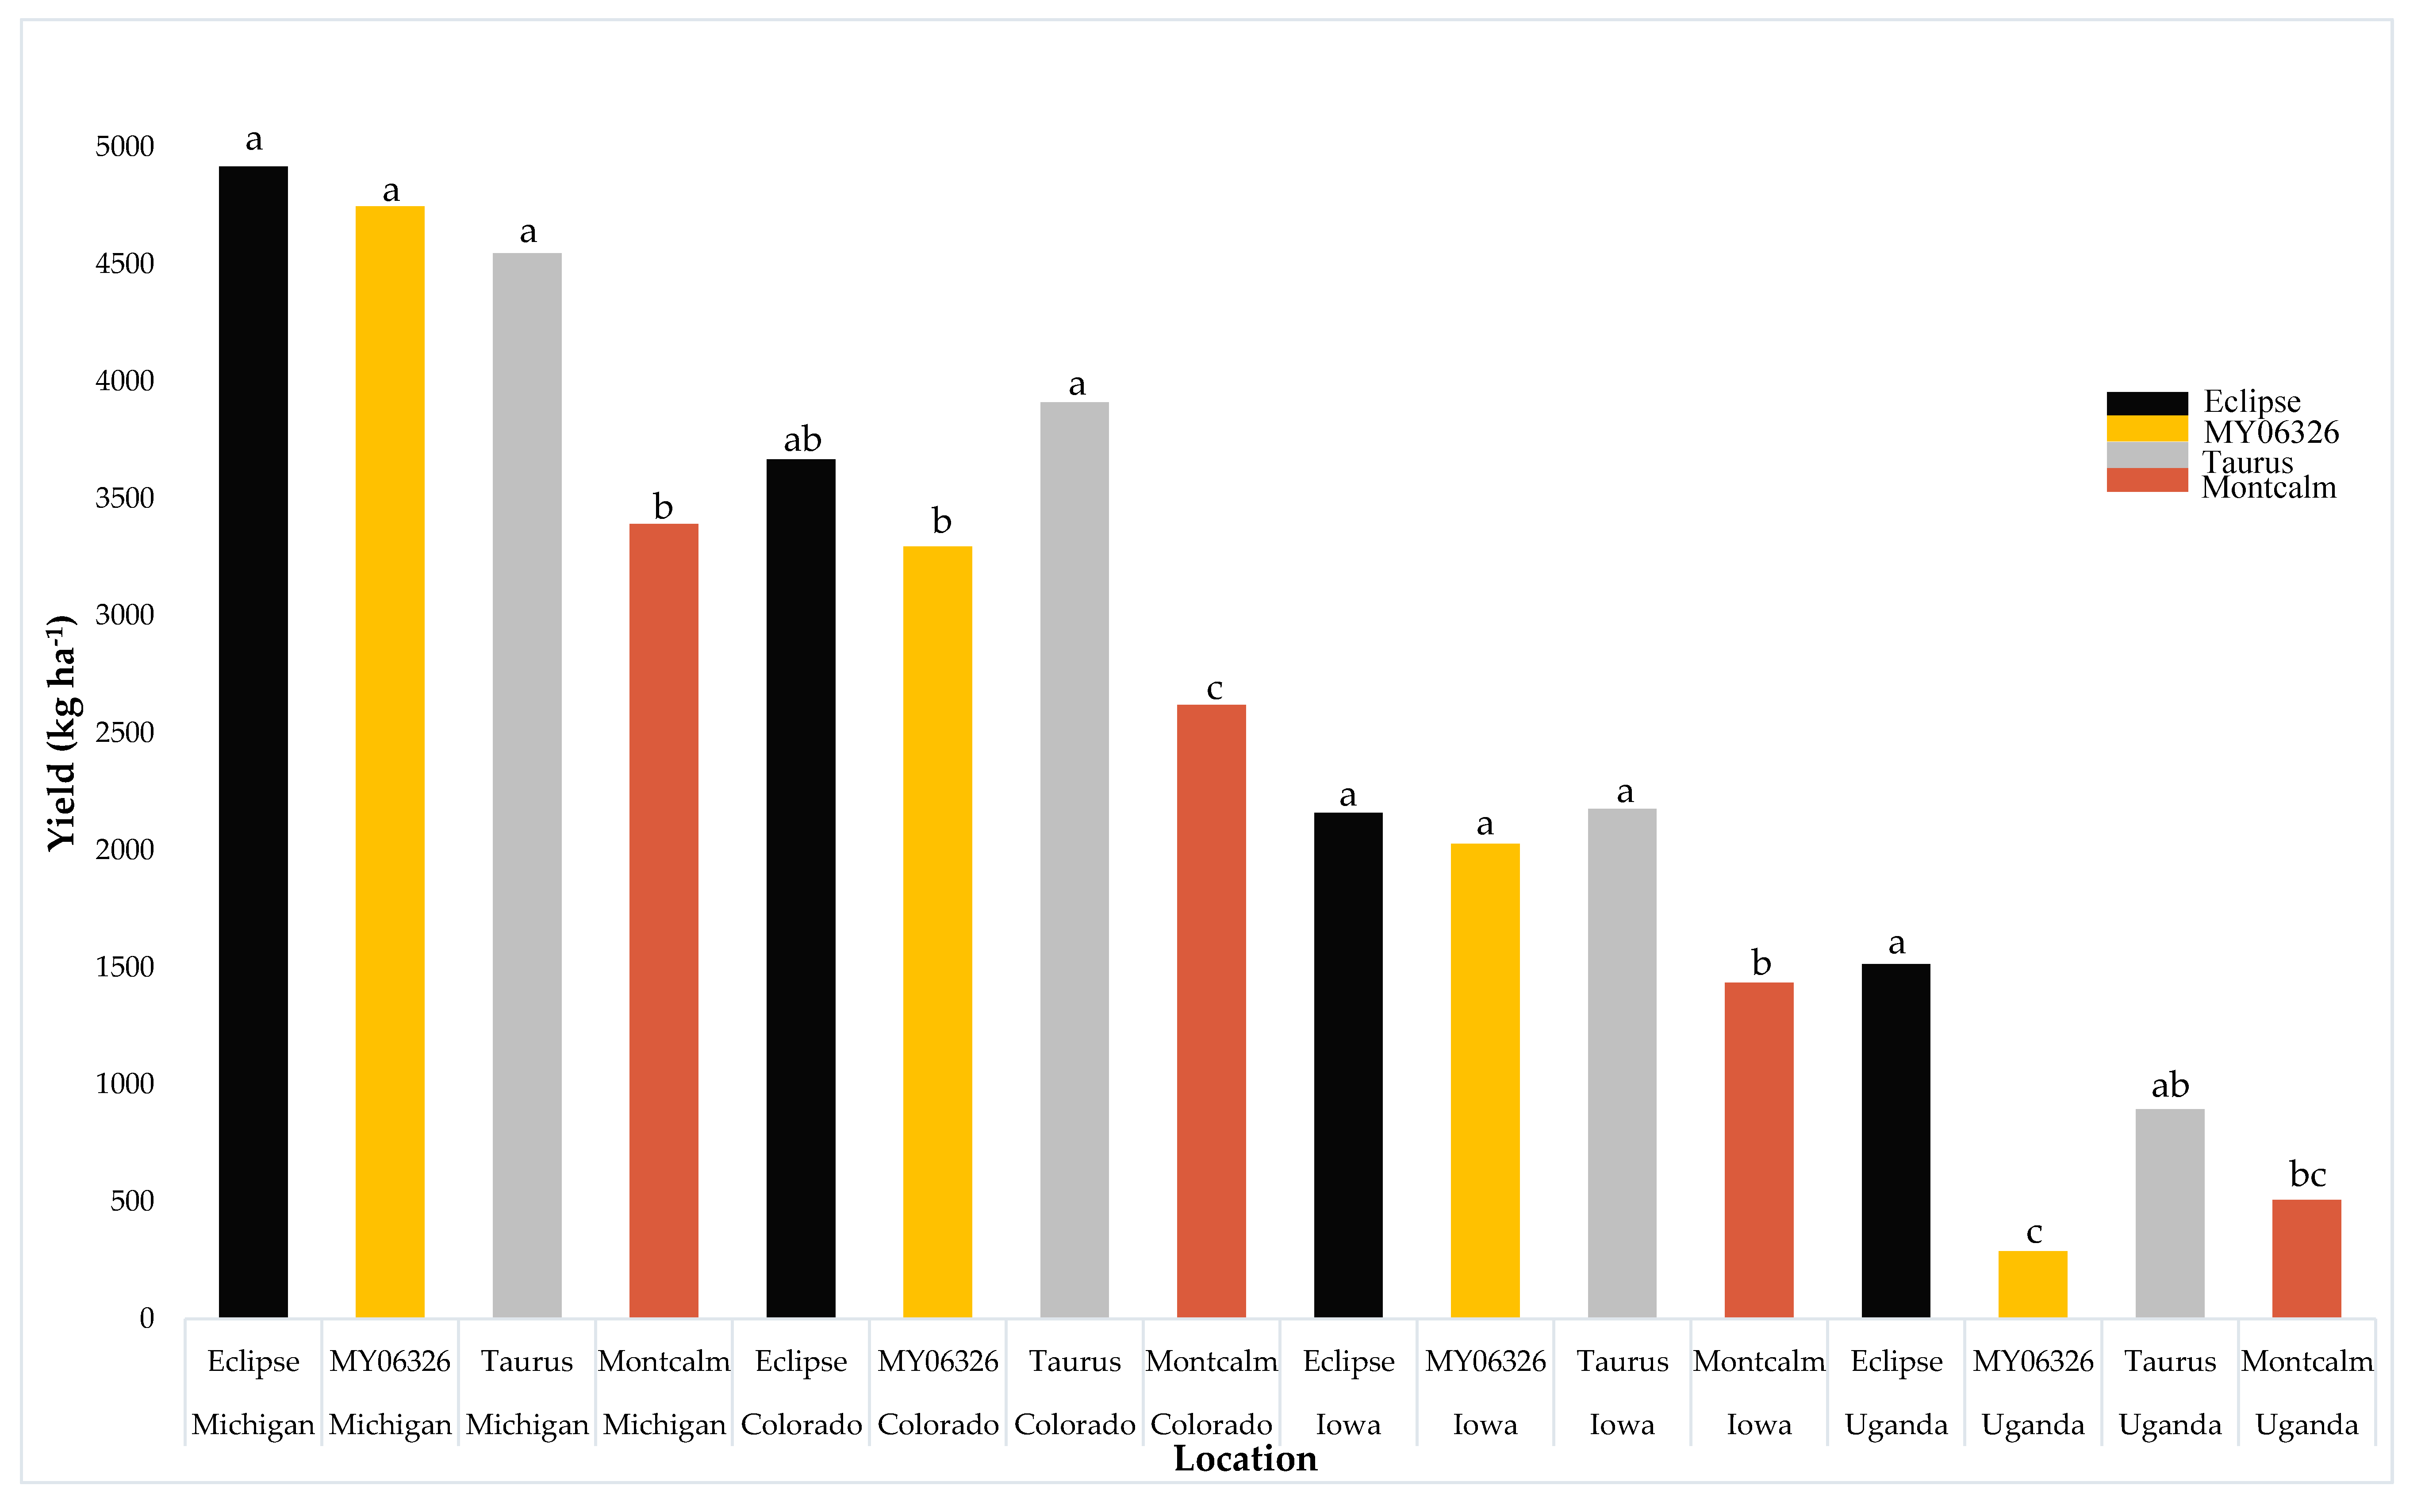
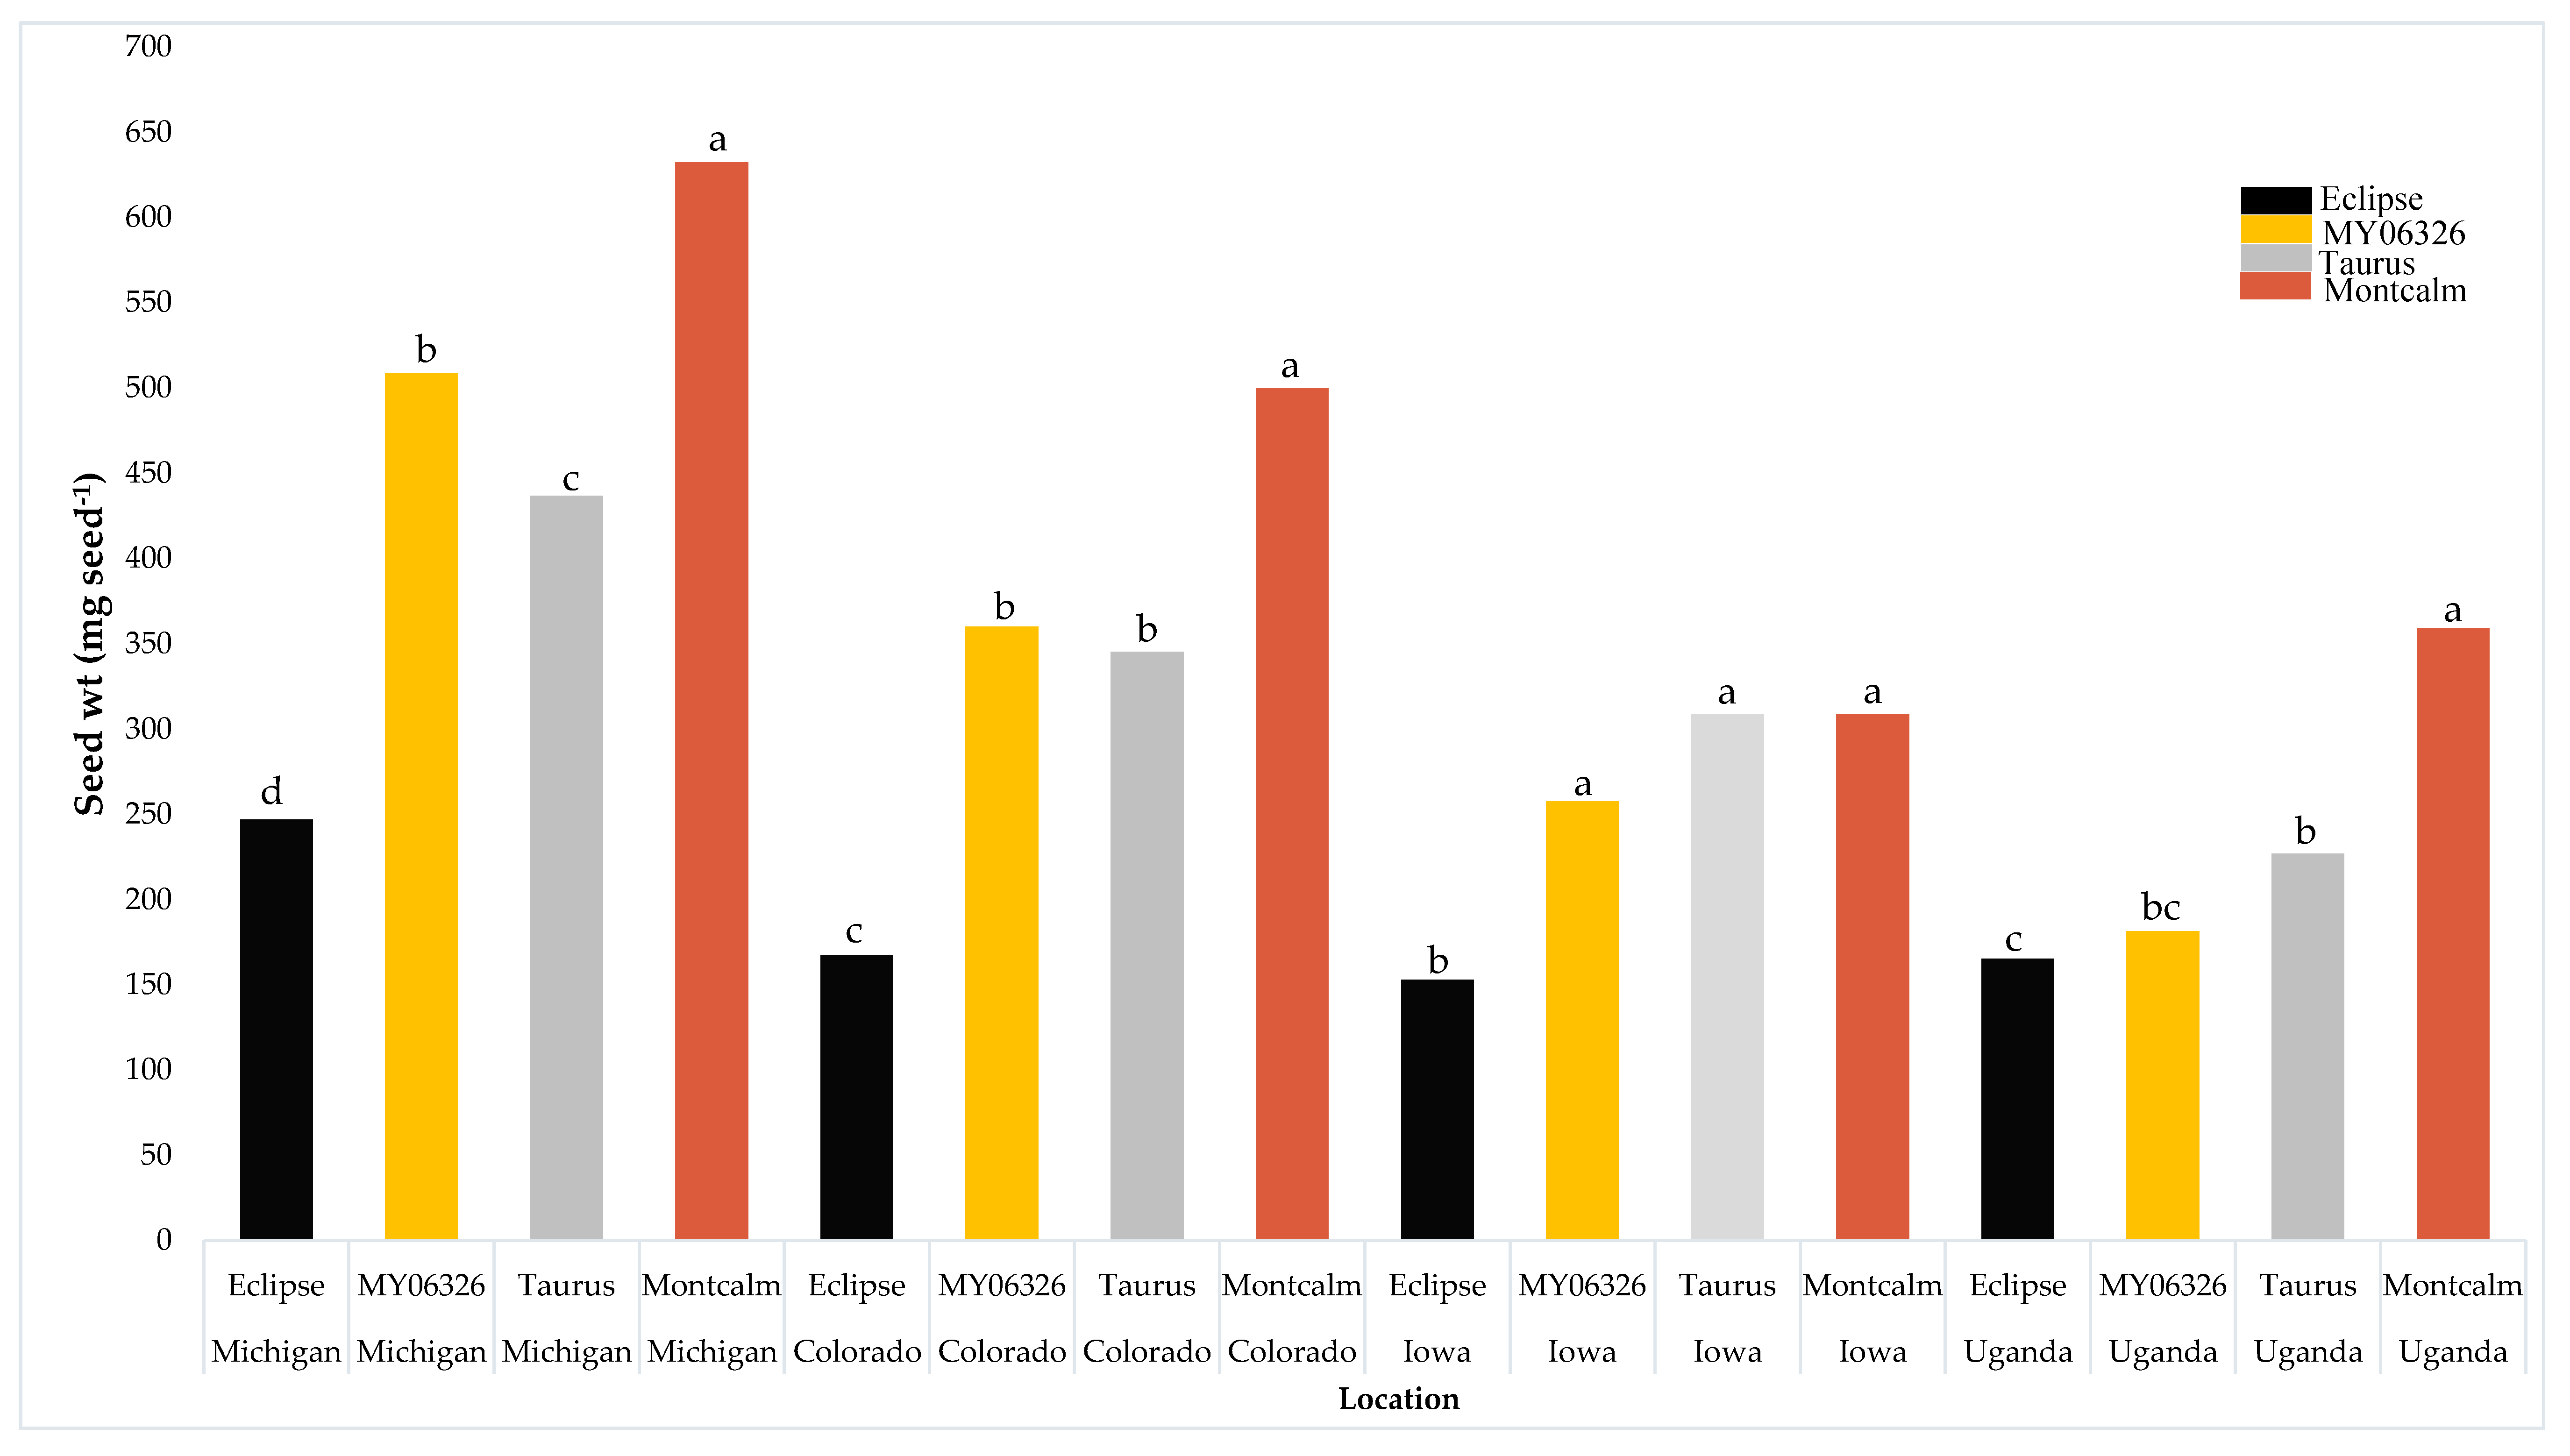
3.1. Impact of Location on Yield and Seed Weight

Stand density at maturity (R9) differed among locations and varieties. Stand density was greater in Iowa than the other three locations (Colorado, Michigan and Uganda; Table 2). Common bean stand density at maturity was 54%, 43%, and 38% higher in Iowa than Uganda, Michigan, and Colorado, respectively. Stand density was greatest for Eclipse, MY06326, and Taurus, and the lowest for Montcalm. Stand density for Eclipse and Taurus was 33% higher than Montcalm whereas that of MY062326 was 28% higher than Montcalm at maturity. Stand density at maturity for all varieties was highest in Iowa (Table 2). Both yield and seed weight differed among locations and among genotypes and the interaction of seed weight × genotype for yield was significant (Table 2, Figure 1). Yield and seed weight in Colorado and Michigan were similar to each other and greater than in Iowa and Uganda. Yield in Colorado and Michigan averaged 42% and 56% higher than Iowa and, 76% and 81% higher than Uganda, respectively. Overall, Eclipse had the greatest yield and Montcalm had the lowest across all locations. Eclipse had 6%, 16%, and 35% greater yield than Taurus, MY06326 and Montcalm, respectively (Table 2). Eclipse, MY06326, Taurus, and Montcalm yield were all greatest in Michigan and lowest in Uganda (Figure 1). Seed weight (g seed−1) was highest in Michigan, followed by Colorado and lowest in Iowa and Uganda. Seed weight for Michigan was 24%, 44%, and 49% higher than average common bean weight in Colorado, Iowa and Uganda, respectively (Table 2). Montcalm had the greatest individual seed weight and Eclipse seeds had the least. Taurus and MY06326 seed weight was similar. Montcalm seeds weighed 59% more than Eclipse seed and 27% more than Taurus and MY06326 seeds (Table 2). Overall, Eclipse, MY06326, Taurus, and Montcalm seeds weighed more in Michigan than the other locations in this study (Figure 2).

3.2. Impact of Location on Common Bean Seed Elemental Concentrations

Soil pH, Mehlich-3 extractable P, K, Na, Mg, Al and S and N differed among locations (Table 3). However, we did not observe statistical differences in soil OM and Mehlich-3 extractable Fe and Zn in soils from Colorado, Iowa, Michigan, and Uganda (Table 3). Seed concentrations of CP, P, K, Mg, and S were different among the four varieties tested (Table 4), suggesting the existence of genetic variability for these traits. Seed Fe and Zn concentrations among the four common bean varieties ranged from 83 to 141 mg kg−1 and 38 to 52 mg kg−1, respectively, whereas seed Mn, Al and S concentrations ranged between 22 to 26 mg kg−1, 75 to 196 mg kg−1, and 80 to 93 mg kg−1, respectively. Location had no impact on common bean seed elemental composition despite the locations having a wide range of differing soil properties, such as pH and nutrient pools of available elements (Table 3 and Table 4). Ugandan soil and seed samples were not analyzed for Al. We did not observe location-by-variety interactions for any seed mineral elements except zinc (Table 3).
Montcalm seeds contained the greatest CP and P concentrations whereas Eclipse contained the least (Table 3). Montcalm seed contained 13%, 8%, and 4% more CP and 18%, 7%, and 4% more P than Eclipse, MY06326 or Taurus, respectively. The concentrations of CP and P in MY06326 and Taurus seed were similar. Seed K concentration was greatest in MY06326 and Taurus seed and lowest in Eclipse (Table 4). The concentration of seed K in MY06326 and Taurus was not different (Table 4). MY06326 seed contained 13% and 7% more K than Eclipse and Montcalm seed, whereas Taurus seed contained 10% and 5% more K than Eclipse and Montcalm, respectively. Sulphur (S) concentrations ranged between 22 to 26 mg kg1, 75 to 196 mg kg1, and 80 to 93 mg kg1, respectively. The seed concentration of S was greatest and similar in Montcalm and Taurus, whereas S concentration was lowest in MY06326 seed. Both Montcalm and Taurus grain contained 13% and 7% more S than MY06326 and Eclipse, respectively.
Across years and locations, the correlation of grain yield with CP was significant and negative (r = −0.750; p = 0.0001) (Table 5). Simple linear regression using CP to predict grain yield accounted for over half of the variation for yield (Y = 9665 – 310.7X; r2 = 0.562; F = 116.85, p = 0.0001). Conversely, correlations of all other nine seed elemental concentrations with grain yield were not significant (Table 5). Likewise, grain CP and seed weight were not correlated within or among locations (results not presented). Correlations of seed weight with seed elemental concentrations were all non-significant, except for Mg and CP (Table 5). Linear regression using seed Mg concentration to predict seed weight (g seed−1) was significant but only explained 15% of the variation in seed weight (Y = 597 −0.14X; r2 = 0.155; F = 16.68, p ≤ 0.0001). The linear regression using seed CP concentration to predict seed weight, although significant, only explained 5% of the variation in seed weight (Y = 505 – 7.72X; r2 = 0.050; F = 4.75, p = 0.0319).

4. Discussion

The objectives of this study were to determine if location influenced yield, and particularly seed nutritional composition of four varieties of common bean. Higher stand densities at maturity were observed in Iowa compared to other locations. This result could be attributable to differences in site management (weed, pest, and disease control) which influenced germination rates and/or edaphic factors on seedling emergence [25,26]. Yields observed in this study were within the range of yields reported by Kandel et al. [27] in Canada and Balasubramanian et al. [28] in North Dakota. Higher yields in Michigan and Colorado may be attributable to better adaption to those locations due to long-term common bean breeding efforts, in contrast to Iowa where common bean is primarily an alternative crop [29]. Common bean has been grown for many decades in Michigan and Colorado, but rarely is this crop planted by farmers in Iowa.
The highest yields and largest seed weights were obtained in Michigan where soil P was higher than the other locations. The Michigan site also had relatively higher soil K. In other studies, common bean yield increased when P was applied [30,31,32]. Soil P improves nodulation by facilitating early root formation and increases active nodules that in turn may generally increase productivity, and seed weight and yield [33]. However, contrary to Ribeiro et al. [34] who reported higher yield in common bean genotypes with high seed phosphorous content, we did not observe any relationship between genotype seed P and seed yield. Contrary to Mourice and Tryphone [31], who attributed high yield to large seeded varieties, the smallest sized variety, Eclipse, had the highest seed yield in our study. Therefore, yield may not be due to seed size per se, contrary to common knowledge. The relationship between seed size and yield in common bean remains quite unclear [35]. Variety seed weights in our study were within ranges of those reported by Kandel et al. [27]. According to their findings, Eclipse seeds weighed between 124–216 mg, which was the same as in our study. Similarly, Taurus and Montcalm seeds weighed 334 and 501 mg seed1 in their findings and 330 and 450 mg seed−1 in our study, whereas yellow beans (327 mg seed1) in our study weighed less than reported by Balasubramanian et al. [28], who reported that yellow bean weighed in the range of 416 to 426 mg seed1.
The observation of no differences in grain CP concentration among locations in our study is in contrast to Leleji et al. [36], who reported that CP in common bean was highly influenced by the environment. Differences in seed CP concentrations among varieties in our study may be related to differences in seed color. Strauta et al. [37] reported some differences in grain CP, especially among brown- and white-colored Phaseolus coccineus L., and related them to seed color.
The range of Fe concentration varied across locations (61 to 150 mg kg1) and varieties (83 to 141 mg kg1), and was higher than the average Fe concentrations (55 mg kg1) found by Bänziger and Long [38]. Although all locations varied in climate, soil mineral pools, and varieties, seed Fe concentration was similar across locations and varieties. Beebe et al. [5] also did not find correlations between geographic location and common bean Fe concentrations. The absence of significant differences in grain Fe levels among locations even when soils had different iron levels/concentration at planting may be attributable to the rapid and irreversible binding of Fe to soil particles immediately after application to the soil, which prevents uptake by plants and its accumulation in grain [39].
Common bean grain Zn concentration did not differ among locations even with edaphic differences because grain Zn is dependent on its availability in the soil. Other chemical and physical soil properties, such as soil pH, can reduce Zn solubility and impair root absorption of Zn [5,14]. We did not observe differences in seed zinc among locations despite variation in soil pH (pH, 8.0 in Colorado versus 5.9–6.2 in the other locations). These findings are contrary to Marschner, who reported that for soil pH between 5.5 to 7.0, soil Zn concentration decreased by 30- to 45-fold for each unit increase in soil pH [18]. He explained that this in turn could increase the risk of Zn deficiency in plants because increasing soil pH activated Zn adsorption to soil constituents and reduced the desorption of adsorbed Zn. Our findings were also contrary to Sarkar and Wyn Jones [17], who associated an increase in soil pH to sharp decreases in soil solution Zn and resultant Zn concentration in plant tissues. Soil moisture and soil organic matter also play a critical role in soil Zn availability for plant uptake [13,14].
Our findings were contrary to Petry et al. [40] who reported that bean Fe and Zn grain concentrations strongly depended on the planting site and site factors such as soil fertilization. However, the specific genotypes were not noted in their study. The potential for varieties in our study to accumulate Fe and Zn despite the differences among locations where they were grown, may be attributable to Fe and Zn transporter proteins, which have the ability to improve the density of micronutrients in grain regardless of the availability of these nutrients in the soil [41,42]. The role that these transporter proteins play in genotypic variation for Fe or Zn deficiency tolerance or even grain Fe or Zn accumulation is still unclear [14], and warrants further investigation.
Studies by Rengel et al. [43] and Aciksoz et al. [44] reported that application of Fe fertilizers to soil was ineffective for improving grain Fe concentrations. Ramolemana [45] also reported no significant impact of soil type or location on Fe concentration of Morama bean (Tylosema esculentum (Burch.) E. Schreib.) seeds. Similarly, soil Zn fertilization of wheat and rice production in seven countries did not increase grain Zn concentrations [46,47]. The ineffectiveness of fertilizer applications to raise grain Fe or Zn concentrations in these examples may be because they are controlled by soil Fe and Zn concentrations and other processes [48].
Grain P concentration may be related to seed weight. Similar to Moraghan and Grafton [49], who reported a positive correlation between grain P concentration and seed weight, we observed that large seeded variety, Montcalm, had the greatest P concentration. Although tropical soils are often P deficient, usually due to Fe and Al binding effects on phosphate compounds [50,51] as well as P loss through erosion attributed to heavy rains [51], we did not observe differences in grain P concentration among locations. Additionally, and contrary to Alley and Vanlauwe [50] and Tiessen [51], soil P at the tropical experimental location in Uganda was not the lowest among locations. Genotypic variation in P use efficiency and differences in root morphology among genotypes [30,31,52] may explain the observed differences in grain P concentrations among the varieties tested despite similar concentrations of extractable P among locations [53]. Differences in P use efficiency and root morphology may render some genotypes more adaptable to soils with varying P. Increased root growth [52], altered root morphological, and architectural characteristics [54,55] can expand the soil volume which can be exploited for P acquisition. The exudation of organic acids by roots of some genotypes for mobilization of P that is fixed in soils can increase P acquisition [56]. The ability to acquire more P from the soil may enable some genotypes to accumulate more P in their grains than their more inefficient counterparts, even when grown in the same location [57]. Furthermore, our findings about genotype grain P concentrations were contrary to Islam et al. [58], who postulated that common bean seeds from the Middle American gene pool, such as Eclipse and Taurus, often contained greater P concentration compared to seeds from the Andean gene pool, such as varieties Montcalm and MY06326.
Grain K concentration was not different among locations, although soil Mehlich-3 extractable K was quite low in Uganda compared to other locations. Soil K is usually reportedly low in most tropical soils [59]. Optimum soil K for bean production in loamy soils is 111–140 mg kg−1 and 81–120 mg kg−1 for sandy, organic soils [60]. It is expected that differences in soil K did not result in differences in grain K, because unlike other nutrients, plants have the tendency for “luxury potassium consumption” and thus absorb potassium in amounts exceeding their requirements if readily available and therefore even in locations with low soil K, “plant potassium luxury consumption” may cover soil inadequacies [61]. Other factors, such as soil aeration, moisture, and temperature, among others, also affect K uptake by plants. For instance, ridge till and compaction, which are common in mechanized farming, affect soil aeration and increase K deficiency. Cool temperatures reduce the release of K into the soil solution and decrease plant metabolic processes responsible for uptake soil K [61]. Varietal differences in grain K among Taurus, MY06326, Montcalm, and Eclipse may be attributed to genotype differences in K use and absorption efficiency. Fageria et al. [62] reported differences in common bean genotypes in relation to soil K use and noted that some genotypes were more responsive to soil K. Legume species demonstrate inter- and intraspecific variation in K nutrition have been reported to impact K use efficiency when grown in nutrient-deficient versus fertilized soils [62].
Soil Mg at all locations was within the optimum range, which may explain why significant differences in grain Mg concentrations among locations were not observed. Laboski and Peters [60] reported 51–250 and 51–100 mg kg−1 as optimum Mg levels for sandy and loamy-organic soils, respectively.
Grain Mn did not differ among locations either as all sites had optimum soil Mn for common bean production. Laboski and Peters [60] reported 11–20 mg kg−1 as the optimum Mn range for plant growth in sandy and loamy soil. Mn deficiency may occur in sandy soils with pH ≥ 8 [63], which is similar to the Colorado location. In contrast to Moraghan and Grafton [49] who reported a negative correlation between seed weight and Mn concentration, we did not observe significant differences in Mn concentration in the varieties we tested, which included large to small seeded varieties, nor correlation of seed weight with seed Mn concentration. In this study, soils with low pH contained more extractable Al, although it should be noted that we do not have soil test results from Uganda, which is the site with the lowest pH. The lack of genotype x location interaction in mineral content supports phenotypic stability. Cichy et al. [64] have observed similar stability for cooking time across locations which would be related to seed composition characteristics.
In this study, grain S concentration was not influenced by location, but it was different among varieties. Other studies have shown that white-seeded bean varieties often contain lower amounts of tannins and grain S [65]. However, in contrast to Welch et al. [65], the white-seeded variety in this study, Taurus, was higher in S than two of the colored varieties, especially dark red kidney (Montcalm) and black bean (Eclipse).
Individual seed weight can show great plasticity in a wide range of species, including common bean. Sadras [66] explored evolutionary aspects in respect to seed size and yield. Our results confirm this plasticity, given the interaction for seed weight by location. Two of the locations in our study were irrigated, while Iowa is a rainfed environment and precipitation was adequate. Drought stress did occur in one season in Uganda. These plots were irrigated after the drought stress was observed and prior to seed fill. Drought stress influences source-sink relationships [67], including seed number and fill. Developing common bean with improved tolerance to drought and other abiotic stressors is an important goal in many breeding programs [68].

5. Conclusions

In this study, we document a strong negative relationship between seed CP with yield. Seed yield and weight in common bean were influenced by location, but otherwise causal relationships between seed weight, seed elemental concentrations, and yield were not evident. Interactions of common bean with location were not evident for elemental concentrations, which did not support our original hypothesis. Mesoamerican origin varieties (Eclipse and Taurus) were generally similar to varieties of Andean origin (MY06326 and Montcalm) for seed elemental concentrations.

Author Contributions

The experiment was conceived by R.B., A.W.L., and D.M.W., and designed by R.B. and A.W.L. Data collection and site management was performed by R.B., E.M.W., and J.B.O. Data were analyzed by R.B., A.W.L., and K.J.M., and the original paper draft was written by R.B. and reviewed by A.W.L., K.J.M., D.M.W., M.A.B., J.D.K., J.B.O., and E.M.W. All authors have read and agreed to the published version of the manuscript.

Funding

This research was funded by the United States Agency for International Development (USAID), Legume Innovation Lab (LIL)-MSU.

Acknowledgments

We thank the United States Agency for International Development (USAID), the Feed the Future Legume Innovation Lab (LIL) and Innovation Lab for Legume Systems Research (LSR) for facilitation and financial support. We are also highly thankful to Roger Hintz for his assistance at establishing experimental trials, site management and data collection in Ames, Iowa.

Conflicts of Interest

The authors declare no conflict of interest. The funders had no role in the design of the study; in the collection, analyses, or interpretation of data; in the writing of the manuscript, or in the decision to publish the results.

References

  1. Rawal, V.; Navarro, D.K. The Global Economy of Pulses; FAO: Rome, Italy, 2019; Available online: http://www.fao.org/3/i7108en/i7108en.pdf (accessed on 22 January 2020).
  2. Broughton, W.J.; Hernandez, G.; Blair, M.; Beebe, S.; Gepts, P.; Vanderleyden, J. Beans (Phaseolus spp.)—Model food legumes. Plant Soil 2003, 252, 55–128. [Google Scholar] [CrossRef] [Green Version]
  3. Beebe, S.; Gonzalez, A.V.; Rengifo, J. Research on trace minerals in the common bean. Food Nutr. Bull. 2000, 21, 387–391. [Google Scholar] [CrossRef]
  4. Mensack, M.M.; Fitzgerald, V.K.; Ryan, E.P.; Lewis, M.R.; Thompson, H.J.; Brick, M.A. Evaluation of diversity among common beans (Phaseolus vulgaris L.) from two centers of domestication using ‘omics’ technologies. BMC Genom. 2010, 11, 686. [Google Scholar] [CrossRef] [PubMed] [Green Version]
  5. Gül, K.; Egesel, C.Ö.; Turhan, H. The effects of planting time on fatty acids and tocopherols in chickpea. Eur. Food Res. Technol. 2008, 226, 517–522. [Google Scholar] [CrossRef]
  6. Wood, J.A.; Knights, E.J.; Harden, S. Milling performance in desi-type chickpea (Cicer arietinum L.): Effects of genotype, environment and seed size. J. Sci. Food Agric. 2008, 88, 108–115. [Google Scholar] [CrossRef]
  7. Graham, R.D.; Welch, R.M.; Bouis, H.E. Addressing micronutrient malnutrition through enhancing the nutritional quality of staple foods: Principles, perspectives and knowledge gaps. Adv. Agron. 2001, 70, 77–142. [Google Scholar] [CrossRef]
  8. Graham, R.D. Breeding for nutritional characteristics in cereals. Adv. Plant. Nutr. 1984, 1, 57–102. [Google Scholar]
  9. Marschner, H. Mineral Nutrition of Higher Plants, 3rd ed.; Elsevier Ltd.: Amsterdam, The Netherlands, 2012. [Google Scholar]
  10. Marschner, H.; Römheld, V. Strategies of plants for acquisition of iron. Plant Soil 1994, 165, 261–274. [Google Scholar] [CrossRef]
  11. Obrador, A.; Novillo, J.; Alvarez, J.M. Mobility and availability to plants of two zinc sources applied to a calcareous soil. Soil Sci. Soc. Am. J. 2003, 67, 564–572. [Google Scholar] [CrossRef]
  12. Cakmak, I. Enrichment of cereal grains with zinc: Agronomic or genetic biofortification. Plant Soil 2008, 302, 1–17. [Google Scholar] [CrossRef]
  13. Sarkar, A.N.; Wyn Jones, R.G. Effect of rhizosphere pH on the availability and uptake of Fe, Mn and Zn. Plant Soil 2008, 66, 361–372. [Google Scholar] [CrossRef]
  14. Vanlauwe, B.; Bationo, A.; Chianu, J.; Giller, K.E.; Merckx, R.; Mokwunye, U.; Ohiokpehai, O.; Pypers, P.; Tabo, R.; Shepherd, K.D.; et al. Integrated soil fertility management—Operational definition and consequences for implementation and dissemination. Outlook Agric. 2008, 39, 17–24. [Google Scholar] [CrossRef] [Green Version]
  15. US Department of Agriculture. Agricultural Research Service. Nutrient Data Laboratory. USDA National Nutrient Database for Standard Reference, Release 28 (Slightly revised). Version Current: May 2016. Available online: http://www.ars.usda.gov/nea/bhnrc/mafcl (accessed on 2 July 2019).
  16. Hofstrand, J. Economics of Tile Drainage. Iowa State Univ., Ext. and Outreach. 2010. Available online: https://www.extension.iastate.edu/agdm/articles/ hof/HofJuly10.html (accessed on 20 May 2019).
  17. US Climate DATA. Available online: https://www.usclimatedata.com/climate/boone/iowa/united-states/usia0091 (accessed on 5 September 2019).
  18. USDA. National Resources Conservation Service. Official Soil Series Descriptions. Available online: https://soilseries.sc.egov.usda.gov/osdname.aspx (accessed on 24 September 2019).
  19. Franzen, D.W. Fertilizing Pinto, Navy and Other Dry Edible Bean. SF720. North Dakota State Univ., Fargo. 2017. Available online: https://www.ag.ndsu.edu/publications/crops/fertilizing-pinto-navy-and-other-dry-edible-bean/sf720.pdf (accessed on 24 September 2019).
  20. TAXOUSDA. Predicted USDA Soil Taxonomy Class (Twelfth Edn). 2014. Available online: https://soilgrids.org/#!/?lon=31.683333&lat=-0.3&zoom=14&layer=ORCDRC_M_sl2_250m&vector=1&showInfo=1 (accessed on 16 April 2019).
  21. Mugume, I.; Mesquita, M.D.S.; Basalirwa, C.; Bamutaze, Y.; Reuder, J.; Nimusiima, A.; Waiswa, D.; Mujuni, G.; Tao, S.; Ngailo, T.J. Patterns of Dekadal rainfall variation over a selected region in Lake Victoria basin, Uganda. Atmosphere 2016, 7, 150. [Google Scholar] [CrossRef] [Green Version]
  22. Lunze, L.; Abang, M.M.; Buruchara, R.; Ugen, M.A.; Nabahungu, N.L.; Rachier, G.O.; Ngongo, M.; Rao, I. Integrated soil fertility management in bean-based cropping systems of Eastern, Central and Southern Africa. In Soil Fertility Improvement and Integrated Nutrient Management—A Global Perspective; Whalen, J.K., Ed.; InTech Open Ltd.: London, UK, 2012; pp. 239–272. [Google Scholar]
  23. Mallarino, A.; Sawyer, J.E.; Barnhart, S.K. A General Guide for Crop Nutrient and Limestone Recommendations in Iowa. PM1688; Iowa State Univ., Ext. and Outreach: Ames, IA, USA, 2013. [Google Scholar]
  24. Copeland, L.O.; Hesterman, O.B.; Pierce, F.J.; Tesar, M.B. AG FACTS—Seeding Practices for Michigan Crops; Michigan State Univ. Coop. Ext. Serv: East Lansing, MI, USA, 2016; Available online: http://fieldcrop.msu.edu/uploads/documents/E2107.pdf (accessed on 22 July 2019).
  25. Sunday, G.; Ocen, D. Fertilizer Consumption and Fertilizer Use by Crop in Uganda; Ministry of Agriculture and, Animal Industry and Fisheries, Uganda National Bureau of Statistics: Kampala, Uganda, 2015.
  26. De Ron, A.M.; Rodiño, A.P.; Santalla, M.; González, A.M.; Lema, M.J.; Martín, I.; Kigel, J. Seedling emergence and phenotypic response of common bean germplasm to different temperatures under controlled conditions and in open field. Front. Plant Sci. 2016, 7, 1087. [Google Scholar] [CrossRef] [Green Version]
  27. Kandel, H.; Osorno, J.; VanderWal, J.; Posch, J.; Cooper, K.; Eslinger, H.; Nelson, S.; Ostlie, M.; Schatz, B.; Endres, G.; et al. North Dakota dry bean. Variety Trial Results for 2018 and Selection Guide; A654-18; North Dakota State University Extension: Fargo, ND, USA, 2018. [Google Scholar]
  28. Balasubramanian, P.M.; Chatterton, S.; Conner, R.L. AAC Y012 and AAC Y015 yellow dry bean. Cultivar description. Can. J. Plant Sci. 2017, 97, 340–343. [Google Scholar]
  29. Delate, K. Alternative Crops for Iowa. 2013. Available online: https://www.extension.iastate.edu/alternativeag/cropproduction.html (accessed on 10 September 2019).
  30. Fageria, N.K.; Baligar, V.C.; Moreira, A.; Portes, T.A. Dry bean genotypes evaluation for growth, yield components and phosphorus use efficiency. J. Plant Nutr. 2010, 33, 2167–2181. [Google Scholar] [CrossRef]
  31. Mourice, S.K.; Tryphone, G.M. Evaluation of common bean (Phaseolus vulgaris L.) genotypes for adaptation to low phosphorus. ISRN Agron. 2012, 2012, 309614. [Google Scholar] [CrossRef] [Green Version]
  32. Turuko, M.; Mohammed, A. Effect of different phosphorus fertilizer rates on growth, dry matter yield and yield components of common bean (Phaseolus vulgaris L.). World J. Agric. Res. 2014, 2, 88–92. [Google Scholar] [CrossRef] [Green Version]
  33. Chekanai, V.; Chikowo, R.; Vanlauwe, B. Response of common beans (Phaseolus vulgaris L.) to nitrogen, phosphorus and rhizobia inoculation across variable soils in Zimbabwe. Agric. Ecosyst. Environ. 2018, 266, 167–173. [Google Scholar] [CrossRef]
  34. Ribeiro, N.D.; da Rosa, S.S.; Jost, E.; Rosa, D.P.; Poersch, N.L.; Maziero, S.M. Genetics of phosphorus content in common bean seeds. Crop Breed Appl. Biotechnol. 2011, 11, 250–256. [Google Scholar] [CrossRef]
  35. Lima, E.R.; Santiago, A.S.; Araujo, A.P.; Teixeira, M.G. Effects of the size of sown seed on growth and yield of common bean cultivars of different seed sizes. Braz. J. Plant Physiol. 2005, 17, 273–281. [Google Scholar] [CrossRef] [Green Version]
  36. Leleji, O.I.; Dickson, M.H.; Crowder, L.V.; Bourke, J.B. Inheritance of crude protein percentage and its correlation with seed yield in beans, Phaseolus vulgaris L. Crop Sci. 1972, 12, 168–171. [Google Scholar] [CrossRef]
  37. Strauta, L.; Muizniece-Brasava, S.; Alsina, I. Crude protein and ash content in different colored Phaseolus coccineus L. World Acad. Sci. Eng. Technol. Internat. J. Nutr. Food Eng. 2013, 7, 696–701. [Google Scholar]
  38. Bänziger, M.; Long, J. The potential for increasing the iron and zinc density of Maize through plant-breeding. Food Nutr. Bull. 2000, 21, 397–400. [Google Scholar] [CrossRef]
  39. Hirschi, K.D. Nutrient biofortification of food crops. Annu. Rev. Nutr. 2009, 29, 401–421. [Google Scholar] [CrossRef] [PubMed] [Green Version]
  40. Petry, N.; Boy, E.; Wirth, J.P.; Hurrell, R.F. Review: The potential of the common bean (Phaseolus vulgaris) as a vehicle for iron biofortification. Nutrients 2015, 7, 1144–1173. [Google Scholar] [CrossRef] [Green Version]
  41. Schachtman, D.P.; Barker, S.J. Molecular approaches for increasing the micronutrient density in edible portions of food crops. Field Crops Res. 1999, 60, 81–92. [Google Scholar] [CrossRef]
  42. Uauy, C.; Distelfeld, A.; Fahima, T.; Blechl, A.; Dubcovsky, J. A NAC gene regulating senescence improves grain protein, zinc, and iron content in wheat. Science 2006, 314, 1298–1301. [Google Scholar] [CrossRef] [Green Version]
  43. Rengel, Z. Physiological mechanisms underlying differential nutrient efficiency of crop genotypes. In Mineral Nutrition of Crops—Fundamental Mechanisms and Implications; Rengel, Z., Ed.; Food Products Press: Binghamton, NY, USA, 1999; Volume 1, pp. 227–265. [Google Scholar]
  44. Aciksoz, S.B.; Yazici, A.; Ozturk, L.; Cakmak, I. Biofortification of wheat with iron through soil and foliar application of nitrogen and iron fertilizers. Plant Soil 2011, 349, 215–225. [Google Scholar] [CrossRef]
  45. Ramolemana, G.M. Influence of soil chemical characteristics on the nutritional value of morama (Tylosema esculentum) bean seed a potential crop in Botswana. J. Agric. Sci. 2013, 5, 185–189. [Google Scholar] [CrossRef] [Green Version]
  46. Zou, C.Q.; Zhang, Y.Q.; Rashid, A.; Ram, H.; Sohu, V.; Hassan, M.; Kaya, Y.; Onder, O.; Lungu, O.; Yagu, M.M.; et al. Biofortification of wheat with zinc through zinc fertilization in seven countries. Plant Soil 2012, 361, 119–130. [Google Scholar] [CrossRef]
  47. Phattarakul, N.; Rerkasem, B.; Li, L.J.; Wu, L.H.; Zou, C.Q.; Ram, H.; Sohu, V.S.; Kang, F.S.; Surek, H.; Kalayci, M.; et al. Biofortification of rice grain with zinc through zinc fertilization in different countries. Plant Soil 2012, 361, 131–141. [Google Scholar] [CrossRef]
  48. Welch, R.M. Effects of nutrient deficiencies on seed production and quality. Adv. Plant Nutr. 1986, 2, 205–247. [Google Scholar]
  49. Moraghan, J.T.; Grafton, K. Genetic diversity and mineral composition of common bean seed. J. Sci. Food Agric. 2001, 81, 404–408. [Google Scholar] [CrossRef]
  50. Alley, M.M.; Vanlauwe, B. The Role of Fertilizers in Integrated Plant Nutrient Management, 1st ed.; IFA: Paris, France; TSBF-CIAT: Nairobi, Kenya, 2009. [Google Scholar]
  51. Tiessen, H. Phosphorus in the Global Environment. In The Ecophysiology of Plant-Phosphorus Interactions; White, P.J., Hammond, J.P., Eds.; Springer: Berlin/Heidelberg, Germany, 2008. [Google Scholar]
  52. Fageria, N.K.; da Costa, J.G.C. Evaluation of common bean genotypes for phosphorus use efficiency. J. Plant Nutr. 2000, 23, 1145–1152. [Google Scholar] [CrossRef]
  53. Polania, J.; Rao, I.M.; Cajiao, C.; Grajales, M.; Rivera, M.; Velasquez, F.; Raatz, B.; Beebe, S.E. Shoot and root traits contribute to drought resistance in recombinant inbred lines of MD 23-24 × SEA 5 of common bean. Front. Plant Sci. 2007, 8, 296. [Google Scholar] [CrossRef]
  54. Lynch, J.P.; Brown, K.M. Topsoil foraging—An architectural adaptation of plants to low phosphorus availability. Plant Soil 2001, 237, 225–237. [Google Scholar] [CrossRef]
  55. Shen, J.; Yuan, L.; Zhang, J.; Li, H.; Bai, Z.; Chen, X.; Zhang, W.; Zhang, F. Phosphorus dynamics: From soil to plant. Plant Physiol. 2011, 156, 997–1005. [Google Scholar] [CrossRef] [Green Version]
  56. Dechassa, N.; Schenk, M.K. Exudation of organic anions by roots of cabbage carrot and potato as influenced by environmental factors and plant age. J. Plant Nutr. Soil Sci. 2004, 167, 623–629. [Google Scholar] [CrossRef]
  57. Hammond, J.P.; Broadley, M.R.; White, P.J. Genetic responses to phosphorus deficiency. Ann. Bot. 2004, 94, 323–332. [Google Scholar] [CrossRef]
  58. Islam, F.M.A.; Basford, K.E.; Jara, C.; Redden, R.J.; Beebe, S. Seed compositional and disease resistance differences among gene pools in cultivated common bean. Genet. Res. Crop Evol. 2002, 49, 285–293. [Google Scholar] [CrossRef]
  59. Sangakkara, U.R.; Hartwig, U.A.; Nosberger, J. Soil moisture and potassium affect the performance of symbiotic nitrogen fixation in faba bean and common bean. Plant Soil 1996, 184, 123–130. [Google Scholar] [CrossRef]
  60. Laboski, C.A.M.; Peters, J.B. Nutrient Application Guidelines for Field, Vegetable, and Fruit Crops in Wisconsin; A2809; University of Wisconsin Cooperative Extension: Madison, WI, USA, 2012. [Google Scholar]
  61. Parnes, R. Soil Fertility. A Guide to Organic and Inorganic Soil Amendments. 2013. Available online: https://www.nofa.org/soil/html/potassium.php (accessed on 3 July 2019).
  62. Fageria, N.K.; Barbosa Filho, M.P.; da Costa, J.G.C. Potassium use efficiency in common bean genotypes. J. Plant Nutr. 2001, 24, 1937–1945. [Google Scholar] [CrossRef]
  63. Manjula, N. Soils, plant nutrition and nutrient management. In Soil Testing and Plant Diagnostic Service Laboratory; University of Missouri Extension: Columbia, MO, USA, 2017; Available online: https://extension2.missouri.edu/mg4 (accessed on 14 September 2019).
  64. Cichy, K.A.; Wiesinger, J.A.; Berry, M.; Nchimbi-Msolla, S.; Fourie, D.; Porch, T.G.; Ambechew, D.; Miklas, P.N. The role of genotype and production environment in determining the cooking time of dry beans (Phaseolus vulgaris L.). Legume Sci. 2019, 1, e13. [Google Scholar] [CrossRef] [Green Version]
  65. Hirpa, L.; Nigussie-Dechassa, R.; Setegn, G.; Bultosa, G. Chemical quality of common beans as influences by genotype and aluminum rates under two soil liming regimes. Afr. J. Food Agric. Nutr. Dev. 2015, 15, 9872–9891. [Google Scholar]
  66. Sadras, V.O. Evolutionary aspects of the trade-off between seed size and number in crops. Field Crops Res. 2007, 100, 125–138. [Google Scholar] [CrossRef]
  67. Smith, J.R.; Rao, I.M.; Merchant, A. Source-sink relationships in crop plants and their influence on yield development and nutritional quality. Front. Plant Sci. 2018, 9, 1889. [Google Scholar] [CrossRef] [Green Version]
  68. Beebe, S. Common Bean Breeding in the Tropics. In Plant Breeding Reviews; Janick, J., Ed.; John Wiley & Sons Inc.: Hoboken, NJ, USA, 2012; Volume 36, pp. 357–426. [Google Scholar]
Figure 1. Common bean yield (kg/ha) of four genotypes (Eclipse, MY06326, Taurus, Montcalm) grown in Michigan, Colorado, Iowa and Uganda. Means within a location with different letters differ at p = 0.05 by Tukey-Kramer test. Location × variety interaction SE = 771.
Agronomy 10 00347 g001
Figure 2. Common bean seed weight (mg seed−1) of four genotypes (Eclipse, MY06326, Taurus, Montcalm) grown in Michigan, Colorado, Iowa and Uganda. Means within a location with different letters differ at p = 0.05 by Tukey-Kramer test. Location × variety SE = 36.
Agronomy 10 00347 g002
Table 1. Elevation, annual precipitation, and agronomic and pest management at four locations for production of four common bean varieties in two years.
LocationElevationAnnual PrecipitationPrevious CropRow SpacingNutrient AdditionsPreplant TillagePlanting DateWeed ManagementInsect Management
m. m.s.l.cm cmkg ha−1
Colorado, USA1550408maize76247 46-0-0
6725 manure
80 11-52-0
vertical tillage, moldboard plow, field cultivator twice9 Jun. 2017
30 May 2018
pendimethalin,
eptam, S-metolachlor, cultivation
not required
Iowa, USA325974maize76247 18-46-0
195 0-0-62
chisel plow, tandem disk, field cultivator31 May 2017
16 May 2018
pendimethalin, cultivation,
hand weeding
dimethoate
Michigan, USA287854maize5091 19-10-19
45 46-0-0
chisel plot, tandem disk, field cultivator13 Jun. 2017
13 Jun. 2018
eptam, ethylfluralin, S-metolachlor, bentazon, fomesafen, imazamoxesfenvalerate
Masaka, Uganda1242658maize50124 17-17-17
14,826 limestone
moldboard plow, hand hoeing to level and fine7 Nov. 2017
3 Mar. 2018
hand weeding three timescypermethrin
Table 2. Stand density at R9, yield, and seed weight for four locations and four genotypes.
Parameter Stand Density R9
(no. m−2)
Yield
(kg ha−1)
Seed Weight
(mg seed−1)
Location
Colorado23 b3374 a343 b
Iowa37 a1951 b257 c
Michigan21 b4402 a456 a
Uganda17 b802 b233 c
SE2.367733
Variety
Eclipse27 a3066 a183 c
Montcalm18 b1989 c450 a
MY0632625 a2590 b327 b
Taurus27 a2883 ab330 b
SE1.538618
p > F
Location (L)*********
Variety (V)*********
L × Vns****
Means followed by different letters within each column indicate significant differences among locations at p < 0.05; * significant at p < 0.05, and *** significant at p < 0.001; ns = not significant.
Table 3. Elemental concentrations, pH and organic matter (OM) of soil for experimental sites in Colorado, Iowa, Michigan and Uganda after fertilization and prior to planting in 2017 and 2018.
LocationpHOM
(%)
Fe
(mg kg−1)
Zn
(mg kg−1)
P
(mg kg−1)
K
(mg kg−1)
Na
(mg kg−1)
Mg
(mg kg−1)
Mn
(mg kg−1)
N
(mg kg−1)
Al
(mg kg−1)
SO4−2-S
(mg kg−1)
Colorado8.0 a3.034.66.654.4 b324.5 a47.6 a602.0 a61.8 ab1100 b47.0 c30.5 a
Iowa6.2 b3.076.03.015.7 b148.9 bc25.6 b308.3 b23.5 b1500 a827.9 b4.4 c
Michigan6.0 b1.7145.65.0214 a190.9 b15.2 b125.8 c53.0 b1000 b949.5 a12.0 bc
Uganda5.9 b2.3123.63.224.8 b97.6 c20.0 b179.0 c129.0 a1500 aN/A15.8 b
SE0.31.069.73.527.239.86.234.538.618818.44.8
p > F***nsnsns***********************
Means followed by different letters within each column indicate significant differences among locations at p < 0.05; ** significant at p < 0.01 and *** significant at p < 0.001; ns = not significant; All elemental concentrations determined following Mehlich-3 extraction.
Table 4. Mean grain elemental and crude protein (CP) composition of four common beans varieties grown in four locations and two years.
ParameterCP
(g kg−1)
Fe
(mg kg−1)
Zn
(mg kg−1)
P
(mg kg−1)
K
(mg kg−1)
Mg
(mg kg−1)
Mn
(mg kg−1)
Al
(mg kg−1)
Na
(mg kg−1)
S
(mg kg−1)
Location
Colorado2115045425313696187123147612405
Iowa2211155539513837208333252172221
Michigan206138490114143177319174561921
Uganda276530439512998190221NA122342
Variety
Eclipse21 b141404181 b12648 b2016 ab26196862181 ab
Montcalm24 a83525110 a13432 ab1658 c22107862341 a
MY0632622 ab79384750 ab14473 a1846 bc2482932028 b
Taurus23 ab84394899 ab14125 a2108 a2375802338 a
SE1.036.110.4482933278287.2844771105
p > F
Location (L)0.08nsnsnsnsnsnsnsnsns
Variety (V)*nsns******nsnsns**
L × Vnsnsnsnsnsnsnsnsnsns
Means followed by different letters within each column indicate significant differences among locations at p < 0.05; * significant at p < 0.05, ** significant at p < 0.01 and *** significant at p < 0.001; ns = not significant.
Table 5. Pearson correlation coefficients for common bean seed weight and grain yield with seed concentrations of phosphorus, potassium, magnesium, sodium, zinc, aluminum, iron, sulfur, manganese, and nitrogen across four locations and two years.
PKMgNaZnAlFeSMnCP 1
Seed weight r0.1360.133−0.394−0.0270.098−0.166−0.112−0.131−0.058−0.223
p > r0.190.200.00010.790.350.170.290.210.610.03
Yield r0.0080.200−0.0200.0090.1560.0890.160−0.1600.123−0.750
p > r0.940.060.850.930.140.460.130.130.270.0001
1 N × 6.25 = Crude protein (CP).

