Environmental Impact Assessment of Organic vs. Integrated Olive-Oil Systems in Mediterranean Context


1
Degree Course of Agriculture, Dipartimento di Farmacia, Università degli Studi di Salerno, (DIFARMA), Via Giovanni Paolo II, 132, 84084 Fisciano, SA, Italy
2
Ages s.r.l. s-Spin-off Accademico, Università degli Studi della Basilicata, Viale dell’Ateneo Lucano, 10-85100 Potenza, Italy
*
Author to whom correspondence should be addressed.
Agronomy 2020, 10(3), 416; https://0-doi-org.brum.beds.ac.uk/10.3390/agronomy10030416
Submission received: 5 February 2020
/
Revised: 9 March 2020
/
Accepted: 17 March 2020
/
Published: 19 March 2020
(This article belongs to the Special Issue Organic vs. Conventional Cropping Systems)
Abstract
:Olive oil is a widely used consumer product, so producers and consumers are increasingly looking for sustainable productions. The olive-oil production chain requires continuous improvements to gradually replace the most environmentally impactful practices with others that are more sustainable. This research aimed to evaluate the environmental impacts of the production of olive oil in the Campania region by comparing six olive oil production systems (two organic certified, two integrated, and two organic—hobbyists). The environmental impacts for the production of one liter of oil—from field cultivation to oil distribution—were quantified by applying the life cycle assessment methodology. Impact categories were calculated according to the CML method, with particular attention paid to global warming potential. The production of one liter of oil caused CO2eq emissions ranging from 0.22 to 3.39 kg. The least impacting cultivation method was the hobby one, which did not use pesticides and carried out organic fertilization. On average, packaging accounted for 60% of total impacts; consequently, the materials and formats choice by farms had strong effects on the environmental sustainability of oil production. This research highlights the problem of expressing sustainability judgments in agriculture, since there are no reference standards/targets that set limits beyond which agricultural productions are no longer sustainable.
1. Introduction
Olive oil is a product with a great economic importance, both in terms of production and consumption, above all in European Union [1]. The olive supply chain is associated with several negative effects on the environment, which cause mainly the depletion of resources, land degradation, air emissions and waste generation [2]. This is due to the techniques adopted for olive cultivation, the oil extraction method chosen, and the management of by-products and waste, which vary among the different producing countries, but also from region to region of the same country. As a matter of fact, olive oil production is affected by the specific local traditions, the characteristics of the cultivars, the typical agronomic management and by the specific socio-economic and climatic conditions of the territory [3].
Olive tree cultivation has been handed down over time, thanks to the beneficial properties of the olive oil, both nutritional and healthy, and the longevity and adaptability of this crop. Consequently, olive production has undergone a strong increase to the present day. Furthermore, in the wake of the success of the “Mediterranean diet”, declared as a cultural heritage of humanity by UNESCO [4], there has been a record growth in the world consumption of olive oil: this, in the last 25 years—a single generation—has increased by almost 49%, changing the diet of citizens in many countries, from Japan to Brazil, from Russia to the United States, from Great Britain to Germany [5].
Since the olive tree is a Mediterranean crop, even today in 2018, after thousands of years, about 93% of the olives’ production (in tons) is concentrated in the Mediterranean basin, and in particular in Spain (1,839,000), Italy (413,200), Tunisia (289,000) and Greece (208,900) [6]. World olive oil production, variable as a result of the alternate bearing characterizing this species, in 2018 amounted to 3083 thousand tons [7], considering the fact that now medium and good quality productions are also obtained in Argentina, Australia and United States. At the quantitative level, the production of these last three countries remains marginal, as it covers less than 2% of the entire world olive area [6].
As for the consumption of olive oil, from data released by the International Olive Council (IOC) in 2014, Italy is the first olive oil consumer, with 620 thousand tons of the 3 million tons consumed in the world, followed by Spain and Greece, which hold, together, 42% of world consumption. The same data also showed a sharp increase in consumption in non-European countries. From 1991 to 2013, in the reference years for the IOC data, a growth rate in global consumption of 3.4% per year was observed, going from 1 million and 666 thousand tons in 1991, exceeding 3 million in 2014. The biggest growth trends have occurred in Australia, the USA and Japan, with an average annual growth of 11%, 10% and 4%, respectively [8]. In Italy, the total area covered by olive groves is 1,147,505 hectares. The regions with the largest olive areas are the following: Puglia (392,150 ha), Calabria (183,400 ha), Sicily (157,586 ha), Tuscany (83,525 ha), Lazio (80,181 ha) and Campania (75,334 ha) [9].
The Italian farms that cultivate olive for oil are 825,201 [9], 81% of which have an average size of less than five hectares. Most of them are family-run and do not guarantee the sustenance of the family. They are often managed on a part-time or even hobby basis, so are the most environmentally friendly. In these cases, the agricultural activity is a secondary and marginal activity, with an unsatisfactory profitability. As a consequence, this does not generate interest in investing in olive growing [9]. On the other hand, the few biggest farms (19% are those with more than five hectares and representing 48% of the Italian olive surface), whose aim is to increase productivity and farm profitability, are able to produce enough olive oil to make Italy the second country in the world for production (45% Spain, 15% Italy) and export (60% Spain, 20% Italy) [7]. This type of intensive cultivation, aimed at increasing output through more input use (labor, capital, energy, other raw materials) and higher resource yield by means of technological progress, has led to a rise in agricultural incomes but also to the depletion of natural resources which are already scarce. At the same time, the concept of sustainability—understood as the right balance between the environmental, social and economic elements of a system—has become widespread. This is born to break the continuous resources consumption and limit the impacts that production systems have had on the environment. The right balance, achievable with sustainable development, is not a definitive harmony condition, but rather a process of change based on choices (resource exploitation, investments direction, orientation of technological development and institutional changes), coherent with the future needs as well as with the present ones [10]. Therefore, sustainability must be seen as a continuous process, not as a state, towards inter-generational equity and respect for the environment. Within the agricultural sector, organic farming can ensure this. In particular, sustainable agriculture uses and integrates local natural resources in order to maintain and improve soil fertility, promote more efficient use of water, increase the biodiversity of plant species and farmed animals, protect biodiversity in soils and agricultural environments, reduce the use of synthetic products for pest and pest management and promote ecosystem and social services within the territory [11]. This becomes part of the regulated organic agriculture, which responds to what is established by the current European regulations on the subject [12,13] and is subjected to a control that is systematically applied to all productions. However, as said by Tuck et al. [14], the overall benefits of organic farming on biodiversity, environment, human health and food security have been intensely debated in recent years. Indeed, sustainable agriculture implies the ability of agro-ecosystems to remain productive in the long-term, namely to be economically competitive, to produce enough quantities of high-quality food at affordable prices, and to be environmentally friendly [15]. The continuous increase in the use of human-made inputs has increased crop yields, but it has caused reductions in the quality of natural capital (e.g., soil degradation, pollution, reduction of natural resources) and, therefore, of the production capacity [16,17,18,19]. However, the development and characteristics of organic technology raise important research questions concerning its productivity and technical efficiency in using capital, labor and natural resources such as land and energy [20]. Therefore, there is the need to analyze each specific situation to design locally appropriate management systems. To be sustainable, the olive oil supply chain requires a continuous improvement process, in which the most impactful techniques, those harmful for the environment, are progressively replaced with more sustainable ones. There are several methodologies to assess the agricultural impact on the environment. Notably, van der Werf and Petit [18] affirmed that indicators of environmental impact may be based either on farmer production practices (“means-based”) or on the effects these practices have (“effect-based”) on the state of the farming system or on emissions to the environment. So, these authors compare and analyzed 12 indicator-based approaches to assess environmental impact at the farm level, providing a characterization of their components and functioning at the farm level. They concluded that a great diversity in their analysis exists and, consequentially, science-based threshold values should be defined for indicators and the method used should be validated with respect to the appropriateness of its set of objectives relative to its purpose and its indicators. Payraudeau and van der Werf [21] provided an analysis of six main methods used for assessing the environmental impact of agriculture on the scale of a farming region (environmental risk mapping, life cycle analysis, environmental impact assessment, multi-agent system, linear programming and agro-environmental indicators). They concluded that indicators which express and impact both per kg of product and per unit of land area used bring together the essential functions of agriculture, namely production and occupation of the countryside. Lastly, the method should be validated with respect to the conception of the method and its indicators, the consistency of the values of the indicators in relation to observed values, and finally, the suitability of the indicators and more generally, of the assessment method for the end users. The authors of the present research think that the life cycle assessment (LCA) is the only methodology that allows one to analyze the whole life cycle of a product or service. Furthermore, as said by Backer et al. [15], LCA has proven to be a valuable tool to address questions on the environmental impact of various agriculture production systems, relating to both the identification of the subsystems that contribute most to the total environmental impact and the comparison of products and processes with the same function [22,23,24,25,26,27,28,29]. So, Cederberg and Mattsson [30], Haas et al. [31], de Boer [32], Gravendijk [33], Thomassen et al. [29], Knudsen et al. [34] and Pirlo and Lolli [35] used LCA technique to analyze conventional and organic milk production chains. Nienhuisen de Vreede [36], Kramer et al. [37], van Woerden [38], Halberg et al. [39], Foteinis and Chatzisymeon [40] and Ronga et al. [41] assessed the LCA profile of organic and conventional vegetables. Nicoletti et al. [42] and Villanueva-Rey et al. [43] applied LCA to investigate the environmental performance of organic/biodinamic and conventional vine growing, and Stern et al. [26], Noya et al. [44], McAuliffe et al. [45] and Makara et al. [46] studied various scenarios for sustainable pig production by means of LCA. A wide review of LCA applications in the fruit sector can be found in Cerutti et al. [47] and those specifically for the olive oil sector in Espadas-Aldana et al. [1].
Attention and importance must be given to C sequestration by agricultural systems (soil and plant), especially those composed by perennial crops. Aguilera et al. [48] evidenced low N2O emissions associated to organic fertilizers and higher soil organic carbon (SOC) stocks in organically managed soils under a Mediterranean climate. González-Sánchez et al. [49] found a C sequestration rate under cover crops in Spanish fruit tree orchards to be equal to 1.59 Mg C ha−1 in short-term experiments (<10 years) and 0.35 Mg C ha−1 in long-term ones (>10 years). Palese et al. [50] demonstrated as some agronomical sustainable practices—the distribution of the real nutrient needs of the olive grove by balanced fertigation, annual pruning, cover crops use, recycling of organic materials internal to the orchard (cover crops and pruning residues left on the ground)—improved the ability of the olive grove to sequester CO2. Looking at the calculated CO2 fluxes (Annual Net Primary Productivity versus total emissions), this olive orchard system showed a positive budget, with a high gain of CO2 (15.45 t ha−1 year−1) sequestered from the atmosphere. Mohamad et al. [51] found that manure was the primary contributor to increased SOC in an organic system, resulting in a higher efficiency of carbon sequestration. This SOC increase compensated for the higher carbon emission from the organic system, resulting in higher negative net carbon flux in the organic versus the conventional system (−1.7 vs. −0.52 t C ha−1 year−1, respectively) and higher efficiency of CO2 mitigation in the organic system. Proietti at al. [52] reported that non-permanent components (olive pruning and fruits) have a great ability to stock C: the greatest contribution to this quantity is due to the fruits, which have a storage capacity of more than twice than pruning residues. Even if the carbon stocked by fruits is lost from the olive grove through the harvesting operation, a significant percentage would return to soil thanks to the soil amendment operation realized with olive pomace. In their study, the net carbon balance of the analyzed olive systems was always positive, with carbon sequestrations greater than emissions. For this reason, the authors assumed that olive groves are agricultural systems, able to remove all the emissions associated to the oil production chain. They highlighted that extra virgin olive oil can be a potential carbon negative product under certain conditions, mainly if of local origin (“km 0” product) and produced by means of traditional practices [52].
The present research analyzed and evaluated some olive oil production systems, under an organic and integrated regime and representative of Salerno Province (Campania region). The main aim was to quantify their environmental impact, identify those operative strategies leading to the respect of the sustainability principle and suggest the most effective management options. LCA methodology was used as a tool for the analysis and the environmental evaluation of the olive oil production systems and as support for the improvement of their environmental performance. Specifically, six olive-oil systems with different characteristics were analyzed: two certified as organic (BIO1, BIO2), two integrated (INT1, INT2), two organic—hobbyists (HOBB1-BIO, HOBB2-BIO). In the present work, the LCA methodology did not analyze the full carbon (C) balance, but only the emissions.
2. Study Area and Systems Description
In the Campania Region, the olive tree has found its ideal environment, thanks to the volcanic soils and the typically Mediterranean climate. Here, olive is a source of income for many farms, but also an important guarantor protection of territory and landscape. In Campania, 85,870 olive oil farms spread over almost 75,000 hectares of UAG (utilized agricultural area), equal to almost 10% of national olive oil farms and just under 8% of Italian olive oil UAG [9]. Of the farms that produce olive oil (85,870), about 1000 are organic [9]. Moreover, Campania can boast an excellent olive growing, thanks to the autochthonous varieties of high typicality and prestige. As a matter of fact, there are 311 farms that produce PDO (protected designation of origin) olive oil [9]. The regional olive production is strongly oriented towards self-consumption, with a residual share of farms (around 5%) that declare commercialization of the product. The preferred marketing channel is the direct sales at the farms, adopted by 40% of the farmers in combination with other channels (catering, retail, large-scale distribution, ecommerce), and it represents an exclusive channel only for a third of them. About a fifth of the farms sell to other commercial or industrial companies, while 15% prefer direct sales outside the farm and only 7% sell all its production [53]. Referring to the olive industry, Campania has 317 oil mills with 699 employees that represent 9.7% and 7.8% of the national total, respectively, and 16% and 12.7% of the Southern Italian [9].
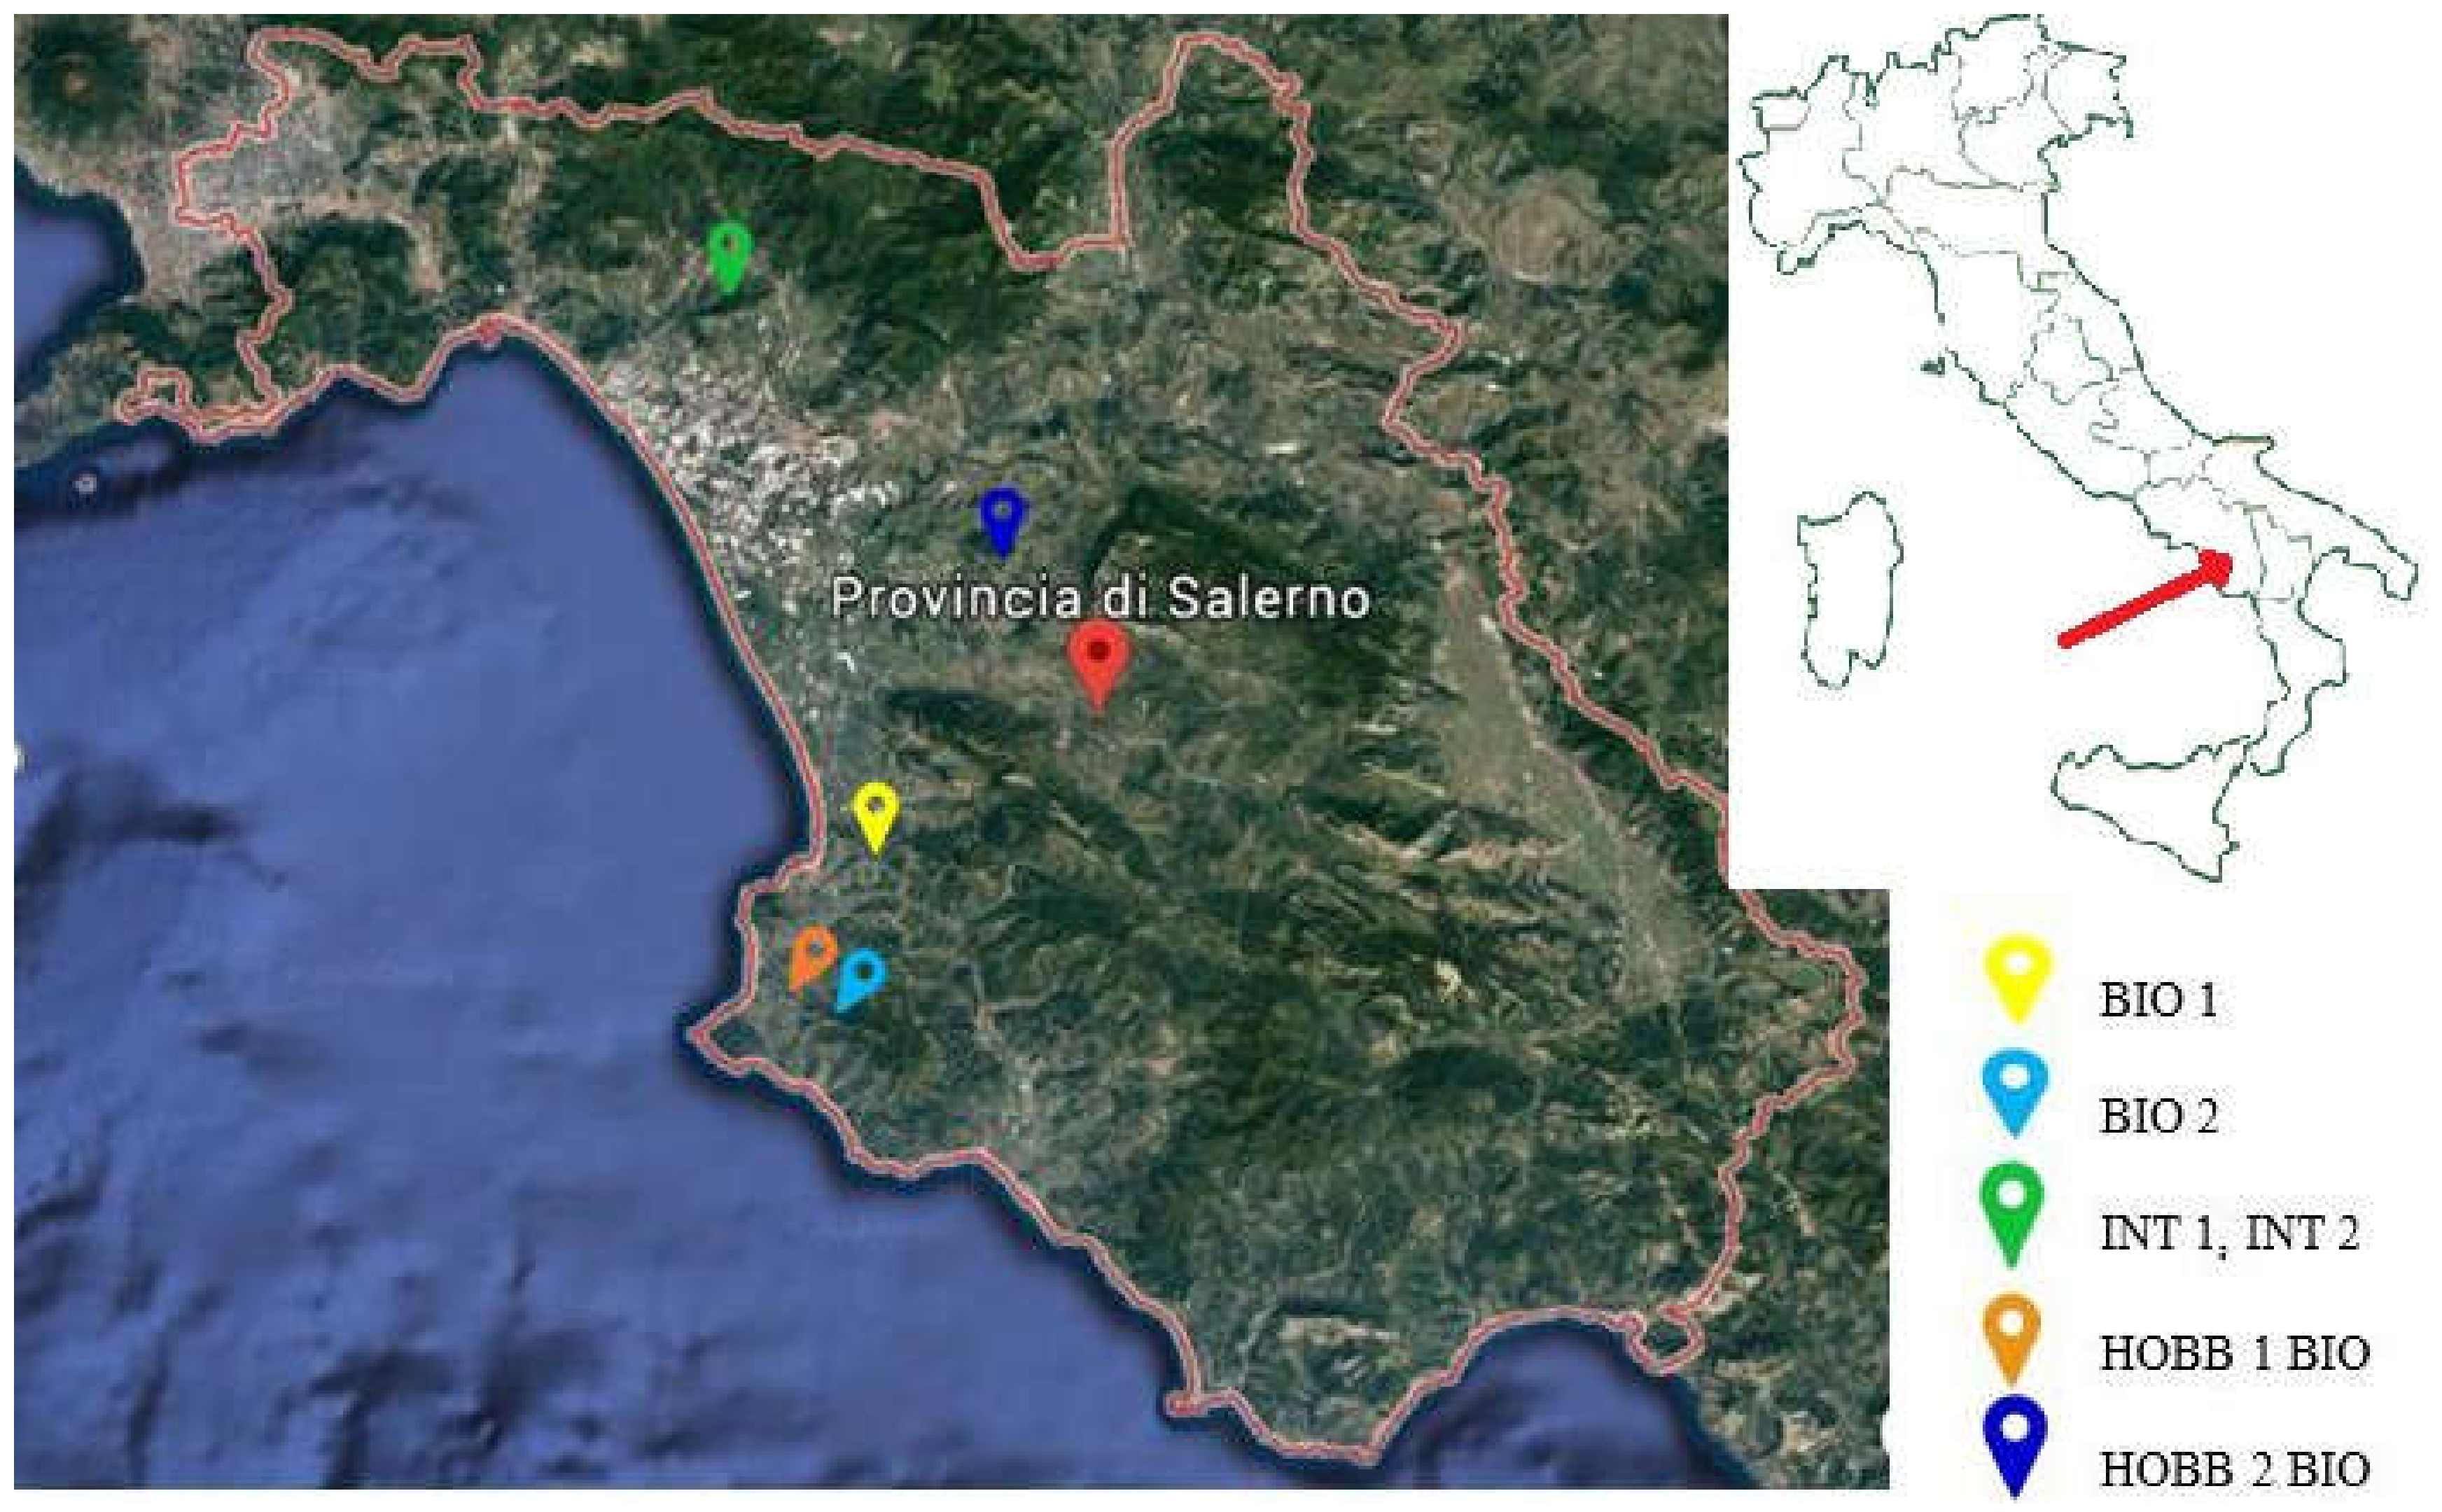
The study was carried out in Salerno Province (SA), where there are 38,420 olive farms [9]. This province shows a very high vocation for olive growing, mainly thanks to the climate and the typical soils of the territory. Specifically, the analyzed production and processing farms are located in Cilento, Alburni and Valle di Diano National Park (namely BIO1, BIO2, HOBB1- BIO, HOBB2- BIO) and in Monti Picentini Regional Park (INT1 and INT2, which fall in the same farm) (Figure 1).
The main features of the studied orchard systems are reported in Table 1. They were collected through: direct interviews with farmers using a specific collection sheet; visits to the farms and consultation of field notebooks. The olive orchard systems differed mainly for cultivar (Salella, Leccino, Frantoiana, Rotondella, Ogliarola and Carpellese) and for the used cultivation system: organic (certified or not) vs. integrated. The integrated system is the most common method to manage fruit orchards in the studied area. It is a “mixed” cultivation method which uses both chemical and natural products in fertilization and disease control. This farming system produces high quality yields using specific protocols, as reported in Decree No. 2722, 17/04/2008 [54].
3. Materials and Methods
The analysis was performed using the LCA approach according to the ISO 14040-44: 2006 [55,56]. As said by Pergola et al. [57], LCA is an analytical tool which allows one to identify the overall environmental impacts of a product, process or human activity from raw material acquisition, through production and use, to waste management [58]. The purpose of LCA studies can be the comparison of alternative products, processes or services; the comparison of alternative life cycles for a certain product or service; or the identification of steps of the life cycle where the greatest improvements can be made [59].
3.1. Goal and Scope Definition
One of the aims of the present research was to estimate and compare the environmental impacts of six olive oil systems, in which the agricultural phase differs according to three systems of cultivation (certified organic, integrated and not certified organic). The study was “cradle to grave”, namely from the extraction of raw materials up to the sale of the final product (olive oil), excluding the planting phase of the olive orchards, as foreseen by the relative PCR (product category rules) 2010:07 “Virgin olive oils and its fractions” [60], since the analyzed orchards were secular or in any case planted for more than 25 years.
Keeping in mind that the aim of the present research was the estimation of environmental impacts to adopt the most sustainable management options, two functional units, namely the reference on the basis of which all data were analyzed and characterized [55,56], were chosen: on the one hand, one liter of oil produced, as established by the relative PCR, including its primary and secondary packaging in glass bottles (capacity of 0.1–0.25–0.75–1 liter) and in tins (capacity of 3 and 5 liters); on the other hand, the surface unit (1 hectare) with the aim to improve environmental results interpretation [57,61,62].
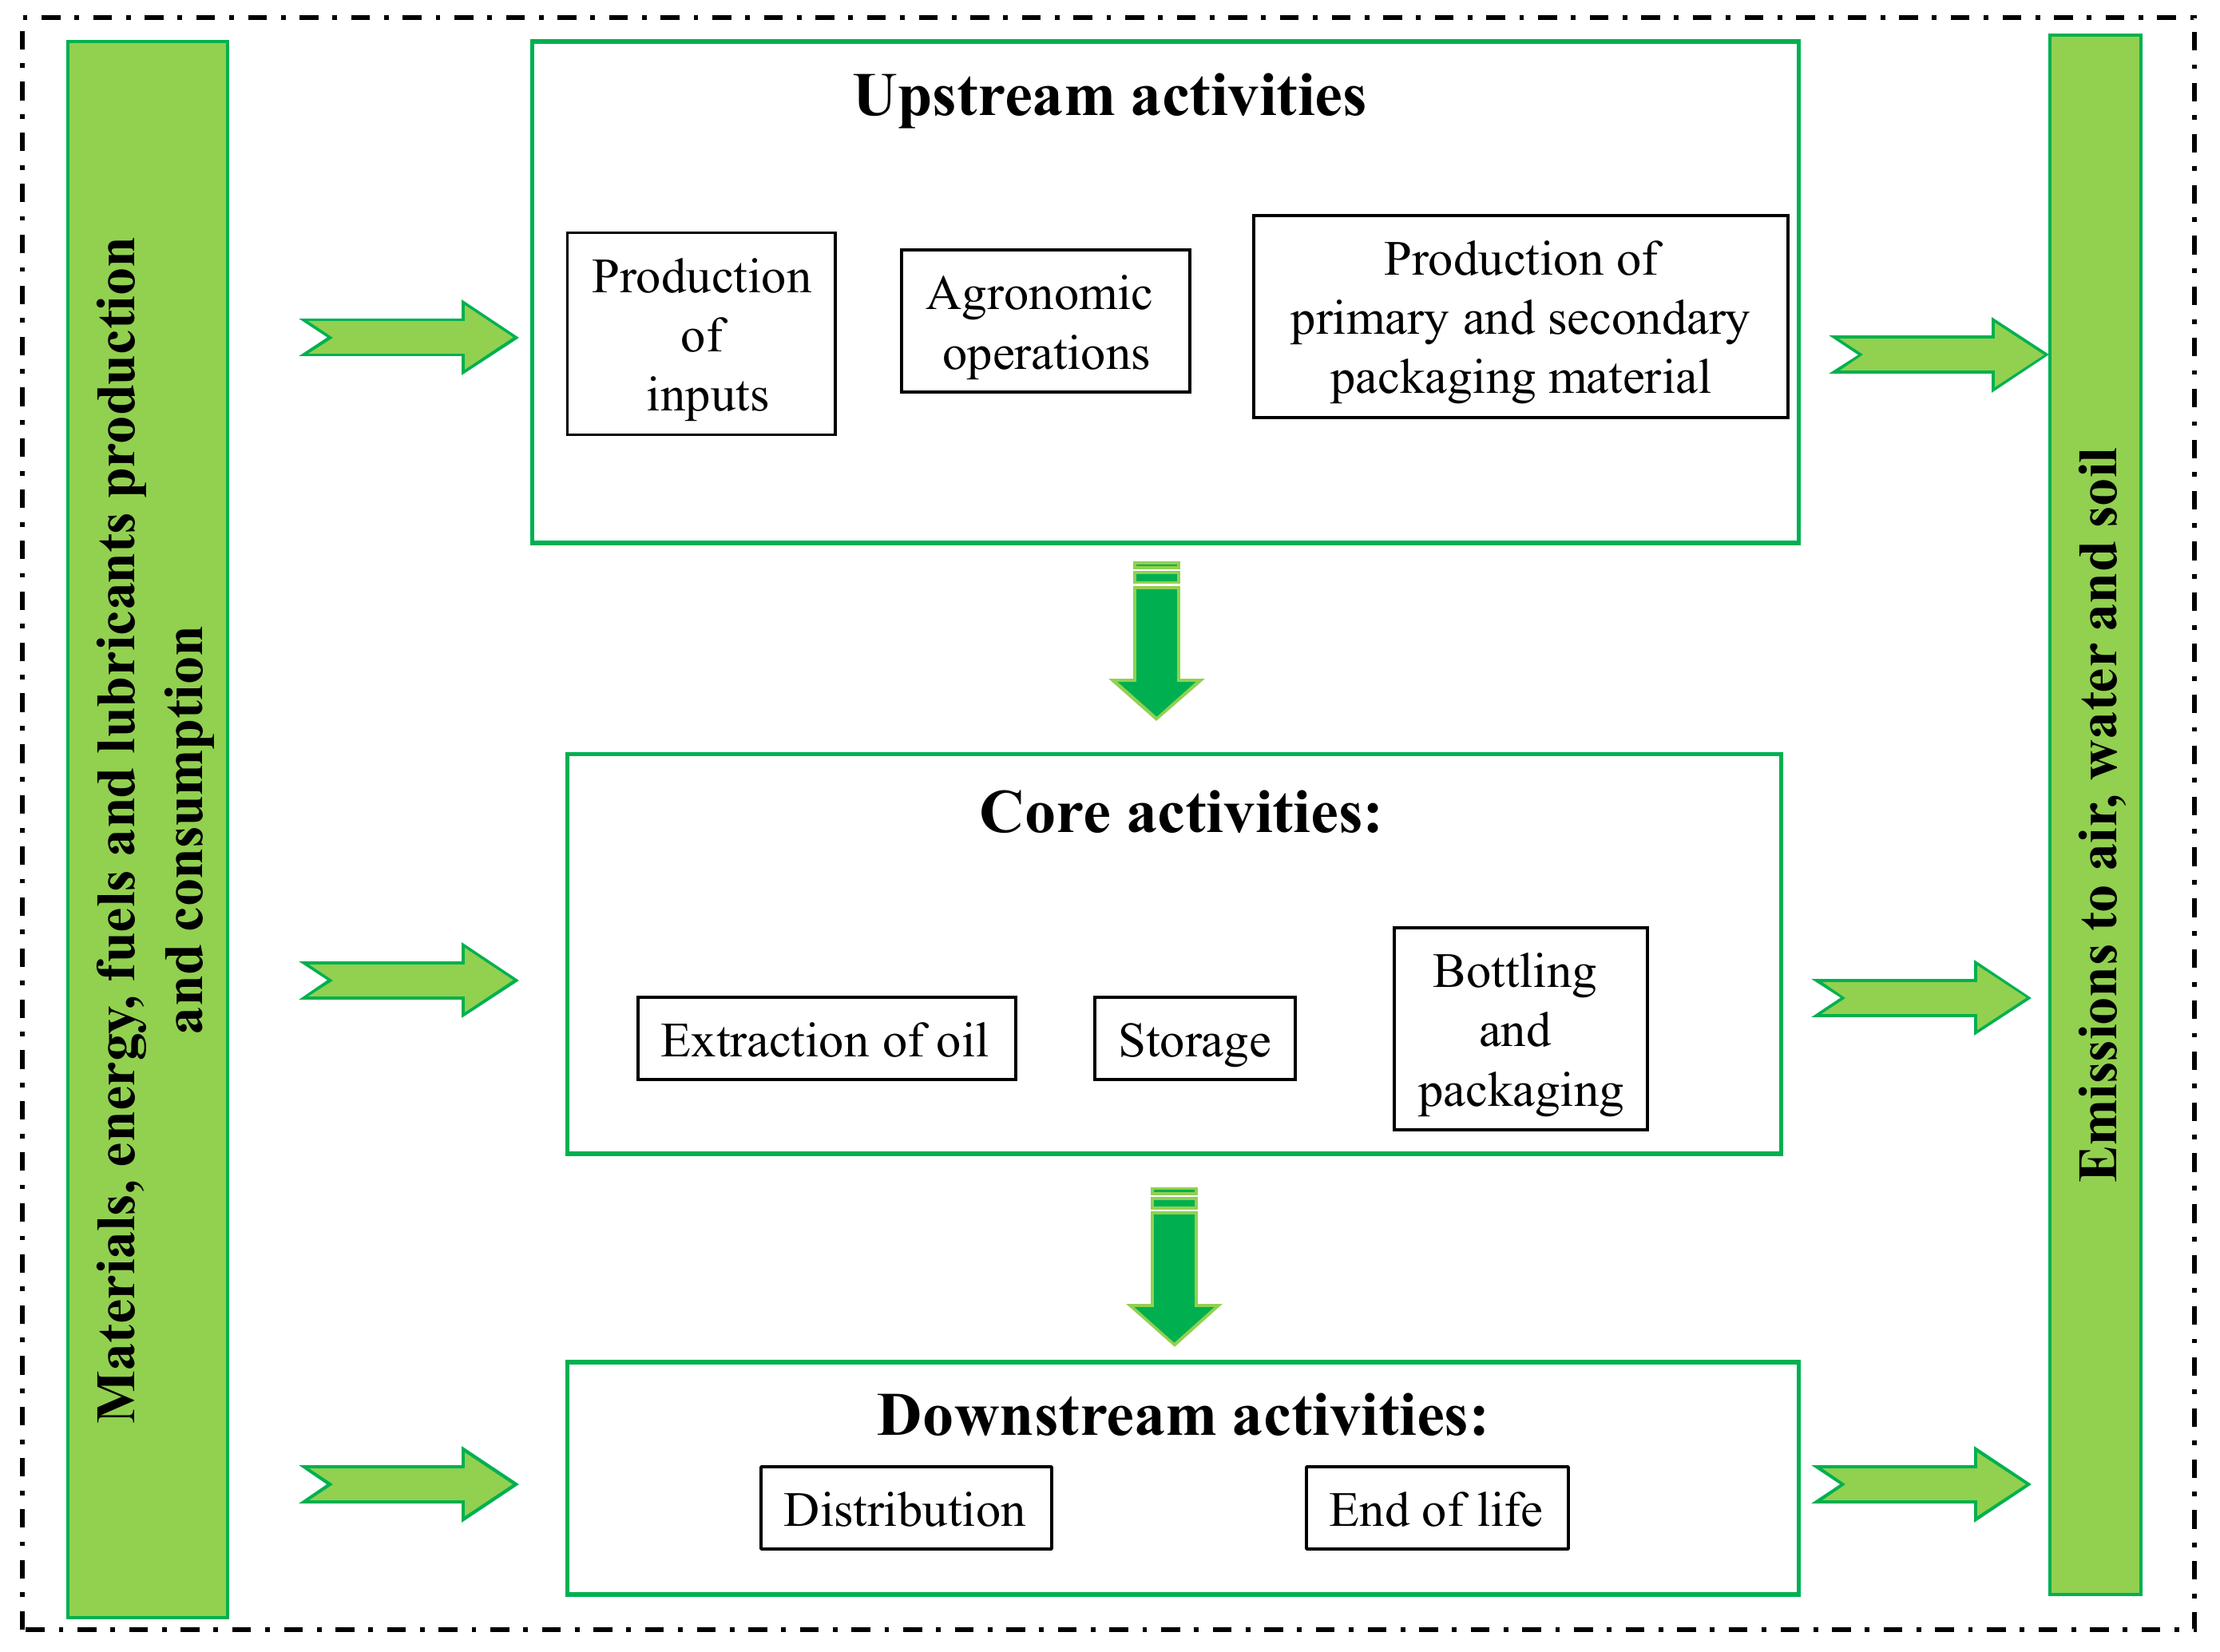
The system boundaries, as shown in Figure 2, started from the olive tree cultivation and ended with the olive oil sale. They included all the activities characteristic of the olive oil supply chain, divided into upstream, core and downstream activities. In particular, among the upstream activities, the following were considered:
- input production;
- agronomic operations for olive tree cultivation (pruning, soil tillage and management, cutting of pruning residues when present, fertilization, disease control), olives harvesting and their transport to the olive oil mill;
- production of primary and secondary packaging material; among core activities:
- processing of olives into oil, its storage, bottling and packaging; among the downstream activities:
- distribution and the end of life of inputs and materials.
The analysis did not consider:
- the use phase, as no environmental impact is associated to the traditional use of extra virgin olive oil (to flavor foods). Furthermore, it was assumed that olive oil was consumed raw and that the residue present in the bottle was irrelevant compared to the total quantity of the product;
- in accordance with the PCR in force [60], machines and tools used as well as the buildings, since they have a useful life of more than 10 years;
- impacts related to the end of life of pruning material removed from the field—since it was destined to another use (firewood)—and pomace, which in the area under study is usually sold to composting plants or biogas plants, so falling under other life cycles as by-products.
Furthermore, due to the lack of data, the analysis did not consider:
- input transport (fertilizers and pesticides) from the place of production to the field.
All the inputs used in the agricultural phase (fertilizers, pesticides, fuels, various materials utilized during the harvesting) were considered. For the other phases—oil processing and distribution —all energy consumptions and the different materials used were taken into account.
3.2. Life Cycle Inventory
Primary data (features of the studied orchard systems, amount of fertilizers, chemicals, diesel, water and other items) were collected in situ during the 2018–2019 agricultural year, as an average of the last 5 years of production, using a data collection sheet. This information was gathered from farmers. The following operations were taken into account: agronomic operations for olive tree cultivation; transport of the olives from the field to the oil mill; processing of olives into oil, its storage, bottling and packaging; distribution of the produced olive oil. As already mentioned, farm features are reported in Table 1, while farm inputs used in the examined systems are reported in Table 2. Table 3 shows the different methods adopted to transport olives from the field to the oil mill for each olive oil system, with details on means (essential for estimating the fuel consumptions), type of containers, as well as on average distance between field and oil mill. Information on oil extraction (methods, energy consumption, inputs) are reported in Table 4. Olive oil extraction took place via a “centrifugation” system. According to this method, the oil paste is subjected to centrifugation in a conical drum rotating on a horizontal axis (called a decanter). The average consumption (kW kg-1 of processed olives) varied according to the hourly capacity of the oil mill and the quantity of pressed olives. Oil yield depended in part on the oil mill, but it was closely linked to the cultivar, olive maturation, time between harvesting and milling, and management of the agricultural phases (Table 4). Data on packaging of the olive oil produced and on its distribution are reported in Table 5 and Table 6, respectively. In this research, priority was given to using primary data in terms of input material typologies and amounts used (Table 2). Additionally, to estimate direct and indirect emissions, the active ingredient of each product, and the amount of fuel and energy consumed, were calculated and used in the analysis for each operation as a standard practice in LCAs. Methodological details are specified in Pergola et al. [57].
3.2.1. Direct Field Emissions
Direct emissions from fuel and lubricants were taken from SimaPro’s LCI databases. Referring to fertilizers, as explained in our other research [57], an entire mineral balance was not undertaken to estimate emissions from them. It is often difficult to derive exact rates of N released to the air and water, because emission rates can greatly vary depending on soil type, climatic conditions, and agricultural management practices. However, nitrogen emissions from the cultivation were accounted for according to Brentrup et al. [63] and IPCC [64]. In particular, considering the air temperature occurred at the organic nitrogen application time, the timing of soil incorporation and rainfall events, ammonia emissions in air from organic nitrogen, valued in the systems INT1 and INT2, were equal to 15% of the applied NH4-N. Ammonia volatilization from mineral fertilizers application (namely NPK for HOBB1 - BIO) to soil incorporation, evaluated taking into account the type of mineral fertilizer and the geographical location of the olive system, was equal to 2% of the applied NH4-N. The nitrous oxide emissions are influenced by a lot of interactions between soil, climate factors and parameters determined by agricultural management (soil aeration, soil water content, nitrogen availability, soil texture, compaction, etc.) and they are not well understood to propose their estimation or even an appropriate calculation method [63]. So, as proposed by Brentrup et al. [63], N2O emissions from fertilizers were computed considering the emission factor proposed by Bouwman [65] equal to 0.0125. N2O emissions from crop residues (grass cover and pruning residues) should be instead accounted for considering their annual N content and the corresponding emission factor equal to 0.01 [65], but in the present study were not considered for the lack of data on grass cover and pruning material quantity. Likewise, N leaching and run-off, as N loss processes, were not considered because the analyzed orchards fall in an area where leaching/run-off does not occur; in addition, the difference between precipitation in the rainy season and the potential evaporation in the same period is not greater than soil water holding capacity. Moreover, irrigation was not employed within the analyzed orchards [64].
As in Milài Canals et al. [28], emissions of synthetic pesticides to air, surface water, groundwater and soil were estimated according to the methodology suggested by Hauschild [66]. These estimates considered both site conditions (soil organic matter, texture, climate, etc.) and physico-chemical characteristics of the active ingredients (vapor pressure, half-life determined by photolysis, half-life in soil, adsorption coefficient to organic material in soil). In more detail, the predominant route to the surrounding environment for the considered active ingredients has been via volatization and re-deposition.
3.2.2. Embodied Emissions
Secondary data were extrapolated from international databases of scientific importance and reliability, like the Ecoinvent 3 [67]. In particular, this was done for the production of diesel, lubricants, fertilizers and pesticides used in the investigated systems, including the accounting of the resulting emissions, as specified in Pergola et al. [57]
3.3. Life Cycle Impact Assessment
The impact assessment was performed using SimaPro 8.02, with the problem oriented LCA method developed by the Institute of Environmental Sciences of the University of Leiden [68]. The following impact categories were considered according to the selected method: abiotic depletion (AD); abiotic depletion (fossil fuels) (AD fossil fuels); global warming potential (GWP) or climate change; photochemical oxidation (PO); ozone layer depletion (ODP); human toxicity (HT); fresh water aquatic ecotoxicity (FWE); marine aquatic ecotoxicity (MAE); terrestrial ecotoxicity (TE); air acidification (AA) and eutrophication (EU).
4. Results and Discussion
Results concern the entire life cycle of the production of olive oil. As a matter of fact, environmental impacts associated with all the phases necessary to obtain a bottle of olive oil, from field to the end of the production cycle—the so-called “cradle to grave” approach—were evaluated. Particularly, data are shown as total impacts relating to all the impact categories analyzed and with a focus on the global warming potential for each phase of the oil production chain.
4.1. Results on Data Collection
Among the analyzed farms, the organic cultivation system was the most present, albeit managed in different technical ways. Common to all organic farms was the use of fertilizers and pesticides of natural origin. The system INT1 applied an integrated cultivation system, using synthetic fertilizers, pesticides and glyphosate for weed control. The system INT2, although using an integrated cultivation method, did not carry out chemical weed control (Table 1).
Other important differences of the cultivation phase among the analyzed systems concerned the final destination of pruning residues and the harvesting methods. With reference to the former, only BIO1 and INT2 chopped pruning residues in the field, BIO2 used them in composting as structuring materials; the others moved them away from the field to use as firewood. Harvesting was carried out with different methods depending on the size of the farm. In particular, BIO1, BIO2 and INT2 carried out a mechanized harvesting using different capacities and power tractors combined with a mechanical shaker. HOBB1-BIO and HOBB2-BIO, being small and purely hobbyist farms, carried out a manual harvesting by means of electric shakers. INT1 system performed harvesting with manual combs. This last farm, before harvesting, carried out a preliminary operation aimed at covering the ground with nets, sewn with special sewing machines, which is a typical operation performed in the study area to prevent the loss of part of olive during harvesting. For this reason, INT1 farm had the highest number of harvesting hours (400 h), even if 80% of these hours were used precisely for the preparation of nets with the sewing machines.
Among systems, INT2—the intensive olive grove—showed the highest yield per hectare, due to the highest plant number per hectare and to intensive soil and plant management, aimed at achieving maximum production per unit area (Table 1).
Packaging of the olive oil produced was a crucial process for the olive-oil production chain. The farms interviewed respected the needs and demands of the market, and systems BIO2, INT1 and INT2, present on the regional and national markets, but also on international, used certain formats in place of others.
Systems using the primary packaging (Table 5) showed the following behaviors:
- BIO1 used mainly the 3-liter tin (70%) and only a bit of the bottles;
- BIO2 used mostly 0.5 and 0.7-liter bottles (80%) and minimally the tins;
- INT1 and INT2 clearly prefer the 5-liter tin (70%) and limitedly the bottles.
Dark glass bottles were used in order to delay the oxidation processes favored by the light. Choice formats depends a lot on the intended use of the product. Specifically, if the oil is used for catering as a condiment to be served at the table, the format of 0.25 l is preferred. This is because, as established by law 161/2014 in article 18 [69], packaged oils used in public establishments must be equipped with a closing system (anti-filling plug), in so as to avoid its reuse after the exhaustion of the original content indicated on the label. Tinplate made with a single metal and without welds was another type of packaging very common among the examined systems. Thanks to modern technologies, the welding phase of this metal has been eliminated to avoid corrosion phenomena and iron release in ionic form, which catalyzes the oil degradation process when the package is opened. The tin was mainly intended for customers who purchase large quantities of olive oil.
“Hobby” systems, which did not sell the oil, did not resort to any type of packaging (Table 5). In fact, HOBB1-BIO and HOBB2-BIO used a single plastic container for oil transport from the oil mill to the farm. The container was then washed and reused, and renewed on average every five years. Olive oil, once at farm, was immediately transferred into a steel container for subsequent storage. Only INT1 and INT2 used the secondary packaging, and specifically a recycled cardboard box with a 3-liter capacity.
Referring to distribution, olive oil was mainly sold on the regional and national markets, where it was placed by means of road transport (Table 6).
4.2. Total Environmental Impacts along the Entire Life Cycle
Environmental impacts were calculated for 11 impact categories, according to the 2010: 07 PCR [60] (Table 7). Results—for each olive oil system—are referred to the functional unit and allow to make the following observations:
- the most sustainable systems were the hobby-organic ones, for all impacts categories;
- INT1 was the most impactful in terms of resource consumption (abiotic depletion), global warming, and marine and terrestrial ecotoxicity;
- BIO2 was the most impactful in reference to human toxicity;
- BIO1 was the most impactful in reference to the ecotoxicity of fresh water.
Data normalization showed that each impact category was influenced by a different group of operations, depending on the system considered. In particular, abiotic depletion was due to packaging in all systems, except in the hobbyist ones. Fossil fuels depletion, global warming potential and ozone layer depletion were mainly due to packaging and the agricultural phase in BIO and INT systems (specifically soil management in BIO1; harvesting in BIO2; fertilization in INT systems), while, in HOBB1-BIO, to transport, harvesting and fertilization and in HOBB2-BIO, to soil management, harvesting and transport. In BIO and INT systems, human toxicity, aquatic (fresh water and marine) and terrestrial ecotoxicity were due mainly to the agricultural operation of disease control and packaging, while in HOBB1-BIO to harvesting, transport and transformation, and in HOBB2-BIO to soil management and transformation. Photochemical oxidation was influenced in a more varied way: mainly by packaging in BIO1; by packaging and harvesting in BIO2; packaging and fertilization in INT1 and INT2; by fertilization, harvesting and transport in HOBB1-BIO and by soil management, harvesting and transport in HOBB2-BIO. Finally, acidification and eutrophication were mainly due to disease control/fertilization and packaging in all BIO and INT systems; to fertilization, harvesting and transport in HOBB1-BIO and, as above, to soil management, harvesting and transport in HOBB2-BIO.
Referring to global warming, the most impactful olive oil system was INT1 (3.39 kg of CO2eq l–1), which implemented an integrated cultivation method, followed by the certified organic BIO1 system (2.77 kg of CO2eq l–1), INT2 (2.64 kg of CO2eq l–1), BIO2 (1.82 kg CO2eq l–1) and the HOBB1-BIO system (0.74 kg of CO2eq l–1). HOBB2-BIO was the system with the lowest impact per unit of product (0.23 kg CO2eq l–1), thanks to the adoption of organic-related cultivation methods and to the total absence of phytosanitary treatments (Table 7). On the other hand, by comparing these emission data with C sequestration range reported by Proietti et al. [52]—from 6.15 to 17.79 kg CO2eq l-1 of olive oil—it is possible to assert that all the analyzed systems are sustainable: the net balance is positive, since C sequestered is greater than that emitted.
4.3. Environmental Impacts per Each Phase of the Production Chain
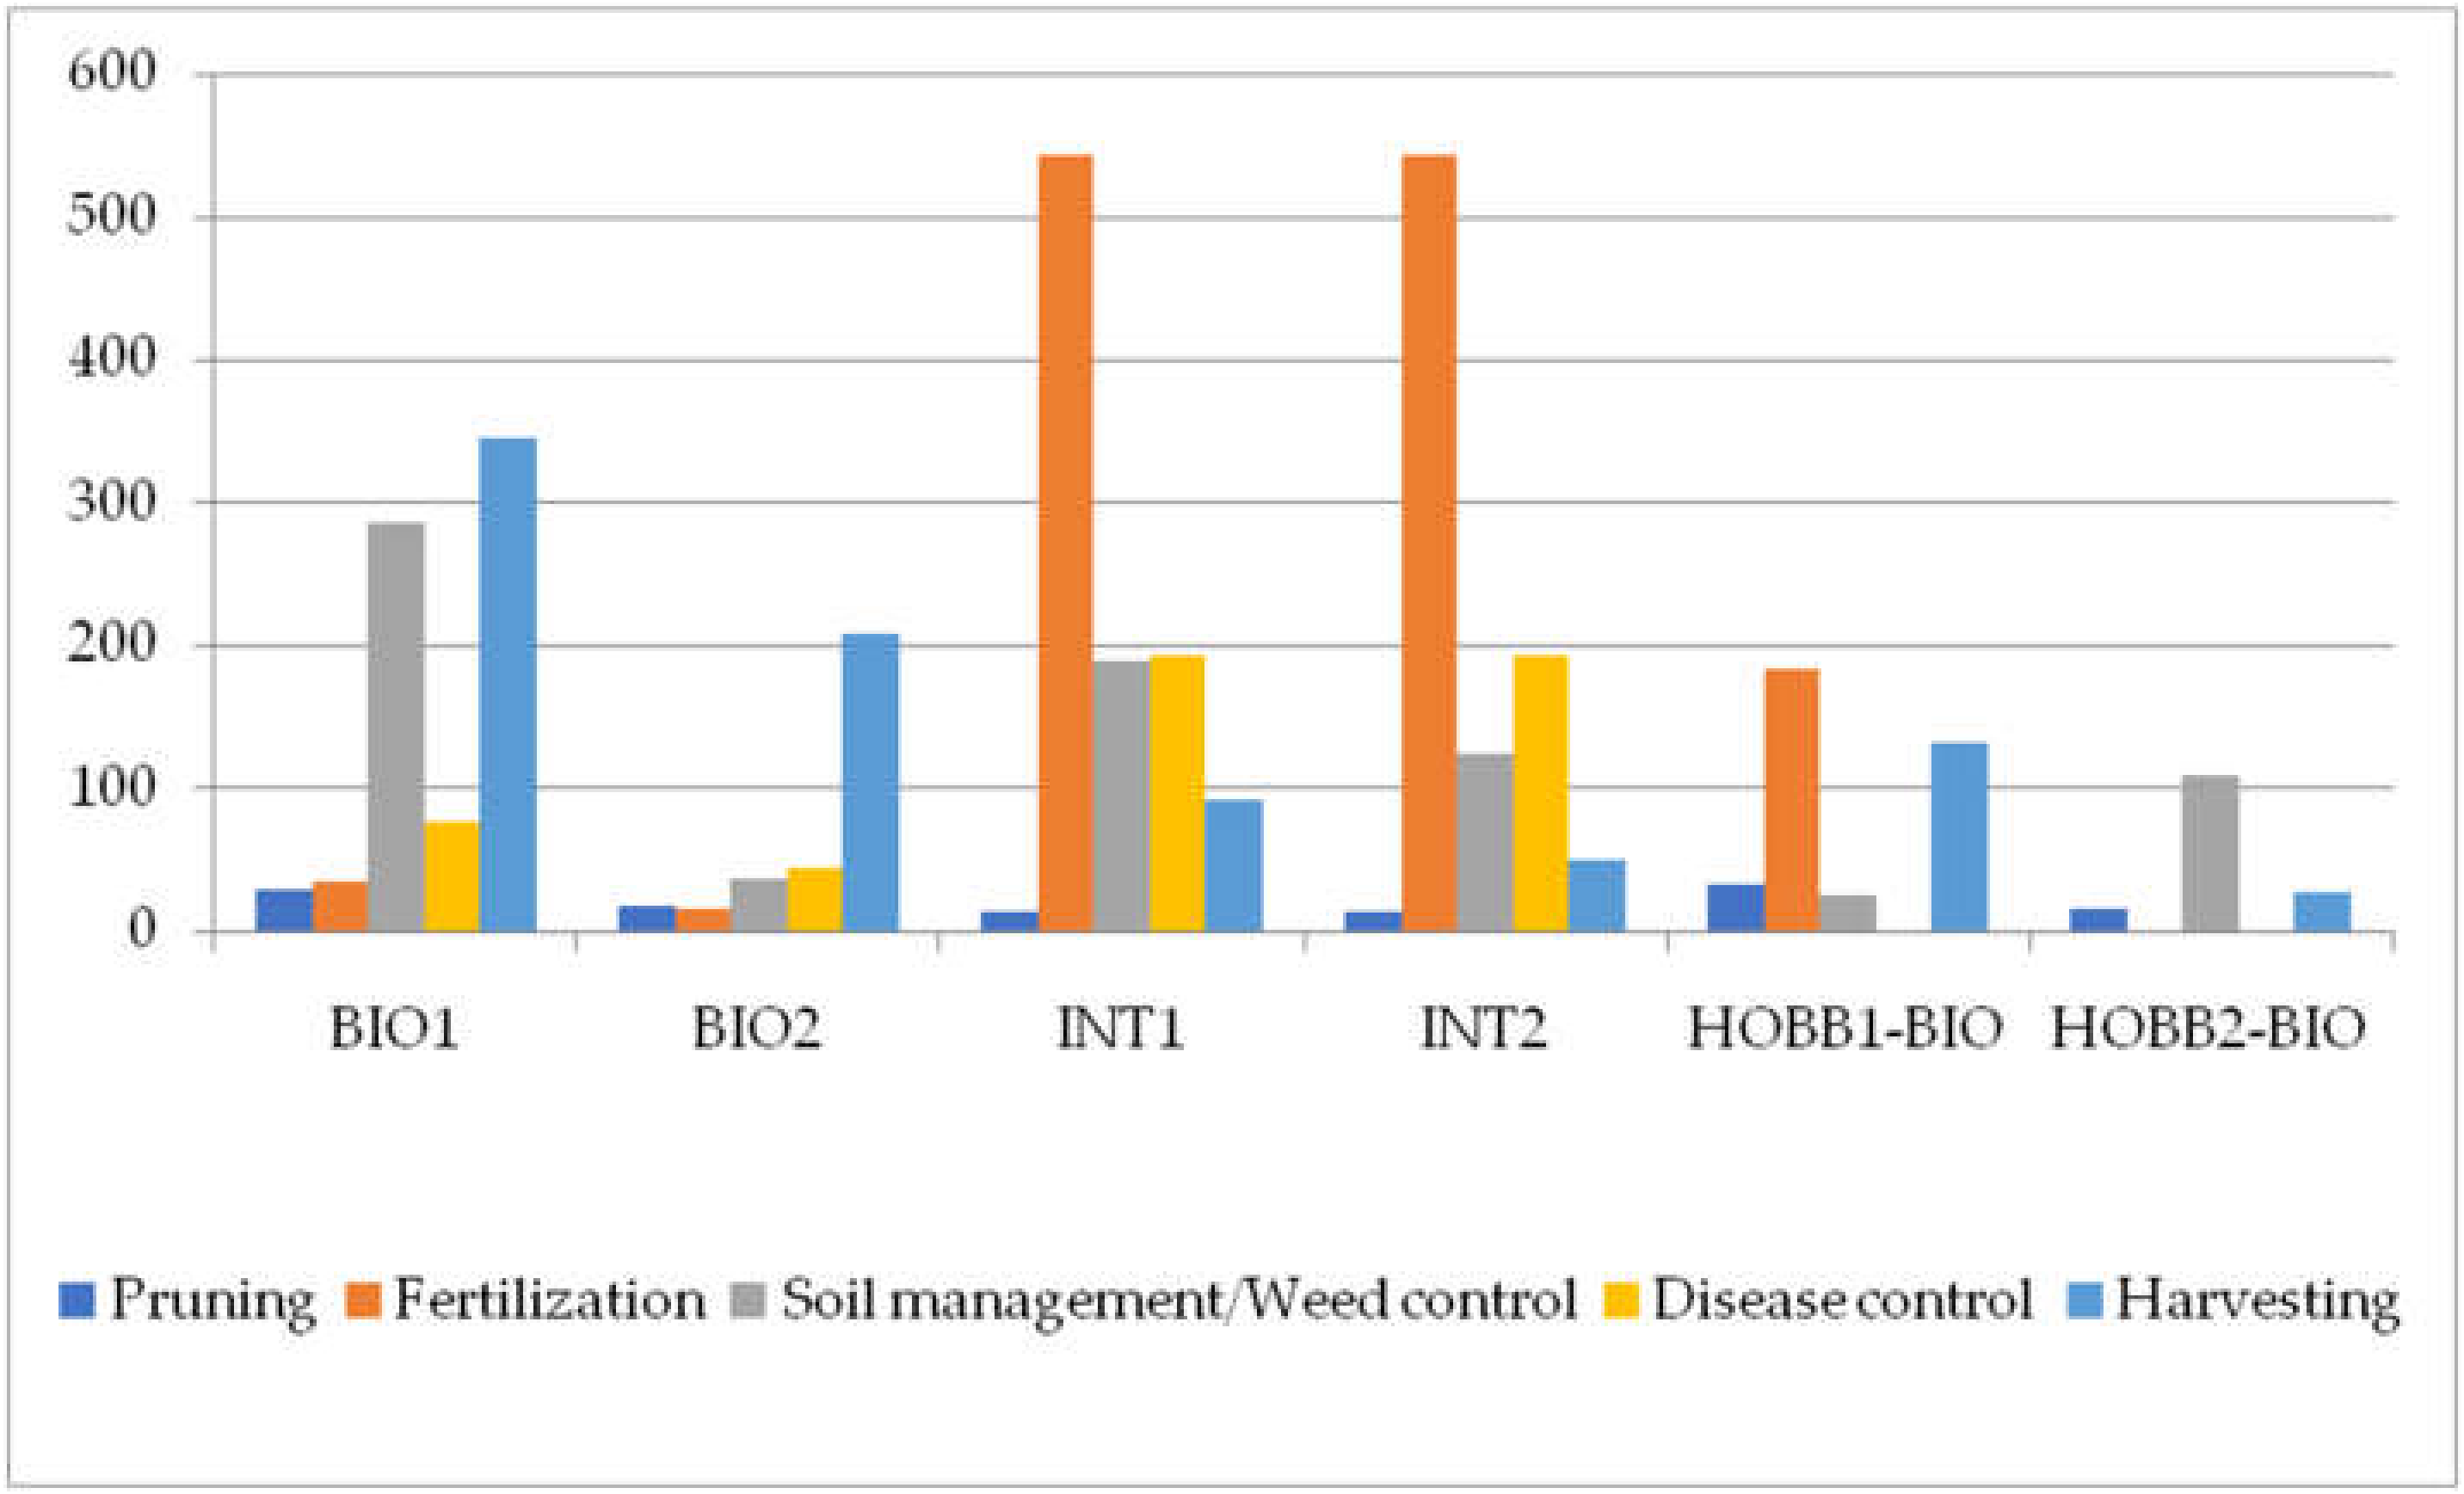
Impacts (global warming, GWP100) relating to the phases of the olive oil production chain are reported, taking into account the different analyzed systems. With respect to the agricultural phase, data referred to the hectare confirm what was seen per liter of oil: INT1 was the most impacting system in terms of CO2eq (1030 kg of CO2eq ha–1) due to the intensive orchard management (four disease control treatments, a chemical weeding with glyphosate and fertilizations with synthetic products, harrowing and shredding, and manual pruning, mechanical harvesting with use of mobile nets and plastic boxes) (Table 8). On the other hand, in this phase, HOBB2-BIO emitted the least quantity of CO2eq per hectare: no chemical treatment was carried out within this system and harvesting was manual. The breakdown of impacts by agricultural operation (Figure 3) showed that global warming was mainly due to harvesting in BIO1 and BIO2, while to fertilization in INT1, INT2 and HOBB1-BIO. In particular, referring to fertilization, indirect emissions of input (manufacture and transportation) represented about 90% of total impact.
Comparing the contribution to the impact of the agricultural phase of the three different cultivation methods analyzed (integrated, certificated organic, hobby—organic system), the greatest impact was attributed to systems that used integrated cultivation methods with intensive use of synthetic pesticides and fertilizers (INT1 and INT2). Certificated organic systems, although using non-synthetic products, had slightly lower impacts than integrated ones, because of a considerable distance of the olive orchard from the farm center (Table 2) and frequent treatments, which involved significant consumptions of fossil fuels. On the contrary, hobby systems were characterized by a minimal impact, less than a third of the integrated ones, essentially attributable to the emissions linked to soil tillage.
With respect to the impacts due to the olive transport from the field to the oil mill, HOBB1-BIO resulted the most impacting system (Table 8). This impact type, mainly caused by the diesel consumption, strongly depended on the distance of farm from the oil mill, eventual property of this last by the farm and obsolescence of the company machine park. Therefore, INT1 and INT2, having advanced technology agricultural machinery and the property of the oil mill placed not far from the olive groves, and aiming to oil sell, showed the least impact. Differently, the hobby farms used old and ineffective agricultural machines with inevitable technological obsolescence, and needed more fuel to reach the oil mill, about 5 km away from the field. Once the olives were delivered to the oil mill, oil extraction, bottling and storage followed. The impacts related to these phases were mainly due to the electric consumption of the oil mill, namely the kW needed to power the oil production process, consisting of washing/sorting, pressing, kneading, extraction and separation phases (Table 8). In this case, BIO1 was the most impacting system, having values equal to 81 kg of CO2eq ha–1. This is mainly due to the very energy-intensive oil mill used by BIO1, that consumed 0.175 kW per kg of milled olives. The high unitary energy impact of the olive processing associated with the high production in the field (8300 kg ha–1) justified the greatest impacts per hectare. BIO2, although with limited hectare production (3500 kg ha–1), showed the lower impact (7 kg of CO2eq ha–1), thanks to the use of an avant-garde oil mill characterized by a low energy consumption per kilo (0.159 kW).
About bottling, only the BIO2 system used an electric bottling plant that generated a minimum impact of 0.2 kg of CO2eq ha–1 (Table 8) and 0.0003 kg CO2eq l−1.
The storage phase produced significant emissions only in the cases where oil remained for a long time in steel containers before sale or self-consumption. It is important to highlight that four of the six analyzed oil systems (INT1, INT2, HOBB1-BIO, HOBB2-BIO) had higher emissions in the storage phase than the olives processing phase (Table 8). This because the latter operation, although crucial, generally lasts three months (from October to December), while storage lasts long periods and consequently immobilize equipment, steel containers, and uses energy for the thermal conditioning of oil storage rooms, so generating emissions. Finally, more than half of the environmental impact for the production of a liter of olive oil was due to the packaging phase (Table 8). If packaging was excluded from evaluation, global warming broke down, as shown in Table 9.
In detail, packaging accounted for 53% of the total global warming produced in BIO2, 65% in BIO1 and INT2 systems, and 66% in INT1 (Table 8). The higher values calculated in the latter two cases were related to the greater use of 5-liters tin and limitedly to the presence of secondary packaging consisting of recycled cardboard boxes with a capacity of three liters. As shown in Table 10, the choice to use tin packaging instead of bottles, strongly penalized those systems, in which this format was prevalent (BIO1, INT1 and INT2), in terms of global warming for the amount of olive oil produced per hectare. Consequently, it is advisable to use light glass bottles rather than tins, as well as formats with greater capacity—certainly the 1-liter format—in order to reduce their weight per unit of volume. The last phase taken into account by the LCA analysis concerns the sale of the olive oil and, in particular, its distribution. The main market on which the analyzed systems sell their product is national, although a small percentage is sold abroad, especially in France and Germany (Table 5). Impacts of olive oil distribution in relation to the type of transport used are shown in Table 11. With reference to global warming, the most impactful transport type was by airplane. Therefore, depending on the means of transport used and the distance of the final sales point, at the CO2eq emissions per liter of oil calculated so far (Table 7) had to be added from a minimum of 0.017 to a maximum of 0.86 kg of CO2eq per bottle of transported oil. This confirmed that “short chain” strategies can certainly reduce the environmental impacts of the olive oil production chain. Buying good olive oil near the place of production would mean less impact on the environment for transport, packaging and storage, and would support the local economy. As a matter of fact, the concept of sustainability must be considered as a synergy among environmental, economic and social aspects. Areas in which the six analyzed systems fall, are characterized by a dramatic demographic depopulation. A valorization strategy of olive oil production, could led to an economic growth of these areas and an increase of employment opportunities for the population, so reconciling the concept of social sustainability.
A brief bibliographical comparison with other LCA studies recently carried out on olive oil production is reported in Table 12. Results refer to the same functional unit: one liter of oil produced and bottled in a one-liter capacity bottle. In order to make a realistic comparison, results obtained in this study have been rearranged considering only the one-liter bottle as packaging and excluding transport. Impacts measured for the various analyzed systems were lower than those found in the literature, except for HOBB2-BIO emissions which were similar to those reported by El Hanandeh and Gharaibeh [70] in Jordan (Table 12).
Differences among our results and literature data are due to several factors, such as the system boundaries and methods utilized for the life cycle impact assessment. From now on, the low global warming values measured can constitute, together with the certification of origin, an important marketing key for the olive oil production in the Park Areas under study. Indeed, the markets of the future are increasingly oriented towards enhancing production certified for sustainability. This is because, in increasingly competitive markets, the implementation of sustainable development models can represent an advantage for farms, for both economic reasons (the economic policies of each European State are increasingly aimed at promoting sustainable development, as reported in the “2019 Europe Sustainable Development Report” [74]) and marketing purposes, since eco-sustainable products are increasingly in demand by consumers. However, an international reference value for environmental impacts is still missing; this could express a value of sustainability judgment to be easily spent and communicated on the market. It is increasingly necessary, for olive oil too, to define at least national standards of sustainability certificates, with respect to which to express the level of sustainability of specific olive-oil systems.
5. Final Considerations
The present study falls into those actions aimed to achievement of high levels of sustainability by agricultural farms. This is one of the main aims of the worldwide researchers who are searching for innovations characterized by high technological content and low natural resources consumption. Specifically, environmental impacts of the olive-oil production chain in two important protected areas (one National Park and a Regional one) within the Salerno province were evaluated. This effort was performed in order to identify the critical issues and suggest improvements for potentiating/increasing environmental sustainability of olive cultivation in areas particularly susceptible to human pressure. Among the six analyzed systems, the least impacting were the hobby systems managed according to organic methods; this was mainly due to the absence of the packaging phase, which represented more than 60% of the total impact, but also for the few processes and treatments that were carried out in the field. Indeed, the second most impactful phase was the agricultural one which, on average, caused 35% of the total CO2eq emissions. These results, obtained by means of LCA methodology, suggest to adjust some specific steps along the entire olive oil production chain: the management of the agricultural phase should be based on more sustainable cultivation methods (as those organic) and on the use of efficient machines with low consumptions; olive oil processing/storage techniques at low energy consumption should be chosen; fully recyclable and flexible packaging should be used together with low impact transport strategies (by rail and ship).
Author Contributions
Conceptualization, M.P. and G.C.; Methodology, A.M. and M.P.; Software, A.M. and M.P.; Validation, A.M.P.; Formal Analysis, A.M. and M.P.; Investigation, A.M.; Resources, A.M.; Data Curation, A.M. and G.C.; Writing – Original Draft Preparation, A.M. and M.P.; Writing – Review & Editing, A.M.P.; Visualization, M.P., A.M., A.M.P. and G.C.; Supervision, G.C.; Project Administration, G.C.; Funding Acquisition, G.C. All authors have read and agreed to the published version of the manuscript.
Funding
This research received no external funding
Acknowledgments
We are grateful to Paola De Conciliis, Giuseppe Cilento, Angelo Petolocchio, Angelo Maffia and Angelo Pugliese for allowing us access to their field data. This research was partially supported by: PSR Campania Region 2014–2020. Modelli Project.
Conflicts of Interest
The authors declare no conflict of interest
References
- Espadas-Aldana, G.; Vialle, C.; Belaud, J.P.; Vaca-Garcia, C.; Sablayrolles, C. Analysis and trends for Life Cycle Assessment of olive oil production. Sustain. Prod. Consum. 2019, 19, 216–230. [Google Scholar] [CrossRef] [Green Version]
- Pattara, C.; Salomone, R.; Cichelli, A. Carbon footprint of extra virgin olive oil: A comparative and driver analysis of different production processes in Centre Italy. J. Clean. Prod. 2016, 20, 533–547. [Google Scholar] [CrossRef]
- Beaufoy, G. The Environment Impact of olive oil production in the European Union; Report della Commissione Europea: Bruxelles, Belgium, 2001. [Google Scholar]
- Saulle, R.; La Torre, G. The Mediterranean Diet, recognized by UNESCO as a cultural heritage of humanity. Ital. J. Public Health 2010, 7. [Google Scholar] [CrossRef]
- Coldiretti. 2018. Available online: https://www.coldiretti.it/prodotto/olio-e-olive (accessed on 20 November 2019).
- FAOSTAT. Available online: http://www.fao.org/faostat/en/#data/QC (accessed on 30 October 2019).
- ISMEA. Scheda di settore olio d’oliva. 2018. Available online: https://www.ismeamercati.it (accessed on 13 December 2019).
- Darli, A. L’olio d’oliva. L’eccellenza della produzione mediterranea sfida la grande crisi dei raccolti di olive del 2014; Ismea: Rome, Italy, 2015; Available online: https://docplayer.it/7250349-L-olio-d-oliva-l-eccellenza-della-produzione-mediterranea-sfida-la-grande-crisi-dei-raccolti-di-olive-del-2014.html (accessed on 8 September 2019).
- ISTAT. Censimento Agricoltura. 2010. Available online: http://censimentoagricoltura.istat.it/index.php?id=73 (accessed on 15 November 2019).
- Bruntland Commission. Report of the World Commission on Environment and Development: Our Common Future. 1987. Available online: https://sustainabledevelopment.un.org/content/documents/5987our-common-future.pdf (accessed on 1 January 2020).
- Forigo News. Agricoltura sostenibile: Per il Futuro del Nostro Pianeta. 2018. Available online: https://www.forigo.it/news/agricoltura-sostenibile-per-il-futuro-del-nostro-pianeta (accessed on 15 November 2019).
- Council Regulation (EC) N. 834/2007 of 28 June 2007 on “Organic Production and Labelling of Organic Products and Repealing Regulation (EEC) No 2092/91”. Available online: https://eur-lex.europa.eu/legal-content/EN/ALL/?uri=CELEX%3A32007R0834 (accessed on 30 October 2019).
- Commission Regulation (EC) N. 889/2008 of 5 September 2008 “Laying down Detailed Rules for the Implementation of Council Regulation (EC) No 834/2007 on Organic Production and Labelling of Organic Products with Regard to Organic Production, Labelling and Control”. Available online: https://eur-lex.europa.eu/legal-content/EN/TXT/?uri=CELEX%3A32008R0889 (accessed on 30 October 2019).
- Tuck1, S.L.; Winqvist, C.; Mota, F.; Ahnström, J.; Turnbull, L.A.; Bengtsson, J. Land-use intensity and the effects of organic farming on biodiversity: A hierarchical meta-analysis. J. Appl. Ecol. 2014, 51, 746–755. [Google Scholar] [CrossRef] [PubMed]
- De Backer, E.; Aertsens, J.; Vergucht, S.; Steurbaut, W. Assessing the ecological soundness of organic and conventional agriculture by means of life cycle assessment (LCA)—A case study of leek production. Br. Food J. 2009, 10, 1028–1061. Available online: http://0-www-emeraldinsight-com.brum.beds.ac.uk/10.1108/00070700910992916 (accessed on 19 December 2019).
- Herdt, R.W.; Steiner, R.A. Agricultural sustainability: Concepts and conundrums. In Agricultural Sustainability. Economic, Environmental and Statistical Considerations; Barnett, V., Payne, R., Steiner, R., Eds.; Wiley: Chichester, UK, 1995; pp. 3–13. [Google Scholar]
- Kramer, K.J.; Moll, H.C.; Nonhebel, S.; Wilting, H.C. Greenhouse gas emissions related to the Dutch food consumption. Energy Policy 1999, 27, 203–216. [Google Scholar] [CrossRef]
- Van der Werf, H.M.G.; Petit, J. Evaluation of the environmental impact of agriculture at the farm level: A comparison and analysis of 12 indicator-based methods. Agr. Ecosyst. Environ. 2002, 93, 131–145. [Google Scholar] [CrossRef]
- Nonhebel, S. On resource use in food production systems: The value of livestock as ‘rest-stream upgrading system’. Ecol. Econ. 2004, 48, 221–230. [Google Scholar] [CrossRef]
- Lampkin, N.; Foster, C.; Padel, S.; Midmore, P. The policy and regulatory environment for organic farming in Europe. In Organic Farming in Europe: Economics and Policy; University of Hohenheim: Stuttgart, Germany, 1999; Volume 1. [Google Scholar]
- Payraudeau, S.; van der Werf, H.M.G. Environmental impact assessment for a farming region: A review of methods. Agr. Ecosyst. Environ. 2005, 107, 1–19. [Google Scholar] [CrossRef]
- Haas, G.; Wetterich, F.; Geier, U. Life cycle assessment framework in agriculture on the farm level. Int. J. Life Cycle Assess. 2000, 5, 345–348. [Google Scholar] [CrossRef]
- Brentrup, F.; Kusters, J.; Kuhlmann, H.; Lammel, J. Application of the Life Cycle Assessment methodology to agricultural production: An example of sugar beet production with different forms of nitrogen fertilisers. Eur. J. Agron. 2001, 14, 221–233. [Google Scholar] [CrossRef]
- Cederberg, C. Life Cycle Assessment (LCA) of Animal Production. PhD Thesis, Department of Applied Environmental Science, Göteborg University, Göteborg, Sweden, 2002. [Google Scholar]
- Brentrup, F.; Kusters, J.; Kuhlmann, H.; Lammel, J. Environmental impact assessment of agricultural production systems using the life cycle assessment methodology—I. Theoretical concept of a LCA method tailored to crop production. Eur. J. Agron. 2004, 20, 247–264. [Google Scholar] [CrossRef]
- Stern, S.; Sonesson, U.; Gunnarsson, S.; Oborn, I.; Kumm, K.I.; Nybrant, T. Sustainable development of food production: A case study on scenarios for pig production. AMBIO 2005, 34, 402–407. [Google Scholar] [CrossRef] [PubMed]
- Charles, R.; Jolliet, O.; Gaillard, G.; Pellet, D. Environmental analysis of intensity level in wheat crop production using life cycle assessment. Agric. Ecosyst. Environ. 2006, 113, 216–225. [Google Scholar] [CrossRef]
- Milà i Canals, L.; Burnip, G.M.; Cowell, S.J. Evaluation of the environmental impacts of apple production using Life Cycle Assessment (LCA): Case study in New Zealand. Agric. Ecosyst. Environ. 2006, 114, 226–238. [Google Scholar] [CrossRef]
- Thomassen, M.A.; van Calker, K.J.; Smits, M.C.J.; Iepema, G.L.; de Boer, I.J.M. Life cycle assessment of conventional and organic milk production in the Netherlands. Agric. Syst. 2008, 96, 95–107. [Google Scholar] [CrossRef]
- Cederberg, C.; Mattsson, B. Life cycle assessment of milk production—A comparison of conventional and organic farming. J. Clean. Prod. 2000, 8, 49–60. [Google Scholar] [CrossRef] [Green Version]
- Haas, G.; Wetterich, F.; Kopke, U. Comparing intensive, extensified and organic grassland farming in southern Germany by process life cycle assessment. Agric. Ecosyst. Environ. 2001, 83, 43–53. [Google Scholar] [CrossRef] [Green Version]
- De Boer, I.J.M. Environmental impact assessment of organic and conventional milk production. Livest. Prod. Sci. 2003, 80, 69–77. [Google Scholar] [CrossRef]
- Gravendijk, L. Environmental impact assessment of Dutch commercial organic dairy farms. MSc. Thesis, Wageningen University and Research Centre, Wageningen, The Netherlands, 2006. [Google Scholar]
- Knudsen, M.T.; Dorca-Preda, T.; Djomo, S.N.; Peña, N.; Padel, S.; Smith, L.G.; Zollitsch, W.; Hörtenhuber, S.; Hermansen, J.E. The importance of including soil carbon changes, ecotoxicity and biodiversity impacts in environmental life cycle assessments of organic and conventional milk in Western Europe. J. Clean. Prod. 2019, 215, 433–443. [Google Scholar] [CrossRef]
- Pirlo, G.; Lolli, S. Environmental impact of milk production from samples of organic and conventional farms in Lombardy (Italy). J. Clean. Prod. 2019, 211, 962–971. [Google Scholar] [CrossRef]
- Nienhuis, J.; de Vreede, P. Milieugerichte Levenscyclusanalyse in de Glastuinbouw: Bruikbaarheid; Proefstation voor Tuinbouw onder glas: Naaldwijk, The Netherlands, 1994. [Google Scholar]
- Kramer, K.J.; Ploeger, C.; van Woerden, S.C. Biologische Glasgroenteteelt—Tussenrapportage Bedrijfseconomische en Milieukunduge Aspecten 1998-1999 (Organic Greenhouse Vegetables Production. Economic and Environmental Aspects 1998-1999); Research Station of Floriculture and Glasshouse Vegetables: Naaldwijk, The Netherlands, 2000. [Google Scholar]
- Van Woerden, S.C. Biologische Glasgroenteteelt—Rapportage Bedrijfseconomische en Milieukundige Aspecten 1999–2000; Praktijkonderzoek Plant & Omgeving: Naaldwijk, The Netherlands, 2001. [Google Scholar]
- Halberg, N.; Dalgaard, R.; Rasmussen, M.D. Miljøvurdering af Konventionel Ogøkologisk avl af Grøntsager—Livscyklusvurdering af Produktion i Væksthuse og Påfriland: Tomater, Agurker, Løg, Gulerødder; Arbejdsrapport fra Miljøstyrelsen Nr. 5; Miljøministeriet Miljøstyrelsen: Copenhagen, Denmark; Available online: https://www2.mst.dk/udgiv/publikationer/2006/87-7614-960-9/pdf/87-7614-961-7.pdf (accessed on 4 October 2019).
- Foteinis, S.; Chatzisymeon, E. Life cycle assessment of organic versus conventional agriculture. A case study of lettuce cultivation in Greece. J. Clean. Prod. 2016, 112, 2462–2471. [Google Scholar] [CrossRef]
- Ronga, D.; Gallingani, T.; Zaccardelli, M.; Perrone, D.; Francia, E.; Milc, J.; Pecchioni, N. Carbon footprint and energetic analysis of tomato production in the organic vs the conventional cropping systems in Southern Italy. J. Clean. Prod. 2019, 220, 836–845. [Google Scholar] [CrossRef] [Green Version]
- Nicoletti, G.M.; Notarnicola, B.; Tassielli, G. Comparison of conventional and organic wine. In Proceedings of the International Conference on LCA in Foods, SIK-Dokument 143, SIK (The Swedish Institute for Food and Biotechnology), Göteborg, Sweden, 26–27 April 2001; pp. 48–52. [Google Scholar]
- Villanueva-Rey, P.; Vázquez-Rowe, I.; Moreira, M.T.; Feijoo, G. Comparative life cycle assessment in the wine sector: Biodynamic vs. conventional viticulture activities in NW Spain. J. Clean. Prod. 2014, 65, 330–341. [Google Scholar] [CrossRef]
- Noya, I.; Villanueva-Rey, P.; González-García, S.; Fernandez, M.D.; Rodriguez, M.R.; Moreira, M.T. Life Cycle Assessment of pig production: A case study in Galicia. J. Clean. Prod. 2017, 142, 4327–4338. [Google Scholar] [CrossRef]
- McAuliffe, G.A.; Chapman, D.V.; Sage, C.L. A thematic review of life cycle assessment (LCA) applied to pig production. Environ. Impact Assess. 2016, 56, 12–22. [Google Scholar] [CrossRef]
- Makara, A.; Kowalski, Z.; Lelek, Ł.; Kulczycka, J. Comparative analyses of pig farming management systems using the Life Cycle Assessment method. J. Clean. Prod. 2019, 241, 118–305. [Google Scholar] [CrossRef]
- Cerutti, A.K.; Beccaro, G.L.; Bruun, S.; Bosco, S.; Dario, D.; Notarnicola, B.; Bounous, G. Life cycle assessment application in the fruit sector: State of the art and recommendations for environmental declarations of fruit products. J. Clean. Prod. 2014, 73, 125–135. [Google Scholar] [CrossRef]
- Aguilera, E.; Guzmán, G.; Alonso, A. Greenhouse gas emissions from conventional and organic cropping systems in Spain. II. Fruit tree orchards. Agron. Sustain. Dev. 2015, 35, 725–737. [Google Scholar] [CrossRef] [Green Version]
- González-Sánchez, E.J.; Ordoñez-Fernández, R.; Carbonell-Bojollo, R.; Veroz-González, O.; Gil-Ribes, J.A. Meta-analysis on atmospheric carbon capture in Spain through the use of conservation agriculture. Soil Tillage Res. 2012, 122, 52–60. [Google Scholar] [CrossRef]
- Palese, A.M.; Pergola, M.; Favia, M.; Xiloyannis, C.; Celano, G. A sustainable model for the management of olive orchards located in semi-arid marginal areas: Some remarks and indications for policy makers. Environ. Sci. Policy 2013, 27, 81–90. [Google Scholar] [CrossRef]
- Mohamad, R.S.; Verrastro, V.; Al Bitar, L.; Roma, R.; Moretti, M.; Al Chami, Z. Effect of different agricultural practices on carbon emission and carbon stock in organic and conventional olive systems. Soil Res. 2017, 54, 173–181. [Google Scholar] [CrossRef]
- Proietti, S.; Sdringola, P.; Regni, L.; Evangelisti, N.; Brunori, A.; Ilarioni, L.; Nasini, L.; Proietti, P. Extra Virgin Olive oil as carbon negative product: Experimental analysis and validation of results. J. Clean Prod. 2017, 166, 550–562. [Google Scholar] [CrossRef]
- Regione Campania. Regione Campania Agricoltura. 2017. Available online: http://agricoltura.regione.campania.it/olivo/olivo_home.htm2/09/2019 (accessed on 12 November 2019).
- Decree of Ministry of Agricultural, Food and Forestry Policies, No. 2722, 17/04/2008, Gazzetta Ufficiale. Available online: https://indicatori-pan-fitosanitari.isprambiente.it/sites/indicatori-pan-fitosanitari.isprambiente.it/files/pdf/LINEE%20GUIDA%20PRODUZIONE%20INTEGRATA_DIFESA%20FITOSANITARIA%20CONTROLLO%20INFESTANTI.pdf (accessed on 3 December 2019).
- UNI EN ISO 14040:2006. Environmental Management, Life Cycle Assessment—Principles and Framework; International Organization for Standardization (ISO): Geneva, Switzerland, 2006. [Google Scholar]
- UNI EN ISO 14044:2006. Environmental Management, Life Cycle Assessment—Requirements and Guidelines; International Organization for Standardization (ISO): Geneva, Switzerland, 2006. [Google Scholar]
- Pergola, M.; Persiani, A.; Pastore, V.; Palese, A.M.; Arous, A.; Celano, G. A comprehensive Life Cycle Assessment (LCA) of three apricot orchard systems located in Metapontino area (Southern Italy). J. Clean. Prod. 2017, 142, 4059–4071. [Google Scholar] [CrossRef]
- Curran, M.A. Life Cycle Assessment: A review of the methodology and its application to sustainability. Curr. Opin. Chem. Eng. 2013, 2, 273–277. [Google Scholar] [CrossRef]
- Roy, P.; Nei, D.; Orikasa, T.; Xu, Q.; Okadome, H. A review of life cycle assessment (LCA) on some food products. J. Food Eng. 2009, 90, 1–10. [Google Scholar] [CrossRef]
- PCR—Product Category Rules, 2017. VIRGIN OLIVE OIL AND ITS FRACTIONS PRODUCT GROUP: UN CPC 21537. Versione 2010:07. Valid Until 1/04/2018. Available online: https://www.environdec.com/PCR/ (accessed on 7 January 2020).
- Cerutti, A.K.; Bruun, S.; Beccaro, G.L.; Bounous, G. A review of studies applying environmental impact assessment methods on fruit production systems. J. Environ. Manage 2011, 92, 2277–2286. [Google Scholar] [CrossRef]
- Seda, M.; Assumpeió, A.; Muñoz, P. Analysing the influence of functional unit in agricultural LCA. LCA FOOD 2010. VII international conference on life cycle assessment in the agri-food sector. In Notarnicola, B. 7th International Conference on Life Cycle Assessment in the Agri-Food Sector (LCA Food 2010), 22–24 September 2010, Bari (Italy). Int J Life Cycle Assess. 2011, 16, 102–105. [Google Scholar]
- Brentrup, F.; Küsters, J.; Lammel, J.; Kuhlmamm, H. Methods to estimate on field nitrogen emissions from crop production as an input to LCA studies in the agricultural sector. Int. J. Life Cycle Assess. 2000, 5, 349–357. [Google Scholar] [CrossRef]
- IPCC: Intergovernmental Panel on Climate Change. Guidelines for National Greenhouse Gas Inventories. In Agriculture, Forestry and other Land Use, USA; IPCC: Intergovernmental Panel on Climate Change: Geneva, Switzerland, 2006; Volume 11. Available online: https://www.ipcc.ch/site/assets/uploads/2018/02/ipcc_wg3_ar5_chapter11.pdf (accessed on 18 November 2019).
- Bouwman, A.E. Compilation of a Global Inventory of Emissions of Nitrous Oxide. Ph.D. Thesis, University of Wageningen, Wageningen, The Netherlands, 1995. [Google Scholar]
- Hauschild, M.Z. Estimating pesticide emissions for LCA of agricultural products. In Agricultural Data for Life Cycle Assessments; Weidema, B.P., Meeusen, M.J.G., Eds.; LCA Net Food: The Hague, The Netherlands, 2000; Volume 2, pp. 64–79. [Google Scholar]
- Ecoinvent Version 3. 2013. Available online: http://www.ecoinvent.org/database/database.html.
- CML; Bureau, B.G. Life Cycle Assessment: An Operational Guide to the ISO Standards; School of System Engineering, Policy Analysis and Management, Delft University of Technology: Delft, The Netherlands, 2001. [Google Scholar]
- Law 30 ottobre 2014, n. 161. Disposizioni per l’adempimento Degli Obblighi Derivanti Dall’appartenenza Dell’italia All’unione Europea—Legge Europea 2013—bis. Available online: https://www.cliclavoro.gov.it/Normative/Legge_30_ottobre_2014_n.161.pdf (accessed on 15 November 2019).
- El Hanandeh, A.; Gharaibeh, M.A. Environmental efficiency of olive oil production by small and micro-scale farmers in northern Jordan: Life cycle assessment. Agric. Syst. 2016, 148, 169–177. [Google Scholar] [CrossRef]
- Rinaldi, S.; Barbanera, M.; Lascaro, E. Assessment of carbon footprint and energy performance of the extra virgin olive oil chain in Umbria, Italy. Sci. Total Environ. 2014, 482–483, 71–79. Available online: http://0-dx-doi-org.brum.beds.ac.uk/10.1016/j.scitotenv.2014.02.104 (accessed on 17 November 2019).
- Espi, J.J.; Clarens, F.; Busset, G.; Sablayrolles, C.; Montrejaud-Vignoles, M.; Carvalho, J.; Fonseca, B.; Delgado, F.; Chacon, L.; Capiscol, C.; et al. OiLCA project: enhancing competitiveness and reducing carbon footprint of olive oil processes through waste management optimisation using life cycle assessment. In Proceedings of the 2010 International Conference on Indoor Positioning and Indoor Navigation, Guimaraes, Portugal, 21–23 September 2011; Available online: https://www.researchgate.net/publication/271825614_OiLCA_project_enhancing_competitiveness_and_reducing_carbon_footprint_of_olive_oil_processes_trhough_waste_management_optimisation_using_life_cycle_assessment (accessed on 13 December 2019).
- Fiore, M.; Breedveld, L.; Arrivas Bajiardi, C.; Giaimo, L.; Notaro, A. Certificazione ambientale di prodotti Agroalimentari, LCA dell’olio d’oliva. Ambiente ARS n.122—Luglio/Settembre 2009. Available online: http://www.to-be.it/wp-content/uploads/2015/07/LCA-dellolio-doliva.pdf (accessed on 13 December 2019).
- Institute for European Environmental Policy. Europe Sustainable Development Report (ESDR2019). 2019. Available online: https://s3.amazonaws.com/sustainabledevelopment.report/2019/2019_europe_sustainable_development_report.pdf (accessed on 30 October 2019).
Figure 1.
Map of Salerno Province with the location of the analyzed systems.

Figure 2.
System boundaries for life cycle assessment (LCA).

Figure 3.
Agricultural phase: global warming (kg CO2eq ha–1) for the different agricultural operations.
Figure 3.
Agricultural phase: global warming (kg CO2eq ha–1) for the different agricultural operations.


Table 1.
Technical and agronomic characteristics of the analyzed systems.
| Orchard Characteristics | BIO1 | BIO2 | INT1 | INT2 | HOBB1- BIO | HOBB2- BIO | ||
|---|---|---|---|---|---|---|---|---|
| Cultivar | Salella | Rotondella | Rotondella | Leccino | Rotondella | Rotondella | ||
| Leccino | Salella | Frantoio | Ogliarola | Carpellese | ||||
| Frantoiana | Carpellese | |||||||
| Planting density (trees ha–1) | 156 (8m × 8m) | 278 (6m × 6m) | 833 (6m × 2m) | 400 (5m × 5m) | 333 (5m × 6m) | |||
| Trees age (years) | Secular | Secular | 80 | 30 | Secular | Secular | ||
| Cultivation system | Certified organic | Certified organic | Integrated | Intensive Integrated | Organic | Organic | ||
| Pruning method | Manual | |||||||
| Pruning residues management | Used as soil mulching | Composting | Firewood | Used as soil mulching | Firewood | Firewood | ||
| Fertilization | Annual/ organic | Annual/ organic | Annual/ mineral | Annual/ mineral | Annual/ organic | - | ||
| Soil management/weed control | Temporary natural grass cover - Disk harrowing | Disk harrowing - Glyphosate | Temporary natural grass cover - Disk harrowing | |||||
| Disease control | Organic products | Organic products | Conventional products | - | - | |||
| Harvesting method/hours | Mechanized /18 | Mechanized /12 | Manual/ 400 | Mechanized /64 | Manual /30 | Manual /16 | ||
| Olives average yield (kgha−1 year−1) | 8300 | 3500 | 8000 | 8500 | 4300 | 7400 | ||
Table 2.
Farm inputs used in the analyzed systems.
| BIO1 | BIO2 | INT1 | INT2 | HOBB1-BIO | HOBB2-BIO | |
|---|---|---|---|---|---|---|
| Fertilizers (kg ha–1) | ||||||
| Ferti Field (organic nitrogen) | - | - | 800 | 800 | - | - |
| compost | 400 | - | - | - | - | - |
| NPK | - | - | - | - | 300 | - |
| Chemicals (kg ha-1) | ||||||
| Bordeaux mixture | 3 | - | - | - | - | - |
| lime | - | 1.5 | - | - | - | - |
| kaolin | 1 | 1.5 | - | - | - | - |
| Vitabor | 1.5 | - | - | - | - | - |
| Copper, Sulfur, Zeolite | - | 1 | - | - | - | - |
| Idrofloral | - | - | 6.5 | 6.5 | - | - |
| Iperion | - | - | 9 | 9 | - | - |
| Boron | 1 | - | 2 | 2 | - | - |
| Epik | - | - | 1.2 | 1.2 | - | - |
| Gliphosate | - | - | 4 | - | - | - |
| Human labour (h ha–1) | 257 | 85 | 501 | 120 | 186 | 52 |
| Machinery and farm tools (h ha–1) | 117 | 69 | 134 | 106 | 130 | 66 |
| Diesel (kg ha–1) | 181 | 66 | 81 | 80 | 54 | 58 |
Table 3.
Methods of olives transporting from the field to the oil mill in the analyzed systems.
| Systems | Type of the Transport | Type of Container | Average Distance Field-Oil mill (km) |
|---|---|---|---|
| BIO 1 | Truck | Plastic bins capacity 400 kg | 38 |
| BIO 2 | Truck | Plastic bins capacity 400 kg | 1.5 |
| INT 1 | Tipper truck | Plastic bins capacity 400 kg | 5 |
| INT 2 | Tipper truck | Plastic bins capacity 400 kg | 4 |
| HOBB1-BIO | Car (Jeep) | Juta bags capacity 40 kg | 1.5 |
| HOBB2-BIO | Car (Jeep) | Juta bags capacity 40 kg | 2 |
Table 4.
Features of the oil mill where olives, collected from the analyzed systems, were processed.
Table 4.
Features of the oil mill where olives, collected from the analyzed systems, were processed.
| Systems | kg of Olives | Extraction Method | Average Yield in Oil | Liters of Oil Produced | Energy Consumptions (kW lil–1) | Water Consumptions (m3 loil–1) |
|---|---|---|---|---|---|---|
| BIO 1 | 8300 | Centrifugal 3 - phases | 0.12 | 996 | 0.018 | 0.008 |
| BIO 2 | 3500 | Centrifugal 2 - phases | 0.15 | 528 | 0.030 | 0.004 |
| INT 1 | 8000 | Centrifugal 2 - phases | 0.13 | 1040 | 0.020 | 0.005 |
| INT 2 | 8500 | Centrifugal 2 - phases | 0.13 | 1105 | 0.020 | 0.005 |
| HOBB1-BIO | 4300 | Centrifugal 3 - phases | 0.2 | 560 | 0.010 | 0.005 |
| HOBB2-BIO | 7500 | Centrifugal 3 - phases | 0.13 | 975 | 0.010 | 0.008 |
Table 5.
Types and combinations of packaging used by the analyzed systems.
| System | Oil Produced l ha–1 | Glass Bottles (l) | TIN (l) | Polyethylene Containers (l) | |||||
|---|---|---|---|---|---|---|---|---|---|
| 0.1 | 0.25 | 0.5 | 0.75 | 1 | 3 | 5 | 15 | ||
| BIO1 | 996 | - | 10% | 10% | - | 10% | 70% | - | - |
| BIO2 | 528 | - | 5% | 40% | 40% | - | 5% | 10% | - |
| INT1 | 1040 | 2% | 3% | 5% | 5% | - | 15% | 70% | - |
| INT2 | 1105 | 2% | 3% | 5% | 5% | - | 15% | 70% | - |
| HOBB1-BIO | 860 | - | - | - | - | - | - | - | 100% |
| HOBB2-BIO | 875 | - | - | - | - | - | - | - | 100% |
Table 6.
Details of olive oil sale for each analyzed system.
| System | Sale | Market | Type of Transport | ||||
|---|---|---|---|---|---|---|---|
| Italy | Abroad | on the Road | by Ship | by Airplane | on Rails | ||
| BIO 1 | yes | 100% | - | 90% | - | - | 10% |
| BIO 2 | yes | 80% | 20% | 80% | 15% | 3% | 2% |
| INT1 | yes | 90% | 10% | 90% | 7% | 1% | 2% |
| INT2 | yes | 90% | 10% | 90% | 7% | 1% | 2% |
| HOBB1-BIO | no | - | - | 100% | - | - | - |
| HOBB2-BIO | no | - | - | 100% | - | - | - |
Table 7.
Total environmental impacts specified for individual impact categories per liter of olive oil produced by each analyzed system.
Table 7.
Total environmental impacts specified for individual impact categories per liter of olive oil produced by each analyzed system.
| Impact Categories | Unit kg–1 | BIO1 | BIO2 | INT1 | INT2 | HOBB1- BIO | HOBB2 - BIO |
|---|---|---|---|---|---|---|---|
| Abiotic depletion | kg Sb eq | 0.00 | 0.00 | 0.00 | 0.00 | 0.00 | 0.00 |
| Abiotic depletion (fossil fuels) | MJ | 37.81 | 24.48 | 46.80 | 36.61 | 8.39 | 3.42 |
| Global warming (GWP100) | kg CO2eq | 2.77 | 1.82 | 3.39 | 2.64 | 0.74 | 0.23 |
| Ozone layer depletion (ODP) | kg CFC-11 eq | 0.00 | 0.00 | 0.00 | 0.00 | 0.00 | 0.00 |
| Human toxicity | kg 1.4-DB eq | 4.40 | 4.84 | 3.69 | 3.10 | 0.03 | 0.01 |
| Fresh water aquatic ecotox. | kg 1.4-DB eq | 1.10 | 0.61 | 1.07 | 0.82 | 0.01 | 0.01 |
| Marine aquatic ecotoxicity | kg 1.4-DB eq | 4440 | 2746 | 4486 | 3558 | 39 | 23 |
| Terrestrial ecotoxicity | kg 1.4-DB eq | 0.01 | 0.01 | 0.01 | 0.01 | 0.00 | 0.00 |
| Photochemical oxidation | kg C2H4eq | 0.00 | 0.00 | 0.00 | 0.00 | 0.00 | 0.00 |
| Acidification | kg SO2eq | 0.05 | 0.02 | 0.05 | 0.04 | 0.00 | 0.00 |
| Eutrophication | kg PO43-eq | 0.01 | 0.01 | 0.01 | 0.01 | 0.00 | 0.00 |
Table 8.
Global warming (kg CO2eq ha–1) per phase of the production chain for each analyzed system.
| Systems | Agricult. Phase | Transport Field - Oil Mill | Oil Mill | Packaging | Total | ||
|---|---|---|---|---|---|---|---|
| Olives Processing | Bottling | Storage | |||||
| BIO1 | 771 | 80 | 81 | - | 0.22 | 1827 | 2759 |
| BIO2 | 323 | 41 | 7 | 0.20 | - | 589 | 960 |
| INT1 | 1030 | 3 | 13 | - | 50 | 2431 | 3527 |
| INT2 | 922 | 3 | 13 | - | 50 | 1925 | 2913 |
| HOBB1-BIO | 370 | 245 | 9 | - | 12 | - | 635 |
| HOBB2-BIO | 151 | 48 | 9 | - | 13 | - | 221 |
Table 9.
Global warming (kg CO2eq l–1) for each analyzed system with and without packaging.
| System | With PACKAGING* | Without PACKAGING |
|---|---|---|
| BIO1 | 2.77 | 0.94 |
| BIO2 | 1.82 | 0.70 |
| INT1 | 3.39 | 1.05 |
| INT2 | 2.64 | 0.89 |
| HOBB1-BIO | 0.74 | 0.74 |
| HOBB2-BIO | 0.23 | 0.23 |
*Values referring to the packaging combinations shown in Table 5.
Table 10.
Global warming (kg CO2eq ha–1) according to the packaging combination chosen by the analyzed systems.
Table 10.
Global warming (kg CO2eq ha–1) according to the packaging combination chosen by the analyzed systems.
| System | Dark Glass Bottle (l) | Tin (l) | Carton Box | |||||
|---|---|---|---|---|---|---|---|---|
| 0.1 | 0.25 | 0.5 | 0.75 | 1 | 3 | 5 | ||
| BIO1 | - | 177 | 102 | 64 | 1483 | - | - | |
| BIO2 | - | 47 | 216 | 180 | - | 56 | 90 | - |
| INT1 | 40 | 56 | 53 | 664 | - | 331 | 1234 | 54 |
| INT2 | 42 | 59 | 56 | 47 | - | 351 | 1311 | 57 |
| HOBB1-BIO | - | - | - | - | - | - | - | - |
| HOBB2-BIO | - | - | - | - | - | - | - | - |
Table 11.
LCA results by type of transport used. Values per km per liter of olive oil transported.
| Impact Categories. | Unit | Type of Transport | |||
|---|---|---|---|---|---|
| Airplane | Ship | Rail | Road | ||
| Abiotic depletion | kg Sb eq | 0.000000 | 0.000000 | 0.000000 | 0.000000 |
| Abiotic depletion (fossil fuels) | MJ | 0.000000 | 0.000210 | 0.000000 | 0.000000 |
| Global warming (GWP100a) | kg CO2eq | 0.000521 | 0.000017 | 0.000020 | 0.000173 |
| Ozone layer depletion (ODP) | kg CFC-11 eq | 0.000000 | 0.000000 | 0.000000 | 0.000000 |
| Human toxicity | kg 1.4-DB eq | 0.000018 | 0.000014 | 0.000001 | 0.000011 |
| Fresh water aquatic ecotox. | kg 1,4-DB eq | 0.000002 | 0.000005 | 0.000000 | 0.000001 |
| Marine aquatic ecotox. | kg 1,4-DB eq | 0.006712 | 0.017902 | 0.000274 | 0.002737 |
| Terrestrial ecotox. | kg 1,4-DB eq | 0.000000 | 0.000000 | 0.000000 | 0.000000 |
| Photochemical oxidation | kg C2H4eq | 0.000000 | 0.000000 | 0.000000 | 0.000000 |
| Acidification | kg SO2eq | 0.000001 | 0.000000 | 0.000000 | 0.000001 |
| Eutrophication | kg PO43-eq | 0.000000 | 0.000000 | 0.000000 | 0.000000 |
Table 12.
Bibliographic comparison between analyzed systems and some similar studies.
| References | System Boundaries | kg CO2eq L–1 |
|---|---|---|
| BIO1 | Cradle – to – gate | 1.33 |
| BIO2 | Cradle – to – gate | 1.10 |
| INT1 | Cradle – to – gate | 1.49 |
| INT2 | Cradle – to – gate | 1.34 |
| HOBB1-BIO | Cradle – to – gate | 1.12 |
| HOBB2-BIO | Cradle – to – gate | 0.61 |
| [70] | Cradle – to – gate | 0.60 |
| [61] | Cradle – to – gate | 1.60 |
| [2] | Cradle – to – gate | 1.60 |
| [71] | Cradle – to – gate | 7.80 |
| [72] | Cradle – to – grave | 3.00 |
| [73] | Cradle – to – grave | 3.80 |
© 2020 by the authors. Licensee MDPI, Basel, Switzerland. This article is an open access article distributed under the terms and conditions of the Creative Commons Attribution (CC BY) license (http://creativecommons.org/licenses/by/4.0/).
Share and Cite
MDPI and ACS Style
Maffia, A.; Pergola, M.; Palese, A.M.; Celano, G. Environmental Impact Assessment of Organic vs. Integrated Olive-Oil Systems in Mediterranean Context. Agronomy 2020, 10, 416. https://0-doi-org.brum.beds.ac.uk/10.3390/agronomy10030416
AMA Style
Maffia A, Pergola M, Palese AM, Celano G. Environmental Impact Assessment of Organic vs. Integrated Olive-Oil Systems in Mediterranean Context. Agronomy. 2020; 10(3):416. https://0-doi-org.brum.beds.ac.uk/10.3390/agronomy10030416
Chicago/Turabian StyleMaffia, Angela, Maria Pergola, Assunta Maria Palese, and Giuseppe Celano. 2020. "Environmental Impact Assessment of Organic vs. Integrated Olive-Oil Systems in Mediterranean Context" Agronomy 10, no. 3: 416. https://0-doi-org.brum.beds.ac.uk/10.3390/agronomy10030416
Note that from the first issue of 2016, this journal uses article numbers instead of page numbers. See further details here.