Article

SNP in DFR1 Coding Sequence Is Tightly Associated with Anthocyanin Accumulation in Cabbage (B. oleracea var. capitata f. alba) at Low Temperature

1
Department of Biological Sciences, College of Biological Science and Biotechnology, Chungnam National University, Daejeon 34134, Korea
2
Department of Horticulture, Sunchon National University, Suncheon, Jeonnam 57922, Korea
3
Biotechnology and Breeding Institute of Asia Seed Co., Icheon-si, Gyeonggi-do 17414, Korea
4
Korea Research Institute of Bioscience and Biotechnology (KRIBB), Daejeon 34141, Korea
*
Author to whom correspondence should be addressed.
These authors contributed equally to this work.
Submission received: 27 March 2020 / Revised: 21 April 2020 / Accepted: 21 April 2020 / Published: 23 April 2020

Abstract

:
Keeping green leaf color at the time of harvest is one of the important traits for breeding of Brassica oleracea var. capitata f. alba, and this trait is related to low anthocyanin contents. To understand the differential accumulation of anthocyanins in cabbage, we selected high anthocyanin accumulators (HAAs) and low anthocyanin accumulator (LAAs) of cabbages and examined the anthocyanin content and the expression of anthocyanin biosynthesis-related genes. Among many genes investigated, BoDFR1 was found to be closely related to anthocyanin accumulation, even under low temperature (LT) conditions. BoDFR1 sequence analyses between HAAs and LAAs revealed that there is a single nucleotide polymorphism (SNP) (1118T/A) in the coding sequence, which substitutes one amino acid from Leu261 to His261; we named BoDFR1 with His261 substitution as BoDFR1v. This amino acid substitution did not affect dihydroflavonol 4-reductase (DFR) activity and substrate specificity, but the polymorphism showed tight association to the BoDFR1 expression, i.e., high level expression of BoDFR1 and low level expression of BoDFR1v under LT conditions. The high levels of BoDFR1 expression were due to the high levels of BoMYB114 and BobHLH expressions combined with low level expression of BoMYBL2, a repressor MYB. On the other hand, low levels of BoDFR1v expression seemed to be related to very low level expressions of BoMYB114 and BobHLH combined with a high level expression of BoMYBL2. It seems that different expression levels of these regulatory genes for MBW (MYB-bHLH-WD40) complex between HAAs and LAAs regulate BoDFR expression and anthocyanin accumulation. Using a single nucleotide polymorphism (SNP) between BoDFR1 and BoDFR1v, molecular markers for PCR and high resolution melt analyses were developed and validated to distinguish between HAAs and LAAs. Combined use of the BoDFR1 SNP marker with other stress markers, such as a cold tolerant marker, will greatly improve cabbage breeding.

1. Introduction

Anthocyanins are water-soluble plant pigments that range from blue to red in color. Anthocyanins impart color to leaves, flowers, and fruits, thus attracting pollinators and seed distributors [1,2,3,4], and protect plants from abiotic stresses, such as ultraviolet (UV) radiation, cold, and drought, and biotic stresses such as microbial infection [5,6,7,8,9,10,11,12,13]. Anthocyanins exhibit potent antioxidant activity [14,15,16] and therefore act as functional compounds that promote human health by lowering the incidence of cardiovascular diseases and chronic and degenerative diseases [17,18,19,20,21,22,23,24,25,26].
In plants, anthocyanin biosynthesis is controlled by several genes encoding structural proteins and transcription factors. Genes encoding structural proteins are divided into two groups: early biosynthetic genes (EBGs), which are involved in the initial stages of anthocyanin biosynthesis such as chalcone synthase (CHS), chalcone isomerase (CHI), and flavanone 3-hydroxylase (F3H) [27], and late biosynthetic genes (LBGs), which are involved in the late stages of anthocyanin biosynthesis such as dihydroflavonol 4-reductase (DFR) and anthocyanidin synthase (ANS) (or leucoanthocyanidin oxygenase; LDOX) [28,29,30]. The expression of LBGs is tightly regulated by MYB, basic helix-loop-helix (bHLH), and WD-repeat proteins [31,32], which together form the MBW complex and regulate the spatiotemporal expression pattern of LBGs in response to developmental and environmental factors [30,32,33].
DFR (EC1.1.1.219) catalyzes a key step late in the biosynthesis of anthocyanins, condensed tannins (proanthocyanidins), and other flavonoids important for plant survival and human nutrition [34]. DFR reduces three dihydroflavonols, including dihydrokaempferol (DHK), dihydroquercetin (DHQ), and dihydromyricetin (DHM), to leucoanthocyanidins, which are common precursors of anthocyanins and condensed tannins [35,36]. Thus, DFR activity regulates the level of anthocyanins, and its substrate preference results in the accumulation of different types of anthocyanins. It has been reported that anthocyanin accumulation and purple (or red) coloration are related to the high levels of DFR expression in purple kale (B. oleracea var. acephala f. tricolor) [33], red (or purple) cabbage (B. oleracea var. capitata f. rubra) [37,38,39], purple cauliflower (B. oleracea var. botrytis) [38], purple mustard (Brassica juncea) [40], purple bok choy (Brassica rapa subsp. chinensis) [41], purple kohlrabi (B. oleracea var. gongylodes) [42,43], red lettuce (Latuca sativa) [44], and apple (Malus domestica) [45]. Increase in anthocyanin accumulation upon exposure to low temperature (LT) is a common phenomenon in various plant species including Arabidopsis thaliana [46], grape (Vitis vinifera) [47], orange (Citrus sinensis) [48], kale [33], Chinese cabbage (B. rapa) [49], and apple [50]. Because of the antioxidant activity of anthocyanins, their accumulation confers cold tolerance [9,51,52] and is concomitant with the increase in DFR expression under LT conditions [12,33,49]. Recently, An et al. reported that an MYB transcription factor regulates both cold tolerance and anthocyanin accumulation in apple by binding to the promoters of C-repeat binding factor (CBF) and DFR genes, thus activating their expression [13].
Genetic and molecular characterization of DFR genes have been conducted in various plant species including alfalfa (Medicago truncatula) [36], trembling aspen (Populus tremuloides) [53], lotus (Lotus japonicus) [54], Saussurea medusa [55], Chinese cabbage [49], and Freesia hybrida [56]. In plants, the DFR gene generally exists as two or more copies, for example, two copies in maize (Zea mays) [57], alfalfa [36], poplar (Populus spp.) [58], and yam (Dioscorea alata) [27], three copies in morning glory (Ipomoea batatas) [59], wheat (Triticum aestivum) [60], onion (Allium cepa) [61], and ginkgo (Ginkgo biloba) [62], six copies in lotus [63], eight copies in Freesia hybrida [56], and twelve copies in Chinese cabbage [49]. Multiple copies of the DFR genes imply the functional diversification of DFR proteins for color determination, stress response, and other horticultural traits. In addition to the multiple copies of DFRs, allelic polymorphisms are also associated with bulb color in onion [61,64], flesh color in potato (Solanum tuberosum) [65], and grain quality in barley (Hordeum vulgare) [66]. Polymorphisms in the untranslated region (UTR) and the intron of the DFR gene have been used to develop molecular markers in common bean (Phaseolus vulgaris) [67] and onion [61,64] to distinguish among haplotypes or genotypes with different bulb colors.
Despite the positive effects of anthocyanins on plant and human health, one of the goals of cabbage breeding programs, especially in Korea and China, is to maintain the deep green color of leaves at the time of harvest regardless of the harvest season. Therefore, a dilemma in cabbage breeding is the development of stress tolerant varieties with low anthocyanin content at harvest when LT conditions may occur. To resolve the dilemma, we identified two contrasting cabbage types, high anthocyanin accumulators (HAAs) and low anthocyanin accumulators (LAAs), under LT conditions, and selected BoDFR1 in both cabbage types as the target gene that regulates anthocyanin accumulation. BoDFR1 expression levels were closely related to a single nucleotide polymorphism (SNP) identified in the gene (BoDFR1 in HAAs vs. BoDFR1v in LAAs) as well as to the level of anthocyanins. This SNP showed perfect association with the expression of upstream regulatory genes and was used to discriminate between HAAs and LAAs.

2. Materials and Methods

2.1. Plant Materials and Growth Conditions

Cabbage (Brassica oleracea var. capitata) varieties used in this study were divided into two groups: one used for sequence and expression analyses (Table 1) and the other used for marker validation (Table S1). Seed and leaf samples of cabbage varieties were kindly provided by Korean Seed Companies or the GSP Horticultural Center of Suncheon National University, Chonnam, Korea. Initially, eight inbred lines, including two purple cabbage lines, were obtained from the Biotechnology and Breeding Institute of Asia Seed Co., Icheon-si, Gyeonggi-do, Republic of Korea (Table 1). Then, additional lines were selected for detailed analysis, including Speed King, Golden Cross, CT-415, T-523, and T-530, from more than 40 inbred lines and cultivars grown in the field under LT conditions. Seeds of these additional lines were kindly provided by Joen Seed Co., Goesan-gun, Chungbuk, Korea, and Asia Seed Co. These lines were usually classified into two groups under LT conditions, HAAs and LAAs.
Seeds were germinated, and plants were grown for 3 weeks in a growth chamber under controlled conditions (23 °C, 16 h light/8 h dark photoperiod and 140 μmol m−2−1 light intensity). Then, plants were grown in a growth chamber under LT (<10 °C) or normal conditions (control) for 1 month. To conduct experiments under natural conditions, plants were cultivated inside and outside the greenhouse of Chungnam National University, Daejeon, Korea. LT treatment (<10 °C) under natural conditions (outside) was conducted for 30 days, whereas plants grown under normal conditions (inside) were maintained in the greenhouse at set minimum (20 °C) and maximum (30 °C) temperatures. Seedlings of the inbred line BN106 were grown in the growth room for 3 weeks and exposed to LT (10 °C, 4 °C, or 0 °C) for 2 h.

2.2. Analysis of BoDFR1 Gene and Promoter Sequences

Genomic DNAs were extracted from the leaves of cabbage genotypes listed in Table 1, except BN106, using the DNeasy Plant Mini Kit (QIAGEN, Hilden, Germany). The promoter and the genomic DNA (from ATG to TGA), including the coding sequence (CDS) of the BoDFR1 gene, were cloned by PCR using Ex Taq (Takara, Kyoto, Japan) and sequence-specific primers designed on the basis of BoDFR1 (Bol035269) sequence obtained from the Brassica database (http://brassicadb.org/brad/index.php); primers DFR-F (5′-ATGGTAGCTCACAAAGAGACCGT-3′) and DFR-R (5′-CTAAGCACAGATCTGCTGTGCCG) were used to amplify 1.6 kb BoDFR1 genomic DNA from ATG to TGA, and primers pDFR-F1 (5′-CCTCTCACTTCGAAGCCTTCCT) and pDFR-R (5′-CACGGTCTCTTTGTGAGCTACCAT) were used to amplify the BoDFR1 promoter region. PCR conditions were as follows: initial denaturation at 94 °C for 5 min, followed by 30 cycles of denaturation at 94 °C for 30 s, annealing at 58 °C for 30 s, and synthesis at 72 °C for 1 min and a final extension at 72 °C for 7 min. PCR products were electrophoresed on 1% agarose gels and purified using LaBoPass Gel Extraction Kit (COSMOGENETECH, Seoul, Korea). The purified DNA fragments were cloned into the T&A cloning vector (RBC, Banqiao, Taiwan) and transformed into Escherichia coli strain DH5α. Plasmid DNA was isolated from the transformed bacteria using LaBoPass Plasmid Mini Kit (COSMOGENETECH, Seoul, Korea). To avoid PCR and sequencing errors and to identify different BoDFR1 alleles, at least ten clones were sequenced for each genotype. The obtained sequences were compared and analyzed using the multiple sequence alignment program CLUSTAL Omega (EMBL-EBI, UK), and cis-elements in the promoter region were identified using web-based promoter analysis tools, PLACE (http://www.dna.affrc.go.jp/htdocs/PLACE/) and PlantPAN (http://PlantPAN2.itps.ncku.edu.tw). To validate T/A SNP, 1177 bp fragment spanning exons 1–5 was amplified using the forward primer, 5′-TGCCACTGTTCGCGATCCTG-3′, and reverse primer, 5′-CATCCACTCCTTCAAACCTGTTCCA-3′, and ca. 30 bp were used for an alignment.

2.3. Expression Analysis of BoDFR1

Total RNA was extracted from leaf samples with TRIzol Reagent (Thermo Scientific, Waltham, USA), and 1 μg of total RNA was treated with RQ1 RNase-free DNase (Promaga, Madison, USA) at 65 °C for 10 min. First-strand cDNA was synthesized using oligo dT primers and Revertra Ace Kit (TOYOBO, Osaka, Japan). Primers used to analyze BoDFR expression are listed in Table S2. Semi-quantitative RT-PCR was performed as follows: initial denaturation at 94 °C for 5 min, followed by 27 cycles of 94 °C for 30 s, 60 °C for 30 s, and 72 °C for 30 s, and a final extension at 72 °C for 7 min. DNA fragments amplified by semi-quantitative RT-PCR were separated on 1.5% agarose gels and stained with ethidium bromide. Quantitative real-time PCR (qRT-PCR) was performed on the MiniOpticon system (Bio-Rad, Hercules, California, USA) using SYBR Green Realtime Master Mix (TOYOBO, Osaka, Japan). Primers for BoDFR1 were designed to amplify 275 nucleotides between exon 4 and exon 6: forward primer, 5′- CTCTCTCCTATCACTCGTAACGAGGC and reverse primer, 5′- TCCCATATCAATCAGCTTCTTGGAACTG. PCR conditions were as follows: denaturation at 95 °C for 10 min, followed by 40 cycles of 94 °C for 30 s, 58 °C for 30 s, and 72 °C for 30 s. Fluorescence values were measured at the last step of each cycle. All analyses were performed with three biological replicates. Transcript levels of target genes were normalized relative to the BoActin2 gene (internal reference) and analyzed using the 2−ΔΔCT method [68].

2.4. Expression Analysis of Anthocyanin Biosynthesis-Related Genes

Total RNA extraction and cDNA synthesis were performed as described above. Expression analysis of anthocyanin biosynthesis-related genes (two representative genes for EBGs and LBGs and eight regulatory genes) was performed by qRT-PCR using primers listed in Table S3. Relative transcript levels were quantified as described above.

2.5. Anthocyanin Extraction and Quantification

Anthocyanin content was measured as described previously [69]. Briefly, 1 mL of 1% (v/v) HCl-methanol was added to 0.3 g of the powdered sample. The sample was shaken gently in darkness at room temperature for 24 h and then centrifuged at 13,000 × g. The upper aqueous phase was collected, and its absorbance was measured at 530, 620, and 650 nm. Relative anthocyanin content was calculated according to the following equation:
Relative   anthocyanin   content = A 530 A 620 0.1 × A 650 A 620
where A530, A620, and A650 represent the absorbance of the aqueous layer at 530, 620, and 650 nm, respectively.
Total anthocyanin content (mg anthocyanin/100 g fresh weight) was then calculated on the basis of the reference, cyanidin-3-oglucoside [70], according to the following equation:
Total   anthocyanin   content = Relative   anthocyanin   content × MW × DF × 1000 ×
where MW is the molecular weight of cyanidin-3-glucoside (449.2 g/mol); DF is the dilution factor; and is the cuvette optical path length (1 cm).

2.6. Establishment of PCR-Based Assay

To discriminate between BoDFR1 and BoDFR1v, an allele-dependent PCR assay was developed, which utilized a common reverse primer and two forward allele-dependent primers in a single reaction. Forward primers possessed different tails containing a destabilizing mismatch (or artificial mismatch) (Table 2) [71,72], while the reverse primer was complementary to a common reference sequence located 200–300 bp away from the forward primer-binding site. Several PCRs were conducted to select primer combinations with high SNP discriminating power and to optimize template concentration, annealing temperature, and amplification cycle number. The selected primer combinations and PCR reaction conditions are summarized in Table 2. PCR reactions contained 5–10 ng of genomic DNA template, 4 μL of Taq Premix (Elpisbiotech, Daejoen, Korea), and 1 μL (10 pmol) each of forward and reverse primer in a total volume of 20 μL.

2.7. High Resolution Melt (HRM) Analysis

To detect SNPs in BoDFR1 rapidly and efficiently, HRM analysis was carried out on a LightCycler 96 (Roche, Basel, Switzerland) instrument post-PCR in a volume of 20 μL containing 10 ng of template DNA, 1 μL (10 pmol) each of forward, reverse, and probe primer, and 10 μL of the LightCycler 480 High Resolution Melting Master Mix (Roche, Basel, Switzerland). The reaction was pre-incubated for 10 min at 95 °C, followed by 50 cycles of amplification including denaturation for 10 s at 95 °C, annealing for 20 s between 63 and 55 °C under touchdown command, and synthesis for 20 s at 72 °C. The amplified PCR products were then subjected to the following HRM cycle: 60 s at 95 °C, 120 s at 40 °C and 1 s at 83 °C. The fluorescence value (-dF/dT) was recorded during the final step with six readings per °C. The LightCycler 96 software (Roche, Basel, Switzerland) was used to analyze the HRM curves. Each of the samples was appropriately labeled in sample editor. Both delta Tm discrimination and curve shape discrimination were set at 75%, where a 0.2 positive/negative threshold level was set to obtain the final output. Primers used for HRM analysis are listed in Table 2.

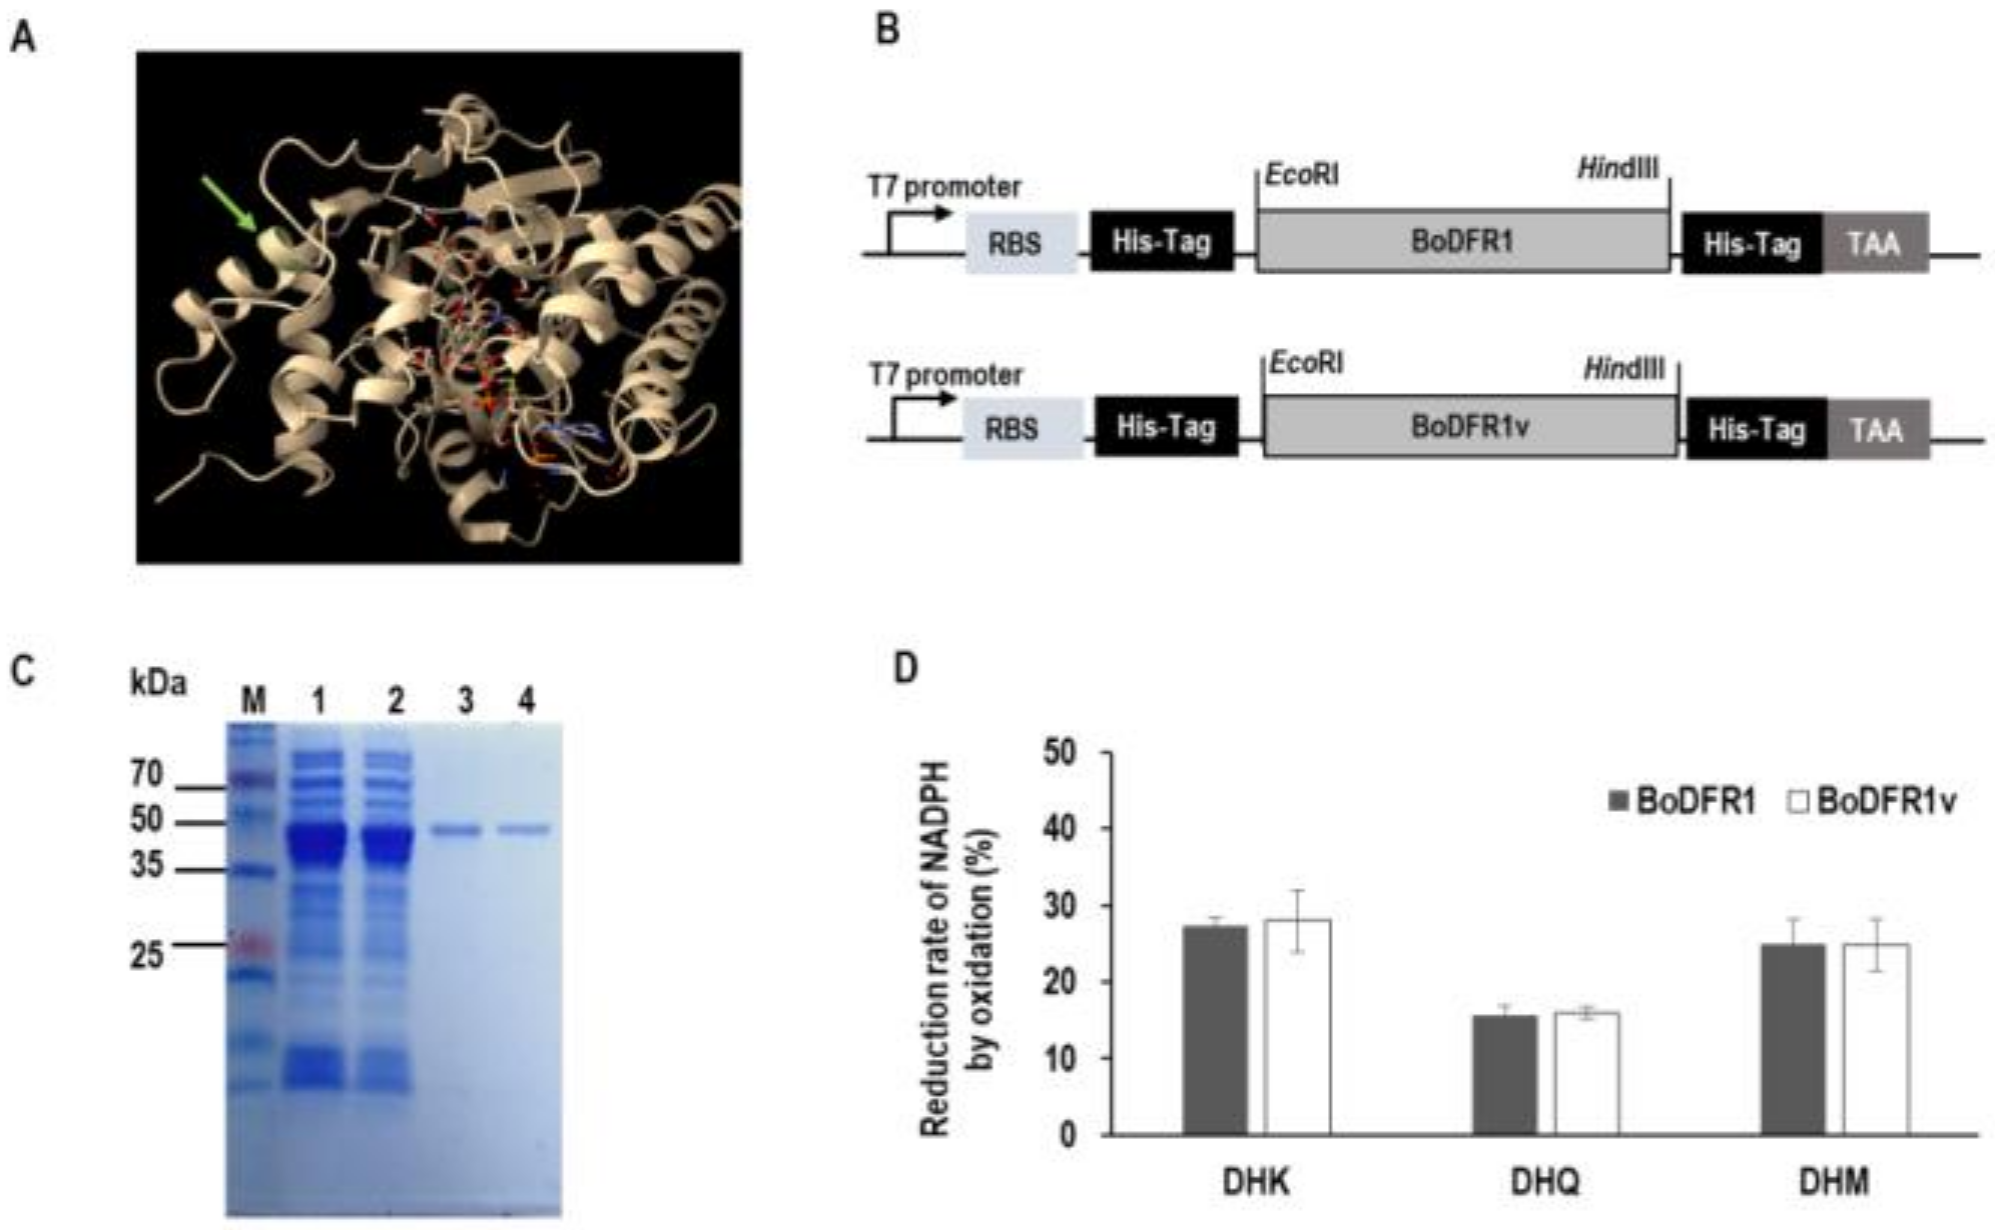
2.8. Recombinant DFR1 Protein Expression

To generate N-terminal His-tagged fusions of BoDFR1 and BoDFR1v proteins, the BoDFR1 gene was amplified from the cDNA of HAA and LAA inbred lines 154 and 09WH45, respectively, by PCR using Ex Taq (Takara, Kyoto, Japan), forward primer BoDFR-poxF (5′-ACAGAATTCATGGTAGCTCACAAAGAG-3′) containing EcoRI restriction site (underlined), and reverse primer BoDFR-poxR (5′-GCAAGCTTGAGCACAGATCTGCTGTG-3′) containing HindIII restriction site (underlined). PCR products were digested with EcoRI and HindIII restriction enzymes and cloned into the pET28a expression vector (Sigma-Aldrich, St. Louis, Missouri, USA) previously digested with the same enzymes. The resulting plasmids were transformed into E. coli DH5α cells, purified and sequenced. The sequence confirmed plasmids were transformed into E. coli strain BL21 cells (RBC, Banquiao, Taiwan), and protein expression was induced by isopropyl-thio-β-D-galactoside (IPTG; 0.3 mM) treatment at 23 °C for 16 h. Cells were harvested, resuspended in phosphate-buffered saline (PBS), and lysed by sonication. The His-tagged BoDFR1 and BoDFR1v proteins were purified by Ni Sepharose High Performance His-tagged protein purification resin (GE Healthcare, Chicago, Illinois, USA), and the purified proteins were dialyzed using MOPS (3-(N-morpholino)propanesulfonic acid) buffer. Protein concentrations were measured by the Bradford assay and confirmed by sodium dodecyl sulfate-polyacrylamide gel electrophoresis (SDS-PAGE) on 10% polyacrylamide gels.

2.9. Enzyme Activity Assay

Enzyme activity of BoDFR1 and BoDFR1v was examined as described previously [73] using 10 mg/ml of DHK (AdipoGen, San Diego, California, USA), DHQ (Sigma-Aldrich, St. Louis, Missouri, USA), and DHM (Sigma-Aldrich, St. Louis, Missouri, USA) substrates. A reaction (500 μL total volume) containing 100 mM Tris-HCl buffer (pH 7.0), 35 μg of enzyme extract, 100 μg of substrate, and 2 mM NADPH (Reduced nicotinamide adenine dinucleotide phosphate) was incubated at 30 °C for 1 h. The activity of DFR1 was determined by measuring the rate of NADPH oxidation. To determine the content of NADPH, absorbance at 340 nm was measured using a spectrophotometer and calculated according to Beer’s law:
A = ε   × ×   C
where A is the absorbance of a 1 M solution of NADPH at 340 nm; ε is the extinction coefficient of NADPH (6.22 mM−1 cm−1); is the path length of the cuvette in cm; and C is the molar concentration.

2.10. Statistical Analysis

Anthocyanin contents, BoDFR1 activity, temperature, and gene expression levels were analyzed using one-way analysis of variance (ANOVA) and Tukey’s pair-wise comparisons in Minitab v.17 (Minitab Inc., State College, PA, USA). The data were presented as the mean of three biological replicates ± standard deviation (±SD).

3. Results

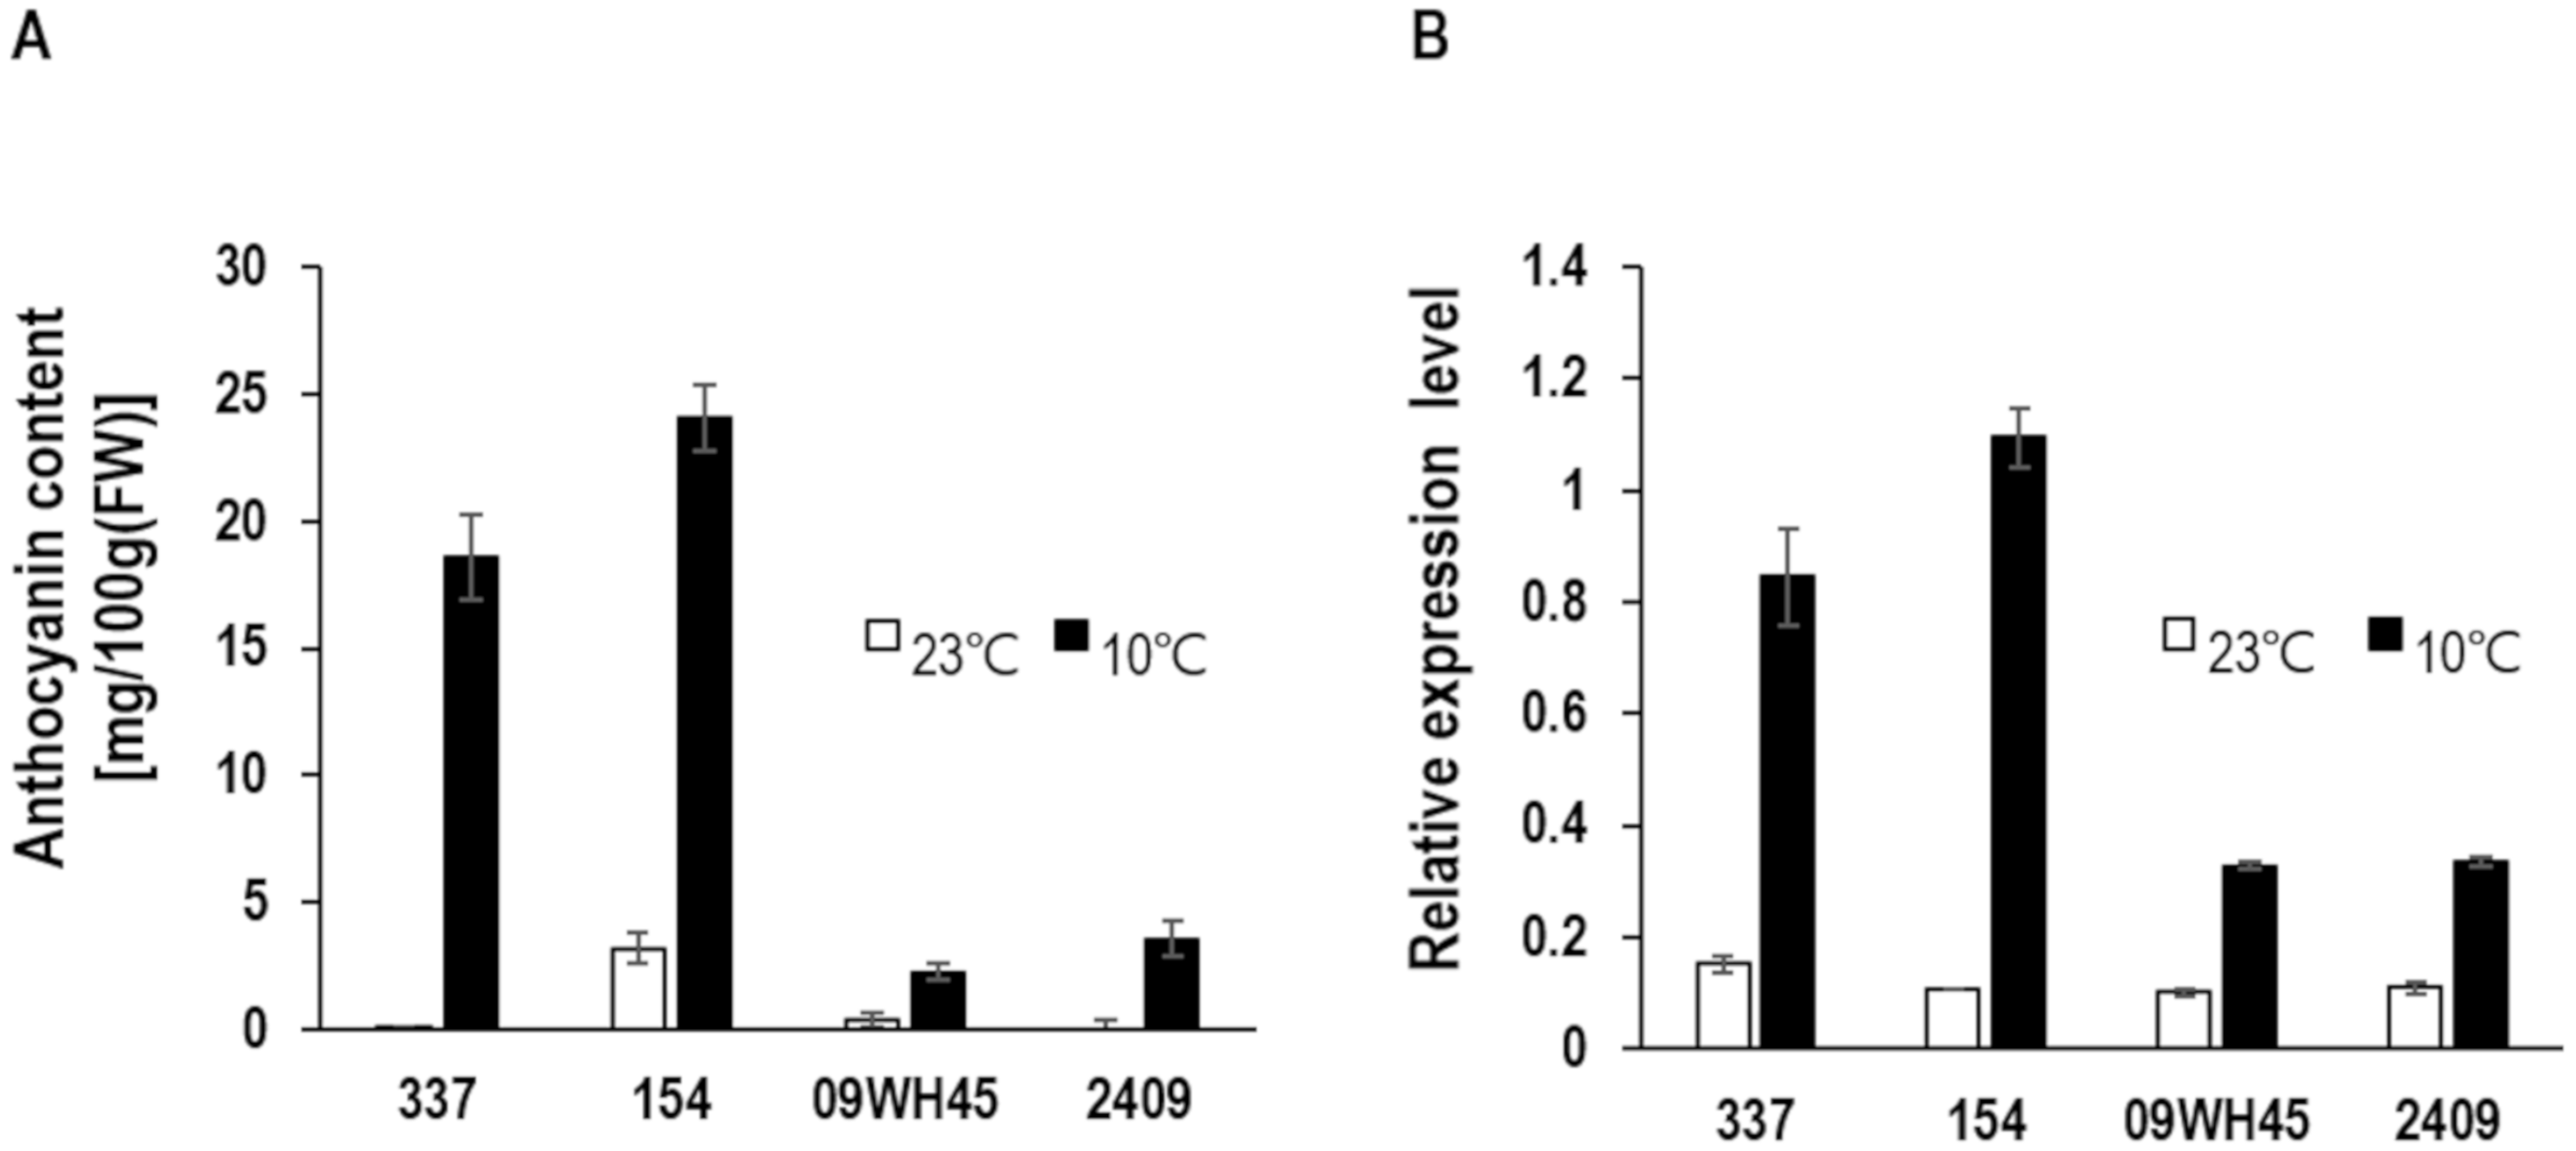
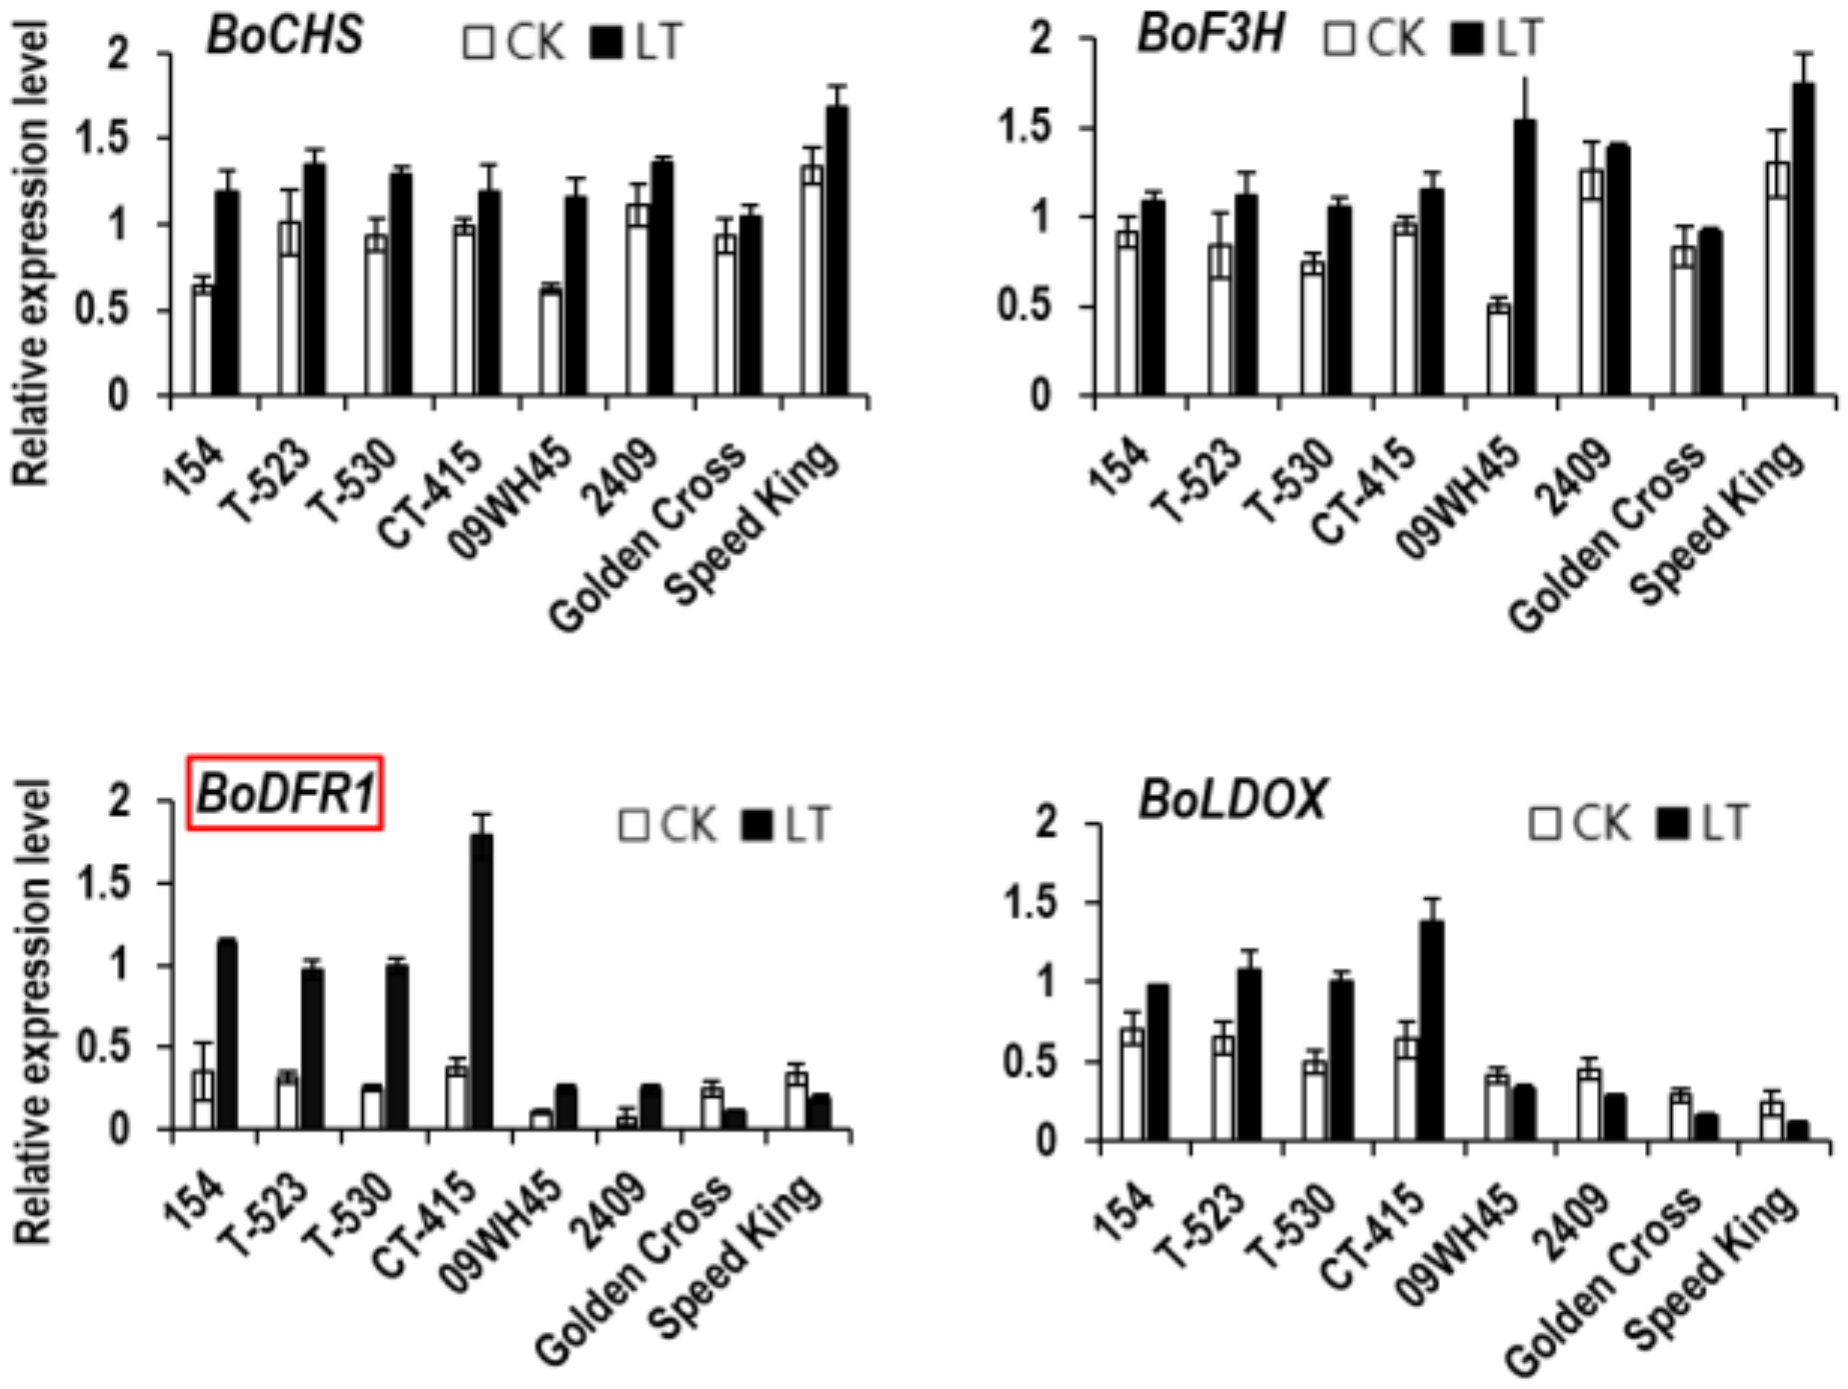
3.1. Identification of BoDFR1 as the Key Gene Responsible for Anthocyanin Accumulation under LT Conditions

To identify the gene that regulates anthocyanin accumulation under LT conditions, we examined the expression profiles of two early anthocyanin biosynthetic genes (BoCHS and BoF3H) and two late anthocyanin biosynthetic genes (BoDFR1 and BoLDOX) encoding structural proteins in the LT tolerant inbred line BN106. The temperature was decreased to 0 °C, and gene expression was analyzed by qRT-PCR (Figure 1A). The expression of BoF3H and BoDFR1 increased in response to the decrease in temperature, whereas the expression of BoCHS and BoLDOX decreased or remained constant. Since the increase in BoDFR1 expression in response to LT was more notable than that of BoF3H, we selected BoDFR1 for further analysis.
The presence of several DFR genes with differential expression under different abiotic stresses is suggested to have functional implications [49]. Based on the DFR sequences of Chinese cabbage, we identified eight putative DFR genes in cabbage (http://brassicadb.org/brad/) (Table S4) and investigated their expression by semi-quantitative RT-PCR in three HAA genotypes (337, 154, and 2437) under LT (Figure 1B). In these genotypes, three putative BoDFR genes (Bol006592, Bol015141, and Bol024018) were expressed constitutively, whereas four genes showed no expression; only one gene (Bol035269) showed LT-dependent expression (Figure 1B). An ortholog of Bol035269 (Bo9g058630) was identified in B. oleracea var. oleracea (http://plants.ensembl.org/Brassica_oleracea/Info/Index), which is hereafter referred to as BoDFR1. The expression of BoDFR1 was then studied in various cabbage genotypes exhibiting differential anthocyanin accumulation under LT.
Initially, we focused on six inbred lines, three of which accumulated anthocyanins to high levels under LT (HAAs: 337, 154, and 2437) but three to show low levels (LAAs: 09WH45, 842, and 2409). Based on RT-PCR results (data not shown), we selected four inbred lines, including two HAAs (337 and 154) and two LAAs (09WH45 and 2409), for further analyses. First, we examined the level of anthocyanins and BoDFR1 expression in these lines grown at LT (<10 °C) for at least 30 days in a growth chamber. Upon LT exposure, anthocyanin content increased 4-10-fold in both HAA genotypes, and this increase was proportional to the increase in BoDFR1 expression (5.5-10-fold) (Figure 2). However, anthocyanin accumulation and BoDFR1 expression levels were not remarkable in the LAA genotypes.
Next, to examine the relationship between anthocyanin accumulation and BoDFR1 expression under natural environmental conditions, we grew more than 40 cabbage genotypes, including previously examined inbred lines, either in the greenhouse or field at LT (<10 °C) for 1 month. Four HAAs (154, T-523, T-530, and CT415) and four LAAs (09WH45, 2409, Golden Cross, and Speed King) were selected from field grown genotypes (Table 1, Figure 3) for further expression analyses and marker development and validation. Under LT, the anthocyanin content of HAAs varied from 30–53 mg/100 g fresh weight (FW), whereas that of LAAs varied from 4–16 mg/100 g FW (Figure 4A). The expression level of BoDFR1 was more than 5-fold higher in HAAs than in LAAs (Figure 4B), indicating that BoDFR1 expression is closely associated with anthocyanin content.

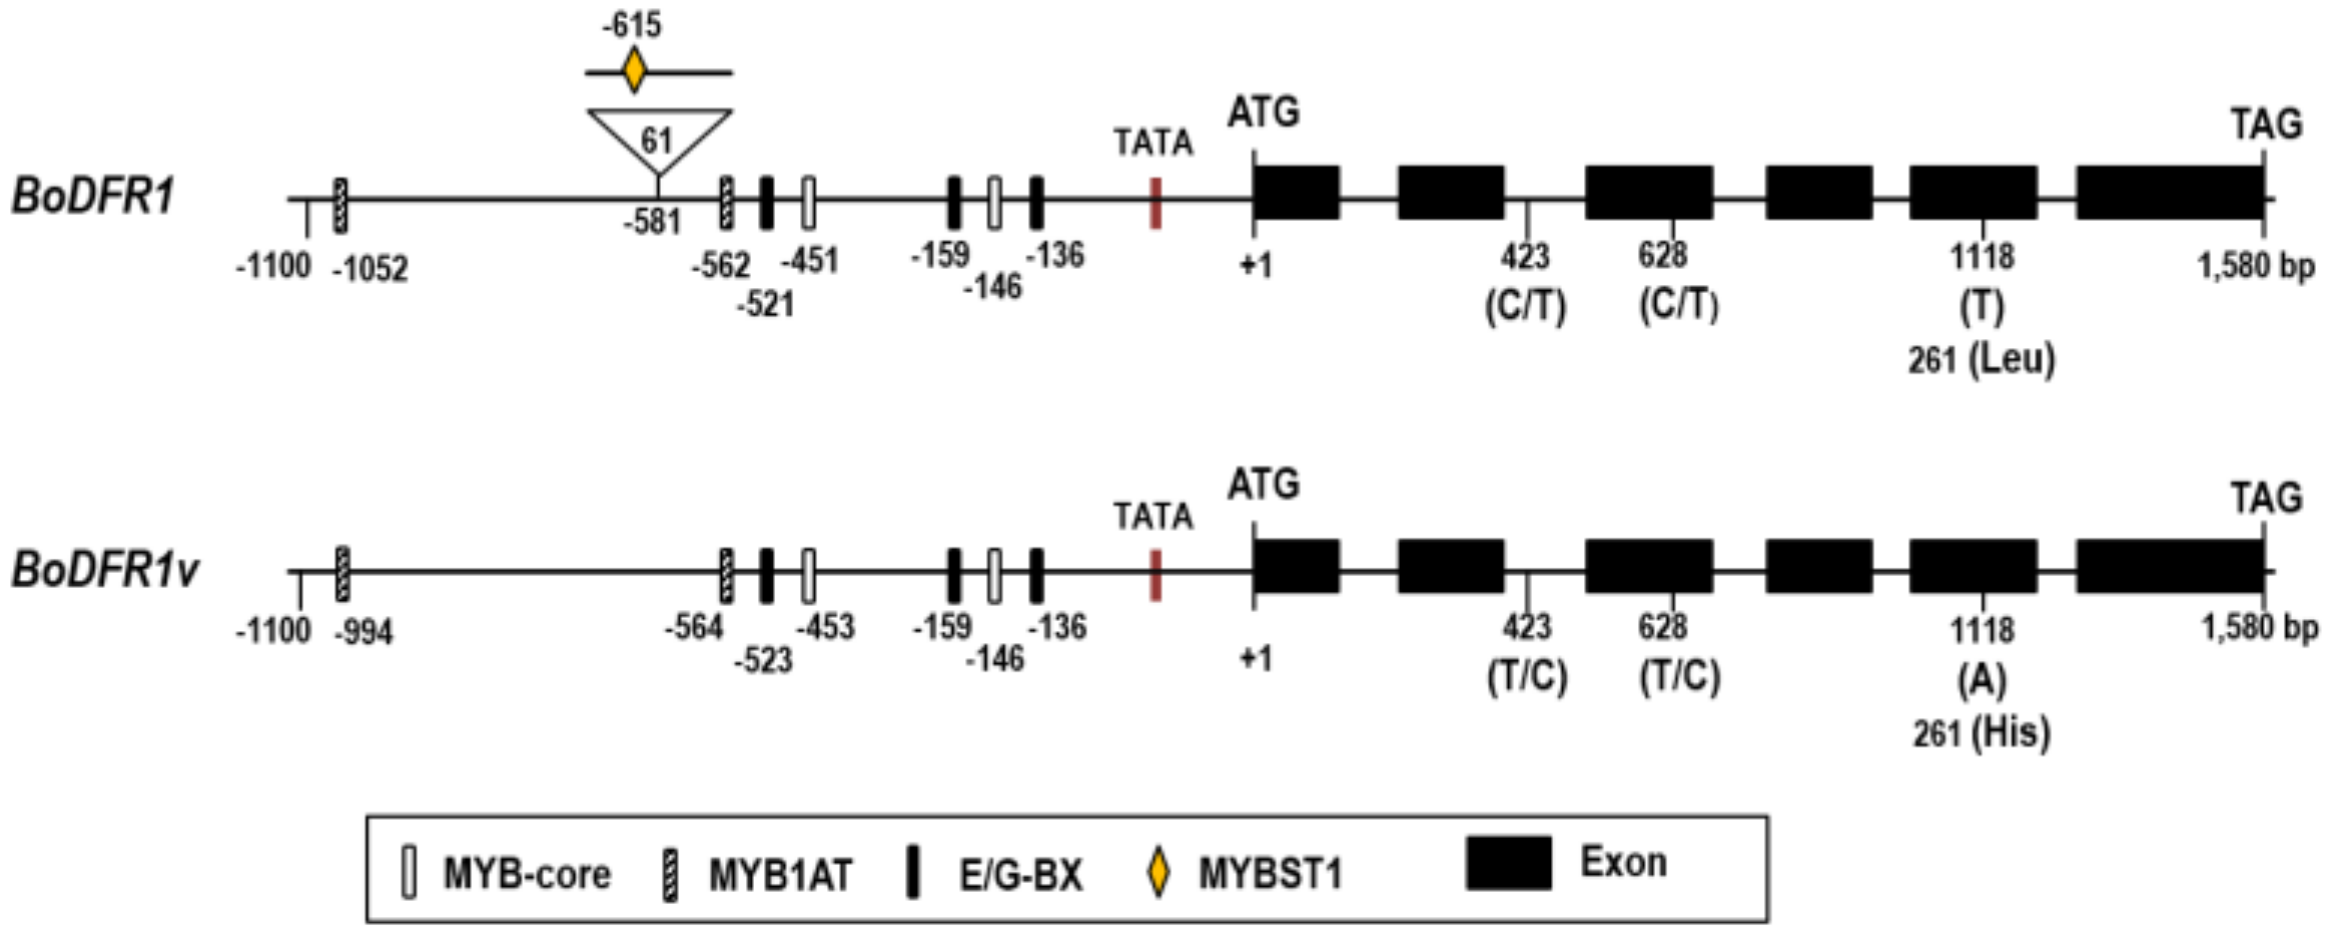
3.2. Analysis of the BoDFR1 Gene Sequence Isolated from HAAs and LAAs

To investigate any relationship between genomic sequences and the expression levels of BoDFR1 in HAAs and LAAs, we isolated the BoDFR1 gene, including its promoter, from six HAAs (337, 154, 2437, T-523, T-530, and CT-415) and five LAAs (09WH45, 842, 2409, Golden Cross, and Speed King) (Table 1) using primers designed against Bol035269 (http://brassicadb.org/brad/) and Bo9g058630 (http://plants.ensembl.org/Brassica_oleracea/Info/Index) sequences and sequence information obtained from the National Center for Biotechnology Information (NCBI) website (https://blast.ncbi.nlm.nih.gov/Blast.cgi) (Table S2). To avoid any errors due to PCR and sequencing, we analyzed at least ten clones for each sample. The promoter region of BoDFR1 (1380 bp upstream of the start codon) and 1580 bp genomic DNA, including CDS, were sequenced. Sequences of BoDFR1 isolated from cabbage genotypes 337, 154, 2437, 09WH45, 2409, 842, T-523-1, T-523-2, T-530-1, T-530-2, CT415-1, CT415-2, Speed King, and Golden Cross were deposited in GenBank under the following accession numbers: MN537957, MN537958, MN537959, MN537960, MN537961, MN537962, MN537963, MN537964, MN537965, MN537966, MN537967, MN537968, MN537969, and MN537970, respectively (Figure S1). All genes (six genes from HAAs and five genes from LAAs) comprised six exons and five introns (1580 bp) and 1380 bp promoter regions (Figure 5). Only three SNPs were identified in 1580 bp genomic DNA of BoDFR1 between HAAs and LAAs at nucleotide positions 423 (second intron), 628 (third exon), and 1118 (fifth exon). SNPs at nucleotide positions 423 and 628 occurred together in only three F1 cultivars (T-523, T-530, and T-415), whereas the remaining genotypes harbored only one of these SNPs. At nucleotide position 1118, HAAs harbored a T, whereas LAAs harbored an A. This T/A SNP was predicted to cause a substitution at amino acid position 261 from leucine (Leu; L) to His (H). Since most of the DFR sequences available in nucleotide databases harbored a T at nucleotide position 1118, we hereafter refer to the BoDFR1 allele in LAAs as the variant (BoDFR1v) and that in HAAs as BoDFR1.
Next, analysis of the number and the distribution of cis-acting elements revealed two MYB-binding sites (MBS1 or MYB-core; CNGTTR) [74], three bHLH-binding sites (E/G-BX; CANNTG/CACGTG) [75,76], and two MYB recognition sites (MYB1AT; A/TAACCA) [77] in the BoDFR1 promoter region, and their sequences were highly similar between HAAs and LAAs (Figure 5). By contrast, the MYBD-binding site (MYBST1; GGATA) [78] at −581 bp was present in reverse orientation in BoDFR1 promoter. However, the presence of MYBST1 might not have affected BoDFR1 expression and anthocyanin accumulation because the BoDFR1 gene in red (or purple) cabbage genotypes 7S4-63 and 7S4-51 (GenBank accession numbers: MN537971 and MN537972, respectively), which exhibited high anthocyanin accumulation and high BoDFR1 expression, does not contain MYBST1 in its promoter.

3.3. In Vitro Enzyme Activity Assay of BoDFR1 and BoDFR1v

Previously, Johnson et al. (2001) [79] reported that minor changes in the DFR gene affect the activity and the substrate specificity of the encoded protein. Additionally, we identified one amino acid substitution in BoDFR1v (L261H). Therefore, we examined the enzyme activity of BoDFR1 and BoDFR1v by expressing His-tagged recombinant proteins in E. coli. Based on the crystal structures of both these proteins (Figure 6A), we hypothesized no differences in their enzyme activity or substrate specificity. The L261H substitution in BoDFR1v is located in the α10 helix of the small C-terminal domain, distant from the ball-and-stick structure, which is important for substrate- and NADP+-binding [80]. We generated recombinant BoDFR1 and BoDFR1v constructs (Figure 6B) and purified the His-tagged recombinant DFR proteins (Figure 6C). Enzyme activity, expressed as the decline in the oxidation rate of NADPH, differed among the substrates DHK, DHQ, and DHM but not between BoDFR1 and BoDFR1v (Figure 6D). These results suggest that the L261H amino acid substitution does not affect the activity or substrate specificity of the DFR protein.

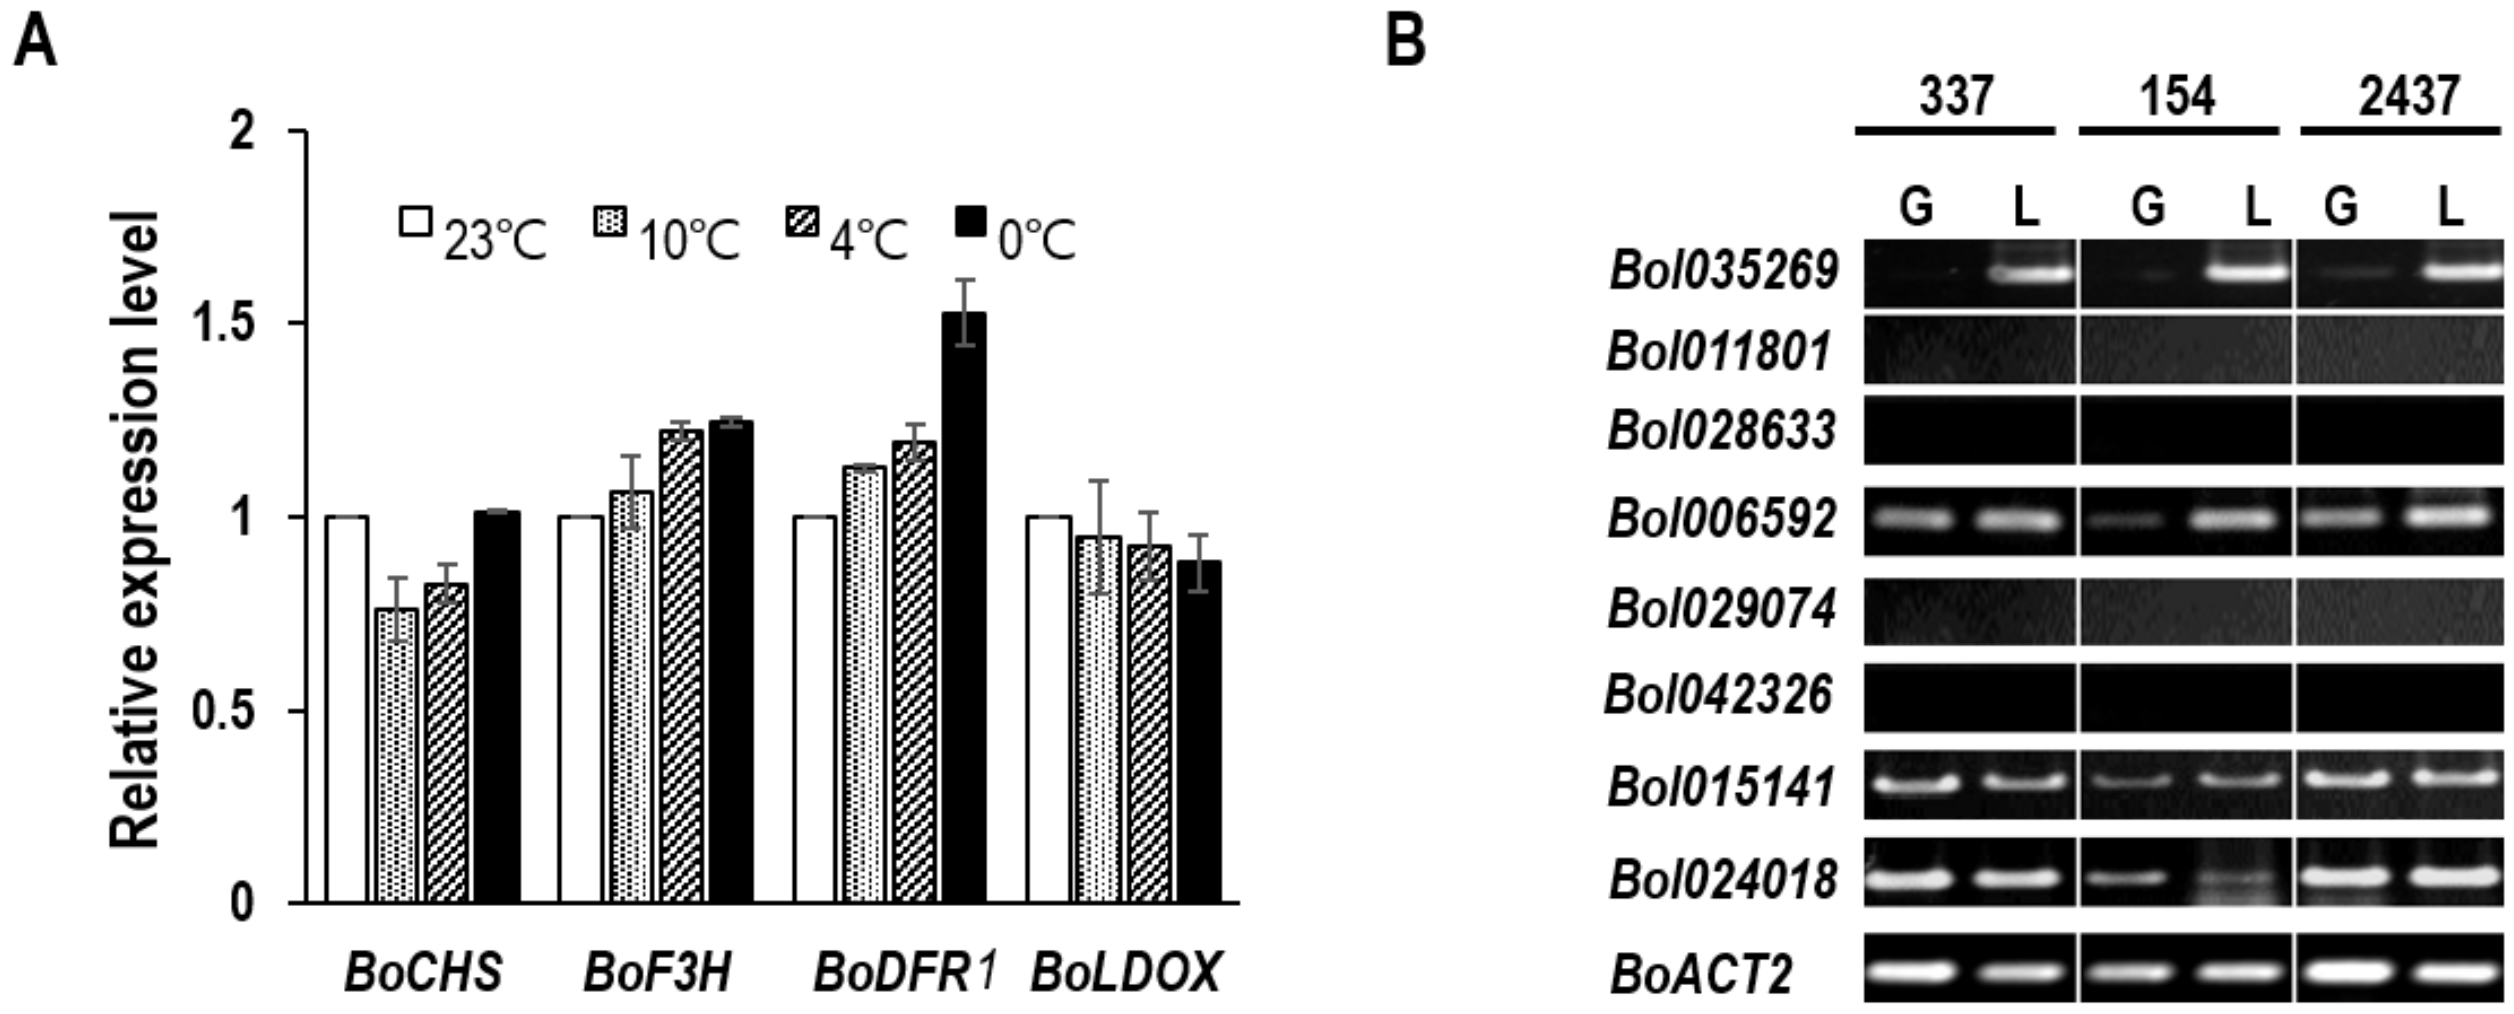
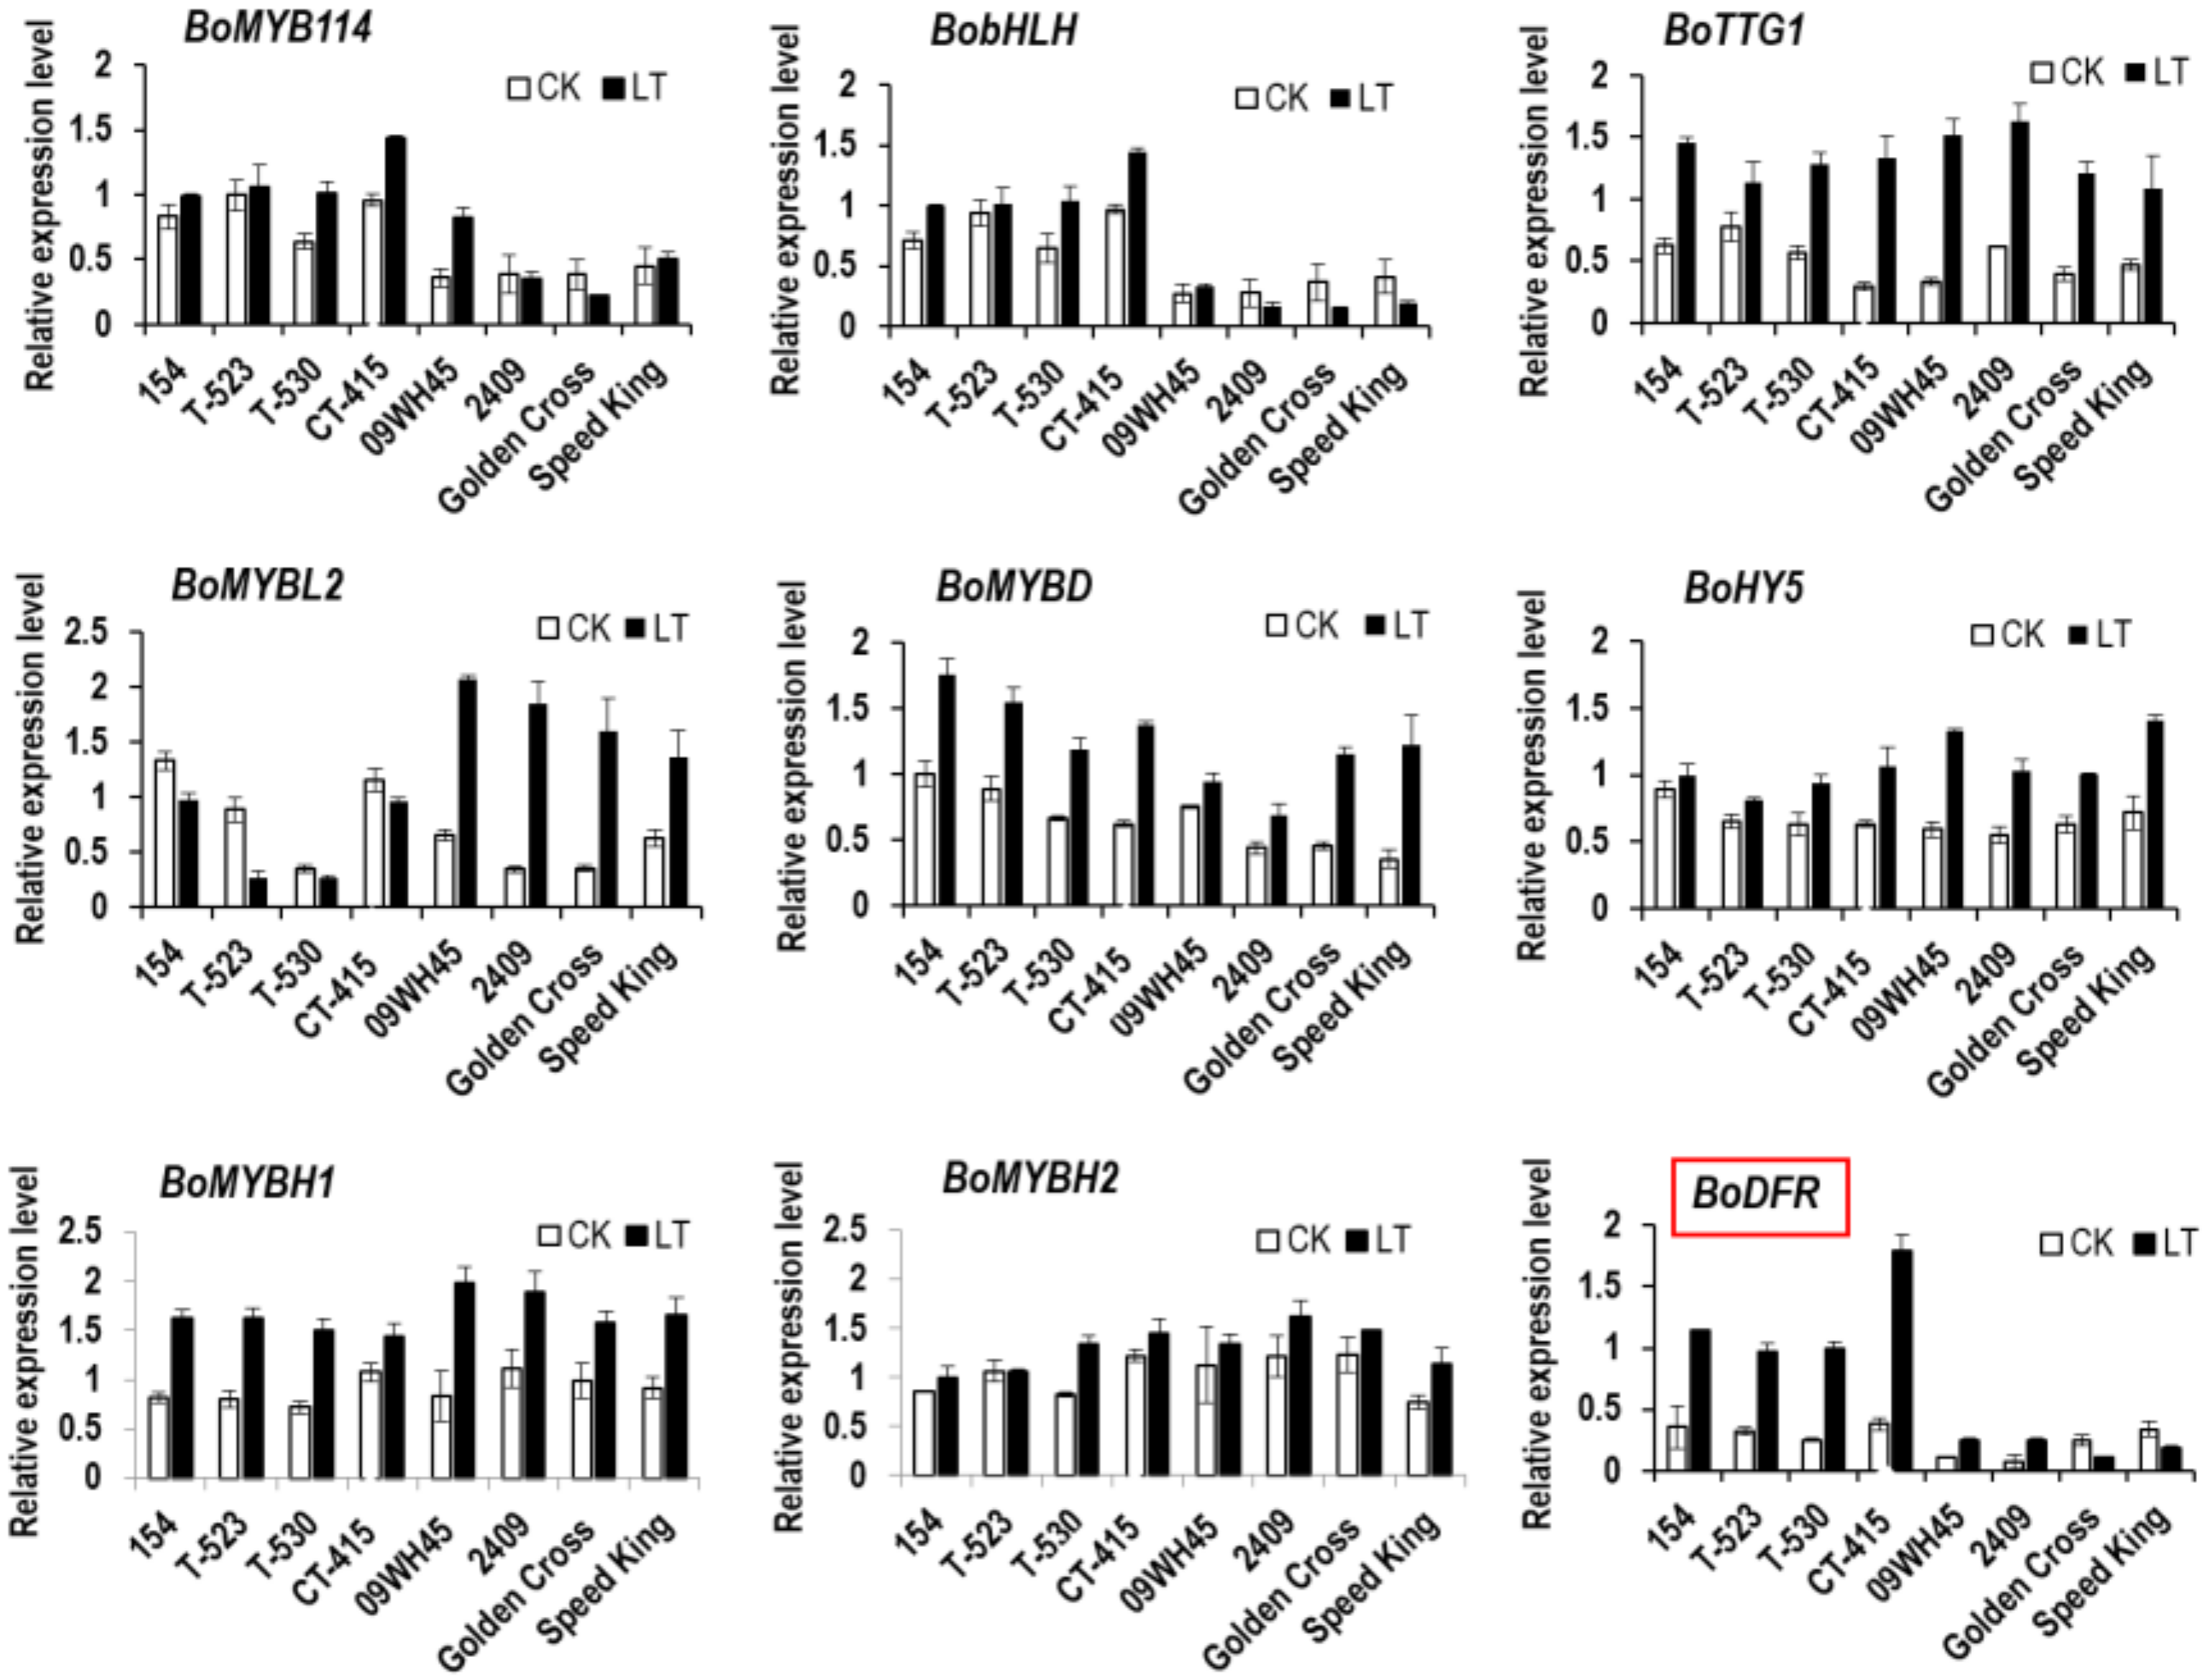
3.4. Relationship between BoDFR1 and Other Anthocyanin Biosynthesis-Related Genes

BoDFR1 showed allele-dependent expression (Figure 4), and anthocyanin content was proportional to the expression level of BoDFR1 under LT treatment. However, the sequence of the promoter, which controls gene expression levels, was highly similar among HAAs (337, 154, 2437, T-523, T-530, and CT-415) and LAAs (09WH45, 842, 2409, Golden Cross, and Speed King) (Figure 5, Figure S1). Additionally, both BoDFR1 and BoDFR1v showed the same substrate specificity and enzyme activity (Figure 6). These results led us to hypothesize that the function of upstream regulatory gene(s) is associated with the DFR1 expression level. To test this hypothesis, we examined the expression levels of anthocyanin biosynthetic genes (encoding structural and regulatory proteins) under normal and LT conditions in the same samples as those used in Figure 4, and BoDFR1 expression data served as a reference (Figure 7, Figure 8). The expression of EBGs, BoCHS and BoF3H, was similar between HAAs and LAAs; however, the expression of LBGs, BoLDOX and BoDFR1, was lower in LAAs than in HAAs (Figure 7). This similar expression pattern of BoLDOX and BoDFR1 may reflect that BoLDOX levels were dependent to DFR activity in directly.
We also examined the expression of anthocyanin biosynthesis regulatory genes (Figure 8). Expression of BoHY5 and BoMYBH1 (a homolog of MYBD) was slightly increased by LT, but no significant difference was detected between HAAs and LAAs. The expression of BoMYBH2 showed no significant differences between HAAs and LAAs or between normal and LT conditions. However, the expression of genes comprising the MBW complex, BoMYB114 (representative MYB in cabbage), BobHLH, and BoTTG1 (WD-repeat gene), seemed to provide some clues about the expression of BoDFR1. Expression levels of BoMYB114 and BobHLH were higher in HAAs than LAAs, regardless of the temperature (normal vs. LT). However, the expression of the genes did not show a significant increase upon exposure to LT; instead, the expression of BobHLH in LAAs was decreased by LT treatment. Although the expression of BoTTG1 showed no significant difference between HAAs and LAAs, it increased significantly upon LT treatment. These results reveal a novel phenomenon in cabbage, which explains why LAAs exhibit low anthocyanin content and low BoDFR1v expression under LT condition. Moreover, expression of the repressor of MBW complex, BoMYBL2, was low in HAAs and greatly increased in LAAs in response to LT. The expression of BoMYBL2 might be negatively associated with BoMYBD expression suggested by a previous study [81]. Thus, the expression pattern of BoMYBL2 may also contribute to BoDFR1 expression and anthocyanin accumulation in cabbage.
In Arabidopsis, anthocyanin accumulation is associated with freezing tolerance, and freezing tolerant accessions show higher DFR expression levels than freezing sensitive accessions [8,9,82]. In apple, a MYB transcription factor binds to both the CBF and the DFR promoters, thereby activating their expression [13]. However, cabbage genotypes (HAAs and LAAs) used in this study seemed to be freezing tolerant, as some of them survived the Korean winter (data not shown). Therefore, any association of BoDFR1 or BoDFR1v expression with cold tolerance (or anthocyanin accumulation and cold tolerance) must be elusive. In cabbage genotypes used in this study, all four CBF genes were upregulated upon LT treatment with no difference in expression between HAAs and LAAs (Figure 9). This suggests that anthocyanin accumulation is not related to cold tolerance at least in the genotypes used in this study.

3.5. Development of a Molecular Marker to Distinguish between BoDFR1 and BoDFR1v

We designed PCR primers to distinguish between BoDFR1 and BoDFR1v based on cytosine (C)/adenine (A), cytosine (C)/thymine (T), and thymine (T)/adenine (A) SNPs at nucleotide positions 423, 628, and 1118, respectively (Figure 5, Table 2). First, PCR was performed using these primers and genomic DNA extracted from six inbred lines provided by Asian Seed Co. (Figure 10A) and eight inbred lines and cultivars selected in Figure 3 for further analysis (Figure 10A,C, Table 2). All primer pairs could discriminate the six inbred lines based on the three SNPs (Figure 10A), but only the primer pair specific to the T/A SNP at position 1118 correctly discriminated among the eight inbred lines and cultivars (Figure 10C). Cabbage cultivars T-523, T-530, and CT-415 were heterozygous for SNPs at nucleotide positions 423 and 628 (Figure S1, Figure 5). Then, based on these PCR results, we designed HRM primers targeting the T/A SNP at nucleotide position 1,118. The results showed that this SNP distinguished between BoDFR1 and BoDFR1v (Figure 10B,D). Therefore, we conclude that the T/A SNP could be used to discriminate between HAAs and LAAs under LT conditions.
To validate this marker, we used the HRM primer set to genotype 120 cabbage inbred lines and cultivars (Figure 11A,B). Among these 120 samples, 70 (58%) were homozygous for the TT allele (HAA homozygote), 32 (27%) were homozygous for the AA allele (LAA homozygote), and 18 (15%) were heterozygous (TA allele). Interestingly, all Chinese cultivars tested in this study carried the AA type (BoDFR1v) (Table S1). Some of the heterozygotes were confirmed by sequencing (Figure S2), and association of the T/A SNP with anthocyanin accumulation was confirmed by examining the level of anthocyanins and BoDFR1 expression (Figure 11C,D). The phenotype of heterozygotes (T/A allele) resembled that of HAA homozygotes (TT allele), indicating dominance of the T allele (HAA genotype was TT or TA). These results indicate that the HRM primer pair developed in this study is useful for distinguishing between BoDFR1 and BoDFR1v genotypes. Notably, HAAs were more abundant than LAAs or heterozygotes, and BoDFR1 was dominant to the BoDFR1v allele.
We also investigated the association between anthocyanin accumulation and BoDFR1 SNP in B. oleracea, Chinese cabbage, and mustard genotypes, which showed high anthocyanin accumulation and very low accumulation. As shown in Figure S3, the BoDFR1v allele was found in cabbage and ornamental kale (B. oleracea var. acephala) but not in cauliflower (B. oleracea var. botrytis), kohlrabi, Chinese cabbage, and mustard. Interestingly, F1 cultivars of ornamental or flower kale including M23 (Benitaka-red) and M24 (Shirotaka-white) were heterozygous and homozygous for the BoDFR1v allele, respectively. Recently, Guo et al. (2019) [83] reported that BoDFR1 expression is associated with anthocyanin accumulation under LT, but the authors did not discuss allele-dependent expression. Overall, we conclude that genotypes heterozygous at the 1,118 SNP show HAA phenotype.

4. Discussion

Anthocyanin accumulation in plants is closely related to abiotic stress tolerance, particularly LT tolerance, in plants and is proportional to DFR gene expression. Despite the positive effects of anthocyanins on human health, one of the breeding objectives of green cabbage is to maintain the deep green color of leaves at harvest, regardless of the season, especially under LT conditions. In this study, we investigated cabbage cultivars and inbred lines that show low anthocyanin accumulation under LT but retain their LT tolerance. Our results showed that BoDFR1 expression is related to anthocyanin accumulation in cabbage. Analysis of the BoDFR1 gene in contrasting cabbage genotypes (HAAs vs. LAAs) revealed that an SNP at nucleotide position 1118 in 1580 bp BoDFR1 genomic DNA is closely related to its expression levels. We used this SNP to develop a PCR-based marker as well as HRM marker for the identification of HAAs and LAAs under LT conditions.

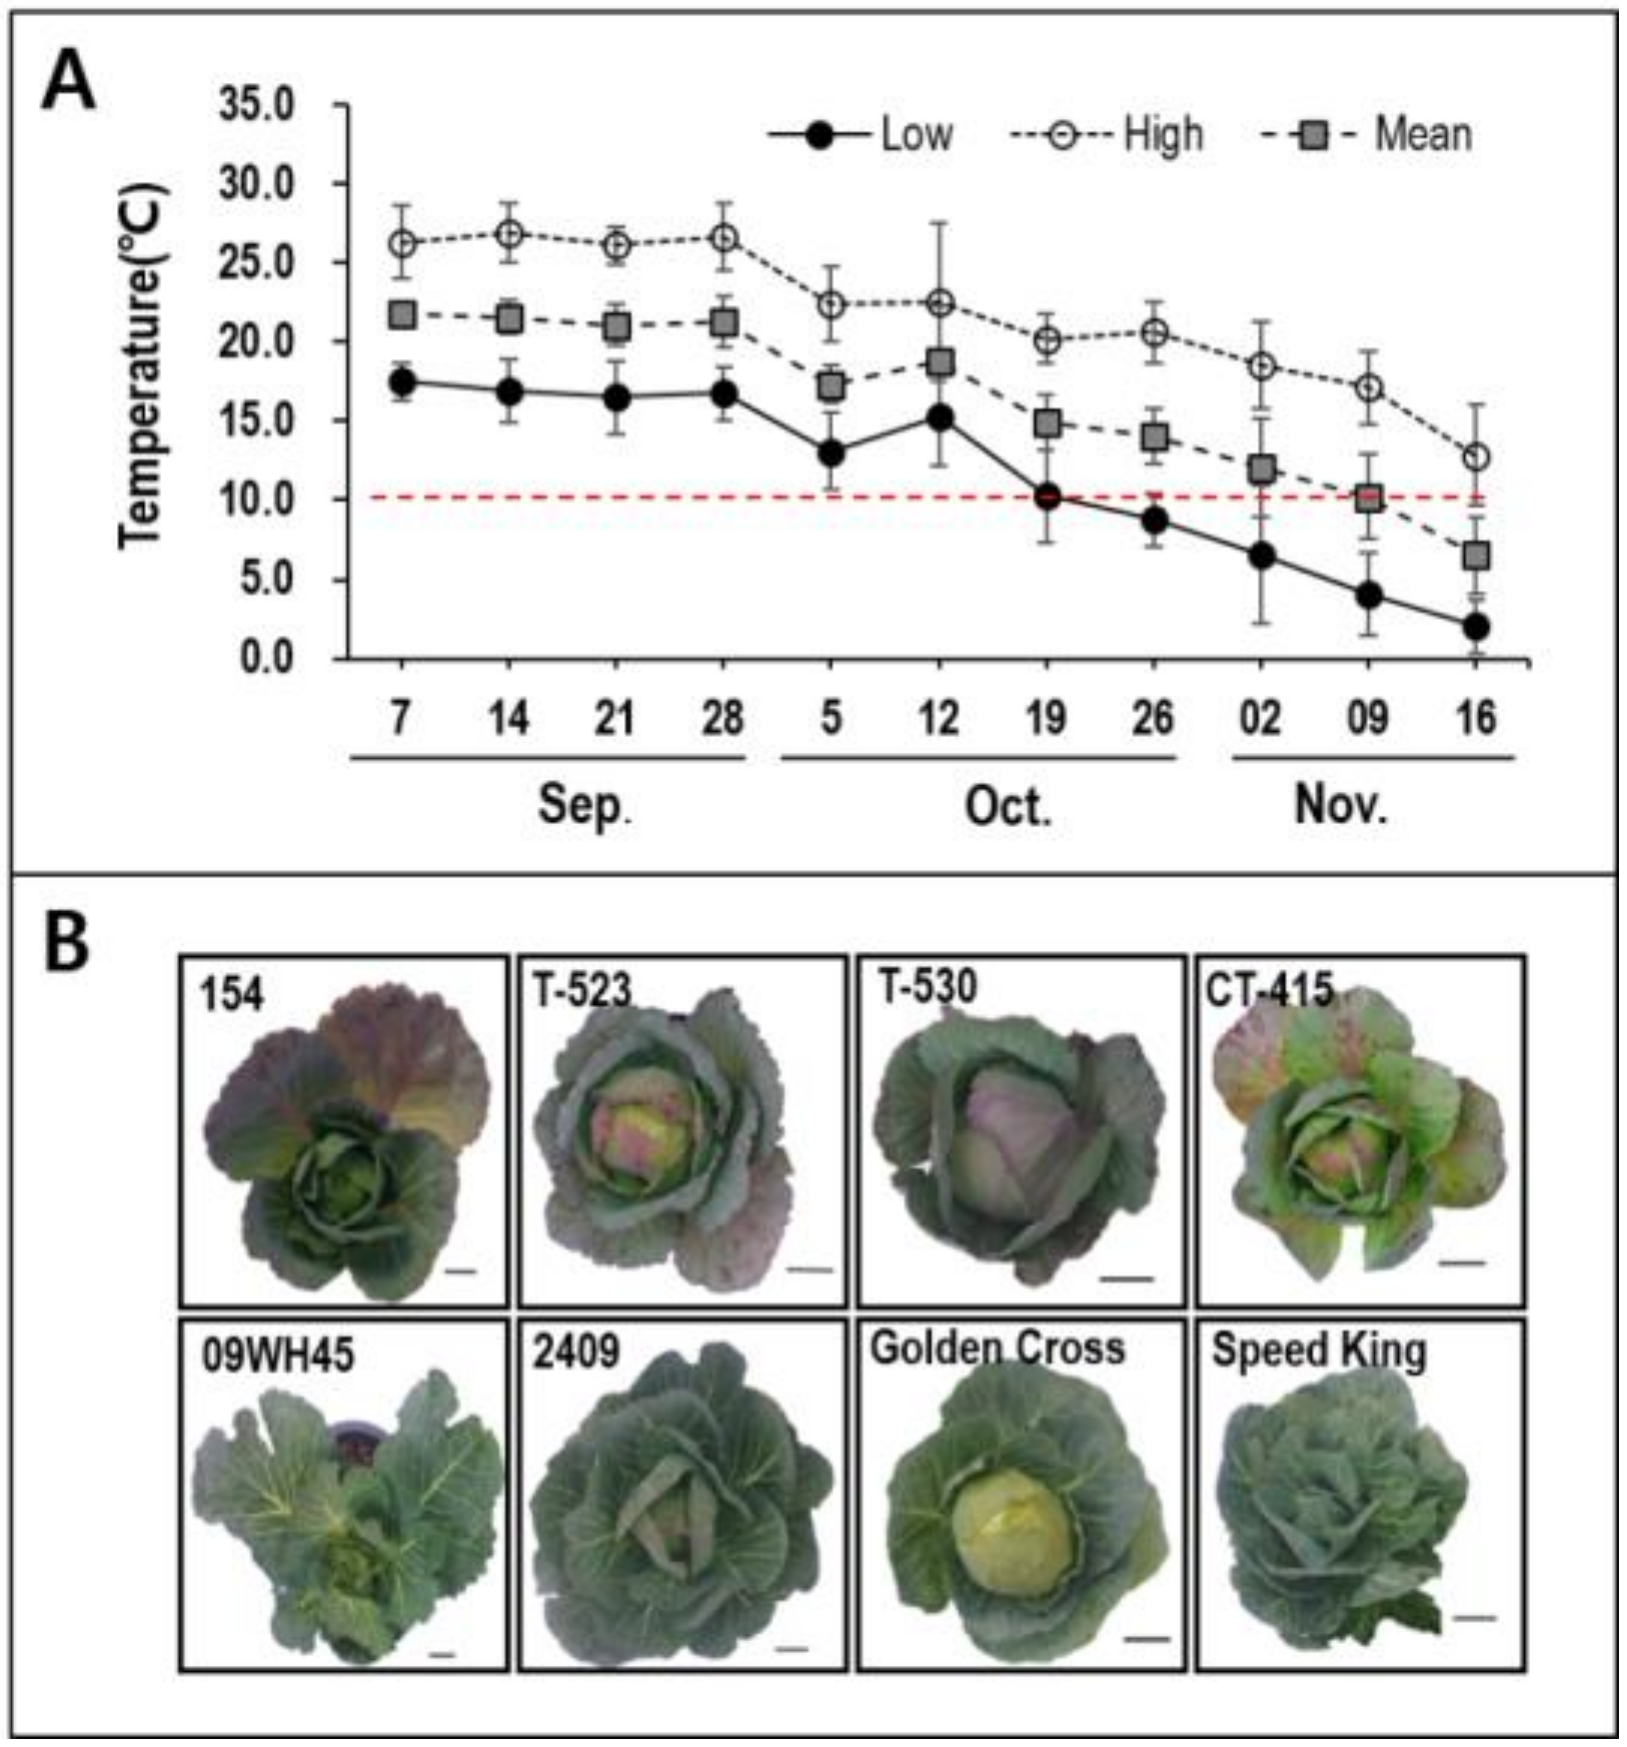
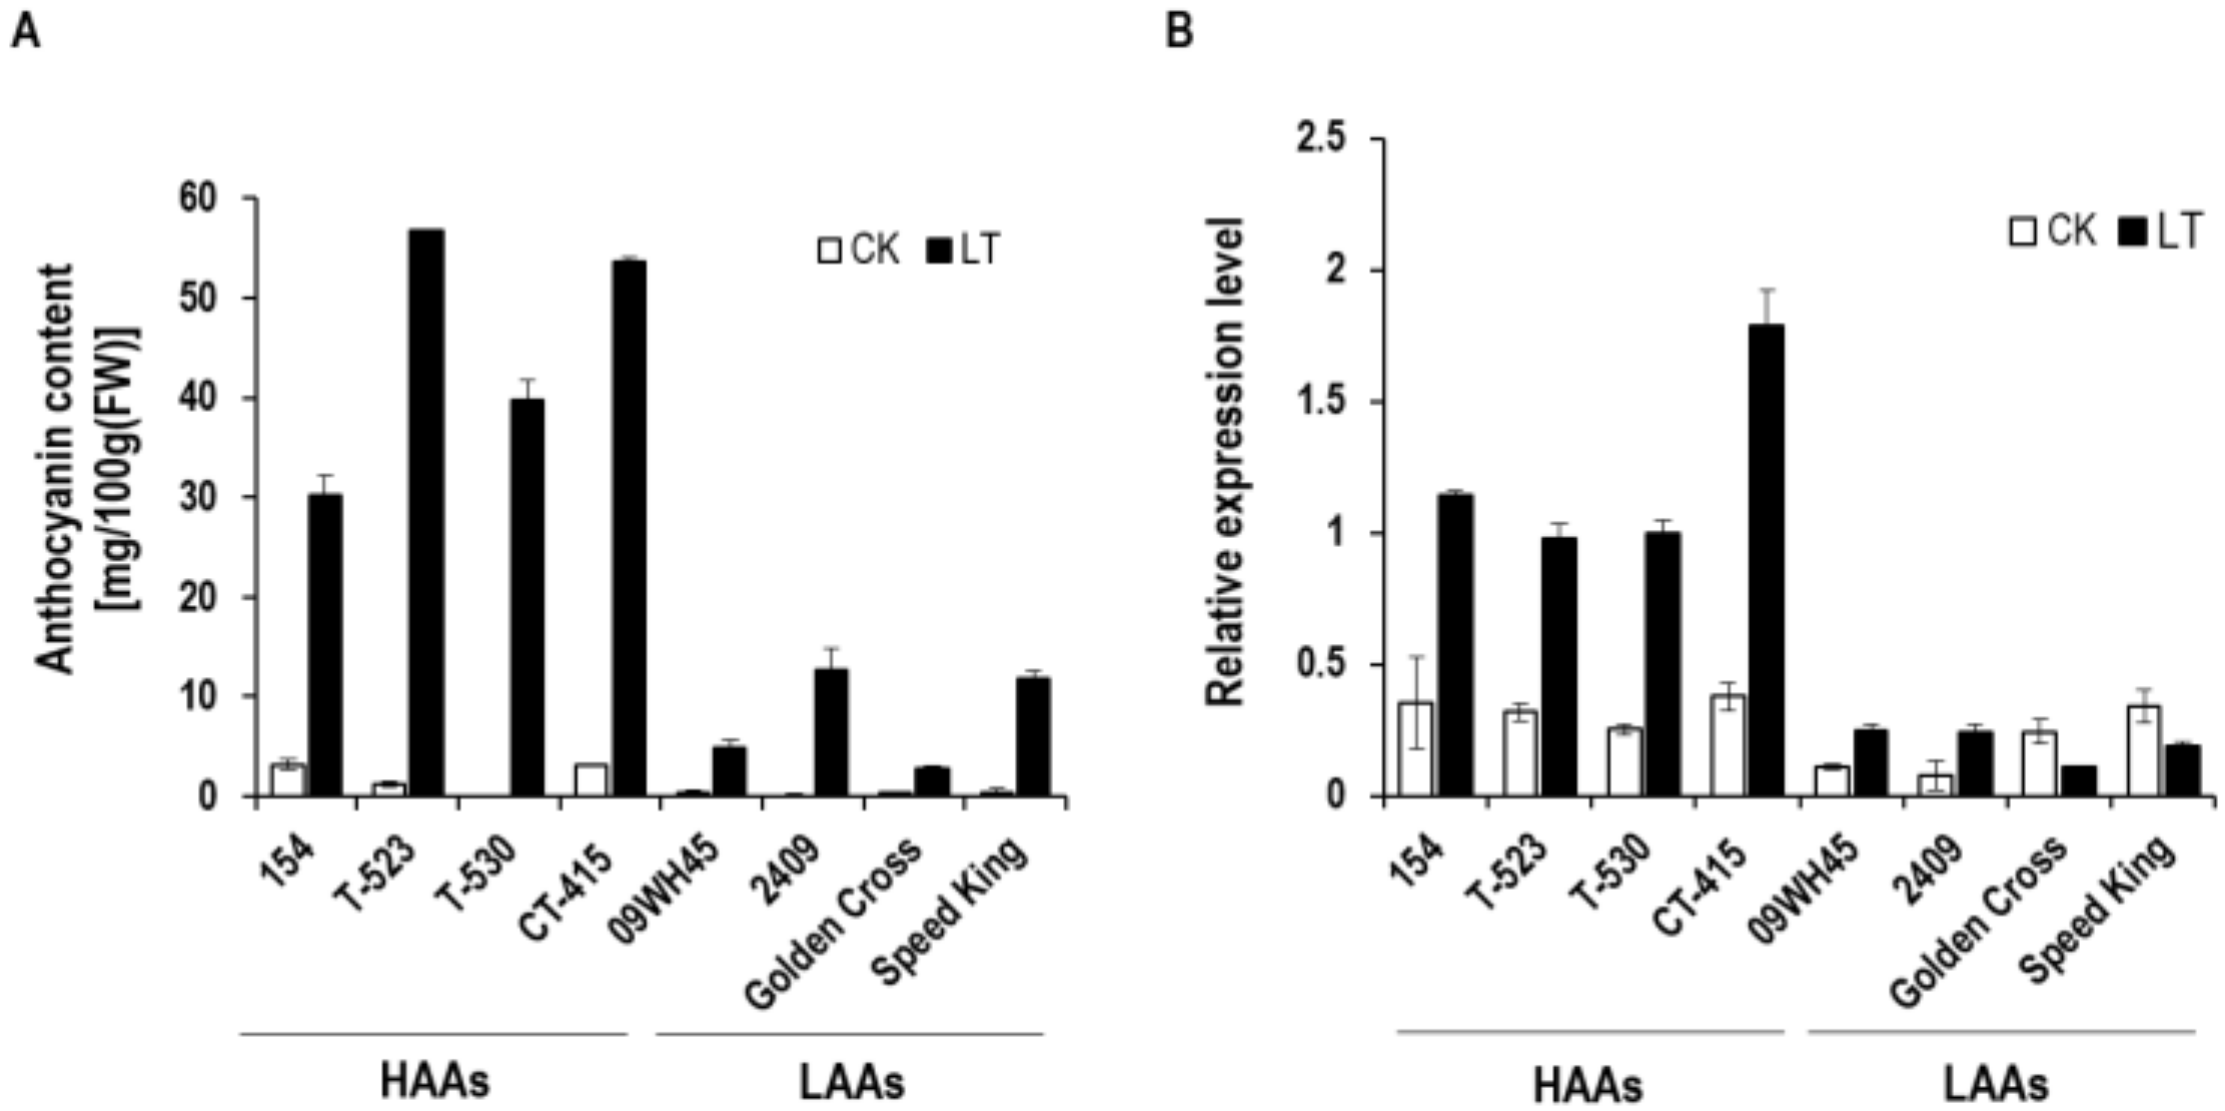
4.1. Selection of HAA and LAA Lines

Analysis of six inbred lines (three HAAs and three LAAs) and five cultivars (three HAAs and two LAAs) of cabbage revealed that BoDFR1 expression was associated with anthocyanin accumulation under LT conditions (Figure 1, Figure 2, Figure 3, Figure 4). This association study was performed using plants grown either in an environmentally controlled growth chamber or in the field, where light intensities vary from 140 to 1300 μmol m−2 s–1. Since light intensity influences anthocyanin biosynthesis [84], we examined gene expression under both conditions. Previous reports imply that the DFR gene is a good candidate for anthocyanin accumulation. The BoPr gene, which confers purple leaf color in ornamental kale (Brassica oleracea L. var. acephala), has been mapped and identified as Bo9g058630 (orthologous to Bol035269 in cabbage) and shows high homology to the gene encoding dihydroflavonol reductase in Arabidopsis (AT5G42800) [85]. In crabapple (Malus crabapple) leaves and apple peels, upregulation of McDFR or MdDFR expression, respectively, is accompanied by a proportional increase in the expression of other genes involved in anthocyanin biosynthesis [45]. This result and our data together imply that the BoDFR gene is a good candidate for the investigation of anthocyanin accumulation in cabbage.

4.2. BoDFR1 Sequence Analysis and SNP Detection

The genomic sequence of BoDFR1 was analyzed in 13 cabbage genotypes including six HAAs, five LAAs, and two red (or purple) cabbage cultivars (Table 1). However, sequences of BoDFR1 from two red cabbage cultivars were excluded from the alignment shown in Figure S1. The genomic DNA of BoDFR1 analyzed in this study comprised the promoter region (1380 bp upstream of the ATG start codon) and the 1580 bp genomic DNA from ATG to TAG stop codon, which includes six exons and five introns (Figure 5). Sequences of BoDFR1 in 13 cabbage genotypes were highly similar. Only three SNPs were identified in the 1580 bp genomic DNA. Among these, only the T/A SNP at the 1118 nt was predicted to cause an amino acid substitution (Leu to His), and this SNP could be used to discriminate between HAA-type DFR1 (BoDFR1) and LAA-type DFR1 (BoDFR1v).
In the promoter region, the number and the distribution of cis-acting elements, such as MYB1AT, MYB-core (or MYBS1), and E/G-BX, were highly similar between HAAs and LAAs (Figure 5); only MYBST1 was found in reverse orientation at -581 bp in BoDFR1 promoter compared with BoDFR1v promoter. HY5-induced MYBD binds to MYBST1 and the MYB-binding motif (A/TAACCA) in the promoter of the repressor MYBL2, resulting in the inhibition of MYBL2 expression [81]. Thus, the presence of the MYBST1 motif in the BoDFR1 promoter affects gene expression. However, the MYBST1 motif was not detected in the BoDFR1 gene isolated from purple (or red) cabbage, which is highly rich in anthocyanins. Moreover, the expression pattern of BoMYBD was not similar to BoMYBL2 expression (Figure 8). These data suggest the possibility that the MYBST1 motif found in the BoDFR1 promoter does not affect the difference in anthocyanin levels between HAAs and LAAs.
A mutation in DFR promoter in onion [61] and two insertion/deletion mutations (InDels) in DFR CDS in kale [85] is associated with anthocyanin accumulation. Rearrangement of a 23 bp sequence in the promoter regions of MdMYB10 and McMYB10 is responsible for the difference in gene expression between white- and red-fleshed apples and red-leaf crabapples [86]. The bHLH transcriptional regulator binds to the CANNTG site (E/G-BX) present in the DFR promoter [50]. Additionally, a MYB transcription factor recognizes the MYBS1, thus regulating the expression of DFR [87]. Together, these data suggest that differential expression of the DFR allele results from differences in promoter sequences or cis-acting sequences. However, promoter sequences of BoDFR1 and BoDFR1v were highly similar, implying that differential expression of BoDFR1 between HAAs and LAAs probably resulted from differences in upstream regulatory proteins.

4.3. Regulation of BoDFR1 Expression

DFR regulates the essential step of anthocyanin biosynthesis and possesses a preference for a precursor of the three different types of anthocyanins [35,36]. However, BoDFR1 and BoDFR1v, which differed by one amino acid substitution, showed identical enzyme activity and substrate specificity (Figure 6) because the substituted amino acid was distant from the active site of DFR [79]. This suggested that the difference in anthocyanin accumulation between HAAs and LAAs could be associated with the difference in BoDFR1 expression levels. However, no significant differences were detected in the promoter and the intron sequences between HAAs and LAAs (Figure S1), which could control gene expression, suggesting the possibility that upstream regulatory transcription factors are involved in the regulation of BoDFR1 expression.
Data shown in Figure 8 provided hints as to why LAAs accumulate less anthocyanins than HAAs under LT conditions. The expression of BoTTG1 increased upon exposure to LT, but that of BoMYB114 and BobHLH did not, especially in LAAs. Instead, BoMYB114 and BobHLH expression levels were high in HAAs. These expression patterns represent a novel characteristic of cabbage plants because the expression of MYB and bHLH genes increases in purple kale in response to LT, whereas that of TT1 shows no change [33]. Similar results have been reported in Arabidopsis [88]. This difference in gene expression levels might explain why prolonged LT treatment (lasting at least one month) is required for increasing anthocyanin accumulation or inducing DFR expression in cabbage (data not shown). In addition, the expression of BoMYBL2 (a repressor) might also affect the formation of the MBW complex. BoMYBL2 expression was low in LAAs but greatly increased upon LT treatment (Figure 8). The expression of BoMYBL2 might be slightly repressed by HY5-dependent MYBD (BoMYBD), as mentioned above [81], although this would not be critical. Taken together, these data suggest that the level of WD-repeat proteins would be sufficient in all cabbage types under LT, but the levels of BoMYB114 and BobHLH were high in HAAs and low in LAAs, regardless of the temperature. The level of BoMYBL2 increased in LAAs upon LT exposure, resulting in the inhibition of MBW complex formation. The MBW complex regulates the expression of LBGs, including DFR, at the transcriptional level [28,89,90]. Moreover, the MBW complex regulates bHLH (TT8) expression in a positive feedback loop, which ensures high level accumulation of proanthocyanins [91]. Our results suggest that formation of the MBW complex, which induced BoDFR1 expression, would be greatly reduced in LAAs but unaffected in HAAs, leading to differential anthocyanin accumulation. However, how the BoDFR1 SNP is associated with the expression of upstream regulatory components remains elusive.
CBF transcription factors play a key role in the cold acclimation of plants by regulating the expression of cold-regulated (COR) genes [92,93]. High level of DFR expression is associated with high anthocyanin accumulation, which confers cold (or freezing) tolerance in Arabidopsis [8,9,82], Chinese cabbage [49], tobacco (Nicotiana tabacum) [12], and purple kale [33,83]. In apple, a MYB transcription factor regulates both cold tolerance and anthocyanin accumulation by binding to the promoters of CBF and DFR genes, thus activating their expression [13]. However, four LAAs used in this study were freezing tolerant (data not shown). Additionally, we did not observe differences in the induction of BoCBFs between HAAs and LAAs under LT treatment (Figure 9), indicating that the mechanisms of anthocyanin accumulation and cold tolerance in cabbage were independent.

4.4. Molecular Marker Development and Application

In cabbage breeding programs, one of the desired horticultural traits is the green color of leaves at the harvest time, regardless of the season. To maintain green leaf color, anthocyanin accumulation should be repressed, which can be achieved by inhibiting BoDFR1 expression. Fortunately, cabbage genotypes harboring the BoDFR1v allele accumulate anthocyanins to a very low level not only under normal conditions but also under LT. The BoDFR1v allele harbors an A at nucleotide position 1118, whereas the BoDFR1 allele harbors a T. This SNP has also been detected in ornamental kale genotypes, M23 (Benitaka–red) and M24 (Shirotaka–white), which are heterozygous and homozygous for BoDFR1v, respectively (Figure S3). Based on this T/A SNP, we developed and validated a PCR-based and an HRM marker, which perfectly discriminated between LAAs and HAAs (Figure 10, Figure 11). Although we could not explain why LAAs express BoDFR1v at low levels while maintaining cold tolerance, both PCR-based and HRM markers will be very useful for cabbage breeding.

5. Conclusions

Cabbage and some ornamental kale genotypes carried the BoDFR1v allele, which contains a single amino acid substitution (Leu to His) due to a single nucleotide change (T to A). However, both BoDFR1v and BoDFR1 showed identical enzyme activity and substrate specificity. BoDFR1v homozygotes exhibited green leaf color, regardless of the temperature, and a very low level of BoDFR1 expression. Using the T/A SNP identified between BoDFR1 and BoDFR1v, molecular markers were developed and validated to distinguish between HAAs and LAAs. Further investigation is needed to identify upstream elements or key regulators that control the expression of anthocyanin-related genes in LAAs, which could be further utilized in cabbage breeding programs.

Supplementary Materials

The following are available online at https://0-www-mdpi-com.brum.beds.ac.uk/2073-4395/10/4/602/s1. Figure S1: Nucleotide sequence alignment of BoDFR1 promoter and genomic DNA from ATG to TGA isolated from 11 cabbage genotypes, Figure S2: Validation of the T/A SNP at nucleotide position 1,118 in BoDFR1 genomic DNA, Figure S3: Genotyping various B. oleracea, B. rapa, B. nuapus and B. juncea accessions using the 1118T/A SNP marker, Table S1: List of cabbage genotypes used in HRM analysis, Table S2: List of primers used for expression analysis and cloning of BoDFR genes, Table S3: List of primers used for qRT-PCR experiments, Table S4: Putative BoDRF genes identified in B. oleracea using B. rapa DFR (BrDFR) genes [49].

Author Contributions

Conceptualization: H.S.; J.-I.P. and Y.H. Methodology: H.S.; J.-I.P.; B.-H.H.; H.Y. and H.K. Software: H.Y. and H.K. Validation: H.S.; J.-I.P.; B.-H.H. and Y.H. Formal analysis: H.S.; J.-I.P. and H.Y. Investigation: H.S.; J.-I.P. and H.Y. Data curation: H.S.; J.-I.P. and H.K. Writing-original draft: H.S.; J.-I.P. and Y.H. Writing-review & editing: H.Y.; H.K. and Y.H. Supervision: Y.H. Funding acquisition: Y.H. All authors have read and agreed to the published version of the manuscript.

Funding

This research was funded by a grant from the Technology Development Program for Agriculture and Forestry, Ministry for Food, Agriculture, Forestry, and Fisheries (Grant 213007-05-4-SB620), Republic of Korea.

Conflicts of Interest

The authors declare that they have no competing interests. The funders had no role in the design of the study; in the collection, analyses, or interpretation of data; in the writing of the manuscript, or in the decision to publish the results.

References

  1. Winkel-Shirley, B. Flavonoid biosynthesis. A colorful model for genetics, biochemistry, cell biology, and biotechnology. Plant Physiol. 2001, 126, 485–493. [Google Scholar] [CrossRef] [Green Version]
  2. Bradshaw, H.D.; Schemske, D.W. Allele substitution at a flower colour locus produces a pollinator shift in monkeyflowers. Nature 2003, 426, 176–178. [Google Scholar] [CrossRef]
  3. Koes, R.; Verweij, W.; Quattrocchio, F. Flavonoids: A colorful model for the regulation and evolution of biochemical pathways. Trends Plant Sci. 2005, 10, 236–242. [Google Scholar] [CrossRef] [PubMed]
  4. Mouradov, A.; Spangenberg, G. Flavonoids: A metabolic network mediating plants adaptation to their real estate. Front. Plant Sci. 2014, 5, 620. [Google Scholar] [CrossRef]
  5. Lorenc-Kukuła, K.; Jafra, S.; Oszmiański, J.; Szopa, J. Ectopic expression of anthocyanin 5-O-glucosyltransferase in potato tuber causes increased resistance to bacteria. J. Agric. Food Chem. 2005, 53, 272–281. [Google Scholar] [CrossRef] [PubMed]
  6. Castellarin, S.D.; Gaspero, G.D. Transcriptional control of anthocyanin biosynthetic genes in extreme A colorful model for genetics, biochemistry, cell biology, and biotechnology. Plant Physiol. phenotypes for berry pigmentation of naturally occurring grapevines. BMC Plant Biol. 2007, 7, 46. [Google Scholar] [CrossRef] [Green Version]
  7. Buer, C.S.; Imin, N.; Djordjevic, M.A. Flavonoids: New roles for old molecules. J. Integr. Plant Biol. 2010, 52, 98–111. [Google Scholar] [CrossRef] [PubMed]
  8. Schulz, E.; Tohge, T.; Zuther, E.; Fernie, A.R.; Hincha, D.K. Natural variation in flavonol and anthocyanin metabolism during cold acclimation in Arabidopsis thaliana accessions. Plant Cell Environ. 2015, 38, 1658–1672. [Google Scholar] [CrossRef] [PubMed]
  9. Schulz, E.; Tohge, T.; Zuther, E.; Fernie, A.R.; Hincha, D.K. Flavonoids are determinants of freezing tolerance and cold acclimation in Arabidopsis thaliana. Sci. Rep. 2016, 6, 34027. [Google Scholar] [CrossRef]
  10. Wu, Q.; Su, N.; Zhang, X.; Liu, Y.; Cui, J.; Liang, Y. Hydrogen peroxide, nitric oxide and UV RESISTANCE LOCUS8 interact to mediate UV-B-induced anthocyanin biosynthesis in radish sprouts. Sci. Rep. 2016, 6, 29164. [Google Scholar] [CrossRef]
  11. Naing, A.H.; Park, K.I.; Ai, T.N.; Chung, M.Y.; Han, J.S.; Kang, Y.-W.; Lim, K.-B.; Kil Kim, C. Overexpression of snapdragon Delila (Del) gene in tobacco enhances anthocyanin accumulation and abiotic stress tolerance. BMC Plant Biol. 2017, 17, 65. [Google Scholar] [CrossRef] [Green Version]
  12. Naing, A.H.; Ai, T.N.; Lim, K.B.; Lee, I.J.; Kim, C.K. Overexpression of Rosea1 from snapdragon enhances anthocyanin accumulation and abiotic stress tolerance in transgenic tobacco. Front. Plant Sci. 2018, 9, 1070. [Google Scholar] [CrossRef]
  13. An, J.P.; Wang, X.F.; Zhang, X.W.; Xu, H.F.; Bi, S.Q.; Hao, Y.-J.; Hao, Y.-J. An apple MYB transcription factor regulates cold tolerance and anthocyanin accumulation and undergoes MIEL1-mediated degradation. Plant Biotechnol. J. 2019, 18, 337–353. [Google Scholar] [CrossRef] [Green Version]
  14. He, J.; Giusti, M.M. Anthocyanins: Natural colorants with health-promoting properties. Annu. Rev. Food Sci. Technol. 2010, 1, 163–187. [Google Scholar] [CrossRef] [PubMed]
  15. Bártiková, H.; Skálová, L.; Dršata, J.; Boušová, I. Interaction of anthocyanin with drug-metabolizing and antioxidant enzymes. Curr. Med. Chem. 2013, 20, 4665–4679. [Google Scholar] [CrossRef] [PubMed]
  16. Wang, Y.; Zhao, L.; Wang, D.; Huo, Y.; Ji, B. Anthocyanin-rich extracts from blackberry, wild blueberry, strawberry, and chokeberry: Antioxidant activity and inhibitory effect on oleic acid-induced hepatic steatosis in vitro. J. Sci. Food Agric. 2016, 96, 2494–2503. [Google Scholar] [CrossRef] [PubMed]
  17. Li, X.; Ma, H.; Huang, H.; Li, D.; Yao, S. Natural anthocyanins from phytoresources and their chemical researches. Nat. Prod. Res. 2013, 27, 456–469. [Google Scholar] [CrossRef]
  18. Li, D.; Zhang, Y.; Liu, Y.; Sun, R.; Xia, M. Purified anthocyanin supplementation reduces dyslipidemia, enhances antioxidant capacity, and prevents insulin resistance in diabetic patients. J. Nutr. 2015, 145, 742–748. [Google Scholar] [CrossRef]
  19. Fang, J. Bioavailability of anthocyanins. Drug Metab. Rev. 2014, 46, 508–520. [Google Scholar] [CrossRef]
  20. Cerlettim, C.; de Curtis, A.; Bracone, F.; Digesù, C.; Morganti, A.G.; Iacoviello, L.; De Gaetano, G.; Donati, M. Dietary anthocyanins and health: Data from FLORA and ATHENA EU projects. Br. J. Clin. Pharmacol. 2017, 83, 103–106. [Google Scholar] [CrossRef] [Green Version]
  21. Huang, P.C.; Kuo, W.W.; Shen, C.Y.; Chen, Y.F.; Lin, Y.M.; Ho, T.J.; Padma, V.V.; Lo, J.-F.; Huang, C.-Y. Anthocyanin attenuates doxorubicin-induced cardiomyotoxicity via estrogen receptor-α/β and stabilizes HSF1 to inhibit the IGF-IIR apoptotic pathway. Int. J. Mol. Sci. 2016, 7, 1588. [Google Scholar] [CrossRef] [PubMed] [Green Version]
  22. Lin, B.W.; Gong, C.C.; Song, H.F.; Cui, Y.Y. Effect of anthocyanins on the prevention and treatment of cancer. Br. J. Pharmacol. 2017, 174, 1226–1243. [Google Scholar] [CrossRef] [Green Version]
  23. Smeriglio, A.; Barreca, D.; Bellocco, E.; Trombetta, D. Chemistry, pharmacology and health benefits of anthocyanins. Phytother. Res. 2016, 30, 1265–1286. [Google Scholar] [CrossRef]
  24. Ma, L.; Sun, Z.; Zeng, Y.; Luo, M.; Yang, J. Molecular mechanism and health role of functional ingredients in blueberry for chronic disease in human beings. Int. J. Mol. Sci. 2018, 19, 2785. [Google Scholar] [CrossRef] [Green Version]
  25. Sandoval-Ramírez, B.A.; Catalán, Ú.; Fernández-Castillejo, S.; Rubió, L.; Macià, A.; Solà, R. Anthocyanin tissue bioavailability in animals: Possible implications for human health. A systematic review. J. Agric. Food Chem. 2018, 66, 11531–11543. [Google Scholar] [CrossRef] [Green Version]
  26. Krga, I.; Milenkovic, D. Anthocyanins: From sources and bioavailability to cardiovascular health benefits and molecular mechanisms of action. J. Agr. Food Chem. 2019, 67, 1771–1783. [Google Scholar] [CrossRef]
  27. Wu, Z.G.; Jiang, W.; Mantri, N.; Bao, X.Q.; Chen, S.L.; Tao, Z.M. Transcriptome analysis reveals flavonoid biosynthesis regulation and simple sequence repeats in yam (Dioscorea alata L.) tubers. BMC Genom. 2015, 16, 346. [Google Scholar] [CrossRef] [Green Version]
  28. Dubos, C.; Gourrierec, J.L.; Baudry, A.; Huep, G.; Lanet, E.; Debeaujon, I.; Routaboul, J.-M.; Alboresi, A.; Weisshaar, B.; Lepiniec, L. MYBL2 is a new regulator of flavonoid biosynthesis in Arabidopsis thaliana. Plant J. 2008, 55, 940–953. [Google Scholar] [CrossRef]
  29. Das, P.K.; Shin, D.H.; Choi, S.B.; Park, Y.I. Sugar-hormone cross-talk in anthocyanin biosynthesis. Mol. Cells. 2012, 34, 501–507. [Google Scholar] [CrossRef] [Green Version]
  30. Xu, W.; Dubos, C.; Lepiniec, L. Transcriptional control of flavonoid biosynthesis by MYB-bHLH-WDR complexes. Trend Plant Sci. 2015, 20, 176–185. [Google Scholar] [CrossRef]
  31. Zhang, F.; Gonzalez, A.; Zhao, M.; Payne, C.T.; Lloyd, A. A network of redundant bHLH proteins functions in all TTG1-dependent pathways of Arabidopsis. Development 2003, 130, 4859–4869. [Google Scholar] [CrossRef] [PubMed] [Green Version]
  32. Gonzalez, A.; Zhao, M.; Leavitt, J.M.; Lloyd, A.M. Regulation of the anthocyanin biosynthetic pathway by the TTG1/bHLH/Myb transcriptional complex in Arabidopsis seedlings. Plant J. 2008, 53, 814–827. [Google Scholar] [CrossRef]
  33. Zhang, B.; Hu, Z.; Zhang, Y.; Li, Y.; Zhou, S.; Chen, G. A putative functional MYB transcription factor induced by low temperature regulates anthocyanin biosynthesis in purple kale (Brassica oleracea var. acephala f. tricolor). Plant Cell Rep. 2012, 31, 281–289. [Google Scholar] [CrossRef] [PubMed]
  34. Takahashi, H.; Hayashi, M.; Goto, F.; Sato, S.; Soga, T.; Nishioka, T.; Tomita, M.; Kawai-Yamada, M.; Uchimiya, H. Evaluation of metabolic alteration in transgenic rice overexpressing dihydroflavonol 4-reductase. Ann. Bot. 2006, 98, 819–825. [Google Scholar] [CrossRef] [Green Version]
  35. Xie, D.Y.; Sharma, S.B.; Paiva, N.L.; Ferreira, D.; Dixon, R.A. Role of anthocyanidin reductase, encoded by BANYULS in plant flavonoid biosynthesis. Science 2003, 299, 396–399. [Google Scholar] [CrossRef] [PubMed] [Green Version]
  36. Xie, D.Y.; Jackson, L.A.; Cooper, J.D.; Ferreira, D.; Paiva, N.L. Molecular and biochemical analysis of two cDNA clones encoding dihydroflavonol-4-reductase from Medicago truncatula. Plant Physiol. 2004, 134, 979–994. [Google Scholar] [CrossRef] [PubMed] [Green Version]
  37. Yuan, Y.; Chiu, L.W.; Li, L. Transcriptional regulation of anthocyanin biosynthesis in red cabbage. Planta 2009, 230, 1141–1153. [Google Scholar] [CrossRef]
  38. Chiu, L.W.; Zhou, X.; Burke, S.; Wu, X.; Prior, R.L.; Li, L. The purple cauliflower arises from activation of a MYB transcription factor. Plant Physiol. 2010, 154, 1470–1480. [Google Scholar] [CrossRef] [Green Version]
  39. Chiu, L.W.; Li, L. Characterization of the regulatory network of BoMYB2 in controlling anthocyanin biosynthesis in purple cauliflower. Planta 2012, 236, 1153–1164. [Google Scholar] [CrossRef]
  40. Xie, Q.; Hu, Z.; Zhang, Y.; Taian, S.; Wang, Z.; Zhao, Z.; Yang, Y.; Chen, G. Accumulation and molecular regulation of anthocyanin in purple tumorous stem mustard (Brassica juncea var. tumida Tsen et Lee). J. Agric. Food Chem. 2014, 62, 7813–7821. [Google Scholar] [CrossRef]
  41. Zhang, Y.; Chen, G.; Dong, T.; Pan, Y.; Zhao, Z.; Tian, S.; Hu, Z. Anthocyanin accumualtion and transcriptional regulation of anthocyanin biosynthesis in purple box choy (Brassica rapa var. chinensis). J. Agric. Food Chem. 2014, 62, 12366–12376. [Google Scholar] [CrossRef]
  42. Park, W.T.; Kim, J.K.; Park, S.; Lee, S.W.; Li, X.; Kim, Y.B.; Uddin, M.R.; Park, N.I.; Kim, S.-J.; Park, S.U. Metabolic profiling of glucosinoltes, anthocyanins, carotenoids, and other secondary metabolites in kohlrabi (Brassica oleracea var. gonglylodes). J. Agric. Food Chem. 2012, 6, 8111–8116. [Google Scholar] [CrossRef] [PubMed]
  43. Zhang, Y.; Hu, Z.; Zhu, M.; Zhu, Z.; Wang, Z.; Tian, S.; Chen, G. Anthocyanin accumulation and molecular analysis of correlated genes in purple kohlrabi (Brassica oleracea var. gongylodes L.). J. Agric. Food Chem. 2015, 63, 4160–4169. [Google Scholar] [CrossRef] [PubMed]
  44. Zhang, Y.Z.; Xu, S.Z.; Cheng, Y.W.; Ya, H.Y.; Han, J.M. Transcriptome analysis and anthocyanin-related genes in red leaf lettuce. Genet. Mol. Res. 2016, 29, 15. [Google Scholar] [CrossRef] [PubMed]
  45. Tian, J.; Han, Z.Y.; Zhang, J.; Hu, Y.; Song, T.; Yao, Y. The balance of expression of dihydroflavonol 4-reductase and flavonol synthase regulates flavonoid biosynthesis and red foliage coloration in crabapples. Sci. Rep. 2015, 5, 12228. [Google Scholar] [CrossRef] [PubMed]
  46. Zhang, Y.; Zheng, S.; Liu, Z.; Wang, L.; Bi, Y. Both HY5 and HYH are necessary regulators for low temperature-induced anthocyanin accumulation in Arabidopsis seedlings. J. Plant Physiol. 2011, 168, 367–374. [Google Scholar] [CrossRef] [PubMed]
  47. Mori, K.; Sugaya, S.; Gemma, H. Decreased anthocyanin biosynthesis in grape berries grown under elevated night temperature condition. Sci. Hortic. 2005, 105, 319–330. [Google Scholar] [CrossRef]
  48. Piero, A.R.L.; Puglisi, I.; Rapisarda, P.; Petrone, G. Anthocyanins accumulation and related gene expression in red orange fruit induced by low temperature storage. J. Agric. Food Chem. 2005, 53, 9083–9088. [Google Scholar] [CrossRef] [PubMed]
  49. Ahmed, N.U.; Park, J.I.; Jung, H.J.; Yang, T.J.; Hur, Y.; Nou, I.S. Characterization of dihydroflavonol 4-reductase (DFR) genes and their association with cold and freezing stress in Brassica rapa. Gene 2014, 550, 46–55. [Google Scholar] [CrossRef] [PubMed]
  50. Xie, X.B.; Li, S.; Zhang, R.F.; Zhao, J.; Chen, Y.C.; Zhao, Q.; Yao, Y.; You, C.-X.; Zhang, X.; Hao, Y.-J. The bHLH transcription factor MdbHLH3 promotes anthocyanin accumulation and fruit colouration in response to low temperature in apples. Plant Cell Environ. 2012, 35, 1884–1897. [Google Scholar] [CrossRef]
  51. Nakabayashi, R.; Yonekura-Sakakibara, K.; Urano, K.; Suzuki, M.; Yamada, Y.; Nishizawa, T.; Matsuda, F.; Kojima, M.; Sakakibara, H.; Shinozaki, K.; et al. Enhancement of oxidative and drought tolerance in Arabidopsis by overaccumulation of antioxidant flavonoids. Plant J. 2014, 77, 367–379. [Google Scholar] [CrossRef] [PubMed]
  52. Li, P.; Li, Y.J.; Zhang, F.J.; Zhang, G.Z.; Jiang, X.Y.; Yu, H.M.; Hou, B.-K. The Arabidopsis UDP-glycosyltransferases UGT79B2 and UGT79B3, contribute to cold, salt and drought stress tolerance via modulating anthocyanin accumulation. Plant J. 2017, 89, 85–103. [Google Scholar] [CrossRef] [PubMed] [Green Version]
  53. Peters, D.; Constabel, C.P. Molecular analysis of herbivore-induced condensed tannin synthesis: Cloning, expression of dihydroflavonol reductase from trembling aspen (Populus tremuloides). Plant J. 2002, 32, 701–712. [Google Scholar] [CrossRef] [PubMed] [Green Version]
  54. Yoshida, K.; Iwasaka, R.; Shimada, N.; Ayabe, S.; Aoki, T.; Sakuta, M. Transcriptional control of the dihydroflavonol 4-reductase multigene family in Lotus japonicus. J. Plant Res. 2010, 123, 801–805. [Google Scholar] [CrossRef] [PubMed]
  55. Li, H.; Qiu, J.; Chen, F.; Lv, X.; Fu, C.; Zhao, D.; Hua, X.; Zhao, Q. Molecular characterization and expression analysis of dihydroflavonol 4-reductase (DFR) gene in Saussurea medusa. Mol. Biol. Rep. 2012, 39, 2991–2999. [Google Scholar] [CrossRef]
  56. Li, Y.; Liu, X.; Cai, X.; Shan, X.; Gao, R.; Yang, S.; Han, T.; Wang, S.; Wang, L.; Gao, X. Dihydroflavonol 4-reductase genes from Freesia hybrida play important and partially overlapping roles in the biosynthesis of flavonoids. Front. Plant Sci. 2017, 8, 428. [Google Scholar] [CrossRef] [Green Version]
  57. Bernhardt, J.; Stich, K.; Schwarz-Sommer, Z.; Saedler, H.; Wienand, U. Molecular analysis of a second functional A1 gene (dihydroflavonol 4-reductase) in Zea mays. Plant J. 1998, 14, 483–488. [Google Scholar] [CrossRef]
  58. Huang, Y.; Gou, J.; Jia, Z.; Yang, L.; Sun, Y.; Xiao, X.; Song, F.; Luo, K. Molecular cloning and characterization of two genes encoding dihydroflavonol-4-reductase from Populus trichocarpa. PLoS ONE 2012, 7, e30364. [Google Scholar] [CrossRef] [Green Version]
  59. Inagaki, Y.; Johzuka-Hisatomi, Y.; Mori, T.; Takahashi, S.; Hayakawa, Y.; Peyachoknagul, S.; Ozeki, Y.; Iida, S. Genomic organization of the genes encoding dihydroflavonol 4-recutase for flower pigmentation in the Japanse and common morning glories. Gene 1999, 226, 181–188. [Google Scholar] [CrossRef]
  60. Himi, E.; Noda, K. Isolation and location of three homoeologous dihydroflavonol-4-reductase (DFR) genes of wheat and their tissue-dependent expression. J. Exp. Bot. 2004, 55, 365–375. [Google Scholar] [CrossRef]
  61. Kim, S.; Baek, D.; Cho, D.Y.; Lee, E.T.; Yoon, M.K. Identification of two novel inactive DFR-A alleles responsible for failure to produce anthocyanin and development of a simple PCR-based molecular marker for bulb color selection in onion (Allium cepa L.). Theor. Appl. Genet. 2009, 118, 1391–1399. [Google Scholar] [CrossRef] [PubMed]
  62. Hua, C.; Linling, L.; Shuiyuan, C.; Fuliang, C.; Feng, X.; Honghui, Y.; Conghua, W. Molecular cloning and characterization of three genes encoding dihydroflavonol-4-reductase from Ginkgo biloba in anthocyanin biosynthetic pathway. PLoS ONE 2013, 8, e72017. [Google Scholar] [CrossRef] [PubMed] [Green Version]
  63. Shimada, N.; Sasaki, R.; Sato, S.; Kaneko, T.; Tabata, S.; Aoki, T.; Ayabe, S.-I.A. A comprehensive analysis of six dihydroflavonol 4-reductases encoded by a gene cluster of the Lotus japonicus genome. J. Exp. Bot. 2005, 56, 2573–2585. [Google Scholar] [CrossRef] [PubMed] [Green Version]
  64. Kim, S.; Yoo, K.S.; Pike, L.M. Development of a PCR-based marker utilizing a deletion mutation in the dihydroflavonol 4-reductase (DFR) gene responsible for the lack of anthocyanin production in yellow onions (Allium cepa). Theor. Appl. Genet. 2005, 10, 588–595. [Google Scholar] [CrossRef]
  65. De Jong, W.S.; De Jong, D.M.; De Jong, H.; Kalazich, J.; Bodis, M. An allele of dihydroflavonol 4-reductase associated with the ability to produce red anthocyanin pigments in potato (Solanum tuberosum L.). Theor. Appl. Genet. 2003, 107, 1375–1383. [Google Scholar] [CrossRef]
  66. Peukert, M.; Weise, S.; Röder, M.S.; Matthies, I.E. Development of SNP markers for genes of the phenylpropanoid pathway and their association to kernel and malting traits in barley. BMC Genet. 2013, 14, 97. [Google Scholar] [CrossRef] [Green Version]
  67. McClean, P.E.; Lee, R.K.; Miklas, P.N. Sequence diversity analysis of dihydrofavonol 4-reductase intron 1 in common bean. Genome 2004, 47, 266–280. [Google Scholar] [CrossRef]
  68. Livak, K.J.; Schmittgen, T.D. Analysis of relative gene expression data using real-time quantitative PCR and the 2-△△CT 682 method. Methods 2001, 25, 402–408. [Google Scholar] [CrossRef]
  69. Lee, H.S.; Wicker, L. Anthocyanin pigments in the skin of lychee fruit. J. Food Sci. 1991, 56, 466–468. [Google Scholar] [CrossRef]
  70. Giusti, M.M.; Wrolstad, R.E. Characterization and measurement of anthocyanins by UV-visible spectroscopy. In Current Protocols in Food Analytical Chemistry; Wrolstadt, R.E., Ed.; Wiley Press: New York, NY, USA, 2001; pp. F1.2.1–F1.2.13. [Google Scholar]
  71. Hayashi, K.; Hashimoto, N.; Daigen, M.; Ashikawa, I. Development of PCR-based SNP markers for rice blast resistance genes. Theor. Appl. Genet. 2004, 108, 1212–1220. [Google Scholar] [CrossRef]
  72. Gaudet, M.; Fara, A.G.; Beritognolo, I.; Sabatti, M. Allele-specific PCR in SNP genotyping. Methods Mol. Biol. 2009, 578, 415–424. [Google Scholar]
  73. Hayashi, M.; Takahashi, H.; Tamura, K.; Huang, J.; Yu, L.H.; Kawai-Yamada, M.; Tezuka, T.; Uchimiya, H. Enhanced dihydroflavonol-4-reductase activity and NAD homeostasis leading to cell death tolerance in transgenic rice. Proc. Natl. Acad. Sci. USA 2005, 102, 7020–7025. [Google Scholar] [CrossRef] [Green Version]
  74. Urao, T.; Katagiri, T.; Mizoguchi, T.; Yamaguchi-Shinozaki, K.; Hayashida, N.; Shinozaki, K. Two genes that encode Ca2+-dependent protein-kinases are induced by drought and high-salt stresses in Arabidopsis thaliana. Mol. Genet. Genom. 1994, 244, 331–340. [Google Scholar] [CrossRef]
  75. Menkens, A.E.; Schindler, U.; Cashmore, A.R. The G-box: A ubiquitous regulatory DNA element in plants bound by the GBF family of bzip proteins. Trends Biochem. Sci. 1995, 20, 506–510. [Google Scholar] [CrossRef]
  76. Stålberg, K.; Ellerström, M.; Ezcurra, I.; Ablov, S.; Rask, L. Disruption of an overlapping E box/ABRE motif abolished high transcription of the napA storage protein promoter in transgenic Brassica napus seeds. Planta 1996, 199, 515–519. [Google Scholar] [CrossRef]
  77. Abe, H.; Urao, T.; Ito, T.; Seki, M.; Shinozaki, K.; Yamaguchi-Shinozaki, K. Arabidopsis AtMYC2 (bHLH) and AtMYB2 (MYB) function as transcriptional activators in abscisic acid signaling. Plant Cell. 2003, 15, 63–78. [Google Scholar] [CrossRef] [Green Version]
  78. Baranowskij, N.; Frohberg, C.; Prat, S.; Willmitzer, L. A novel DNA binding protein with homology to Myb oncoproteins containing only one repeat can function as a transcriptional activator. EMBO J. 1994, 13, 5383–5392. [Google Scholar] [CrossRef]
  79. Johnson, E.T.; Ryu, S.; Yi, H.K.; Shin, B.; Cheong, H.; Choi, G. Alteration of a single amino acid changes the substrate specificity of dihydroflavonol 4-reductase. Plant J. 2001, 25, 325–333. [Google Scholar] [CrossRef]
  80. Petit, P.; Granier, T.; d’Estaintot, B.L.; Manigand, C.; Bathany, K.; Schmitter, J.M.; Lauvergeat, V.; Hamdi, S.; Gallois, B. Crystal structure of grape dihydroflavonol4-reductase, a key enzyme in flavonoid biosynthesis. J. Mol. Biol. 2007, 368, 1345–1357. [Google Scholar] [CrossRef]
  81. Nguyen, N.H.; Jeong, C.Y.; Kang, G.H.; Yoo, S.D.; Hong, S.W.; Lee, H. MYBD employed by HY5 increases anthocyanin accumulation via repression of MYBL2 in Arabidopsis. Plant J. 2015, 84, 1192–1205. [Google Scholar] [CrossRef] [Green Version]
  82. Chalker-Scott, L. Environmental significance of anthocyanins in plant stress responses. Photochem. Photobiol. 1999, 70, 1–9. [Google Scholar] [CrossRef]
  83. Guo, N.; Han, S.; Zong, M.; Wang, G.; Zheng, S.; Liu, F. Identification and differential expression analysis of anthocyanin biosynthetic genes in leaf color variants of ornamental kale. BMC Genom. 2019, 20, 564. [Google Scholar] [CrossRef] [Green Version]
  84. Shi, M.Z.; Xie, D.Y. Features of anthocyanin biosynthesis in pap1-D and wild-type Arabidopsis thaliana plants grown in different light intensity and culture media conditions. Planta 2010, 231, 1385–1400. [Google Scholar] [CrossRef]
  85. Liu, X.P.; Gao, B.Z.; Han, F.Q.; Fang, Z.Y.; Yang, L.M.; Zhuang, M.; Lv, H.; Liu, Y.; Li, Z.; Cai, C.; et al. Genetics and fine mapping of a purple leaf gene, BoPr, in ornamental kale (Brassica oleracea L. var. acephala). BMC Genom. 2017, 18, 230. [Google Scholar] [CrossRef] [Green Version]
  86. Espley, R.V.; Brendolise, C.; Chagné, D.; Kutty-Amma, S.; Green, S.; Volz, R.; Putterill, J.; Schouten, H.J.; Gardiner, S.E.; Hellens, R.P.; et al. Multiple repeats of a promoter segment causes transcription factor autoregulation in red apples. Plant Cell. 2009, 21, 168–183. [Google Scholar] [CrossRef] [Green Version]
  87. Kim, J.; Lee, H.J.; Jung, Y.J.; Kang, K.K.; Tyagi, W.; Kovach, M.; Sweeney, M.; McCouch, S.; Cho, Y.-G. Functional properties of an alternative, tissue-specific promoter for rice NADPH-dependent dihydroflavonol reductase. PLoS ONE 2017, 12, e0183722. [Google Scholar] [CrossRef] [Green Version]
  88. Petridis, A.; Döll, S.; Nichelmann, L.; Bilger, W.; Mock, H.P. Arabidopsis thaliana G2-LIKE FLAVONOID REGULATOR and BRASSINOSTEROID ENHANCED EXPRESSION1 are low-temperature regulators of flavonoid accumulation. N. Phytol. 2016, 211, 912–925. [Google Scholar] [CrossRef] [Green Version]
  89. Debeaujon, I.; Nesi, N.; Perez, P.; Devic, M.; Grandjean, O.; Caboche, M.; Lepiniec, L. Proanthocyanidin-accumulating cells in Arabidopsis testa: Regulation of differentiation and role in seed development. Plant Cell. 2003, 15, 2514–2531. [Google Scholar] [CrossRef] [Green Version]
  90. Baudry, A.; Heim, M.A.; Dubreucq, B.; Caboche, M.; Weisshaar, B.; Lepiniec, L. TT2, TT8, and TTG1 synergistically specify the expression of BANYULS and proanthocyanindin biosynthesis in Arabidopsis thaliana. Plant J. 2004, 39, 366–380. [Google Scholar] [CrossRef]
  91. Baudry, A.; Caboche, M.; Lepiniec, L. TT8 controls its own expression in a feedback regulation involving TTG1 and homologous MYB and bHLH factors, allowing a strong and cell-specific accumulation of flavonoids in Arabidopsis thaliana. Plant J. 2006, 46, 768–779. [Google Scholar] [CrossRef]
  92. Thomashow, M.F. Plant cold acclimation: Freezing tolerance genes and regulatory mechanisms. Annu. Rev. Plant Physiol. Plant Mol. Biol. 1999, 50, 571–599. [Google Scholar] [CrossRef] [Green Version]
  93. Liu, Y.; Dang, P.; Liu, L.; He, C. Cold acclimation by the CBF–COR pathway in a changing climate: Lessons from Arabidopsis thaliana. Plant Cell Rep. 2019, 3, 511–519. [Google Scholar] [CrossRef] [Green Version]
Figure 1. Expression analysis of anthocyanin biosynthesis genes in cabbage genotypes. (A) Expression analysis of two early and two late anthocyanin biosynthetic genes in BN106, a cold tolerant inbred line, by quantitative real-time PCR (qRT-PCR). Plants were grown under normal growth conditions (23 °C) for 3 weeks and then subjected to warm or cold temperatures for 2 h. Three replicates were performed for each sample. Data represent mean ± standard deviation (SD). (B) Expression analysis of putative DFR genes in cabbage genotypes under low temperature (LT) by reverse transcription PCR (RT-PCR). Plants were grown in the greenhouse for 4 weeks and then placed either in the greenhouse (G) or in the field (L) (under LT) for 4 weeks. Average temperature varied from 20 °C (low) to 30 °C (high) in the greenhouse, and from 6 °C (low) to 18 °C (high) in the field. Putative BoDFRs were selected on the basis of B. rapa DFR sequences [49].
Agronomy 10 00602 g001
Figure 2. Anthocyanin content (A) and BoDFR1 expression (B) in four inbred lines of cabbage grown under normal (23 °C) or low temperature (10 °C) treatment for 30 days. Plants were grown in a growth chamber for 3 weeks before treatments. Data represent mean ± SD (n = 3).
Agronomy 10 00602 g002
Figure 3. Variation in temperature and anthocyanin content under the natural environment. (A) Temperature profile expressed as weekly average temperature (low, high and mean) from 7 September to 16 November under the natural environment. The daily low temperature in the field was below 10 °C during the last one month. Data represented mean ± SD (n = 7). (B) Variation in anthocyanin content in cabbage genotypes harvested on Nov. 16. The top four samples represent high anthocyanin accumulators (HAAs), and the bottom four samples represent low anthocyanin accumulators (LAAs).
Agronomy 10 00602 g003
Figure 4. Analysis of anthocyanin content (A) and DFR1 expression (B) in cabbage genotypes shown in Figure 3. 154, T-523, T-530, and CT-415 are cabbages belonging to the genotype of HAAs and 09WH45, 2409, Golden Cross, and Speed King are cabbages belonging to the genotype of LAAs. Plants were grown in the greenhouse at temperatures ranging from 20 °C to 30 °C (control, CK) or at low temperature (LT) for one month. DFR transcript levels were measured by qRT-PCR. Data represent mean ± SD (n = 3).
Agronomy 10 00602 g004
Figure 5. Schematic representation of the BoDFR1 and the BoDFR1v alleles identified in cabbage. The 1580 bp genomic DNA from ATG to TAG codon consists of six exons (black rectangles) and five introns (solid line). Locations of SNPs in the genomic DNA and putative transcription factor binding sites in the promoter are indicated. Analysis of cis-regulatory elements in the promoter region was performed using PlantPAN and PLACE databases. MYB-core, MYB-binding site; E/G-BX, bHLH-binding site; MYB1AT, MYB recognition site; MYBST1, Solanum tuerosum MYB-binding site 1.
Agronomy 10 00602 g005
Figure 6. Production and activity of recombinant BoDFR1 and BoDFR1v proteins. (A) Predicted structure of BoDFR1 based on grape DFR crystal structure (PDB (protein data bank) ID: 2C29) [76]. The L261H amino acid substitution identified in Bol035269 is located in the α10 helix of the small C-terminal domain (green arrow). (B) Schematic representation of recombinant expression vectors. (C) SDS-PAGE analysis of recombinant proteins. Protein samples were separated on 10% polyacrylamide gels. M, protein marker. Lane 1, total lysate of pET-28a-BoDFR1; lane 2, total lysate of pET-28a-BoDFR1v; lane 3, purified His-tagged BoDFR1 protein; lane 4, purified His-tagged BoDFR1v protein. The molecular weight of BoDFR1 and BoDFR1v is 43 kDa. (D) Activity of BoDFR1 based on the oxidation of NADPH (Reduced nicotinamide adenine dinucleotide phosphate). The oxidation of NADPH was measured as the decrease in absorbance at 340 nm. DHK, dihydrokaempferol; DHQ, dihydroquercetin; DHM, dihydromyricetin.
Agronomy 10 00602 g006
Figure 7. Expression analysis of anthocyanin biosynthesis genes encoding structural proteins in cabbage genotypes. Plants were grown either under normal growth temperature (CK; 20–30 °C) or at LT (see Figure 3). Gene expression was analyzed by qRT-PCR. Expression level of BoActin2 was set to one and used for data normalization. Data represent mean ± SD (n = 3).
Agronomy 10 00602 g007
Figure 8. Expression analysis of anthocyanin biosynthesis genes encoding regulatory proteins in cabbage genotypes. Plants were grown either under normal growth temperature (CK; 20–30 °C) or under LT (see Figure 3). Gene expression was analyzed by qRT-PCR. Expression level of BoActin2 was set to one and used for data normalization. Data represent mean ± SD (n = 3). BoDFR1 data were same as that in Figure 4B and used as a reference.
Agronomy 10 00602 g008
Figure 9. Expression analysis of four CBF genes by qRT-PCR. Cabbage plants were grown either under normal growth temperature (CK; 20–30 °C) or under LT condition (see Figure 3). Expression level of BoActin2 was set to one and used for data normalization. Data represent mean ± SD (n = 3).
Agronomy 10 00602 g009
Figure 10. Validation of BoDFR SNP marker designed to distinguish between HAAs and LAAs. (A,C) PCR analysis. Optimal annealing temperatures are indicated on the right side. (B,D) HRM analysis. Cabbage genotypes used for the analysis are indicated on the right side.
Agronomy 10 00602 g010
Figure 11. HRM analysis of 120 cabbage genotypes (inbred lines and cultivars). (A) HRM graph, (B) genotype of the SNP in 120 cabbage genotypes. Anthocyanin content (C) and BoDFR1 expression (D) in selected cabbage genotypes to confirm the utility of the marker. Data represent mean ± SD (n = 3).
Agronomy 10 00602 g011
Table 1. Cabbage genotypes used for DFR1 sequence and expression analyses.
Genotype ID or NameCharacteristic Genetic StatusUse §Seed Source
337HAAInbred lineNTS, RT-PCRAsia Seed Co.
2437HAA..NTS, RT-PCRAsia Seed Co.
154HAA..NTS, RT-PCR, qRT-PCRAsia Seed Co.
09WH45LAA..NTS, qRT-PCRAsia Seed Co.
2409LAA..NTS, qRT-PCRAsia Seed Co.
842LAA..NTSAsia Seed Co.
Speed KingLAAF1 cultivarNTS, qRT-PCRTakii Seed Co.
BN106Cold toleranceInbred lineqRT-PCRAsia Seed Co.
7S4-63Purple cabbage..NTSAsia Seed Co.
7S4-51Purple cabbage..NTSAsia Seed Co.
CT-415HAAF1 cultivarNTS, qRT-PCRAsia Seed Co.
T-523HAAF1 cultivarNTS, qRT-PCRTakii Seed Co.
T-530HAA..NTS, qRT-PCRTakii Seed Co.
Golden CrossLAA..NTS, qRT-PCRTakii Seed Co.
HAA, high anthocyanin accumulator; LAA, low anthocyanin accumulator. § NTS, nucleotide sequence analysis; RT-PCR, reverse transcription PCR; qRT-PCR, quantitative real-time PCR.
Table 2. Primers and conditions used for PCR and high resolution melt (HRM) analyses of three SNPs in cabbage genotypes. Gothic underlined nucleotide indicated a destabilizing mismatch in forward primer.
UseSNP Position (bp)Primer OrientationTarget SNPPrimer NamePrimer Sequence (5′→3′)PCR Reaction ConditionsProduct Size (bp)
Template DNA (ng)Annealing Temperature (°C)No. of Cycles
PCR Analysis423ForwardCBoDFR 423C-F1GTTATACTATGAACCTTTTTCTTATTACAC56027266
TBoDFR 423T-F1GTTATACTATGAACCTTTTTCTTATTACAT560.527266
Reverse BoDFR 423CT-R1CTGTCATCTTCTTGGACATGATAAAGT
628ForwardCBoDFR 628C-F2ATGATGAAAACGATTGGAGTGATATC56027295
TBoDFR 628T-F2ATGATGAAAACGATTGGAGTGATATT56127295
Reverse BoDFR 628CT-R1GCGGTAATAAGGCTAGG
1118ForwardTBoDFR1-1118T-F2TTTGTTCCTCTCACGATGCAACGATACT7.562.727197
ABoDFR1-1118A-F1GTTTGTTCCTCTCACGATGCAACGATTTA7.562.727198
Reverse BoDFR1-1118TA-RCTCTTTAGATTCTCATCCACTCCTTCAAA
HRM1118 BoDFR-HRM-aF12TCCACTTGGACGACTTATGCAATGCT 66.3
BoDFR-HRM-aR1ATCTTACGTTGAAGGCACGTTATATTCTG 66.2
BoDFR-HRM-pF1GCAACGATTCATACTATCTC 54.3

