Identifying Spring Barley Cultivars with Differential Response to Tillage

 , ,
, ,
Abstract
:1. Introduction
2. Materials and Methods
2.1. Cultivars
2.2. Trial Design
2.3. Assessments
2.4. Statistical Analysis
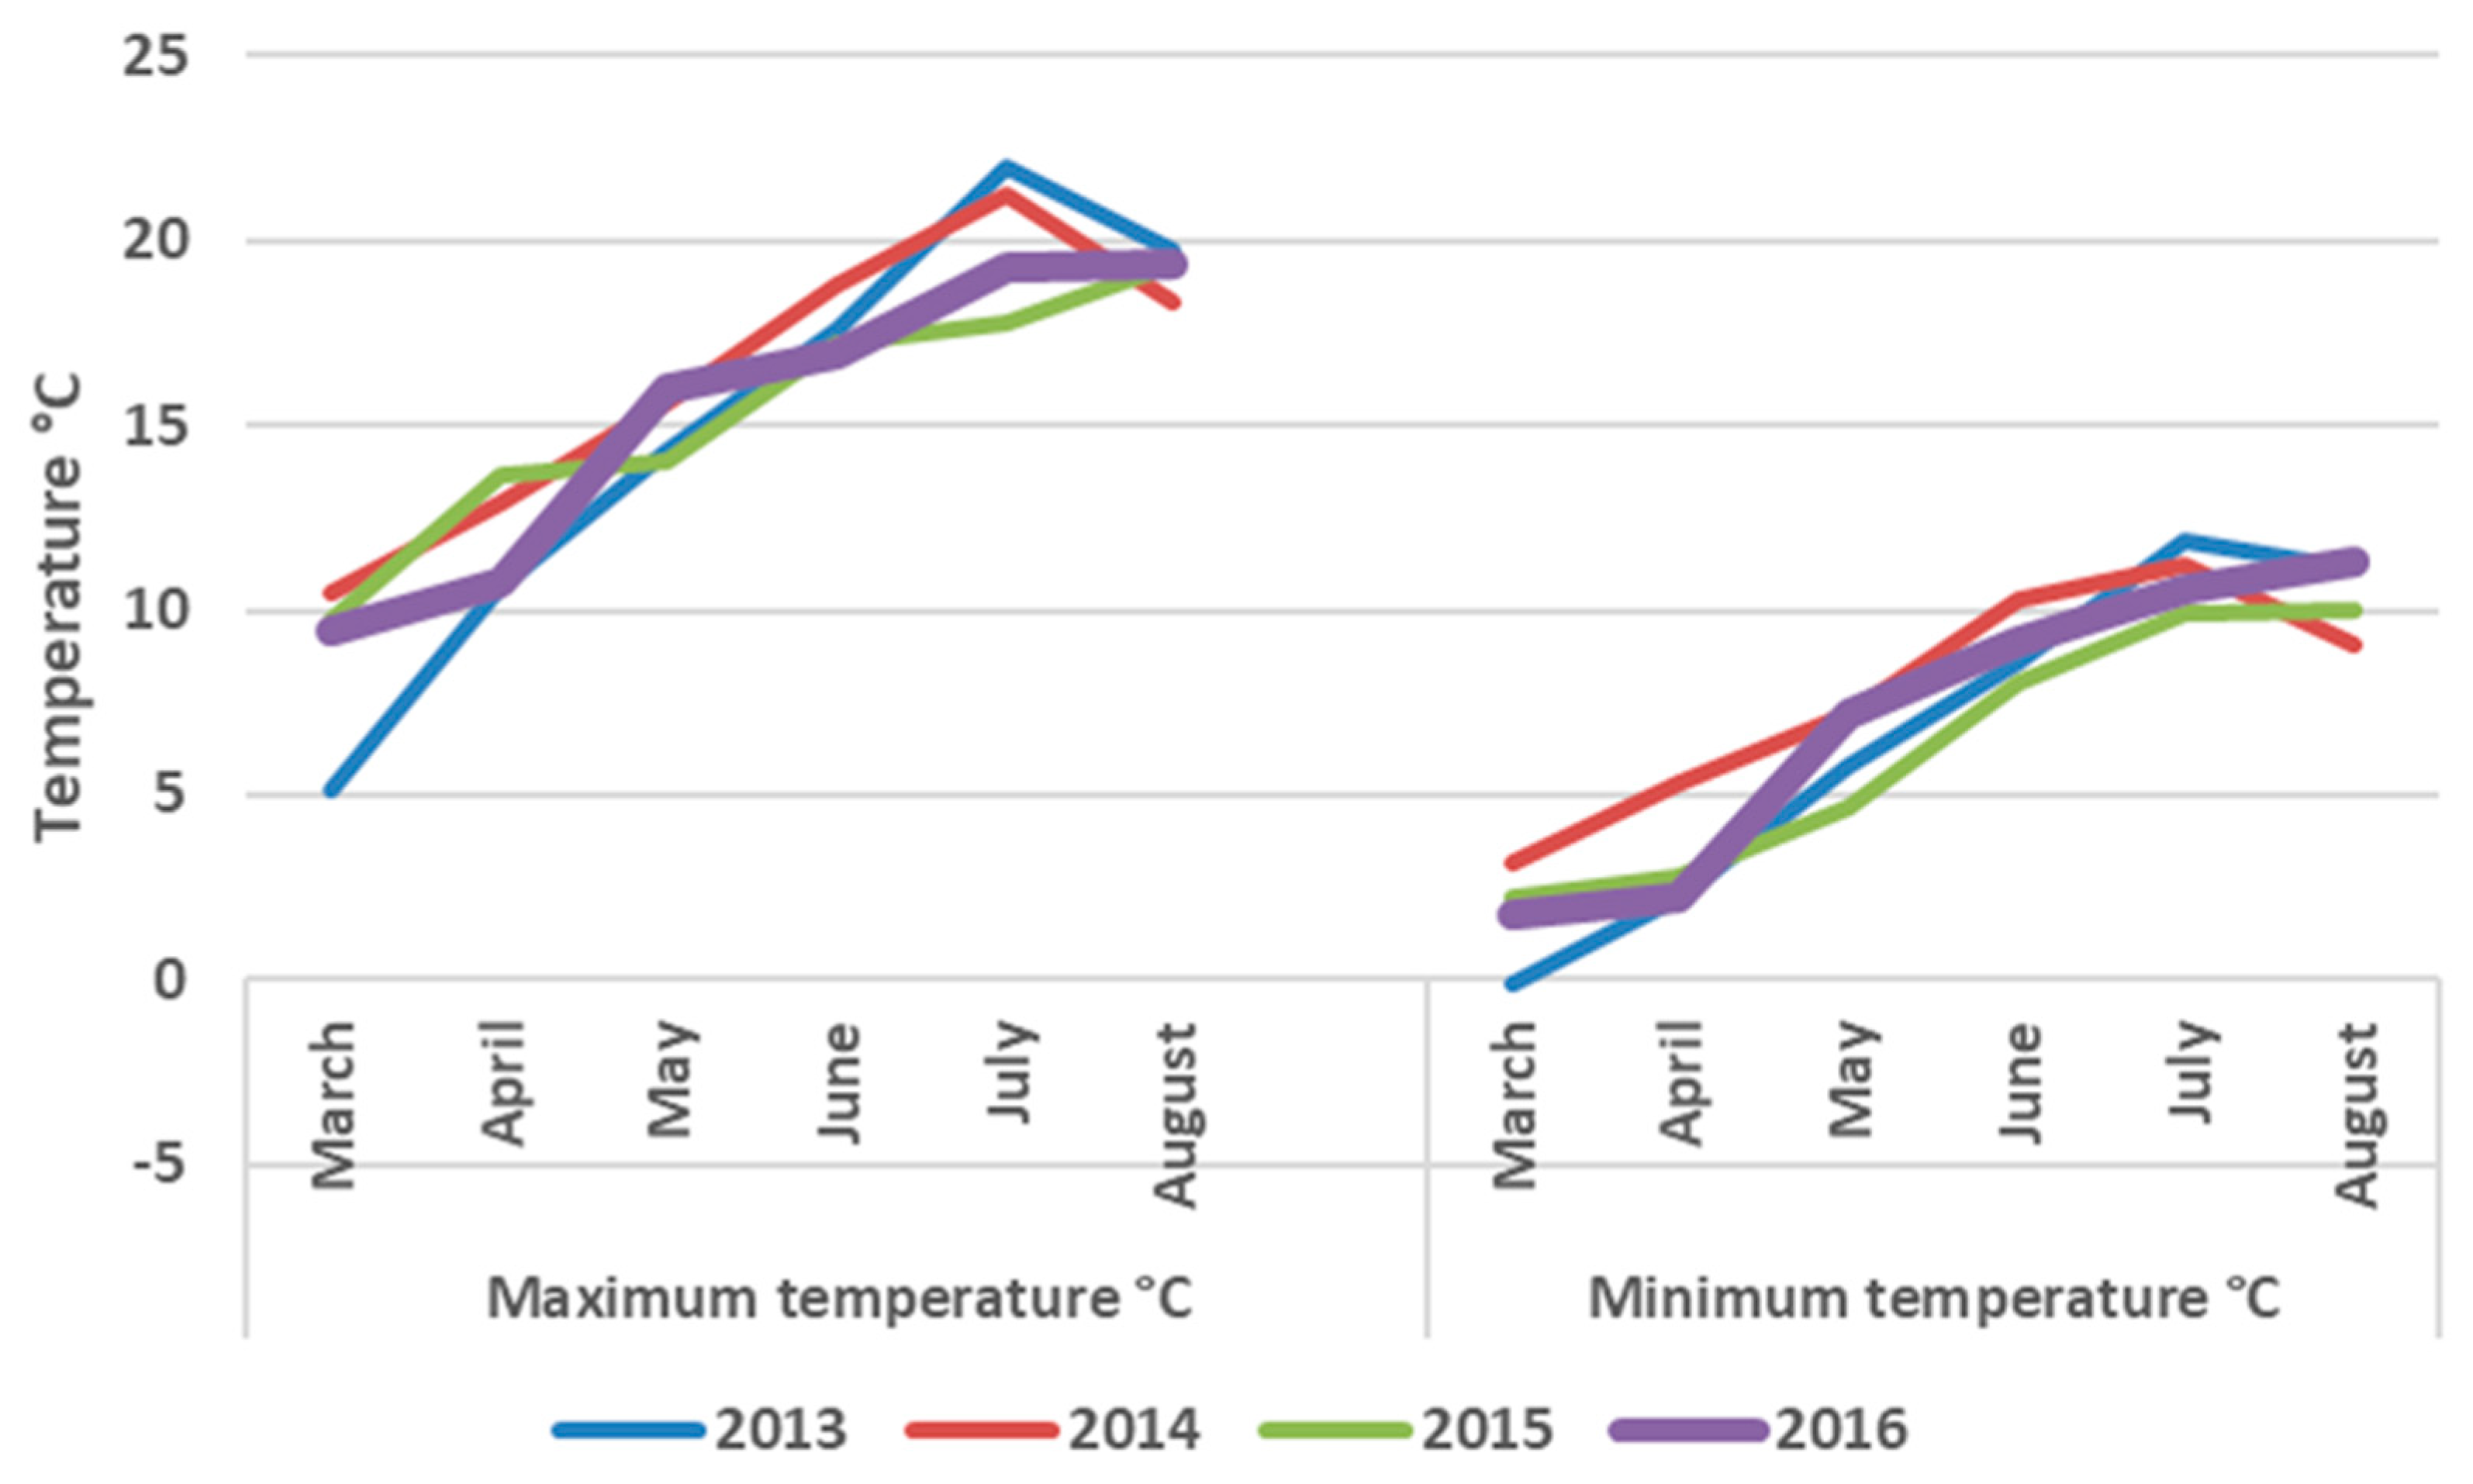
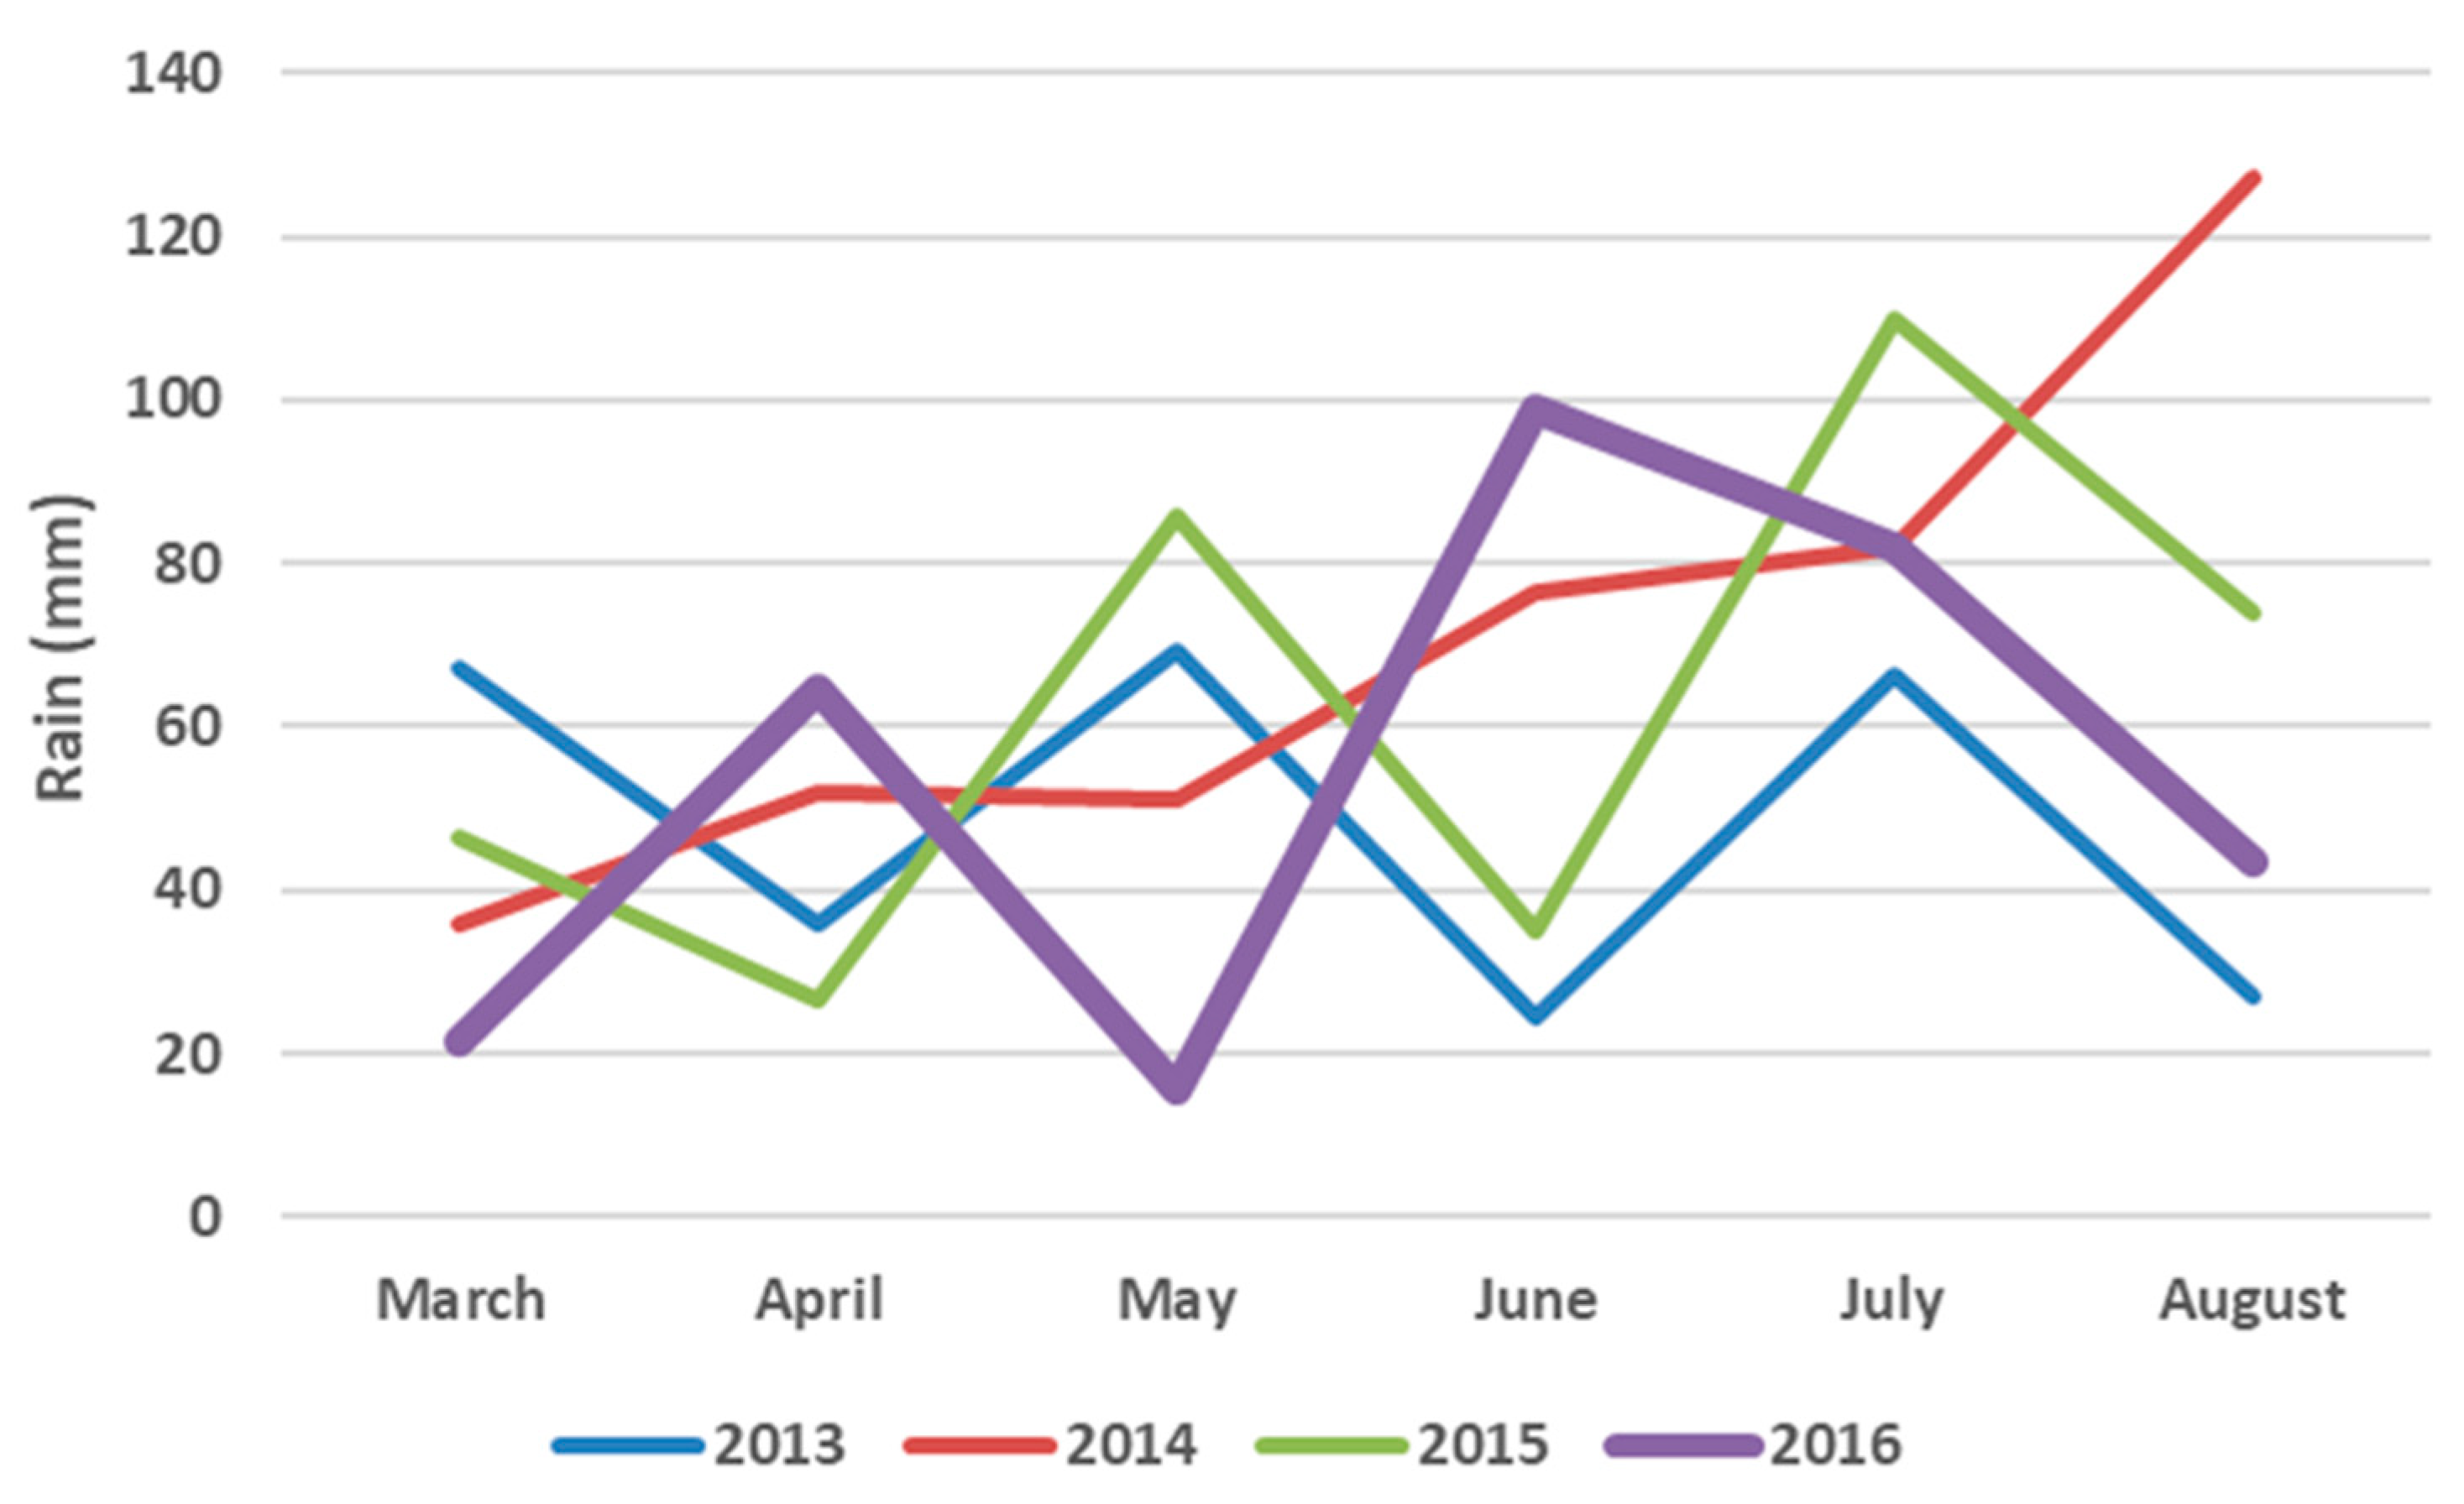
2.5. Seasonal Weather Data
2.6. Exploring Cultivar Ranking Changes
3. Results
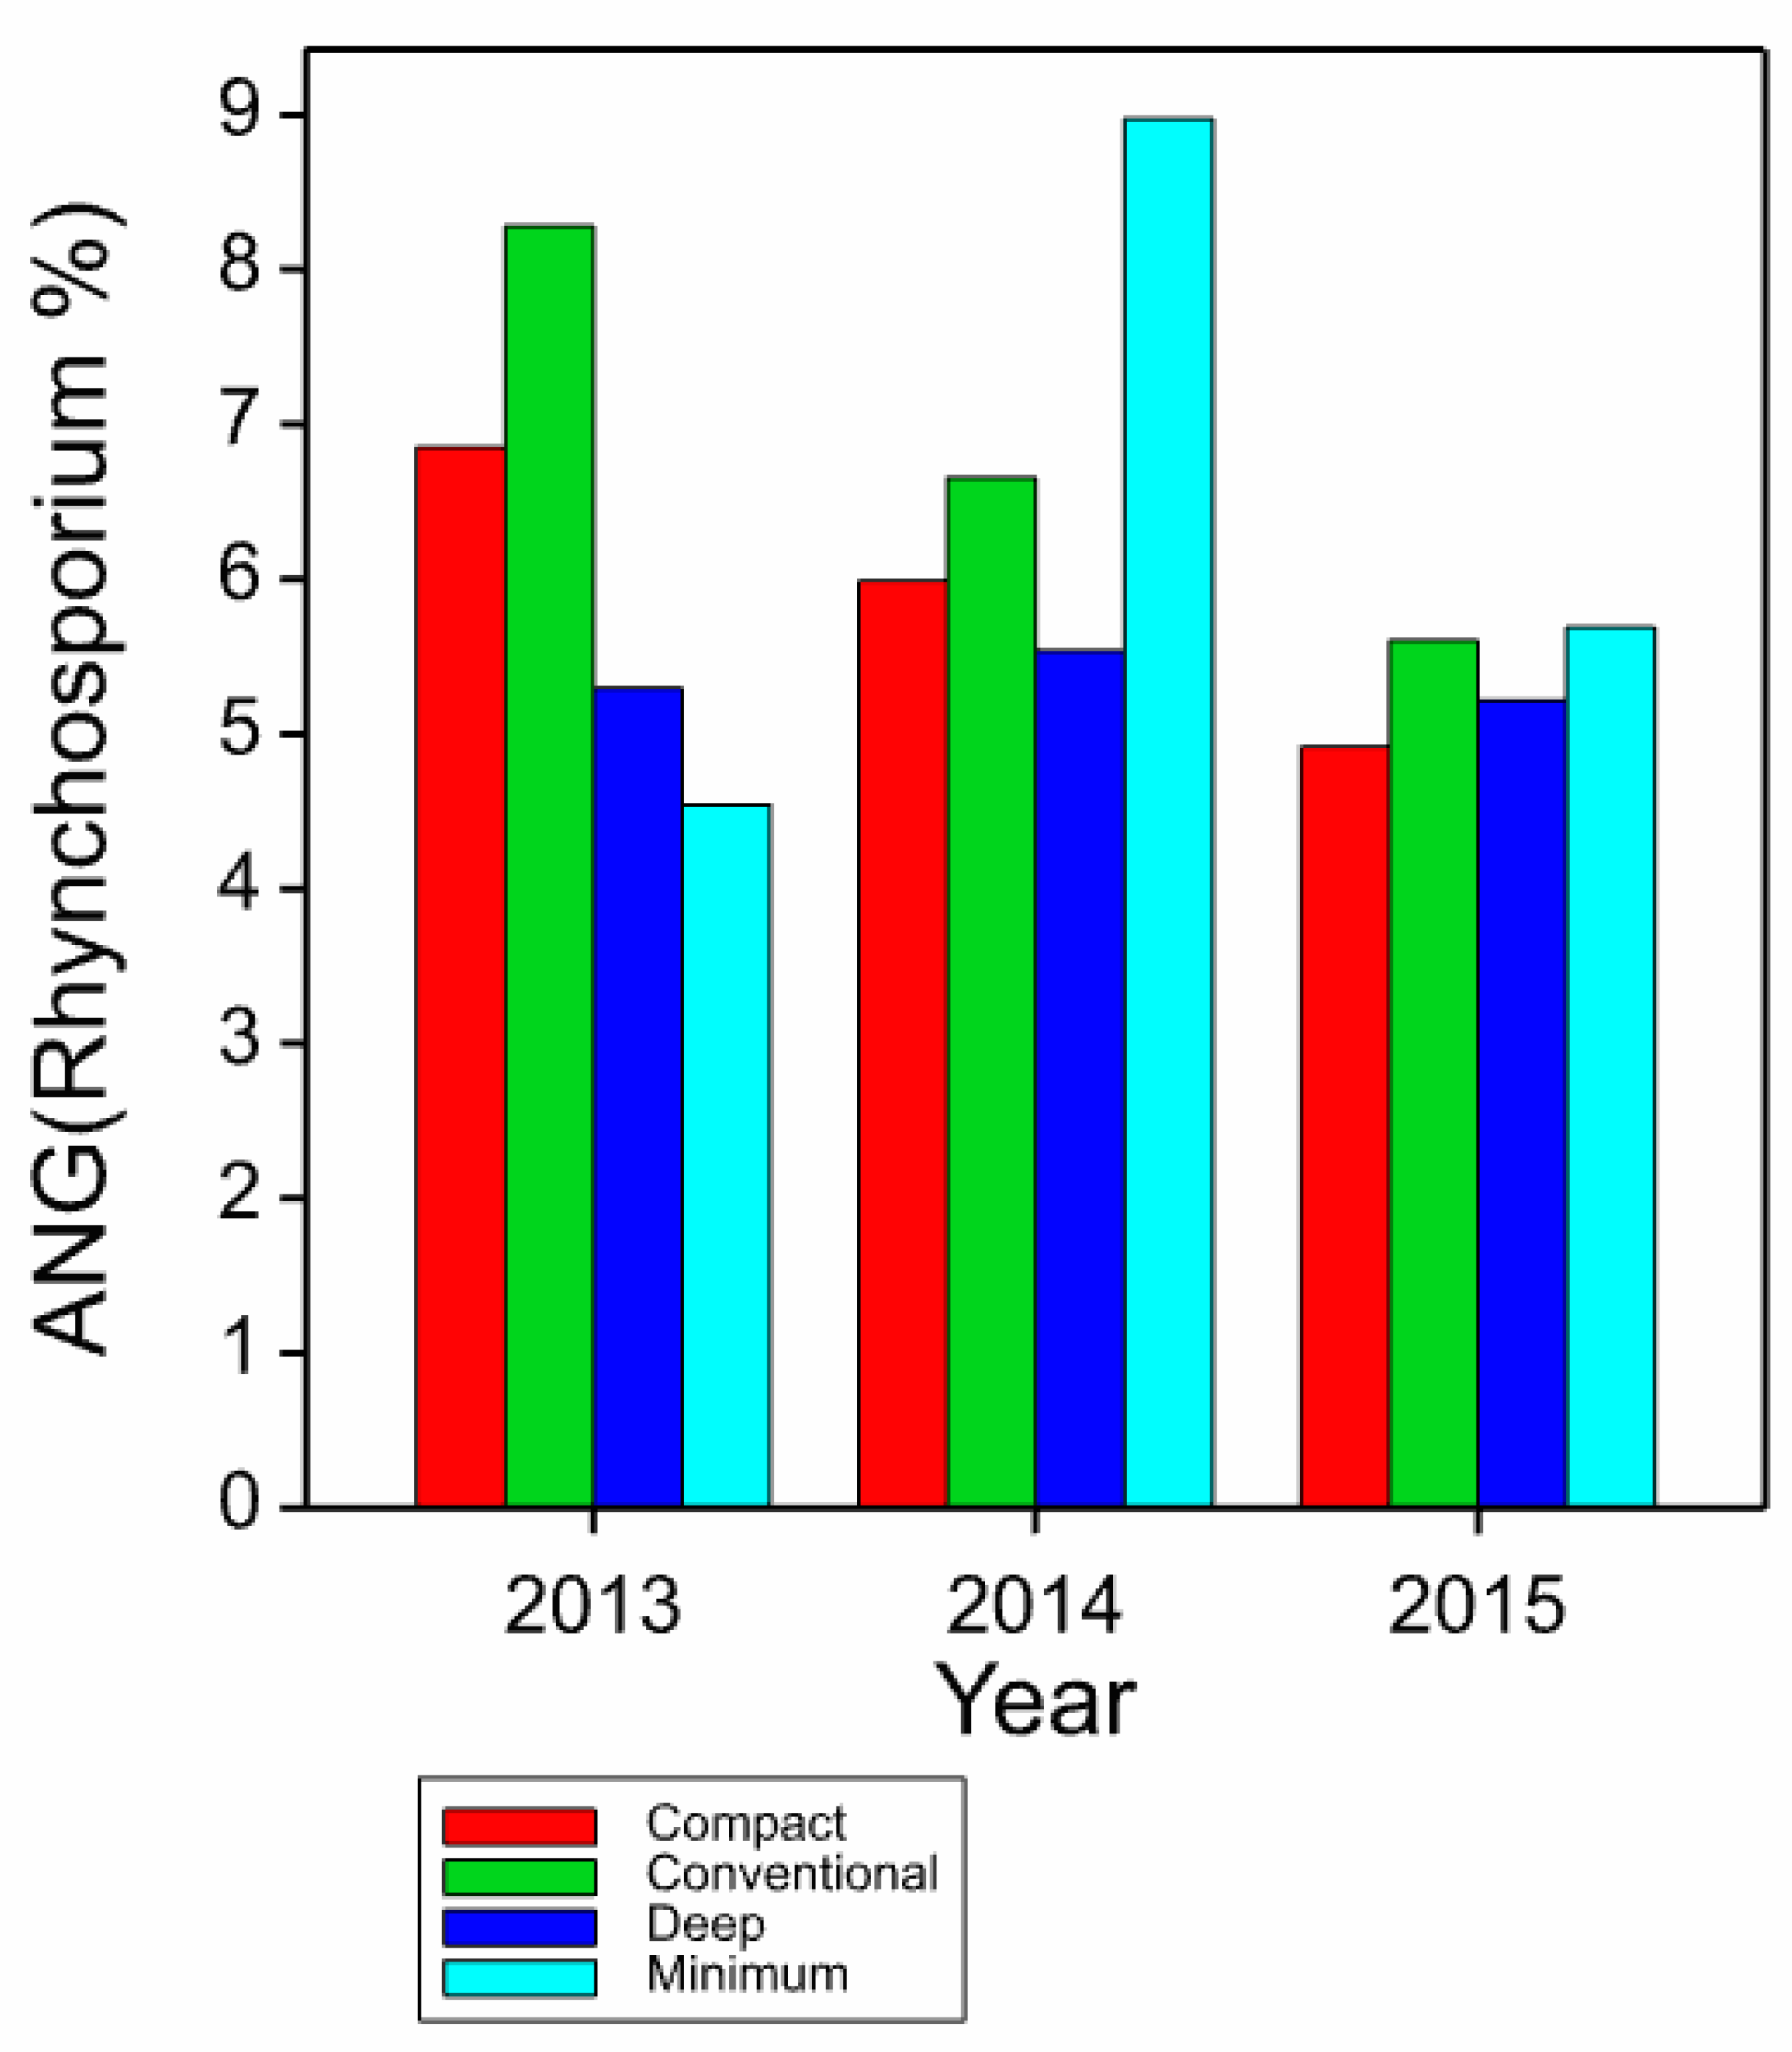
3.1. Disease
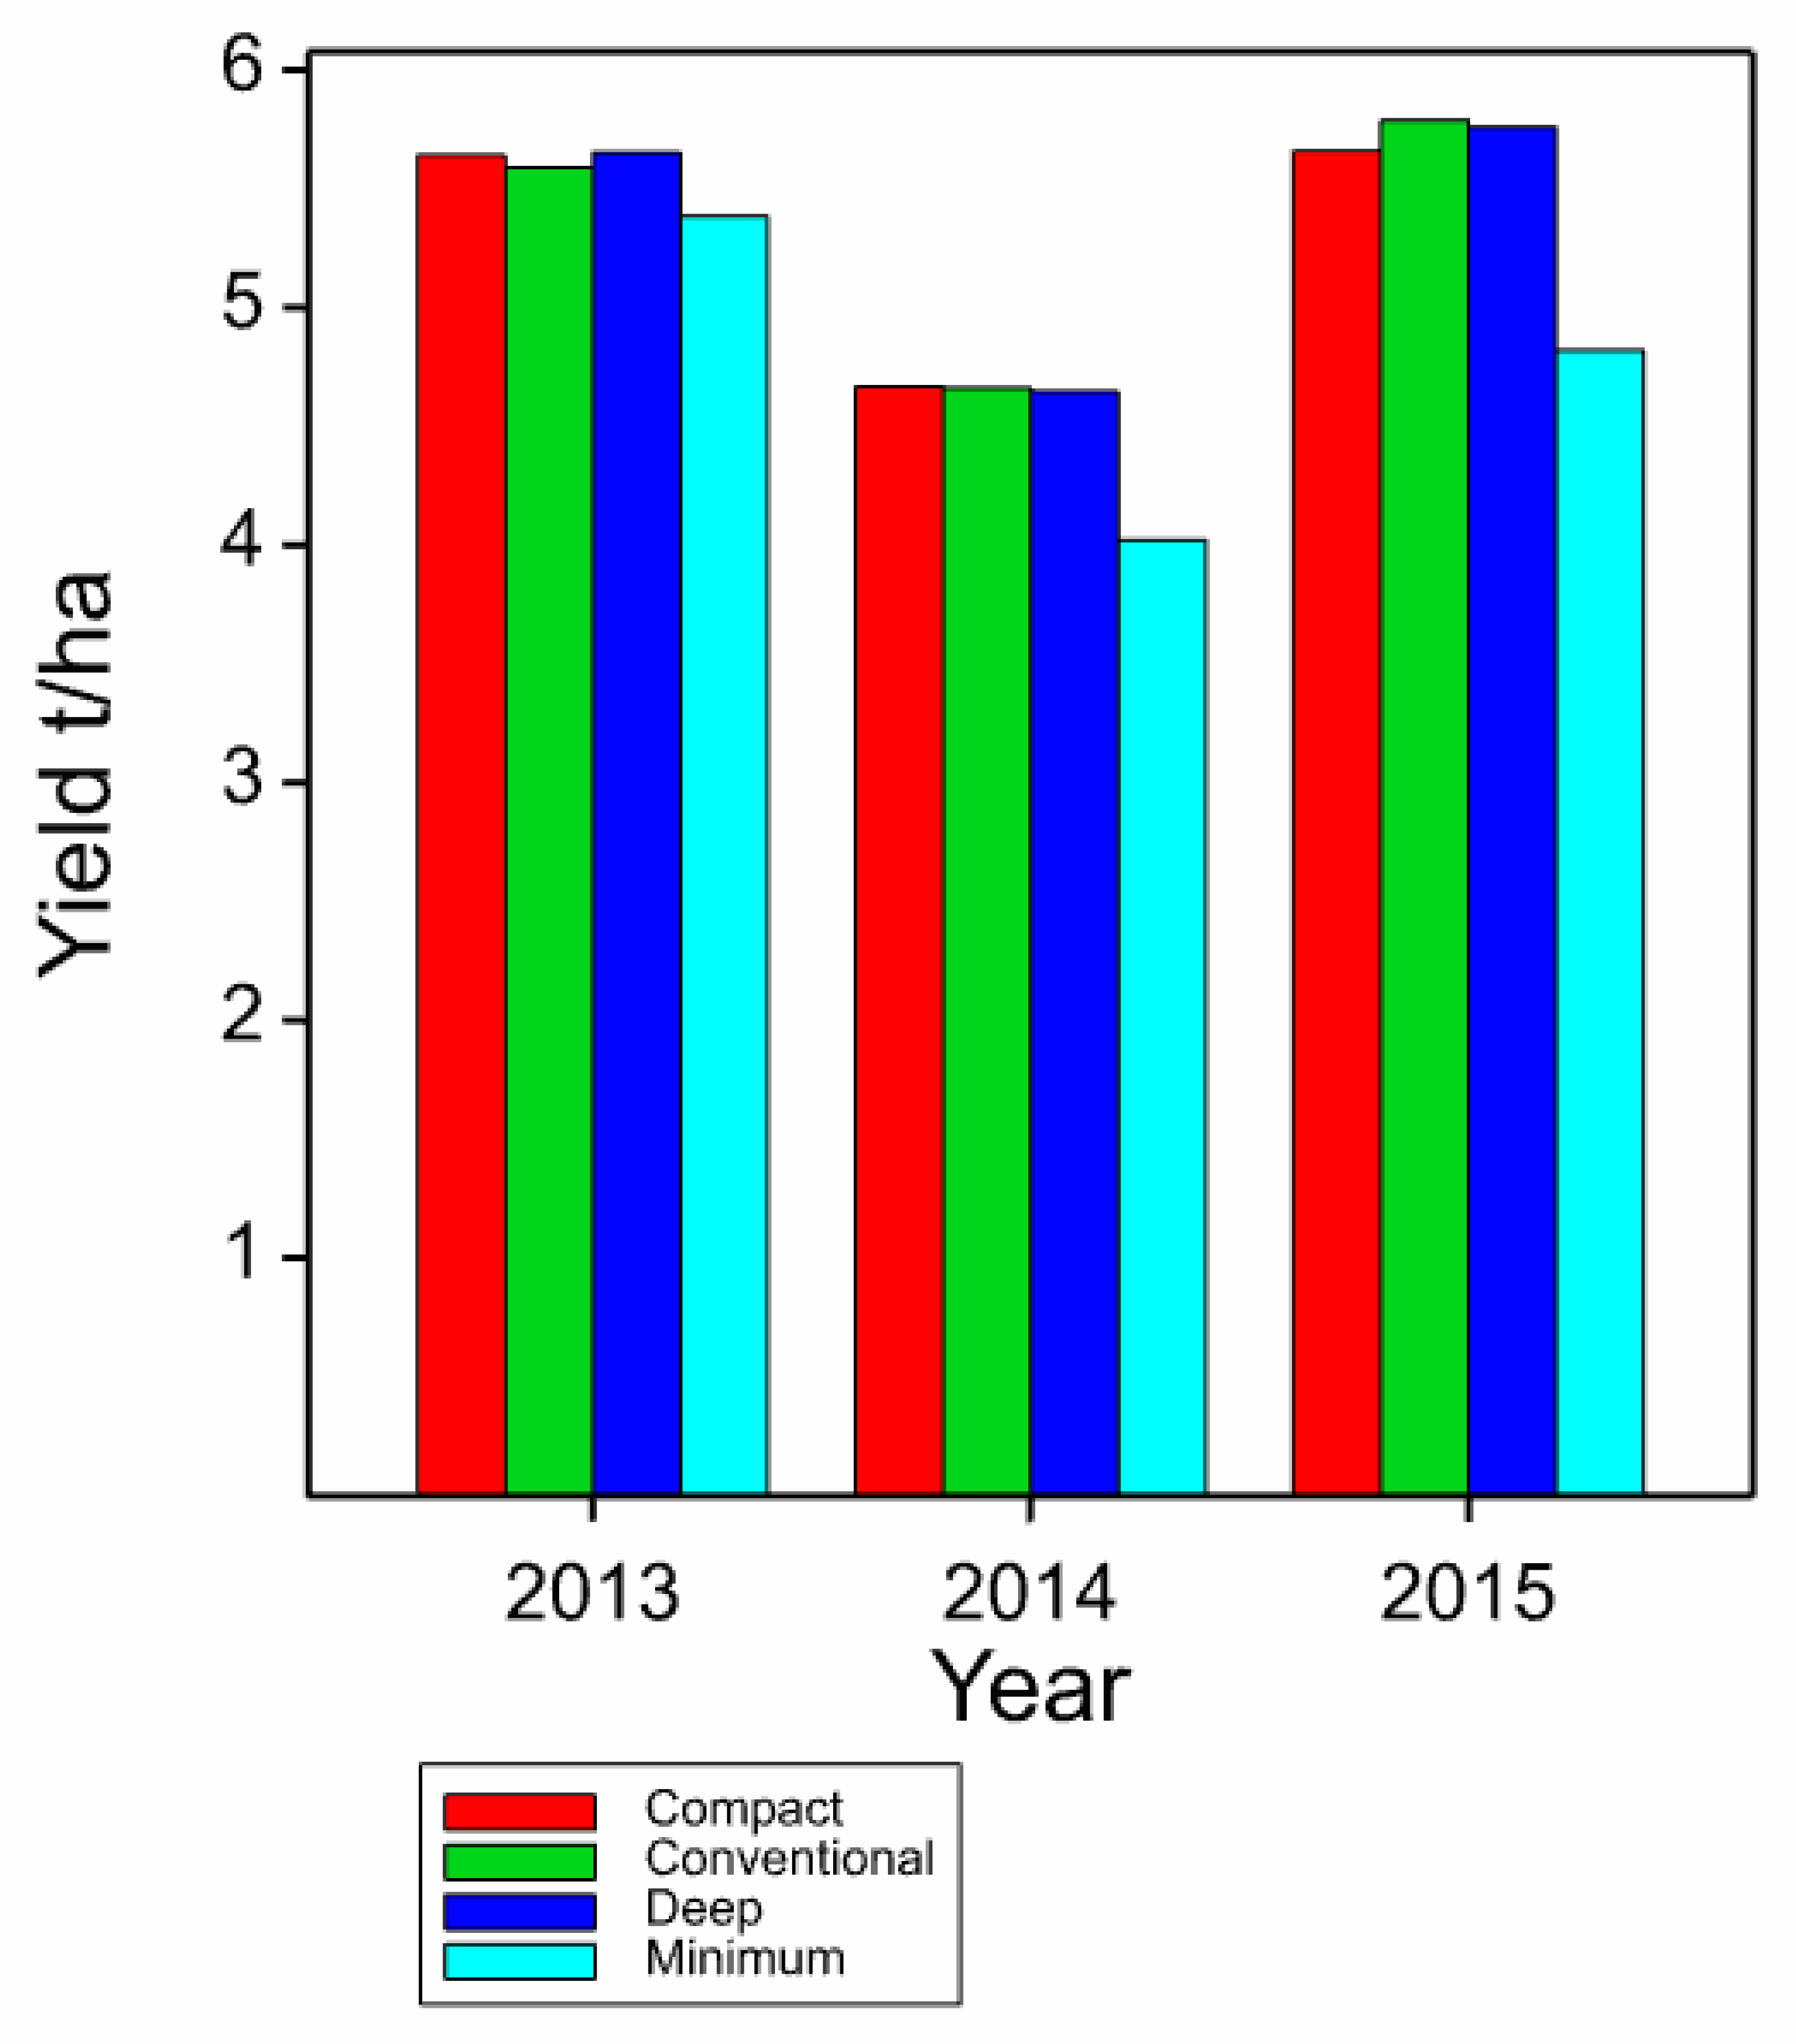
3.2. Yield
3.3. Cultivar Ranking Changes
4. Discussion
5. Conclusions
Author Contributions
Funding
Acknowledgments
Conflicts of Interest
References
- Newton, A.C.; Guy, D.; Preedy, K. Wheat cultivar yield response to some organic and conventional farming conditions and the yield potential of mixtures. J. Sci. Food Agric. 2017, 89, 2477–2491. [Google Scholar] [CrossRef]
- Trethowan, R.M.; Mahmood, T.; Ali, Z.; Oldach, K.; Garcia, A.G. Breeding wheat cultivars better adapted to conservation agriculture. Field Crops Res. 2012, 132, 76–83. [Google Scholar] [CrossRef]
- Herrera, J.M.; Verhulsta, N.; Trethowan, R.M.; Stamp, P.; Govaerts, B. Insights into genotype × tillage interaction effects on the grain yield of wheat and maize. Crop Sci. 2013, 53, 1845–1859. [Google Scholar] [CrossRef]
- Cox, D.J.; Shelton, D.R. Genotype-by-Tillage Interactions in Hard Red Winter Wheat Quality Evaluation. Agron. J. 1992, 84, 627–630. [Google Scholar] [CrossRef]
- Weisz, R.; Bowman, D.T. Influence of Tillage System on Soft Red Winter Wheat Cultivar Selection. J. Prod. Agric. 2013, 12, 415–418. [Google Scholar] [CrossRef]
- Kitonyo, O.M.; Sadras, V.O.; Zhou, Y.; Denton, M.D. Evaluation of historic Australian wheat varieties reveals increased grain yield and changes in senescence patterns but limited adaptation to tillage systems. Field Crops Res. 2017, 206, 65–73. [Google Scholar] [CrossRef]
- Carr, P.M.; Horsley, R.D.; Poland, W.W. Tillage and Seeding Rate Effects on Wheat Cultivars. Crop Ecol. Manag. Qual. 2003, 43, 210–218. [Google Scholar]
- Guy, S.O.; Oplinger, E.S. Soybean Cultivar Performance as Influenced by Tillage System and Seed Treatment. J. Prod. Agric. 2013, 2, 57–62. [Google Scholar] [CrossRef]
- Townsend, T.J.; Ramsden, S.J.; Wilson, P. How do we cultivate in England? Tillage practices in crop production systems. Soil Use Manag. 2016, 32, 106–117. [Google Scholar] [CrossRef] [Green Version]
- Llewellyn, R.S.; D’Emden, F.H.; Kuehne, G. Extensive use of no-tillage in grain growing regions of Australia. Field Crops Res. 2012, 132, 204–212. [Google Scholar] [CrossRef]
- George, T.S.; Brown, L.K.; Newton, A.C.; Hallett, P.D.; Sun, B.H.; Thomas, W.T.B.; White, P.J. Impact of soil tillage on the robustness of the genetic component of variation in phosphorus (P) use efficiency in barley (Hordeum vulgare L.). Plant Soil 2011, 339, 113–123. [Google Scholar] [CrossRef] [Green Version]
- Bingham, I.J.; Blake, J.; Foulkes, M.J.; Spink, J. Is barley yield in the UK sink 704 limited? Field Crops Res. 2007, 101, 198–211. [Google Scholar] [CrossRef]
- Bingham, I.J.; Young, C.; Bounds, P.; Paveley, N.D. In sink-limited spring barley crops, light interception by green canopy does not need protection against foliar disease for the entire duration of grain filling. Field Crops Res. 2019, 239, 124–134. [Google Scholar] [CrossRef]
- Serrago, R.A.; Alzueta, I.; Savin, R.; Slafer, G.A. Understanding grain yield responses to source–sink ratios during grain filling in wheat and barley under contrasting environment. Field Crops Res. 2013, 150, 42–51. [Google Scholar] [CrossRef] [Green Version]
- Haling, R.E.; Brown, L.K.; Bengough, A.G.; Young, I.M.; Hallett, P.D.; White, P.J.; George, T.S. Root hairs improve root penetration, root–soil contact, and phosphorus acquisition in soils of different strength. J. Exp. Bot. 2013, 64, 3711–3721. [Google Scholar] [CrossRef] [PubMed] [Green Version]
- Haling, R.E.; Brown, L.K.; Bengough, A.G.; Valentine, T.A.; White, P.J.; Young, I.M.; George, T.S. Root hair length and rhizosheath mass depend on soil porosity, strength and water content in barley genotypes. Planta 2014, 239, 643–651. [Google Scholar] [CrossRef]
- Newton, A.C.; Guy, D.C.; Bengough, A.G.; Gordon, D.C.; McKenzie, B.M.; Sun, B.; Valentine, T.A.; Hallett, P.D. Soil tillage effects on the efficacy of cultivar and their mixtures in winter barley. Field Crops Res. 2012, 128, 91–100. [Google Scholar] [CrossRef]
- AHDB. Agriculture and Horticulture Development Board Recommended Lists for Cereals and Oilseeds 2016/17; AHDB Cereals & Oilseeds, Stoneleigh Park: Kenilworth, UK, 2016. [Google Scholar]
- McKenzie, B.M.; Stobart, R.; Brown, J.L.; George, T.S.; Morris, N.; Newton, A.C.; Valentine, T.A.; Hallett, P.D. Platforms to Test and Demonstrate Sustainable Soil Management: Integration of Major UK Field Experiments; AHDB Final Report RD-2012-3786; AHDB Cereals & Oilseeds, Stoneleigh Park: Kenilworth, UK, 2017. [Google Scholar]
- Sun, B.; Hallett, P.D.; Caul, S.; Daniell, T.J.; Hopkins, D.W. Distribution of soil carbon and microbial biomass in arable soils under different tillage regimes. Plant Soil 2011, 338, 17–25. [Google Scholar] [CrossRef]
- Sun, B.; Roberts, D.M.; Dennis, P.G.; Caul, S.; Daniell, T.J.; Hallett, P.D.; Hopkins, D.W. Microbial properties and nitrogen contents of arable soils under different tillage regimes. Soil Use Manag. 2014, 30, 152–159. [Google Scholar] [CrossRef]
- Newton, A.C.; Hackett, C.A. Subjective components of mildew assessment on spring barley. Eur. J. Plant Pathol. 1994, 100, 395–412. [Google Scholar] [CrossRef]
- Turkington, T.K.; Xi, K.; Clayton, G.W.; Burnett, P.A.; Klein-Gebbinck, H.W.; Lupwayi, N.Z.; Harker, K.N.; O’Donocan, J.T. Impact of crop management on leaf diseases in Alberta barley fields, 1995–1997. Can. J. Plant Pathol. 2006, 28, 441–449. [Google Scholar] [CrossRef]
- Fitt, B.D.L.; Atkins, S.D.; Fraaije, B.A.; Lucas, J.A.; Newton, A.C.; Looseley, M.; Werner, P.; Harrap, D.; Ashworth, M.; Southgate, J.; et al. Role of Inoculum Sources in Rhynchosporium Population Dynamics and Epidemics on Barley; HGCA Project Report No. 486; AHDB Cereals & Oilseeds, Stoneleigh Park: Kenilworth, UK, 2012; 46p. [Google Scholar]


| Cultivar | Trials | Pedigree a/Note | Breeder | |||
|---|---|---|---|---|---|---|
| 2013 | 2014 | 2015 | 2016 | |||
| Optic (Op) | + | + | + | + | (Corniche*Force)*Chad | New Farm Crops Ltd. (Syngenta) |
| Westminster (We) | + | + | + | + | NSL 97-5547*Barke | Nickerson (UK) Ltd. (Limagrain) |
| Waggon (Wa) | + | + | + | + | NFC 499-69*Vortex | Syngenta Netherlands |
| Concerto (Co) | + | + | + | + | Minstrel*Westminster c | Limagrain |
| Op/Wa | + | + | + | - | (Equal component mixture) | Syngenta |
| Op/We | + | + | + | - | (Equal component mixture) | Syngenta/Limagrain |
| Op/Co | + | + | + | - | (Equal component mixture) | Syngenta/Limagrain |
| Wa/We | + | + | + | - | (Equal component mixture) | Syngenta/Limagrain |
| Wa/Co | + | + | + | - | (Equal component mixture) | Syngenta/Limagrain |
| We/Co | + | + | + | - | (Equal component mixture) | Limagrain |
| Op/We/Wa/Co | + | + | + | + | (Equal component mixture) | Syngenta/Limagrain |
| T-short root hairs-R c | + | + | + | + | EMS mutant | - |
| Q-no root hairs-S c | + | + | + | + | EMS mutant | - |
| V-short root hairs-R c | + | + | + | + | EMS mutant | - |
| Propino | + | + | + | + | Quench*NFC Tipple b | Syngenta |
| Appaloosa | + | + | + | + | 493113-502*Decanter | Nickerson-Advanta Seeds UK Ltd. (Limagrain) |
| Riviera | + | + | + | + | Stanza*Cebeco 8331 | PBI Cambridge Ltd. |
| Tocada | + | + | + | + | Henni*Pasadena | KWS |
| Kenia | + | + | + | + | Binder*Gull | Abed Plant Breeding Stn., Denmark |
| Morex | + | + | + | + | Cree*Bonanza | Dept Agri, University Minnesota |
| Aramir | + | + | + | + | Volla*Emir | Cebeco, Netherlands |
| Bowman | + | + | + | + | ((Klages*(Fergus*Nordic))*ND 1156)*Hector | North Dakota Agri Exp Stn |
| Troon | + | + | + | + | Extract*NSL 95-2949 | Nickerson (UK) Ltd. (Limagrain) |
| Vada | + | + | + | + | H.laevigatum*Gull | Instituut de Haaff, Netherlands |
| Decanter | + | + | + | + | Heron*Dallas | Limagrain |
| Golden Promise | + | + | + | + | Maythorpe Gamma-Ray Mutant | Zenica |
| Carlsberg | + | + | + | + | Prentice*Maja | Carlsberg |
| NFC Tipple | + | + | + | + | (NFC 497-12*Cork)*Vortex | New Farm Crops Ltd. (Syngenta) |
| Melius | + | + | + | + | Conchita*TamTam | Syngenta |
| Prestige | + | + | + | - | (Bohemian Wheat*Rye)*(Ble de Domes*Garnet) | PBI Cambridge Ltd. |
| Carafe | + | + | + | - | (Linden*Cooper)*Extract | New Farm Crops Ltd. (Syngenta) |
| Scarlett | + | + | + | - | Amazona (Breun ST 2730e*Kym) | Bruen |
| Derkado | + | + | + | - | Lada*Salome | VEB Berlin |
| B83/12/21/5 | + | + | + | - | Thurso*Esk | Scottish Crop Research Institute |
| RGT Planet | - | - | - | + | Concerto*TamTam | RAGT |
| KWS Sassy | - | - | - | + | Publican*Concerto | KWS |
| Olympus | - | - | - | + | Genie*Tesla | Limagrain |
| Octavia | - | - | - | + | Odyssey*SY Universal | Limagrain |
| Sienna | - | - | - | + | Chronicle*Genie | Limagrain |
| Odyssey | - | - | - | + | Concerto*Quench | Limagrain |
| Origin | - | - | - | + | NSL07-8113-B*Tesla | Limagrain |
| Fairing | - | - | - | + | 144-02-4*Titouan | Syngenta |
| Belgravia | - | - | - | + | Minstrel*Westminster b | Limagrain |
| Ovation | - | - | - | + | Tesla*Odyssey | Limagrain |
| Scholar | - | - | - | + | Summit*SJ056065 | Syngenta |
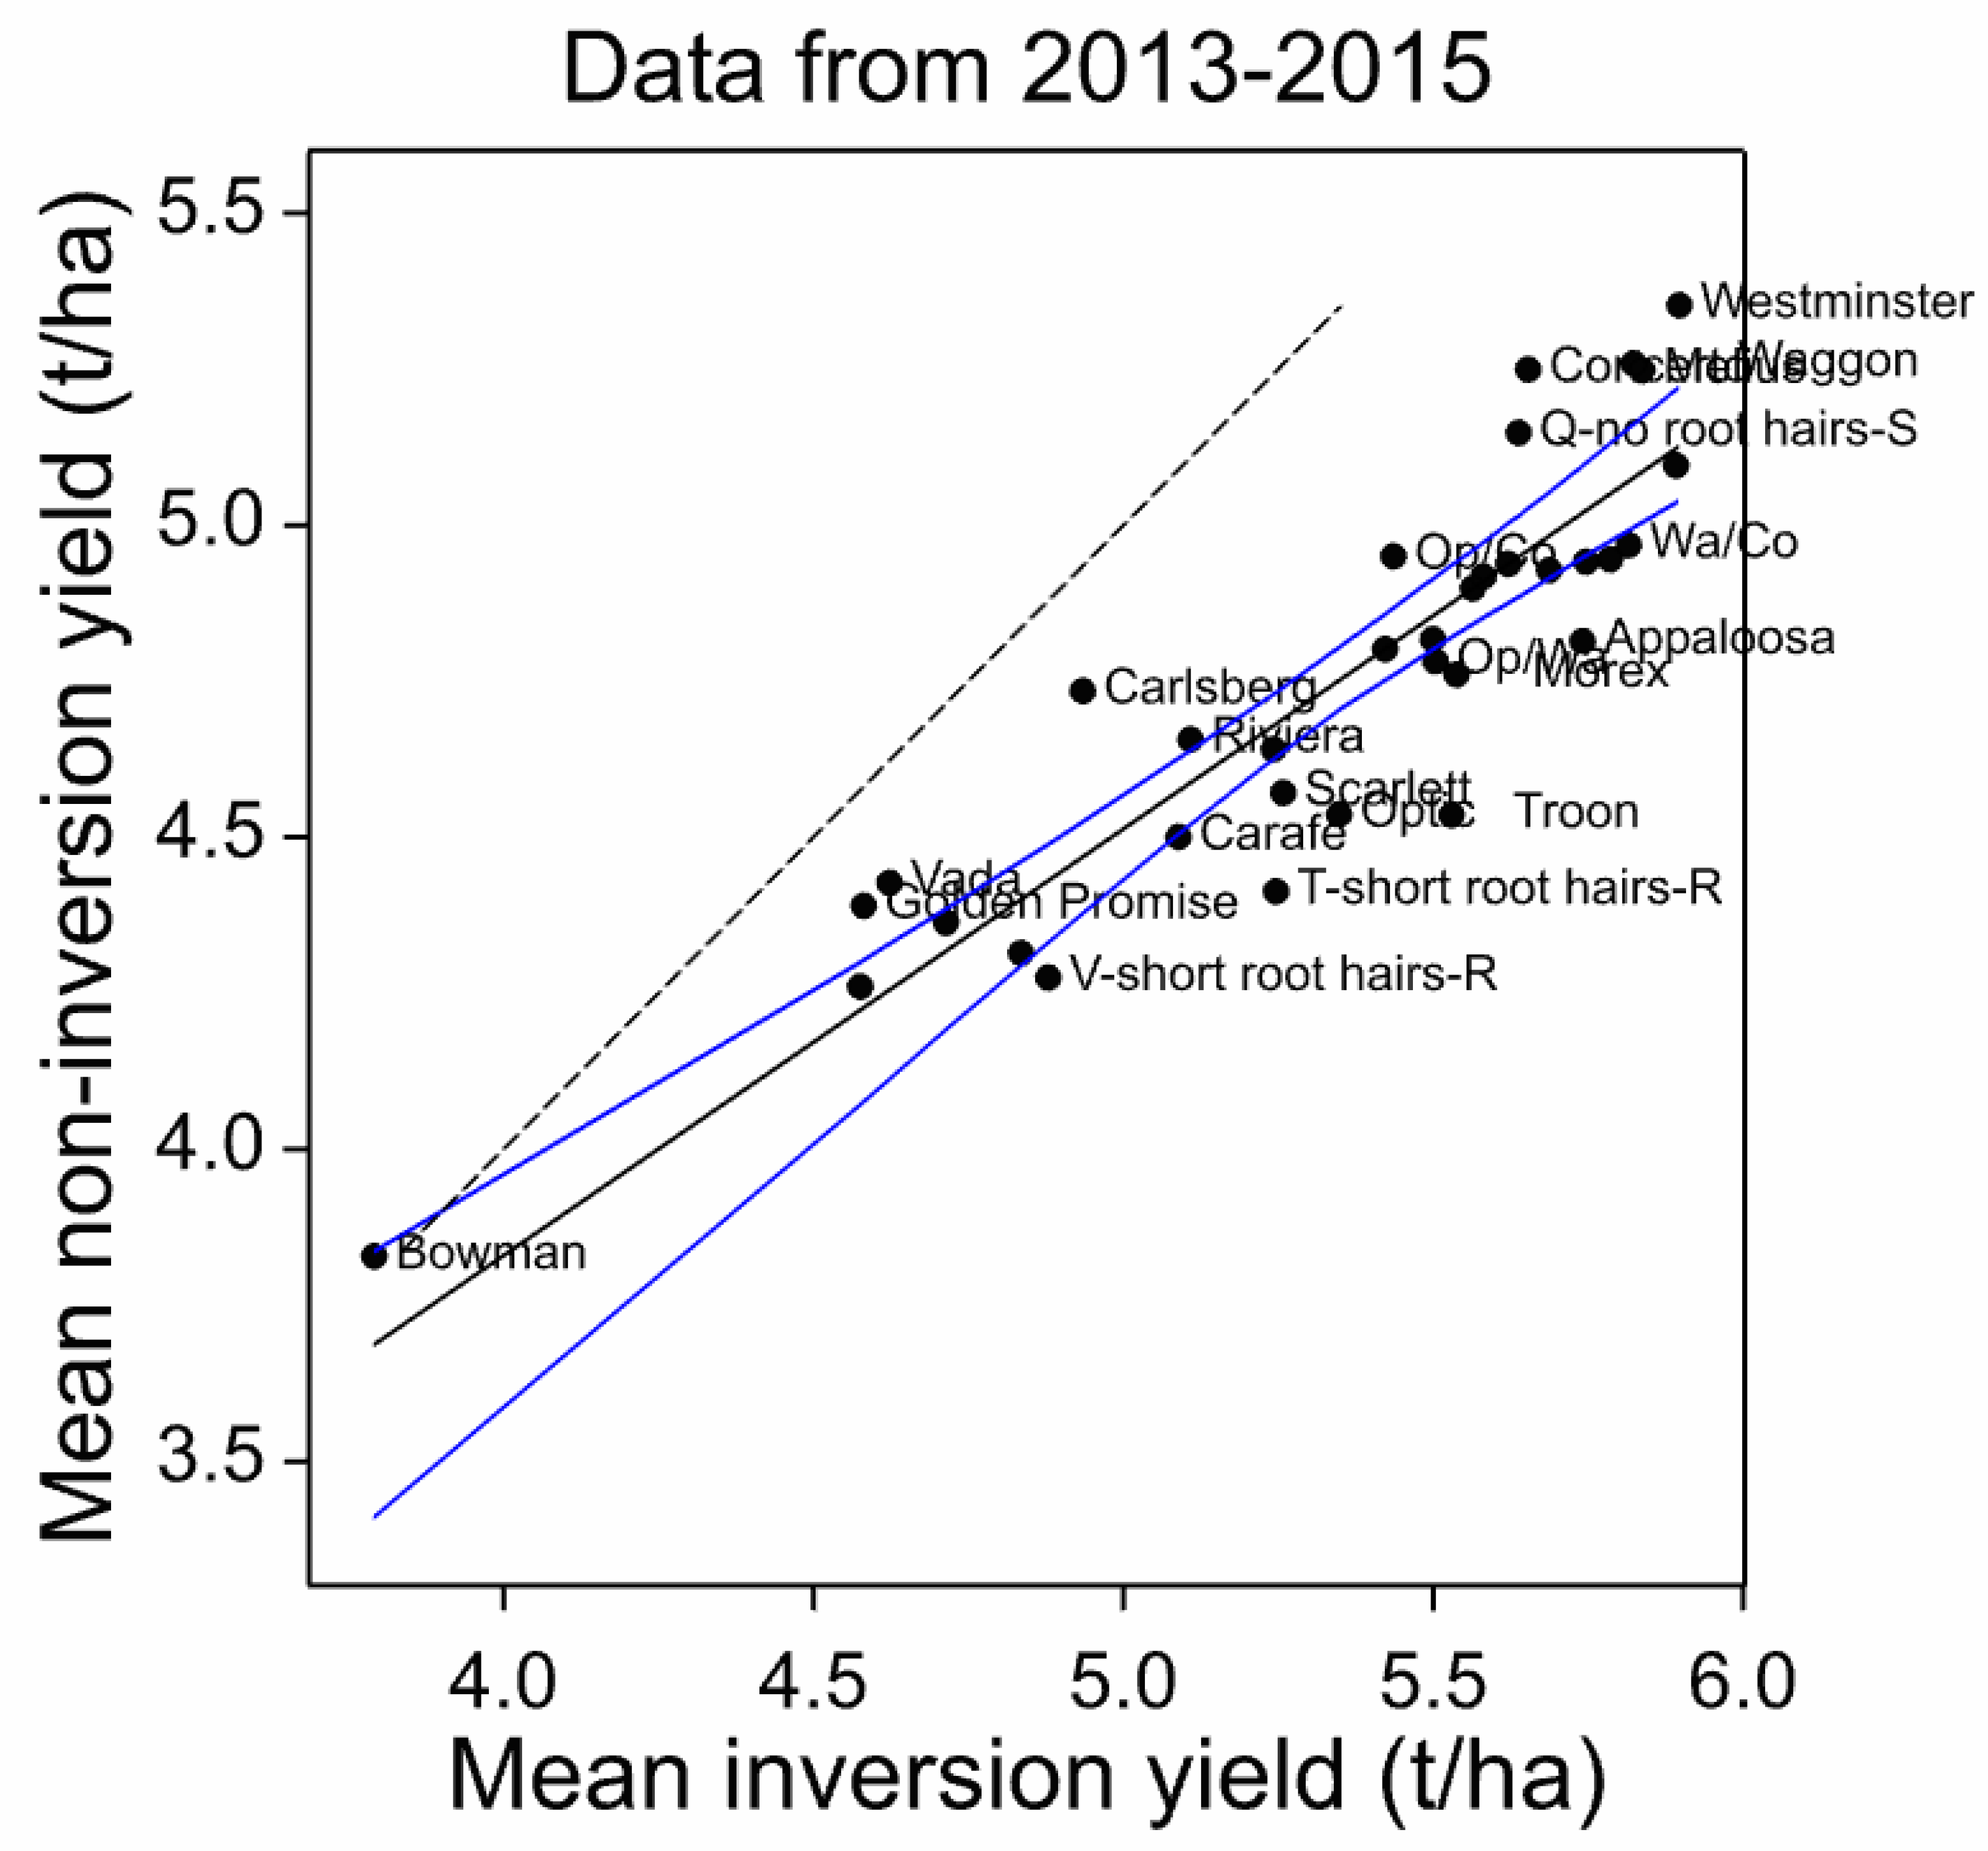
| Cultivar | Yield Inv. | Yield Non-Inv. | Rank Inv. | Rank: Non-Inv. | Rank Diff. | Yield Diff. Percent |
|---|---|---|---|---|---|---|
| Inversion-adapted | ||||||
| Troon | 5.53 | 4.54 | 16 | 25 | −9 | 17.98 |
| Appaloosa | 5.74 | 4.81 | 8 | 16 | −8 | 16.14 |
| T-short root hairs-R | 5.25 | 4.41 | 23 | 28 | −5 | 15.88 |
| Morex | 5.54 | 4.76 | 15 | 19 | −4 | 14.03 |
| V-short root hairs-R | 4.88 | 4.28 | 28 | 32 | −4 | 12.38 |
| Wa/We | 5.89 | 5.10 | 2 | 6 | −4 | 13.51 |
| Op/We | 5.69 | 4.93 | 9 | 12 | −3 | 13.35 |
| Optic | 5.35 | 4.54 | 21 | 24 | −3 | 15.17 |
| Propino | 5.79 | 4.95 | 6 | 9 | −3 | 14.53 |
| We/Co | 5.75 | 4.94 | 7 | 10 | −3 | 14.01 |
| Derkado | 4.83 | 4.31 | 29 | 31 | −2 | 10.76 |
| Wa/Co | 5.82 | 4.97 | 5 | 7 | −2 | 14.57 |
| Melius | 5.84 | 5.25 | 3 | 4 | −1 | 10.10 |
| Op/Wa | 5.50 | 4.78 | 17 | 18 | −1 | 13.11 |
| Scarlett | 5.26 | 4.57 | 22 | 23 | −1 | 13.06 |
| Aramir | 4.58 | 4.26 | 33 | 33 | 0 | 6.89 |
| Bowman | 3.79 | 3.83 | 34 | 34 | 0 | −0.98 |
| Carafe | 5.09 | 4.50 | 26 | 26 | 0 | 11.56 |
| Kennia | 4.71 | 4.36 | 30 | 30 | 0 | 7.44 |
| NFC Tipple | 5.56 | 4.90 | 14 | 14 | 0 | 11.95 |
| Tocada | 5.58 | 4.92 | 13 | 13 | 0 | 11.88 |
| Westminster | 5.90 | 5.35 | 1 | 1 | 0 | 9.24 |
| Op/We/Wa/Co | 5.62 | 4.94 | 12 | 11 | 1 | 12.16 |
| Prestige | 5.24 | 4.64 | 24 | 22 | 2 | 11.47 |
| Waggon | 5.82 | 5.26 | 4 | 2 | 2 | 9.69 |
| B83-12/21/5 | 5.50 | 4.82 | 18 | 15 | 3 | 12.41 |
| Decanter | 5.42 | 4.80 | 20 | 17 | 3 | 11.45 |
| Golden Promise | 4.58 | 4.39 | 32 | 29 | 3 | 4.17 |
| Riviera | 5.11 | 4.66 | 25 | 21 | 4 | 8.84 |
| Vada | 4.62 | 4.43 | 31 | 27 | 4 | 4.24 |
| Q-no root hairs-S | 5.64 | 5.15 | 11 | 5 | 6 | 8.69 |
| Carlsberg | 4.93 | 4.73 | 27 | 20 | 7 | 4.06 |
| Concerto | 5.65 | 5.25 | 10 | 3 | 7 | 7.14 |
| Op/Co | 5.44 | 4.95 | 19 | 8 | 11 | 8.94 |
| Non−inversion adapted |
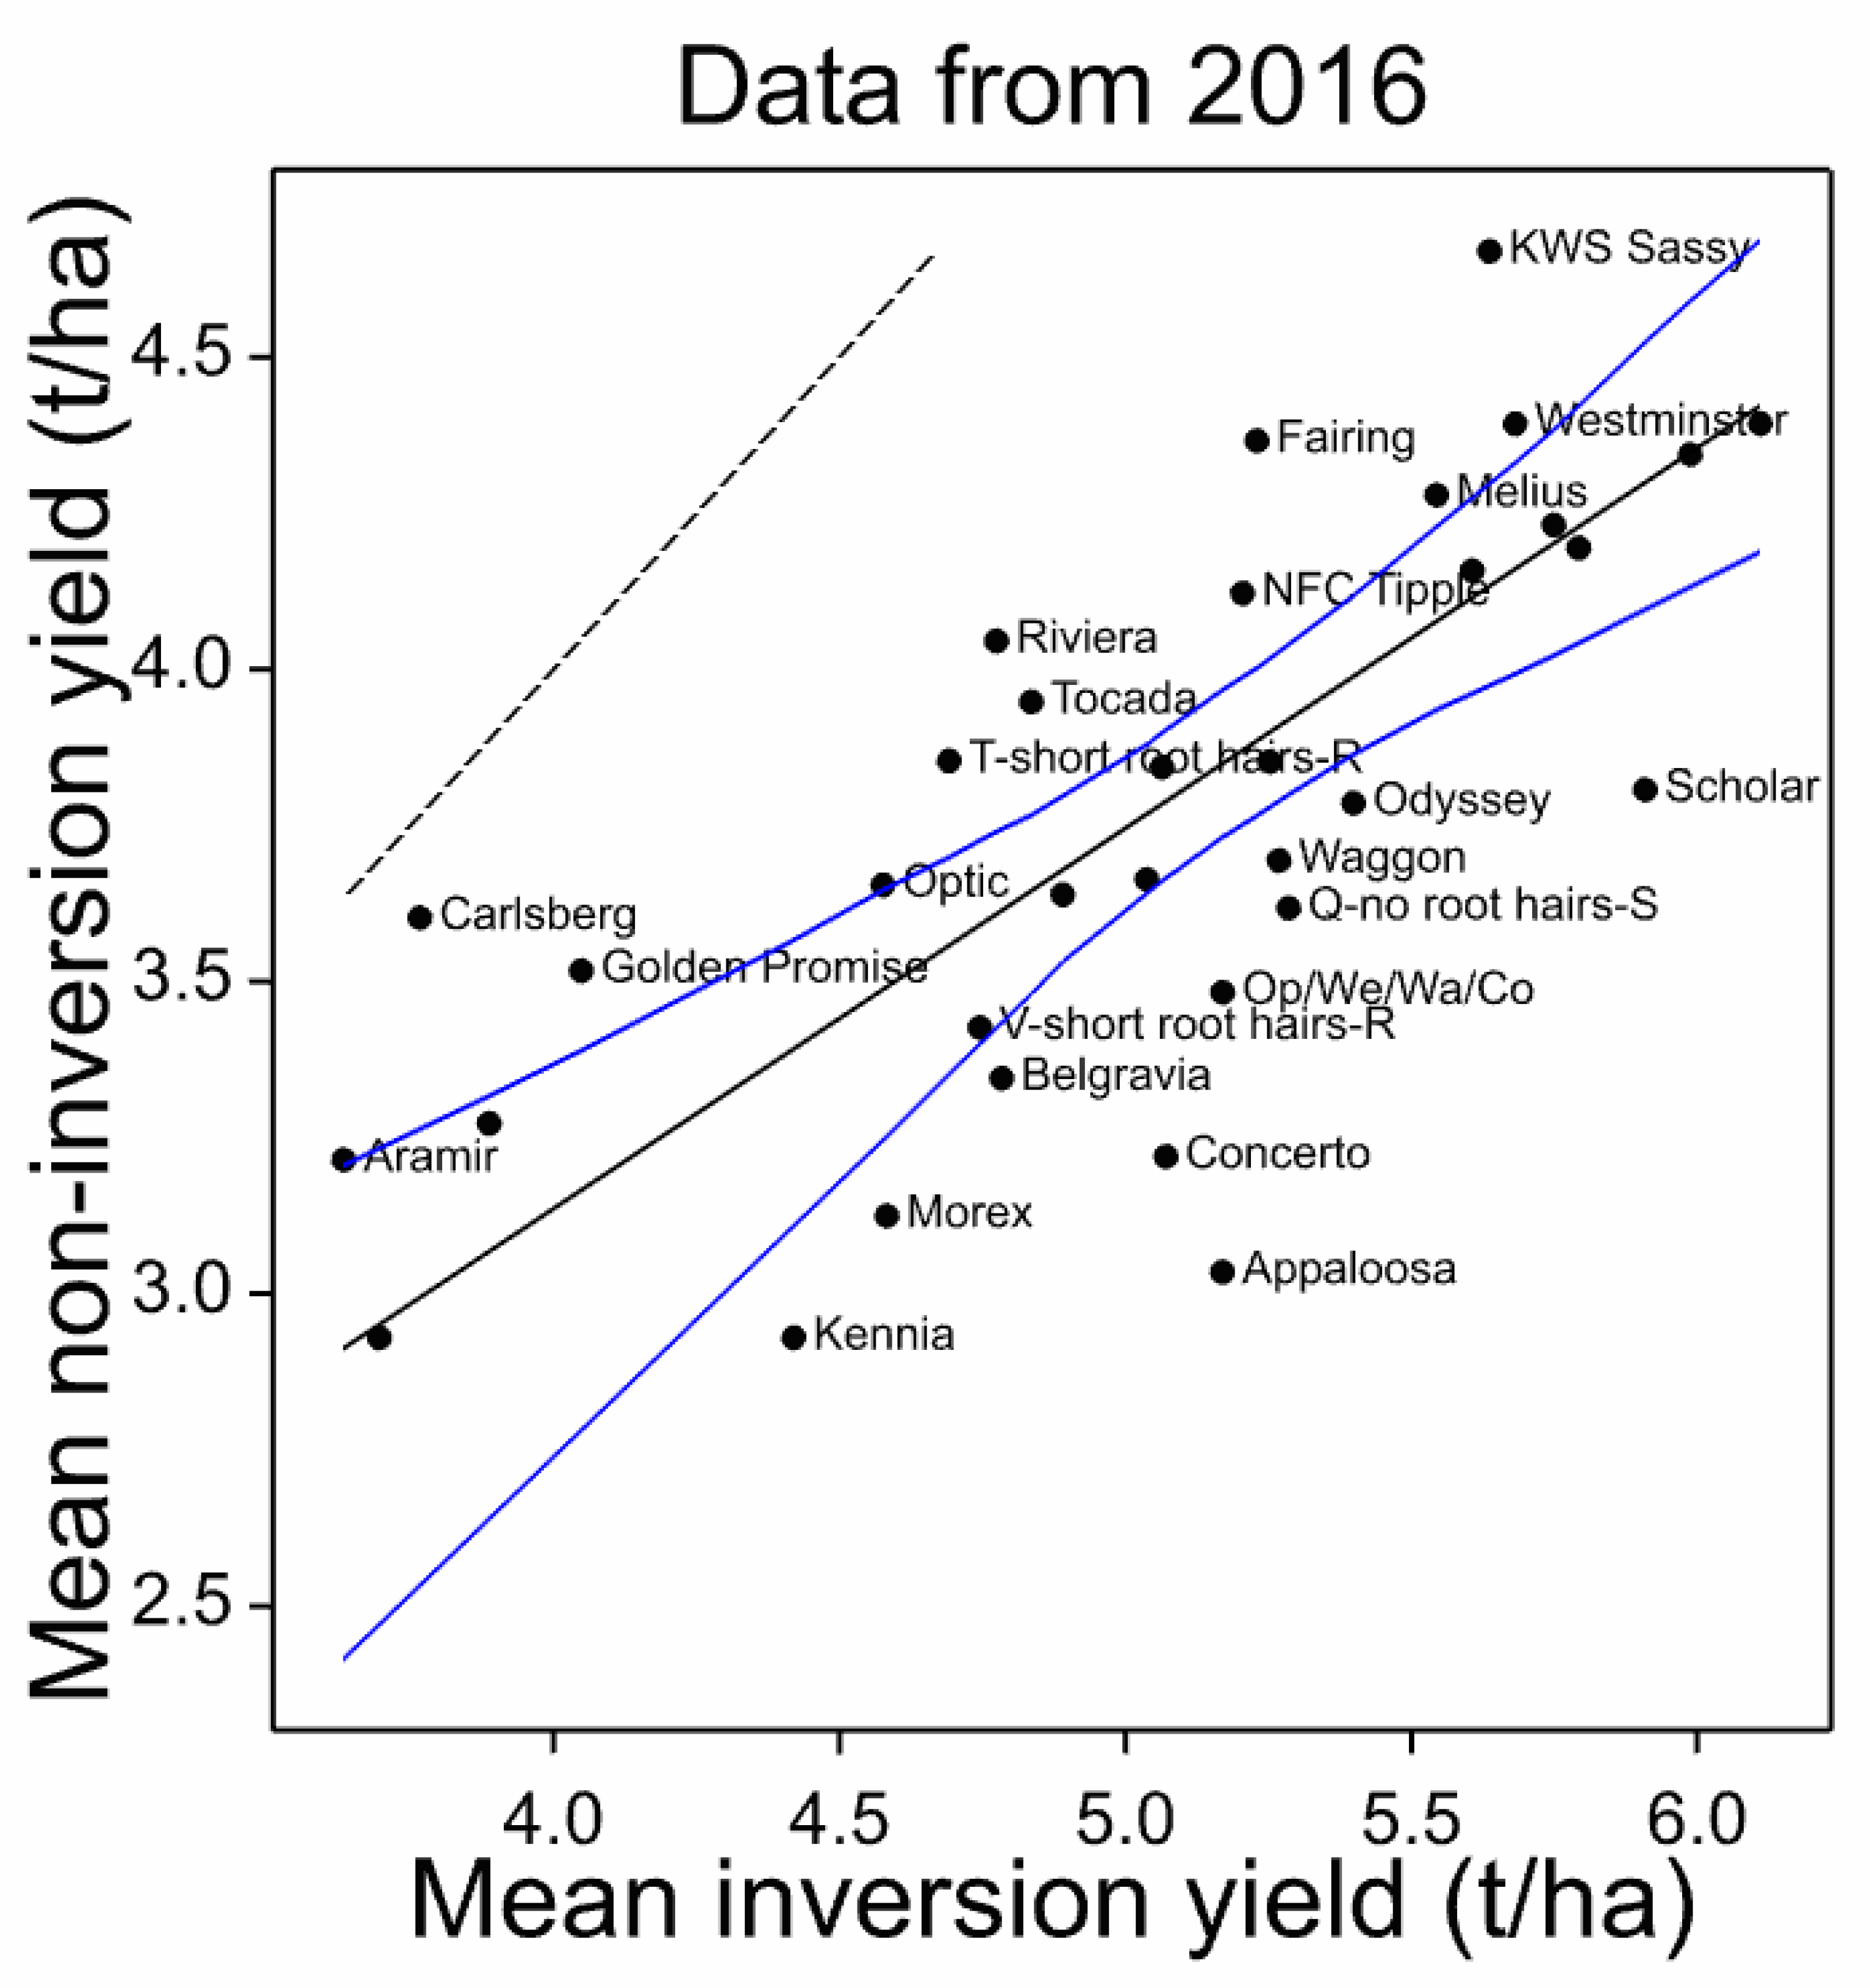
| Cultivar | Yield Inv. | Yield Non-Inv. | Rank Inv. | Rank: Non-Inv. | Rank Diff. Percent | Yield Diff. |
|---|---|---|---|---|---|---|
| Inversion-adapted | ||||||
| Appaloosa | 5.17 | 3.03 | 17 | 32 | −15 | 41.30 |
| Scholar | 5.91 | 3.81 | 3 | 16 | −13 | 35.57 |
| Concerto | 5.07 | 3.22 | 18 | 29 | −11 | 36.50 |
| Q-no root hairs-S | 5.29 | 3.62 | 11 | 22 | −11 | 31.55 |
| Op/We/Wa/Co | 5.17 | 3.48 | 16 | 25 | −9 | 32.64 |
| Odyssey | 5.40 | 3.79 | 10 | 17 | −7 | 29.88 |
| Waggon | 5.27 | 3.69 | 12 | 18 | −6 | 29.89 |
| Belgravia | 4.78 | 3.35 | 23 | 27 | −4 | 30.07 |
| Kennia | 4.42 | 2.93 | 29 | 33 | −4 | 33.71 |
| Morex | 4.58 | 3.12 | 27 | 31 | −4 | 31.81 |
| Olympus | 5.79 | 4.19 | 4 | 8 | −4 | 27.59 |
| Sienna | 5.99 | 4.34 | 2 | 5 | −3 | 27.45 |
| Origin | 5.75 | 4.23 | 5 | 7 | −2 | 26.40 |
| RGT Planet | 6.11 | 4.39 | 1 | 2.5 | −1.5 | 28.10 |
| Bowman | 3.70 | 2.93 | 33 | 34 | −1 | 20.72 |
| Octavia | 5.25 | 3.85 | 13 | 14 | −1 | 26.66 |
| Propino | 5.61 | 4.16 | 8 | 9 | −1 | 25.84 |
| V-short rt hrs-R | 4.75 | 3.43 | 25 | 26 | −1 | 27.80 |
| Decanter | 4.89 | 3.64 | 21 | 21 | 0 | 25.59 |
| Troon | 5.04 | 3.66 | 20 | 19 | 1 | 27.28 |
| Melius | 5.54 | 4.28 | 9 | 6 | 3 | 22.82 |
| Vada | 3.89 | 3.27 | 31 | 28 | 3 | 15.81 |
| Westminster | 5.68 | 4.39 | 6 | 2.5 | 3.5 | 22.68 |
| Aramir | 3.63 | 3.21 | 34 | 30 | 4 | 11.52 |
| Ovation | 5.06 | 3.84 | 19 | 15 | 4 | 24.10 |
| NFC Tipple | 5.20 | 4.12 | 15 | 10 | 5 | 20.81 |
| Golden Promise | 4.05 | 3.52 | 30 | 24 | 6 | 13.12 |
| KWS Sassy | 5.64 | 4.67 | 7 | 1 | 6 | 17.16 |
| Optic | 4.58 | 3.65 | 28 | 20 | 8 | 20.14 |
| Carlsberg | 3.77 | 3.60 | 32 | 23 | 9 | 4.35 |
| Fairing | 5.23 | 4.37 | 14 | 4 | 10 | 16.52 |
| Tocada | 4.84 | 3.95 | 22 | 12 | 10 | 18.36 |
| Riviera | 4.77 | 4.05 | 24 | 11 | 13 | 15.27 |
| T-short rt hrs-R | 4.69 | 3.85 | 26 | 13 | 13 | 17.87 |
| Non-inversion adapted |
| Rank Change | No. Cultivars | Cumulative | 50% | 90% | 95% |
|---|---|---|---|---|---|
| 0 | 7 | 34 | 34 | 34 | 34 |
| 1 | 4 | 27 | 28 | 30 | 31 |
| 2 | 4 | 23 | 19 | 23 | 24 |
| 3 | 7 | 19 | 13 | 17 | 18 |
| 4 | 5 | 12 | 9 | 12 | 13 |
| 5 | 1 | 7 | 6 | 9 | 10 |
| 6 | 1 | 6 | 4 | 6 | 7 |
| 7 | 2 | 5 | 2 | 4 | 5 |
| 8 | 1 | 3 | 1 | 3 | 4 |
| 9 | 1 | 2 | 1 | 2 | 3 |
| 11 | 1 | 1 | 0 | 1 | 1 |
| Rank Change | No. Cultivars | Cumulative | 50% | 90% | 95% |
|---|---|---|---|---|---|
| 0 | 1 | 34 | 34 | 34 | 34 |
| 1 | 5 | 33 | 29 | 32 | 32 |
| 2 | 2 | 28 | 21 | 25 | 25 |
| 3 | 3 | 26 | 15 | 19 | 20 |
| 4 | 6 | 23 | 11 | 15 | 16 |
| 5 | 2 | 17 | 8 | 11 | 12 |
| 6 | 3 | 15 | 5 | 8 | 9 |
| 7 | 1 | 12 | 3 | 6 | 7 |
| 8 | 1 | 11 | 2 | 4 | 5 |
| 9 | 2 | 10 | 1 | 3 | 4 |
| 10 | 2 | 8 | 1 | 2 | 3 |
| 11 | 2 | 6 | 0 | 1 | 2 |
| 13 | 3 | 4 | 0 | 1 | 1 |
| 15 | 1 | 1 | 0 | 0 | 0 |
© 2020 by the authors. Licensee MDPI, Basel, Switzerland. This article is an open access article distributed under the terms and conditions of the Creative Commons Attribution (CC BY) license (http://creativecommons.org/licenses/by/4.0/).
Share and Cite
Newton, A.C.; Valentine, T.A.; McKenzie, B.M.; George, T.S.; Guy, D.C.; Hackett, C.A. Identifying Spring Barley Cultivars with Differential Response to Tillage. Agronomy 2020, 10, 686. https://0-doi-org.brum.beds.ac.uk/10.3390/agronomy10050686
Newton AC, Valentine TA, McKenzie BM, George TS, Guy DC, Hackett CA. Identifying Spring Barley Cultivars with Differential Response to Tillage. Agronomy. 2020; 10(5):686. https://0-doi-org.brum.beds.ac.uk/10.3390/agronomy10050686
Chicago/Turabian StyleNewton, Adrian C., Tracy A Valentine, Blair M. McKenzie, Timothy S. George, David C. Guy, and Christine A. Hackett. 2020. "Identifying Spring Barley Cultivars with Differential Response to Tillage" Agronomy 10, no. 5: 686. https://0-doi-org.brum.beds.ac.uk/10.3390/agronomy10050686