Manipulation of Fruit Dry Matter via Seasonal Pruning and Its Relationship to d’Anjou Pear Yield and Fruit Quality


1
Tree Fruit Research & Extension Center, Washington State University, Wenatchee, WA 98801, USA
2
Department of Horticulture, Washington State University, Pullman, WA 99164, USA
*
Author to whom correspondence should be addressed.
†
These authors contributed equally to this work.
Agronomy 2020, 10(6), 897; https://0-doi-org.brum.beds.ac.uk/10.3390/agronomy10060897
Submission received: 27 May 2020
/
Revised: 17 June 2020
/
Accepted: 22 June 2020
/
Published: 24 June 2020
(This article belongs to the Special Issue In-Field Estimation of Fruit Quality and Quantity)
Abstract
:Orchard-side optimization of fruit quality is experiencing renewed research focus in the fresh fruit industry as new technologies and quality metrics have emerged to enhance consumer acceptance and satisfaction. Fruit dry matter, one such quality index gaining traction among numerous fresh fruit commodities, was targeted for improvement in d’Anjou pear with the application of seasonal pruning cycles (fall, fall and summer, winter, and winter and summer) across two growing seasons in 2016 and 2017 in a mid-aged, traditionally managed commercial orchard in the Columbia basin, Washington, USA. Dry matter was assessed non-destructively on pears using near-infrared spectroscopy at harvest and fruit categorized in to low (<13%), moderate (13–16%), and high (>16%) dry matter quality categories, revealing that fall pruning positively impacted average predicted fruit dry matter in comparison to winter pruning (15.1 vs. 14.2% in 2016 and 13.7 vs. 13.1% predicted dry matter in 2017 for winter vs. fall pruning, respectively), as well in the abundance of high dry matter fruits. The addition of summer pruning to either fall or winter pruning increased fruit size by up to 13% of proportion of fruits 80 mm or greater in diameter. Further, a tendency for summer pruning to decrease yield (up to nearly 30 kg/tree lower yields), average fruit dry matter (up to 0.5% lower average predicted dry matter), and abundance of high dry matter fruits (up to 11% fewer high predicted dry matter fruits) was observed. Fruit quality classes assembled on predicted dry matter verified the utility of this emerging parameter as a fruit quality metric for pears as demonstrated by more desirable post-harvest eating characteristics such as higher soluble solids content corresponding to greater at-harvest predicted dry matter categories. Targeted seasonal pruning in association with precise at-harvest dry matter fruit sorting may preserve the profitability of pear cultivation through their impact on fruit quality and associated consumer experiences.
Keywords:
dry matter; Pyrus communis; fruit quality; pruning; orchard management; at-harvest sorting1. Introduction
The North American pear industry is dominated by traditional orchard plantings (non-trellised, low- to medium-density plantings), cultural practices, and low-input technologies [1,2]. Low-density systems retain their viability in growing districts in the Pacific Northwest (PNW) where the use of modern dwarfing Quince rootstocks remains inadvisable due to winter frost risk and graft incompatibility issues [1,3,4]. These limitations on the use of dwarfing Quince rootstocks in pear cultivation in the PNW has resulted in the persistence of central- or multi-leader, open-vase orchards grafted on pear seedlings characterized by vigorous growth and dense canopies with wide variability in canopy light penetration and interception by the fruit [5,6,7]. Under these conditions, large labor inputs then become necessary to ensure optimal fruit growth with the active management of vigor, crop load, and light environment, namely in the form of seasonal pruning practices [8]. Further, the timing and intensity of management practices may have substantial consequences for flower bud formation, carbon partitioning, and fruit yield and quality [9,10,11], resulting in unpredictable consumer eating experiences.
One potential improvement in orchard management is considering the eating quality through the manipulation of dry matter partitioning to fruit [11]. Dry matter, emerging as a reliable quality index among numerous tree fruit commodities, is a measure of the amount of photosynthates (sugars) and derivative compounds (starches, proteins, structural carbohydrates, etc.) acquired from the leaves during photosynthesis as well as roots by nutrient uptake and transported to the fruit for storage and metabolism [12,13].
Gathering many of the physio-chemical attributes contributing to the sensory perception of texture, sweetness, and flavor, dry matter has been linked to positive consumer responses in European pears [14], as well as apple, cherry, and kiwifruit [13,15,16]. Additionally, higher dry matter fruits are more likely to be purchased relative to lower dry matter fruits for apple and kiwifruit [13,17], and consumers are willing to purchase high dry matter pears at higher prices [14]. Thus, it is of growing interest to producers and fruit industry to prioritize dry matter accumulation as an effective means of achieving higher quality yields.
Dry matter accumulation in the fruit is ultimately a product of within-canopy resource partitioning determined by the interaction between growth capacity (genetics), resource availability (environment), and inter-organ competition driven by source–sink relationships [18,19,20,21,22,23]. Among the various tools available to growers to manage these interactions, the most consequential to the accumulation of fruit dry matter in an established and mature orchard is perhaps the manipulation of canopy light dynamics (controlling excess of vigor) and crop load adjustments. Palmer et al. [24] demonstrated in apples that whole-tree shading reduced fruit dry matter in a magnitude proportional to the duration that the reduced light environment lasted, and Link [25] and Anthony et al. [26] showed that lower crop loads increase fruit dry matter. On the microclimate level, higher levels of light exposure on individual fruit have been shown to result in fruit with higher soluble solids content and dry matter in pear [7,27,28]. Dry matter may be rapidly and accurately assessed non-destructively with the use of near-infrared spectroscopy [29,30,31,32].
Precision timing and intensity of pruning may represent one solution to simultaneously address light dynamics, crop load, and vigor control for active dry matter management [9,10]. From the physiological point of view, pruning alters the tree’s ability to attain the essential resources (water, light, nutrients) to buildup dry matter and distribute and share carbohydrates, nutrients, and minerals between vegetative and reproductive organs of the plant [33].
Orchard pruning can be performed at different times of the season to obtain different physiological responses of the trees. Currently, winter pruning performed during dormancy is the most adopted practice to manage the balance of leaf:fruit ratio, reduce competition within the canopy, remove unproductive wood, and prioritize fruiting structures [9,34,35]. As an alternative, fall pruning performed approximately one month after harvest can affect spring growth through the reduction of vigor in new shoots leading to less competition for nutrients and water [36]. Furthermore, fall pruning increases light penetration into the canopy and enhances flower bud formation for the following crop [5,8,37,38], as flower bud differentiation and development is typically complete prior to dormancy release the following spring [39]. Bartolini et al. [40] carried out a study on floral differentiation in apricot and documented that in August and September (1–2 months post-harvest in the Northern Hemisphere) there is still a proportion of buds (10–20%) that have not yet differentiated. For this reason, highly shaded conditions (i.e., netting with high shading factor or dense canopies) can be detrimental to flower bud differentiation, while bringing more light (higher photosynthetic activity) inside the tree in fall has a beneficial effect toward the further development of flower buds. After harvest and early fall is the time of the year suggested by Elkins et al. [41] for pruning vigorous pear trees by mechanical hedger, as vigor is not high at this time of the growing season, while winter pruning is more suitable to promote growth in low-vigor trees.
Pruning during active fruit growth in the summer (late May or early June in the Northern Hemisphere) in addition to either fall or winter pruning may also provide a convenient solution to controlling tree vigor while prioritizing fruit quality. Mika [9] reported summer pruning as a technique adopted in dwarfing orchards to manage tree size while promoting use of carbon reserves held in the trunk, roots, and structural branches to support both vegetative and fruit growth. This kind of pruning in summer may also reduce the competition for resources between fruit and shoots [42] and can be repeatedly applied depending on vigor and management goals. Accordingly, Lakso and Grappadelli [10] and Lakso and Robinson [43] recommend summer pruning to increase light capture of spur leaves in apple to support carbon export to fruiting sites early in the growing season, approximately three to four weeks after full bloom. Summer pruning also allows a better penetration of spray treatments in the canopy and has a positive effect on reduction of pest pressure through the physical removal of feeding sites [44,45,46,47].
However, summer pruning may also negatively influence yield and fruit quality due to net diminution of whole-canopy leaf area and carbon capture [48], though there appears to be little consensus on this effect among studies due to variation in timing and intensity of pruning events. For instance, Ashraf et al. [49], Demirtas et al. [50], and Pramanick et al. [51] reported increases in soluble solids content following summer pruning for apple, apricot, and kiwifruit, respectively. However, several authors report either no impact [52,53] or a reduction in soluble solids with summer pruning [54,55]. Beyond sugar content, Ferree et al. [56] reported summer pruning as a tool to improve fruit quality in terms of higher overcolor and reduction of disorder (i.e., water core and cork spot). Storage quality of fruit may be increased by adoption of summer pruning as a practice to reduce physiological disorders such as bitter pit, internal breakdown, watercore and lenticel rots [9,57]. Shoots in fact compete with fruit for calcium, and this competition can promote the onset of bitter pit [58,59]. Notably, Autio and Greene [60] observed a lower yield in apple due to summer pruning, but a net increase in the number of profitable fruit due to better coloring and higher marketable fruit grades. Summer pruning may also alter floral bud initiation [9] with undesirable downstream implications on return bloom and subsequent yield as reported by Maas [61] and Asin et al. [62] for several pear cultivars, though Saure [57] reported some positive effects on flower bud development in a review on apple.
In this study, treatments of either traditional winter or fall pruning were applied individually or complementary to summer pruning (pre-harvest during active growth, i.e., late May or early June) in d’Anjou variety pear, the predominant variety cultivated in the Pacific Northwest (Oregon and Washington, USA) characterized by high vigor and delayed bearing [63]. Displaying similarities to Type 4 cultivars classified on the basis on bearing wood such as cv. Bosc, d’Anjou shows the tendency to crop mainly (>70% crop) on spurs on older wood with good fruit set [64,65]. For this reason, the pruning strategy and intensity employed was tailored to vigor and specific fruiting habit with an emphasis on increasing light penetration to fruiting sites and spur shoots to achieve a good fruit set, higher fruit dry matter accumulation, and valuable (70 mm or greater) fruit size [7,9,64,66,67]. Vegetative growth, bloom, and yield were monitored across two growing seasons with a focus on distribution of size and dry matter classifications in the fruit as assed using near-infrared spectroscopy at harvest. Pear quality was evaluated both one month after harvest and following five months of cold storage, the results of which are discussed in the context of achieving more desirable consumer outcomes based on fruit dry matter as influenced by seasonal pruning practices.
2. Materials and Methods
2.1. Pruning and Vegetative Growth
This study was conducted across two consecutive growing seasons and harvests (2016 and 2017) in an established commercial orchard located in Cashmere, Washington, USA (47.52° N, 120.51° W). The orchard, planted in 1998, consisted of central leader d’Anjou/OHF87 trees spaced at 4.3 m (inter-row) by 2.5 m (957 trees ha−1). Beginning in October (Fall) 2015 through harvest in September 2017, trees were subjected to one of four seasonal pruning treatments: (1) fall pruning (“F”, October/November), (2) fall and summer pruning (“F+S”, October/November and June), (3) winter pruning (“W”, March), and (4) winter and summer pruning (“W+S”, March and June). Each treatment was represented by four trees of equal age and management history except for winter “W” pruning treatment represented by only three trees in 2016 with the addition of a fourth in 2017.
Tree growth was monitored incrementally by recording trunk diameter 10 cm above the root crown and expressed as trunk cross-sectional area (TCSA, cm2). Pruning was conducted by hand with an emphasis on removing (1) competitive vertical shoots (“watersprouts”, strong vertical shoots originating from severe pruning and not contributing photosynthates to neighboring fruit—Mika [9]) and (2) crowded horizontal branches to improve light penetration in the canopy. For the second pruning cycle beginning in Fall 2016, cut material was collected and weighed for each tree. During summer pruning, material was classified as either fruit, leaves, one-year-old shoots, and wood, and weighed for each tree.
2.2. Flowering, Fruit Set, and Yield
In the second year of observation, bloom density was recorded in spring (29 March 2017) as the number of inflorescences contained within a cubic meter quadrat suspended in the canopy approximately 65 cm above the ground. Measurements were taken on opposing east and west aspects of the canopy and averaged together to provide a single tree estimate (number flower clusters m−3). Simultaneously, several branches (1–3 branches/tree in order to reach at least 50 flower clusters/treatment) randomly selected in the canopy of each tree were monitored for fruit set (%, assuming six flowers per cluster in d’Anjou; Figure S1) denoted by the number of developing pears retained through mid-May (18 May 2017). Harvest of the experimental trees took place 18 and 19 August 2016 and 11 and 12 September 2017 in accordance with commercial maturity standards. The whole production of each tree was harvested, weighed, and evaluated for the gross incidence of the external defect of sunburn the same day of harvest (Figure S2).
2.3. Fruit Size and Dry Matter Distribution
Immediately following harvest, fruit were sized and, from this, representative subsamples from each tree (totaling approx. 500 pears/treatment in 2016 and 300 pears/treatment in 2017) of market quality fruit 70 mm or greater in diameter were selected and evaluated non-destructively for predicted dry matter using a near-infrared spectrometer (F-750 Produce Quality Meter, Felix Instruments, Camas, WA, USA [14,32,68]). Predictive models used in the estimation of fruit dry matter were designed specifically for use on d’Anjou variety grown in the PNW and were shown to be highly accurate, demonstrating a 0.29 and 0.34 root mean squared error (RMSE) at the time of calibration for models employed for 2016 and 2017 harvest, respectively. A detailed account of calibration procedures and model performance is described in Goke et al. [68]. Representing an industry sorting stage, stratified random samples of low (<13%), moderate (13–16%), and high (>16%) predicted dry matter fruit from the pool of the experimental trees were selected and cold-stored in regular atmosphere cold (≈ 1 °C) until instrumental fruit quality evaluation.
2.4. Fruit Quality
Instrumental fruit quality was evaluated at two stages—first within one month after harvest (“one mo. post-harvest”), and secondly at five months after harvest representing a consumer stage once the necessary chilling requirement [69,70] had been satisfied for the d’Anjou variety (“5 mos. post-harvest”). Before instrumental assessments, fruit at both stages were ripened for seven days at room temperature (≈23 °C [71,72]) to achieve a more consistent maturity similar to the consumer eating experience. At each pullout, pears were individually weighed and evaluated for ripeness as non-destructively estimated via the index of absorbance difference (IAD) between 670 and 720 nm as an estimate of chlorophyll concentration in the outer part of the flesh of unpeeled fruit (DA Meter, T.R. Turoni Srl, Forli, Italy; [73]). Peel color was described from the most representative background color or non-blush (i.e., least red pigmented) region of each fruit using a Minolta colorimeter acquiring in the CIELAB color space (Minolta CR-300, Minolta Co. Ltd., Tokyo, Japan) and expressed as hue angle (h°) and chroma (C*) as described by McGuire [74]. A hue angle of 0° represents red color and increases to yellow (90°) and green (180°), while C* quantifies the intensity of the hue where greater values indicate saturation.
For instrumental characterization of internal quality, fruit firmness was determined on opposing sides of each fruit immediately below the peel with an 8-mm-diameter penetrometer probe and averaged together for one estimate per fruit (Fruit Texture Analyzer, GUSS, Strand, South Africa). Actual fruit dry matter (DM) was evaluated by oven drying at 60 °C (VWR 89511 forced-air oven, VWR, Rednor, PA, USA) an approximately 15–25 g peeled and cored vertical slice of pear fruit to constant weight and expressed as a percentage of the fresh weight. Soluble solids content (SSC) was measured with a temperature-compensating refractometer on the juices extracted from each fruit tissue using a filter-lined garlic press (PAL-1, ATAGO USA Inc, Bellevue, WA, USA). Finally, replicates of several fruit belonging to each dry matter category (3–7 pears/category) were combined and juiced for determination of titratable acidity (TA;% malic acid, n = 3/predicted dry matter category/pruning treatment) using a Titrando titrator (Metrohm AG, Herisau, Switzerland). During the one month post-harvest evaluation stage, fruit were evaluated for disorders and expressed as the gross incidence of cork spot (Figure S3), and both cork spot and superficial scald at the five months post-harvest evaluation stage (Figure S4).
2.5. Statistical Methods
Differences in tree growth, flowering and fruit set, yield, and fruit quality were analyzed among production years, pruning treatments, and dry matter categories using analysis of variance (ANOVA) followed by Tukey HSD means separation. All analyses were conducted in R v. 3.6 [75].
3. Results
3.1. Pruning and Vegetative Growth
Over the course of two growing seasons, winter (W) and winter and summer (W+S) treatments averaged marginally larger TCSA increments relative to fall (F) and fall and summer (F+S) treatments (Figure 1). However, these patterns in TCSA increase did not differ significantly among pruning treatments for all measured dates (Figure 1).
The amount of material cut during application of pruning treatments varied both within most individual pruning events as well as cumulatively when considering the pruning cycle preceding the harvest of 2017 (Fall 2016 to Summer 2017 pruning events). For treatments coupled with summer pruning, winter and summer (W+S) pruning resulted in significantly higher amounts of both leaf materials and first year shoot removed relative to fall and summer pruning (F+S, Figure 2). The average amount of fruit and wood material removed during summer pruning in 2017 from F+S and W+S pruning treatments did not differ significantly, though slightly more wood on average was removed from W+S treatment than F+S (Figure 2). Summer pruning when added to the previously conducted fall or winter pruning (together fall and summer, F+S, or winter and summer, W+S) tended to lower the amount of pruned branch material pruned (wood, Figure 2). This effect resulted in significantly less material cut for W+S during winter pruning, though also nearly significant (p = 0.0563) for F+S pruning treatment during fall pruning relative to the non-summer pruned treatments (Figure 2). Cumulatively, and irrespective of pruned material type, W followed by W+S pruning treatments resulted in a significantly larger cumulative amount of removed material compared to F and F+S pruning (Figure 2).
3.2. Flowering, Fruit Set, and Yield
In the second year of application of these pruning practices (2017), flower cluster density did not differ significantly among pruning treatments, though fall-pruned trees (F) tended to have a higher average flower cluster density (Figure S1). Fruit production in terms of average total yield (kg fruit/tree), yield efficiency (kg fruit/tree TCSA [cm2]−1), and average fruit weight (g) were substantially different and in many cases to a significant degree by the applied pruning treatments in both 2016 and 2017 harvests (Figure 3). Broadly, F pruning showed a tendency for larger yields relative to W pruning treatments with a significant greater yield efficiency in 2016 (0.28 and 0.18 kg fruit/tree ∙TCSA [cm2]−1) for F and W pruning, respectively. In 2017, both yield (92.1 and 54.6 kg/tree for F and W pruning, respectively) and yield efficiency (0.40 and 0.16 kg fruit/tree TCSA [cm2]−1 for F and W pruning, respectively) were significantly different (Figure 3). However, larger yields and higher yield efficiencies tended towards lower average fruit weights with F pruning having lower average fruit weights (193 and 202 g mean fruit weight in 2016 and 2017, respectively) than W pruning treatment (203 and 215 g mean fruit weight in 2016 and 2017, respectively, Figure 3).
The addition of S pruning to either F (together F+S) or W (together W+S) pruning treatments tended to lower the observed average yield and yield efficiencies, an effect that was significant in 2017 (Figure 3). The addition of a S pruning application to F pruning (together F+S) averaged a 4.5-kg lower yield in 2016 and 29.9 kg in 2017, though averaged a 15.4-g greater fruit weight in 2016 and 28.1 g in 2017 (Figure 3). Similarly, the addition of a S pruning application to W (together W+S) pruning averaged a 14.0-kg lower yield in 2016 and 10.1 kg in 2017, though averaged a 16.4-g greater fruit weight in 2016 and 2.5 g in 2017 (Figure 3). Overall in both years, the greatest average yields were found in F pruned trees (60.5 and 92.1 kg/tree in 2016 and 2017, respectively) as well as the greatest yield efficiencies (0.28 and 0.40 kg fruit/tree ∙ TCSA [cm2]−1 in 2016 and 2017, respectively), while the highest average fruit weight was reported in 2016 for fruits from W+S pruned trees (219 g) and in 2017 for the fruits from F+S pruned trees (230 g).
3.3. Fruit Size and Dry Matter Distribution
In both years of harvest, the distribution of fruit size at harvest appeared to respond to pruning treatments (Figure 4). While the greatest proportions of fruit were classified as average 70–75 mm among all treatments, a somewhat larger proportion of fruits 80 mm or greater in diameter were produced in winter pruning treatments relative to fall pruning treatments (Figure 4). The 6.4 and 13.6% of fruits were 80 mm or greater for W pruning treatments in 2016 and 2017, respectively, whereas 4.0 and 8.2% of fruits were 80 mm or greater for F pruning treatments in 2016 and 2017, respectively (Figure 4). The addition of summer pruning to either fall or winter pruning tended to increase the proportion of these larger-sized 80+ mm fruits. There was a 6.0 and 1.7% higher average proportion of 80 mm or greater fruits for W+S pruning compared to W pruning alone in 2016 and 2017, respectively, and 4.7 and 13.3% more F+S pruning treatment relative to F pruning alone in 2016 and 2017, respectively (Figure 4).
Predicted fruit dry matter when assessed non-destructively at harvest also significantly varied in response to pruning treatments (Figure 5). The distribution of predicted dry matter for F pruned trees skewed towards higher dry matter content fruit relative to W pruning. This is shown by 15.1 vs. 14.2% mean predicted dry matter in 2016 and 13.7 vs. 13.1% mean predicted dry matter for F vs. W pruning treatments, respectively (Figure 5). Summer pruning in combination with either fall or winter pruning averaged 0.5 and 0.2% lower predicted dry matter in F+S pruning treatment relative to F pruning alone in 2016 and 2017, respectively, and 0.1 and 0.3% lower predicted dry matter for W+S pruning compared to W pruning alone in 2016 and 2017, respectively (Figure 5). Overall, the average predicted dry matter was significantly different among pruning treatments, though W and W+S pruning treatments were not statistically unique from one another in 2016 though significantly lower than either F or F+S pruning (Figure 5). Similarly, F and F+S pruning treatments were not statistically unique from each other in 2017 though still significantly different than either W or W+S pruning (Figure 5). F pruning exhibited the greatest average predicted dry matter among all treatments in both years (Figure 5).
When sorted into groups of predicted dry matter categories, pruning treatments tended to influence the proportions of fruit of the overall crop belonging to each category (Figure 6). In 2016, F pruning had significantly greater average proportions of high (>16%) predicted dry matter fruits than either W and W+S pruning treatments (18, 3, and 2%, respectively, Figure 6). F+S pruning displayed an intermediate (7%) average proportion of high (>16%) dry matter fruit not significantly different from either F or W and W+S treatments (Figure 6). In 2017, an average of less than 1% of fruits were classified as high (>16%) predicted dry matter by F and F+S pruning treatments, while W and W+S did not produce any fruits classified as high predicted dry matter (Figure 6). Within the moderate (13–16%) predicted dry matter category in 2017, there were significantly higher proportions for F and F+S pruning relative to W+S pruning treatments (76, 73, and 47%, respectively, Figure 6). Winter pruning (W) displayed an intermediate (55%) average proportion of moderate dry matter fruit not significantly different from either F or F+S and W+S treatments in 2017. W+S pruning produced a significantly larger average proportion (53%) of fruit belonging to the low (<13%) predicted dry matter category in 2017, while F pruning produced the smallest average proportion (24%) of fruit in this category (Figure 6). W and F+S pruning produced intermediate average proportions of low (<13%) predicted dry matter fruits in 2017 (45 and 26%, respectively, Figure 6).
3.4. Fruit Quality
Instrumental fruit quality tended to vary as a factor of both pruning treatment and dry matter classification. In terms of pruning treatments, the index of absorbance difference (IAD) averaged higher in treatments including summer pruning (F+S and W+S), indicating these pears were less ripe one month post-harvest in both years than the non-summer-pruned treatments, with F pruning having pears most ripe after one month post-harvest and to a significant degree in 2016 though not in 2017 (Table 1). This trend was not maintained five months post-harvest, where fall-pruned treatments evolved to be generally more ripe (lower IAD values) than winter-pruned counterpart treatments, confirmed also by the least green background color (lowest hue values, Table 1). The percentage of blush overcolor did not show reliable patterns across the four pruning treatments in both years (Table 1). Pigmentation (hue and chroma of background color) varied significantly among pruning treatments, but not reliably from year to year or between one and five months post-harvest evaluation periods (Table 1).
After one month post-harvest (within one month after harvest in cold storage plus seven days of room temperature ripening), fruit firmness was on average greater in both 2016 and 2017 (though not uniquely significant) in summer pruning treatments (F+S versus F and W+S versus W), though after five months post-harvest in cold storage plus seven days of room temperature ripening these patterns were not retained (Figure 7 and Figure 8). Soluble solids content had the highest average in F pruning, followed by F+S, W, and W+S pruning in both years and at both stages of evaluation and to a significant degree (Figure 7 and Figure 8). Acidity did not display clear patterns among pruning treatments in both 2016 and 2017 (Figure 7 and Figure 8).
At harvest gross incidence of defects reported approximately a 2% of pears afflicted by sunburn with no macroscopic differences between the treatments in 2016, while in 2017 sunburn was almost absent (Figure S2). Gross incidence of cork spot one month post-harvest showed that pears picked from winter-pruned trees had the tendency to present more cork than fruit from fall pruned trees (approximately 12% vs. 5% in winter vs. fall pruned trees, respectively, Figure S3). During the five months post-harvest assessment, another percentage of pears reported visible cork spot (not noticeable at harvest), and in particular in the F+S pruning treatment (Figure S4). Superficial scald afflicted about 50% of the pears five months post-harvest (Figure S4).
Irrespective of pruning treatment, chlorophyll content measured as the index of absorbance difference (IAD) was significantly higher in low (<13%) predicted dry matter categories at both evaluation stages (one and five months post-harvest) in both harvest years, indicating these pears were less ripe than those belonging to the moderate (13–16%) or high (>16%) predicted matter classes (Table 2). In terms of coloration, low dry matter fruits exhibited significantly less percentage of overcolor blush (ranging around 2–4%), with a greater background color hue angle (°h), indicating a greener pigmentation both one and five months post-harvest in both harvest years, though hue angle did not differ significantly one month post-harvest in 2017 (Table 2). The intensity of the hue (chroma, *C) did not vary significantly with the exception of 2016 fruits five months post-harvest, in which low (<13%) predicted dry matter fruits exhibited a higher chroma relative to either moderate (13–16%) or high (>16%) predicted dry matter fruits (Table 2).
Soluble solids (°Brix) and actual dry matter (%) evaluated using the destructive method were significantly unique among low (<13%), moderate (13–16%), and high (>16%) predicted dry matter categories in a manner consistent with these classifications (e.g., higher predicted dry matter corresponded with higher soluble solids and higher destructively-assessed dry matter, Figure 9). These patterns were consistent across harvest years and fruit evaluation stages (one and five mos. post-harvest, Figure 9 and Figure 10).
Fruit firmness (kg) and titratable acidity (% malic acid) were less consistent among dry matter classifications (Figure 9 and Figure 10). At harvest, firmness appeared to trend negatively with increasing predicted dry matter classifications (and to significant degree only in 2017, Figure 9), though five months post-harvest, average fruit firmness was significantly higher in the high dry matter category relative to moderate and low in 2016, but moderate predicted dry matter fruits were significantly lower in firmness relative to low predicted dry matter fruits in 2017 (Figure 10). Titratable acidity (% malic acid) was uniquely higher in the moderate dry matter category one month after harvest in both years (Figure 9), as well five months post-harvest, though not uniquely significant in 2016 (similar to low) and was non-significant in 2017 (Figure 10).
4. Discussion
4.1. Vegetative Growth
Physiological responses to pruning are driven by the need to restore a balance between the root system and the aboveground tree structure disturbed by the practice. Moreover, the way trees react to pruning depends also on the number of cuts and type of cuts such as thinning the canopy with the removal of entire branches versus shoot heading or trimming [9]. In this trial, winter pruning (W) was more focused on the removal of vertical watersuckers and large branches that were determined as too vigorous, in an unideal position, or competing with the central leader. Fall pruning (F) was intended to bring more light inside the canopies to promote a more uniform flower bud development inside the tree, resulting in fewer and smaller cuts relative to winter pruning. Summer pruning (F+S and W+S) had the same goal as fall pruning to increase light penetration in the canopy to benefit carbon capture at the fruiting sites.
Though differences in accumulated growth in terms of TCSA (cm2) were not significant over the two growing seasons presented in this study, it is somewhat indicated that winter (W) pruning trended subtly towards greater trunk growth relative to fall (F) pruning as presented by the larger, though non-significant, average TCSA increases (Figure 1). Utermark et al. [76] reported that summer pruning applied to mature fruiting apple trees could lead to a delay in trunk growth which was also observed here as TCSA averaged lower in summer pruning between fall and fall and summer (F vs. F+S) and between winter and winter and summer (W vs. W+S), though not significantly (Figure 1). The trend of greater vigor of the winter treatments was also apparent in the significantly larger amount of total material pruned relative to other treatments (Figure 2), suggesting trees had high level of reserves to invest in new shoots [48]. Since new growth is proportional to the intensity of dormant pruning [9], the large removal of material from winter pruning lead to more new growth relative to other treatments which then had to again be removed in subsequent pruning events. The addition of summer pruning substantially decreased the amount of branch material that was removed at later fall or winter pruning events relative to trees that did not receive summer pruning (Figure 2). This is in accordance with Maggs [77], who explained that summer pruning in young apple trees limited tree growth by the removal of photosynthetic leaf area causing new bud break that competed with shoot development. While we have not investigated anything related to roots in this study, Marini and Barden [78] reported that summer pruning in apple trees reduced root growth, which may also limit the above-ground regeneration of shoots and leaves following summer pruning, as was observed here.
4.2. Flowering, Fruit Set, and Yield
Pruning treatments did not yield significant patterns in flower cluster density within the canopy (flower clusters∙m−3) nor in the rate of fruit set (%, Figure S1). However, the addition of summer pruning to winter and summer pruning did average a lower fruit set, which was made more apparent at harvest when production (fruit/tree) and total yield (kg fruit/tree) averaged lower in summer pruning treatments (F+S and W+S) relative to either fall (F) and winter (W) pruning, respectively (Figure 3). Overall, production (fruit/tree) and yield (kg fruit/tree) and, more precisely, yield efficiency (kg fruit/tree ∙ TCSA[cm2]−1) seemed to be inversely related to average fruit weight, where small yields and yield efficiencies (e.g., low crop loads) tended to average larger fruits within pruning treatments, with fall and summer (F+S) averaging larger fruits than fall (F) pruning along, and winter and summer (W+S) averaging larger fruits than winter (W) pruning alone (Figure 3).
The effect of summer pruning trending towards greater fruit weight may be explained by an increase in light exposure to fruits. In apples, Lakso et al. [79] demonstrated that the exposure of the apple spurs to light within the first five weeks following bloom was a key factor in triggering fruit growth. Similarly, Kappel and Nelsen [27] and Khemira et al. [8] concluded that sunlight exposure was directly correlated to d’Anjou final fruit weight and diameter and the period of time most responsible for final fruit size was between early May and mid-July. The exact timing of summer pruning may produce different effects, as the transition between cell division and cell enlargement phases vary for European and Asian pears and, therefore, the timing of practicing summer pruning can differently affect the final fruit size also depending on the specific fruit growing stage at the time of pruning [80].
4.3. Fruit Size and Dry Matter
The observed trend in fruit weight closely aligned to the distributions of fruit sizes among pruning treatments (Figure 4). While the greatest average proportion of fruit was 70 mm in size across all pruning treatments in both years with the exception of fall and summer (F+S) pruning in 2017 in which 75 mm was the largest average proportion of fruit, the addition of summer pruning to either fall (F+S) and winter (W+S) pruning trended towards an increase in proportions of fruit 80 mm or greater, though this trend was not evaluated for statistical significance (Figure 4).
Predicted fruit dry matter (%), when assessed non-destructively at harvest, also varied in response to pruning treatments, in a pattern opposite to fruit size and to a more substantial and significant degree (Figure 5). F pruning produced the greatest average predicted dry matter, followed by F+S, W, and W+S pruning in both years (Figure 5). We could speculate that fall pruning effectively brought more light inside the canopy at a time of the season when the flower buds could still benefit from light exposure in terms of their development [5,8,37,38,81].
Summer pruning appeared to decrease the amount of predicted dry matter documented at harvest relative to non-summer pruned treatments (F versus F+S, W versus W+S, Figure 5). While summer pruning increases fruit site exposure which arguably would increase carbon assimilation in the fruit, the significant removal of leaf area (Figure 2) during summer pruning may also lead to a net negative impact on light interception and photosynthesis [49,52] which may explain the reduced dry matter in the summer pruning treatments (up to 65% decrease in net carbon exchange rate was observed as a result of summer pruning by Li et al. [53]). The reduction of photosynthesis through summer pruning may also reduce water loss through transpiration because of the leaf area reduction [49]. This retention of water could potentially lead to greater fruit water content which may also explain the lower predicted dry matter in summer pruned treatments, as well as the greater fruit weight observed (Figure 3 and Figure 4), though Mika [9] postulated that the improvement of water status in the vegetative organs of trees after pruning could instead be a result in a change in the ratio between canopy and root systems rather than a reduction in transpiration. As such, deficit irrigation during the growing period may serve to increase fruit dry matter [82].
The abundance of fruit segregated at harvest to the predicted dry matter categories among pruning treatments mirrored the patterns of average predicted dry matter. F had the greatest proportion of high dry matter fruits followed by F+S, W, and W+S in 2016 (Figure 6). In 2017, when there was not a meaningful amount of high dry matter fruits produced among all pruning treatments, the same pattern was seen for moderate dry matter fruits (Figure 6). This may be attributable to the unfavorable year experienced in 2017 characterized by an extended winter leading to a later bud release and fewer growing-degree days, despite a later harvest date [83].
4.4. Fruit Quality
Fruit quality based on the applied pruning treatment largely did not produce significant differences in the ripeness or coloration of fruit. Despite many terms being significant, coloration (% overcolor), pigmentation values of hue (°h) and chroma (*C), and ripeness as indicated by chlorophyll concentration measured by the index of absorbance difference (IAD) did not vary reliably, indicating that the fruit were not showing a clear pattern of coloring, pigmentation, or ripeness among treatments, post-harvest evaluation periods, and harvest years (Table 1).
Destructively measured actual dry matter both one and five months post-storage (and soluble solids content as a related measure), mimicked the patterns of dry matter among pruning treatments estimated at the harvest sorting stage (Figure 5 and Figure 6). F pruning averaged greater dry matter and soluble solids relative to F+S, and W pruning averaged greater than W+S, indicating that in our experiment the addition of summer pruning reduced the net dry matter and sugar contents of the resulting fruit (Figure 7 and Figure 8). These results are in contrast with what was found by Asharaf et al. [49], Demirtas et al. [50], and Pramanick et al. [51], in apple, apricot and kiwifruit, and more in agreement with Morgan et al. [54], Ystaas [55], and Ferree et al. [56] on apple trees. It is apparent here as well as in the estimated dry matter measures (Figure 5 and Figure 6), that the reduction in overall leaf area and photosynthesis arising from summer pruning outweighs the benefit of increase light penetration to fruit sites, ultimately reducing fruit quality in our experimental conditions [53,56]. Indeed, modifications of timing and intensity of summer pruning from the present experiment could reflect into different results and discussion. No specific trend for acidity was found across the four pruning treatments, similar to Ystaas [55] for apple.
When evaluating fruit quality, higher predicted dry matter fruit were more mature one month post-harvest as determined by lower IAD (indicating more advanced chlorophyll degradation in the outer layers of the cortex). Higher dry matter fruits averaged a much greater percentage of blushed overcolor and a lower (more yellow as opposed to green) hue angle, indicating these fruits experienced greater light interception in the canopy prior to harvest (Table 2). Higher dry matter fruits also exhibited significantly greater soluble solids concentrations (°Brix) both one and five months post-harvest (Figure 9 and Figure 10). Firmness first appeared to be generally lower in high or moderate dry matter classes and greater in low dry matter classes, though was significantly higher in the high dry matter category five months post-harvest in 2016, indicating an inconsistent relationship between firmness and dry matter (Figure 9 and Figure 10). The greatest titratable acidity (% malic acid) was found in the moderate dry matter category one month post-harvest in both years (Figure 7), but this trait did not persist five months post-harvest (Figure 9 and Figure 10). High dry matter pears reported quality characteristics very similar to external/more exposed pears reported in comparison to internal fruit grown and harvested from the inner part of the canopies [7,28]. Low dry matter pears, indeed, with low blush, higher IAD and greener background color resembled in general more to the internal pears in Serra et al. [28] that showed approximately a 2-SSC (°Brix) of difference with the exposed fruit. This SSC difference is similar to almost 4 SSC (°Brix) between low and high dry matter pears presented in this study (Figure 9 and Figure 10). These general trends of greater soluble solids, and lower firmness and greater titratable acidity (though often not significantly or reliably), may account for the greater consumer liking of high dry matter fruits, as found in consumer tests using the same low/moderate/high classification scheme as employed here [14].
Regarding the incidence of disorders, we noticed that pears harvested from winter-pruned trees averaged a greater incidence of cork spot than other treatments (Figures S3 and S4). This observation, though not evaluated for statistical significance, may be explained by the characteristic high vigor of winter-pruned trees where many shoots and watersprouts are attracting calcium and compete with the fruit in the early stage of development [56,59,84]. Summer pruning has been proved to minimize or reduce the incidence of cork spot in pear or bitter pit in apple in particular if carried out early in the summer when fruitlets can still take advantage of more calcium available [56,59,84,85]. To our knowledge, no previous studies have been found correlating cork spot incidence to fall pruning.
5. Conclusions
Pruning has been long known as a key management practice able to affect and regulate tree balance, modifying vegetative and reproductive activities, and carbon assimilation and partitioning in the tree. In this study, conducted over two growing seasons, we demonstrated that the timing of seasonal pruning had effects on the vegetative characteristics, yield, dry matter accumulation, and fruit quality of d’Anjou pears. Summer pruning in combination with either fall and winter pruning averaged a greater fruit size and desirable coloration but at the significant expense of dry matter accumulation with an impact on the ultimate consumer eating quality (i.e. soluble solids). Noticeable differences in these traits were also revealed between fall and winter pruning strategies regardless of summer pruning application, where fall pruning averaged greater proportions of high dry matter fruit with more desirable eating quality than traditional winter pruning. Finally, we validated the use of dry matter as a quality metric in the tree fruit management toolbox as higher dry matter fruits displayed significantly greater levels of optimal quality traits such as soluble solids content both one and five months post-harvest. Further exploration on orchard size optimization of fruit quality via the manipulation of dry matter, as well as how to monitor dry matter in real time in the field non-destructively and in pre-harvest, is necessary to understand the role of management strategies in dry matter production and ultimate fruit quality outcomes in relation to consumer preference.
Supplementary Materials
The following are available online at https://0-www-mdpi-com.brum.beds.ac.uk/2073-4395/10/6/897/s1.
Author Contributions
Conceptualization, S.S. and S.M.; Methodology, A.G., S.S., and S.M.; Software, A.G. and S.S.; Validation, A.G. and S.S.; Formal Analysis, A.G. and S.S.; Investigation, A.G., S.S., and S.M.; Resources, S.S. and S.M.; Data Curation, A.G. and S.S.; Writing—Original Draft Preparation, A.G. and S.S.; Writing—Review and Editing, A.G., S.S., and S.M.; Visualization, A.G. and S.S.; Supervision, S.S. and S.M.; Project Administration, S.S. and S.M.; Funding Acquisition, S.S. and S.M. All authors have read and agreed to the published version of the manuscript.
Funding
This researched was funded by Washington Tree Fruit Research Commission award #PR16-105 and Crop Improvement and Sustainable Production Systems, primary funding source: Hatch (accession No: 1014919 and project No: WNP00011).
Acknowledgments
The authors would like to thank Bob Gix and Blue Star Growers of Cashmere, WA, USA for orchard access and harvesting support. We would also like to thank Ryan Sheick, Angela Knerl, Stefan Roeder, Brendon Anthony, Zach Fabey, Niles Desmarais, and Ashley Heuchert for their technical contributions.
Conflicts of Interest
The authors declare no conflict of interest.
References
- Einhorn, T.C.; Turner, J.; Gibeaut, D.; Postman, J.D. Characterization of Cold Hardiness in Quince: Potential Pear Rootstock Candidates for Northern Pear Production Regions. Acta Hortic. 2011, 909, 137–143. [Google Scholar] [CrossRef]
- Elkins, R.; Bell, R.; Einhorn, T. Needs assessment for future US pear rootstock research directions based on the current state of pear production and rootstock research. J. Am. Pomol. Soc. 2012, 66, 153–163. [Google Scholar]
- Wertheim, S.J. Rootstocks for European pear: A review. Acta Hortic. 2000, 596, 299–309. [Google Scholar] [CrossRef]
- Sansavini, S.; Castagnoli, M.; Musacchi, S. New rootstocks for William and Abate Fetel cultivars of pear tree. Comparison between progenies of quince tree and clonal stocks [Pyrus communis]. Riv. Frutticolt. Ortofloric. 1997, 59, 31–40. [Google Scholar]
- Elfving, D.C.; Lombardini, L.; McFerson, J.R.; Drake, S.R. Effects of directed applications of prohexadione-calcium to tops of mature pear trees on shoot growth, light penetration, pruning and fruit quality. J. Am. Pomol. Soc. 2003, 57, 45–57. [Google Scholar]
- Einhorn, T.C.; Turner, J.; Laraway, D. Effect of reflective fabric on yield of mature ‘d’Anjou’ pear trees. HortScience 2012, 47, 1580–1585. [Google Scholar] [CrossRef]
- Zhang, J.; Serra, S.; Leisso, R.S.; Musacchi, S. Effect of light microclimate on the quality of ‘d’Anjou’ pears in mature open-centre tree architecture. Biosyst. Eng. 2016, 141, 1–11. [Google Scholar] [CrossRef]
- Khemira, H.; Lombard, P.B.; Sugar, D.; Azarenko, A.N. Hedgerow Orientation Affects Canopy Exposure, Flowering, and Fruiting of Anjou’ Pear Trees. HortScience 1993, 28, 984–987. [Google Scholar] [CrossRef]
- Mika, A. Physiological responses of fruit trees to pruning. Hortic. Rev. 1986, 8, 337–378. [Google Scholar]
- Lakso, A.N.; Corelli-Grappadelli, L. Implications of pruning and training practices to carbon partitioning and fruit development in apple. Acta Hortic. 1991, 322, 231–240. [Google Scholar] [CrossRef]
- DeJong, T.M. Canopy and light management. In Pear Production and Handling Manual; UC ANR Publications: Davis, CA, USA, 2007; Volume 3483, pp. 59–62. [Google Scholar]
- Suni, M.; Nyman, M.; Eriksson, N.A.; Björk, L.; Björck, I. Carbohydrate composition and content of organic acids in fresh and stored apples. J. Sci. Food Agric. 2000, 80, 1538–1544. [Google Scholar] [CrossRef]
- Palmer, J.W.; Harker, F.R.; Tustin, D.S.; Johnston, J. Fruit dry matter concentration: A new quality metric for apples. J. Sci. Food Agric. 2010, 90, 2586–2594. [Google Scholar] [CrossRef]
- Serra, S.; Goke, A.; Diako, C.; Vixie, B.; Ross, C.; Musacchi, S. Consumer perception of d’Anjou pear classified by dry matter at harvest using near-infrared spectroscopy. Int. J. Food Sci. 2019, 54, 2256–2265. [Google Scholar] [CrossRef]
- Escribano, S.; Biasi, W.V.; Lerud, R.; Slaughter, D.C.; Mitcham, E.J. Non-destructive prediction of soluble solids and dry matter content using NIR spectroscopy and its relationship with sensory quality in sweet cherries. Postharvest Biol. Technol. 2017, 128, 112–120. [Google Scholar] [CrossRef]
- Burdon, J.; McLeod, D.; Lallu, N.; Gamble, J.; Petley, M.; Gunson, A. Consumer evaluation of “Hayward” kiwifruit of different at-harvest dry matter contents. Postharvest Biol. Technol. 2004, 34, 245–255. [Google Scholar] [CrossRef]
- Jaeger, S.R.; Harker, R.; Triggs, C.M.; Gunson, A.; Campbell, R.L.; Jackman, R.; Requejo-Jackman, C. Determining consumer purchase intentions: The importance of dry matter, size, and price of kiwifruit. J. Food Sci. 2011, 76, 177–184. [Google Scholar] [CrossRef] [PubMed]
- Mooney, H.A. The carbon balance of plants. Annu. Rev. Ecol. Evol. Syst. 1972, 3, 315–346. [Google Scholar] [CrossRef]
- Cannell, M.G.R. Dry matter partitioning in tree crops. In Attributes of Trees as Crop Plants; Cannell, M.G.R., Jackson, J.E., Eds.; Institute of Terrestrial Ecology: Cambridgeshire, UK, 1985; pp. 160–193. [Google Scholar]
- DeJong, T.M. Developmental and environmental control of dry-matter partitioning in peach. HortScience 1999, 34, 1037–1040. [Google Scholar] [CrossRef] [Green Version]
- Génard, M.; Dauzat, J.; Franck, N.; Lescourret, F.; Moitrier, N.; Vaast, P.; Vercambre, G. Carbon allocation in fruit trees: From theory to modelling. Trees 2008, 22, 269–282. [Google Scholar] [CrossRef]
- Grappadelli, L.C.; Lakso, A.N.; Flore, J.A. Early season patterns of carbohydrate partitioning in exposed and shaded apple branches. J. Am. Soc. Hortic. Sci. 1994, 119, 596–603. [Google Scholar] [CrossRef] [Green Version]
- Mesa, K.; Serra, S.; Masia, A.; Gagliardi, F.; Bucci, D.; Musacchi, S. Preliminary Study on Effect of Early Defoliation on Dry Matter Accumulation and Storage of Reserves on ‘Abbé Fétel’ Pear Trees. HortScience 2019, 54, 2169–2177. [Google Scholar] [CrossRef] [Green Version]
- Palmer, J.; Diack, R.; Johnston, J.; Boldingh, H. Manipulation of fruit dry matter accumulation and fruit size in ‘Scifresh’ apple through alteration of the carbon supply, and its relationship with apoplastic sugar composition. J. Hortic. Sci. Biotechnol. 2013, 88, 483–489. [Google Scholar] [CrossRef]
- Link, H. Significance of flower and fruit thinning on fruit quality. Plant Growth Regul. 2000, 31, 17–26. [Google Scholar] [CrossRef]
- Anthony, B.; Serra, S.; Musacchi, S. Optimizing Crop Load for New Apple Cultivar: “WA38”. Agronomy 2019, 9, 107. [Google Scholar] [CrossRef] [Green Version]
- Kappel, F.; Neilsen, G.H. Relationship between light microclimate, fruit growth, fruit quality, specific leaf weight and N and P content of spur leaves of ‘Bartlett’ and ‘Anjou’ pear. Sci. Hortic. (Amst.) 1994, 59, 187–196. [Google Scholar] [CrossRef]
- Serra, S.; Sullivan, N.; Mattheis, J.P.; Musacchi, S.; Rudell, D.R. Canopy attachment position influences metabolism and peel constituency of European pear fruit. BMC. Plant Biol. 2018, 18, 364. [Google Scholar] [CrossRef] [PubMed]
- Nicolai, B.M.; Beullens, K.; Bobelyn, E.; Peirs, A.; Saeys, W.; Theron, K.I.; Lammertyn, J. Nondestructive measurement of fruit and vegetable quality by means of NIR spectroscopy: A review. Postharvest Biol. Technol. 2007, 46, 99–118. [Google Scholar] [CrossRef]
- Lin, H.; Ying, Y. Theory and application of near infrared spectroscopy in assessment of fruit quality: A review. Sens. Instrum. Food Qual. Saf. 2009, 3, 130–141. [Google Scholar] [CrossRef]
- Walsh, K.B.; Golic, M.; Greensill, C.V. Sorting of fruit using near infrared spectroscopy: Application to a range of fruit and vegetables for soluble solids and dry matter content. J. Near Infrared Spectrosc. 2004, 12, 141–148. [Google Scholar] [CrossRef]
- Walsh, K.B.; McGlone, V.A.; Han, D.H. The uses of near infra-red spectroscopy in postharvest decision support: A review. Postharvest Biol. Technol. 2020, 163, 111139. [Google Scholar] [CrossRef]
- Lakso, A.; Corelli-Grappadelli, L. Le techniche di potatura e allevamento influenzano la ripartizione dei carboidrati e lo sviluppo dei frutti di melo. Frutticoltura 1992, 54, 15–20. [Google Scholar]
- Forshey, C.G.; Elfving, D.C. The relationship between vegetative growth and fruiting in apple trees. Hortic. Rev. 1989, 11, 229–287. [Google Scholar]
- Ashraf, N.; Ashraf, M. Summer pruning in fruit trees. Afr. J. Agric. Res. 2014, 9, 206–210. [Google Scholar]
- Musacchi, S.; Beers, E.; Mattheis, D. Fall and Summer Pruning to Control Vigor and Psylla in d’Anjou Pear; PR14-104; Washington Tree Fruit Research Commission: Wenatchee, WA, USA, 2017; pp. 1–10. [Google Scholar]
- Cain, J.C. Effects of mechanical pruning of apple hedgerows with a slotting saw on light penetration and fruiting. J. Am. Soc. Hortic. Sci. 1971, 96, 664–667. [Google Scholar]
- McArtney, S.; Greene, D.; Schmidt, T.; Yuan, R. Naphthaleneacetic acid and ethephon are florigenic in the biennial apple cultivars Golden Delicious and York imperial. HortScience 2013, 48, 742–746. [Google Scholar] [CrossRef] [Green Version]
- Wilkie, J.D.; Sedgley, M.; Olesen, T. Regulation of floral initiation in horticultural trees. J. Exp. Bot. 2008, 59, 3215–3228. [Google Scholar] [CrossRef] [Green Version]
- Bartolini, S.; Viti, R.; Andreini, L. The effect of summer shading on flower bud morphogenesis in apricot (Prunus americana L.). Open Life Sci. 2013, 8, 54–63. [Google Scholar] [CrossRef]
- Elkins, R.; van den Ende, B.; Stebbins, R.; Micke, W. Training young trees. In Pear Production and Handling Manual; UC ANR Publications: Davis, CA, USA, 2007; Volume 3483, pp. 63–76. [Google Scholar]
- Sansavini, S.; Neri, D.; Ancarani, V. Innovazioni tecniche per migliorare l’efficienza produttiva e la qualità dei frutti nelle coltivazioni intensive. Riv. Frutticolt. Ortofloric. 2008, 70, 10–26. [Google Scholar]
- Lakso, A.N.; Robinson, T.L. Principles of orchard systems management optimizing supply, demand and partitioning in apple trees. Acta Hortic. 1997, 451, 405–416. [Google Scholar] [CrossRef]
- Beers, E.H.; Brunner, J.F.; Willett, M.J.; Warner, G.M. Orchard Pest Management: A Resource Book for the Pacific Northwest; Good Fruit Grower: Yakima, WA, USA, 1993; p. 276. [Google Scholar]
- Horton, D.R. Monitoring of pear psylla for pest management decisions and research. Integr. Pest Manag. Rev. 1999, 4, 1–20. [Google Scholar] [CrossRef]
- Lawson, D.S.; Reissig, W.H.; Agnello, A.M. Effects of summer pruning and hand fruit thinning on oblique-banded leafroller (Lepidoptera: Tortricidae) fruit damage in New York state apple orchards. J. Agric. Entomol. 1998, 15, 113–123. [Google Scholar]
- Simon, S.; Sauphanor, B.; Lauri, P.E. Control of fruit tree pests through manipulation of tree architecture. Pest. Technol. 2007, 1, 33–37. [Google Scholar]
- Chandler, W.H. Results of Some Experiments in Pruning Fruit Trees; Cornell University Agricultural Experiment Station: Ithaca, NY, USA, 1923; Volume 415. [Google Scholar]
- Ashraf, N.; Ashraf, M.; Bhat, M.Y.; Sharma, M.K. Paclobutrazol and summer pruning influences fruit quality of red delicious apple. Int. J. Agric. Environ. Biotechnol. 2017, 10, 349. [Google Scholar] [CrossRef]
- Demirtas, M.N.; Bolat, I.; Ercisli, S.; Ikinci, A.; Olmez, H.A.; Sahin, M.; Altindag, M.; Celik, B. The effects of different pruning treatments on the growth, fruit quality and yield of ‘Hacihaliloglu’ apricot. Acta Sci. Pol. Hortorum Cultus 2010, 9, 183–192. [Google Scholar]
- Pramanick, K.K.; Kashyap, P.; Kishore, D.K.; Shajtma, Y.P. Effect of summer pruning and CPPU on yield and quality of kiwi fruit (Actinidia deliciosa). J. Environ. Biol. 2015, 36, 351. [Google Scholar]
- Miller, S.S. Regrowth, flowering, and fruit quality of ’Delicious’ apple trees as influenced by summer pruning. J. Am. Soc. Hortic. Sci. 1982, 107, 975–978. [Google Scholar]
- Li, K.T.; Lakso, A.N.; Piccioni, R.; Robinson, T. Summer pruning effects on fruit size, fruit quality, return bloom and fine root survival in apple trees. J. Hortic. Sci. Biotechnol. 2003, 78, 755–761. [Google Scholar] [CrossRef]
- Morgan, D.C.; Stanley, C.J.; Volz, R.; Warrington, I.J. Summer pruning of Gala apple: The relationships between pruning time, radiation penetration, and fruit quality. J. Am. Soc. Hortic. Sci. 1984, 109, 637–642. [Google Scholar]
- Ystaas, J. Effects of summer pruning on yield, fruit size, and fruit quality of the apple cultivar ‘Summer red’. Acta Hortic. 1991, 322, 277–282. [Google Scholar]
- Ferree, D.C.; Myers, S.C.; Rom, C.R.; Taylor, B.H. Physiological aspects of summer pruning. Acta Hortic. 1984, 146, 243–252. [Google Scholar] [CrossRef]
- Saure, M.C. Summer pruning effects in apple—A review. Sci. Hortic. 1987, 30, 253–282. [Google Scholar] [CrossRef]
- DeLong, W.A. Variations in the chief ash constituents of apples affected with blotchy cork. Plant Physiol. 1936, 11, 453. [Google Scholar] [CrossRef]
- Bangerth, F. Calcium-related physiological disorders of plants. Annu. Rev. Phytopathol. 1979, 17, 97–122. [Google Scholar] [CrossRef]
- Autio, W.R.; Greene, D.W. Summer Pruning Affects Yield and Improves Fruit Quality of ‘McIntosh’ Apples. J. Am. Soc. Hortic. Sci. 1990, 115, 356–359. [Google Scholar] [CrossRef] [Green Version]
- Maas, F.M. Shoot growth, fruit production and return bloom in ‘Conference’ and ‘Doyenné du Comice’ treated with Regalis (prohexadione-calcium). Acta Hortic. 2004, 671, 517–524. [Google Scholar]
- Asin, L.; Alegre, S.; Montserrat, R. Effect of paclobutrazol, prohexadione-Ca, deficit irrigation, summer pruning and root pruning on shoot growth, yield, and return bloom, in a ‘Blanquilla’ pear orchard. Sci. Hortic. 2007, 113, 142–148. [Google Scholar] [CrossRef]
- Pasa, M.S.; Einhorn, T.C. Heading cuts and prohexadione-calcium affect the growth and development of ‘d’Anjou’ pear shoots in a high-density orchard. Sci. Hortic. 2014, 168, 267–271. [Google Scholar] [CrossRef]
- Sansavini, S.; Musacchi, S. Canopy architecture, training and pruning in the modern European pear orchards: An overview. Acta Hortic. 1993, 367, 152–172. [Google Scholar] [CrossRef]
- Sansavini, S. Pear fruiting-branch models related to yield control and pruning. Acta Hortic. 2000, 596, 627–633. [Google Scholar] [CrossRef]
- Mitcham, E.J.; Elkins, R.B. Pruning mature trees. In Pear Production and Handling Manual; UC ANR Publications: Davis, CA, USA, 2007; Volume 3483, pp. 77–84. [Google Scholar]
- Garriz, P.I.; Colavita, G.M.; Alvarez, H.L. Fruit and spur leaf growth and quality as influenced by low irradiance levels in pear. Sci. Hortic. 1998, 77, 195–205. [Google Scholar] [CrossRef]
- Goke, A.; Serra, S.; Musacchi, S. Postharvest Dry Matter and Soluble Solids Content Prediction in d’Anjou and Bartlett Pear Using Near-infrared Spectroscopy. HortScience 2018, 53, 669–680. [Google Scholar] [CrossRef]
- Chen, P.M.; Mellenthin, W.M. Maturity, chilling requirement, and dessert quality of ’d’Anjou’ and ’Bosc’ pears. Acta Hortic. 1981, 124, 203–210. [Google Scholar] [CrossRef]
- Argenta, L.C.; Fan, X.; Mattheis, J.P. Influence of 1-methylcyclopropene on ripening, storage life, and volatile production by d’Anjou cv. pear fruit. J. Agric. Food Chem. 2003, 51, 3858–3864. [Google Scholar] [CrossRef] [PubMed]
- Sugar, D.; Einhorn, T.C. Conditioning temperature and harvest maturity influence induction of ripening capacity in ‘d’Anjou’ pear fruit. Postharvest Biol. Technol. 2011, 60, 121–124. [Google Scholar] [CrossRef]
- Villalobos-Acuña, M.; Mitcham, E.J. Ripening of European pears: The chilling dilemma. Postharvest Biol. Technol. 2008, 49, 187–200. [Google Scholar] [CrossRef]
- Ziosi, V.; Noferini, M.; Fiori, G.; Tadiello, A.; Trainotti, L.; Casadoro, G.; Costa, G. A new index based on vis spectroscopy to characterize the progression of ripening in peach fruit. Postharvest Biol. Technol. 2008, 49, 319–329. [Google Scholar] [CrossRef]
- McGuire, R.G. Reporting of objective color measurements. HortScience 1992, 27, 1254–1255. [Google Scholar] [CrossRef] [Green Version]
- R Core Team. R: A Language and Environment for Statistical Computing, v. 3.6; R Foundation for statistical Computing: Vienna, Austria, 2020. [Google Scholar]
- Utermark, H. Summer pruning to control growth and maintain fruiting in mature apple trees. Compact Fruit Trees 1977, 10, 86–90. [Google Scholar]
- Maggs, D.H. Dormant and summer pruning compared by pruning young apple trees once on a succession of dates. J. Hortic. Sci. 1965, 40, 249–265. [Google Scholar] [CrossRef]
- Marini, R.P.; Barden, J.A. Effects of summer vs. dormant pruning and NAA treatment on growth of one-and two-year-old apple trees. J. Am. Soc. Hortic. Sci. 1982, 107, 604–607. [Google Scholar]
- Lakso, A.N.; Robinson, T.L.; Pool, R.M. Canopy microclimate effects on patterns of fruiting and fruit development in apples and grapes. In Manipulation of Fruiting; Wright, C.J., Ed.; Bunerworths: London, UK, 1989; pp. 263–274. [Google Scholar]
- Theron, K.I. Size matters: Factors influencing fruit size in pear. Acta Hortic. 2011, 909, 545–555. [Google Scholar] [CrossRef]
- Tufts, W.; Morrow, E. Fruit-bud differentiation in deciduous fruits. Hilgardia 1925, 1, 1–14. [Google Scholar] [CrossRef]
- Mpelasoka, B.; Behboudian, M.; Green, S. Water use, yield and fruit quality of lysimeter-grown apple trees: Responses to deficit irrigation and to crop load. Irrig. Sci. 2001, 20, 107–113. [Google Scholar]
- Washington State University. AgWeatherNet Growing Degree Days. Available online: https://weather.wsu.edu/?p=90850 (accessed on 23 May 2020).
- Raese, J.T. Performance of ‘Anjou’ pear Trees Sprayed with Calcium or Summer Pruned. Acta Hortic. 1992, 322, 315–324. [Google Scholar] [CrossRef]
- Al-Ani, A.M. Postharvest Physiology of ‘Anjou’ Pear Fruit: Relations between Mineral Nutrition and Cork Spot, Respiration, and Ethylene Evolution. Ph.D. Thesis, Oregon State University, Corvallis, OR, USA, 1978. [Google Scholar]
Figure 1.
Mean increase in trunk cross-sectional area (TCSA, cm2) of trees subjected to fall (F, red), fall and summer (F+S, yellow), winter (W, blue), or winter and summer (W+S, green). Points indicate mean (n = 4 trees with exception of W+S where n = 3). Error bars indicate ± standard error. “ns” indicates no significance difference among means (p > 0.05, Tukey HSD).

Figure 2.
Mean weight of pruned wood (orange), fruit (yellow), one-year-old shoots (blue), leaves (green), and sum of all cut materials (purple) in Fall 2016, Winter 2017, Summer 2017, and total among these three pruning dates of trees subjected to fall (F), fall and summer (F+S), winter (W), or winter and summer (W+S) pruning treatments. Error bars ± standard error. Different letters indicate significance difference among means within pruning date and cut material type (capital letters for leaves, lowercase letters for shoots in Summer 2017, italic letters for total of all cut material types, p < 0.05, Tukey HSD). “ns” indicates no significant difference among means (p > 0.0, Tukey HSD).

Figure 3.
Mean production (number fruit/tree), yield (kg/tree), yield efficiency (kg fruit/tree ∙ TCSA[cm2]−1), and average fruit weight (g) in 2016 (left) and 2017 (right) among seasonal pruning treatments consisting of fall pruning (F, orange), fall and summer pruning (F+S, yellow), winter pruning (W, blue), and winter and summer pruning (W+S, green). Error bars indicate ± standard error. Different letters indicate significance difference among means (p < 0.05, Tukey HSD). “ns” indicates no significant difference among means (p > 0.05, Tukey HSD).

Figure 4.
Histogram of proportion of fruit (%) in fruit size (mm) categories determined at harvest of 2016 (left) and 2017 (right) fruit grown among seasonal pruning treatments consisting of fall pruning (F, orange, n = 1262 and 1849 in 2016 and 2017, respectively), fall and summer pruning (F+S, yellow, n = 1072 and 1086 in 2016 and 2017, respectively), winter pruning (W, blue, n = 856 and 1019 in 2016 and 2017, respectively), and winter and summer pruning (W+S, green, n = 797 and 818 in 2016 and 2017, respectively).

Figure 5.
Density distribution of predicted dry matter (%) determined at harvest of 2016 (left) and 2017 (right) fruit grown among seasonal pruning treatments consisting of fall pruning (F, orange, n = 512 and 320 in 2016 and 2017, respectively), fall and summer pruning (F+S, yellow, n = 501 and 320 in 2016 and 2017, respectively), winter pruning (W, blue, n = 500 and 320 in 2016 and 2017, respectively), and winter and summer pruning (W+S, green, n = 500 and 320 in 2016 and 2017, respectively). Vertical lines indicate the average predicted dry matter within each pruning treatment. Different letters indicate significant difference among means across the four pruning treatments in the same year (p < 0.05, Tukey HSD).

Figure 6.
Mean proportion of low (<13%), moderate (13–16%), and high (>16%) predicted dry matter classes of pears determined at harvest in 2016 (upper), 2017 (lower) among seasonal pruning treatments consisting of fall pruning (F, orange, n = 512 and 320 in 2016 and 2017, respectively), fall and summer pruning (F+S, yellow, n = 501 and 320 in 2016 and 2017, respectively), winter pruning (W, blue, n = 500 and 320 in 2016 and 2017, respectively), and winter and summer pruning (W+S, green, n = 500 and 320 in 2016 and 2017, respectively). Error bars indicate ± standard error. Different letters indicate significance difference among means (p < 0.05, Tukey HSD). “ns” indicates no significant difference among means (p > 0.05, Tukey HSD).

Figure 7.
Mean firmness (kg, n = 487 and 350 in 2016 and 2017, respectively), soluble solids content (SSC, °Brix, n = 487 and 347 in 2016 and 2017, respectively), destructively measured actual dry matter (%, n = 108 and 233 in 2016 and 2017, respectively). and acidity (% malic acid, n = 64 and 60 in 2016 and 2017, respectively) for d’Anjou fruit evaluated one mo. post-harvest (within one month after harvest in cold storage plus seven days of ripening at room temperature) in 2016 (left) and 2017 (right) among seasonal pruning treatments consisting of fall pruning (F, orange), fall and summer pruning (F+S, yellow), winter pruning (W, blue), and winter and summer pruning (W+S, green). Error bars indicate ± standard error. Different letters indicate significance difference among means (p < 0.05, Tukey HSD). “ns” indicates no significant difference among means (p > 0.05, Tukey HSD).

Figure 8.
Mean firmness (kg, n = 457 and 253 in 2016 and 2017, respectively), soluble solids content (SSC, °Brix, n = 457 and 253 in 2016 and 2017, respectively), destructively measured actual dry matter (%, n = 95 and 173 in 2016 and 2017, respectively), and acidity (% malic acid, n = 57 and 45 in 2016 and 2017, respectively) for d’Anjou fruit evaluated five mos. post-harvest (five months after harvest in cold storage plus seven days of ripening at room temperature) in 2016 (left) and 2016 (right) among seasonal pruning treatments consisting of fall pruning (F, orange), fall and summer pruning (F+S, yellow), winter pruning (W, blue), and winter and summer pruning (W+S, green). Error bars indicate ± standard error. Different letters indicate significance difference among means (p < 0.05, Tukey HSD). “ns” indicates no significant difference among means (p > 0.05, Tukey HSD).

Figure 9.
Mean firmness (kg, n = 457 and 253 in 2016 and 2017, respectively), soluble solids content (SSC, °Brix, n = 457 and 253 in 2016 and 2017, respectively), destructively measured actual dry matter (%, n = 95 and 173 in 2016 and 2017, respectively), and acidity (% malic acid, n = 57 and 45 in 2016 and 2017, respectively) for d’Anjou fruit evaluated one mo. post-harvest (within one month after harvest in cold storage plus seven days of ripening at room temperature) in 2016 (left) and 2017 (right) among Low (<13%, green), Moderate (13–16%, yellow), and High (>16%, orange) predicted dry matter categories. Error bars indicate ± standard error. Different letters indicate significance difference among means (p < 0.05, Tukey HSD). “ns” indicates no significant difference among means (p > 0.05, Tukey HSD).

Figure 10.
Mean firmness (kg, n = 457 and 253 in 2016 and 2017, respectively), soluble solids content (SSC, °Brix, n = 457 and 253 in 2016 and 2017, respectively), destructively measured actual dry matter (%, n = 95 and 173 in 2016 and 2017, respectively), and acidity (% malic acid, n = 57 and 45 in 2016 and 2017, respectively) for d’Anjou fruit evaluated at five mos. post-harvest (five months after harvest in cold storage plus seven days of ripening at room temperature) in 2016 (left) and 2016 (right) among Low (<13%, green), Moderate (13–16%, yellow), and High (>16%, orange) predicted dry matter categories. Error bars indicate ± standard error. Different letters indicate significance difference among means (p < 0.05, Tukey HSD). “ns” indicates no significant difference among means (p > 0.05, Tukey HSD).


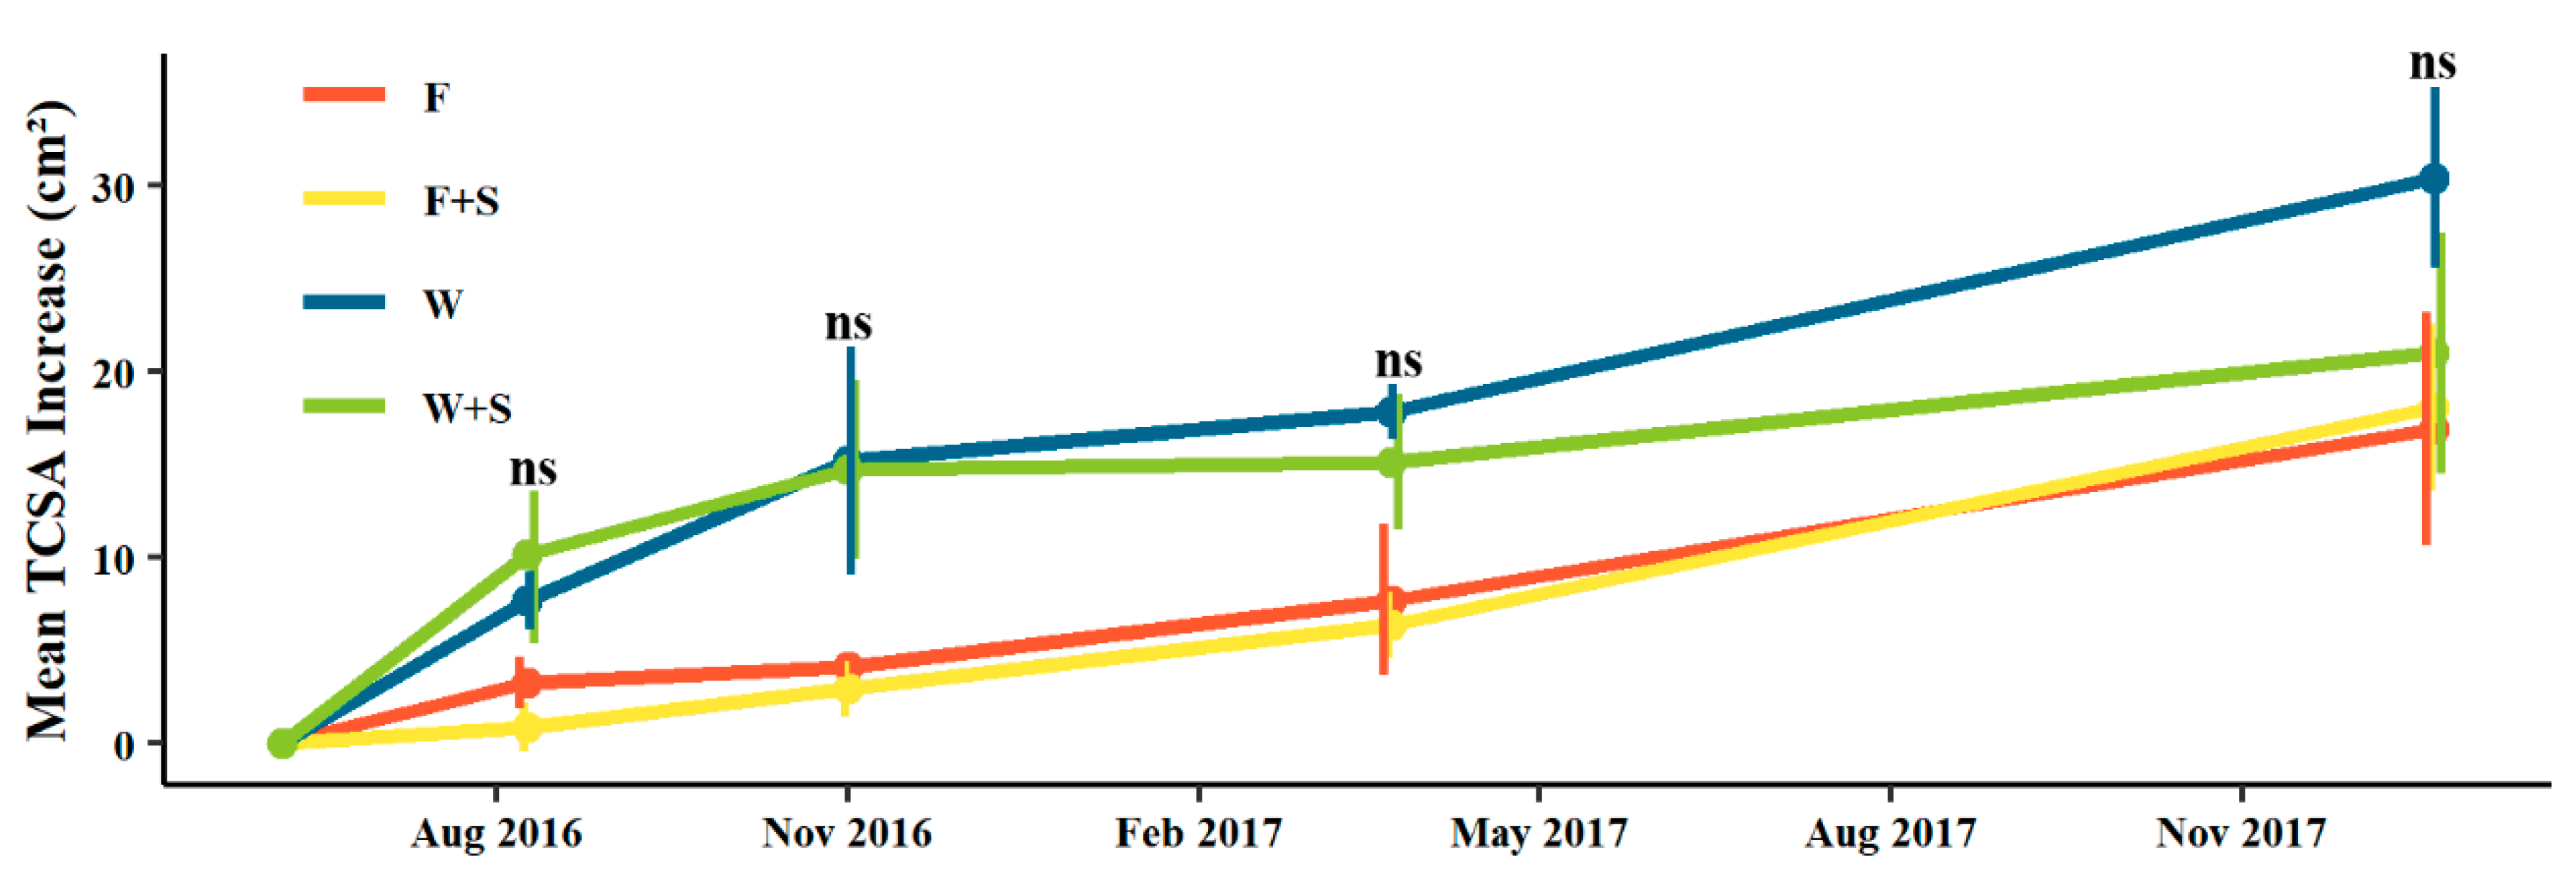
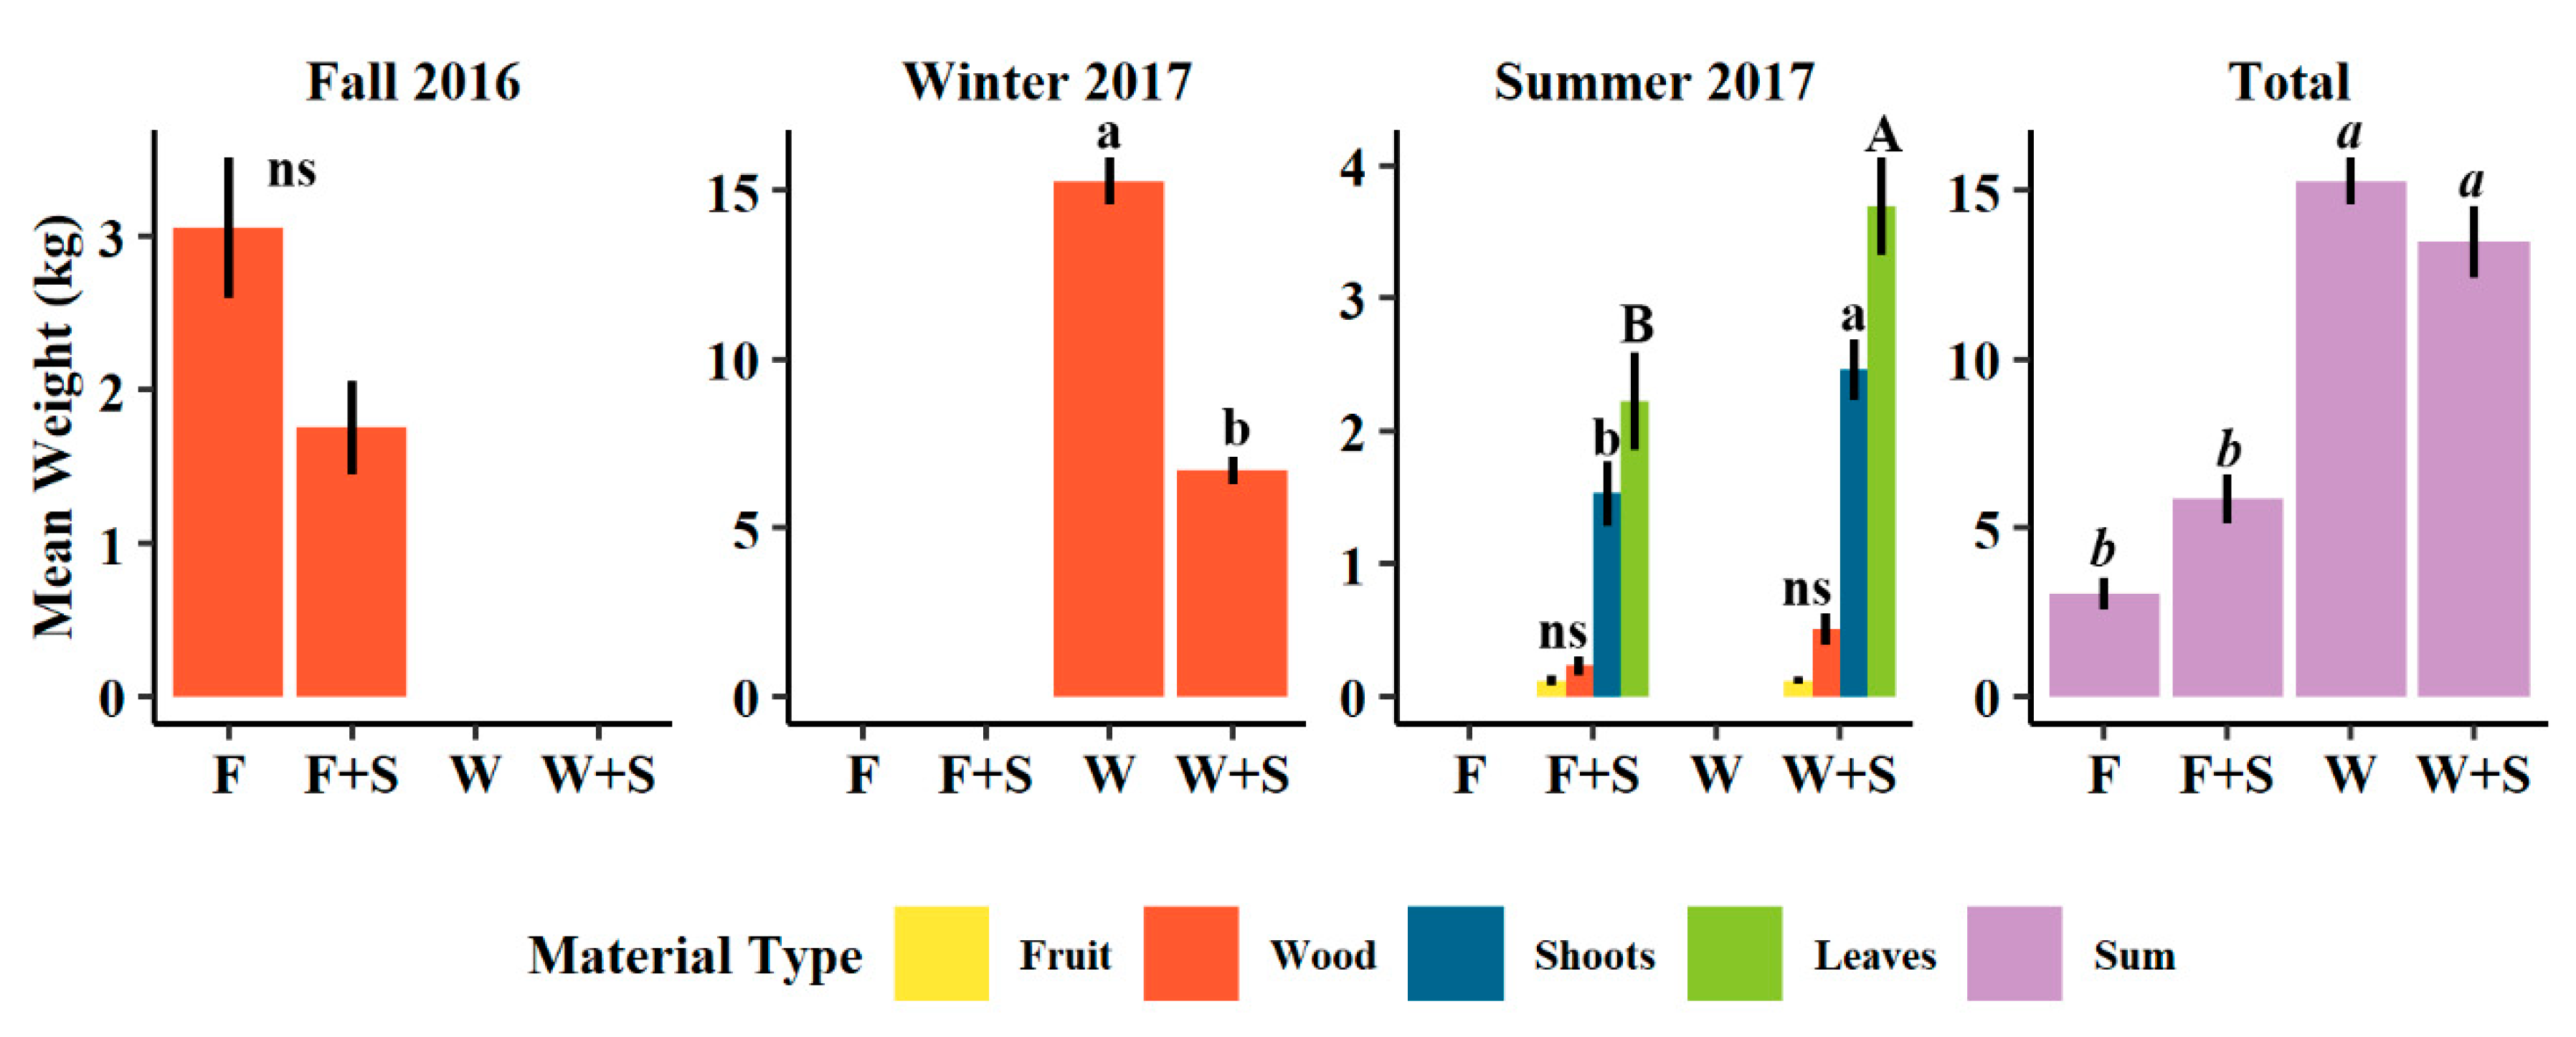
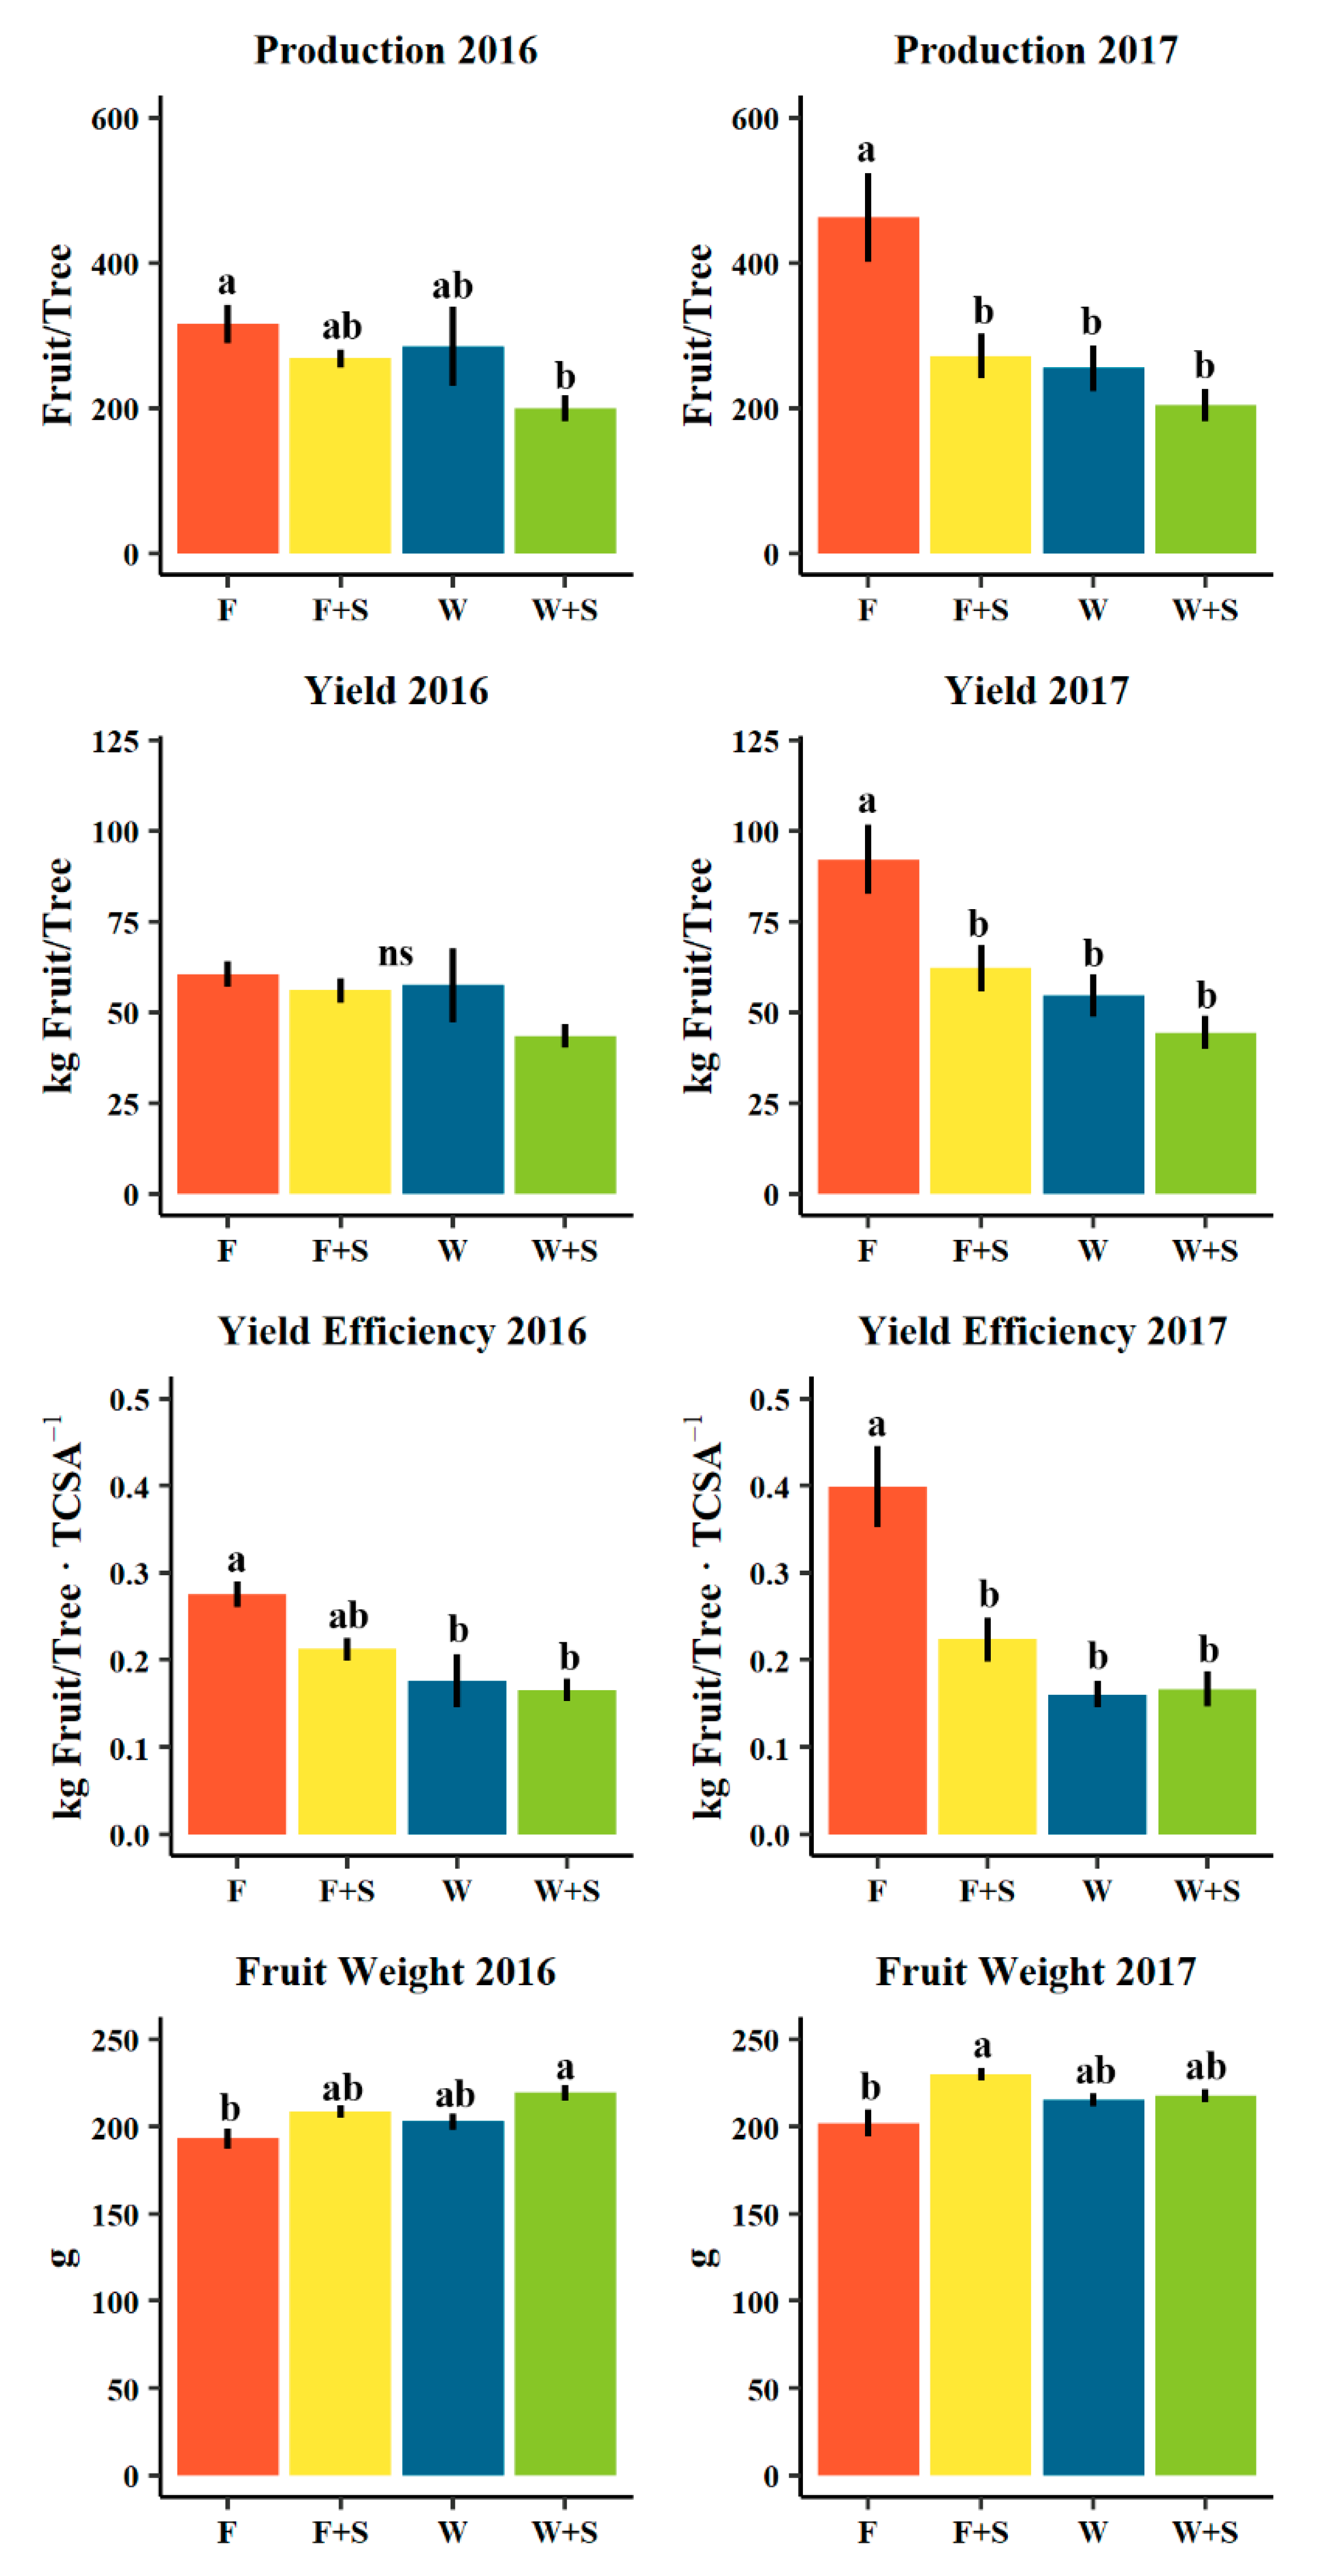
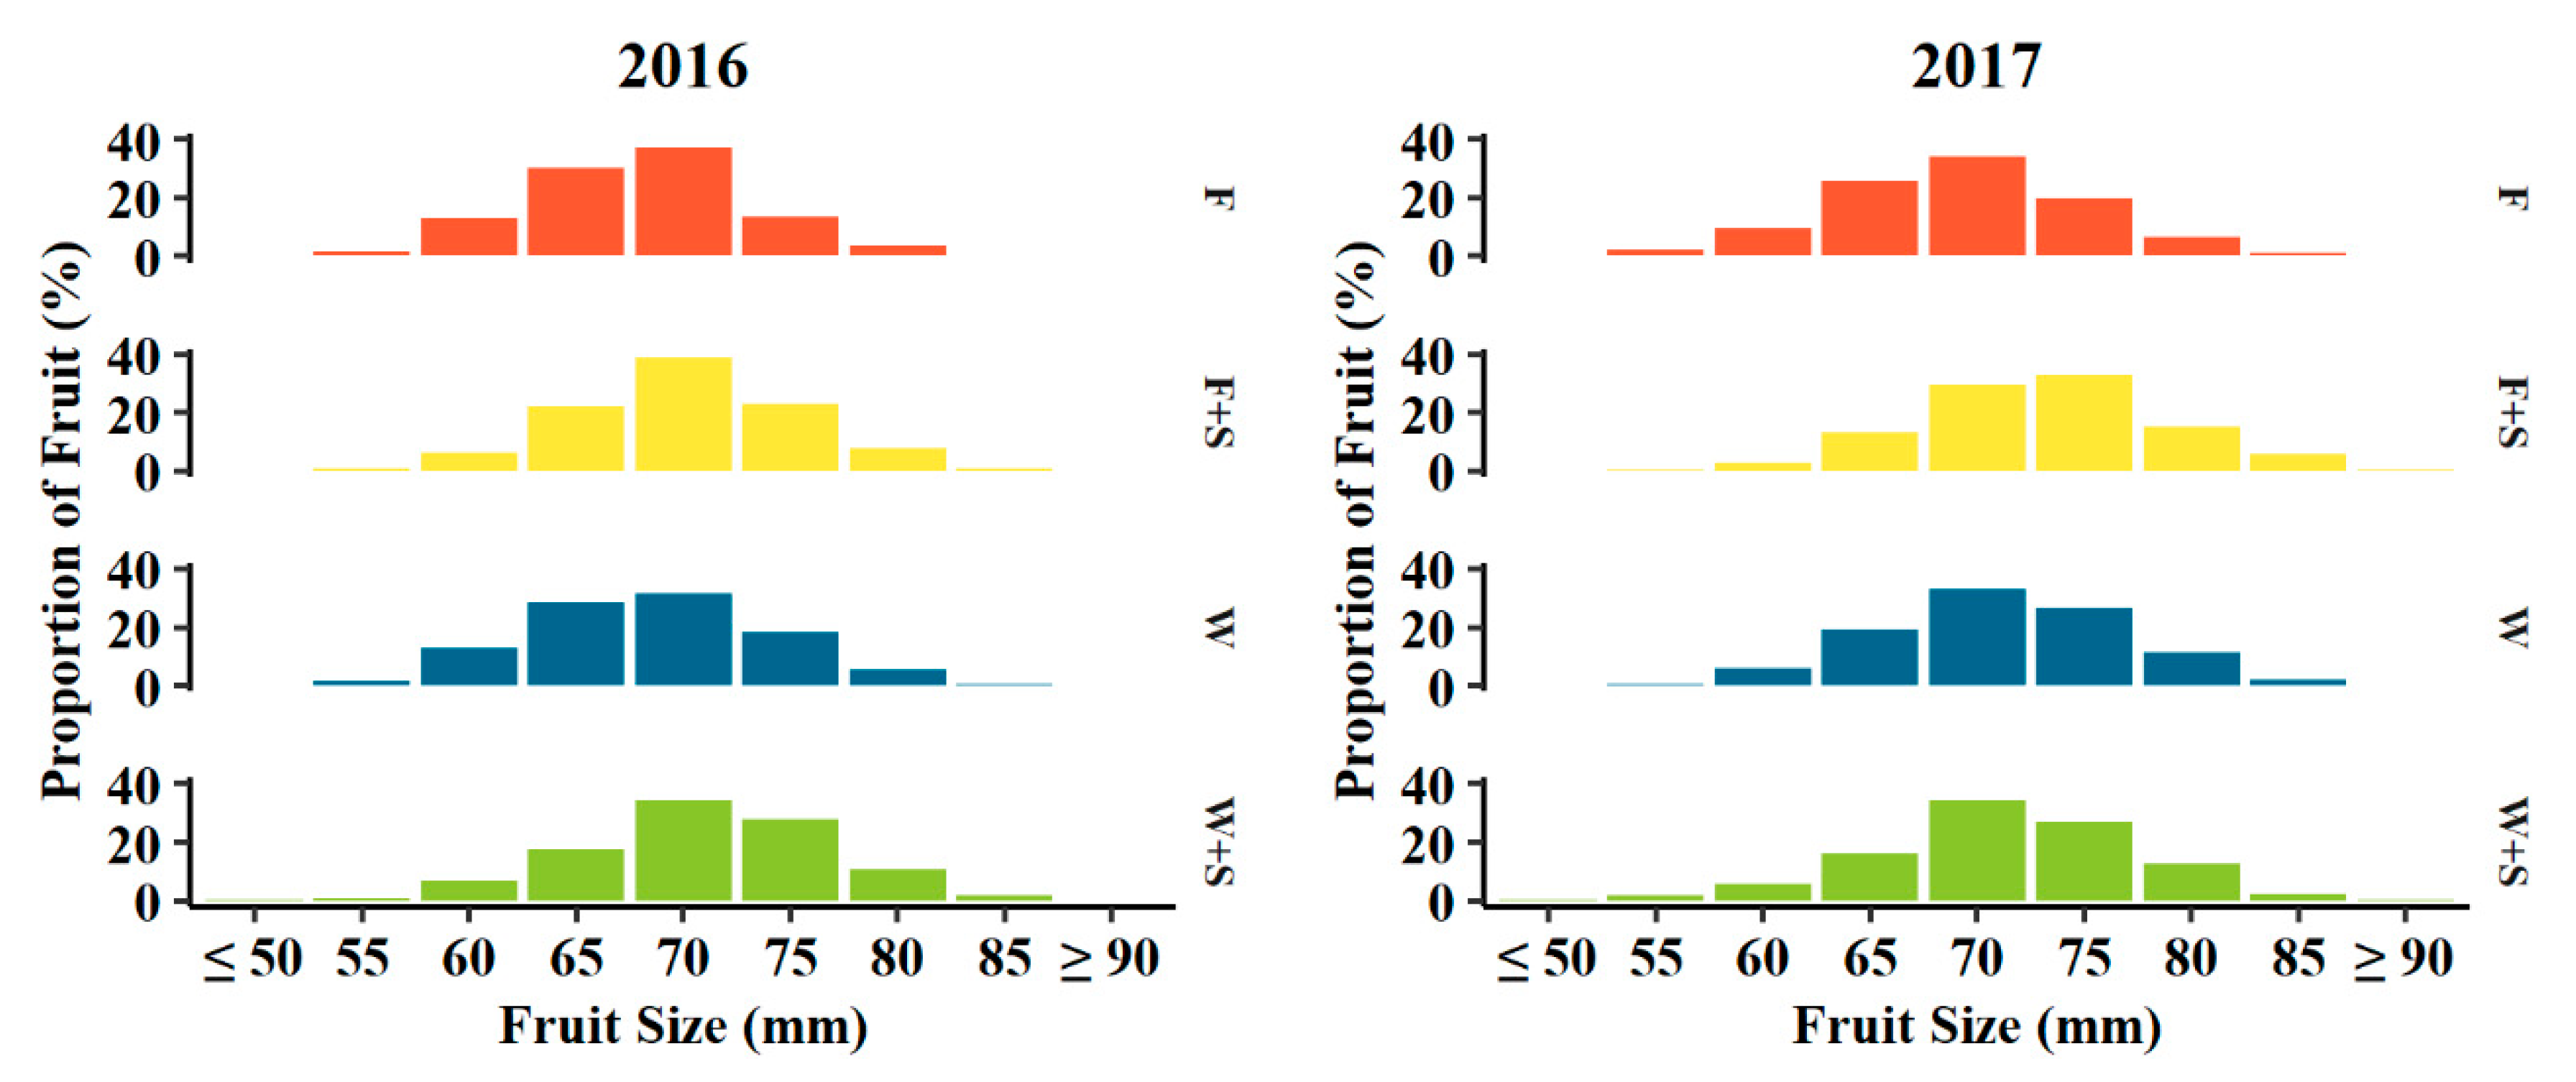
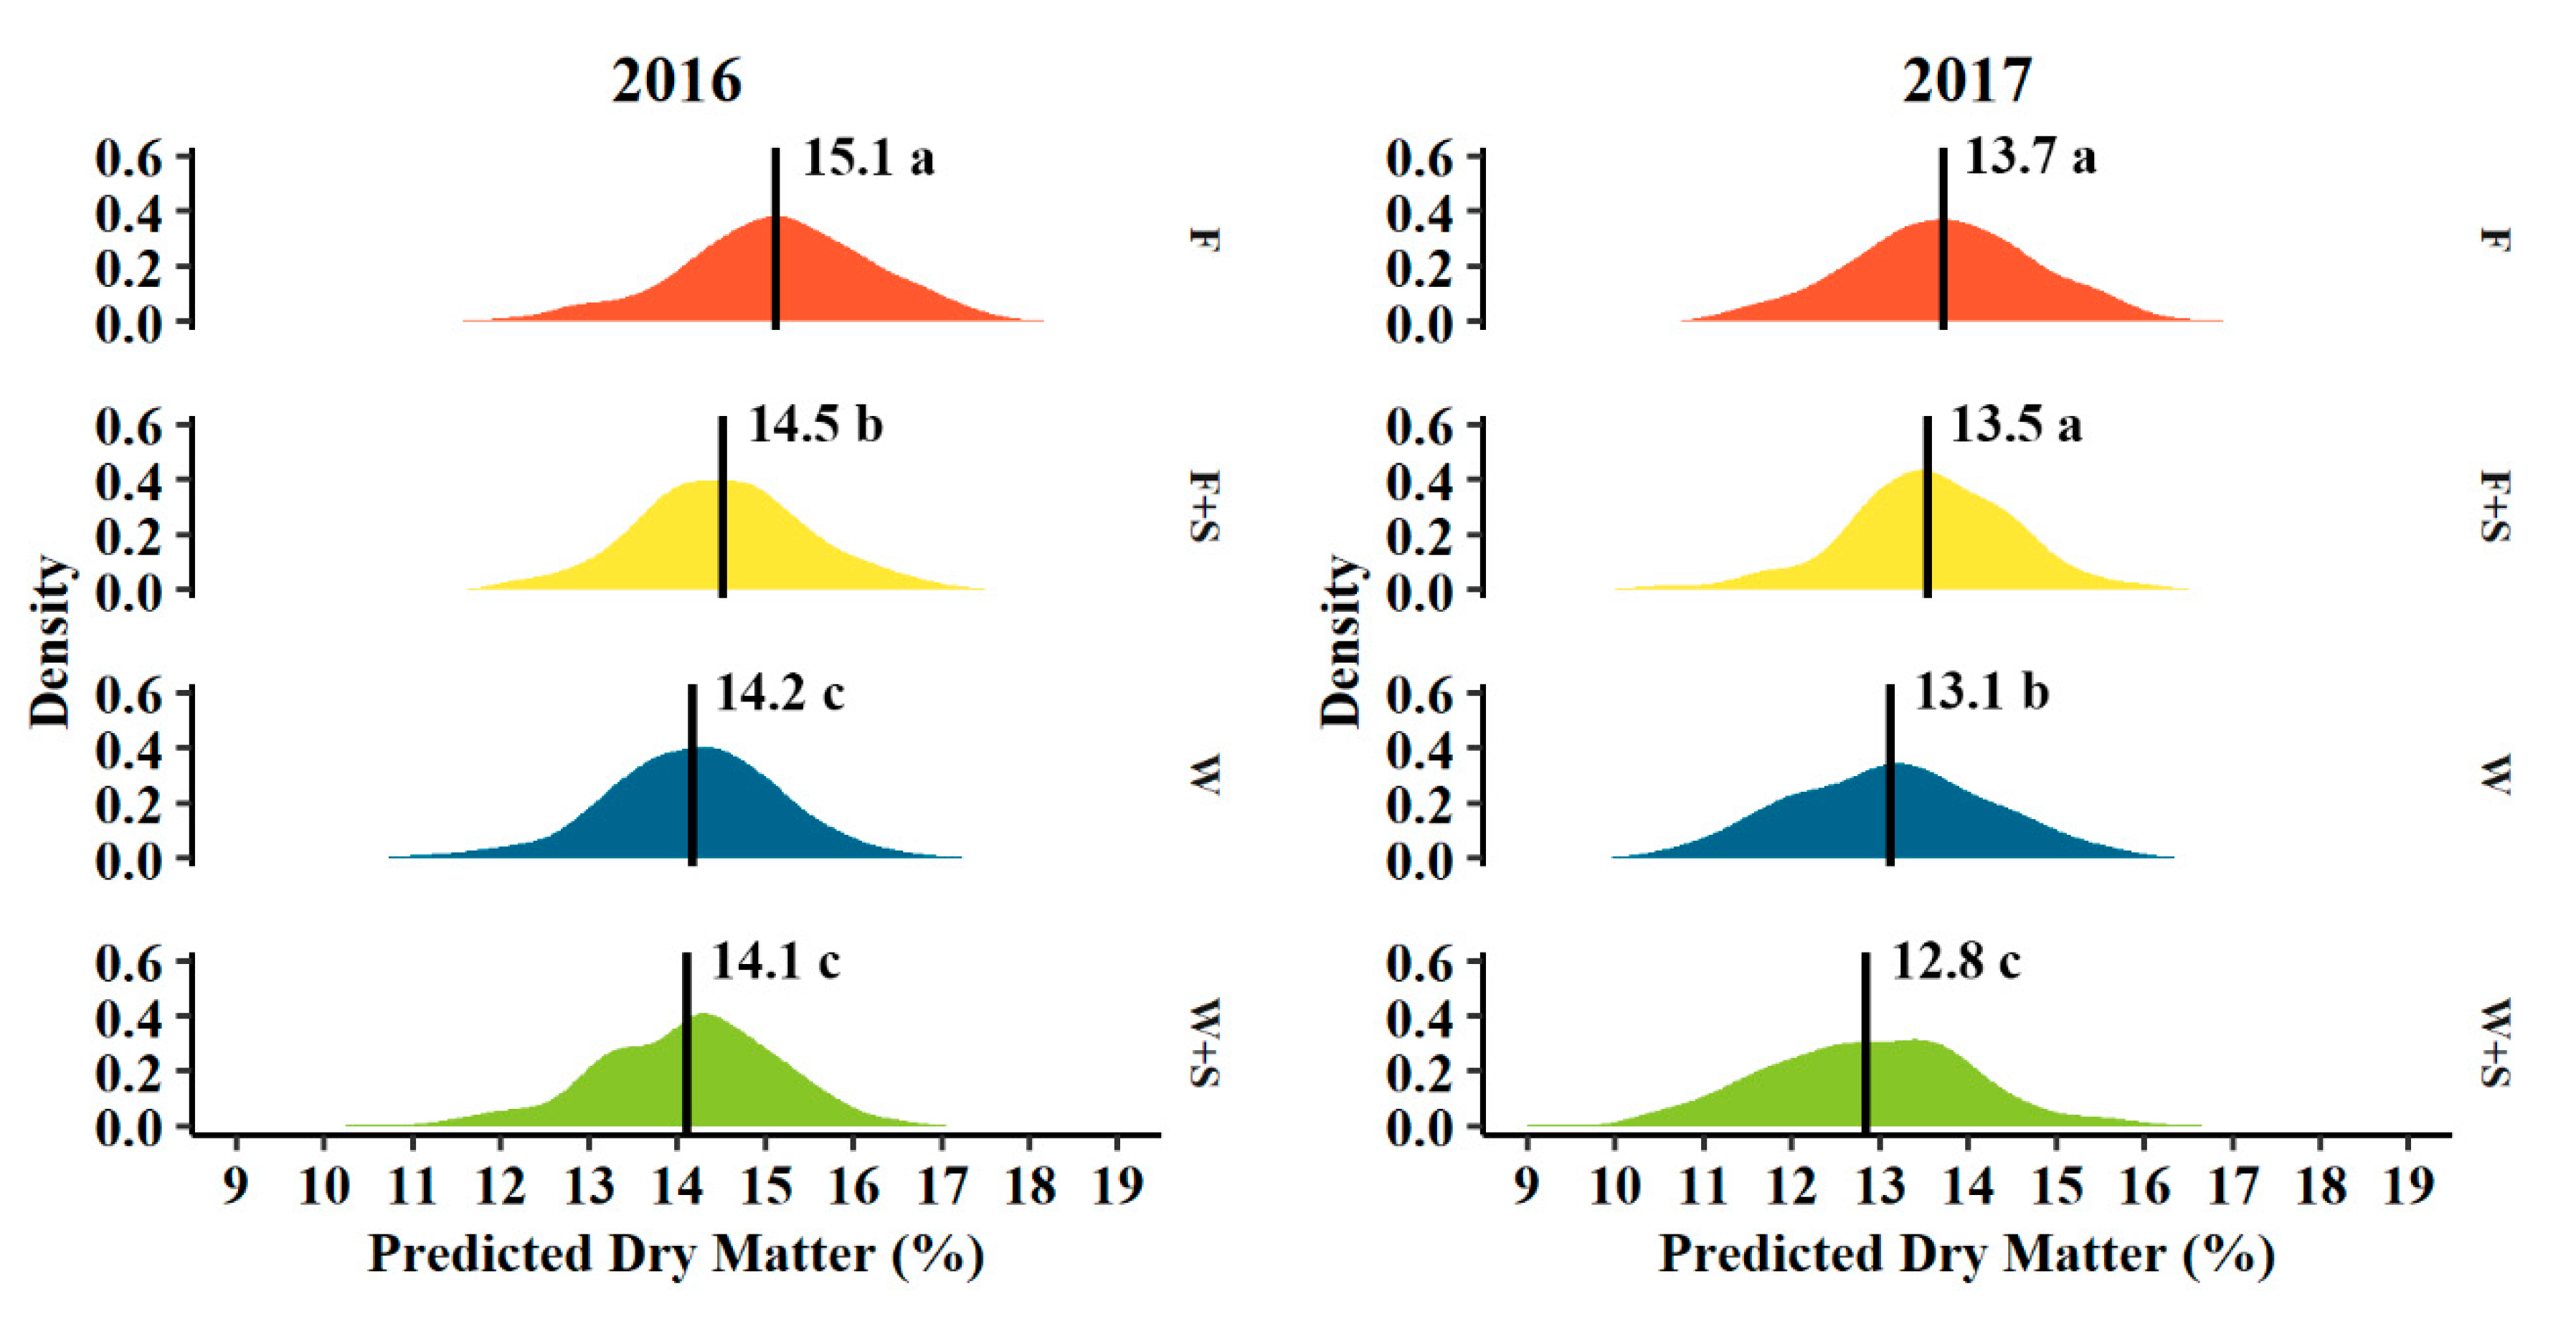
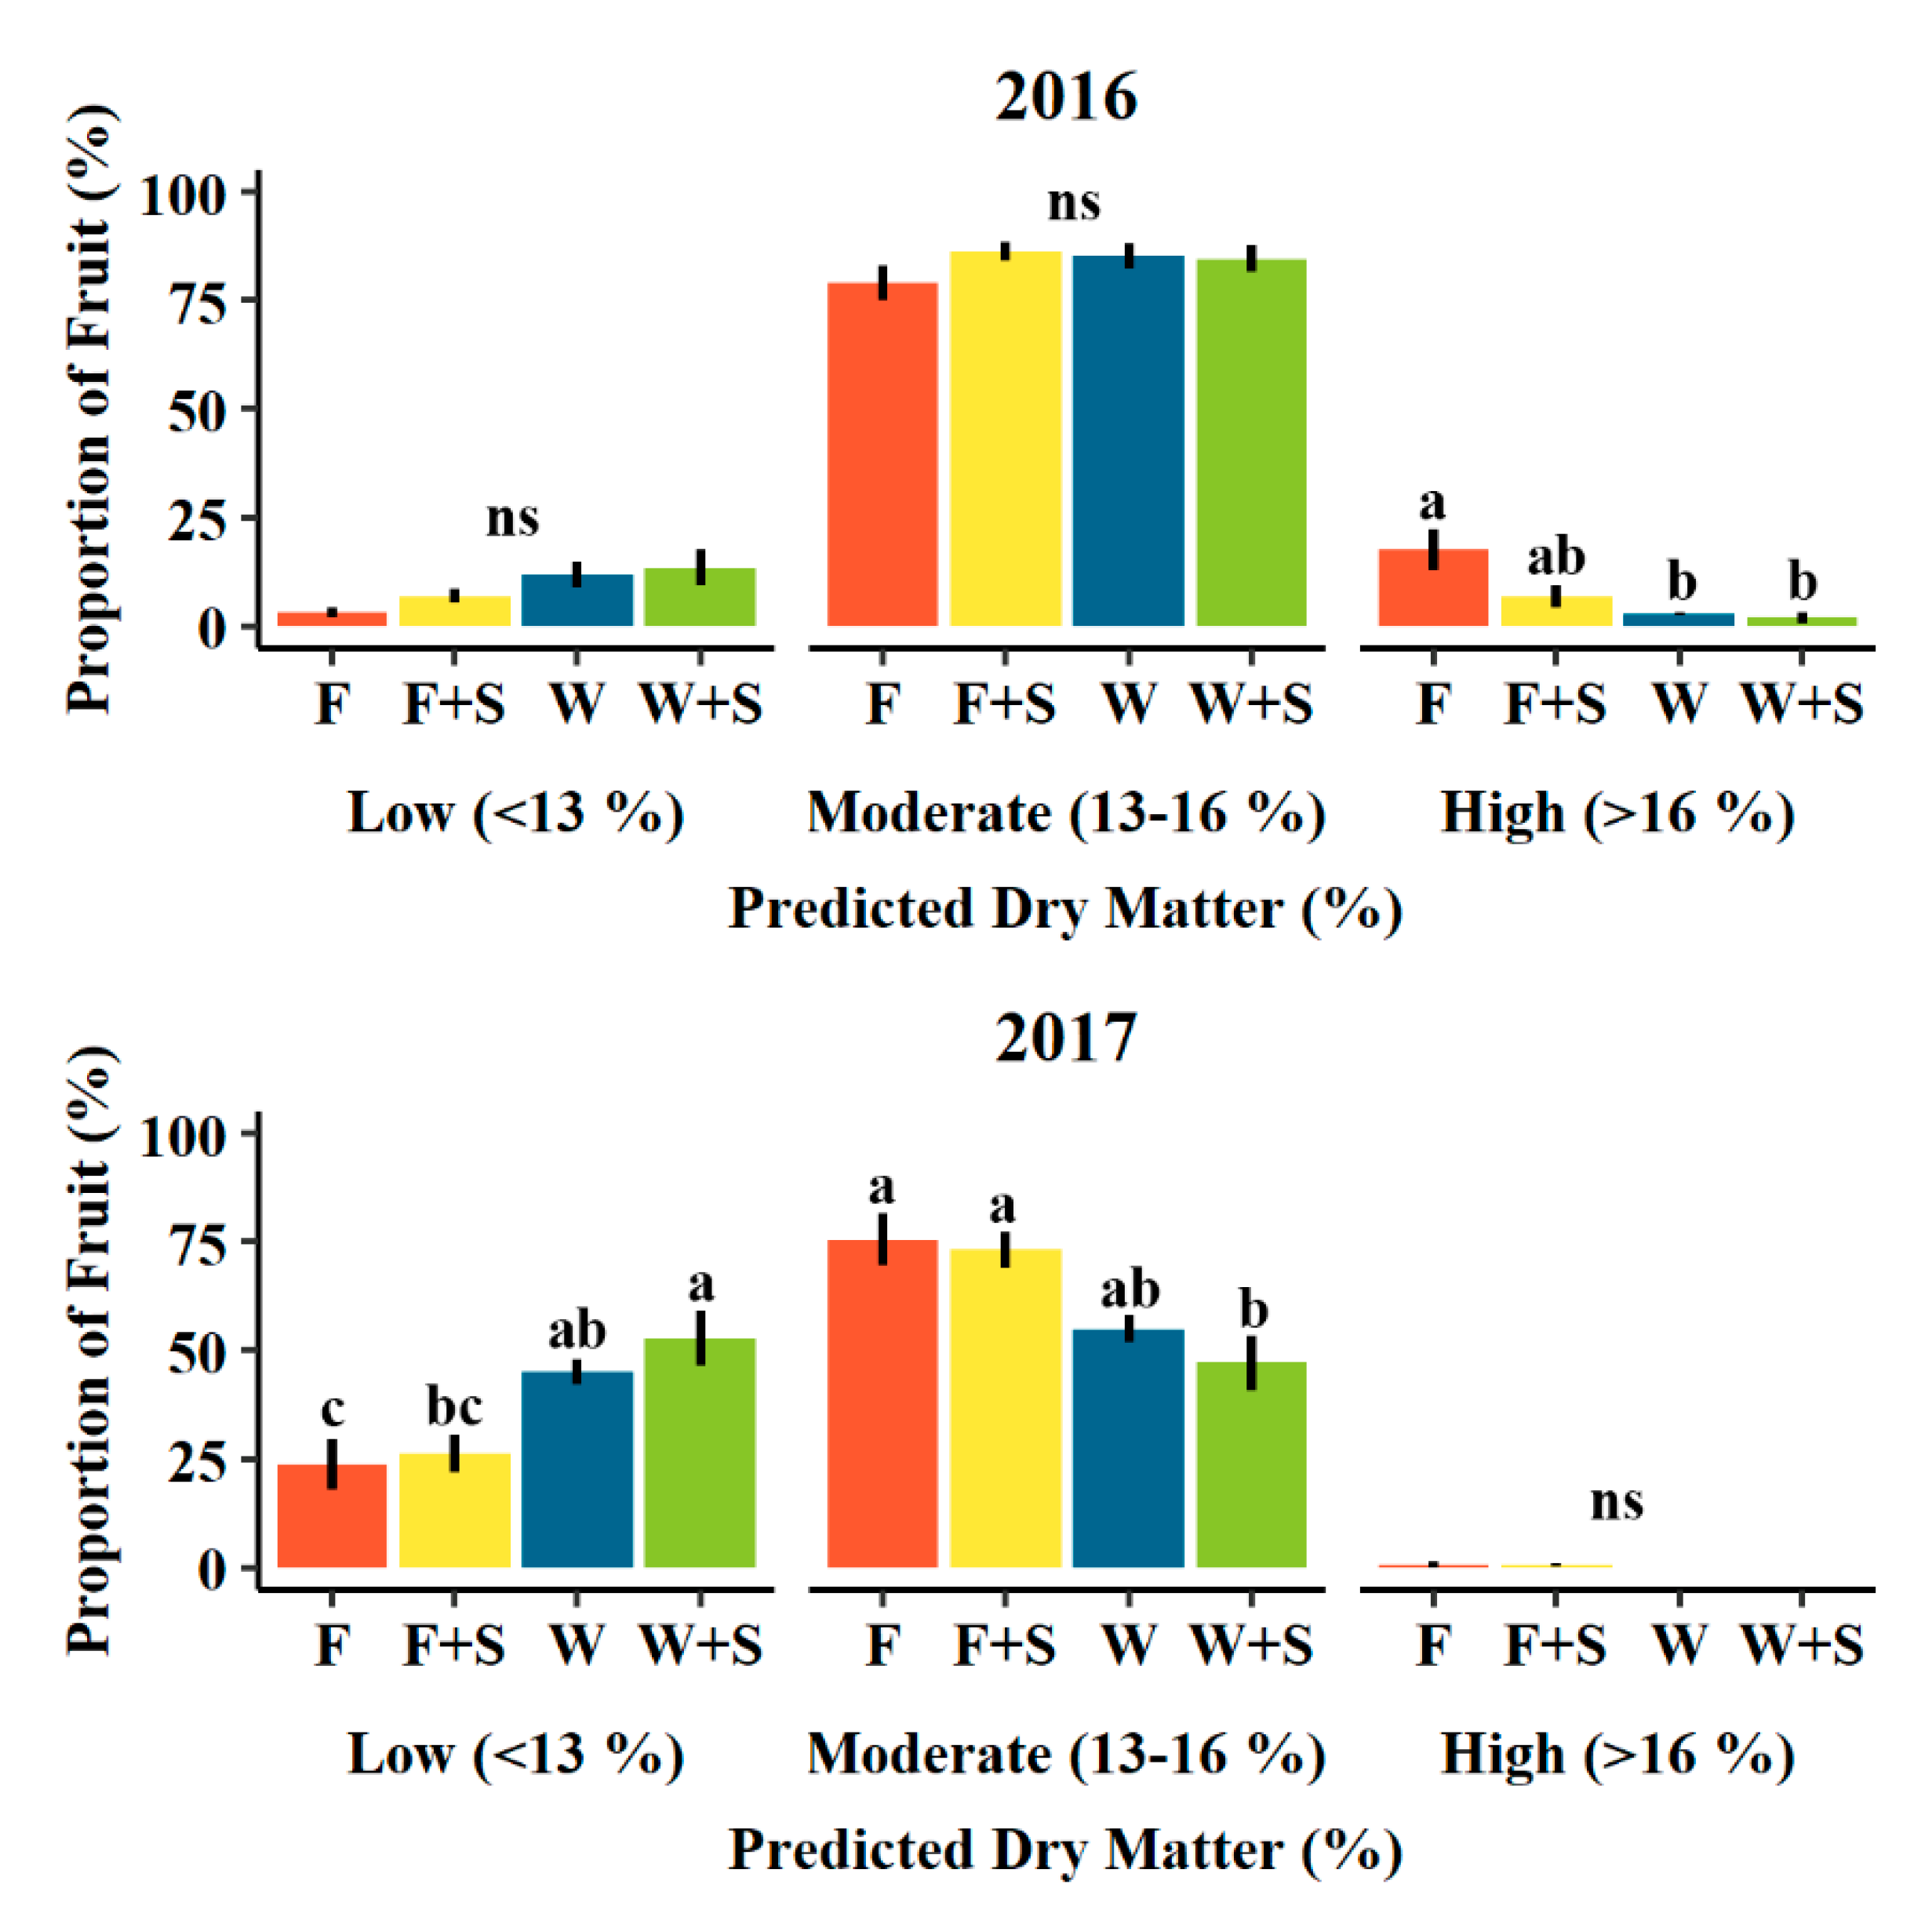
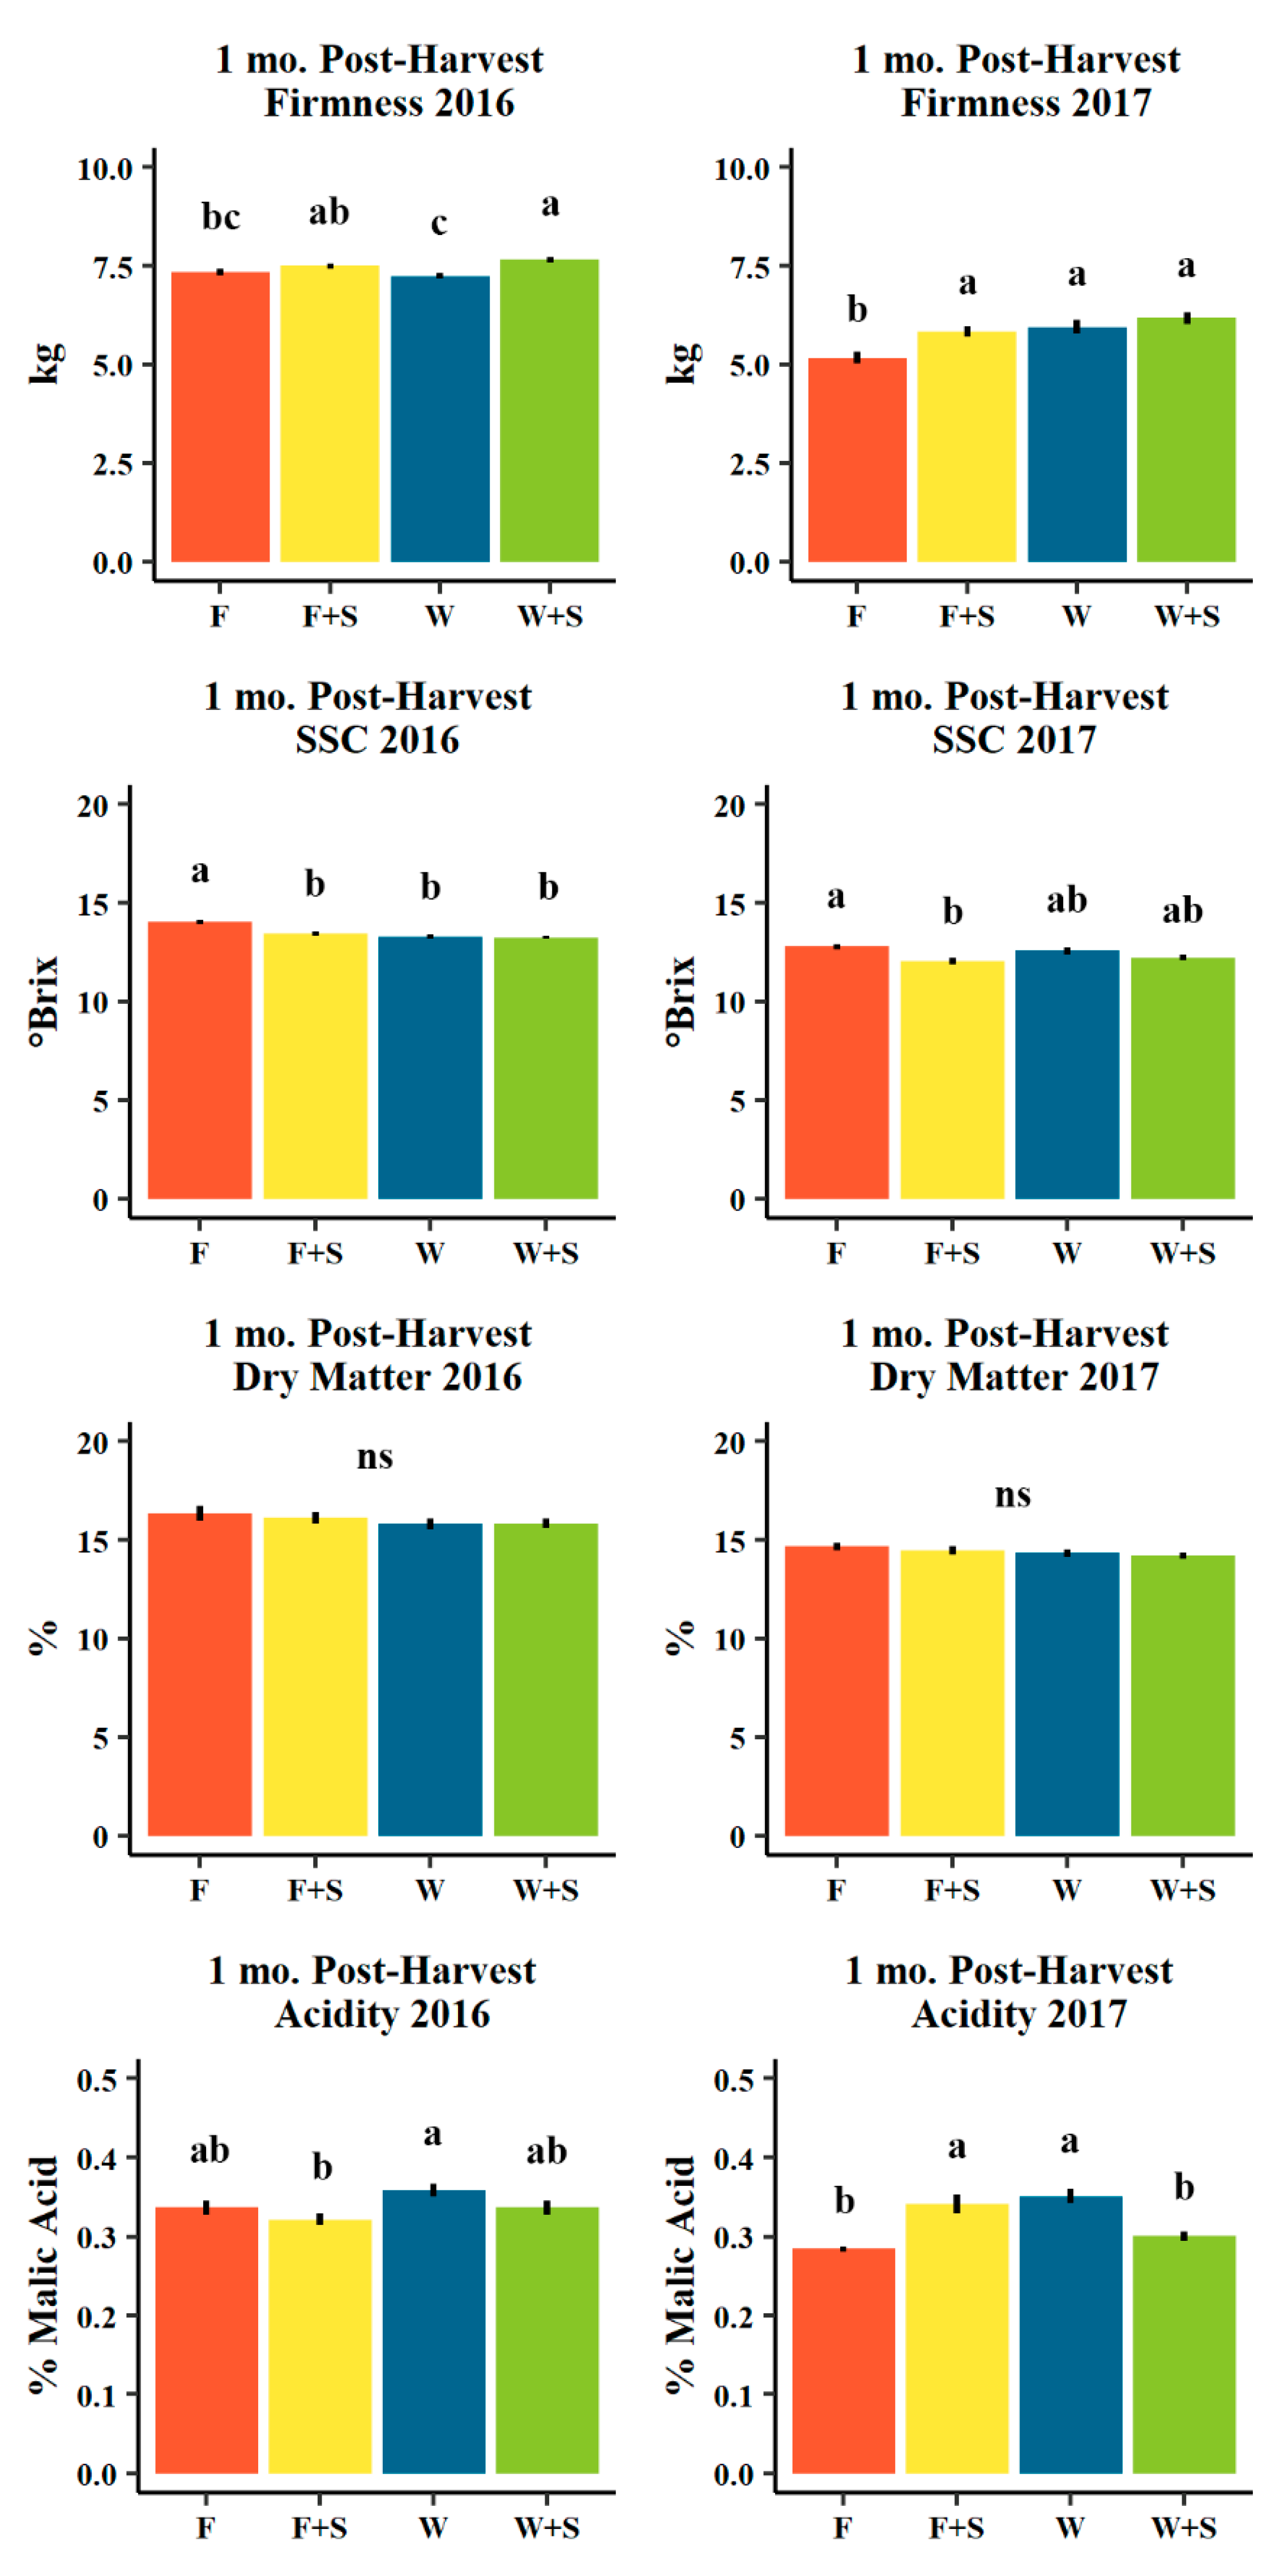
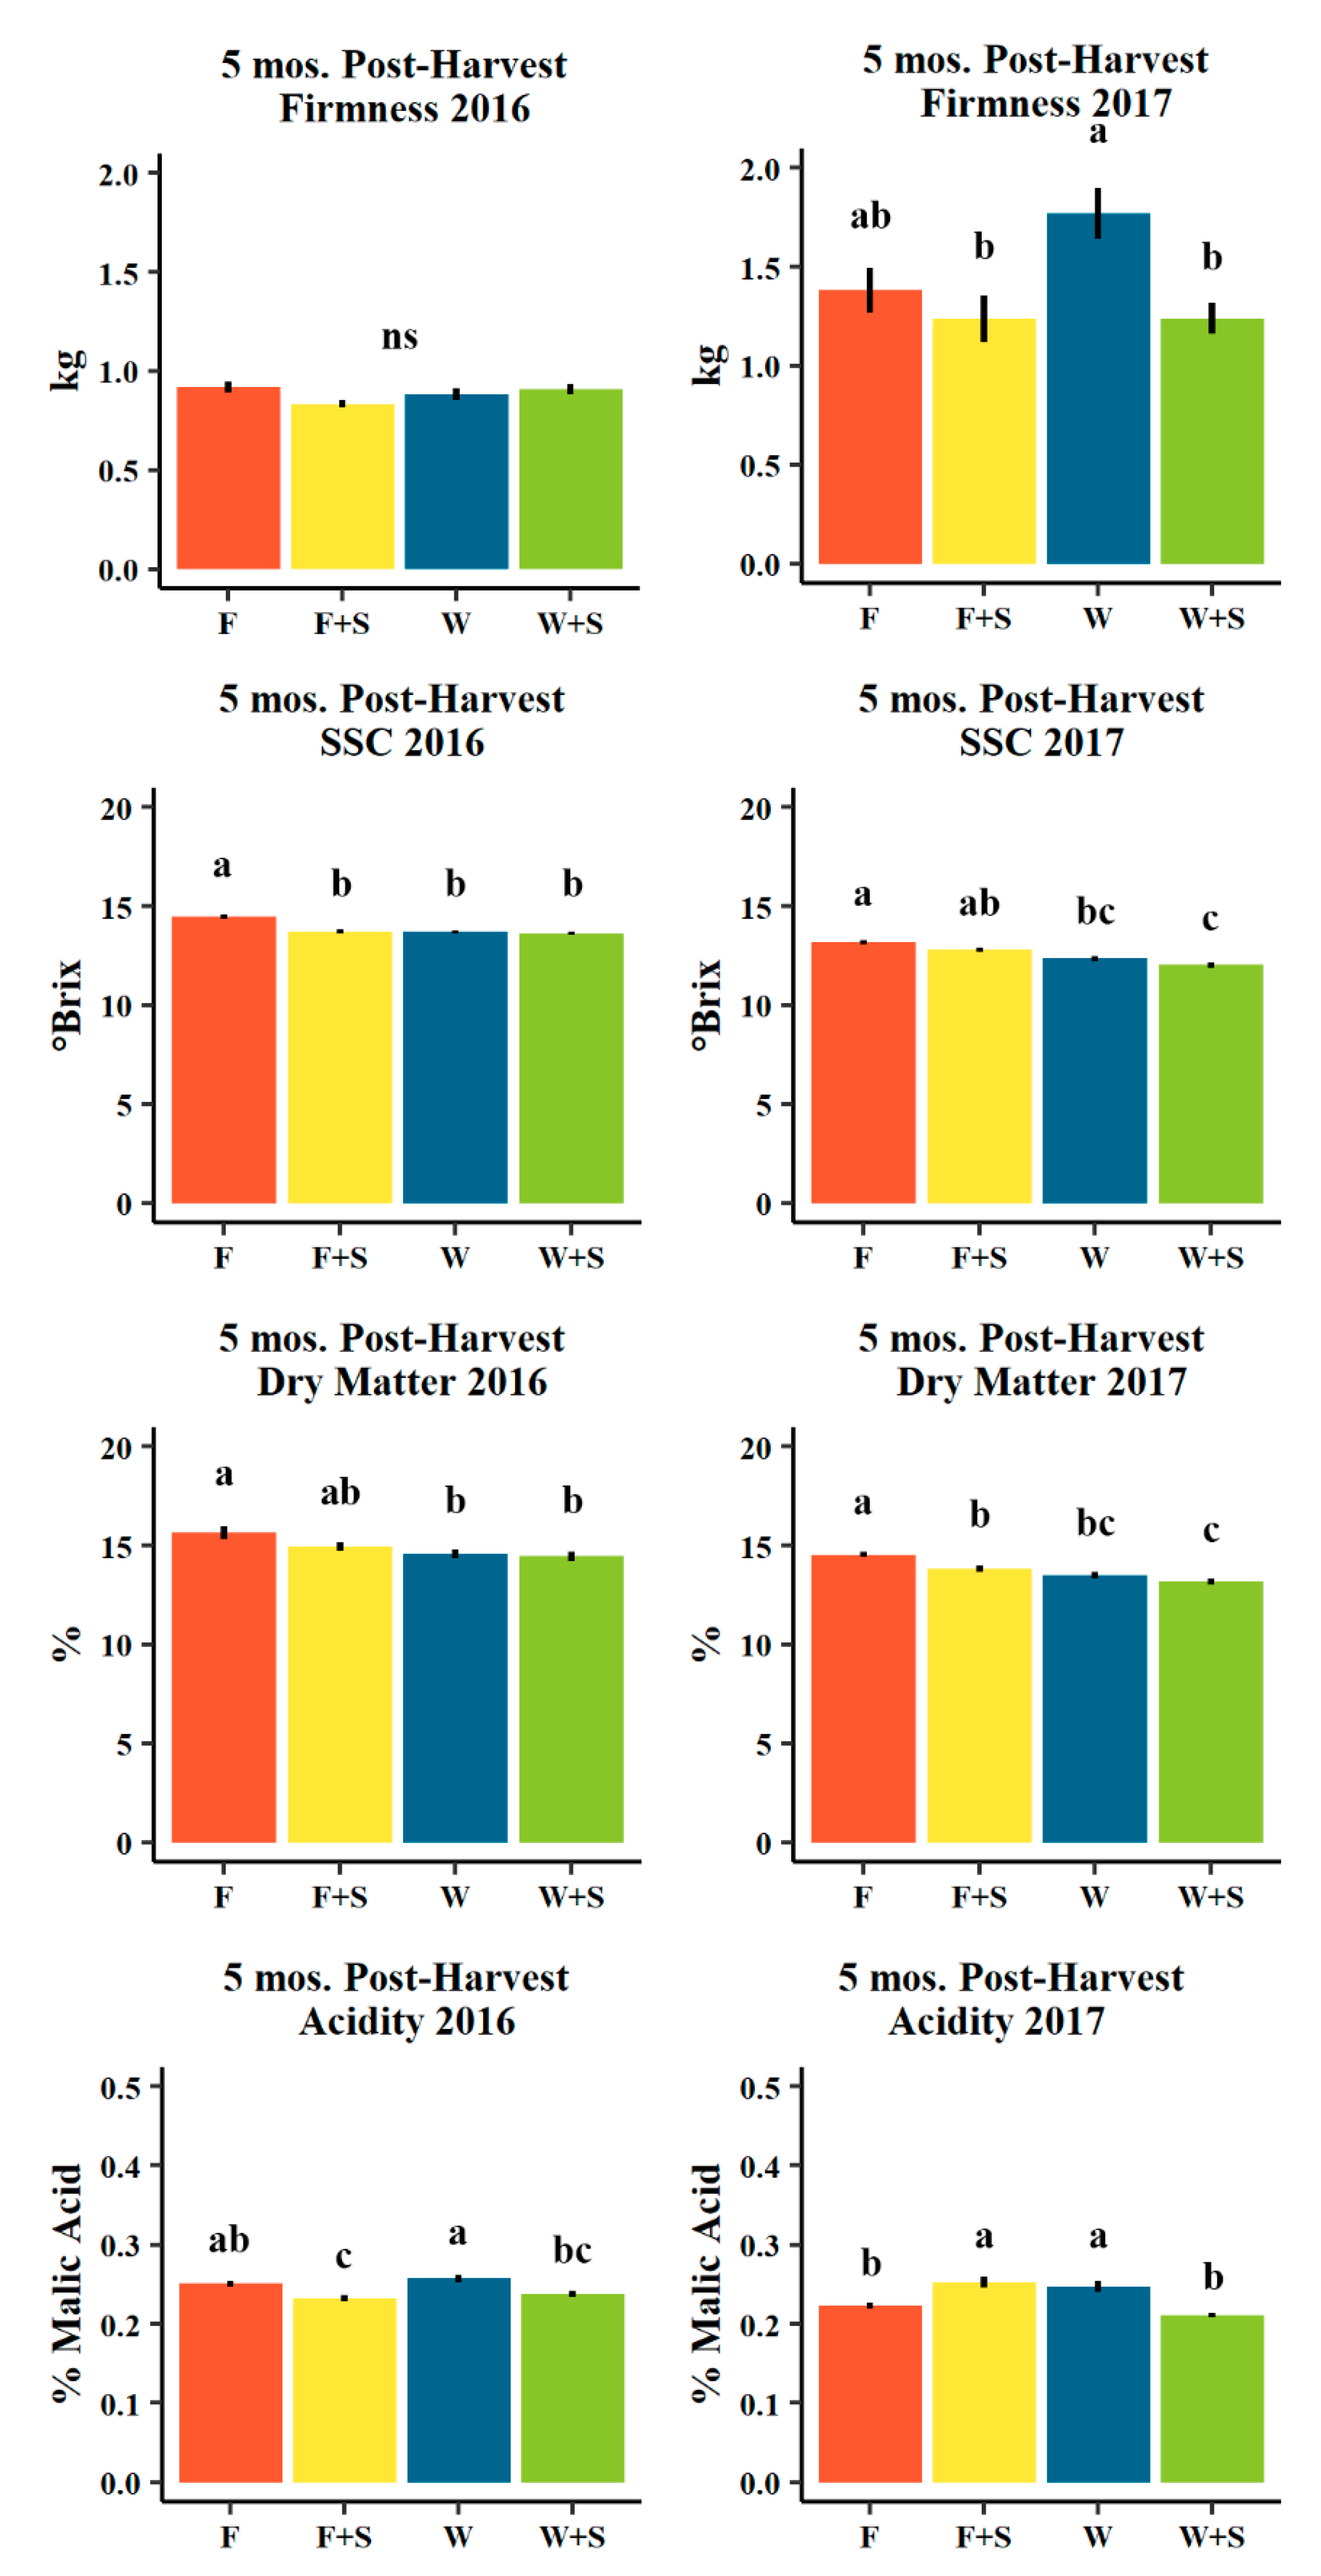
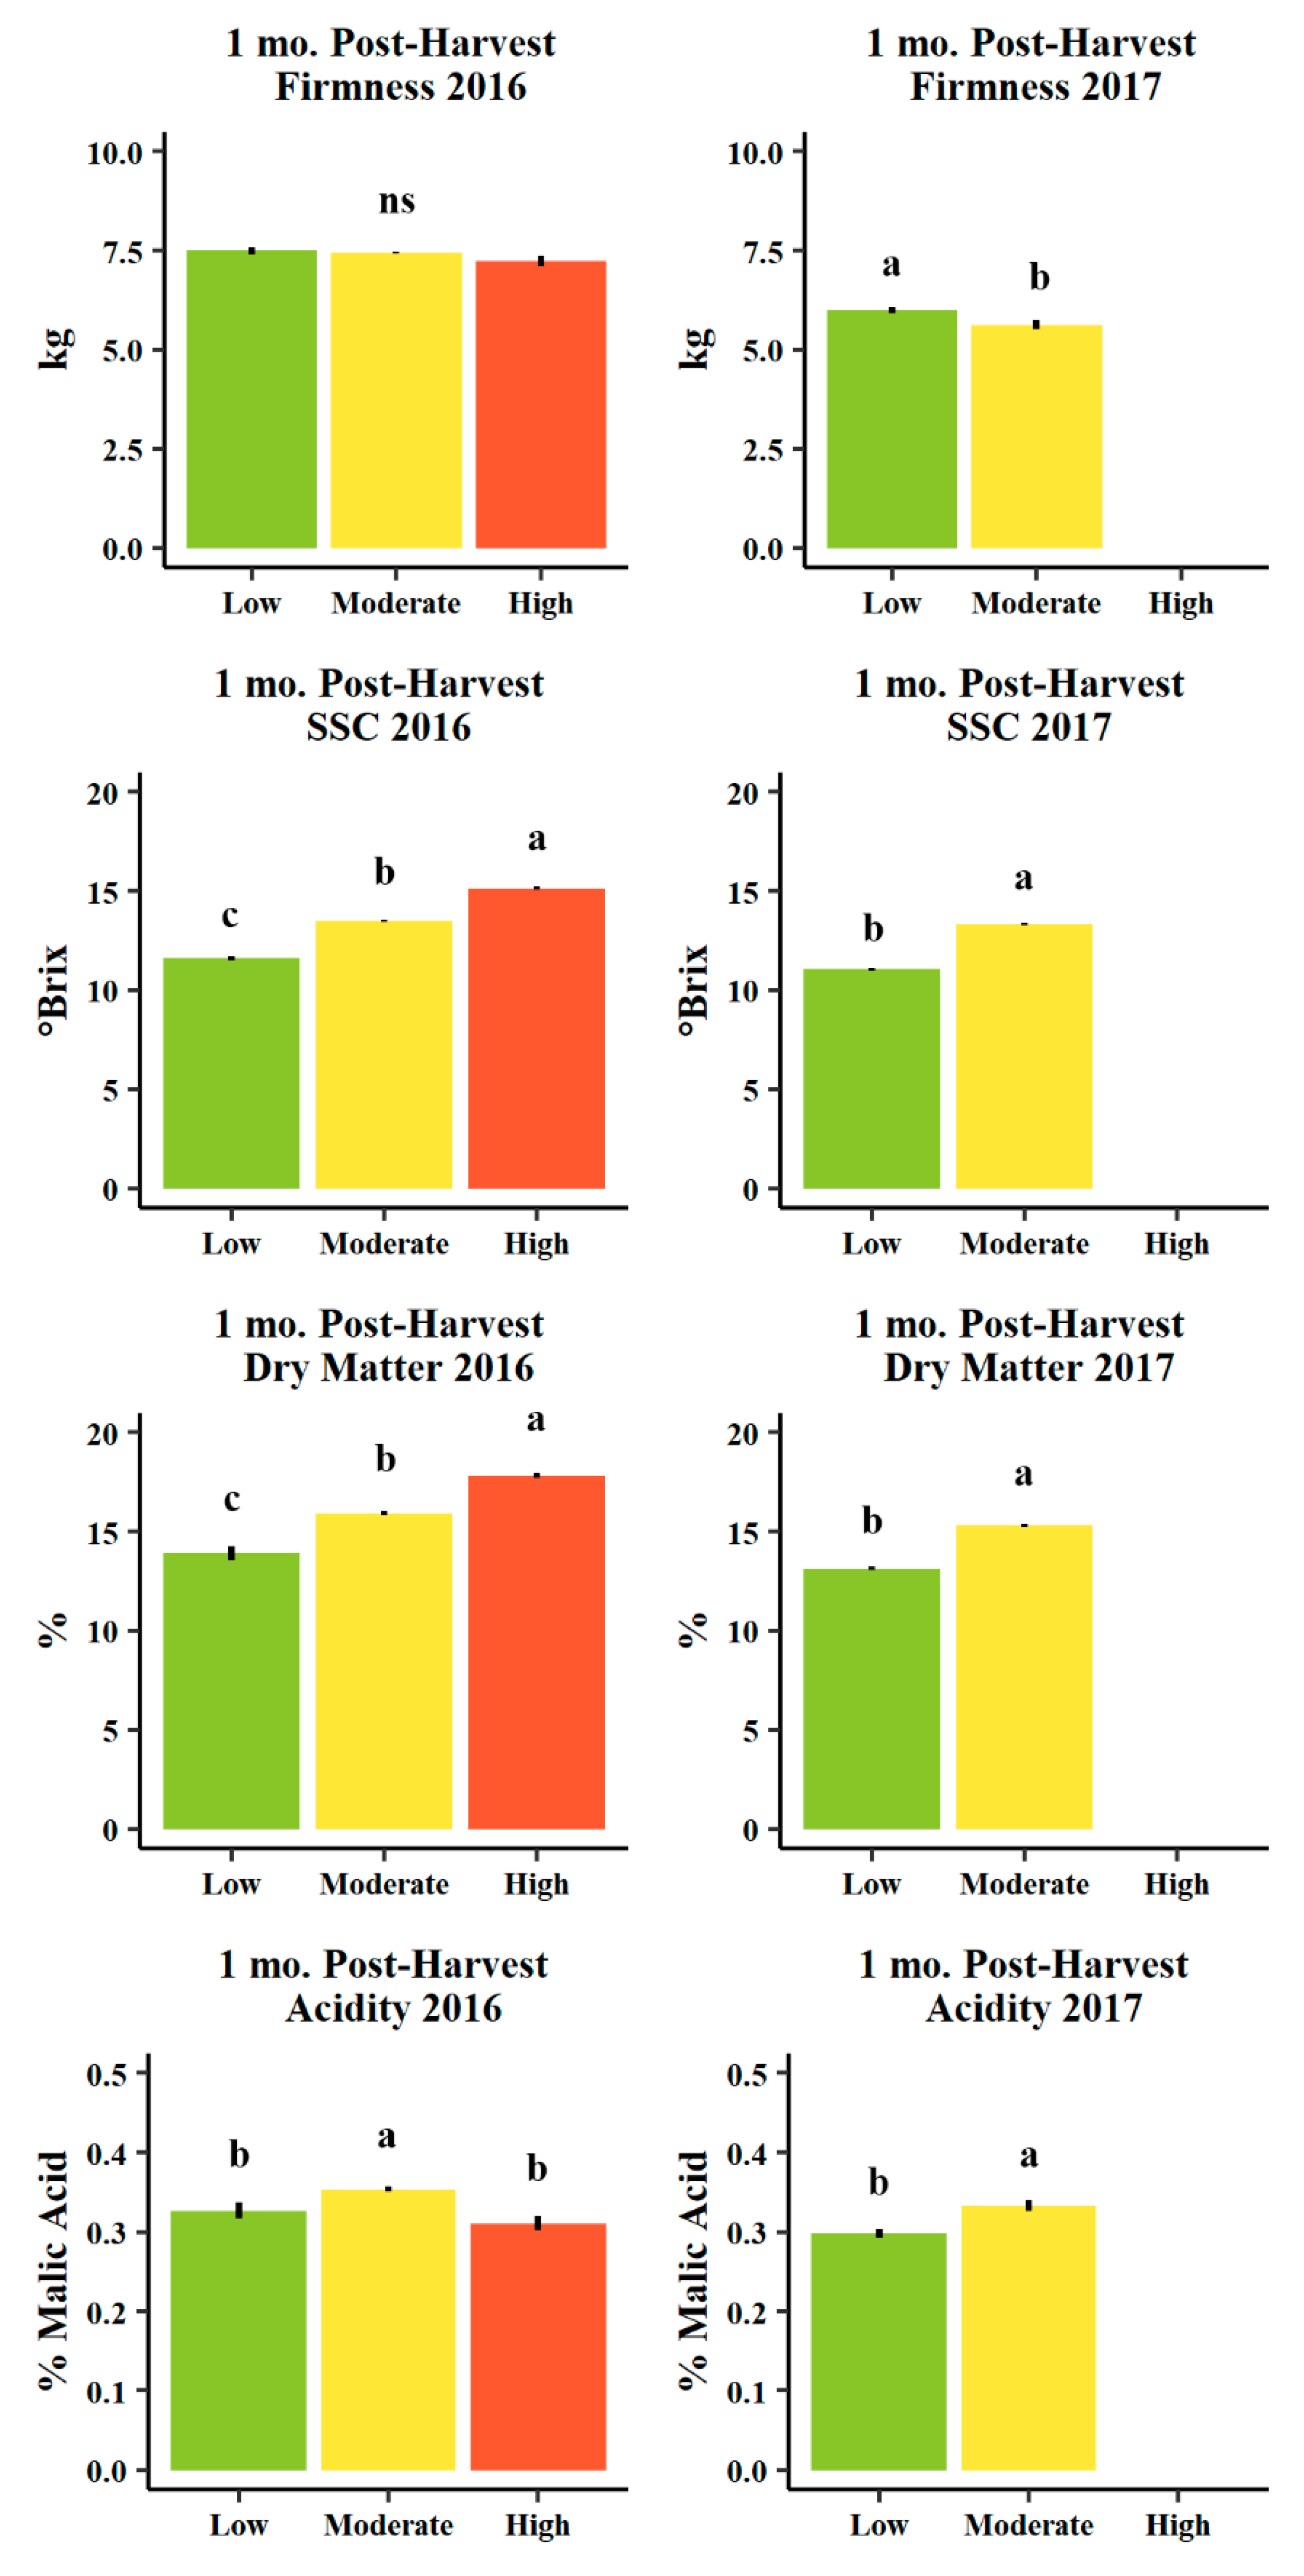
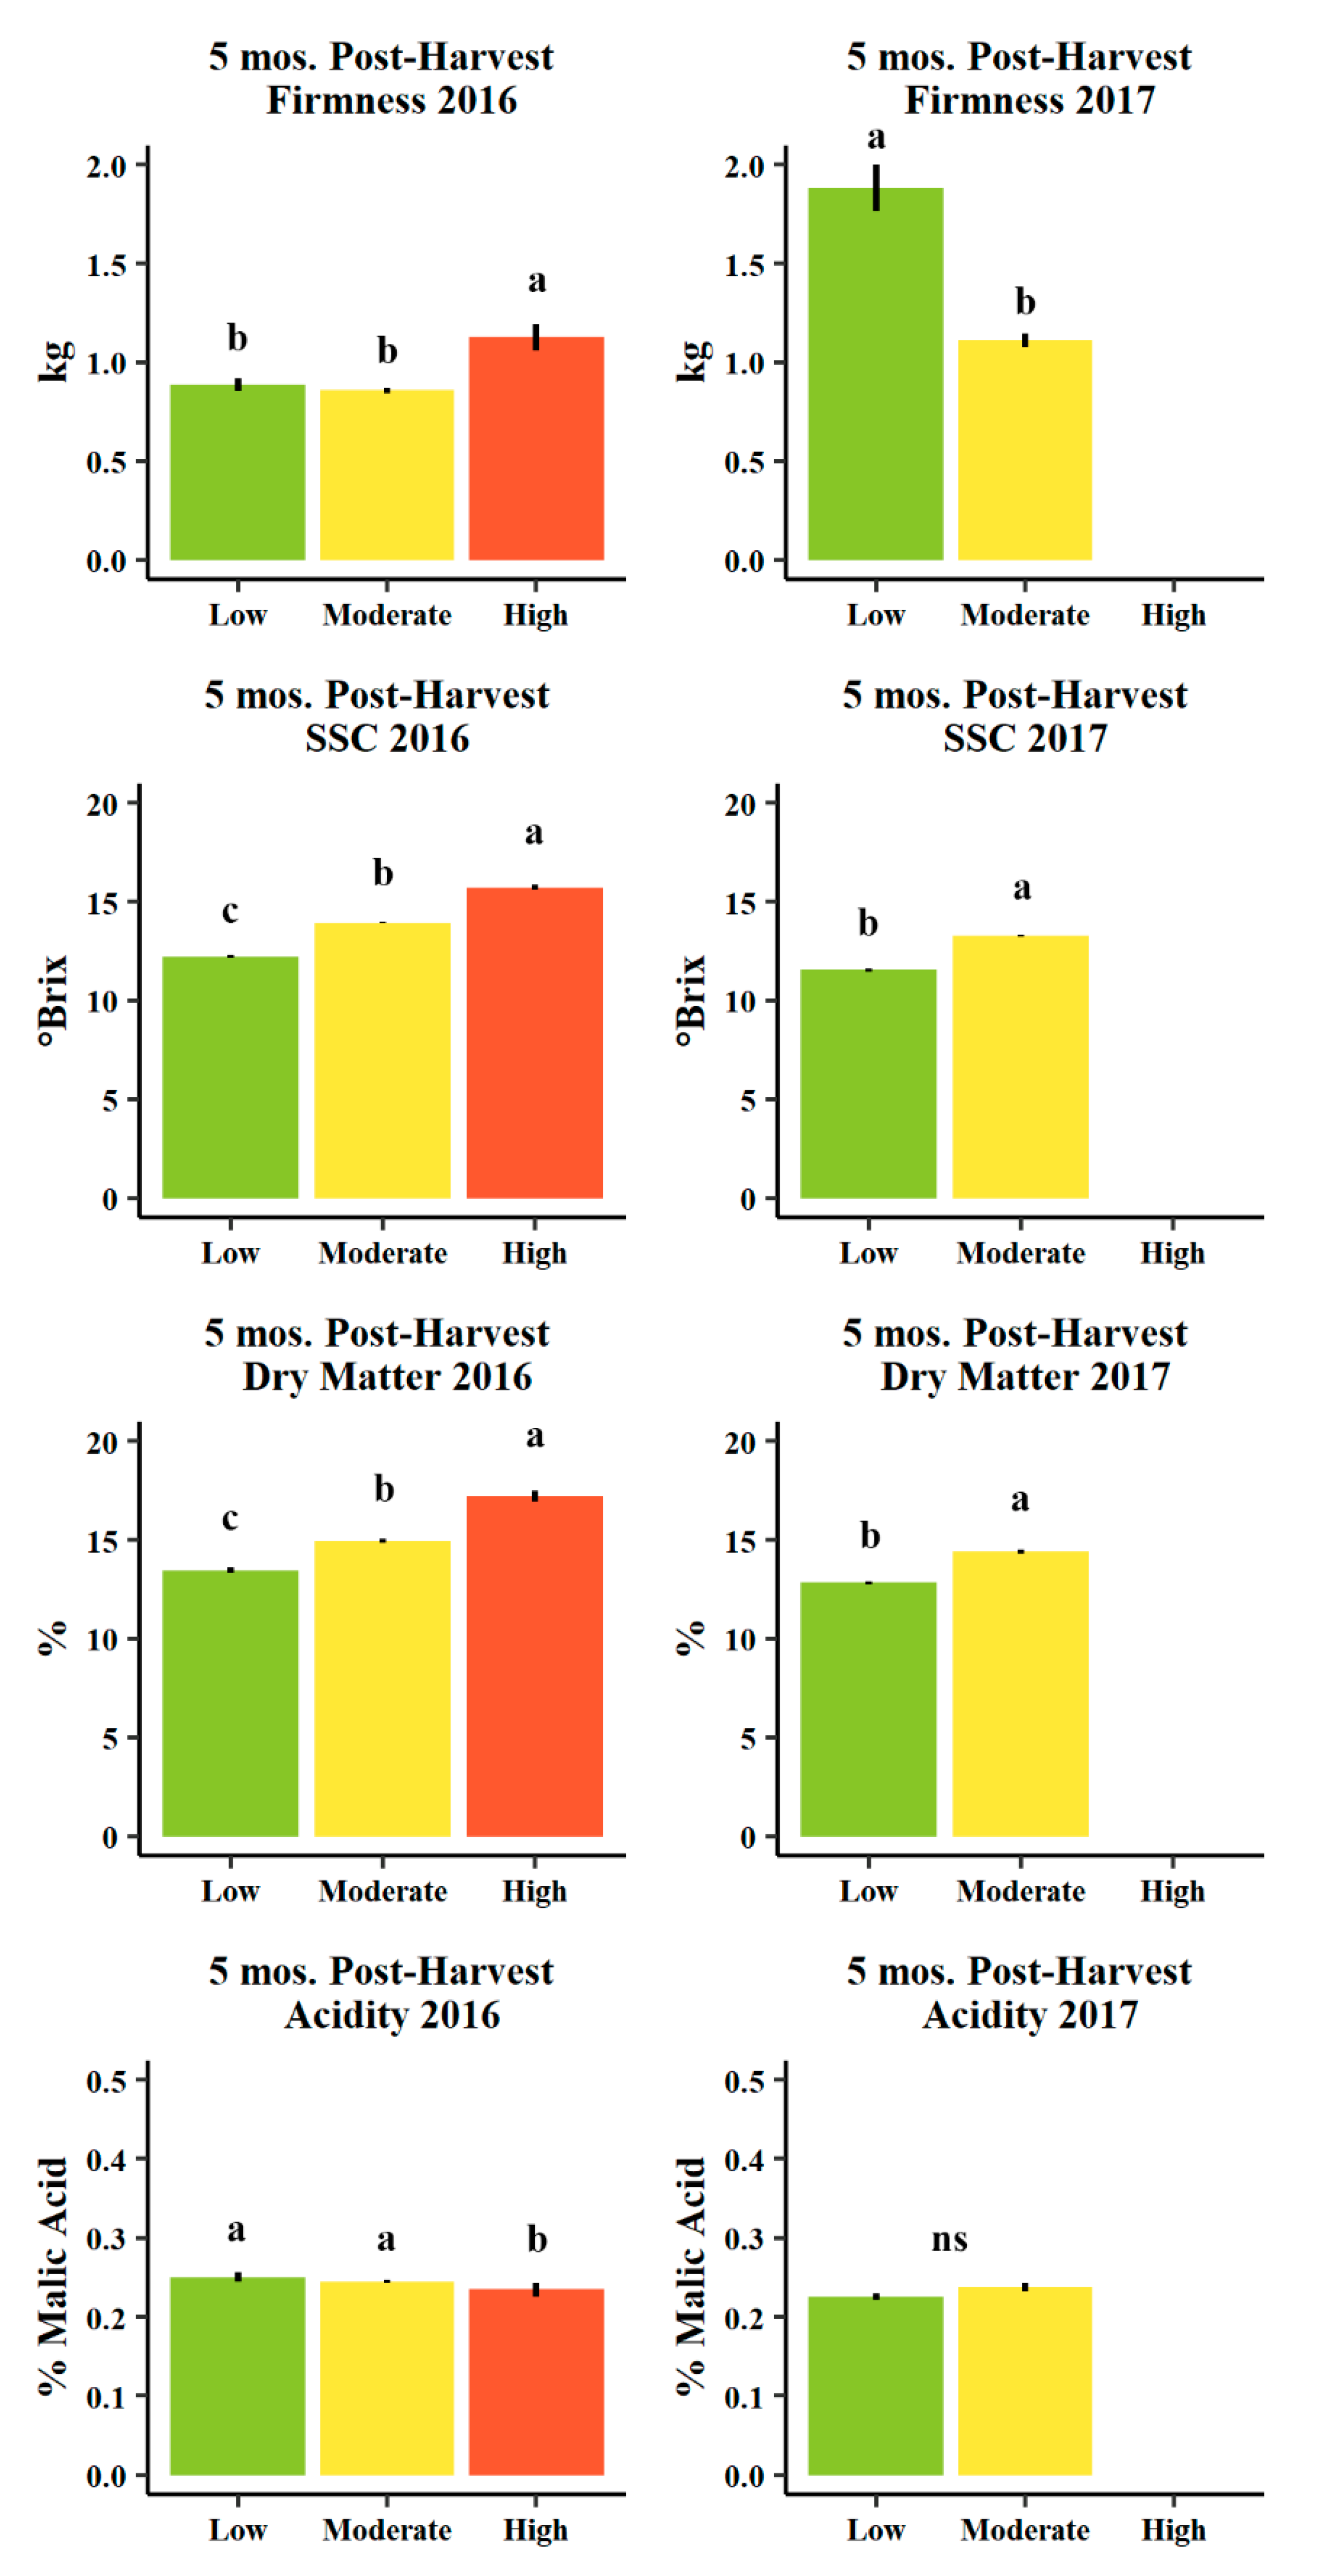
Table 1.
Index of absorbance difference (IAD), proportion of overcolor (%), background hue (h°), and background chroma (C*) in 2016 and 2017 harvest d’Anjou fruit evaluated one mo. post-harvest (within one month after harvest in cold storage plus seven days of ripening at room temperature, n = 487 and 350 in 2016 and 2017, respectively) and five mos. post-harvest (five months after harvest in cold storage plus seven days ripening at room temperature, n = 458 and 253 in 2016 and 2017, respectively) among seasonal pruning treatments consisting of fall pruning (F), fall and summer pruning (F+S), winter pruning (W), and winter and summer pruning (W+S). Different letters indicate significance difference among means (p < 0.05, Tukey HSD). “ns” indicates no significant difference among means (p > 0.05, Tukey HSD).
| 1 mo. Post-Harvest | |||||||||
|---|---|---|---|---|---|---|---|---|---|
| Year | Pruning | IAD | Overcolor (%) | Hue (°h) | Chroma (C*) | ||||
| 2016 | F | 1.81 | b | 9.2 | ns | 112.6 | ab | 43.9 | b |
| F+S | 1.92 | a | 12.4 | 113.0 | a | 43.5 | b | ||
| W | 1.86 | ab | 10.4 | 112.1 | b | 44.8 | a | ||
| W+S | 1.88 | a | 12.2 | 112.3 | b | 44.5 | a | ||
| 2017 | F | 1.76 | ns | 5.8 | ns | 111.6 | a | 44.4 | bc |
| F+S | 1.83 | 6.1 | 112.3 | a | 44.2 | c | |||
| W | 1.76 | 6.4 | 110.9 | b | 45.0 | a | |||
| W+S | 1.81 | 7.8 | 111.8 | a | 44.9 | ab | |||
| 5 Mos. Post-Harvest | |||||||||
| Year | Pruning | IAD | Overcolor (%) | Hue (°h) | Chroma (C*) | ||||
| 2016 | F | 0.84 | b | 9.2 | ns | 98.3 | b | 44.9 | b |
| F+S | 0.91 | b | 12.4 | 98.8 | b | 44.9 | b | ||
| W | 1.01 | a | 8.8 | 99.2 | b | 44.6 | b | ||
| W+S | 1.05 | a | 10.2 | 100.6 | a | 46.3 | a | ||
| 2017 | F | 1.17 | b | 9.0 | a | 102.7 | b | 45.0 | ab |
| F+S | 1.00 | c | 7.6 | ab | 102.7 | b | 45.3 | ab | |
| W | 1.37 | a | 3.3 | b | 104.3 | ab | 44.6 | b | |
| W+S | 1.26 | ab | 5.6 | ab | 104.9 | a | 45.7 | a | |
Table 2.
Index of absorbance difference (IAD), proportion of overcolor (%), background hue (h°), and background chroma (C*) in 2016 and 2017 harvest d’Anjou fruit evaluated one mo. post-harvest (within one month after harvest in cold storage plus seven days of ripening at room temperature, n = 487 and 350 in 2016 and 2017, respectively) and five mos. post-harvest (five months after harvest in cold storage plus seven days ripening at room temperature, n = 458 and 253 in 2016 and 2017, respectively) among low (<13%), moderate (13–16%), and high (>16%) predicted dry matter. Different letters indicate significance difference among means (p < 0.05, Tukey HSD). “ns” indicates no significant difference among means (p > 0.05, Tukey HSD).
| 1 mo. Post-Harvest | |||||||||
|---|---|---|---|---|---|---|---|---|---|
| Year | Dry Matter Class | IAD | Overcolor (%) | Hue (°h) | Chroma (C*) | ||||
| 2016 | Low | 2.04 | a | 3.5 | c | 112.9 | a | 44.0 | ns |
| Moderate | 1.89 | b | 9.5 | b | 112.6 | a | 44.1 | ||
| High | 1.64 | c | 25.4 | a | 111.5 | b | 44.4 | ||
| 2017 | Low | 1.87 | a | 1.6 | b | 111.8 | 44.7 | ns | |
| Moderate | 1.73 | b | 10.1 | a | 111.6 | 44.6 | |||
| High | - | - | - | - | |||||
| 5 mos. Post-Harvest | |||||||||
| Year | Dry Matter Class | IAD | Overcolor (%) | Hue (°h) | Chroma (C*) | ||||
| 2016 | Low | 1.36 | a | 2.4 | c | 102.3 | a | 46.3 | a |
| Moderate | 0.91 | b | 9.9 | b | 98.9 | b | 45.0 | b | |
| High | 0.72 | c | 24.2 | a | 96.7 | c | 44.2 | b | |
| 2017 | Low | 1.46 | a | 2.6 | b | 105.7 | a | 45.3 | ns |
| Moderate | 1.04 | b | 8.8 | a | 102.4 | b | 45.0 | ||
| High | - | - | - | - | |||||
© 2020 by the authors. Licensee MDPI, Basel, Switzerland. This article is an open access article distributed under the terms and conditions of the Creative Commons Attribution (CC BY) license (http://creativecommons.org/licenses/by/4.0/).
Share and Cite
MDPI and ACS Style
Goke, A.; Serra, S.; Musacchi, S. Manipulation of Fruit Dry Matter via Seasonal Pruning and Its Relationship to d’Anjou Pear Yield and Fruit Quality. Agronomy 2020, 10, 897. https://0-doi-org.brum.beds.ac.uk/10.3390/agronomy10060897
AMA Style
Goke A, Serra S, Musacchi S. Manipulation of Fruit Dry Matter via Seasonal Pruning and Its Relationship to d’Anjou Pear Yield and Fruit Quality. Agronomy. 2020; 10(6):897. https://0-doi-org.brum.beds.ac.uk/10.3390/agronomy10060897
Chicago/Turabian StyleGoke, Alex, Sara Serra, and Stefano Musacchi. 2020. "Manipulation of Fruit Dry Matter via Seasonal Pruning and Its Relationship to d’Anjou Pear Yield and Fruit Quality" Agronomy 10, no. 6: 897. https://0-doi-org.brum.beds.ac.uk/10.3390/agronomy10060897
Note that from the first issue of 2016, this journal uses article numbers instead of page numbers. See further details here.