Effects of Rice Husk Biochar on Carbon Release and Nutrient Availability in Three Cultivation Age of Greenhouse Soils


Department of Forestry and Natural Resources, National Ilan University, Ilan 26047, Taiwan
*
Author to whom correspondence should be addressed.
Agronomy 2020, 10(7), 990; https://0-doi-org.brum.beds.ac.uk/10.3390/agronomy10070990
Submission received: 10 June 2020
/
Revised: 7 July 2020
/
Accepted: 8 July 2020
/
Published: 10 July 2020
(This article belongs to the Special Issue Effects of Agricultural Management on Soil Properties and Health)
Abstract
:Greenhouse production can contribute to the accumulation of salt and heavy metals and nutrient imbalance, thus, increasingly degrading greenhouse soils. The potential of rice husk biochar to increase carbon sequestration, neutralize soil pH, increase nutrient retention, and change nutrient/heavy metal sorption/desorption in greenhouse soils is promising. Therefore, we investigated three greenhouse soils (red soil) with 3, 14, and 24 cultivation years (3S, 14S, and 24S) in northern Taiwan to test the effects of rice husk biochar (RHB) on carbon dynamics and nutrient availability. A 100-day incubation study was conducted in which poultry-livestock manure compost (2% by wt.) and six rice-husk-based, slow-pyrolysis biochars pyrolyzed at different temperatures were applied (0%, 0.5%, 1.0%, 4.0%, 10%, and 20% by wt.) to three red soils. The study results indicated that the RHB pyrolyzed at high temperatures, with relatively high pH and Ca content, could lead to a higher neutralizing effect when applied to the soil. In addition, the high temperatures pyrolyzed RHB had a higher capacity to reduce the concentration of Cu, Pb, and Zn in the three soils, especially for the younger cultivation soil, which contributed to the higher pH and relatively high surface area of these RHB, and the relative lower soil pH of the younger soil. Furthermore, only adding 0.5% RHB could result in an evident change in soil characteristics for 3S and 24S soil, including cumulative C release, pH, EC, TC, and available K increase, but 4% RHB addition was needed for 14S soil. In the condition of co-application with 2% compost (by wt.), 4% RHB addition was necessary for carbon sequestration, at least 10% RHB addition was needed for 3S and 14S soil, but 1.0 to 4.0% would be sufficient for 24S. In conclusion, the RHB and compost co-application in greenhouse soil resulted in improved chemical properties, and the effect of the pyrolysis temperature, application rate, and cultivation age had varying improvements.
1. Introduction
Greenhouse vegetable production, an intensive form of agriculture and the best structure for growing winter horticultural crops [1] and for producing fresh vegetables in the off-seasons [2], has rapidly expanded around the world in response to market demands and economic incentives [3,4]. The climate in Taiwan, with >2500 mm of precipitation per year, warm (23~25 °C) air temperature, and frequent disturbance by typhoons (from July to September) and northeastern monsoons (from September to next year April), usually leads to the rapid decomposition of soil organic matter and organic fertilizers, extensive soil erosion, and significant nutrient loss in open-field cultivation. A typical greenhouse has three solid walls and is covered by plastic films to keep the greenhouse warm by sunlight (sunlight greenhouses), and the structure has the potential to decrease the damage of crops and loss of fertilizers during monsoon and typhoon season in Taiwan. The area of crop cultivation in greenhouses has rapidly increased in Taiwan, from 1874 to 33,972 ha, about 18-fold, from 1990 to 2015.
To gain higher yields and greater profit by continuous cropping and short rotation, greenhouse vegetable farmers are using increasingly large amounts of organic or inorganic fertilizers to enhance ‘high-value’ crop growth [5]. However, the greenhouse environment has high temperature and humidity that leads to the rapid decomposition of organic matter and release of base ions; frequent irrigation that adds salts to the greenhouse soils; a lack of leaching by natural precipitation; and upward movement of soil water. These conditions can lead to the degradation of soil quality through acidification, secondary salinization, nutrition enrichment, and nutrient imbalance [3]. More importantly, the contents of cadmium (Cd), copper (Cu), zinc (Zn), and lead (Pb) in greenhouse vegetable soils can be routinely higher than or nearly twice the background values [6,7], which threatens food security and human health. Overall, excessive fertilizer application has been a significant cause of nutrient accumulation and heavy metal (HM) pollution, resulting in soil degradation in solar greenhouses [7]. In addition, cultivation age is an important factor that affects soil physicochemical properties (organic matter and inorganic nutrients) as well as HM contamination [3,7,8,9,10].
Bade District, a major vegetable production area in northern Taiwan, produces many short-term vegetable crops for urban consumption (5~6 times cropped per year). The greenhouse fields in Bade are nearly level (1~2% slopes) and have a >30-year history of organic agriculture, mostly by using deep-layer groundwater for irrigation and applying raw poultry litter (PL) directly. Poultry litter is a potential feedstock for bioenergy and other value-added applications [11]. In Taiwan, there were 194,395 tons of fresh PL produced in 2013 according to the production rate, and the characteristics of dry PL were pH 6.7, EC 16.9 dS m−1, organic carbon 37.1%, total N 4.0%, P 1.8%, K 3.2%, Cu 55 mg kg−1, Zn 350 mg kg−1, and total Pb 1.0 mg kg−1 [12]. Because of the bad odors and potential environmental and public health risks, the utilization of raw PL as soil fertilizer in open-field and greenhouse cultivation has been gradually restricted since 2010 in Taiwan. Farmers should use fully composted materials, such as livestock manure compost and poultry litter compost, instead of raw PL. Furthermore, soils in greenhouse fields are red earth and are classified as Ultisols with low soil pH (pH 4.5~5.0) and higher (silt + clay) content (>80%) [13]. Because low soil pH can be a limiting factor for the soil nitrification reaction [14,15], soil pH should be adjusted before organic fertilizer application for a soil pH lower than pH 5.5 [16]. About 1.5~3.0 Mg ha−1 year−1 of lime materials, including limestone powder, shell powder, dolomite, and dolomite powder (CaCO3 or CaMg(CO3)2), is added to raise soil pH to between 5.8 and 6.8. The amount of manure compost applied is about 5~10 Mg ha−1 year−1 (0.25~0.5% by wt.) to meet the demand of most vegetable crops in Taiwan. However, compost fertilizer and lime material inputs are several times (1~2% or even more) those used in open fields in order to maximize income. After long-term excessive organic fertilizer and lime material application, the accumulation of salt and heavy metals, nutrient imbalance, excess nitrate pollution, and the more serious problems of pests and disease have often been found to decrease the production of organic vegetables in greenhouses [16].
Rice is a staple food for more than 3 billion people in the world, especially in most Asian countries. In Taiwan, rice is the single most important crop. Rice husk (RH) is the main byproduct with abundant availability, and the amount of RH in Taiwan is about 335,000 tons per year. Because of its lower value as a charcoal-type fuel due to the high silica content, which limits the calorific value, rice husk char (RHC) can become a waste disposal or pollution problem in locations where rice husks are used [17]. In these circumstances, it may make sense to regard RHC as a form of biochar and to apply it to agricultural soils to enhance crop yields and soil ‘health’. However, the potential benefits of RHC are not only the effects on the long-term storage of carbon but also improvements in crop productivity [18]. Rice husk conversion into biochar may result in secondary carbon advantages by avoiding burning it in the field and implementing bio-resource recycling [19], and it can also, potentially, serve as a more sustainable disposal route for RHC, which otherwise may be a local pollutant [18]. The application of crop residue biochars can improve nutrient bioavailability to crops by neutralizing soil pH, and it has the potential to reduce nutrient losses by increasing nutrient retention and changing nutrient sorption/desorption in soils [20]. The RHB pyrolyzed at 500 and 700 °C is a promising material for potential application in soil remediation to immobilize Pb and reduce its environmental risks [21]. Additionally, RHB application had a positive effect on soil properties, aggregation, and nitrate retention in soil [19], 3% RHB addition improved soil aggregate stability indices and nitrate retention in the clay soil, and it did not show any tendency to develop alkalinity or salinity in loamy sand soil and clay soil in Iran.
Reasonable and sustainable strategies of organic fertilizer application should be suggested in greenhouse vegetable production soils, not only to reduce the accumulation of trace metals but also to mitigate soil salt accumulation, nutrient imbalance, and soil acidification. The potential benefit of an alkaline biochar for neutralizing soil pH could be the replacement of lime materials. It is necessary and important to investigate the potential and implication of biochar co-application with organic fertilizer for improving greenhouse soil characteristics. Many studies have reported the positive effects of biochar co-application with organic fertilizer on soil properties and plant growth [22,23,24,25,26], and our previous studies have also reported the positive influence on C sequestration and N conservation, and no effect on the absorption of the excessive nutrients Cu and Zn in studied soils co-applied with woody biochar and excessive compost [27,28,29]. However, the effects of biochar application on soil characteristics in greenhouse soils with different cultivation ages have been less examined. Therefore, we hypothesized that RHB and compost co-application in greenhouse soil could improve chemical properties in general, and we also expected varying improvements due to the effect of the pyrolysis temperature, application rate, and cultivation age. In these contexts, the objectives of this study were to evaluate the effects of RHB on several soil chemical properties in three greenhouse soils with different cultivation ages. This work can contribute to the understanding of the addition of RHB to greenhouse cropland for sustainable agriculture production by using quantitative analysis, especially when the addition of biochars is combined with organic fertilizer.
2. Materials and Methods
2.1. Studied Soil, Biochar, and Compost
Bulk soil samples of the three studied soils were collected from a field located in Bade District, which is contiguous with the Jungli Tableland, Taoyuan, northern Taiwan. The soil series name of the three studied soils is the Tachuwwi (Tw) soil series, which occupies about 3500 ha of Taiwan rural soil and is classified as Plinthic Paleudults [13]. Three soils with the same cultivation pattern were selected with different cultivation ages, namely, 3 years (3S), 14 years (14S), and 24 years (24S). Soil samples were taken at 0–15 cm depth using a shovel in mid-July, approximately 1~2 weeks after leafy vegetables were harvested, and they were taken randomly from different areas at each site (about 0.1 ha), consisting of 8–10 subsamples. The soil was air-dried at room temperature and then ground to pass through a 2-mm sieve before its use in the incubation.
Six RHB were collected for this study, including RHB-A (pyrolyzed at >500 °C) from Hualien District Agricultural Research and Extension Station, RHB-B (600 °C) and -C (700 °C) from Industrial Technology Research Institute (ITRI) Southern Region Campus [30], RHB-D and -E (both estimated to be pyrolyzed at <350 °C) from a market, and RHB-F (>500 °C) from a local farmer. RHB-A, -B, -C, and -F were slow pyrolyzed (30 min for A and F, 2~3 h for B and C) and carbonized separately by a horizontal (for A and F) or vertical (for B and C) continuous carbonization furnace without the presence of oxygen [30], but the commercial product RHB-D and -E could be produced in the open air by means of smoldering after burning. Raw RHB was used in the study without being ground into a mesh of <2 mm for analysis, except for elemental analysis.
The poultry-livestock manure compost used in this study is a commercial product (organic fertilizer) certified by the government and often used by farmers. The main raw materials (>50%) of the studied compost were poultry manure (mostly chicken) and livestock manure (mostly swine), and the minor raw material was mushroom waste, which was completely decomposed after a composting period of six months. The dry matter content was higher than 65%, according to regulations. The particle size distribution of the studied compost was as follows: 21% for >1 mm, 28% for 1–0.5 mm, 20% for 0.5–0.25 mm, 18% for 0.25–0.105 mm, and 13% for <0.105 mm.
2.2. Characterization of Soil, Biochar, and Compost
The soil pH was determined in a soil/deionized water ratio of 1:1 (g mL−1) [31]. The electrical conductivities (EC) of the soils were determined using a saturation extract of each soil sample [32]. The soils’ particle sizes were analyzed using the pipette method [33], and their total soil C contents (TC) were determined using dry combustion [34] and an O·I·Analytical Solid Total Organic Carbon (TOC) Analyzer (O·I·Corporation/Xylem, Inc., College Station, TX, USA). The TC was assumed to be organic because the low soil pH precludes carbonates. The total soil nitrogen (TN) content was extracted by digesting 1.0 g of a dried and powdered soil sample in a Kjeldahl flask using concentrated sulfuric acid (H2SO4) and adding a catalytic powder containing K2SO4, CuSO4, and selenium. The total N concentration was determined using an Analytical Aurora Model 1030W (O·I· Corporation/Xylem, Inc., College Station, TX, USA), and the total P content in the digested solution was determined using inductively coupled plasma optical emission spectrometry (ICP-OES) (PerkinElmer, Inc., Optima 2100DV, Waltham, MA, USA). The total content of Cu, Pb, and Zn in the studied soil was determined after aqua regia digestion [35]. The concentrations of Cu, Pb, and Zn were determined by ICP-OES. Soil available NH4+-N and NO3−-N were extracted by 2 M KCl using a 1:5 soil-to-solution concentration [36]. The inorganic N (NO3−–N and NH4+–N) was determined by extracting 5 g (dry weight equivalent) of soil with 25 mL of 2 M KCl [37]. The NO3−–N and NH4+–N in the KCl soil extracts were determined colorimetrically through an automated flow injection analysis with an O·I·Analytical Aurora Model 1030W (O.I. Corporation/Xylem, Inc., College Station, TX, USA). Available phosphorus (P) was estimated by the methods of Bray and Kurtz [38] for acid soils (pH < 6.5). Soil available potassium (K) was extracted by Mehlich I extraction (0.05 M HCl + 0.0125 M H2SO4) [39]. The contents of P and K were determined by ICP-OES. The exchangeable bases (K, Na, Ca, Mg), cation exchangeable capacities (CEC), and base saturation percentages (BS%) were measured using the ammonium acetate method at pH 7 [40]. The Mehlich-3 extraction method was used for the analysis of plant-available nutrients [41]. Mehlich-3-extractable (M3-) P, K, Na, Ca, Mg, Fe, Al, Mn, Cu, Pb, and Zn values were measured with ICP-OES.
The pH and EC of the six RHBs were measured after shaking for 30 min in deionized water (1:5 solid/solution ratio). Expecting high amounts of water-soluble salts in the biochar, the EC was also measured after shaking the biochar/water mixtures (1:5 solid/solution ratio) for 24 h [42]. In addition, the six RHBs were digested using a H2O2/H2SO4 mixture [43], and the total contents of P, K, Ca, Mg, Cu, and Zn were determined using ICP-OES. The exchangeable bases (K, Na, Ca, Mg) and the CEC were measured using the ammonium acetate method at pH 7. The exchangeable base (K, Na, Ca, Mg) contents of the soils were determined using ICP-OES. The Mehlich-3 extraction method was used for the analysis of plant-available nutrients, including P, K, Na, Ca, Mg, Fe, Al, Mn, Cu, Pb, and Zn, and were measured with ICP-OES. Nitrogen gas adsorption measurements for specific surface area (m2 g−1) (Brunauer–Emmett–Teller, BET) were performed using a SA-3100 Beckman Coulter volumetric adsorption system (Beckman Coulter, Inc. Indianapolis, United States of America). Samples were previously outgassed at 100 °C for 200 min. For the elemental analyses (C, H, N, O), the biochar samples were ground to <0.2 mm. Two replicates were used for each analysis, and in some analyses, three replicates were used. The C, H, N, and O contents of biochars were determined using an Elementar vario EL cube (Elementar Analysensysteme GmbH, Langenselbold, Germany). Solid-state cross-polarization magic angle-spinning and total-sideband-suppression 13C NMR spectra were obtained using a Bruker Avance III 400 NMR spectrometer (Bruker Corporation, Billerica, Massachusetts, United States of America) at 100 MHz (400 MHz 1H frequency). The attributions of chemical shift were according to the reports of Wang et al. [44]. Additionally, scanning electron microscopy (SEM) observations (FEI Inspect S, Thermo Fisher Scientific Inc., Waltham, MA, USA) and chemical functional groups by Fourier transform infrared spectra (FTIR) (PerkinElmer Pyris Diamond, PerkinElmer, Waltham, MA, USA) were also determined (Supplemental Materials).
The same compost was used in the previous study [27], and the characteristics are briefly described as follows: pH 8.4, EC 3.79 dS m−1, total C 23.3%, total N 22.6 g kg−1, total P 10.2 g kg−1, exchangeable K 6.43 cmol(+) kg−1 soil−1, Na 1.09 cmol(+) kg−1 soil−1, Ca 2.70 cmol(+) kg−1 soil−1, and Mg 2.72 cmol(+) kg−1 soil−1, CEC 19.7 cmol(+) kg−1 soil−1, BS 69%, Mehlich-3-extractable P 6.87 g kg−1, K 8.91 g kg−1, Ca 14.5 g kg−1, Mg 3.97 g kg−1, Cu 6.22 mg kg−1, Pb 1.23 mg kg−1, and Zn 62.4 mg kg−1.
2.3. Soil–Biochar Incubation
The effects of RHB and compost co-application to the three greenhouse soils with different cultivation ages were investigated in a 100-day laboratory aerobic incubation study. Six RHBs were applied and thoroughly mixed by hand into three soils at 0, 0.5, 1, 4, 10%, and 20% (~0, 10, 20, 80, 200, and 400 Mg ha−1; by wt.). The 10% and 20% application rates were chosen to help identify the upper-level soil detriments by biochar application. Compost was then added to all soils at a rate of 2% (by wt.). In addition to the non-amended (no biochar and compost addition) soil sample (i.e., the control), 2% compost + 0% RHB was used as a compost control to investigate and compare the effects of biochar addition. There are forty-two treatments for each soil with three replicates, and totally 378 samples. Twenty-five grams of a mixed soil sample were placed in 30-mL plastic containers, which were subsequently put into 500-mL plastic jars containing a vessel with 10 mL of distilled water to avoid soil desiccation and a vessel with 10 mL of 1 M NaOH solution to trap evolved CO2 [45,46]. The jars were sealed and incubated in the laboratory (25~27 °C; 50~60% humidity). Soil moisture content was adjusted to 60~70% of field capacity before the incubation and was maintained throughout the experiment using repeated weighing. The incubation experiment was run for 100 days, with samples taken on Days 0, 1, 3, 10, 20, 30, 50, 70, and 100. After sampling, the vessel with 10 mL of 1 M NaOH solution was removed and replaced with fresh NaOH, resealed, and stored until the CO2 analysis. A titrimetric determination method was used to quantify the evolved CO2 [45]. The cumulative CO2 released and C mineralization kinetics were calculated from the amount of CO2–C released during different intervals of time in each treatment. Samples of the control and biochar-treated soils were collected after 100 incubation days for the analysis of plant-available nutrients using Mehlich-3 extraction. Mehlich-3-extractable P, K, Na, Ca, Mg, Cu, Pb, and Zn values were measured by ICP-OES. In order to compare the changes and quantify the impacts of soil–biochar amendments on nutrient leaching, the soil pH [soil/deionized water ratio of 1:2 (g mL−1)], EC [soil/deionized water ratio of 1:5 (g mL−1) and shaking for 1 h], TSC, TSN, TSP, and CEC of all treatments were also measured on Day 100.
2.4. Statistical Analysis
Statistical analyses (calculation of means and standard deviations, differences of means) were performed using the SAS 9.4 package (SAS Institute, Inc., SAS Campus Drive, Cary, NC, USA). The results were analyzed by analysis of variance (two-way ANOVA) to test the effects of each treatment. The statistical significance of the mean differences was determined using least-significant-difference (LSD) tests based on a t-test at a 0.05 probability level. The values presented in the graphs and the text are the means ± 1 standard deviation (SD). The Pearson correlation coefficient (r) was calculated, and principle component analysis (PCA) was performed using SAS 9.4 software. The multivariate statistical technique of PCA was used to investigate the most susceptible variances and to identify the important components that explain most of the variances in a large data set. In addition, the current study used the canonical discriminant analysis (CDA) in SAS with PROC Candisc to conduct a discriminant analysis for the soil under different soil ages and biochar treatments for identifying differences among groups of individuals (or treatments) and improving the understanding of the relationships among the variables measured within those groups.
3. Results
3.1. Initial Soil and RHB Characterization
The physical and chemical characteristics of the studied soils are shown in Table 1. Characteristics that visibly increased with increasing cultivation age include pH; total P, Cu, and Zn; available NH4+-N, P, and K; exchangeable Ca; base saturation; and Mehlich-3-extractable P, K, Ca, Mg, Cu, and Zn. In contrast, including the silty content, the characteristics that showed decreasing trends were total C, N, and Pb; available NO3−-N; exchangeable Na; and Mehlich-3-extractable Al, Mn, and Pb.
The pH of RHB-A, -B, -C, and -F (pyrolyzed at 500~700 °C) was 8.35, 7.87, 8.07, and 8.38, respectively, and it was 7.40 and 7.23 for RHB-D and -E (pyrolyzed at <300 °C) (Table 2). The EC of RHB was found to decrease when the pyrolysis temperature increased. The higher EC of RHB-D, -E and -F suggests that more soluble salts can be released from biochar, which can be confirmed by the higher exchangeable K and Mechlich-3-extractable K, Ca, and Mg in these biochars. The BET surface areas of RHB-A, -B, -C, and -F (2.66~2.81 m2 g−1) were higher than those of -D and -E (2.45 m2 g−1). The SEM images (Supplemental Figure S1) reveal irregular and highly porous structures with tubular shapes, rough surface structures, sharp edges, and particles of various sizes. The honeycomb-like pore structures are clear in the current studied RHB. The results of elemental composition analysis revealed that carbon content was within 40.4~52.2% for all six RHB. The RHB pyrolyzed at higher temperatures (A, B, C, and F) had higher C content as compared with RHB-D and -E pyrolyzed at lower temperatures. In comparison, H and O contents decreased with increasing pyrolysis temperature in the current study, but N content was similar between the six RHBs. Correspondingly, the O/C (polarity), (O+N)/C (polarity), and H/C (aromaticity) values decreased with the increase in the pyrolysis temperature. In addition, RHB-A, -B, -C, and -F, pyrolyzed at high temperatures, had high aromatic C content and lower aliphatic C content (Table 2), consistent with the lower H/C values. In contrast, RHB-D and -E, pyrolyzed at low temperatures, had higher aliphatic C, polar C, and aliphatic polar C content, in agreement with their polarity [(O+N)/C] and O/C values. The FTIR spectra of the six RHBs (Supplemental Figure S2) showed that RHB pyrolyzed at a higher temperature had a weaker peak for aromatic C=C and C–H. However, consistent with the low values of the H/C ratio, indicating a high degree of aromatization of the feedstocks during biochar production, no peaks associated with O-containing functional groups (C=O, C–O, O–H) or aliphatic C–H were observed for RHB-A and -B. A weaker peak that represents OH– stretching was found for RHB-C and -F, and the peak was stronger for RHB-D and -E.
3.2. Carbon Mineralization and Nutrient Availability
The two-way ANOVA analysis was conducted for soils and RHB, respectively (Table 3). For three soils, the between-subject effects of rate (0.5, 1.0, 4.0, 10, and 20%) and treatment type (control, compost, RHB A~F) (Table 3) were analyzed within soil, and significant effects of the rate, treatment, and rate × treatment interactions for the cumulative C release, pH, TC, and available K were observed for three soils. Significant interactions for rate, treatment, and rate × treatment was also found for TP, Mg, Cu, Pb, and Zn of 3S soil, EC of 14S soil, and TP, P, Ca, Cu, Pb, and Zn of 24S soil. In addition, for six RHB the between-subject effects of soil (3S, 14S, and 24S) and rate (0.5, 1.0, 4.0, 10, and 20%) were also analyzed within RHB, and significant effects of the soil, rate, soil × rate interactions could be observed for available P, Pb, and Zn concentrations for the six RHBs. In general, the addition of RHB significantly influenced C mineralization, pH, EC, TP, and available nutrients, but it less significantly influenced TC and TN and had almost no significant influence on CEC. The variable influence could be attributed to the pyrolysis temperature of RHB. Thus, the cultivation age of greenhouse soil would be an important factor that affects the impact of RHB co-application with compost on soil C mineralization and nutrient availability.
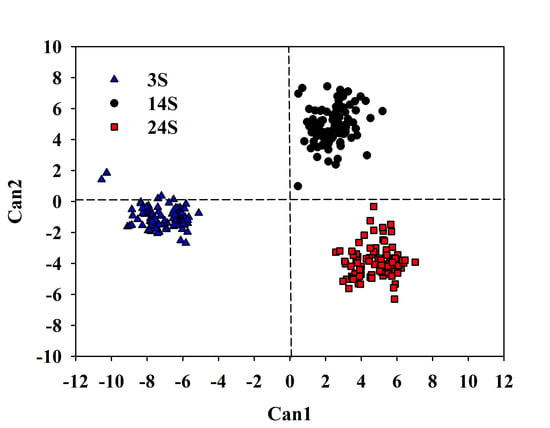
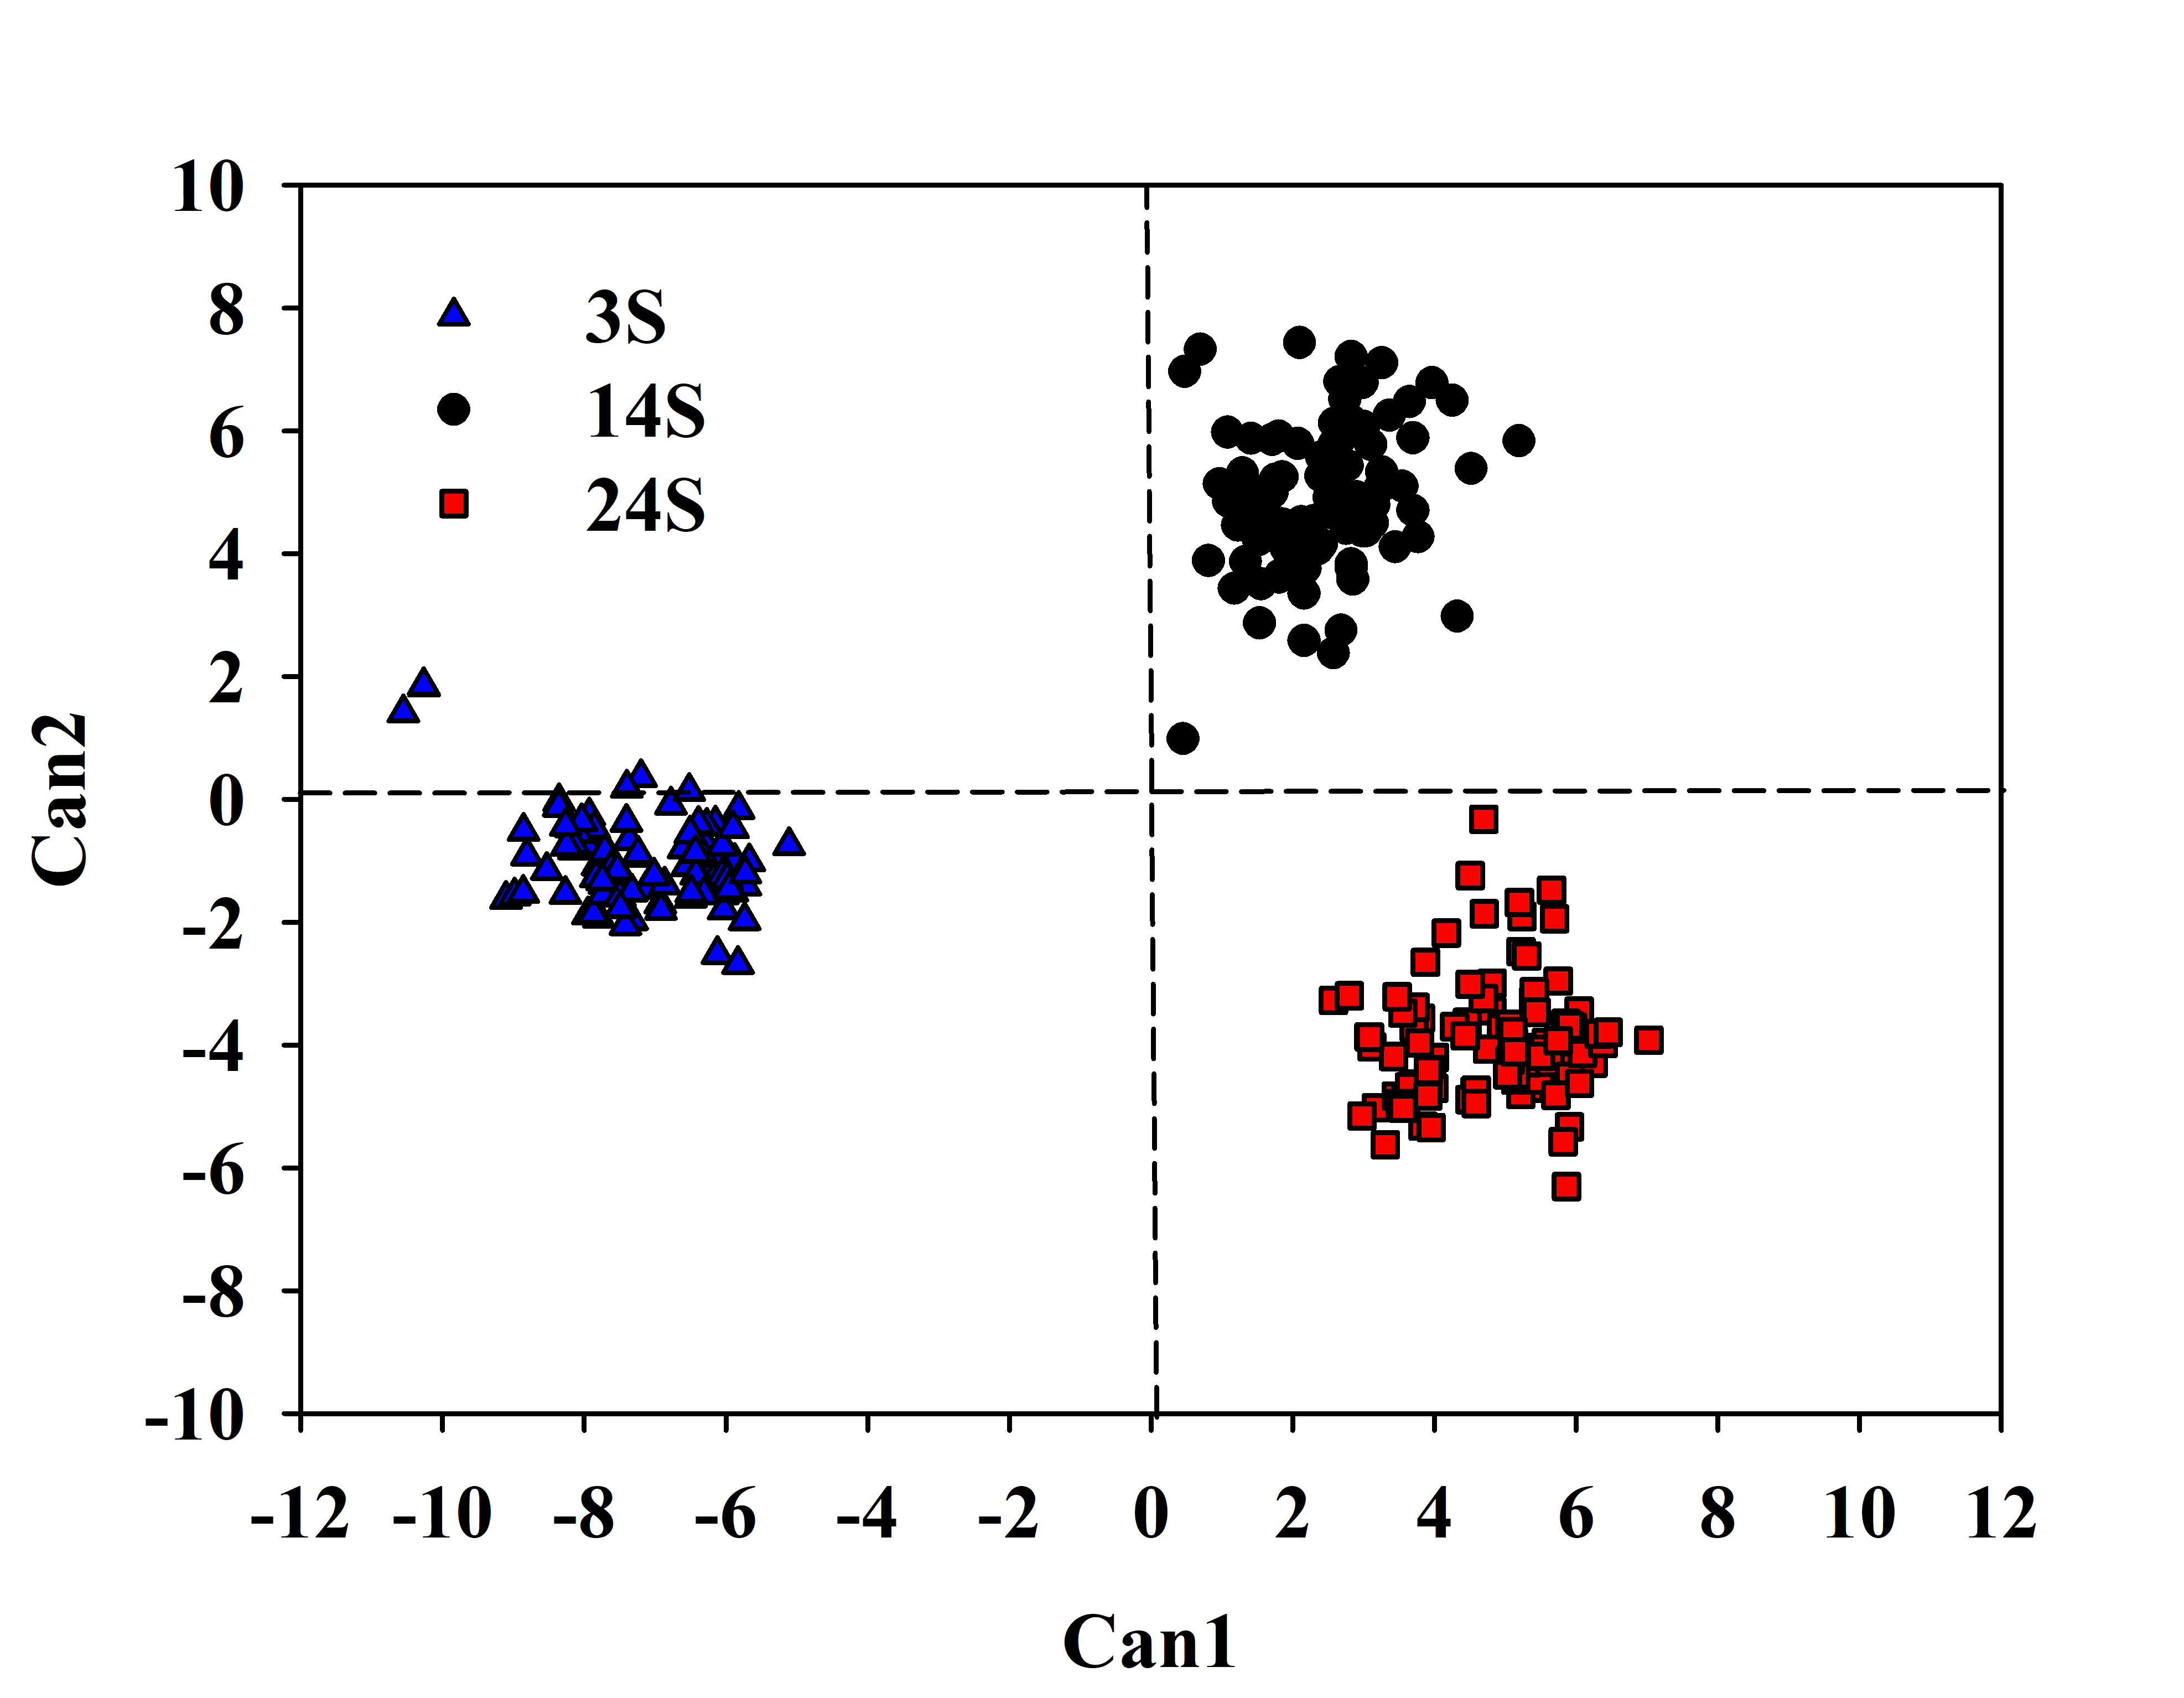
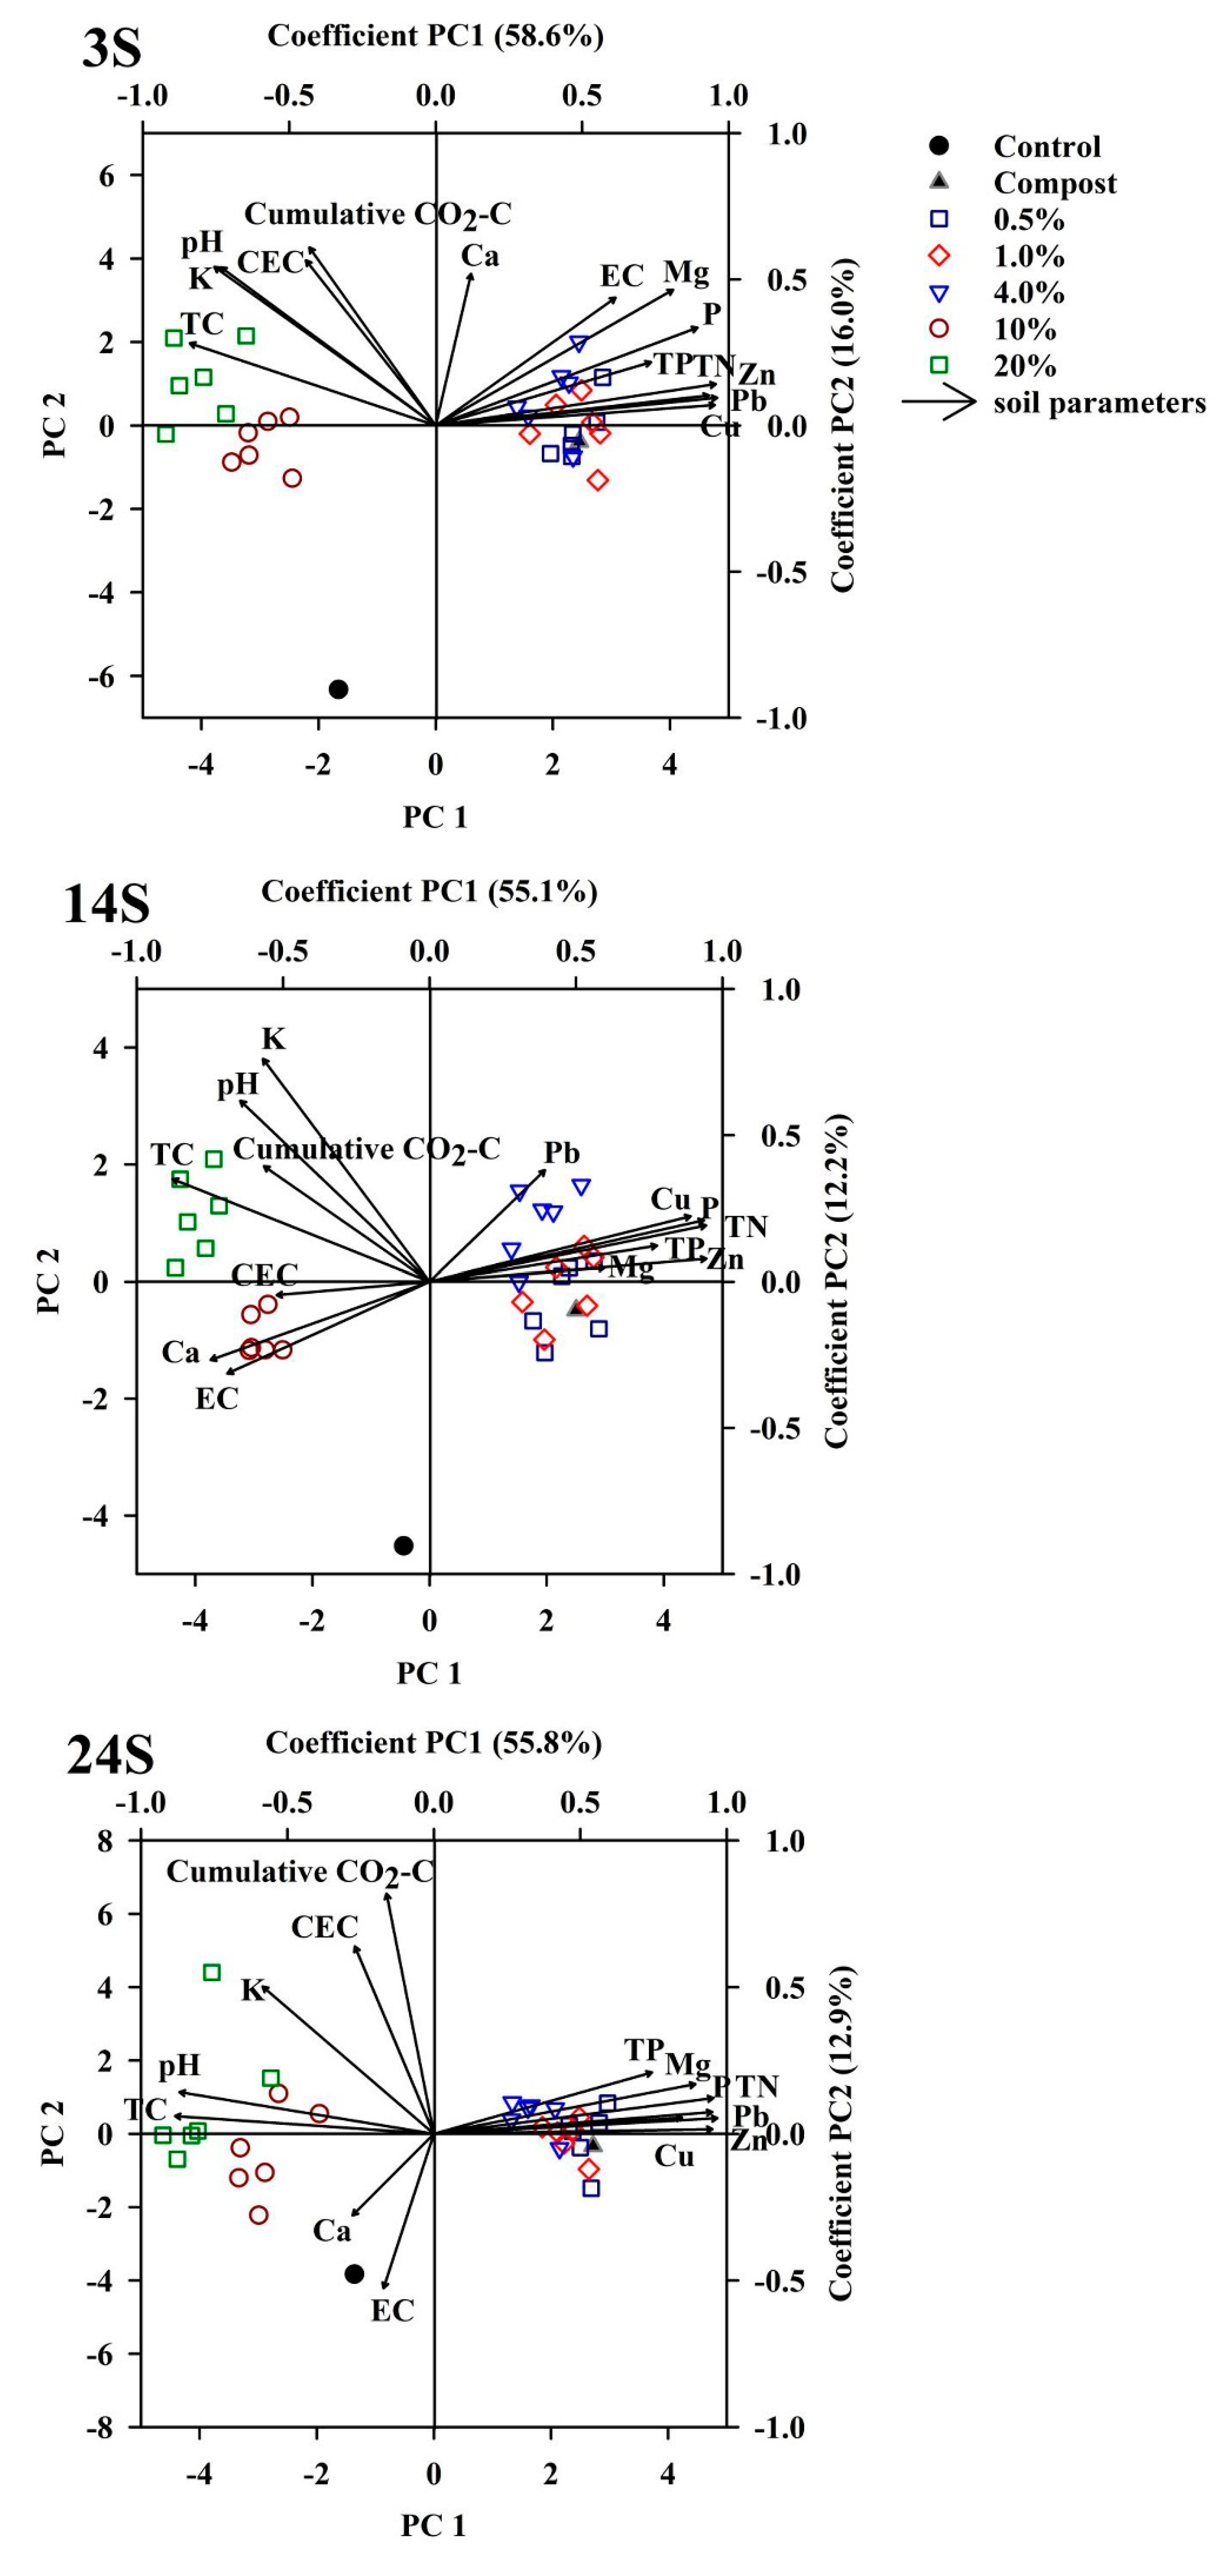
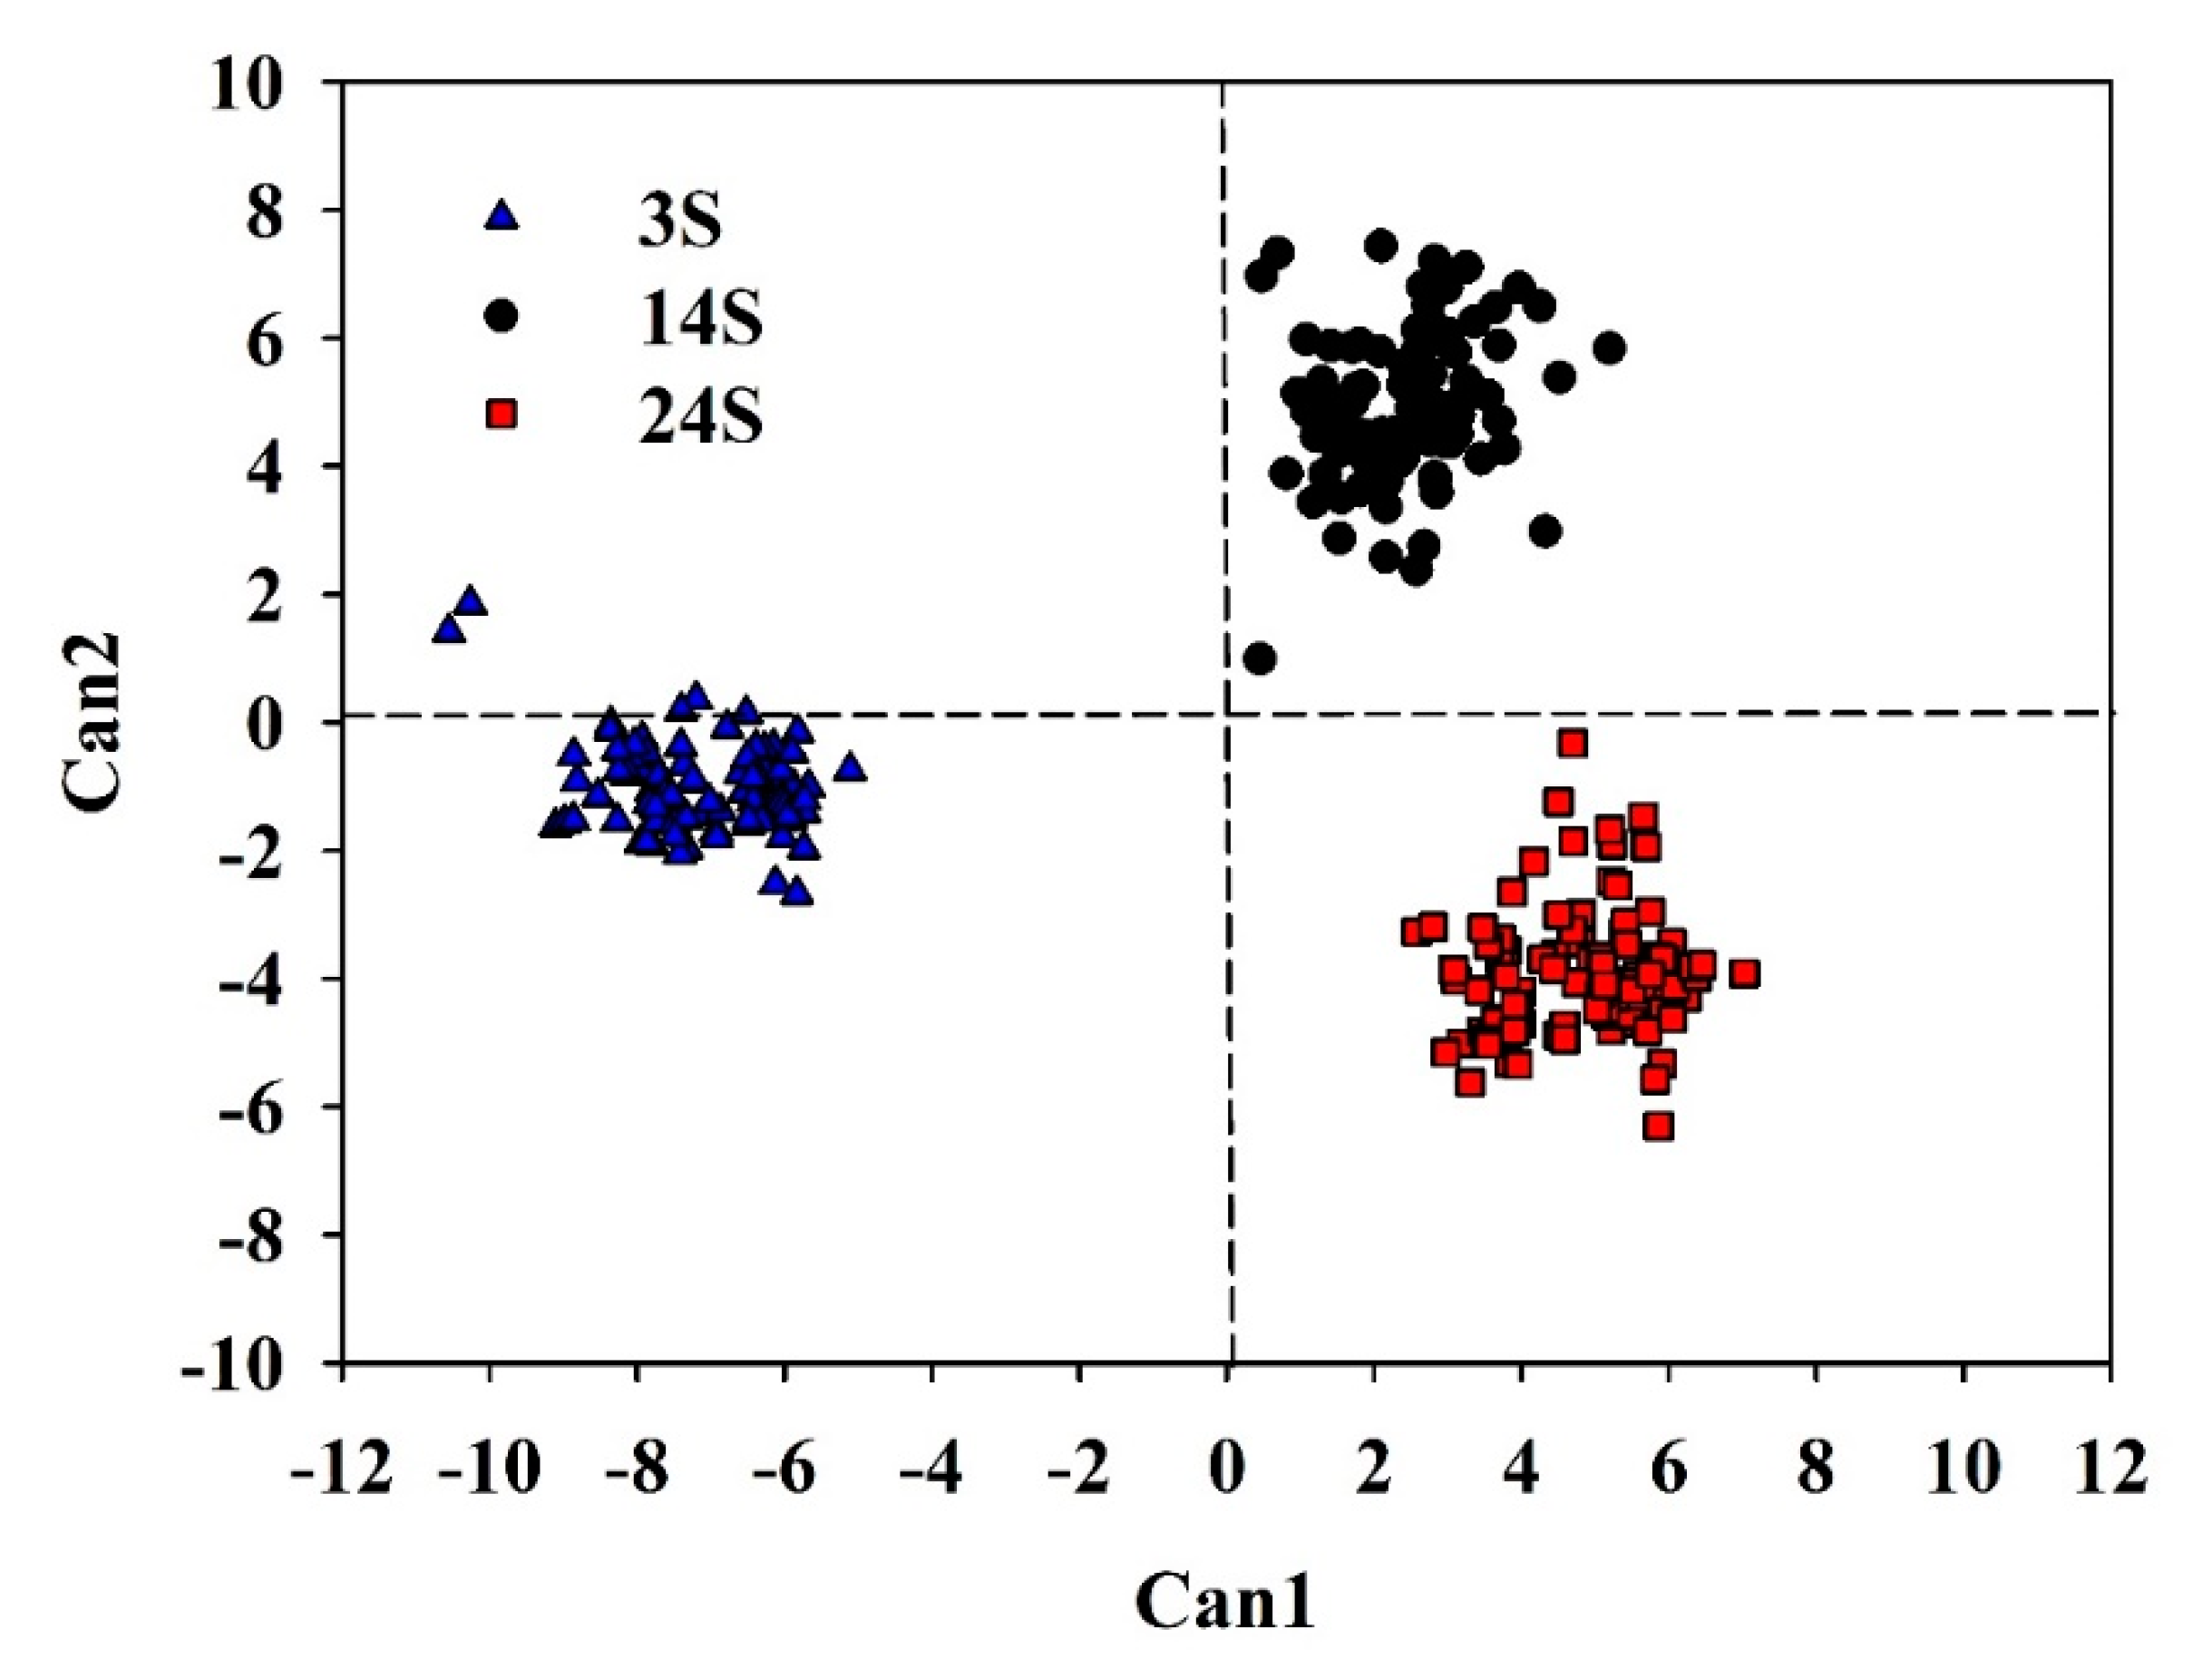
The PCA results revealed that PC1 and PC2 explained 58.6% and 16.0%, 55.1% and 12.2%, and 55.8% and 12.9% of the total variance in 3S, 14S, and 24S soils on day 100, accounting for 74.6%, 67.3%, and 68.7% of the total variance, respectively. Additionally, PCA revealed two groupings for each of the three soils (Figure 1). The parameters of Group 1 (TN, TP, P, Mg, Cu, Pb, and Zn) and Group 2 (cumulative CO2-C, pH, EC, TC, CEC, K, and Ca) were the same in 14S and 24S soils but different in the 3S soil. Two parameters, EC and available Ca, which were in Group 1 in 3S soil, indicated that the characteristics of a lower greenhouse soil cultivation age differed from those of an older soil. Similar relations could be observed for three soil, that is, the low RHB addition rates (0.5%, 1.0%, and 4.0%) were clustered near Group 1, whereas the high RHB addition rates (10% and 20%) were clustered closer to Group 2. Pearson correlation coefficients (r) between measured soil characteristics and PCs (PC1 and PC2) after incubation for 3S, 14S and 24S shown in Supplemental Table S1. ANOVA of canonical scores revealed clear discrimination of soil age on canonical discriminant function 1 (Can1) and canonical discriminant function 1 (Can2) (Figure 2), indicating that soil cultivation age has affected the influence of RHB. Analysis of these scores also suggests that 24S soil is more variable in the characteristics encompassed by Can1 and Can2, followed by 14S and 3S soil. In addition, higher application rate (10% and 20%) was distinct distinguishable from lower application rate (0.5%, 1.0%, and 4.0%), compost and control in 3S and 24S soil, but 10% rate was not distinguishable from lower application rate (0.5%, 1.0%, and 4.0%), compost and control in 14S soil (Supplemental Figure S3). The control was distinguishable from other treatments in three soils. The addition of 0.5% and 1.0% was not distinguishable from compost treatment, indicating the relative lower influence. At higher application rate (10% and 20%), the scores of RHB-A and -F, RHB-B and -C, and RHB-D and -E were distinguishable, suggesting the different effects of high and low pyrolyzed temperature RHB. In contrast, at lower application rate (0.5~4.0%) different pyrolyzed temperature showed less distinguishable from each other.
Regardless of the pyrolysis temperature of RHB, compared with the compost treatment, the effect of the application rate on soil C mineralization and selected soil characteristics indicated that higher application rates (10% and 20%) of RHB for the three soils significantly increased the cumulative C release, pH, EC, TC, CEC, and available K and Ca concentrations, but the contents of TN, TP, P, Mg, Cu, Pb, and Zn were significantly decreased (Table 4 and Supplemental Table S3), which consistent with the results of PCA analysis. The addition of 0.5% RHB was associated with significantly increased cumulative C release and pH in 3S soil and the concentration of available K in 14S soil, but it significantly decreased the concentration of P and Mg in 24S soil. The addition of 1.0% RHB was associated with significantly increased cumulative C release, pH, and available K concentration in 3S soil, available K in 14S soil, and cumulative C release and available K in 24S soil, but it significantly decreased the concentration of available P, Mg, Cu, and Pb in 24S soil. The addition of 4.0% RHB was associated with significantly increased cumulative C release, pH, TC, and available K and Pb concentration in 3S soil, cumulative C release, TC, and available K in 14S soil, and cumulative C release, TC, and available K in 24S soil, but it significantly decreased the concentration of available P, Mg, Cu, Pb, and Zn in 24S soil. EC, TN, TP, CEC, and available P, Ca, Mg, Cu, Pb, and Zn did not significantly differ between 0.5, 1.0, and 4.0% for 3S and 14S soil. The same trends of these parameters also occurred in 24S soil, except for Cu, Pb, and Zn.
Additionally, the significant test results between the three studied soils for each RHB indicated that cumulative C release and available Cu concentration for the six RHBs significantly decreased in the same order: 24S > 3S > 14S (Supplemental Table S2). The mean values of pH for the six RHBs significantly decreased in the order of 24S > 14S > 3S. The ECs of 14S were all significantly higher than those of 3S and 14S in the six RHB treatments. There was no significant difference between 34S and 24S for RHB-A, -B, -D, and -F. The content of TC for RHB-A, -D, and -E and the content of TN for RHB-D and -E did not significantly differ between the three soils. The mean values of Pb significantly decreased in the order 3S > 24S > 14S. The mean values of Mg for RHB-A, -B, -C, -D, and -E and Zn for RHB-A, -E, and -F significantly decreased in the order 14S > 24S > 3S.
4. Discussion
4.1. Cumulative C (CO2) Release, pH, and EC
As indicated in Figure 1, Table 3, Table 4 and Table 5, CO2 release from amended soils was significantly affected by addition rate and pyrolysis conditions of RHB. The effects of biochar on soil fertility and soil carbon sequestration are inconstant, which is related to the feedstocks and pyrolysis conditions of biochar [47]. The feedstock and pyrolysis temperature of biochar regulate the emissions of CO2 from the interaction of BC with compost organic matter (COM) [48], and the net CO2 emissions are lower for the biochar and compost mixtures (compared with compost alone), suggesting that biochar may stabilize COM and decrease C mineralization [27,48].
However, many studies have suggested that co-metabolism contributes to biochar decomposition in soils, because the addition of easily metabolized organic C or additional labile organic carbon sources might accelerate BC decomposition (or increase soil CO2 effluxes) [49,50,51,52]. For the RHB treatments in 3S soil, compared with the compost control, the mean value of cumulative C release of 5 addition rates of each RHB, significantly increased by about 4~17% and 54~55% for RHB pyrolyzed at high and low temperatures, respectively (Table 5). It was 2~14% and 49~52% for 14S soil and −6~8% and 39~56% for 24S soil, and the more variable changes might be attributed to the cultivation age. Jones et al. [53] proposed that including the biological breakdown of organic matter, abiotic release of inorganic carbon, or increased microbial respiration resulting from the enhanced soil physical characteristics leads to an increase in the CO2 efflux rate from the biochar-amended soils.
The cumulative CO2-C release had a significant positive correlation with pH, CEC, and K in 3S soil; a significant positive correlation with pH, TC, and K and a significant negative correlation with TN, TP, P, Cu, and Zn in 14S soil; and a significant positive correlation only with K in 24S soil (Table 6). The H/C ratio of RHB-D and -E was higher than 0.7, suggesting a lack of condensed aromatic structures and the possible loss of its overall stability [54], which could explain the higher C mineralization in these two RHB treatments. Aromatic C, a recalcitrant ingredient of biochar composition, is primarily responsible for biochar’s stability in soil; however, biochar also contains relatively labile components, including aliphatic carbon, carboxyl, and carbohydrate, which are easily mineralized [55]. Therefore, mineralization of biochar is much slower than that of other organic materials [50,56,57] and involves many uncertainties. The FTIR spectra of the six RHBs (Supplemental Figure S2) indicate the presence of aromatic C=C stretching (1600 cm−1), Si–O–Si asymmetric vibration (1100 and 800 cm−1), and aromatic C–H bending (800 cm−1) observed for all biochars. The peak at 1700 cm−1 from RHB-D and -E could be attributed to C=O, which is mainly carboxyl, but was not observed for RHB-A, -B, -C, and -F. Similar results were indicated by Shi et al. [21], who suggested that further heating resulted in the decomposition of carboxyl in the biochars.
Soil pH was also significantly affected by addition rate and pyrolysis conditions of the RHB. At the end of incubation, soil pH increased by 0.2~0.4, 0.1~0.2, and 0.1~0.3 pH units for 3S, 14S, and 24S soil, respectively. It was increased by about 0.1~0.2 pH units in RHB pyrolyzed at low temperatures. The inherent alkalinity of biochar leads to increased soil pH and has made it a promising amendment for acidic soils [58,59]. In addition, applying biochar with a high pH value and the presence of calcite could achieve a great neutralizing effect [60]. As more alkaline minerals formed in biochar at high temperatures, the pH value of biochar increased [61]. In contrast, the pH value of biochar decreased as more acidic functional groups or acidic organic compounds presented in and on the biochar at low temperatures. In addition, RHB-A, -B, -C, and -F could have alkaline minerals that influence the pH and only limited acidic functional groups in these biochars, but RHB-D and -E could have a certain number of acidic functional groups remaining at this pyrolyzed temperature. The higher potassium (K) content of RHB-A, -B, -C, and -F support this possibility. The pH and the Ca content of RHB-A, -B, -C, and -F, pyrolyzed at high temperatures, were higher than those of lower-temperature RHB-D and -E (Table 1) and would have a higher neutralizing effect when applied to the soil. In addition to biochar, soil buffering capacity—the ability to resist changes in pH—may depend on the soil’s organic and mineral content and its physical properties [62]. Soil buffering capacity might prevent major changes in soil pH, even at a high biochar application rate (10%, w/w) [63]. Therefore, the soil pH in the current study changed in response to the addition of biochar, similar to the results of many studies [62,64,65], but the soil pH increased by a maximum of 0.4, 0.2, and 0.3 pH units for 3S, 14S, and 24S, respectively. From the current results, we suggest that the soil buffering capacity may have prevented major changes in soil pH, and the acidification of 2% compost decomposition and nitrification may offset the neutralizing effect of RHB. Soil pH is an important factor with a significant positive correlation with TC, CEC (only for 3S), and K and a negative correlation with TN, TP (only for 14S and 24S), P, Mg (only for 24S), Cu, Pb (only for 3S and 24S), and Zn (Table 6). In addition, a significant positive correlation between cumulative C release and pH was observed in 3S and 14S soil, but not in 24S soil. These results indicate that raising the soil pH could increase soil C mineralization of greenhouse soils with young and middle cultivation ages, but this is not true for older soil.
The EC values (the mean value of 5 addition rates of each RHB) were higher than 1 dS m−1, ranging from 1.07 to 1.22, 1.87 to 2.42, and 1.12 to 1.27 dS m−1 for 3S, 14S, and 24S, respectively, and were indicative of salinization after RHB and compost co-application (Table 5). In two highly weathered soils (Ultisols and Oxisols), compared with the addition of compost (2%), the combined addition of biochar (2%) and compost (2%) showed no significant increase in EC after 2 weeks and 7 weeks of incubation [66]. The EC values of red earth soil in which 2% (by wt.) woody biochar and 5% (by wt.) compost were co-applied also showed no significant increase after 434 days of incubation [27]. The higher EC value of RHB treatments in 14S soil, especially for RHB pyrolyzed at high temperatures (>2 dS m−1), could be attributed to the relatively higher EC value of raw 14S soil. The addition of biochar and/or compost could increase soil EC [66], and such EC increases could be attributed to the release of basic cations from both biochar and compost [66,67]. EC was important for 3S and 14S, but not for 24S. The EC value had a significant positive correlation with TN, TP, P, Mg, Cu, Pb, and Zn for 3S soil, and it had a significant positive correlation with TC, CEC, and Ca and a negative correlation with TN, TP, P, Cu, and Zn for 14S soil (Table 6). Those soil characteristics had relatively lower content in the raw soil, and addition of compost and RHB might evidently and significantly increase the content in the amend soil. In contrast, the raw 24S soil had relatively higher content of such soil parameters, co-application of RHB and excessive compost showed insignificant influence. In raw 3S soil, the pH value, EC value and the content of P, K, Ca, Mg, Cu, and Zn were relatively lower than raw 14S soil. The decomposition and release of basic cations from both RHB and compost resulted in the increase of EC, TN, TP, P and Mg, much more visible in 3S soil than in 14S soil. Besides, the relative lower soil pH of 3S soil, even before and after incubation test, suggested that the higher availability of Cu, Pb and Zn in soil, resulted the higher concentrations in 3S soil. In addition, the nutrient imbalance may occur in 14S soil after incubation test, especially the interaction between calcium and other nutrients.
4.2. TC, TN, TP, and CEC
Biochar has the potential to affect carbon sequestration and add high carbon content; thus, the application of biochar to soil could enrich the TC content [68]. The current results are in line with several studies [69,70,71]. Compared with the compost treatment, the TC content of RHB treatments pyrolyzed at high and low temperatures increased by 87~101% and 55~57%, 121~127% and 83~87%, 121~144% and 82~86% in 3S, 14S, and 24S soil, respectively (Table 5). The compost treatment had higher TN, TP, and available P content than those (the mean value of 5 addition rates of each RHB) of the six RHB treatments, indicating that N and P might be consumed during C mineralization and that available P might be sorbed/absorbed by RHB. Additions of biochar may retain soil N [72], have no effect on the soil N content [73], and/or have an indirect effect on the concentration of soil nitrogen by reinforcing microbial communities [70]. The application of woody biochar (0.5, 1.0, and 2.0%) in soil fertilized with excessive (5%) compost had no significant difference from the control (5% compost) in soil TN [27,29].
The liming agent effect of RHB with alkaline pH could neutralize acidic soil pH and reinforce microbial communities. The studied compost is high-quality organic matter with a low C/N ratio and with sufficient N, and its application to soil can result in the release of available N via N mineralization. Co-application of RHB with high C content and compost with high available N content resulted in a C mineralization increase, and, in turn, the TN content declined after incubation. In 14S soil, cumulative C release had a significant negative correlation with TN and TP (r = −0.44), which confirmed the results described above (Table 6). Furthermore, a less significant correlation and no correlation could be observed in 3S and 24S soil, respectively. In the condition of co-application with 5% compost, the study of Tsai and Chang [29] also indicated that soil TP content had similar results to those of soil TN content, but the TP content significantly increased with 0.5% and 2.0% addition of woody biochar in red soil [27]. Soil TP content depended on the soil N level and the rate of biochar addition, as well as their interaction (p < 0.05) [20]. The significant positive correlation between TN and TP, with a correlation coefficient (r) of 0.72, 0.74, and 0.70 for 3S, 14S, and 24S soil, respectively, could be observed and indicated a similar trend of both TN and TP in different treatments.
In all three soils, the content of CEC did not significantly differ from that of the compost treatment (except for RHB-F in 3S soil), but the value was higher (<6%) than that of the compost treatment. The content of CEC had a significant positive correlation with cumulative C release, pH, TC, and K for 3S soil; a significant positive correlation with EC, TC, and Ca and significant negative correlation with TN, TP, P, and Zn for 14S soil; and no significant correlation for 24S soil (Table 6). The value of the correlation coefficient (r) was between 0.4 and 0.5, indicating that these parameters can explain only about 16~25% of the variation in CEC for the three soils. The CEC content of the three studied soils and six RHBs was about 12~13 and 3~6 cmol(+) kg−1 soil−1, respectively; soil CEC cannot be expected to increase after RHB addition, even at high application rates (10% and 20%). The studied compost had higher CEC content (19.7) than RHB and had a significant influence.
4.3. Available P, K, Ca, and Mg
Optimal soil pH is directly associated with the availability of P [74]. In the current study, compared with the compost treatment, the content of available P of RHB treatments pyrolyzed at high and low temperatures decreased by −9~−18% and −9~−17%, −12~−21% and −12~−17%, and −15~−25% and −19~−20% in 3S, 14S, and 24S soil, respectively (Table 5). The content of available P had a significant positive correlation with EC, TN (r = 0.9), TP, Mg (0.96), Cu (0.84), Pb (0.88), and Zn (0.82) and a significant negative correlation with pH, TC, and K for 3S soil; a significant positive correlation with TN (0.94), TP, Mg, Cu (0.82), and Zn (0.92) and a significant negative correlation with cumulative C release, pH, EC, TC, and Ca (−0.75) for 14S soil; and a significant positive correlation with TN (0.95), TP, Mg (0.93), Cu (0.90), Pb (0.79), and Zn (0.95) and significant negative correlation with pH, TC, and K for 24S soil (Table 6). The 3S and 24S soil showed similar correlation patterns, except for EC. Only in 14S was a significant (negative) correlation found between P and Ca.
In highly weathered tropical soil, the reactive nature of P easily tends to form insoluble Fe, Al, and Ca phosphates, thus reducing P availability for plant uptake [75]. In addition, the feedstock and pyrolysis temperature of biochar affect heterogeneous surface properties and further affect P retention and availability in tropical soils. Gérard [76] suggested that available P in soil solution for plant uptake is related to biogeochemical processes, including dissolution, complexation, adsorption, and precipitation. The Al and Fe oxide type and content, the amount and type of silicate clays, ionic strength, soil solution pH, calcium carbonate content, concentration of P in solution, and the presence of competing anions all play an important role in chemical processes [75]. When applied to soils, the diverse physical and chemical properties of biochar, including functional groups, cation exchange capacity, porosity, and surface area, even at the same feedstock of biochar pyrolyzed at different temperatures, may invariably alter the surface chemistry of soils and therefore affect P availability and retention in soils [75,77]. The studied compost contained an ample amount of P (TP 10.2 g kg−1 and Mehlich-3-extractable P 6.87 g kg−1) and could therefore directly release soluble P into the soil solution to enhance P availability. The studied soils and six RHBs also contained an abundant amount of available P. Moreover, the three studied soils also contained a much greater amount of available Ca, Mg, Fe, and Al (24S > 14S > 3S for the content of Ca and Mg; 14S > 3S > 24S for the content of Fe and Al) (Table 1), and the six RHBs contained a lot of available K (Table 2). Obviously, the reduction in available P concentration was mainly affected by soil pH, TC, and available K in 3S and 24S soil, but it was more significantly influenced by EC, TC, and available Ca in 14S soil. RHBs that were subjected to high- and low-temperature pyrolysis had low BET (about 2.5 m2 g−1 for low-temperature RHB and 2.6~2.8 m2 g−1 for high-temperature RHB), without much difference between them (Table 2), confirming the reduction percentage by RHB treatments. In addition, compared with high-temperature RHB, RHB-D and -E, pyrolyzed at low temperatures, contained higher aliphatic C content (Table 2), about 2-fold, and evident functional groups (Supplemental Figure S2), suggesting that the adsorption capacity could be higher. However, the unstable characteristics resulting from a H/C atomic ratio of >0.7 (Table 2) might offset the adsorption capacity. Moreover, corn cob and RHB pyrolyzed at 300–450 °C applied at a rate of 1% (w/w) could be used to reduce P sorption and increase P bioavailability, especially in acid soils (Ultisols and Oxisols) [75]. The current study results showed declining trends and may be attributed to the intensive cultivation practices and cultivation age.
The studied RHB contained an ample amount of available K (Table 2), especially for RHB-D, -E, and -F (2007~2269 mg kg−1), and could therefore directly release soluble K into soil solution to enhance K availability (Table 5). The studied soils, compost, and six RHBs also contained a plentiful amount of available Ca and Mg. The content of Ca had no significant correlation with other soil parameters in 3S and 24S, but in 14S soil, it had a significant positive correlation with EC, TC, and CEC and a significant negative correlation with TN, TP, and available P, Mg, Cu, and Zn (Table 6). The significantly higher available Ca content in 14S and 24S could be attributed to the higher available Ca in RHB-E, but it did not result in a significant change in 3S soil. The content of Mg had a significant negative correlation with pH and TC in 24S soil and with TC in 3S and 14S soil. The soil pH also had an insignificant negative correlation with Mg in 3S and 14S. Thus, the evident pH change resulted in a change in available Mg in 24S soil, followed by 3S and 14S soil.
4.4. Available Cu, Pb, and Zn
Compared with the compost treatment, the content of available Cu of RHB treatments pyrolyzed at high and low temperatures decreased by −16~−31% and −9~−18%, −21~−27% and −12~−25%, and −16~−25% and −25~−30% in 3S, 14S, and 24S soil, respectively. Available Pb decreased by −16~31% and −18~−21%, −12~−53% and −3~−34%, and −18~−39% and −35~−48% for 3S, 14S, and 24S soil. Available Zn decreased by −5~25% and −11~−12%, −12~−25% and −16~−17%, and −16~−21% and −15~−20% for 3S, 14S, and 24S soil. The content of available Cu, Pb, and Zn had a significant negative correlation with pH, TC, and K in 3S and 24S soil, except for the insignificant correlation between K and Pb in 24S soil (Table 6). An insignificant negative correlation between heavy metals (Cu, Pb, and Zn) and CEC could be observed in 3S and 24S soil, but the coefficient was higher in 3S soil (r = −0.33~−0.36) than in 24S soil (r = −0.05~−0.19). In 14S soil, Cu and Zn had similar correlations, including significant negative correlations with cumulative C release, pH, EC, TC, CEC (not for Cu), K, and Ca. The three studied soils contained a lot of Zn, including total Zn and available Zn, with the decreasing order of 24S ≈ 14S > 3S, consistent with the decrease after the RHB addition. The results suggest that RHB pyrolyzed at high temperatures have a higher capacity to reduce the concentration of Cu, Pb, and Zn in the three soils, but the potential was higher in 3S and 14S soil than in 24S soil. Inyang et al. [78] indicated that the physicochemical properties of biochar, including pH, surface area, and surface functional groups, significantly influence the sorption of heavy metals onto the biochar. For a certain feedstock, increasing the pyrolyzed temperature results in an increase in biochar pH (attributed to alkaline mineral formation) and aromaticity and a decrease in the number of functional groups [21,79]. Thus, the determination of biochar’s properties and surface chemistry can depend on the pyrolyzed temperature [79,80]. Because of the low surface area and lack of surface functional groups in the studied RHB, the interactions between heavy metals and RHB might be mainly attributed to precipitation, one of the interactions between heavy metals and biochar [21], consistent with the negative correlation between pH and heavy metal concentration. In addition, the concentration of available K showed a significant negative correlation with heavy metals, indicating that some cation exchange occurred between heavy metals and RHB because of the relatively ample amount of available K in RHB and available heavy metals in soils. The RHB pyrolyzed at high temperatures in this study had higher pH and relatively high surface area, suggesting a high capacity to reduce heavy metal concentration, especially for 3S and 14S soil with lower soil pH.
5. Conclusions
The current study results are consistent with our hypothesis that the co-application of RHB and compost in greenhouse soil could improve chemical properties in general and also lead to varying improvements due to the effect of pyrolysis temperature, application rate, and cultivation age. In general, RHB pyrolyzed at low temperatures significantly increased C mineralization (increasing cumulative C release and decreasing TC content) compared with RHB pyrolyzed at high temperatures for the three soils, which could be attributed to the unstable characteristics with a H/C atomic ratio of >0.7. The relatively high pH and Ca content of RHB pyrolyzed at high temperatures led to a higher neutralizing effect when applied to the soil. Additionally, the results suggest that RHB pyrolyzed at high temperatures had a higher capacity, attributed to having a higher pH and relatively high surface area, to reduce the concentration of Cu, Pb, and Zn in the three soils, but the potential was higher in younger cultivation soil than that in older soil because of the lower soil pH of the younger soil. The high application rates (10% and 20%) could significantly increase the values (content) of cumulative CO2-C, pH, TC, CEC, and K in younger and older soils and, in contrast, significantly decrease the content of other soil characteristics. Some variations could be attributed to the RHB types added. With the lower application rates (0.5%, 1.0%, and 4.0%), the cumulative C release, pH, EC, TC, and available K had significant increases with increasing rates; however, the content of TN, TP, CEC, P, Ca, MG, Cu, Pb, and Zn had little or no significant changes. In the co-application with 2% compost (by wt.), only adding 0.5% RHB resulted in an evident change in soil characteristics for 3S and 24S soil, but 4% RHB addition was needed for 14S soil. For carbon sequestration, 4% RHB addition was necessary under the condition of 2% compost application for the three soils. For the reduction in Cu, Pb, and Zn concentration to prevent heavy metal toxicity, 10% RHB addition was needed for 3S and 14S soil, but 1.0 to 4.0% was needed for 24S soil.
Supplementary Materials
The following are available online at https://0-www-mdpi-com.brum.beds.ac.uk/2073-4395/10/7/990/s1, Figure S1: Results of significant tests of RHB effect on cumulative C release, soil properties and available nutrients within three studies soils, Figure S2: Pearson correlation coefficients between measured parameters and PCs (PC1 and PC2) at Day 100 for the three studied soils, Figure S3: Canonical scores of the first two canonical discriminant functions (Can) of RHB type (A~F) and addition rate (0.5, 1.0, 4.0, 10, and 20%) in 3S, 14S and 24S soil. (C = control, CO = compost, A-0.5 = 0.5% of RHB A, and so on.), Table S1: Pearson correlation coefficients between measured parameters and PCs (PC1 and PC2) at Day 100 for the three studied soils, Table S2: Results of significant tests of RHB effect on cumulative C release, soil properties and available nutrients within three studies soils, Table S3: Results of significant test of RHB effect on cumulative C release, soil properties and available nutrients within five application rates.
Author Contributions
Conceptualization, C.-C.T.; methodology, C.-C.T.; validation, C.-C.T., formal analysis, Y.-F.C.; investigation, C.-C.T. and Y.-F.C.; data curation, C.-C.T. and Y.-F.C.; writing—original draft preparation, C.-C.T.; writing—review and editing, C.-C.T.; supervision, C.-C.T.; funding acquisition, C.-C.T. All authors have read and agreed to the published version of the manuscript.
Funding
The authors thank the National Science Council of the Republic of China for financially supporting this research under Contract No. NSC-102-2313-B-197-002.
Acknowledgments
The authors would like to thank the staffs of TC5 Bio-Image Tools, Technology Commons, College of Life Science, National Taiwan University, for help with scanning electron microscopy (SEM); Elemental Analysis, the Instrumentation Center, National Taiwan University, for help with C, H, N, and O contents; Instrumentation Center, National Tsing Hua University, for help with solid-state 13C NMR spectra. Special thanks to Li-Feng Ni (Assistant Researcher, Soil and Fertilizer Research Office, Crop Environment Section, Hualien District Agricultural Research and Extension Station, Council of Agriculture, Taiwan), Chuan-Chi Chien (Industrial Technology Research Institute (ITRI)), and Xie-he Chen (local farmer for rice production, eastern Taiwan) for providing rice husk biochar.
Conflicts of Interest
The authors declare no conflict of interest.
References
- Gao, L.-H.; Qu, M.; Ren, H.; Sui, X.; Chen, Q.-Y.; Zhang, Z. Structure, Function, Application, and Ecological Benefit of a Single-slope, Energy-efficient Solar Greenhouse in China. HortTechnology 2010, 20, 626–631. [Google Scholar] [CrossRef] [Green Version]
- Seo, H.D.; Kang, S.H.; Kim, K.Y.; Kim, H.T.; Kang, S.J. White Revolution of Agriculture in Korea: The achievement of Year-Round Production and Distribution of Horticultural Crops by the Expansion of Greenhouse Cultivation; Korea Development Institute (KDI): Seoul, Korea, 2013; pp. 26–34. [Google Scholar]
- Han, J.; Luo, Y.; Yang, L.; Liu, X.; Wu, L.; Xu, J. Acidification and salinization of soils with different initial pH under greenhouse vegetable cultivation. J. Soils Sediments 2014, 14, 1683–1692. [Google Scholar] [CrossRef]
- Kong, X.; Cao, J.; Tang, R.; Zhang, S.; Dong, F. Pollution of intensively managed greenhouse soils by nutrients and heavy metals in the Yellow River Irrigation Region, Northwest China. Environ. Monit. Assess. 2014, 186, 7719–7731. [Google Scholar] [CrossRef] [PubMed]
- Ju, X.; Kou, C.; Zhang, F.; Christie, P. Nitrogen balance and groundwater nitrate contamination: Comparison among three intensive cropping systems on the North China Plain. Environ. Pollut. 2006, 143, 117–125. [Google Scholar] [CrossRef] [Green Version]
- Zhang, H.; Li, H.; Wang, Z.; Zhou, L. Accumulation Characteristics of Copper and Cadmium in Greenhouse Vegetable Soils in Tongzhou District of Beijing. Procedia Environ. Sci. 2011, 10, 289–294. [Google Scholar] [CrossRef] [Green Version]
- Chen, Z.; Tian, T.; Gao, L.; Tian, Y. Nutrients, heavy metals and phthalate acid esters in solar greenhouse soils in Round-Bohai Bay-Region, China: Impacts of cultivation year and biogeography. Environ. Sci. Pollut. Res. 2016, 23, 13076–13087. [Google Scholar] [CrossRef] [PubMed]
- Wang, J.; Mi, W.; Song, P.; Xie, H.; Zhu, L.; Wang, J. Cultivation Ages Effect on Soil Physicochemical Properties and Heavy Metal Accumulation in Greenhouse Soils. Chin. Geogr. Sci. 2018, 28, 717–726. [Google Scholar] [CrossRef] [Green Version]
- Ju, X.; Kou, C.; Christie, P.; Dou, Z.; Zhang, F. Changes in the soil environment from excessive application of fertilizers and manures to two contrasting intensive cropping systems on the North China Plain. Environ. Pollut. 2007, 145, 497–506. [Google Scholar] [CrossRef] [Green Version]
- Chen, B.H.; Yang, H.L.; Li, Y.L.; Li, X.Z.; Zhou, J.G. Variation characteristics of soil water-soluble salts of large plastic house vegetable field for different cultivation year. J. Soil Water Conserv. 2012, 26, 241–245, (In Chinese with English abstract). [Google Scholar]
- Bernhart, M.; Fasina, O.; Fulton, J.; Wood, C. Compaction of poultry litter. Bioresour. Technol. 2010, 101, 234–238. [Google Scholar] [CrossRef]
- Cheng, M.-P.; Chung, C.-H.; Su, T.-M.; Hung, C.-C.; Lee, C.-F.; Hsiao, T.-H. Investigation on the litter production and composition for native chicken. Taiwan Livest. Res. 2015, 48, 288–296, (In Chinese with English abstract). [Google Scholar]
- Tsai, C.C.; Chen, Z.S.; Hseu, Z.Y.; Guo, H.Y. Representative soils selected from arable and slope soils in Taiwan and their database establishment. Soil Environ. 1998, 1, 73–88, (In Chinese, with English abstract). [Google Scholar]
- Kyveryga, P.M.; Blackmer, A.M.; Ellsworth, J.W.; Isla, R. Soil pH effects on nitrification of fall-applied anhydrous ammonia. Soil Sci. Soc. Am. J. 2004, 68, 545–551. [Google Scholar] [CrossRef]
- Kemmitt, S.J.; Wright, D.; Jones, D.L. Soil acidification used as a management strategy to reduce nitrate losses from agricultural land. Soil Boil. Biochem. 2005, 37, 867–875. [Google Scholar] [CrossRef]
- Lo, C.-S. Technology for Organic Vegetable Production in Plastic House. In Proceedings of the Symposium on Organic Crop Culture Technology, Taichung, Taiwan, 26 June 2008; Agricultural Research Institute, Council of Agriculture, Executive Yuan: Taichung, Taiwan, 2008; pp. 47–60, (In Chinese with English abstract). [Google Scholar]
- Shackley, S.; Carter, S.; Knowles, T.; Middelink, E.; Haefele, S.; Sohi, S.; Cross, A.; Haszeldine, S. Sustainable gasification-biochar systems? A case-study of rice-husk gasification in Cambodia, Part I: Context, chemical properties, environmental and health and safety issues. Energy Policy 2012, 42, 49–58. [Google Scholar] [CrossRef]
- Shackley, S.; Carter, S.; Knowles, T.; Middelink, E.; Haefele, S.M.; Haszeldine, S. Sustainable gasification–biochar systems? A case-study of rice-husk gasification in Cambodia, Part II: Field trial results, carbon abatement, economic assessment and conclusions. Energy Policy 2012, 41, 618–623. [Google Scholar] [CrossRef]
- Ghorbani, M.; Asadi, H.; Abrishamkesh, S. Effects of rice husk biochar on selected soil properties and nitrate leaching in loamy sand and clay soil. Int. Soil Water Conserv. Res. 2019, 7, 258–265. [Google Scholar] [CrossRef]
- Li, S.; Liang, C.; Shangguan, Z. Effects of apple branch biochar on soil C mineralization and nutrient cycling under two levels of N. Sci. Total. Environ. 2017, 607, 109–119. [Google Scholar] [CrossRef]
- Shi, J.; Fan, X.; Tsang, D.C.; Wang, F.; Shen, Z.; Hou, D.; Alessi, D.S. Removal of lead by rice husk biochars produced at different temperatures and implications for their environmental utilizations. Chemosphere 2019, 235, 825–831. [Google Scholar] [CrossRef]
- Oldfield, T.L.; Sikirica, N.; Mondini, C.; López, G.; Kuikman, P.J.; Holden, N.M. Biochar, compost and biochar-compost blend as options to recover nutrients and sequester carbon. J. Environ. Manag. 2018, 218, 465–476. [Google Scholar] [CrossRef]
- Trupiano, D.; Cocozza, C.; Baronti, S.; Amendola, C.; Vaccari, F.P.; Lustrato, G.; Di Lonardo, S.; Fantasma, F.; Tognetti, R.; Scippa, G. The Effects of Biochar and Its Combination with Compost on Lettuce (Lactuca sativa L.) Growth, Soil Properties, and Soil Microbial Activity and Abundance. Int. J. Agron. 2017, 2017, 3158207. [Google Scholar] [CrossRef] [Green Version]
- Liu, J.; Schulz, H.; Brandl, S.; Miehtke, H.; Huwe, B.; Glaser, B. Short-term effect of biochar and compost on soil fertility and water status of a Dystric Cambisol in NE Germany under field conditions. J. Plant Nutr. Soil Sci. 2012, 175, 698–707. [Google Scholar] [CrossRef]
- Agegnehu, G.; Bird, M.I.; Nelson, P.N.; Bass, A. The ameliorating effects of biochar and compost on soil quality and plant growth on a Ferralsol. Soil Res. 2015, 53, 1–12. [Google Scholar] [CrossRef]
- Agegnehu, G.; Srivastava, A.; Bird, M.I. The role of biochar and biochar-compost in improving soil quality and crop performance: A review. Appl. Soil Ecol. 2017, 119, 156–170. [Google Scholar] [CrossRef]
- Tsai, C.-C.; Chang, Y.-F. Carbon Dynamics and Fertility in Biochar-Amended Soils with Excessive Compost Application. Agronomy 2019, 9, 511. [Google Scholar] [CrossRef] [Green Version]
- Tsai, C.-C.; Chang, Y.-F. Nitrogen Availability in Biochar-Amended Soils with Excessive Compost Application. Agronomy 2020, 10, 444. [Google Scholar] [CrossRef] [Green Version]
- Tsai, C.-C.; Chang, Y.-F. Effects of Biochar to Excessive Compost-Fertilized Soils on the Nutrient Status. Agronomy 2020, 10, 683. [Google Scholar] [CrossRef]
- Chien, C.C.; Huang, Y.P.; Sah, J.G.; Cheng, W.J.; Chang, R.Y.; Lu, Y.S. Application of Rice Husk Charcoal on Remediation of Acid Soil. Mater. Sci. Forum 2011, 685, 169–180. [Google Scholar] [CrossRef]
- Thomas, G.W. Soil pH and soil acidity. In Methods of Soil Analysis, Part 3. Chemical Methods; Bigham, J.M., Ed.; Agronomy Society of America and Soil Science Society of America: Madison, WI, USA, 1986; pp. 475–489. [Google Scholar]
- Rhoades, J.D. Salinity: Electrical conductivity and total dissolved solids. In Methods of Soil Analysis, Part 3. Chemical Methods; Bigham, J.M., Ed.; Agronomy Society of America and Soil Science Society of America: Madison, WI, USA, 1986; pp. 417–435. [Google Scholar]
- Poppe, L.; Eliason, A.; Fredericks, J. A computerized particle-size analysis system. Comput. Geosci. 1986, 12, 93–96. [Google Scholar] [CrossRef]
- Tabatabai, M.A.; Bremner, J.M. Automated instruments for determination of total carbon, nitrogen, and sulfur in soils by combustion techniques. In Soil Analysis: Modern Instrumental Techniques; Smith, K.A., Ed.; Marcel Dekker: New York, NY, USA, 1991; pp. 261–289. [Google Scholar]
- Environmental Protection Administration (EPA), Taiwan. Total Concentration of Metals in Soils; Method Code No: NIEA S321.63B; Environmental Protection Administration of Taiwan: Taipei, Taiwan, 2003; 11p.
- Pansu, M.; Gautheyrou, J. Handbook of Soil Analysis-Mineralogical Organic and Inorganic Methods; Springer: Heidelberg, Germany, 2006; pp. 677–686. [Google Scholar]
- Mulvaney, R.L. Nitrogen-inorganic forms. In Methods of Soil Analysis, Part 3 Chemical Method, 1st ed.; Book Series No.5; Sparks, D.L., Page, A.L., Helmke, P.A., Loeppert, R.H., Soltanpour, P.N., Tabatabai, M.A., Johnston, C.T., Sumner, M.E., Eds.; Soil Science Society of America: Madison, WI, USA, 1996; pp. 1123–1185. [Google Scholar]
- Bray, R.H.; Kurtz, L.T. Determination of Total, Organic, and Available Forms of Phosphorus in Soils. Soil Sci. 1945, 59, 39–46. [Google Scholar] [CrossRef]
- Mehlich, A. Determination of P, Ca, Mg, K, Na, and NH4. Short Test Methods Used in Soil Testing Division, Department of Agriculture, Raleigh, North Carolina; North Carolina Department of Agriculture: Raleigh, NC, USA, 1953; 8p.
- Rhoades, J.D. Cation exchange capacity. In Methods of Soil Analysis, Part 2, 2nd ed.; Page, A.L., Miller, R.H., Keeney, D.R., Eds.; Agronomy Society of America and Soil Science Society of America: Madison, WI, USA, 1982; pp. 149–157. [Google Scholar]
- Mehlich, A. Mehlich 3 soil test extractant: A modification of Mehlich 2 extractant. Commun. Soil Sci. Plant Anal. 1984, 15, 1409–1416. [Google Scholar] [CrossRef]
- Singh, B.; Singh, B.P.; Cowie, A.L. Characterisation and evaluation of biochars for their application as a soil amendment. Soil Res. 2010, 48, 516–525. [Google Scholar] [CrossRef]
- Jones, J.B.; Case, V.W.; Westerman, R. Sampling, Handling, and Analyzing Plant Tissue Samples. In Methods of Soil Analysis, Part 5-Mineralogical Methods; Soil Science Society of America: Madison, WI, USA, 2018; pp. 389–427. [Google Scholar]
- Wang, X.; Cook, R.; Tao, S.; Xing, B. Sorption of organic contaminants by biopolymers: Role of polarity, structure and domain spatial arrangement. Chemosphere 2007, 66, 1476–1484. [Google Scholar] [CrossRef] [PubMed]
- Zibilske, L.M. Carbon Mineralization. In Methods of Soil Analysis, Part 2, Microbiological and Biochemical Properties; Weaver, R.W., Angle, J.S., Bottomly, P., Eds.; Soil Science of America: Madison, WI, USA, 1994; pp. 835–863. [Google Scholar]
- Ribeiro, H.; Fangueiro, D.; Alves, F.; Vasconcelos, E.; Coutinho, J.; Bol, R.; Cabral, F. Carbon-mineralization kinetics in an organically managed Cambic Arenosol amended with organic fertilizers. J. Plant Nutr. Soil Sci. 2009, 173, 39–45. [Google Scholar] [CrossRef]
- Jeffery, S.; Verheijen, F.G.; Van Der Velde, M.; Bastos, A.C. A quantitative review of the effects of biochar application to soils on crop productivity using meta-analysis. Agric. Ecosyst. Environ. 2011, 144, 175–187. [Google Scholar] [CrossRef]
- Mukome, F.N.; Six, J.; Parikh, S.J. The effects of walnut shell and wood feedstock biochar amendments on greenhouse gas emissions from a fertile soil. Geoderma 2013, 200, 90–98. [Google Scholar] [CrossRef]
- Hamer, U.; Marschner, B.; Brodowski, S.; Amelung, W. Interactive priming of black carbon and glucose mineralisation. Org. Geochem. 2004, 35, 823–830. [Google Scholar] [CrossRef]
- Kuzyakov, Y.; Subbotina, I.; Chen, H.; Bogomolova, I.; Xu, X. Black carbon decomposition and incorporation into soil microbial biomass estimated by 14C labeling. Soil Boil. Biochem. 2009, 41, 210–219. [Google Scholar] [CrossRef]
- Liang, B.; Lehmann, J.; Sohi, S.; Thies, J.E.; O’Neill, B.; Trujillo, L.; Gaunt, J.; Solomon, D.; Grossman, J.M.; Neves, E.G.; et al. Black carbon affects the cycling of non-black carbon in soil. Org. Geochem. 2010, 41, 206–213. [Google Scholar] [CrossRef]
- Novak, J.M.; Busscher, W.; Watts, D.; Laird, D.; Ahmedna, M.; Niandou, M. Short-term CO2 mineralization after additions of biochar and switchgrass to a Typic Kandiudult. Geoderma 2010, 154, 281–288. [Google Scholar] [CrossRef]
- Jones, D.L.; Murphy, D.V.; Khalid, M.; Ahmad, W.; Edwards-Jones, G.; DeLuca, T.H. Short-term biochar-induced increase in soil CO2 release is both biotically and abiotically mediated. Soil Boil. Biochem. 2011, 43, 1723–1731. [Google Scholar] [CrossRef]
- Schimmelpfennig, S.; Glaser, B. One Step Forward toward Characterization: Some Important Material Properties to Distinguish Biochars. J. Environ. Qual. 2012, 41, 1001–1013. [Google Scholar] [CrossRef] [PubMed] [Green Version]
- Purakayastha, T.J.; Kumari, S.; Pathak, H. Characterisation, stability, and microbial effects of four biochars produced from crop residues. Geoderma 2015, 239, 293–303. [Google Scholar] [CrossRef]
- Awad, Y.M.; Blagodatskaya, E.; Ok, Y.S.; Kuzyakov, Y. Effects of polyacrylamide, biopolymer and biochar on the decomposition of 14C-labelled maize residues and on their stabilization insoil aggregates. Eur. J. Soil Sci. 2013, 64, 488–499. [Google Scholar] [CrossRef]
- El-Naggar, A.H.; Usman, A.R.; Al-Omran, A.M.; Ok, Y.S.; Ahmad, M.; Al-Wabel, M.I. Carbon mineralization and nutrient availability in calcareous sandy soils amended with woody waste biochar. Chemosphere 2015, 138, 67–73. [Google Scholar] [CrossRef]
- Ducey, T.F.; Ippolito, J.A.; Cantrell, K.B.; Novak, J.M.; Lentz, R.D. Addition of activated switchgrass biochar to an aridic subsoil increases microbial nitrogen cycling gene abundances. Appl. Soil Ecol. 2013, 65, 65–72. [Google Scholar] [CrossRef]
- Luo, X.; Chen, L.; Zheng, H.; Chang, J.; Wang, H.; Wang, Z.; Xing, B. Biochar addition reduced net N mineralization of a coastal wetland soil in the Yellow River Delta, China. Geoderma 2016, 282, 120–128. [Google Scholar] [CrossRef] [Green Version]
- Pariyar, P.; Kumari, K.; Jain, M.K.; Jadhao, P.S. Evaluation of change in biochar properties derived from different feedstock and pyrolysis temperature for environmental and agricultural application. Sci. Total. Environ. 2020, 713, 136433. [Google Scholar] [CrossRef]
- Dodson, J. Wheat Straw Ash and its Use as a Silica Source. Ph.D. Thesis, University of York, Heslington, York, UK, September 2011. [Google Scholar]
- Streubel, J.D.; Collins, H.P.; Garcia-Perez, M.; Tarara, J.; Granatstein, D.; Kruger, C. Influence of Contrasting Biochar Types on Five Soils at Increasing Rates of Application. Soil Sci. Soc. Am. J. 2011, 75, 1402–1413. [Google Scholar] [CrossRef]
- Ippolito, J.; Stromberger, M.E.; Lentz, R.D.; Dungan, R.S. Hardwood Biochar Influences Calcareous Soil Physicochemical and Microbiological Status. J. Environ. Qual. 2014, 43, 681–689. [Google Scholar] [CrossRef] [Green Version]
- Yamato, M.; Okimori, Y.; Wibowo, I.F.; Anshori, S.; Ogawa, M. Effects of the application of charred bark ofAcacia mangiumon the yield of maize, cowpea and peanut, and soil chemical properties in South Sumatra, Indonesia. Soil Sci. Plant Nutr. 2006, 52, 489–495. [Google Scholar] [CrossRef]
- Van Zwieten, L.; Kimber, S.; Morris, S.; Chan, K.Y.; Downie, A.; Rust, J.; Joseph, S.; Cowie, A. Effects of biochar from slow pyrolysis of papermill waste on agronomic performance and soil fertility. Plant Soil 2010, 327, 235–246. [Google Scholar] [CrossRef]
- Berek, A.K.; Hue, N.V.; Radovich, T.J.K.; Ahmad, A.A. Biochars Improve Nutrient Phyto-Availability of Hawai’i’s Highly Weathered Soils. Agronomy 2018, 8, 203. [Google Scholar] [CrossRef] [Green Version]
- Chintala, R.; Mollinedo, J.; Schumacher, T.; Malo, D.D.; Julson, J.L. Effect of biochar on chemical properties of acidic soil. Arch. Agron. Soil Sci. 2013, 60, 393–404. [Google Scholar] [CrossRef]
- Xu, C.Y.; Hosseini, B.S.; Xu, Z.; Blumfield, T.J.; Zhao, H.; Wang, H.; Wallace, H.M.; Van Zwieten, L. Biochar application increases soil available nitrogen and plantto-soil carbon input. In Proceedings of the 2nd International Conference on Biochar and Green Agriculture, Nanjing, China, 14–18 April 2015. [Google Scholar]
- Haefele, S.M.; Konboon, Y.; Wongboon, W.; Amarante, S.; Maarifat, A.; Pfeiffer, E.-M.; Knoblauch, C. Effects and fate of biochar from rice residues in rice-based systems. Field Crops Res. 2011, 121, 430–440. [Google Scholar] [CrossRef]
- Jones, D.L.; Rousk, J.; Edwards-Jones, G.; DeLuca, T.; Murphy, D. Biochar-mediated changes in soil quality and plant growth in a three year field trial. Soil Boil. Biochem. 2012, 45, 113–124. [Google Scholar] [CrossRef]
- El-Naggar, A.; Lee, S.S.; Awad, Y.; Yang, X.; Ryu, C.; Rizwan, M.; Rinklebe, J.; Tsang, D.C.; Ok, Y.S. Influence of soil properties and feedstocks on biochar potential for carbon mineralization and improvement of infertile soils. Geoderma 2018, 332, 100–108. [Google Scholar] [CrossRef]
- Solaiman, Z.M.; Anawar, H.M. Application of Biochars for Soil Constraints: Challenges and Solutions. Pedosphere 2015, 25, 631–638. [Google Scholar] [CrossRef]
- Sackett, T.; Basiliko, N.; Noyce, G.L.; Winsborough, C.; Schurman, J.; Ikeda, C.; Thomas, S.C. Soil and greenhouse gas responses to biochar additions in a temperate hardwood forest. GCB Bioenergy 2014, 7, 1062–1074. [Google Scholar] [CrossRef]
- Agegnehu, G.; Bass, A.M.; Nelson, P.N.; Bird, M.I. Benefits of biochar, compost and biochar–compost for soil quality, maize yield and greenhouse gas emissions in a tropical agricultural soil. Sci. Total. Environ. 2016, 543, 295–306. [Google Scholar] [CrossRef]
- Eduah, J.; Nartey, E.; Abekoe, M.; Breuning-Madsen, H.; Andersen, M. Phosphorus retention and availability in three contrasting soils amended with rice husk and corn cob biochar at varying pyrolysis temperatures. Geoderma 2019, 341, 10–17. [Google Scholar] [CrossRef]
- Gérard, F. Clay minerals, iron/aluminum oxides, and their contribution to phosphate sorption in soils—A myth revisited. Geoderma 2016, 262, 213–226. [Google Scholar] [CrossRef]
- Liang, Y.; Cao, X.; Zhao, L.; Xu, X.; Harris, W. Phosphorus Release from Dairy Manure, the Manure-Derived Biochar, and Their Amended Soil: Effects of Phosphorus Nature and Soil Property. J. Environ. Qual. 2014, 43, 1504–1509. [Google Scholar] [CrossRef]
- Inyang, M.I.; Gao, B.; Yao, Y.; Xue, Y.; Zimmerman, A.; Mosa, A.; Pullammanappallil, P.; Ok, Y.S.; Cao, X. A review of biochar as a low-cost adsorbent for aqueous heavy metal removal. Crit. Rev. Environ. Sci. Technol. 2015, 46, 406–433. [Google Scholar] [CrossRef]
- Zhao, B.; O’Connor, D.; Zhang, J.; Peng, T.; Shen, Z.; Tsang, D.C.; Hou, D. Effect of pyrolysis temperature, heating rate, and residence time on rapeseed stem derived biochar. J. Clean. Prod. 2018, 174, 977–987. [Google Scholar] [CrossRef]
- Zhang, H.; Chen, C.; Gray, E.M.; Boyd, S.E. Effect of feedstock and pyrolysis temperature on properties of biochar governing end use efficacy. Biomass Bioenergy 2017, 105, 136–146. [Google Scholar] [CrossRef]
Figure 1.
Principal component analysis, based on soil chemical characteristics and cumulative CO2-C after 100-d incubation period, in 3S, 14S and 24S soils treated with 0% (control), compost (2%), and 0.5%, 1.0%, 4.0%, 10% and 20% of RHB.
Figure 1.
Principal component analysis, based on soil chemical characteristics and cumulative CO2-C after 100-d incubation period, in 3S, 14S and 24S soils treated with 0% (control), compost (2%), and 0.5%, 1.0%, 4.0%, 10% and 20% of RHB.

Figure 2.
Canonical scores of the first two canonical discriminant functions (Can) of 3S, 14S and 24S soil.
Figure 2.
Canonical scores of the first two canonical discriminant functions (Can) of 3S, 14S and 24S soil.


Table 1.
Surface soil (0–15 cm) characteristics of three studied soils (3S, 14S and 24S for soil with 3-yrs, 14-yrs, 17-yrs, and 24-yrs cultivation ages).
Table 1.
Surface soil (0–15 cm) characteristics of three studied soils (3S, 14S and 24S for soil with 3-yrs, 14-yrs, 17-yrs, and 24-yrs cultivation ages).
| Soil Characteristics | 3S | 14S | 24S |
|---|---|---|---|
| Sand (%) | 12.8 | 18.0 | 20.1 |
| Clay (%) | 32.2 | 31.2 | 35.1 |
| Silt (%) | 55.0 | 50.8 | 44.7 |
| Soil Texture | Silty clay loam | Silty clay loam | Clay loam |
| pH | 4.42 | 4.56 | 5.62 |
| Electrical conductivity (EC) (dS m−1) | 0.40 | 0.51 | 0.48 |
| Total C (%) | 2.49 | 1.75 | 2.08 |
| Total N (%) | 0.39 | 0.29 | 0.34 |
| C/N | 6.38 | 6.03 | 6.12 |
| Total P (g kg−1) | 1.58 | 3.14 | 4.00 |
| Total Cu (mg kg−1) | 20.0 | 32.3 | 35.2 |
| Total Pb (mg kg−1) | 10.5 | 9.59 | 8.91 |
| Total Zn (mg kg−1) | 422 | 724 | 749 |
| Available NH4+-N (mg kg−1) | 14.2 | 11.4 | 19.9 |
| Available NO3−-N (mg kg−1) | 148 | 253 | 119 |
| Available P (mg kg−1) | 424 | 822 | 912 |
| Available K (mg kg−1) | 131 | 265 | 230 |
| Exchangeable K (coml(+) kg−1 soil−1) | 0.88 | 1.82 | 0.88 |
| Exchangeable Na (coml(+) kg−1 soil−1) | 0.52 | 0.58 | 0.27 |
| Exchangeable Ca (coml(+) kg−1 soil−1) | 3.26 | 4.28 | 4.64 |
| Exchangeable Mg (coml(+) kg−1 soil−1) | 0.75 | 1.14 | 0.89 |
| Cation exchange capacity (CEC) (coml(+) kg−1 soil−1) | 12.2 | 13.0 | 12.9 |
| Base saturation (BS) (%) | 44 | 60 | 52 |
| Mehlich-3 extraction P (mg kg−1) | 404 | 752 | 944 |
| Mehlich-3 extraction K (mg kg−1) | 75.5 | 179 | 155 |
| Mehlich-3 extraction Na (mg kg−1) | 34.9 | 48.8 | ND 1 |
| Mehlich-3 extraction Ca (mg kg−1) | 1722 | 1675 | 3087 |
| Mehlich-3 extraction Mg (mg kg−1) | 282 | 396 | 427 |
| Mehlich-3 extraction Fe (mg kg−1) | 313 | 342 | 319 |
| Mehlich-3 extraction Al (mg kg−1) | 686 | 744 | 536 |
| Mehlich-3 extraction Mn (mg kg−1) | 38.2 | 40.4 | 28.9 |
| Mehlich-3 extraction Cu (mg kg−1) | 4.21 | 6.17 | 7.79 |
| Mehlich-3 extraction Pb (mg kg−1) | 6.68 | 0.88 | 2.87 |
| Mehlich-3 extraction Zn (mg kg−1) | 40.0 | 55.6 | 62.0 |
1 ND = not detected.
Table 2.
Characteristics of six rice husk biochars (RHB) in this study.
| Characteristics | A | B | C | D | E | F | |
|---|---|---|---|---|---|---|---|
| pH (1:5) | 8.35 | 7.87 | 8.07 | 7.40 | 7.23 | 8.38 | |
| Electrical conductivity (EC) (1:10, 30min) (dS m−1) | 0.40 | 0.19 | 0.17 | 0.58 | 0.67 | 0.50 | |
| Electrical conductivity (EC) (1:10, 24Hr) (dS m−1) | 0.78 | 0.40 | 0.38 | 0.84 | 0.99 | 0.85 | |
| Total content (g kg−1) | P | 1.71 | 1.21 | 0.95 | 0.95 | 1.51 | 1.20 |
| K | 19.6 | 16.7 | 15.4 | 12.0 | 13.2 | 20.9 | |
| Ca | 3.34 | 2.18 | 2.05 | 1.58 | 3.27 | 2.91 | |
| Mg | 1.68 | 0.65 | 0.51 | 0.99 | 1.57 | 1.03 | |
| Cu | 0.03 | 0.02 | 0.02 | 0.02 | 0.02 | 0.02 | |
| Zn | 0.05 | 0.03 | 0.02 | 0.03 | 0.04 | 0.04 | |
| Cation exchangeable capacity (CEC)(cmol(+) kg−1 soil−1) | 3.10 | 4.11 | 4.34 | 5.86 | 4.37 | 7.08 | |
| Exchangeable bases (coml(+) kg−1 soil−1) | K | 0.87 | 1.59 | 2.06 | 1.86 | 1.33 | 5.00 |
| Na | 0.08 | 0.01 | 0.04 | 0.02 | 0.05 | 0.47 | |
| Ca | 0.02 | 0.07 | 0.10 | 0.03 | 0.04 | 0.19 | |
| Mg | 0.01 | 0.02 | 0.03 | 0.03 | 0.03 | 0.08 | |
| Base saturation (BS) (%) | 32 | 42 | 51 | 33 | 33 | 81 | |
| Mehlich-3 extraction (mg kg−1) | P | 170 | 252 | 239 | 315 | 489 | 361 |
| K | 1209 | 638 | 648 | 2269 | 2053 | 2007 | |
| Na | ND 1 | ND | ND | ND | ND | 96.1 | |
| Ca | 184 | 215 | 244 | 277 | 1000 | 422 | |
| Mg | 91.8 | 93.3 | 87.0 | 218 | 336 | 167 | |
| Fe | 32.1 | 16.7 | 19.0 | 32.7 | 156 | 16.7 | |
| Al | 12.6 | 1.69 | 2.10 | 2.44 | 214 | 3.36 | |
| Mn | 48.6 | 74.1 | 64.7 | 64.8 | 68.9 | 100 | |
| Cu | 0.10 | 0.16 | 0.20 | 0.15 | 0.41 | 0.17 | |
| Pb | 0.16 | 0.11 | 0.10 | 0.19 | 0.21 | 0.14 | |
| Zn | 6.43 | 3.50 | 3.90 | 7.40 | 9.76 | 5.39 | |
| BET surface area (m2 g−1) | 2.66 | 2.77 | 2.81 | 2.45 | 2.45 | 2.80 | |
| Elemental analysis (%) | C | 49.2 | 51.9 | 51.1 | 42.2 | 40.4 | 52.2 |
| H | 2.29 | 2.48 | 2.55 | 2.89 | 3.29 | 2.35 | |
| N | 0.71 | 0.63 | 0.62 | 0.54 | 0.63 | 0.65 | |
| O | 13.9 | 15.2 | 15.0 | 22.0 | 24.1 | 14.7 | |
| C/N mass ratio | 68.8 | 82.6 | 82.7 | 78.9 | 64.1 | 80.8 | |
| (O+N)/C atomic ratio | 0.224 | 0.229 | 0.231 | 0.401 | 0.461 | 0.221 | |
| O/C atomic ratio | 0.212 | 0.219 | 0.220 | 0.391 | 0.448 | 0.211 | |
| H/C atomic ratio | 0.558 | 0.574 | 0.599 | 0.820 | 0.979 | 0.540 | |
| Distribution of C chemical shift, ppm (Integrated results of solid-state 13C NMR spectra) (%) | paraffinic C (0–50 ppm) | 18.4 | 20.1 | 21.2 | 16.6 | 18.9 | 19.1 |
| substituted aliphatic C including alcohol, amines, carbohydrates, ethers, and methyl and acetal C (50–109 ppm) | 10.1 | 9.03 | 10.9 | 41.1 | 43.4 | 8.40 | |
| aromatic C (109–145 ppm) | 58.9 | 54.9 | 52.6 | 31.3 | 26.4 | 57.3 | |
| phenolic C (145–163 ppm) | 6.96 | 9.72 | 8.97 | 6.90 | 5.97 | 9.16 | |
| carboxyl C (163–190 ppm) | 2.53 | 3.47 | 3.21 | 1.88 | 2.52 | 3.05 | |
| carbonyl C (190–220 ppm) | 3.16 | 2.78 | 3.21 | 2.19 | 2.83 | 3.05 | |
| Aliphatic C 2 | 28.5 | 29.2 | 32.1 | 57.7 | 62.3 | 27.5 | |
| Polar C 2 | 22.8 | 25.0 | 26.3 | 52.0 | 54.7 | 23.7 | |
| Aliphatic polar C 2 | 10.1 | 9.03 | 10.9 | 41.1 | 43.4 | 8.40 | |
1 ND = not detected; 2 Aliphatic C: total aliphatic C region (0–109 ppm); polar C: total polar carbon region (50–109 ppm and 145–220 ppm); aliphatic polar C: polar carbon in aliphatic region (50–109 ppm).
Table 3.
Significance (p-value) of two-way ANOVA results of three soils (Rate and Treat) effect and six RHB (Soil and Rate) effect on cumulative C release, soil properties and available nutrients in this study.
Table 3.
Significance (p-value) of two-way ANOVA results of three soils (Rate and Treat) effect and six RHB (Soil and Rate) effect on cumulative C release, soil properties and available nutrients in this study.
| Soil | Source | Df 1 | Cumulative C Release | pH | EC | TC | TN | TP | CEC | P | K | Ca | Mg | Cu | Pb | Zn |
|---|---|---|---|---|---|---|---|---|---|---|---|---|---|---|---|---|
| 3S | Rate | 4 | ***2 | *** | *** | *** | *** | *** | *** | *** | *** | ns | *** | *** | *** | *** |
| Treat | 7 | *** | *** | *** | *** | *** | *** | ns | *** | *** | *** | *** | *** | *** | *** | |
| Rate × Treat | 20 | *** | *** | ns | *** | ns | *** | ns | ns | *** | ns | *** | *** | *** | *** | |
| 14S | Rate | 4 | *** | *** | *** | *** | *** | *** | *** | *** | *** | *** | *** | *** | ns | *** |
| Treat | 7 | ***2 | *** | *** | *** | *** | ns | ns | *** | *** | ns | ns | ns | ns | *** | |
| Rate × Treat | 20 | *** | *** | *** | *** | ns | ns | ns | ns | *** | ns | ns | ns | ns | ns | |
| 24S | Rate | 4 | *** | *** | ns | *** | *** | *** | ns | *** | *** | *** | *** | *** | *** | *** |
| Treat | 7 | ***2 | *** | *** | *** | *** | *** | ns | *** | *** | *** | *** | *** | *** | *** | |
| Rate × Treat | 20 | *** | *** | *** | *** | ns | *** | ns | *** | *** | *** | ns | *** | *** | *** | |
| RHB | Source | Df 1 | Cumulative C Release | pH | EC | TC | TN | TP | CEC | P | K | Ca | Mg | Cu | Pb | Zn |
| RHB-A | Soil | 2 | *** | *** | *** | ns | ns | *** | *** | *** | *** | *** | *** | *** | *** | *** |
| Rate | 4 | *** | *** | ns | *** | *** | *** | ns | *** | *** | ns | *** | *** | *** | *** | |
| Soil × Rate | 8 | *** | ns | *** | ns | ns | ns | ns | *** | ns | *** | ns | ns | *** | *** | |
| RHB-B | Soil | 2 | *** | *** | *** | ns | ns | *** | ns | *** | *** | *** | *** | *** | *** | *** |
| Rate | 4 | *** | *** | ns | *** | *** | *** | *** | *** | *** | *** | *** | *** | *** | *** | |
| Soil × Rate | 8 | *** | ns | ns | ns | ns | *** | ns | *** | ns | ns | ns | *** | *** | *** | |
| RHB-C | Soil | 2 | *** | *** | *** | ns | *** | *** | ns | *** | *** | *** | *** | *** | *** | *** |
| Rate | 4 | ns | *** | *** | *** | *** | *** | ns | *** | *** | *** | *** | *** | *** | *** | |
| Soil × Rate | 8 | ns | *** | *** | ns | ns | *** | ns | *** | *** | ns | *** | *** | *** | *** | |
| RHB-D | Soil | 2 | *** | *** | *** | ns | ns | *** | ns | *** | *** | *** | *** | *** | *** | *** |
| Rate | 4 | *** | *** | *** | *** | *** | *** | *** | *** | *** | ns | *** | *** | *** | *** | |
| Soil × Rate | 8 | *** | *** | *** | ns | ns | ns | ns | *** | *** | ns | *** | *** | *** | *** | |
| RHB-E | Soil | 2 | *** | *** | *** | ns | ns | *** | ns | *** | *** | *** | *** | *** | *** | *** |
| Rate | 4 | *** | *** | *** | *** | *** | ns | ns | *** | *** | *** | *** | *** | *** | *** | |
| Soil × Rate | 8 | *** | ns | *** | ns | ns | ns | ns | *** | *** | *** | *** | *** | *** | *** | |
| RHB-F | Soil | 2 | *** | *** | *** | ns | ns | *** | ns | *** | *** | *** | *** | *** | *** | *** |
| Rate | 4 | *** | *** | *** | *** | *** | *** | ns | *** | *** | *** | *** | *** | *** | *** | |
| Soil × Rate | 8 | *** | ns | *** | ns | ns | ns | ns | *** | *** | ns | ns | *** | *** | *** |
1 df = degree of freedom; EC = electrical conductivity; TC = total carbon; TN = total nitrogen; TP = total phosphorus; CEC = cation exchange capacity; available nutrients (P, K, Ca, Mg, Cu, Pb and Zn) = Mehlich 3 extraction method; 2 ***: p < 0.0001.
Table 4.
Results of significant tests of RHB application rates effect on cumulative C release, soil properties and available nutrients for studied soil.
Table 4.
Results of significant tests of RHB application rates effect on cumulative C release, soil properties and available nutrients for studied soil.
| Rate | n | Cumulative C Release | pH | EC 1 | TC | TN | TP | CEC | P | K | Ca | Mg | Cu | Pb | Zn |
|---|---|---|---|---|---|---|---|---|---|---|---|---|---|---|---|
| mg CO2-C kg−1 soil−1 | dS m−1 | % | g kg−1 | g kg−1 | coml (+) kg−1 soil−1 | g kg−1 | g kg−1 | g kg−1 | g kg−1 | mg kg−1 | mg kg−1 | mg kg−1 | |||
| 3S | |||||||||||||||
| Control | 3 | 1622 F 2 | 4.20 F | 0.93 C | 2.23 E | 0.23 C | 1.40 C | 15.5 C | 0.60 C | 0.20 F | 1.80 B | 0.20 D | 4.17 B | 4.23 D | 35.5 B |
| Compost | 3 | 2728 E | 4.83 E | 1.20 A | 2.87 D | 3.30 AB | 2.43 A | 16.2 BC | 1.20 A | 0.57 E | 2.63 A | 0.50 AB | 6.70 A | 11.0 B | 53.1 A |
| 0.5% | 18 3 | 2805 E | 4.86 DE | 1.21 A | 3.03 D | 3.42 A | 2.43 A | 16.4 B | 1.22 A | 0.59 DE | 2.69 A | 0.48 B | 6.71 A | 11.1 AB | 54.0 A |
| 1.0% | 18 | 2943 D | 4.91 D | 1.18 A | 3.19 D | 3.30 AB | 2.49 A | 16.3 BC | 1.23 A | 0.64 D | 2.69 A | 0.48 AB | 6.86 A | 11.3 AB | 54.8A |
| 4.0% | 18 | 3228 C | 4.97 C | 1.22 A | 4.39 C | 3.08 B | 2.47 A | 16.7 B | 1.25 A | 0.94 C | 2.52 A | 0.51 A | 6.91 A | 11.5 A | 54.8 A |
| 10% | 18 | 3488 B | 5.27 B | 1.08 B | 6.28 B | 0.36 C | 1.66 B | 16.9 AB | 0.82 B | 1.08 B | 2.66 A | 0.38 C | 3.44 C | 4.39 CD | 32.9 C |
| 20% | 18 | 4390 A | 5.48 A | 1.07 B | 9.32 A | 0.37 C | 1.86 B | 17.7 A | 0.81 B | 1.58 A | 2.55 A | 0.37 C | 3.34 C | 4.67 C | 32.1 C |
| 14S | |||||||||||||||
| Control | 3 | 1461 E | 4.73 E | 2.50 A | 1.83 E | 0.30 B | 3.13 B | 17.9 ABC | 1.60 B | 0.30 G | 5.03 BC | 0.60 C | 3.47 B | 0.20 A | 64.3 B |
| Compost | 3 | 2332 D | 5.10 CD | 1.93 B | 2.33 DE | 3.03 A | 4.43 A | 16.9 C | 2.83 A | 0.80 F | 4.40 CD | 0.80 A | 5.73 A | 0.77 A | 90.8 A |
| 0.5% | 18 | 2385 D | 5.08 D | 1.89 B | 2.59 D | 2.93 A | 4.35 A | 16.9 C | 2.84 A | 0.91 E | 4.39 CD | 0.81 A | 5.63 A | 0.77 A | 89.4 A |
| 1.0% | 18 | 2367 D | 5.12 CD | 1.86 B | 2.66 D | 3.08 A | 4.40 A | 17.3 BC | 2.87 A | 0.99 D | 4.27 D | 0.82 A | 5.56 A | 0.74 A | 90.3 A |
| 4.0% | 18 | 2692 C | 5.18 BC | 1.86 B | 3.99 C | 2.84 A | 4.32 A | 17.3 BC | 2.75 A | 1.25 B | 3.92 D | 0.74 AB | 5.79 A | 1.26 A | 85.7 A |
| 10% | 18 | 3076 B | 5.27 B | 2.48 A | 6.01 B | 0.49 B | 3.16 B | 18.1 AB | 1.78 B | 1.15 C | 5.84 A | 0.71 AB | 2.97 B | 0.27 A | 55.2 C |
| 20% | 18 | 3842 A | 5.48 A | 2.43 A | 9.37 A | 0.34 B | 3.09 B | 18.6 A | 1.67 B | 1.66 A | 5.48 AB | 0.66 BC | 2.69 B | 0.31 A | 50.5 C |
| 24S | |||||||||||||||
| Control | 3 | 1950 E | 5.67 D | 1.20 A | 1.80 E | 0.30 B | 2.50 C | 15.9 C | 1.70 D | 0.30 F | 5.30 B | 0.40 D | 4.80 D | 0.57 D | 50.5 C |
| Compost | 3 | 3322 D | 5.80 C | 1.20 A | 2.30 DE | 3.10 A | 4.63 A | 17.7 B | 3.17 A | 0.90 E | 5.30 B | 0.77 A | 9.50 A | 3.70 A | 87.1 A |
| 0.5% | 18 | 3505 CD | 5.83 C | 1.17 A | 2.63 D | 3.31 A | 5.12 A | 17.9 B | 3.02 B | 0.91 E | 5.54 B | 0.72 B | 9.49 A | 3.62 A | 88.3 A |
| 1.0% | 18 | 3622 C | 5.82 C | 1.16 A | 2.85 D | 3.19 A | 4.62 A | 17.7 B | 3.03 B | 0.95 D | 5.44 B | 0.72 B | 9.07 B | 3.23 B | 87.4 A |
| 4.0% | 18 | 3944 B | 5.84 C | 1.16 A | 3.91 C | 3.12 A | 4.63 A | 17.8 B | 2.97 B | 1.23 B | 5.28 B | 0.71 B | 8.68 C | 3.17 B | 84.5 B |
| 10% | 18 | 3874 B | 6.18 B | 1.21 A | 6.32 B | 0.36 B | 3.40 B | 18.0 B | 1.77 C | 1.17 C | 6.22 A | 0.53 C | 4.55 DE | 1.15 C | 48.1 D |
| 20% | 18 | 4426 A | 6.30 A | 1.21 A | 9.23 A | 0.34 B | 2.90 BC | 19.0 A | 1.73 CD | 1.63 A | 5.61 B | 0.52 C | 4.25 E | 1.32 C | 45.1E |
1 EC = electrical conductivity; TC = total carbon; TN = total nitrogen; TP = total phosphorus; CEC = cation exchange capacity; available nutrients (P, K, Ca, Mg, Cu, Pb and Zn) = Mehlich 3 extraction method; 2 Means followed by different capital letter are significantly different for each parameter in the rate column and biochar column (p < 0.01); 3 The value is means of six RHB for each addition rate (in 3 replicates).
Table 5.
Results of significant tests of RHB type effect on cumulative C release, soil properties and available nutrients for studied soil.
Table 5.
Results of significant tests of RHB type effect on cumulative C release, soil properties and available nutrients for studied soil.
| Treat | n | Cumu-lative C Release | pH | EC 1 | TC | TN | TP | CEC | P | K | Ca | Mg | Cu | Pb | Zn |
|---|---|---|---|---|---|---|---|---|---|---|---|---|---|---|---|
| mg CO2-C kg−1 soil−1 | dS m−1 | % | g kg−1 | g kg−1 | coml (+) kg−1 soil−1 | g kg−1 | g kg−1 | g kg−1 | g kg−1 | mg kg−1 | mg kg−1 | mg kg−1 | |||
| 3S | |||||||||||||||
| Control | 3 | 1622 E 2 | 4.20 F | 0.93 D | 2.23 D | 0.23 C | 1.40 C | 15.5 C | 0.60 E | 0.20 F | 1.80 D | 0.20 E | 4.17 F | 4.23 E | 35.5 F |
| Compost | 3 | 2728 D | 4.83 E | 1.20 AB | 2.87 C | 3.30 A | 2.43 A | 16.2 BC | 1.20 A | 0.57 E | 2.63 B | 0.50 A | 6.70 A | 11.0 A | 53.1 A |
| RHB-A | 15 3 | 2919 C | 5.11 BC | 1.17 AB | 5.38 A | 2.17 B | 1.97 B | 16.5 AB | 1.00 D | 0.99 B | 2.29 C | 0.43 CD | 5.64 C | 9.24 B | 50.3 B |
| RHB-B | 15 | 2834 CD | 5.10 BC | 1.13 BC | 5.75 A | 2.07 B | 2.15 B | 17.0 AB | 1.03 CD | 0.90 D | 2.49 BC | 0.43 CD | 4.63 E | 7.56 D | 39.8 E |
| RHB-C | 15 | 2863 C | 5.11 B | 1.13 BC | 5.55 A | 2.03 B | 2.46 A | 16.5 AB | 1.09 BC | 0.89 D | 2.70 B | 0.43 CD | 5.15 D | 7.92 D | 40.7 E |
| RHB-D | 15 | 4239 A | 5.05 CD | 1.07 C | 4.47 B | 2.15 B | 2.12 B | 17.0 AB | 1.03 CD | 0.93 CD | 2.92 A | 0.43 D | 6.13 B | 9.02 BC | 46.9 D |
| RHB-E | 15 | 4190 A | 5.03 D | 1.19 AB | 4.52 B | 2.15 B | 2.21 B | 16.9 AB | 1.12 B | 0.96 BC | 2.61 B | 0.47 AB | 5.53 C | 8.72 C | 47.3 CD |
| RHB-F | 15 | 3180 B | 5.19 A | 1.22 A | 5.79 A | 2.09 B | 2.19 B | 17.1 A | 1.11 B | 1.13 A | 2.72 AB | 0.46 BC | 5.64 C | 9.09 BC | 49.3 BC |
| 14S | |||||||||||||||
| Control | 3 | 1461 E | 4.73 D | 2.50 A | 1.83 C | 0.30 D | 3.13 D | 17.9 A | 1.60 C | 0.30 F | 5.03 AB | 0.60 B | 3.47 C | 0.20 A | 64.3 D |
| Compost | 3 | 2332 D | 5.10 C | 1.93 CD | 2.33 C | 3.03 A | 4.43 A | 16.9 A | 2.83 A | 0.80 E | 4.40 BC | 0.80 A | 5.73 A | 0.77 A | 90.8 A |
| RHB-A | 15 | 2574 B | 5.23 AB | 2.42 AB | 5.25 A | 1.95 BC | 3.77 BC | 17.5 A | 2.39 B | 1.25 B | 4.24 C | 0.81 A | 4.72 B | 0.97 A | 79.4 B |
| RHB-B | 15 | 2394 CD | 5.19 BC | 2.29 B | 5.29 A | 1.77 C | 3.90 BC | 17.8 A | 2.33 B | 1.08 D | 4.93 ABC | 0.81 A | 4.15 BC | 0.38 A | 67.8 D |
| RHB-C | 15 | 2530 BC | 5.22 B | 2.05 C | 5.19 A | 1.79 C | 3.91 BC | 18.0 A | 2.23 B | 1.07 D | 5.37 A | 0.71 AB | 4.50 B | 0.71 A | 70.0 CD |
| RHB-D | 15 | 3505 A | 5.19 BC | 1.87 D | 4.29 B | 2.28 B | 3.75 BC | 17.3 A | 2.35 B | 1.17 C | 5.03 AB | 0.70 AB | 5.04 AB | 0.77 A | 75.3 BC |
| RHB-E | 15 | 3558 A | 5.21 B | 1.96 CD | 4.36 B | 2.05 BC | 3.61 C | 17.9 A | 2.50 B | 1.19 BC | 4.67 ABC | 0.77 A | 4.30 BC | 0.52 A | 75.9 BC |
| RHB-F | 15 | 2674 B | 5.32 A | 2.02 CD | 5.15 A | 1.78 C | 4.25 AB | 17.3 A | 2.49 B | 1.39 A | 4.43 BC | 0.70 AB | 4.46 B | 0.67 A | 77.1 B |
| 24S | |||||||||||||||
| Control | 3 | 1950 F | 5.67 E | 1.20 BC | 1.80 C | 0.30 E | 2.50 D | 15.9 B | 1.70 G | 0.30 F | 5.30 CD | 0.40 E | 4.80 E | 0.57 E | 50.5 D |
| Compost | 3 | 3322 DE | 5.80 D | 1.20 BC | 2.30 C | 3.10 A | 4.63 AB | 17.7 A | 3.17 A | 0.90 E | 5.30 CD | 0.77 A | 9.50 A | 3.70 A | 87.1 A |
| RHB-A | 15 | 3280 DE | 6.09 A | 1.18 BCD | 5.17 A | 1.85 CD | 3.79 C | 18.3 A | 2.45 E | 1.23 B | 5.40 BCD | 0.62 D | 7.53 B | 3.01 B | 68.3 C |
| RHB-B | 15 | 3444 CD | 5.99 B | 1.13 DE | 5.12 A | 1.77 D | 4.06 BC | 18.0 A | 2.48 DE | 1.05 D | 5.15 D | 0.61 D | 7.08 C | 2.21 CD | 69.2 C |
| RHB-C | 15 | 3124 E | 5.97 B | 1.23 AB | 5.48 A | 2.31 B | 3.80 C | 18.2 A | 2.35 F | 1.05 D | 6.29 A | 0.62 D | 7.90 B | 3.01 B | 72.7 B |
| RHB-D | 15 | 5180 A | 5.89 C | 1.12 E | 4.21 B | 2.18 B | 3.72 C | 18.2 A | 2.55 C | 1.18 C | 5.19 D | 0.62 D | 6.59 D | 1.92 D | 74.2 B |
| RHB-E | 15 | 4632 B | 5.96 B | 1.16 CDE | 4.31 B | 2.09 BC | 4.53 AB | 18.1 A | 2.51 CD | 1.19 BC | 5.78 ABC | 0.66 C | 7.11 C | 2.36 C | 69.4 C |
| RHB-F | 15 | 3586 C | 6.07 A | 1.27 A | 5.65 A | 2.18 B | 4.89 A | 17.5 A | 2.67 B | 1.37 A | 5.89 AB | 0.70 B | 7.05 C | 2.47 C | 70.1 C |
1 EC = electrical conductivity; TC = total carbon; TN = total nitrogen; TP = total phosphorus; CEC = cation exchange capacity; available nutrients (P, K, Ca, Mg, Cu, Pb and Zn) = Mehlich 3 extraction method; 2 Means followed by different capital letter are significantly different for each parameter in the rate column and biochar column (p < 0.01); 3 The value is means of five addition rates for each RHB (in 3 replicates).
Table 6.
Pearson correlation coefficients between measured parameters at Day 100 for the three studied soils.
Table 6.
Pearson correlation coefficients between measured parameters at Day 100 for the three studied soils.
| Cumu. C Release 1 | pH | EC | TC | TN | TP | CEC | P | K | Ca | Mg | Cu | Pb | Zn | |
|---|---|---|---|---|---|---|---|---|---|---|---|---|---|---|
| 3S | ||||||||||||||
| Cumu. C release | 1.00 | 0.49 2 | −0.16 | 0.33 | −0.37 | −0.30 | 0.51 | −0.24 | 0.60 | 0.29 | −0.04 | −0.34 | −0.32 | −0.30 |
| pH | 1.00 | −0.18 | 0.89 | −0.62 | −0.37 | 0.48 | −0.44 | 0.92 | 0.14 | −0.34 | −0.66 | −0.60 | −0.62 | |
| EC | 1.00 | −0.33 | 0.60 | 0.46 | −0.08 | 0.66 | −0.17 | 0.15 | 0.66 | 0.56 | 0.63 | 0.63 | ||
| TC | 1.00 | −0.75 | −0.45 | 0.43 | −0.62 | 0.90 | −0.09 | −0.58 | −0.75 | −0.72 | −0.74 | |||
| TN | 1.00 | 0.72 | −0.38 | 0.90 | −0.66 | 0.15 | 0.82 | 0.92 | 0.95 | 0.90 | ||||
| TP | 1.00 | −0.23 | 0.73 | −0.40 | 0.17 | 0.67 | 0.69 | 0.70 | 0.64 | |||||
| CEC | 1.00 | −0.22 | 0.54 | 0.15 | −0.12 | −0.36 | −0.33 | −0.34 | ||||||
| P | 1.00 | −0.48 | 0.22 | 0.96 | 0.84 | 0.88 | 0.82 | |||||||
| K | 1.00 | −0.01 | −0.36 | −0.66 | −0.60 | −0.60 | ||||||||
| Ca | 1.00 | 0.25 | 0.14 | 0.12 | 0.07 | |||||||||
| Mg | 1.00 | 0.75 | 0.80 | 0.76 | ||||||||||
| Cu | 1.00 | 0.98 | 0.95 | |||||||||||
| Pb | 1.00 | 0.97 | ||||||||||||
| Zn | 1.00 | |||||||||||||
| 14S | ||||||||||||||
| Cumu. C release | 1.00 | 0.39 | 0.23 | 0.48 | −0.44 | −0.44 | 0.36 | −0.44 | 0.61 | 0.34 | −0.25 | −0.42 | −0.13 | −0.46 |
| pH | 1.00 | 0.22 | 0.81 | −0.48 | −0.40 | 0.22 | −0.45 | 0.81 | 0.33 | −0.37 | −0.48 | −0.12 | −0.58 | |
| EC | 1.00 | 0.55 | −0.77 | −0.48 | 0.41 | −0.74 | 0.23 | 0.55 | −0.14 | −0.64 | −0.24 | −0.63 | ||
| TC | 1.00 | −0.77 | −0.59 | 0.41 | −0.76 | 0.78 | 0.53 | −0.47 | −0.71 | −0.22 | −0.82 | |||
| TN | 1.00 | 0.74 | −0.48 | 0.94 | −0.40 | −0.71 | 0.55 | 0.87 | 0.37 | 0.91 | ||||
| TP | 1.00 | −0.50 | 0.74 | −0.28 | −0.49 | 0.49 | 0.68 | 0.26 | 0.72 | |||||
| CEC | 1.00 | −0.44 | 0.23 | 0.40 | −0.14 | −0.38 | −0.07 | −0.41 | ||||||
| P | 1.00 | −0.35 | −0.75 | 0.69 | 0.82 | 0.30 | 0.92 | |||||||
| K | 1.00 | 0.22 | −0.19 | −0.39 | −0.06 | −0.45 | ||||||||
| Ca | 1.00 | −0.52 | −0.62 | −0.31 | −0.72 | |||||||||
| Mg | 1.00 | 0.44 | 0.06 | 0.63 | ||||||||||
| Cu | 1.00 | 0.71 | 0.86 | |||||||||||
| Pb | 1.00 | 0.35 | ||||||||||||
| Zn | 1.00 | |||||||||||||
| 24S | ||||||||||||||
| Cumu. C release | 1.00 | 0.14 | −0.34 | 0.08 | −0.12 | 0.04 | 0.36 | −0.10 | 0.45 | −0.12 | −0.01 | −0.20 | −0.18 | −0.12 |
| pH | 1.00 | 0.17 | 0.90 | −0.78 | −0.55 | 0.34 | −0.77 | 0.74 | 0.32 | −0.64 | −0.75 | −0.57 | −0.83 | |
| EC | 1.00 | 0.29 | −0.16 | −0.10 | −0.22 | −0.21 | 0.19 | 0.24 | −0.07 | −0.11 | 0.02 | −0.13 | ||
| TC | 1.00 | −0.75 | −0.60 | 0.28 | −0.77 | 0.77 | 0.25 | −0.71 | −0.77 | −0.63 | −0.80 | |||
| TN | 1.00 | 0.70 | −0.22 | 0.95 | −0.43 | −0.24 | 0.88 | 0.92 | 0.83 | 0.94 | ||||
| TP | 1.00 | −0.14 | 0.73 | −0.25 | −0.21 | 0.77 | 0.65 | 0.59 | 0.67 | |||||
| CEC | 1.00 | −0.22 | 0.36 | 0.11 | −0.16 | −0.15 | −0.05 | −0.19 | ||||||
| P | 1.00 | −0.40 | −0.29 | 0.93 | 0.90 | 0.79 | 0.95 | |||||||
| K | 1.00 | 0.04 | −0.28 | −0.50 | −0.33 | −0.49 | ||||||||
| Ca | 1.00 | −0.13 | −0.19 | −0.14 | −0.25 | |||||||||
| Mg | −0.13 | 1.00 | 0.86 | 0.81 | 0.88 | |||||||||
| Cu | 1.00 | 0.95 | 0.95 | |||||||||||
| Pb | 1.00 | 0.86 | ||||||||||||
| Zn | 1.00 | |||||||||||||
1 Cumu. C release = cumulative C release; EC = electrical conductivity; TC = total carbon; TN = total nitrogen; TP = total phosphorus; CEC = cation exchange capacity; 2 The bold number indicated the significant correlations analyzed by SAS (p < 0.0001).
© 2020 by the authors. Licensee MDPI, Basel, Switzerland. This article is an open access article distributed under the terms and conditions of the Creative Commons Attribution (CC BY) license (http://creativecommons.org/licenses/by/4.0/).
Share and Cite
MDPI and ACS Style
Tsai, C.-C.; Chang, Y.-F. Effects of Rice Husk Biochar on Carbon Release and Nutrient Availability in Three Cultivation Age of Greenhouse Soils. Agronomy 2020, 10, 990. https://0-doi-org.brum.beds.ac.uk/10.3390/agronomy10070990
AMA Style
Tsai C-C, Chang Y-F. Effects of Rice Husk Biochar on Carbon Release and Nutrient Availability in Three Cultivation Age of Greenhouse Soils. Agronomy. 2020; 10(7):990. https://0-doi-org.brum.beds.ac.uk/10.3390/agronomy10070990
Chicago/Turabian StyleTsai, Chen-Chi, and Yu-Fang Chang. 2020. "Effects of Rice Husk Biochar on Carbon Release and Nutrient Availability in Three Cultivation Age of Greenhouse Soils" Agronomy 10, no. 7: 990. https://0-doi-org.brum.beds.ac.uk/10.3390/agronomy10070990
Note that from the first issue of 2016, this journal uses article numbers instead of page numbers. See further details here.