Article

Rice Yield Gaps in Smallholder Systems of the Kilombero Floodplain in Tanzania

by
Julius Kwesiga
1,*,
Kristina Grotelüschen
1,
Kalimuthu Senthilkumar
2,
Daniel Neuhoff
1,
Thomas F. Döring
1 and
Mathias Becker
1
1
Institute of Crop Science and Resource Conservation (INRES), University of Bonn, 53115 Bonn, Germany
2
Africa Rice Center (AfricaRice), P.O. Box 1690, Antananarivo 101, Madagascar
*
Author to whom correspondence should be addressed.
Submission received: 30 June 2020 / Revised: 30 July 2020 / Accepted: 31 July 2020 / Published: 5 August 2020
(This article belongs to the Special Issue Organic vs. Conventional Cropping Systems)

Abstract

:
To meet the growing rice demand in Africa, gaps between actual and attainable yields have to be reduced. In Tanzania, this particularly concerns smallholder rain-fed production systems in the floodplains. After quantifying the existing yield gaps, key contributing factors need to be analyzed to improve site-specific management. Field experiments were conducted for three years and in three pedo-hydrological environments (fringe, middle, and center positions) of the Kilombero floodplain to evaluate: (1) The grain yield under farmers’ management (actual yield), (2) yield with the best-recommended management (attainable yield), and (3) the non-limited yield simulated by the APSIM model (potential yield). In the field, we additionally assessed incremental effects of (1) field bunding and soil levelling, (2 and 3) additionally applying of 60 kg N ha−1, as urea or as farmyard manure (FYM), and (4 and 5) incorporating in-situ-grown leguminous green manures. Attainable yields were determined with mineral N application at 120 kg ha−1, additional PK fertilizer and supplemental irrigation. On average across years and positions, the potential, the attainable, and farmers’ actual yields were 11.5, 8.5, and 2.8 t ha−1 indicating a high total yield gap. About 16–38%, 11–20%, and 28–42% of this gap could be attributed to non-controllable yield-reducing (i.e., pest and diseases), yield-limiting (i.e., water and nutrient deficiencies), and yield-defining factors (i.e., poor soil and crop management), respectively. Results indicate a closure of the exploitable yield gap (differences between attainable and farmers’ actual yields) by up to 6.5 t ha−1 (nearly 60% of the potential yield). This exploitable yield gap was larger in 2016 than in 2017. Also, the gap was larger in the water-limited fringe and middle than in the frequently submerged center positions. Simple field bunds combined with land levelling could close 15–35% of the exploitable yield gap, depending on field positions and year. FYM or green manures were less effective than mineral N; however, in 2017 and in the wetter middle and center positions, they reduced the yield gap by >50%. We conclude that yield gaps in rainfed rice in Kilombero floodplain are large, but that a site- and system-specific adaptation of crop management can close much of the exploitable yield gap and increase grain yields by 0.7–4.8 t ha−1. Similar benefits may be obtained in other hydrologically variable floodplain environments of the region and beyond.

1. Introduction

In many countries of sub-Saharan Africa, rice increasingly replaces traditional staple food crops such as maize and cassava in both daily diets and in dominant agro-production systems. However, with about 2 t ha−1, grain yields of rain-fed lowland rice in Africa are far below the global average of 3.1 t ha−1 [1]. Rice supply gaps in most countries are caused by low yields in combination with high demographic growth and are, in many instances, further exacerbated by land scarcity [2]. Meeting the growing future rice demand will require either an expansion of the rice-growing area [3] or a substantial increase in rice yields from current farmland, without compromising the environment [4]. It has been suggested that yield gains can easily be achieved by applying existing knowledge and adopting available technologies for narrowing the existing large gaps between potential and farmers’ actual yields [5]. The extent of the yield gaps and the effectiveness of technology options to close them largely differ by crop species, production environments and farmers’ ability to adopt technologies [6]. Such yield gap analyses have been widely applied and are postulated to be useful tools for food security assessment [7], for priority-setting in research and development [8], for policy framing both at local and at regional scales [9] and to evaluate the impacts of climate change [10,11].
The term “yield gap” was first used in the 1970s by Herdt and Wickham [12], defining it as the difference between the maximum experimental station and the national on-farm average yields. Later, this definition was refined and expanded as yield gaps being the difference between biological potential or the water-limited potential and the actual yield in farmers’ field [6]. Further, differentiation included the definition yield-defining, yield-limiting, and yield-reducing factors, which allowed better explanation of yield levels and differences [13]. Since the 1990s, the genotype-specific “biological potential” of rice has been assessed initially under no-resource-limited conditions by the crop growth model ORYZA1 [14]. Later, water-limited potentials were simulated by ORYZA-W [15] and N-limited yields by ORYZA-N [16]. ORYZA2000 rice model integrates previous ORYZA models [17]. The physiological part of ORYZA2000 was incorporated into the APSIM model for failure to simulate long-term flooded conditions [18]. Further improvements and limitations of rice model have been discussed in [19] for APSIM but also in [20] for ORYZA (v3). In 2019, a global sensitive analysis of the “Rice” module in APSIM (APSIM-Oryza) provided more comprehensive insights into the model and its parameters compared to existing studies [21].
Yield gap analyses were previously, also suggested to include social and economic factors (beyond ecological and management factors) [22]. The resulting analyses are diverse and cross-comparisons are reportedly difficult because of lack consistency between various studies. Therefore, the general usefulness of yield gap analyses in the context of development-oriented agronomy still remains to be questioned [22]. It is thus not surprising that the links between identified yield gaps and proposed technical solutions are still weak and non-specific [23]. However, within a specific and well-defined or homogenous environmental setting, yield gap analyses are capable of successfully shaping priority setting and assisting in technology targeting and influence policy formulations [24,25].
In this study, the difference between simulated potential and farmers’ actual yields has been termed the “total yield gap”. It comprises yield-defining factors which are non-controllable or difficult to control, such as some pests, diseases, topography effects, crop submergence, or storm damage. The difference between the simulated potential and the yield attained under optimal conditions is termed “yield gap 1”. The total yield gap further comprises the yield-limiting factors, which are mainly related to water shortages or nutrient deficiencies. These factors are manageable with supplemental irrigation and fertilizer applications and determine the “yield gap 2”. Finally, there are yield-reducing factors that contribute to the total yield gap and these comprise several land and crop management practices that are often associated with poor management, such as the lack of land levelling or field bunding and the timely control of weeds or application of fertilizers and are termed “yield gap 3” [26]. The combined effects of yield-defining, limiting and reducing factors determine the extent of the total yield gap.
For closing the yield gap, there is a need to quantitatively and site-specifically understand the key contributing factors, to analyses the yield effectiveness of available technology options, and to target interventions which are likely to have the strongest impact. Thus, the yield gap is decomposed into yield-effective contributing factors and their extent and usefulness in closing existing gaps. This approach has been successfully applied to quantify the role of weed management in upland rice systems [27], the effects of weed and fertilizer N management in irrigated rice systems [28], and for the role of land management and genotype on rainfed rice yield in hydrologically variable valley bottoms [29]. The approach is now widely used to identify suitable agronomic land and crop management practices and for formulating management recommendations [14]. In rainfed rice production systems with varying soil properties and hydrology, there is a need for site specific management options for smallholder farmers to benefit such practices [30].
In the present research, we used the decomposed yield gap analysis to assess the productivity of rainfed lowland rice in the Kilombero floodplain of Tanzania. With some 800,000 hectares, the floodplain is the largest rice-growing area of the country and is expected to contribute to national and regional self-sufficiency by 2030 [31,32]. Rice is mainly produced in smallholder systems that rely on traditional practices and low use of external inputs, resulting in low yields. Due to resource limitations, preferences for local genotypes, and poor access to modern technology, smallholder farmers are unable to benefit from recent innovations [33]. However, substantial yield increases of about 3 t ha−1 are reportedly possible when applying recommended crop, soil, and weed management practices [34], or by applying good agricultural practices in combination with improved genotypes [35]. However, the benefits of such technologies are highly variable between years and production sites. The yield gap analysis for Kilombero floodplain must thus comprise an analysis over several years. It must further cover the diversity of the main biophysical land units prevailing in the floodplain considering those technology options that are available for the smallholders in the area.
We hypothesized that applying this approach to Kilombero floodplain can site-specifically differentiate the benefits of specific agronomic interventions, and thus assist in formulating management recommendations for closing the existing large yield gap in this region. The main objectives of this research were; (1) to quantify actual and potential rice yields and their variability in space and time; and (2) to identify the causes of yield gaps by applying available land and fertilizer management options at different hydrological positions.

2. Materials and Methods

2.1. Experiments

Field trials on private farms were conducted from 2015 to 2017 in the Kilombero floodplain, Ifakara, Tanzania. Fields were located at the fringe, middle and center positions, representing the typical hydrological production situations in rain-fed floodplain environments. The positions were selected based on inundation depth and flooding duration, plus their distance relative to the river (center) and the adjacent mountain ranges (fringe). The fringe position was located closest to the Udzungwa Mountains and furthest from Kilombero River. The fringe position has only short periods with ponded water during the main rainy season but has a relatively shallow groundwater due to subsurface interflow from the mountain slopes [36]. The center position experiences extended periods of soil submergence by the overflowing Kilombero River, and soils tend to maintain high residual moisture contents after flood recession [37]. The middle position represents an intermediate situation with water contributions from both subsurface flow and river spill-over.
Daily solar radiation, maximum and minimum temperature, rainfall, relative humidity, and wind speed were obtained from an automated climate station at the Ifakara Health Institute, located 5 km away from the study areas. The experimental location has a sub-humid tropical climate with average annual temperatures between 22 and 23 °C with maximum and minimum peaks in December and July, respectively. The area receives binomial rainfall with about 90% of the annual rainfall between December and April. During the experimental period, the area received 846 mm, 787 mm, and 1252 mm of rainfall in 2015, 2016, and 2017, respectively. The mean maximum and maximum solar radiation varied from 16–25 MJ m−2 year−1 day−1. Soil attributes differed between positions with increasing clay content of 14.0% at the center to 36% in the fringe position. The reverse was true for the sand content increasing from 12% to 27% in the fringe and center positions respectively. The N content is generally low irrespective of the position of the floodplain with 1.0, 0.9, and 1.7 mg kg−1 in the fringe, middle, and center positions, respectively. Soil samples were taken from a depth of 20 cm before the first crop establishment to be analyzed for major physio-chemical attributes. Further details are provided in Kwesiga et al. [33].

2.2. Treatments and Management

In each position, on-farm experiments were conducted with experimental plots of 30 m2 (6 × 5 m), for each treatment. The experimental treatments were laid out in a randomized complete block design (RCBD) replicated four times. The treatments included: Farmers’ practice, bunding and levelling, recommended practice, organic N (farmyard manure), pre-rice green manure, post rice green manure and best practice. All land and crop management was done by the researcher, following a standardized experimental protocol, including the following treatments:
(1) Farmers’ practice: treatment plots were neither bunded nor levelled. No mineral or organic fertilizers other than the returned rice straw were applied, and plots received one-time hand weeding at 30 days after transplanting. Grain yields in this treatment are referred to as farmers’ actual yield.
(2) Bunding and levelling: In contrast to farmers’ practice, individual field plots were surrounded by 40 cm high and 20 cm wide bunds and the soil within the plot was manually levelled during puddling. No fertilizers but one additional weeding at 50 days after transplanting were applied. Yield gains obtained in this treatment were assigned to the effects of improved land management.
(3/4) Fertilizer N: In these treatments, plots were bunded and levelled and received the recommended rate of 60 kg N ha−1 either in the form of split-applied urea, with half applied basally and half at panicle initiation stage (treatment 3), or by one single basal application of fresh farmyard manure adjusted to an N rate of 60 kg ha−1 (treatment 4). Depending on the N content, farmyard manure application rates varied between 5.0 and 6.7 kg ha−1.
(5/6) Two available green manure options including the in-situ growth of either lablab (Lablab purpureus) during the six-week period between the onset of the rain and the transplanting of rice (pre-rice green manure) (treatment 5) or of Stylosanthes guianensis established on residual soil moisture after rice harvest and occupying the plot for about six months until manual incorporation into the soil and the transplanting of rice (post-rice green manure) (treatment 6). The treatments 2–6 represent locally-available and/or recommended practices and are components of the “achievable yield”.
(7) Best practice: The bunded and levelled regularly weeded plots received 120 kg urea-N ha−1 (split application), a basal application of 60 kg P (Single Super Phosphate) ha−1 and 60 kg K (KCl) ha−1 and supplementary irrigation as required to maintain constant water saturation. The management options are non-limiting under on-farm researcher managed conditions. Such practices are usually either not accessible or not affordable for smallholder farmers. This treatment represents the “attainable yield”.
All plots were homogenously transplanted at a 20 × 20 cm spacing with 28 day-old seedlings of the high-yielding genotype SARO5 (TXD 306) that is promoted by the Tanzania Agricultural Research Institute (TARI). Rice grain yield was determined from 6 m2 area at the center of each plot, air dried, weighed, measured with a digital grain moisture meter (Satake Moistex SS7) and adjusted to 14% grain moisture content [33,38].

2.3. Yield Gap Concept and Data Analyses

The APSIM model combines biophysical and management modules within a central engine to simulate cropping systems. The “Rice” module in APSIM (APSIM-Oryza) simulates rice growth under potential production, water-limited and N-limited simulations [18]. Using 2015 experimental data, the model was supplied with local input parameters which were directly measured, i.e., soil chemical and physical characteristics plus water table dynamics, and recorded daily climate variables, i.e., solar radiation, maximum and minimum temperatures and rainfall. The parameters were used to parameterize soil water characteristics and soil organic matter decomposition rates. Variety-specific development parameters and partitioning coefficients for “SARO-5” were determined from observed key phenological stages and sequential biomass accumulation and partitioning data of treatment 7 while calibration performance was assessed against treatment 2 and 3 as well. The simulated outputs for rice phenology, biomass accumulation and partitioning, and grain yield were compared with observed values. The calibrated model was tested against data from 2016 and 2017 for model validation. The validated model was hence used to simulate potential yields by providing daily ample water and nitrogen for un-limited crop growth. In this study, the model’s capacity to provide potential yields from the different hydrological positions was the main aspect for evaluation. The middle was used as a proxy for the center due to complete crop failure resulting from prolonged submergence in 2015. Detail on model calibration and validation is given in our paper in prep ([39]).
The actual farmers’ yield (YFac) was obtained from non-bunded and levelled and non-amended field plots (treatment 1), while the attainable yields (YAtt) were determined from the “best practice” (treatment 7).
The difference between the simulated potential yield (YPot) and farmers’ actual mean yield (YFac) represents the total yield gap (YGT). This gap comprises all yield-determining factors, including those that cannot be controlled by farmers. More appropriate for agronomic purposes is the difference between the yield that is attainable with best management practices (YAtt) and farmers’ actual mean yield (YFac) indicating the exploitable yield gap (YGE). For assessing the determinants of the exploitable yield gap the effects of sequentially super-imposed treatments of land management (bunding and levelling), of recommended fertilizer N, and of a combination of high NPK and supplemental irrigation were calculated based on data of treatments two to seven. The general conceptual framework and the different incremental levels of yield-limiting and yield-reducing factors in the yield gap analysis are illustrated in Figure 1. The modes of calculation are as follows:
Total gap:YGT = YPot−YFac(yield-defining, limiting, and reducing factors);
Yield gap 1:YG1 = YPot−YAtt(yield-defining; non-controllable factors);
Yield gap 2:YG2 = YAtt−YAch(only the yield-limiting factors);
Yield gap 3:YG3 = YAch−YFac(only yield-reducing factors);
Exploitable gap:YGE = YAtt−YFac(yield-limiting and reducing factors);
whereby YPot is the simulated potential, YAtt is the attainable, YAch the achievable, and YFac farmers actual rice grain yield.
We considered a new indicator focusing on the percentage share of individual sequentially applied management practices on the exploitable yield gap. This share was calculated as the ratio between the absolute increase of yield (Yai) above the farmers’ practice and the exploitable yield gap (YGE), expressed as a percentage (Equation (1)). This indicator helps to quantify the relative importance of the specific measures for closing the exploitable yield gap.
%Y share = Yai/YGE * 100
Descriptive statistics, including arithmetic means, standard errors of the mean, variances, and the percentage share on the exploitable yield gap, were calculated for the main effects of management practices (1) across years and (2) across hydrological positions. A linear mixed model fit by Restricted Maximum Likelihood (ReML), and Satterthwaite’s method was used for the t-tests using R software version 3.5.0.

3. Results

The farmers’ actual and simulated potential yields, the yield attainable and those obtained by applying individual management practices, and the relative share of management interventions in closing the exploitable yield gap are presented for the different hydrological positions in Figure 2 and for the different study years in Figure 3.

3.1. Total and Exploitable Yield Gaps

Rice grain yields from farmers’ practice (actual yields) (YFac) varied between 1.2 to 4.9 t ha‒1, depending on the year and the hydrological position. The yield variability within hydrological positions increased from the fringe with 3.3 ± 0.8 t ha−1 to the center position with 2.6 ± 1.3 t ha−1 (Figure 2). While yields tended to be higher in 2017 than in 2016, such differences were not significant (Figure 3). The average potential grain yields (YPot) were relatively stable, ranging from a low of 10.4 t ha−1 in 2016 in the middle position to 12.3 t ha−1 in 2017 in the middle and fringe position. The resulting total yield gap (YGT) (YPot−YFac) was accordingly very large, ranging between years from 8.2 t ha−1 in 2015 to 9.5 t ha−1 in 2017 and between positions from 8.3 t ha−1 in the fringe to 9.0 t ha−1 in the middle (Table 1). These gaps represent 72 to 77% of the potential yield. However, they contain yield-defining factors that cannot be controlled by management interventions. More realistic for assessing management interventions to effectively close the gap is thus the exploitable yield gap, which represents the difference between attainable and farmers’ actual yields. The attainable rice yields, resulting from best management practices (YAtt), varied between 6.4 and 11.3 t ha−1, with the highest attainable mean yield of 9.8 t ha−1 in the fringe, and the lowest with 7.1 t ha−1 in the center position. Between years, the attainable yields varied relatively little with a maximal difference between 2015 (highest YAtt) and 2016 (lowest YAtt) of only 0.7 t ha−1. Accordingly, the mean exploitable yield gap (YGE) (YAtt−YFac) was 5.7 t ha−1 (3.1 t ha−1 less than YGT) across hydrological positions and years. The largest mean YGE was observed in the fringe (6.5 t ha−1), and the lowest was observed in the center (4.4 t ha−1). The YGE varied little between years, with a maximum of 5.9 t ha−1 in 2017 and a minimum of 5.5 t ha−1 in 2016. Thus, the exploitable yield gap amounted only 39 to 56% of the potential yield across positions (Table 1).

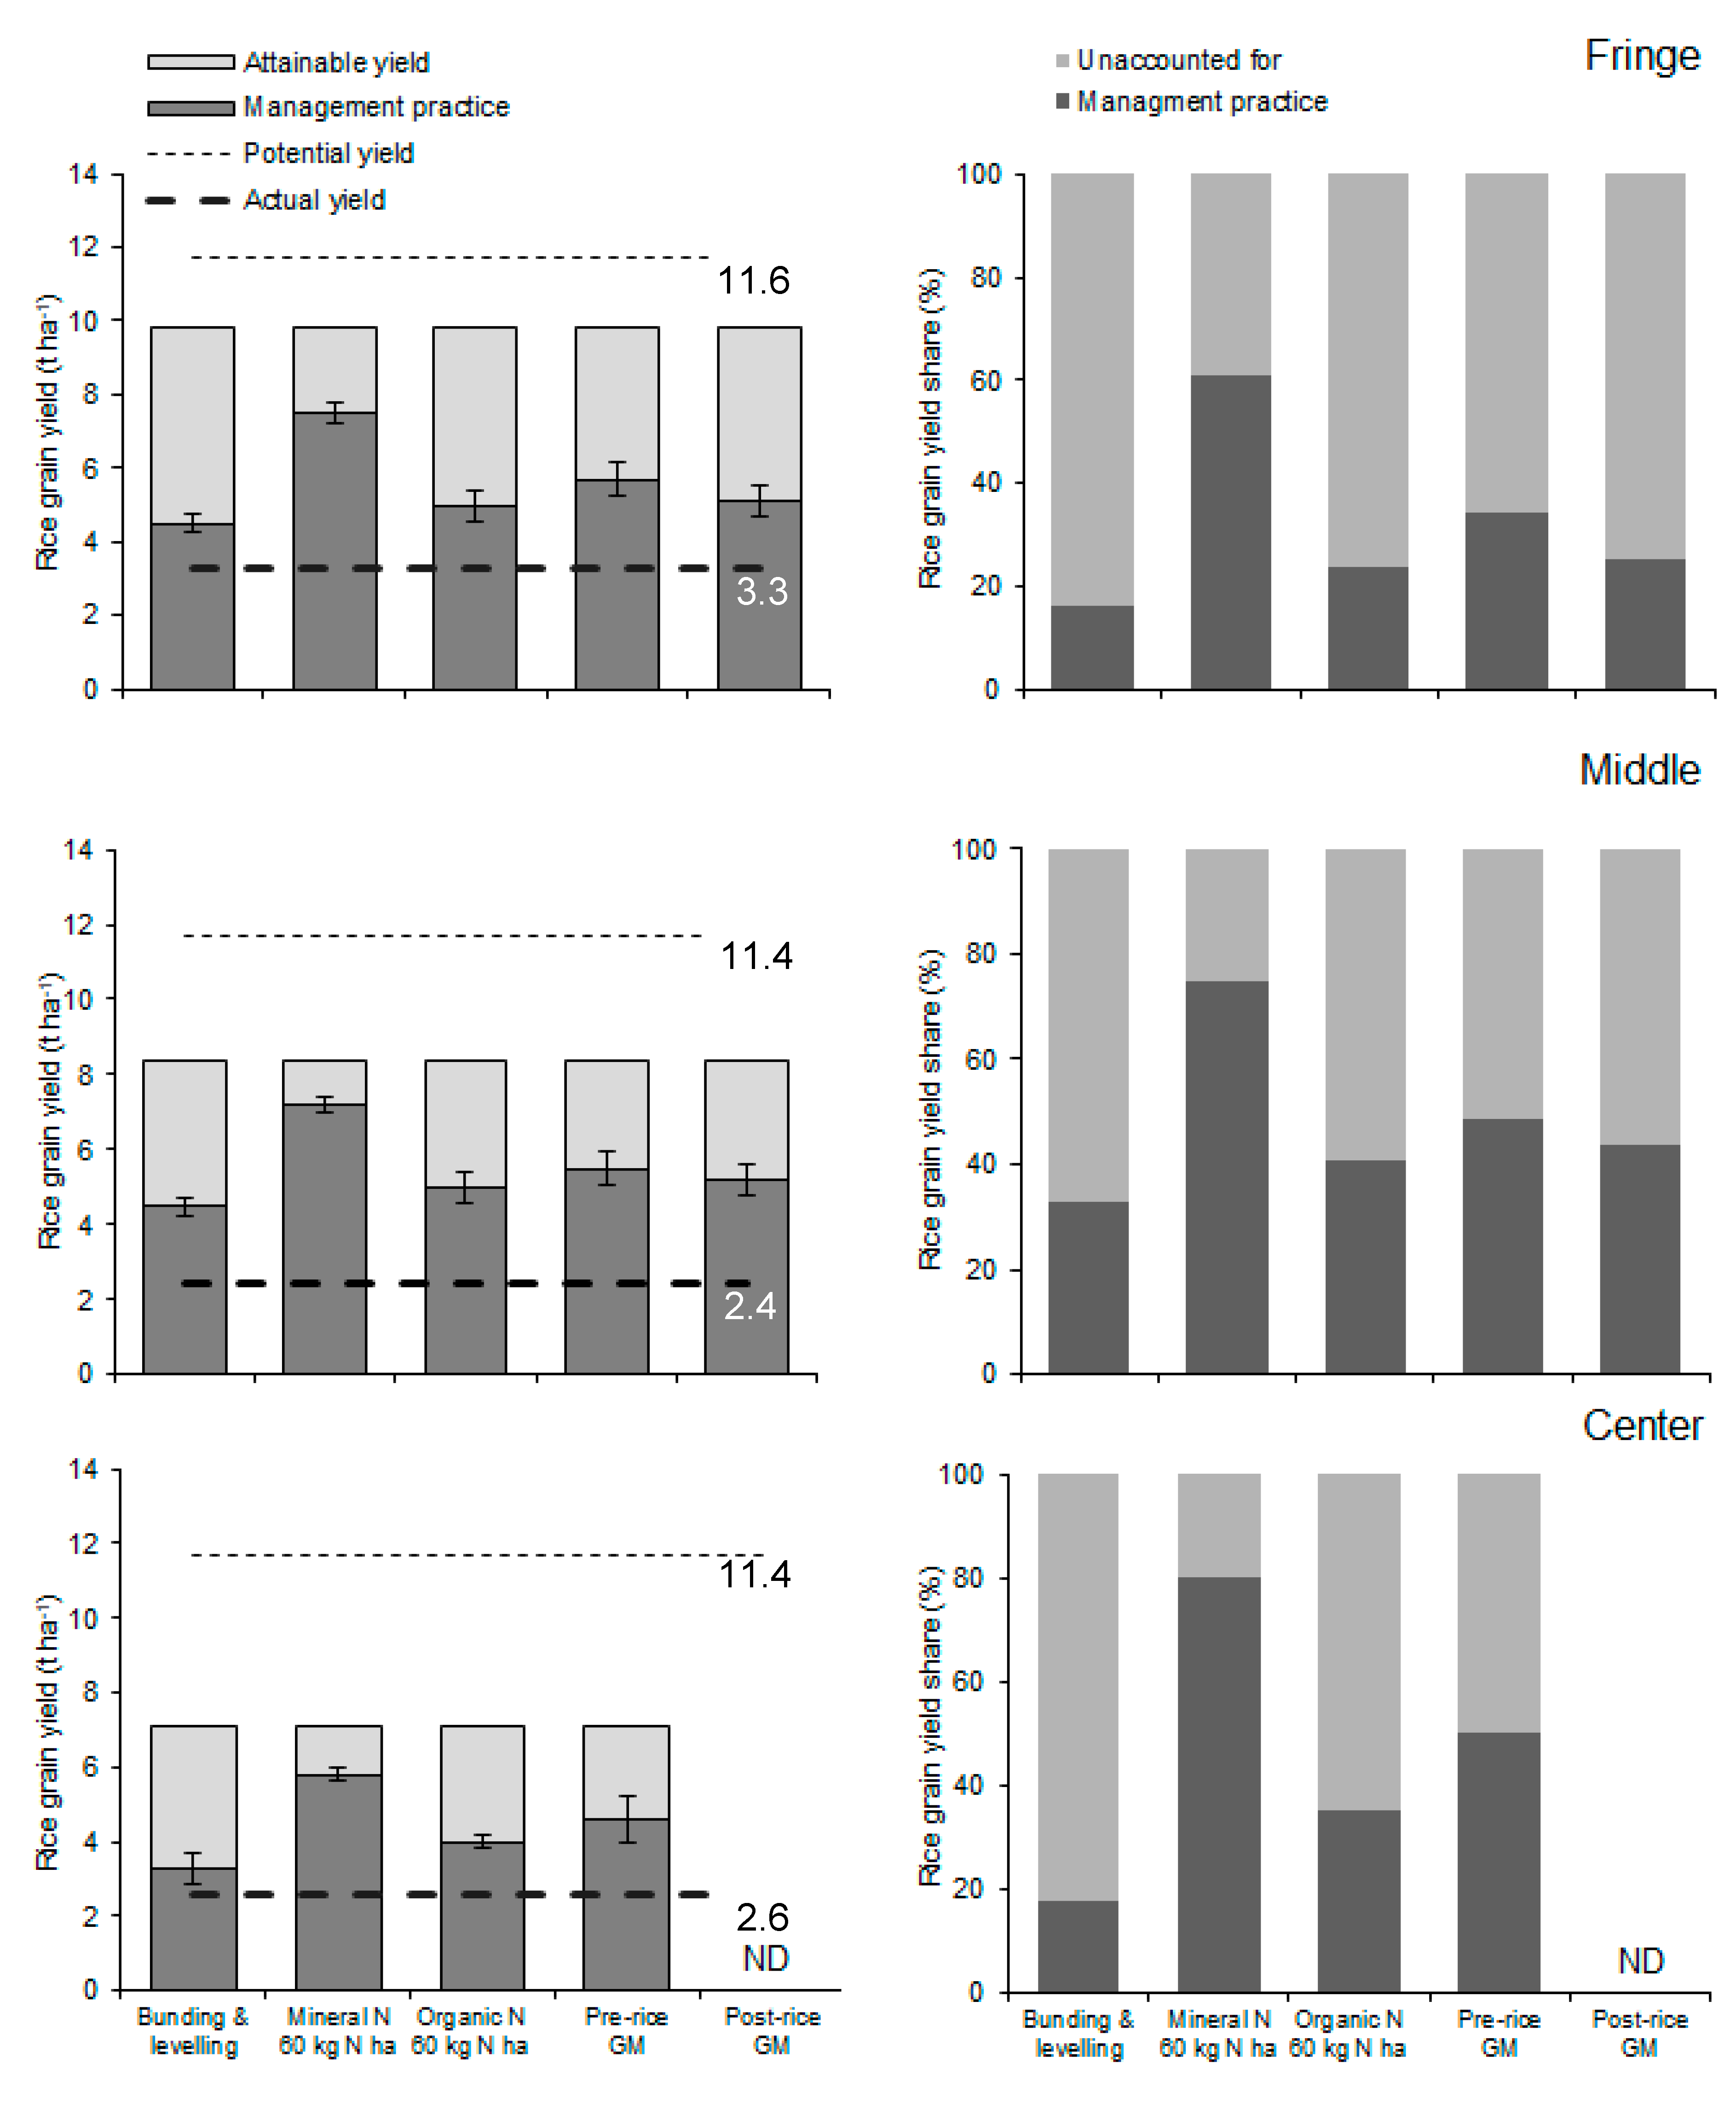
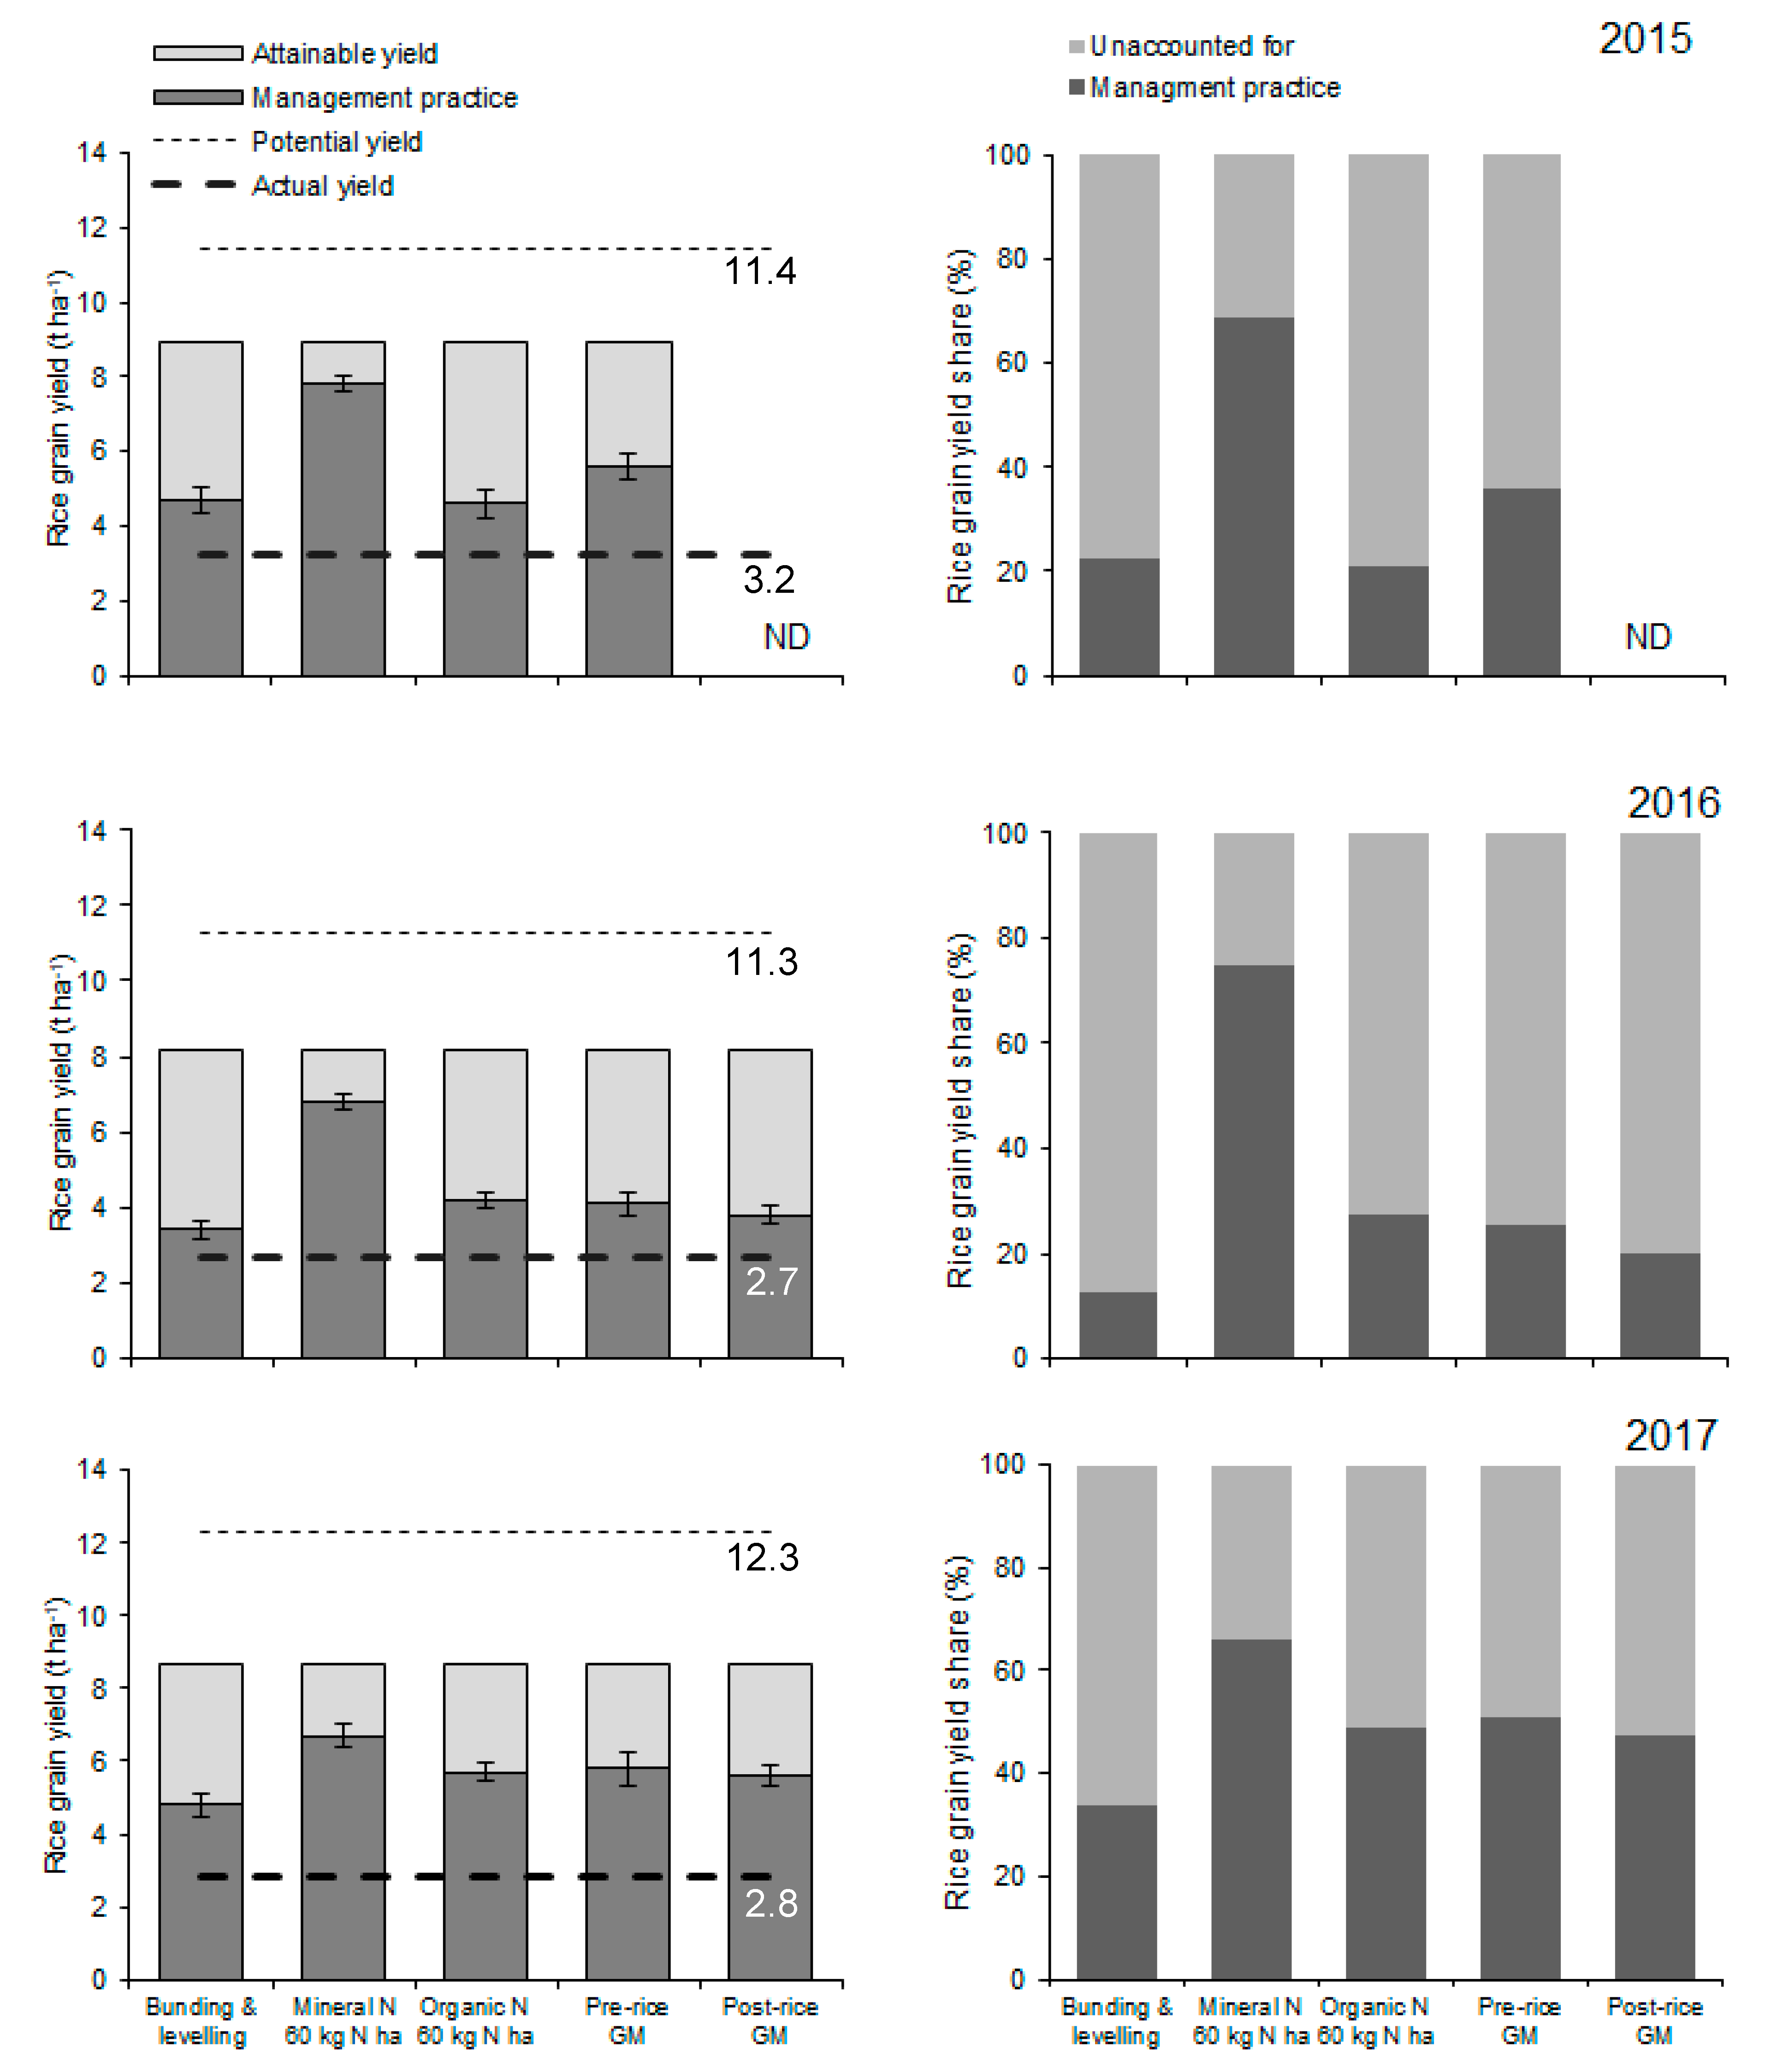
3.2. Disentangling the Total Yield Gap

Non-controllable factors accounted for 1.8–4.3 t ha−1 of grain yield and hence between 16% and 38% of the total yield gap cannot be closed by improved management (yield gap 1). This non-accountable yield gap was largest in the center position of the floodplain. Yield-limiting factors or application of cropping practices that are not at the reach of common smallholders define yield gap 2. This YG2 was relatively small. While it varied little between years (1.2–2.3 t ha−1), it was much larger in the drought-prone fringe. Here, it accounted for 20% of the yield gap compared to only 11% in the middle and center each. Finally, yield gains that can realistically be achieved by applying available technology options were in the range of 3.2 to 4.8 t ha−1, closing 28–42% of the yield gap and contributing to the largest share of the yield gap overall (Table 1).

3.3. Disentangling the Exploitable Yield Gap

Simple land management was associated with mean rice yields ranging from 3.3 t ha−1 to 4.5 t ha−1 across hydrological positions. This corresponds to yield increases over farmers’ management by 0.7 t ha−1 in the submergence-prone center position and reaching 2.1 t ha−1 in the middle position. The effect was much higher in 2017 compare to 2016 and 2015. Thus, recommended land management closed >30% of the yield gap in 2017 and in the middle position and <20% in 2016 and the center and fringe positions (Figure 2 and Figure 3).
Combining improved land management with the application of the locally-recommended rate of 60 kg urea-N ha−1 produced rice grain yields of 5.8–7.8 t ha−1, corresponding to yield increases above farmers’ management by 3.2 to 4.8 t ha−1. This implies that, depending on the year, mineral N could close 66–75% of the exploitable yield gap. This yield gap closing effect was less in the drought-prone fringe (61%) than in the wetter middle (75) and center positions (80%). Beneficial effects of comparable amounts of organic N (farmyard manure) were much lower, irrespective of the hydrological position. However, the share in closing the yield gap increased over time from 21% in 2015, over 27% in 2016 to 49% in 2017.
In the absence of mineral N or farmyard manure, farmers rely on biological nitrogen fixation by different green manure legumes. Depending on farmers’ preference or on available soil moisture for crop establishment, farmers may opt for short-duration legumes during the pre-rice cropping niche, or for forage legumes established on residual soil moisture during the post-rice niche. Both types of green manure were comparable but generally more yield-effective than applying farmyard manure. In the drought-prone fringe, they closed only 30%, in the wetter positions nearly 50% of the exploitable yield gap. Similar to the trend observed in farmyard manure, this effect increased over time with repeated application from initially >20% in 2016 to nearly 50% of the exploitable yield gap in 2017.

4. Discussion

This study set out with the aim of quantifying the actual and potential rice yields and their variability in space and time while identifying the causes of yield gaps by applying and modifying available management practices. The findings are valuable indicators for guiding research, extension, and policy formulations in hydrologically variable rain-fed floodplains. In the following paragraphs, we discuss the implications for disentangling the different gaps.

4.1. The Extent of Total and Exploitable Yield Gaps

From our study, actual rice grain yields from farmers’ practice were generally low, varying between 1.2 and 4.9 t ha−1, which is similar to findings by Senthilkumar et al. [35], who reported grain yields in Kilombero ranging from 0.7 to 4.3 t ha−1 in farmers’ fields. Yield potentials, on the other hand, were very high and can reach up to 12 t ha−1. The resulting total yield gap was equally very high and actually much higher than the total yield gaps reported from rice-growing areas of South East Asia [40] and West Africa [41]. However, in these areas, the actual yields in farmers’ fields were much higher than those observed in the present study. The amounts of mineral fertilizers used and the general knowledge level of farmers are much higher in those areas where rice is a traditional crop cultivated since centuries or even millennia [42,43] and where consequently, the exploitable yield gaps (differences between actual and attainable yields) were much lower (1.3–3.8 t ha−1) than in the Kilombero case (5.7 t ha−1). Finally, low and highly variable actual yields in farmers’ fields in Kilombero are related to fluctuating and unpredictable hydrological regimes, differing greatly between years and positions [36] making rice production highly risky.

4.2. Disentangling the Total Yield Gap

The yield gains obtained by applying improved or recommended management practices suggest large opportunities for further increases in rice yields beyond the current levels. Our data indicate a closure of the exploitable yield gap by up to 6.5 t ha−1 or by nearly 60% of the potential yield (Table 1). In the Kilombero case, non-controllable factors (YG1) were responsible for up to 38% of the total yield gap, which is a much larger share than that reported from yield gaps in the Philippines (<18%, [40]) or in West Africa (<20%, [44]). The extent of YG1 in the present study depended on positions and differed between years, and was mainly related to unfavorable hydrology, here mainly the duration of crop submergence [36]. Similarly, large unexplained shares in the total yield gap reported from Indonesia were associated to unfavorable hydrology [45], particularly to differences in groundwater depths between the top and the bottom positions of rice fields along a toposequence. Consequently, the depth and the duration of ponded water may explain the large observed YG1 which was largest in the submergence-prone center positions, particularly during the submergence-sensitive early reproductive growth stage of rice.
Yield gap 2 resulting from yield-limiting factors was relatively small (11–20% of the potential yield) in the middle and center positions, but much larger in the fringe position. This share of the total yield gap is related mainly to nutrient management and particularly the use efficiency of applied N. The extent of this share to the total yield gap in irrigated rice in the Philippines has been related to sub-optimal rates of macro-nutrient fertilizers [46]. Tsujimoto et al. [30] highlighted, that hydrology was a major factor influencing N use efficiency and affecting fertilizer application and yield. In the case of Kilombero this share in the yield gap is much larger, which may be linked to the low recommended N application rate of 60 kg urea-N ha−1 compared to the Philippines (120 kg N ha−1) or West Africa (100 kg N ha−1). Thus, both fertilizer application rates and the use efficiency of the applied N are likely to explain the extent and the variations in YG2 between different positions.
Yield gap 3 accounted to the largest share in the total yield gap with values ranging from 28% to 42%. This share of yield gap 3 is much larger than reported values from other yield gap analyses in Asia [40] and West Africa [47,48] or of those reported from irrigated systems [43] and it varies strongly between positions. This part of the yield gap is related to soil fertility attributes, to soil and land management and to varietal choice. Rice genotypes did not differ and can thus be discounted for in this study. The large yield gap could also be attributed to low (less than 22 kg ha−1) application rates or no N at all in farmers’ fields in Tanzania compared to 37–147 kg ha−1 in Mauritania, Burkina Faso, Mali or Senegal [30]. Hence, these large N-related gaps create an opportunity to increase rice yields in Tanzania more than in most areas in West Africa. On the other hand, soil attributes such as texture, soil organic matter, and total soil N differ between positions in the floodplain [33,49] and may thus explain part of the large YG3 and the observed differences between positions (Table 1), and reinforces the recommendation for site and system-specific soil management in alleviating soil constraints and increasing grain yields [50].

4.3. Disentangling the Exploitable Yield Gap

Land management was associated with yield gains between 0.7 and 2.0 t ha−1, representing about 16–33% of the exploitable yield gap depending on the hydrological position. Field bunding retained rainwater for extended periods of time, thus reducing water stress at least in the middle position. Enhanced soil water retention has been shown previously to increase rice yields in Tanzania [51] and in West Africa [52]. Also, field bunding reduced the weed biomass compared to open plots and increased the use efficiency of applied mineral N [29]. In the present study, the benefits of bunding were largest in the potentially drought-prone fringe and middle position of the floodplain. However, adoption of such simple but highly effective land management at farm-level is very low in Tanzania in general and in floodplain environments in particular [53], with missing awareness by farmers and labor shortages having been pinpointed as key reasons.
A combination of improved land management and the application of mineral N (60 kg ha‒1) increased rice grain yields substantially to 5.8 and 7.8 t ha−1, thus closing 61–80% of the exploitable yield gap. Despite N having been stressed as the most yield-limiting nutrient element, yield increases of 1–3 t ha−1 due to N application were much less in the rain-fed lowland systems of West Africa [54]. In that region the building of field bunds is common practice and applied fertilizer N is reportedly used much more efficiently [28]. In our study, the combination of field bunding and N application reduced the exploitable yield gap by up to 80%. A particularly higher percentage in the center position is however, linked to the relatively low attainable yield in this submergence-prone environment, and hence to a much lower yield gap compared to fringe and middle positions. However, up to date, smallholder farmers do rarely benefit from such dramatic effects of technology adoption, key reasons being the untimely availability and non-affordability of mineral N fertilizers in the Kilombero region [53]. Another disincentive for adopting the use of fertilizers is the high production risk or uncertainty in the outcome of such investments due to complete crop failure related to unreliable hydrology in floodplain environments [37].
On the other hand, organic N sources may reduce such risks and have been shown to increase yields and reduce the exploitable yield gap in upland systems of Northern Tanzania [55], in water-limited rain-fed lowland rice in South-East Asia [56], as well as in the Kilombero floodplain [38]. The benefits of these organic N sources were largest in the wetter middle and center positions of the floodplain. However, while reducing the variability and hence the risk for farmers, organic amendments have been shown in the present study to be less effective than mineral fertilizers. Green manure legumes closed only between 20 and 50% of the exploitable yield gap. In addition, both the ecological and the social niches for farmers adopting green manure technologies in sub-Sahara Africa are limited and widely constrain their adoption [57]. Conversely, Kwesiga et al. [34] this issue highlighted the suitability of both the pre- and the post-rice niches for growing leguminous green manures in Kilombero floodplain. Thus, short-duration pre-rice legumes can establish with the short rains in November–January in the floodplain fringes, while post-rice forage legumes can benefit from residual soil moisture after flood recession in the center position. The drought-tolerant post-rice forages could be grown under moisture regimes that are unfavorable for a cash crop. In the present study, the contribution of both legumes towards yield increase and gap closure was comparable irrespective of hydrological position. Thus, based on the year and the position of the rice field in the floodplain, and based on on-farm labor availability, smallholder farmers can decide to seed legumes either before rice establishment (pre-rice green manure) or after rice harvest (post-rice green manure) with comparable effects on yields and on closing the exploitable yield gap in the rainfed systems of Kilombero floodplain.

5. Conclusions

Our research has confirmed considerable exploitable yield gaps in the Kilombero flood plain. The rice production potential in the region is high since the gap between potential and attainable yields was low. Different hydrological positions strongly affect the attainable yields within a rainfed lowland system and require site-specific management. The tested management options closed between 25 and 80% of the exploitable yield gap. Other factors besides fertilizer N management may prevent farmers from closing the exploitable yield gap. Joint efforts of all stakeholders including research, policy and extension efforts are needed to guide smallholder rice farmers in implementing site-specific locally available management options towards increasing rice production in floodplains.

Author Contributions

Conceptualization, D.N., S.K., and M.B.; methodology, J.K., D.N., K.S., and M.B.; validation, D.N. and M.B.; formal analysis, J.K., M.B.; investigation, J.K., S.K. and D.N.; resources, S.K., D.N., and M.B.; data curation, J.K., K.G.; writing-original draft preparation, J.K.; writing—review and editing J.K., K.G., D.N., S.K., T.F.D., and M.B.; visualization, D.N., T.F.D., and M.B.; supervision, D.N., S.K., and M.B.; project administration, D.N. and M.B.; funding acquisition, M.B. All authors have read and agreed to the published version of the manuscript.

Funding

This research was funded by the German Federal Ministry for Education and Research (BMBF) grant number FKZ 031A250 A-H, with additional funding provided by the German Federal Ministry of Economic Cooperation and Development.

Acknowledgments

The authors are grateful to the field assistants John Massawe, Goodluck Munishi, Sandali Ali, Rashid Mutengela and others for field establishment and management.

Conflicts of Interest

The authors declare no conflict of interest.

References

  1. Tanaka, A.; Johnson, J.-M.; Senthilkumar, K.; Akakpo, C.; Segda, Z.; Yameogo, L.P.; Bassoro, I.; Lamare, D.M.; Allarangaye, M.D.; Gbakatchetche, H. On-farm rice yield and its association with biophysical factors in sub-Saharan Africa. Eur. J. Agron. 2017, 85, 1–11. [Google Scholar] [CrossRef]
  2. Scoones, I.; Smalley, R.; Hall, R.; Tsikata, D. Narratives of scarcity: Framing the global land rush. Geoforum 2019, 101, 231–241. [Google Scholar] [CrossRef]
  3. Tilman, D.; Balzer, C.; Hill, J.; Befort, B.L. Global food demand and the sustainable intensification of agriculture. Proc. Natl. Acad. Sci. USA 2011, 108, 20260–20264. [Google Scholar] [CrossRef] [Green Version]
  4. Zabel, F.; Delzeit, R.; Schneider, J.M.; Seppelt, R.; Mauser, W.; Václavík, T. Global impacts of future cropland expansion and intensification on agricultural markets and biodiversity. Nat. Commun. 2019, 10, 2844. [Google Scholar] [CrossRef] [PubMed] [Green Version]
  5. Neumann, K.; Verburg, P.H.; Stehfest, E.; Müller, C. The yield gap of global grain production: A spatial analysis. Agric. Syst. 2010, 103, 316–326. [Google Scholar] [CrossRef]
  6. Fischer, R.A. Definitions and determination of crop yield, yield gaps, and of rates of change. Field Crops Res. 2015, 182, 9–18. [Google Scholar] [CrossRef]
  7. van Ittersum, M.K.; Cassman, K.G. Yield gap analysis—Rationale, methods and applications—Introduction to the Special Issue. Field Crops Res. 2013, 143, 1–3. [Google Scholar] [CrossRef] [Green Version]
  8. van Oort, P.A.J.; Saito, K.; Dieng, I.; Grassini, P.; Cassman, K.G.; van Ittersum, M.K. Can yield gap analysis be used to inform R&D prioritisation? Glob. Food Sec. 2017, 12, 109–118. [Google Scholar] [CrossRef] [Green Version]
  9. Sumberg, J. Mind the (yield) gap(s). Food Sec. 2012, 4, 509–518. [Google Scholar] [CrossRef] [Green Version]
  10. van Oort, P.A.J.; Zwart, S.J. Impacts of climate change on rice production in Africa and causes of simulated yield changes. Glob. Chang. Biol. 2018, 24, 1029–1045. [Google Scholar] [CrossRef] [Green Version]
  11. Lobell, D.B.; Gourdji, S.M. The influence of climate change on global crop productivity. Plant Physiol. 2012, 160, 1686–1697. [Google Scholar] [CrossRef] [Green Version]
  12. Herdt, R.W.; Wickham, T.H. Exploring the gap between potential and actual rice yield in the Philippines. Food Res. Inst. Stud. 1975, 14, 163–181. [Google Scholar] [CrossRef]
  13. van Ittersum, M.K.; Rabbinge, R. Concepts in production ecology for analysis and quantification of agricultural input-output combinations. Field Crops Res. 1997, 52, 197–208. [Google Scholar] [CrossRef]
  14. Kropff, M.J.; van Laar, H.H.; Matthews, R.B. ORYZA 1: An Ecophysiological Model for Irrigated Rice Production; SARP Research Proceedings: Wageningen, The Netherlands, 1994; ISBN 9789073384231. [Google Scholar]
  15. Wopereis, M.C.S.; Bouman, B.A.M.; Tuong, T.P.; Berge, H.F.M.; Kropff, M.J. ORYZA-W. Rice Growth Model for Irrigated and Rainfed Environments; SARP Research Proceedings: Wageningen, The Netherlands, 1996; ISBN 9073384397. [Google Scholar]
  16. Drenth, H.; Berge, H.F.M., X; Riethoven, J.J.M. ORYZA Simulation Models for Potential and Nitrogen Limited Rice Production; SARP Research Proceedings: Wageningen, The Netherlands, 1994. [Google Scholar]
  17. Bouman, B.A.M. ORYZA2000. Modeling Lowland Rice; IRRI: Los Baños, Philippines, 2001; ISBN 9712201716. [Google Scholar]
  18. Gaydon, D.S.; Probert, M.E.; Buresh, R.J.; Meinke, H.; Suriadi, A.; Dobermann, A.; Bouman, B.; Timsina, J. Rice in cropping systems—Modelling transitions between flooded and non-flooded soil environments. Eur. J. Agron. 2012, 39, 9–24. [Google Scholar] [CrossRef]
  19. Gaydon, D.S.; Balwinder, S.; Wang, E.; Poulton, P.L.; Ahmad, B.; Ahmed, F.; Akhter, S.; Ali, I.; Amarasingha, R.; Chaki, A.K.; et al. Evaluation of the APSIM model in cropping systems of Asia. Field Crops Res. 2017, 204, 52–75. [Google Scholar] [CrossRef]
  20. Li, T.; Angeles, O.; Marcaida, M.; Manalo, E.; Manalili, M.P.; Radanielson, A.; Mohanty, S. From ORYZA2000 to ORYZA (v3): An improved simulation model for rice in drought and nitrogen-deficient environments. Agric. For. Meteorol. 2017, 237–238, 246–256. [Google Scholar] [CrossRef] [PubMed]
  21. Liu, J.; Liu, Z.; Zhu, A.-X.; Shen, F.; Lei, Q.; Duan, Z. Global sensitivity analysis of the APSIM-Oryza rice growth model under different environmental conditions. Sci. Total Environ. 2019, 651, 953–968. [Google Scholar] [CrossRef] [Green Version]
  22. Beza, E.; SILVA, J.V.; Kooistra, L.; Reidsma, P. Review of yield gap explaining factors and opportunities for alternative data collection approaches. Eur. J. Agron. 2017, 82, 206–222. [Google Scholar] [CrossRef]
  23. Lobell, D.B. The use of satellite data for crop yield gap analysis. Field Crops Res. 2013, 143, 56–64. [Google Scholar] [CrossRef] [Green Version]
  24. Muller, A.; Schader, C.; El-Hage Scialabba, N.; Brüggemann, J.; Isensee, A.; Erb, K.-H.; Smith, P.; Klocke, P.; Leiber, F.; Stolze, M.; et al. Strategies for feeding the world more sustainably with organic agriculture. Nat. Commun. 2017, 8, 1290. [Google Scholar] [CrossRef] [Green Version]
  25. Stuart, A.M.; Pame, A.R.P.; SILVA, J.V.; Dikitanan, R.C.; Rutsaert, P.; Malabayabas, A.J.B.; Lampayan, R.M.; Radanielson, A.M.; Singleton, G.R. Yield gaps in rice-based farming systems: Insights from local studies and prospects for future analysis. Field Crops Res. 2016, 194, 43–56. [Google Scholar] [CrossRef] [Green Version]
  26. Tittonell, P.; Giller, K.E. When yield gaps are poverty traps: The paradigm of ecological intensification in African smallholder agriculture. Field Crops Res. 2013, 143, 76–90. [Google Scholar] [CrossRef] [Green Version]
  27. Becker, M.; Johnson, D.E. Rice yield and productivity gaps in irrigated systems of the forest zone of Côte d’Ivoire. Field Crops Res. 1999, 60, 201–208. [Google Scholar] [CrossRef]
  28. Becker, M.; Johnson, D.E. Improved water control and crop management effects on lowland riceproductivity in West Africa. Nutr. Cycl. Agroecosys. 2001, 59, 119–127. [Google Scholar] [CrossRef]
  29. Touré, A.; Becker, M.; Johnson, D.E.; Koné, B.; Kossou, D.K.; Kiepe, P. Response of lowland rice to agronomic management under different hydrological regimes in an inland valley of Ivory Coast. Field Crops Res. 2009, 114, 304–310. [Google Scholar] [CrossRef]
  30. Tsujimoto, Y.; Rakotoson, T.; Tanaka, A.; Saito, K. Challenges and opportunities for improving N use efficiency for rice production in sub-Saharan Africa. Plant. Prod. Sci. 2019, 22, 413–427. [Google Scholar] [CrossRef] [Green Version]
  31. Mombo, F.; Speelman, S.; van Huylenbroeck, G.; Hella, J.; Pantaleo, M. Ratification of the Ramsar convention and sustainable wetlands management: Situation analysis of the Kilombero Valley wetlands in Tanzania. J. Agric. Ext. Rural Dev. 2011, 3, 153–164. [Google Scholar]
  32. Buseth, J.T. The green economy in Tanzania: From global discourses to institutionalization. Geoforum 2017, 86, 42–52. [Google Scholar] [CrossRef]
  33. Kwesiga, J.; Grotelüschen, K.; Neuhoff, D.; Senthilkumar, K.; Döring, T.F.; Becker, M. Site and management effects on grain yield and yield variability of rainfed lowland rice in the Kilombero Floodplain of Tanzania. Agronomy 2019, 9, 632. [Google Scholar] [CrossRef] [Green Version]
  34. Senthilkumar, K.; Rodenburg, J.; Dieng, I.; Vandamme, E.; Sillo, F.S.; Johnson, J.M.; Rajaona, A.; Ramarolahy, J.A.; Gasore, R.; Abera, B.B.; et al. Quantifying rice yield gaps and their causes in Eastern and Southern Africa. J. Agron. Crop. Sci. 2020, 206, 478–490. [Google Scholar] [CrossRef]
  35. Senthilkumar, K.; Tesha, B.J.; Mghase, J.; Rodenburg, J. Increasing paddy yields and improving farm management: Results from participatory experiments with good agricultural practices (GAP) in Tanzania. Paddy Water Environ. 2018, 16, 749–766. [Google Scholar] [CrossRef] [Green Version]
  36. Gabiri, G.; Burghof, S.; Diekkrüger, B.; Leemhuis, C.; Steinbach, S.; Näschen, K. Modeling spatial soil water dynamics in a tropical Floodplain, East Africa. Water 2018, 10, 191. [Google Scholar] [CrossRef] [Green Version]
  37. Näschen, K.; Diekkrüger, B.; Leemhuis, C.; Steinbach, S.; Seregina, L.S.; Thonfeld, F.; van der Linden, R. Hydrological modeling in data-scarce catchments: The Kilombero floodplain in Tanzania. Water 2018, 10, 599. [Google Scholar] [CrossRef] [Green Version]
  38. Kwesiga, J.; Neuhoff, D.; Senthilkumar, K.; Döring, T.F.; Becker, M. Effect of organic amendments on the productivity of rainfed lowland rice in the Kilombero floodplain of Tanzania. Agronomy 2020, in press. [Google Scholar]
  39. Grotelüschen, K.; Gaydon, D.S.; Langensiepen, M.; Senthilkumar, K.; Kwesiga, J.; Ziegler, S.; Whitbread, A.M.; Becker, M. Crop management differentially affects rice along hydrological gradients in contrasting East African wetlands. Field Crops Res. 2020. in preparation. [Google Scholar]
  40. Laborte, A.G.; de Bie, K.C.; Smaling, E.M.; Moya, P.F.; Boling, A.A.; Van Ittersum, M.K. Rice yields and yield gaps in Southeast Asia: Past trends and future outlook. Eur. J. Agron. 2012, 36, 9–20. [Google Scholar] [CrossRef]
  41. Saito, K.; Dieng, I.; Toure, A.A.; Somado, E.A.; Wopereis, M.C.S. Rice yield growth analysis for 24 African countries over 1960–2012. Glob. Food Sec. 2015, 5, 62–69. [Google Scholar] [CrossRef]
  42. Boling, A.A.; Tuong, T.P.; Suganda, H.; Konboon, Y.; Harnpichitvitaya, D.; Bouman, B.A.M.; Franco, D.T. The effect of toposequence position on soil properties, hydrology, and yield of rainfed lowland rice in Southeast Asia. Field Crops Res. 2008, 106, 22–33. [Google Scholar] [CrossRef]
  43. Saito, K.; Vandamme, E.; Johnson, J.-M.; Tanaka, A.; Senthilkumar, K.; Dieng, I.; Akakpo, C.; Gbaguidi, F.; Segda, Z.; Bassoro, I.; et al. Yield-limiting macronutrients for rice in sub-Saharan Africa. Geoderma 2019, 338, 546–554. [Google Scholar] [CrossRef]
  44. Saito, K.; Nelson, A.; Zwart, S.J.; Niang, A.; Sow, A.; Yoshida, H.; Wopereis, M.C.S. Towards a better understanding of biophysical determinants of yield gaps and the potential for expansion of the rice area in Africa. In Realizing Africa’s Rice Promise; Wopereis, M.C.S., Johnson, D.E., Ahmadi, N., Tollens, E., Jalloh, A., Eds.; CABI: Wallingford, UK, 2013; pp. 188–203. ISBN 9781845938123. [Google Scholar]
  45. Boling, A.A.; Tuong, T.P.; van Keulen, H.; Bouman, B.A.M.; Suganda, H.; Spiertz, J.H.J. Yield gap of rainfed rice in farmers’ fields in Central Java, Indonesia. Agric. Syst. 2010, 103, 307–315. [Google Scholar] [CrossRef]
  46. Silva, J.V.; Reidsma, P.; Laborte, A.G.; Van Ittersum, M.K. Explaining rice yields and yield gaps in Central Luzon, Philippines: An application of stochastic frontier analysis and crop modelling. Eur. J. Agron. 2017, 82, 223–241. [Google Scholar] [CrossRef]
  47. Niang, A.; Becker, M.; Ewert, F.; Tanaka, A.; Dieng, I.; Saito, K. Yield variation of rainfed rice as affected by field water availability and N fertilizer use in central Benin. Nutr. Cycl. Agroecosys. 2018, 110, 293–305. [Google Scholar] [CrossRef]
  48. Becker, M.; Wopereis, M.C.S.; Johnson, D.E. The role of N nutrition on lowland rice yields along an agroecological gradient in West Africa. Plant Nutr. 2001, 92, 970–971. [Google Scholar] [CrossRef]
  49. Daniel, S.; Gabiri, G.; Kirimi, F.; Glasner, B.; Näschen, K.; Leemhuis, C.; Steinbach, S.; Mtei, K. Spatial distribution of soil hydrological properties in the Kilombero Floodplain, Tanzania. Hydrology 2017, 4, 57. [Google Scholar] [CrossRef] [Green Version]
  50. Anderson, W.; Johansen, C.; Siddique, K.H.M. Addressing the yield gap in rainfed crops: A review. Agron. Sustain. Dev. 2016, 36, 1–13. [Google Scholar] [CrossRef] [Green Version]
  51. Raes, D.; Kafiriti, E.M.; Wellens, J.; Deckers, J.; Maertens, A.; Mugogo, S.; Dondeyne, S.; Descheemaeker, K. Can soil bunds increase the production of rain-fed lowland rice in south eastern Tanzania? Agric. Water Manage. 2007, 89, 229–235. [Google Scholar] [CrossRef]
  52. Worou, O.N.; Gaiser, T.; Saito, K.; Goldbach, H.; Ewert, F. Spatial and temporal variation in yield of rainfed lowland rice in inland valley as affected by fertilizer application and bunding in North-West Benin. Agric. Water Manag. 2013, 126, 119–124. [Google Scholar] [CrossRef]
  53. Nhamo, N.; Rodenburg, J.; Zenna, N.; Makombe, G.; Luzi-Kihupi, A. Narrowing the rice yield gap in East and Southern Africa: Using and adapting existing technologies. Agric. Syst. 2014, 131, 45–55. [Google Scholar] [CrossRef]
  54. Niang, A.; Becker, M.; Ewert, F.; Dieng, I.; Gaiser, T.; Tanaka, A.; Senthilkumar, K.; Rodenburg, J.; Johnson, J.-M.; Akakpo, C.; et al. Variability and determinants of yields in rice production systems of West Africa. Field Crops Res. 2017, 207, 1–12. [Google Scholar] [CrossRef]
  55. Saidia, P.S.; Mrema, J.P. Effects of farmyard manure and activated effective microorganisms on rain-fed upland rice in Mwanza, Tanzania. Org. Agr. 2017, 7, 83–93. [Google Scholar] [CrossRef]
  56. Haefele, S.M.; Sipaseuth, N.; Phengsouvanna, V.; Dounphady, K.; Vongsouthi, S. Agro-economic evaluation of fertilizer recommendations for rainfed lowland rice. Field Crops Res. 2010, 119, 215–224. [Google Scholar] [CrossRef]
  57. Nandwa, S.M.; Obanyi, S.N.; Mafongoya, P.L. Agro-ecological distribution of legumes in farming systems and identification of biophysical niches for legumes growth. In Fighting Poverty in Sub-SAHARAN Africa: The Multiple Roles of Legumes in Integrated Soil Fertility Management; Bationo, A., Ed.; Springer: New York, NY, USA, 2011; pp. 1–26. ISBN 978-94-007-1535-6. [Google Scholar]
Figure 1. A conceptual framework for the analysis of yield gaps (A) and the concept applied to yield gaps in rain-fed lowland rice in the Kilombero floodplain (B).
Agronomy 10 01135 g001
Figure 2. Rice grain yields in Kilombero floodplain attainable with a package of recommended management practices (light grey columns = attainable yield) and grain yields obtained under farmers’ management or by applying individual practices (dark grey columns = actual yield) at the fringe, middle and center. The left and right graphs represent mean rice yields of individual practices and the percentage share of the exploitable yield, respectively. Data are means of 3 years (2015, 2016, 2017). Bars present standard error of the mean (n = 12). Dotted lines indicate the potential simulated yield (upper) and farmers’ actual yields (lower). Mineral N = Urea, organic N = farmyard manure ND = not determined; GM = green manure.
Agronomy 10 01135 g002
Figure 3. Rice grain yields in Kilombero floodplain attainable with a package of recommended management practices (light grey columns = attainable yield) and grain yields obtained under farmers’ management or by applying individual practices (dark grey columns = actual yield) during three consecutive years (2015, 2016, 2017). The left and right graphs represent mean rice yields of individual practices and the percentage share of the exploitable yield, respectively. Data are means of three positions (fringe, middle, center). Bars present standard error of the mean (n = 12). Dotted lines indicate the potential simulated yield (APSIM-Oryza). Mineral N = Urea, organic N = farmyard manure ND = not determined; GM = green manure.
Agronomy 10 01135 g003
Table 1. Effect of hydrological position and seasonal variation on the total and the exploitable yield gaps (expressed as the percentage share of the simulated potential yield), and the share attributed to non-controllable factors (YG1), to water and nutrient limitations (YG2), and to good agricultural practices (YG3) in closing the yield gap in the Kilombero floodplain.
Yield Gaps/
Effects
Reference GapsComponent Gaps
Total Yield Gap (YGT)Exploitable Gap (YGE)Yield-Defining Factors (YG1)Yield-Limiting Factors (YG2)Yield-Reducing Factors (YG3)
t ha−1%t ha−1%t ha−1%t ha−1%t ha−1%
Position effectsFringe8.3726.5561.8162.3204.236
Middle9.0806.0533.0261.2114.842
Center *8.8764.4394.3381.3113.228
Time effects2015 **8.2725.7502.5221.1104.640
20168.6765.5493.1271.4124.136
20179.5775.9483.6292.0163.932
YGT: difference between potential and farmers’ actual yield; YGE: difference between attainable and farmers’ actual yield; YG1: share of the yield gap attributed to non-controllable yield-defining factors; YG2: share of the yield gap attributed to yield-limiting factors; YG3: share of the yield gap attributed to yield-reducing factors. * only two year evaluation, ** center position excluded.

