Article

Economic Optimal Nitrogen Rate Variability of Maize in Response to Soil and Weather Conditions: Implications for Site-Specific Nitrogen Management

1
College of Resources and Environmental Sciences, China Agricultural University, Beijing 100193, China
2
Precision Agriculture Center, Department of Soil, Water, and Climate, University of Minnesota, St. Paul, MN 55108, USA
3
School of Surveying and Land Information Engineering, Henan Polytechnic University, Jiaozuo 454000, China
4
Center for Precision Agriculture, Norwegian Institute of Bioeconomy Research (NIBIO), Nylinna 226, 2849 Kapp, Norway
*
Author to whom correspondence should be addressed.
Submission received: 1 August 2020 / Revised: 19 August 2020 / Accepted: 19 August 2020 / Published: 21 August 2020
(This article belongs to the Special Issue Site-Specific Nutrient Management)

Abstract

:
The dynamic interactions between soil, weather and crop management have considerable influences on crop yield within a region, and should be considered in optimizing nitrogen (N) management. The objectives of this study were to determine the influence of soil type, weather conditions and planting density on economic optimal N rate (EONR), and to evaluate the potential benefits of site-specific N management strategies for maize production. The experiments were conducted in two soil types (black and aeolian sandy soils) from 2015 to 2017, involving different N rates (0 to 300 kg ha−1) with three planting densities (55,000, 70,000, and 85,000 plant ha−1) in Northeast China. The results showed that the average EONR was higher in black soil (265 kg ha−1) than in aeolian sandy soil (186 kg ha−1). Conversely, EONR showed higher variability in aeolian sandy soil (coefficient of variation (CV) = 30%) than in black soil (CV = 10%) across different weather conditions and planting densities. Compared with farmer N rate (FNR), applying soil-specific EONR (SS-EONR), soil- and year-specific EONR (SYS-EONR) and soil-, year-, and planting density-specific EONR (SYDS-EONR) would significantly reduce N rate by 25%, 30% and 38%, increase net return (NR) by 155 $ ha−1, 176 $ ha−1, and 163 $ ha−1, and improve N use efficiency (NUE) by 37–42%, 52%, and 67–71% across site-years, respectively. Compared with regional optimal N rate (RONR), applying SS-EONR, SYS-EONR and SYDS-EONR would significantly reduce N application rate by 6%, 12%, and 22%, while increasing NUE by 7–8%, 16–19% and 28–34% without significantly affecting yield or NR, respectively. It is concluded that soil-specific N management has the potential to improve maize NUE compared with both farmer practice and regional optimal N management in Northeast China, especially when each year’s weather condition and planting density information is also considered. More studies are needed to develop practical in-season soil (site)-specific N management strategies using crop sensing and modeling technologies to better account for soil, weather and planting density variation under diverse on-farm conditions.

Graphical Abstract

1. Introduction

Improper nitrogen (N) management in current crop production systems has become a growing concern among governments, scientists and farmers around the world [1,2,3]. Optimizing N management in agriculture is crucially important for food security, environmental protection, and sustainable development [3,4,5]. This is particularly true for China, the world’s largest producer, consumer and importer of chemical fertilizers [6,7]. Chinese scientists have been promoting a regional optimal N management (RONM) strategy to avoid significant over- or under-application problems [5,8]. If it were adopted for maize (Zea mays L.) production across China, more than 1.4 million tons N fertilizer and 18.6 million tons of greenhouse gas (GHG) emission would be reduced [9]. Such strategy can be easily adopted by farmers and won’t increase their costs. However, due to the significant field-to-field and within-field variability of indigenous soil N supply and crop N demand, this fixed rate and timing strategy will unavoidably result in sub-optimal N management in different fields within a region [8,10]. There is a growing interest in China to develop alternative strategies to further improve N use efficiency (NUE) by better matching N supply with crop N requirement in both space and time [5,6]. Accordingly, it is necessary to determine key factors influencing maize response to N rate and evaluate the potential benefits of alternative N management strategies first.
The first and most important factor to consider is soil type differences, especially soil texture, which regulates many soil processes such as water retention and infiltration, soil organic matter mineralization and nutrient dynamics and, therefore, influences soil N availability and crop yield [11,12,13,14]. There are about 17 different soil types, according to the United States Department of Agriculture (USDA) Soil Taxonomy, in Lishu county, Jilin Province, Northeast China [15]. Recent research indicated that N requirements for maize varied spatially due to the spatial heterogeneity of soil texture [16]. The optimal N rate should be determined according to variability in these soil properties that influence soil N availability or crop response to available N [17]. Loamy clay and loamy sand are two representative soil textures in Northeast China. The loamy clay soil generally has a higher soil organic matter (SOM) content, higher water holding capacity, and stronger ability to fix NH4-N than loamy sand [18]. Loamy sand soils, on the other hand, have generally lower SOM and water holding capacity, but due to greater aeration, they are usually characterized by a higher N mineralization rate than the loamy clay soils [19], causing higher risks of N leaching losses [20]. A recent study from Northeast China indicated that there was a weak parabolic relationship between N rate and maize root length in loamy clay and clay loam soils, but not in the loamy sand soil [21]. That study reported that root length and grain yield were both maximized at the optimal N rate (ONR) of 168–240 kg N ha−1 across soils and years. Results of Qiu et al. [22] indicated that ONR ranged between 140 and 210 kg ha−1 for maize in Northeast China across site-years. The results of studies conducted in North America indicated that the maize grown in fine-textured soils had significantly greater response to added N than the maize grown in medium-textured soils [23].
In addition to soil type and soil texture, weather conditions can also have a strong impact on crop growth, soil water and nutrient dynamics, and crop response to N fertilization. Precipitation and temperature have been found to significantly affect maize grain yield, soil mineral N, and maize response to N [24,25,26,27]. The interaction between soil properties and weather conditions controls the soil water and nutrient availability as well as crop yield potential during the growing season [28,29]. Due to the spatial and temporal variations in crop N demand and soil N supply and losses, crop responses to N fertilizer may vary both between and within soils under different weather conditions [30,31,32]. This can result in significant changes of ONR in space and time [33,34,35]. It has been found that maize yield response to N fertilization could be enhanced by abundant and well-distributed rainfall, and accumulated maize heat units [23]. Therefore, weather conditions should also be taken in account when determining the ONR for different soils.
Planting density is often considered one of the most important crop management practices to improve grain yield and NUE for maize production [36,37,38]. An optimal planting density is needed together with a matching optimal N rate to ensure appropriate aboveground and underground plant growth through different utilization of solar radiation and soil nutrients [38,39,40]. Hence, the maximum maize grain yield in a specific environment (related to soil and weather conditions) may be achieved [41].
So far, few studies have explored the effects of soil type (texture), weather condition, and planting density on the economic optimal N rate (EONR) for maize production, especially in Northeast China. Therefore, the objectives of this study were to (1) determine the EONR as affected by soil type, weather condition and planting density, and (2) evaluate the potential benefits of applying soil-specific (SS), soil- and year-specific (SYS), and soil-, year- and density-specific (SYDS) EONR for maize production in Northeast China.

2. Materials and Methods

2.1. Site Descriptions

The study was conducted in Lishu County (43°02′–43°46′ N, 123°45′–124°53′ E), Jilin Province in Northeast China. Two field locations within the study site with contrasting soil types were selected for this study: one field with a black soil (loamy clay) equivalent to typical Haploboroll and the other field with an aeolian sandy soil (loamy sand) equivalent to typical Cryopsamments according to the USDA Soil Taxonomy [42]. In Lishu County, about 54,700 hectares of black soil fields and about 13,900 hectares of aeolian sandy soil fields are used to grow spring maize [15]. The black soil field was fertile and fine-textured with higher field capacity (0.39 cm cm−3), total N (1.35 g kg−1), and SOM (26.2 g kg−1) than the coarse-textured aeolian sandy soil field with lower field capacity (0.13 cm cm−3), total N (0.65 g kg−1), and SOM (9.7 g kg−1) [43]. The daily precipitation (mm) and daily mean temperature (°C) during three maize growing seasons from 2015 to 2017 were reported in the previous study in Lishu County [43]. According to accumulated precipitation (APP) of maize growth season, year 2015, 2016, and 2017 were considered as dry (347.3 mm), wet (660.6 mm), and normal (509.9 mm) years, respectively.

2.2. Field Experiments and N Management Strategies

The same field experiment was conducted from 2015 to 2017 in the black soil and aeolian sandy soil fields. The experiment used a two-factor randomized complete block design with three replicates involving six N rates (from 0 to 300 kg N ha−1 for maize with an increment of 60 kg N ha−1) with three planting densities (D1: 55,000 plants ha−1, D2: 70,000 plants ha−1, D3: 85,000 plants ha−1) in each field. The plot size was 9 × 8 m2 with wide-narrow row planting spacing of 0.40–0.80 m. For each N treatment, one-third of the N fertilizer in the form of urea and all the phosphorus in the form of calcium superphosphate (at rate of 90 kg P2O5 ha−1) and potassium in the form of potassium sulphate (at rate of 90 kg K2O ha−1) fertilizers were blended into the top 20 cm soil as basal fertilizers before planting. The remaining two-thirds of the N fertilizer was side-dressed at the V8 growth stage.
To compare different N management strategies, we defined the treatments of 300 kg N ha−1 with 55,000 plants ha−1 and 240 kg N ha−1 with 70,000 plants ha−1 as the farmer N rate (FNR) and regional optimal N rate (RONR) management strategies, respectively. The treatment of 0 kg N ha−1 with 55,000 plants ha−1 was defined as check plot (CK). Three EONR management strategies were evaluated in this study: (1) soil-specific EONR (SS-EONR) adjusts N application rates according to different soil types; (2) soil- and year-specific EONR (SYS-EONR) adjusts N application rates according to different soil types and each year’s weather conditions; and (3) soil-year-density-specific EONR (SYDS-EONR) adjusts N application rates according to different soil types, each year’s weather conditions and different planting densities. The EONR was defined as the rate of N application where $1 of additional N fertilizer returned $1 in grain yield, and was based on the assumption that N fertilizer was the only variable cost and all other costs were fixed [44]. The optimal plant density was empirically determined at 70,000 and 55,000 plants ha−1 for the black and aeolian sandy soil fields, respectively. The SS-EONR, SYS-EONR and SYDS-EONR were determined based on the maize yield responses to the N application rate for specific soil, specific soil- and year, and specific soil-, year and density situations, respectively.
The local maize variety-Liangyu 66 was used in both fields. No irrigation was applied in the black soil field, while one-time irrigation of about 50 mm of water was applied before the anthesis growth stage in the aeolian sandy soil field each year. All plots were kept free of weeds, insects, and diseases with chemicals based on standard practices.

2.3. Sample Collection and Data Calculation

Before the start of the experimental series in 2015, soil samples were collected from each plot to determine the soil physical and chemical characteristics. At maize harvest stage (R6) for each growing season, three plant samples were randomly collected from each plot and split into stalks, leaves and grains. These three parts of plant samples were dried in the oven at 105 °C for one hour and then at 85 °C to a constant weight to determine dry aboveground biomass (AGB), which was the sum dry weight of talks, leaves and grains. Then they were ground into fine powder to determine plant N concentration (PNC) by the Kjeldahl digestion method [45], and the plant nitrogen uptake (PNU) was determined by multiplying PNC by AGB. Finally, the N nutrition index (NNI) for each plot was determined by the ratio of actual and critical PNC at harvest stage [46]. The critical PNC was calculated as following equation:
PNCc = 36.5 × W−0.48
where PNCc is the critical plant N concentration expressed as “g kg−1 dry matter (DM)” and W is the AGB expressed in “t DM ha−1”.
After sampling, grain yield was determined by harvesting the middle 20 m2 area of each plot and standardized to 14% grain moisture content. Later, partial factor productivity (PFP), agronomic efficiency (AE), and recovery efficiency (RE) were calculated using the following equations:
PFP [kg kg−1] = YN/NF
AE [kg kg−1] = (YN − Y0)/NF
RE [%] = (PNUN − PNU0)/NF
where YN and Y0 are the yield in N fertilizer application plots and 0 kg N ha−1 plots, respectively, and PNUN and PNU0 are the plant N uptake (PNU) in N application plots and 0 kg N ha−1 plots, respectively, and NF is the applied N fertilizer rate.
The economic income, defined as net return (NR, $ ha−1), was calculated according to Formula (4):
NR = GY × GP − Cost
where GY is the grain yield (kg ha−1), GP is the grain price (0.25 $ kg−1), and the Cost included field tillage (100 $ ha−1), sowing (127 $ ha−1), irrigation (423 $ ha−1), pesticide (100 $ ha−1), herbicide (100 $ ha−1), harvest (155 $ ha−1), N fertilizer (0.92 $ N kg−1), phosphorus fertilizer (0.52 $ P2O5 kg−1), potassium fertilizer (0.52 $ K2O kg−1), and maize seeds (1.05 $ 1000 seeds−1).

2.4. Statistical Analysis

Analysis of variance (ANOVA) was conducted using the general linear model procedure in SPSS 25.0 software (SPSS Inc., Chicago, IL, USA). The main effects of soil, year, planting density, and N fertilizer rate on yield, AGB, PNC, and NNI were analyzed. Mean values of the aforementioned variables for each N treatment were compared using least significant difference test (LSD) at the p < 0.05 probability level. Three statistical models (quadratic, quadratic-plus-plateau and linear-plus-plateau) were selected to describe the crop yield response to N rate, AGB, PNC, and NNI. The PROC NLIN procedure in SAS software (Version 8.0, SAS, 2013), was used to build and analyze those models. The choice of the best model was based on the coefficients of determination (R2) and root mean square error (RMSE). The quadratic model had the best fit to describe the crop yield response to AGB, and the linear-plus-plateau model had the best fit to describe the crop yield response to PNC and NNI at specific soil and specific soil-year respectively. The quadratic-plus-plateau model had the best fit and was therefore used to calculate the EONR and yield at EONR (EOY). The EONR (kg N ha−1) was calculated as:
EONR [kg ha−1] = (CP − b)/2c
where CP was the ratio of the cost of N fertilizer to the price of maize grain, and b and c are the linear and quadratic coefficients from the quadratic-plus-plateau equation. The EOY was calculated by substituting the EONR value into the quadratic-plus-plateau equation [44].
Additionally, multiple linear regression was used to establish the relationships between EONR (obtained yield) and the soil total N (TN), planting density (D), growing degree days (GDD), and accumulated precipitation (APP) during maize growing season using the SPSS 25.0 software (SPSS Inc., Chicago, IL, USA). The GDD was calculated as follows:
GDD = ∑ ((Tmax − Tmin)/2 − Tbase)
where Tmax, Tmin, Tbase are the daily maximum, minimum, and base temperatures, respectively and Tbase = 10 °C.

3. Results

3.1. The Description of Maize Agronomic Parameters

According to the results of ANOVA (Table 1), maize yield, AGB, PNC, and NNI, were all significantly affected by soil type, year with its weather pattern, N rate, and their interactions. However, the yield, PNC, and NNI were not directly affected by the planting density.
The multiple comparisons of the analyzed agronomic parameters in data subsets aggregated by a given influencing factor are shown in Table 2. The maize yield, AGB, and NNI in the black soil field were significantly higher (by 3.43 t ha−1, 5.91 t ha−1, and 0.06) than in the aeolian sandy soil field. On the other hand, the PNC were significantly lower (by 1.31 kg kg−1) in the black soil field than in the aeolian sandy soil field. The relatively wet season of 2016 brought the highest yield and AGB while NNI was the lowest among three years. In 2015, a relatively dry year, the yield and PNC were the lowest in the analyzed period. The yield, PNC, and NNI were not significantly affected by the three tested planting densities. The values of all of the parameters significantly improved with the increasing N rate, until the N4 treatment (240 kg ha−1).
An overview of the relationships between maize yield and agronomic parameters showed distinct crop response to growing conditions (Figure 1 and Figure 2). Whether across the three years or in a specific year, for black soil and aeolian sandy soil fields the relationship between yield and AGB had a significant quadratic relationship. On the contrary, the relationships between yield and either PNC or NNI were modeled according to the linear-plus-plateau models. Across the three years, the yield was maximized when the PNC reached 9.6 kg kg−1 and 10.1 kg kg−1 in black soil and aeolian sandy soil, respectively. Correspondingly, in black soil field, the yield reached its maximum when the NNI was at 0.95, while in the aeolian sandy soil, the maximum yield was obtained at NNI of 0.81. Analyzed for a given year, in 2015, 2016, and 2017, the yield was maximized when the PNC reached 8.2, 9.2, and 9.9 kg kg−1 in black soil and 9.7, 9.5, and 10.1 kg kg−1 in aeolian sandy soil, respectively. Correspondingly, in the black soil field, the yield reached its maximum when the NNI was at 1.15, 0.84, and 0.90 in specific year of 2015, 2016, and 2017, while in the aeolian sandy soil, the yield was maximized at NNI of 0.74, 0.80, and 0.88, respectively.

3.2. The Response of Maize Agronomic Parameters to N Application Rate

The maize yield was significantly higher in black soil than in aeolian sandy soil at each N application rate (Figure 3). According to the quadratic-plus-plateau model, the maize yield was maximized at the N rates of 285 and 201 kg ha−1 in black soil and aeolian sandy soils across three years, respectively. Furthermore, the lowest N rate for obtaining the maximum yield, or the agronomic optimal N rate (AONR), was not stable in either the black soil field or the aeolian sandy soil field and was influenced by the weather pattern in a given season. For specific year of 2015, 2016, and 2017, the soil-specific AONR of black soil and aeolian sandy soil fields were 300, 243, and 277 kg ha−1 and 112, 209, and 217 kg ha−1 in 2015, 2016, and 2017, respectively. The average EONRs were 265 kg ha−1 (276, 230, and 260 kg ha−1) and 186 kg ha−1 (101, 193, and 203 kg ha−1) in black soil and aeolian sandy soil fields, respectively, across three years (in specific year of 2015, 2016, and 2017).
Moreover, the soil-specific EONR was also influenced by the year and planting density interaction (Figure 4). In the black soil field, the soil-specific EONR had a coefficient of variation (CV) of 10% and reached 210, 225, and 240 kg ha−1, 234, 214, and 252 kg ha−1, and 266, 250, and 266 kg ha−1 at the planting density of 55,000, 70,000, and 85,000 plants ha−1 in year of 2015, 2016, and 2017, respectively. The NUE analysis using PFP and AE showed that the highest values were obtained at the planting density of 70,000 plants ha−1 (64 and 42 kg kg−1) in all three years compared with 50,000 plants ha−1 (54 and 20 kg kg−1) and 85,000 plants ha−1 (50 and 37 kg kg−1). In the aeolian sandy soil field, the soil-specific EONR varied with the CV of 30% and reached 88, 150, and 96 kg ha−1, 158, 209, and 215 kg ha−1, and 168, 177, and 208 kg ha−1 at the planting density of 55,000, 70,000, and 85,000 plants ha−1 in year of 2015, 2016, and 2017, respectively. Interestingly, the NUE analysis (PFP and AE), showed that the highest values were obtained at the planting density of 55,000 plants ha−1 (75 and 23 kg kg−1) in all three years compared with 70,000 plants ha−1 (55 and 34 kg kg−1) and 85,000 (50 and 36 kg kg−1) (Figure 4). Meanwhile, according to the multiple linear regression (Figure 5), soil-specific EONR (R2 = 0.77) and obtained yield (R2 = 0.95) showed significant relationships with the soil total N, growing degree days, accumulated precipitation, and planting density.

3.3. The Potential Benefits of Site-Specific N Management Strategies

Based on the EONR specific to different soil types, years and planting densities, as described above (Figure 4), three site-specific N management strategies were proposed. The results of the SS-EONR, SYS-EONR, and SYDS-EONR strategies with their explicit N-rates and optimal planting densities at 70,000 and 55,000 plants ha−1 for the black and aeolian sandy soil fields, respectively, were averaged across the soils and years (Table 3). This facilitated the comparison with FNR at 300 kg N ha−1 and 55,000 plants ha−1 and RONR at 240 kg N ha−1 and 70,000 plants ha−1. The variation between the different strategies at the two soil types are given in Figure 6.
In comparison with FNR across the two soil types and three years (Table 3), the SS-EONR, SYS-EONR, and SYDS-EONR strategies significantly reduced N rate by 25%, 30%, and 38%, increased NR by 155, 176, and 163 $ ha−1, and improved NUE parameters (PFP and AE) by 37–42%, 52%, and 67–71%, respectively. Meanwhile, these three strategies showed no significant effects on maize yield. When compared with RONR, the SS-EONR, SYS-EONR, and SYDS-EONR strategies significantly reduced N rate by 6%, 12%, and 22%, and improved NUE parameters (PFP and AE) by 7–8%, 16–19%, and 28–34%, respectively, without significantly affecting maize yield and NR.
Analyzed for each soil type separately, the SS-EONR, SYS-EONR, and SYDS-EONR strategies performed differently when compared with FNR and RONR across the three years (Figure 6). In the black soil field, in comparison with FNR, the SS-EONR, SYS-EONR, and SYDS-EONR strategies significantly reduced N rate by 12%, 15%, and 22%, increased NR by 201, 212, and 193 $ ha−1, and improved PFP by 20%, 26%, and 35%, respectively, without significantly affecting maize yield, AE, and RE. However, when compared with RONR, the SS-EONR, SYS-EONR, and SYDS-EONR strategies did not significantly affected N rate, maize yield, NR, and NUE parameters (PFP, AE, and AE).
In the aeolian sandy soil field, in comparison with FNR, the SS-EONR, SYS-EONR, and SYDS-EONR strategies reduced N rate by 38%, 45%, and 54%, increased NR by 109, 140, and 133 $ ha−1, and improved NUE parameters (PFP and AE) by 62%, 76–93%, and 105–126%, respectively. When compared with RONR, the SS-EONR, SYS-EONR, and SYDS-EONR strategies reduced N rate by 23%, 31%, and 42%, increased NR by 95, 126, and 119 $ ha−1, and improved NUE parameters (PFP and AE) by 31–33%, 44–56%, and 68–83%, respectively. It is worth noting that the SS-EONR, SYS-EONR, and SYDS-EONR strategies showed no significant difference in maize yield whether comparing with FNR or RONR in the aeolian sandy soil field.

4. Discussion

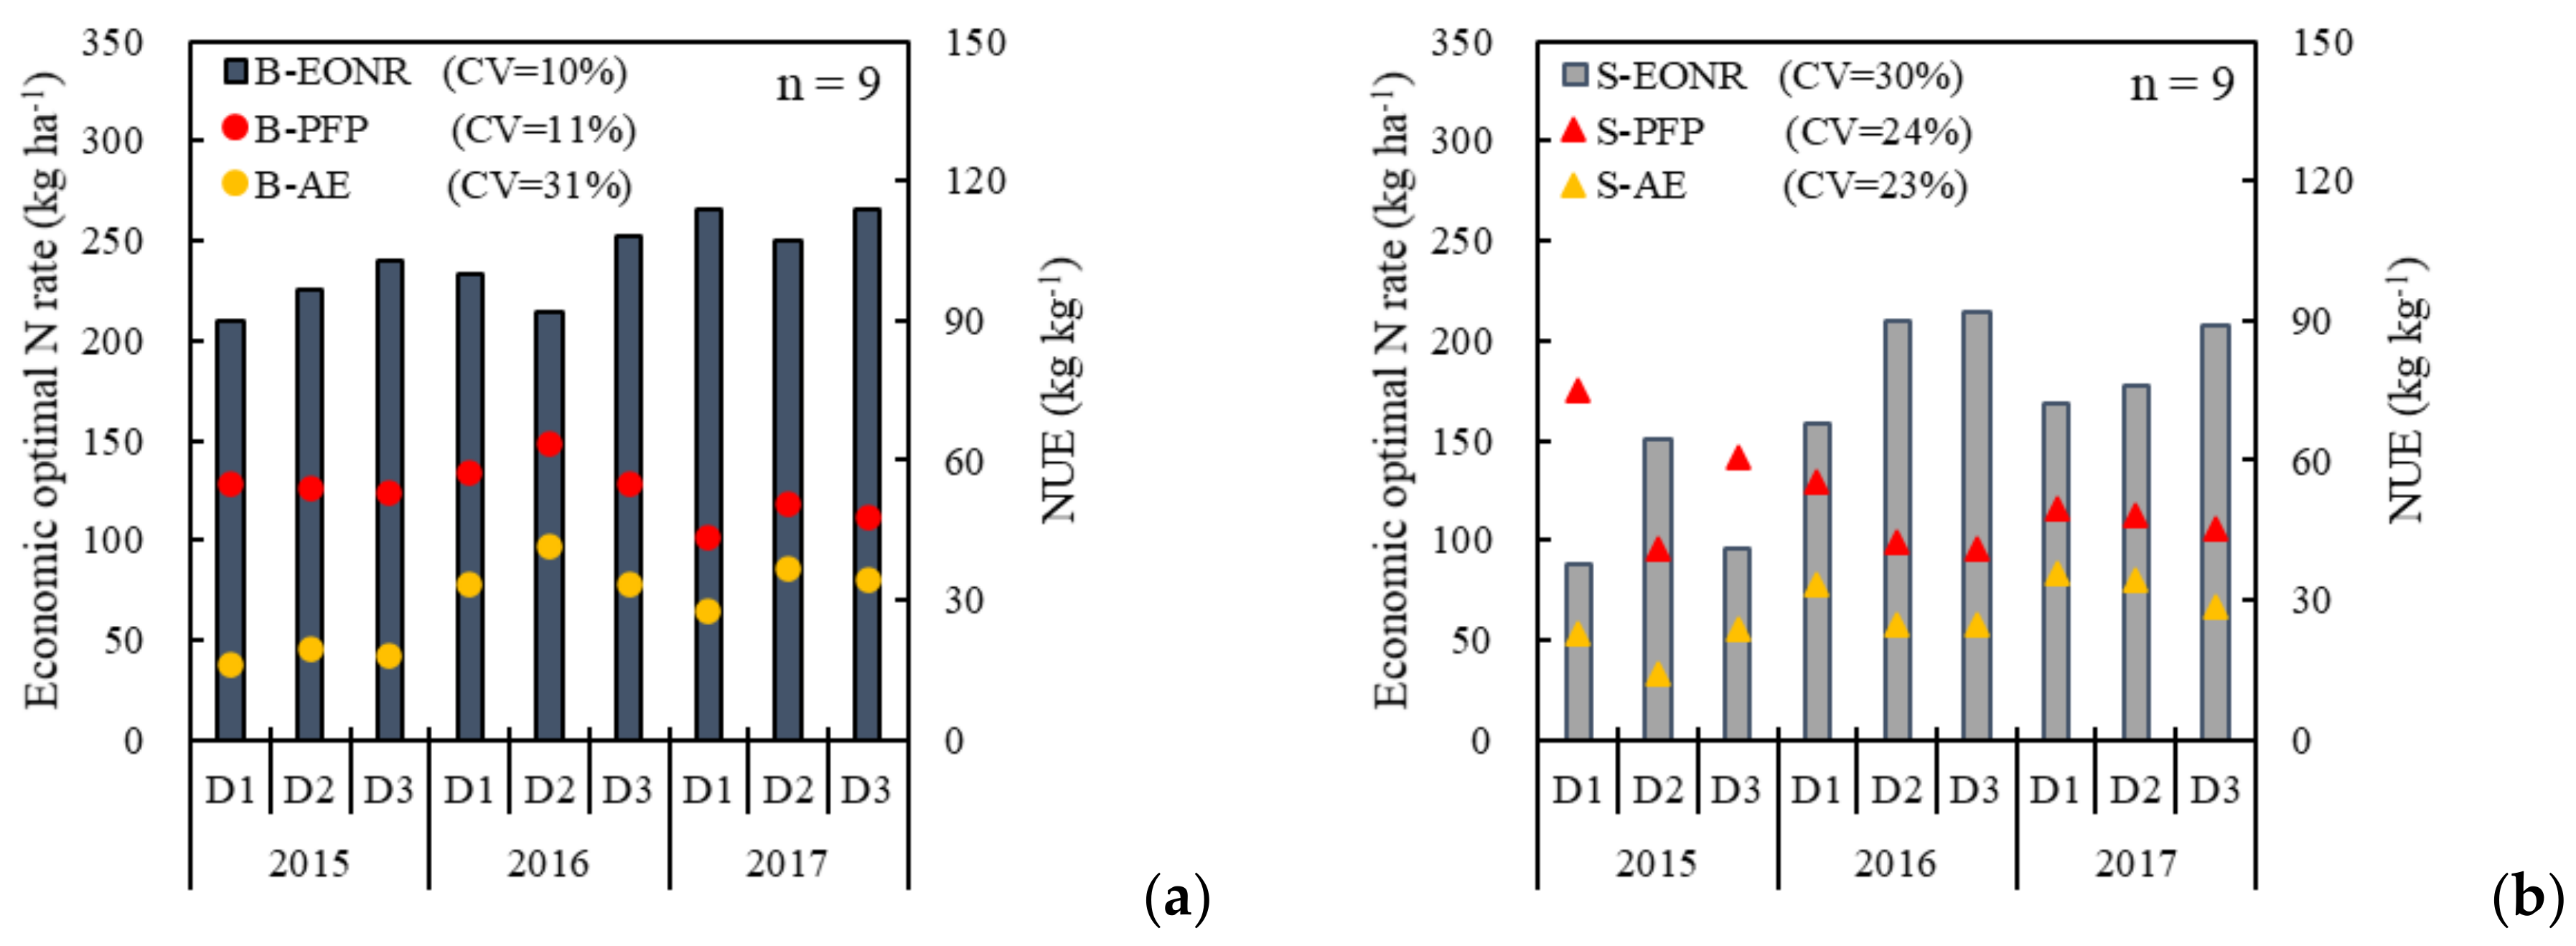
4.1. The Soil-Specific Economic Optimal N Rate

In this study, the black soil field was characterized by a higher water holding capacity and soil fertility than the aeolian sandy soil field (Table 1). This led to a more efficient nutrient supply to the maize crop during the growing season and resulted in larger AGB and NNI in the black soil field (Table 2). These findings were in agreement with previous studies conducted in this study region [47,48]. According to the relationship between grain yield and AGB or NNI (Figure 1), a higher yield was recorded in the black soil field than in aeolian sandy soil field (Table 2). That is despite the fact that the PNC was higher in the aeolian sandy soil field than in the black soil field (Table 2). The NNI is generally used during the growing season to diagnose crop N status (deficient, optimal or surplus) for guiding in-season N application [49], however, the concept can also be extended to the maturity stage to guide adjustment of N management in the following season [50].
It is usually assumed that the ONRs are higher in coarse-textured soil fields than in fine-textured soil fields, due to the disability in coarse-textured soil fields to retain moisture leading to higher N leaching potential [51]. As a result, most farmers apply more N fertilizer in the aeolian sandy soil field than in the black soil field [52]. Furthermore, in this study location, maize production is rain-fed and water deficit frequently occurs during the maize growing season, hence the drought has been the main limiting factor of crop growth in the aeolian sandy soil field [53,54]. In order to avoid the overuse of N fertilizers, many researchers tend to use the linear plus plateau model to determine the ONR in China [22,55]. In this study, according to the R2 and RMSE, the quadratic-plus-plateau model had the best fit and was, therefore, used to calculate the EONR. The EONR across three years and three planting densities was considerably higher in fine-textured black soil field (265 kg ha−1) than in coarse-textured aeolian sandy soil field (186 kg ha−1) (Figure 3a). According to the relationships between yield and PNC or NNI (Figure 1), plants with a given level of PNC and NNI could produce much more yield in black soil than in aeolian sandy soil. The minimum NNI to obtain the maximum yield in the aeolian sandy soil field (0.81) was significantly lower than in the black soil field (0.95). In other words, adding more N fertilizer would not lead to substantial increase of maize yield in aeolian sandy soil field. Therefore, N fertilizer was not considered the main limiting factor there. This result was in agreement with the previous studies stating that the ONR was lower in coarse-textured soil fields than in fine-texture soil fields and showing great soil-specific variability [50,56].

4.2. The Influence of Weather Conditions and Planting Density on Soil-Specific Economic Optimal N Rate

The interaction between soil properties and weather conditions had the greatest influence on the response of crop yield to N fertilizer [23,24,57]. According to the previous research [58,59,60], the relationship between soil properties and yield was mainly affected by the spatial and temporal variability in soil water holding capacity and precipitation. Therefore, ONR should be adjusted based on the interaction between soil properties and weather conditions. Precipitation was significantly different among three years covered by this study (Figure 1), and had a significant effect on yield, AGB, PNC, and NNI (Table 1 and Table 2). Meanwhile, the minimum PNC and NNI to obtain the maximum maize yield also showed inter-annual variation in both fields (Figure 2). This resulted in the year-to-year variability of soil-specific EONR (Figure 3b–d). For the year of 2016, in black soil field with high soil buffering capacity and fertility (total N and SOM), the relatively high GDD with well-distributed precipitation would lead to a higher AGB and grain yield potential than in 2015 and 2017, a phenomenon noted also in several other studies [40,61,62]. Furthermore, the synchronization of high GDD and well-distributed precipitation in 2016 would lead to a higher soil nitrification rate [19,63] and would provide relatively more soil N for the maize growth than in 2015 and 2017. As a consequence, in 2016 the minimum NNI to obtained the maximum maize yield was the lowest among the three years. Therefore, the SS-EONR for the black soil was lower in 2016 than in 2015 and 2017. On the other hand, in the year of 2015, in aeolian sandy soil with low soil buffering capacity and fertility (total N and SOM), the severe drought restricted the crop growth and yield formation, a phenomenon well described in another study [64]. Due to the low AGB and yield potential, the minimum NNI to obtain the maximum maize yield in the aeolian sandy soil field was the lowest in 2015 among the three tested growing seasons. Therefore, the SS-EONR for the aeolian soil was lower in the dry year (2015) than in 2016 and 2017.
Another question faced by scientists and the farmers is how planting density should be adjusted for different soil types and weather conditions. Although, in this study, the planting density did not have any significant effect on the yield, PNC, and NNI (Table 1), the soil-specific EONR still varied among three weather conditions and planting densities, along with PFP and AE (Figure 4). Also, the variability of the parameters was higher in the aeolian sandy soil field than in the black soil field. The buffering capacity mainly comes from the texture and organic carbon. Therefore, in the fertile black soil field with a higher buffering capacity, the production would in theory be less affected by the varying conditions than in the barren aeolian sandy soil field. The barren aeolian sandy soil field had a low yield potential and high variation in soil conditions, leading to high variation in AGB and yield, which translated to high variation in EONR. Due to the relatively higher N uptake and AGB accumulation at the relatively higher planting densities [37,65], the highest soil-specific AONRs were defined in this study under the high (85,000 plants ha−1) planting density in the fertile black soil field and under the middle (70,000 plants ha−1) and high (85,000 plants ha−1) planting density in the aeolian sandy soil field. Therefore, according to the PFP and AE with the highest values among three planting densities, the middle (70,000 plants ha−1) and low (55,000 plants ha−1) planting densities with their corresponding SYS-EONR would be the optimal N management strategy for maize production in the black soil and aeolian sandy soil fields, respectively. The SS-EONR could be adjusted based on the information about the soil properties, weather conditions, and planting density [66]. Through the multiple linear regression analysis (Figure 5) performed in this study, the SYDS-EONR and the obtained grain yield could be determined preliminarily using soil N, GDD, APP, and planting density.

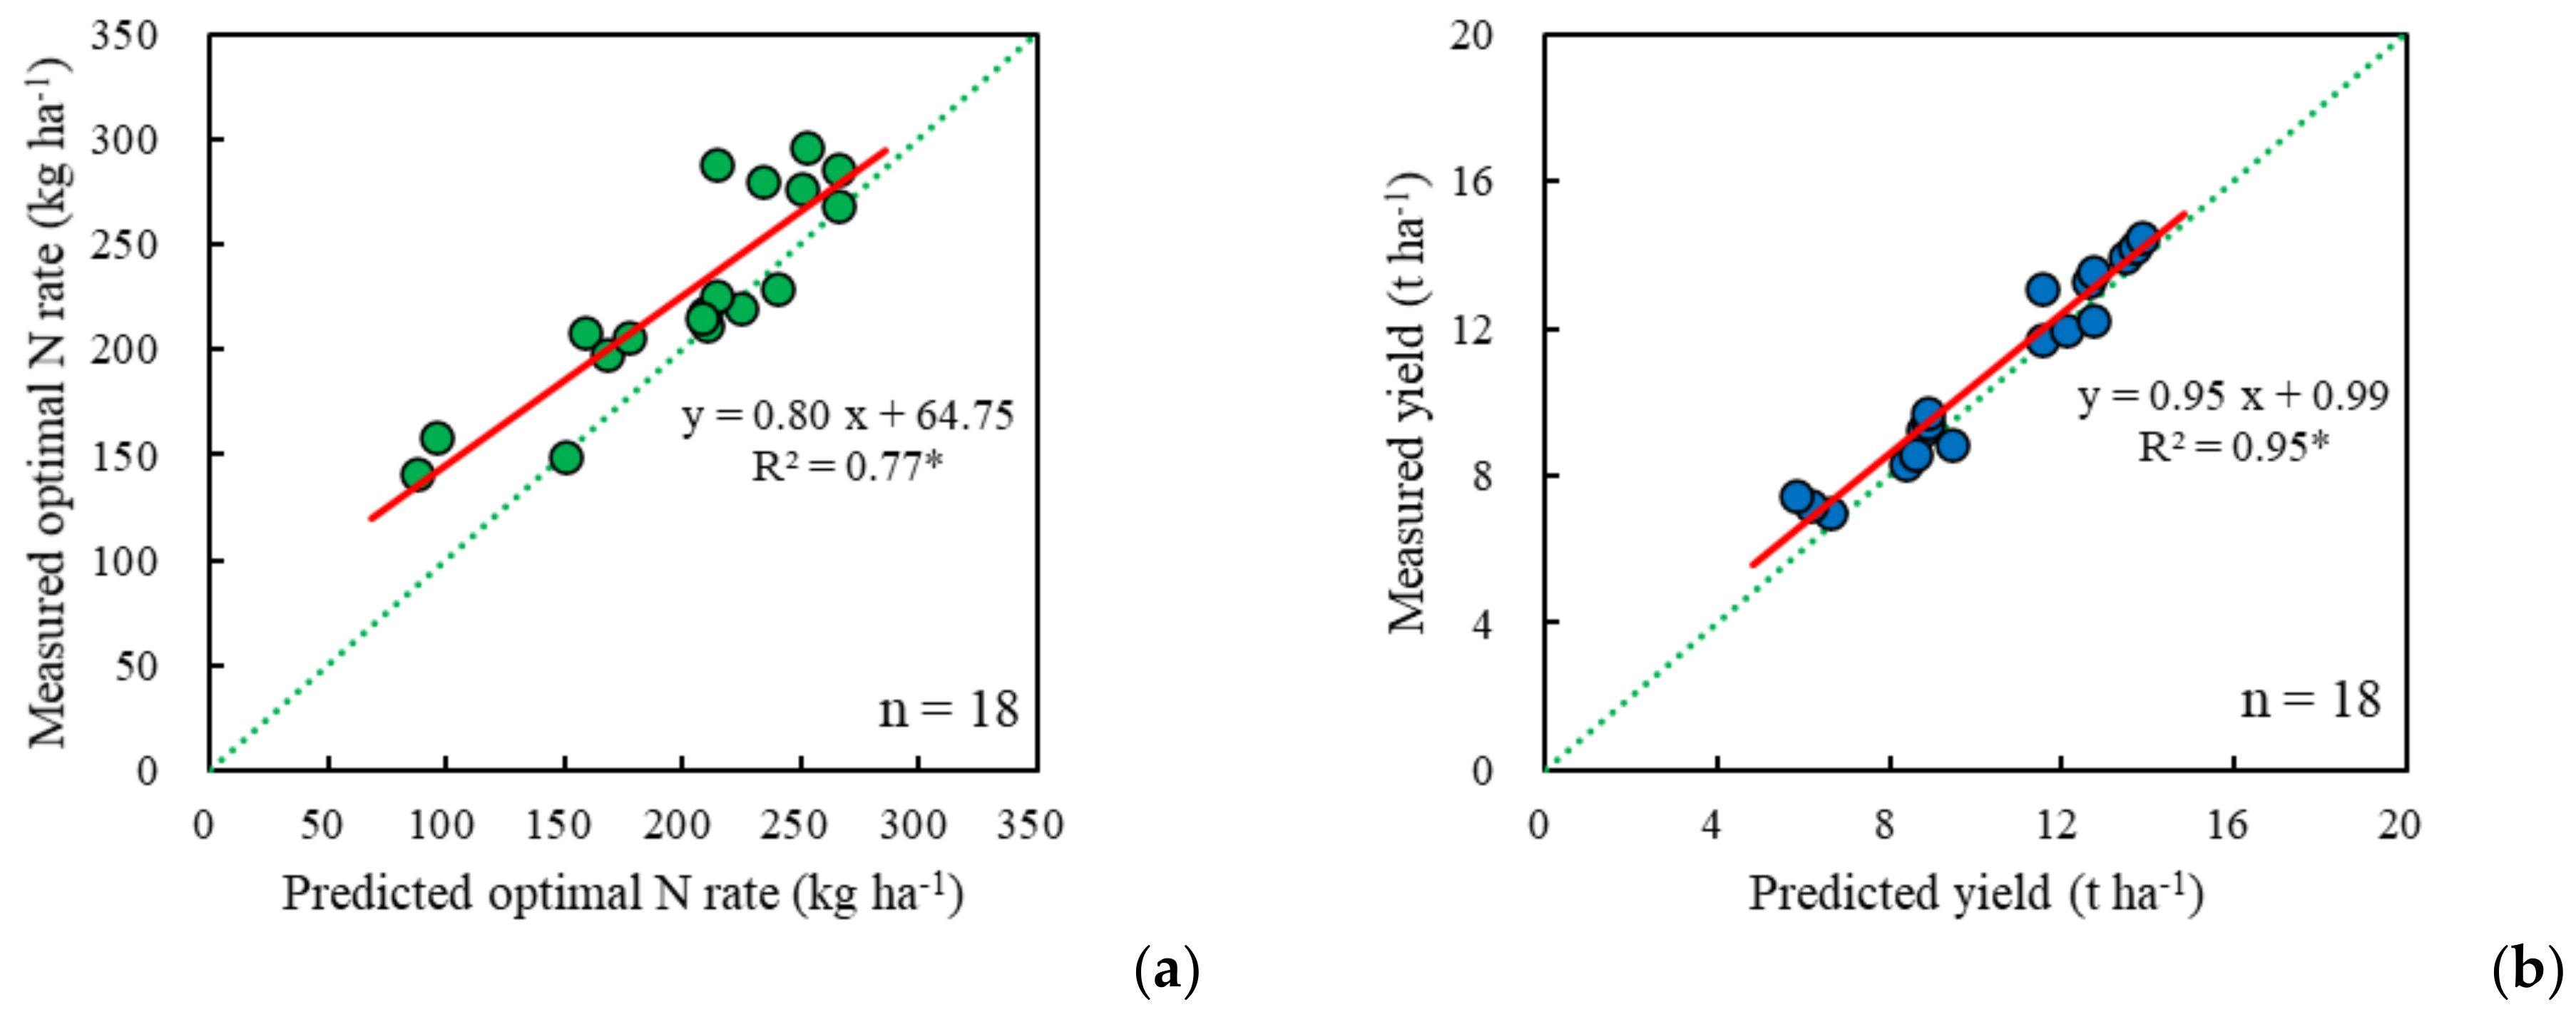
4.3. The Potential Benefits of Applying Soil-Specific Economic Optimal N Rate

Currently, the RONR strategy recommended about 240 kg N ha−1 with 70,000 plant ha−1 for this study region [8,9]. In this strategy, the N fertilizer is applied at a fixed rate and timing without accounting for spatial and temporal variability in soil N supply and crop N demand. According to the results of this study, the EONR changed dramatically from the black soil field to the sandy soil field and from year to year, which confirmed the findings of the previous studies showing that an ONR varied significantly in space and time [33,34,35]. The previous research demonstrated that soil-specific N management could adjust the N fertilizer application to match crop requirement by identifying the gap between soil N supply and crop N demand according to their spatial and temporal variation in a particular growing season for a specific soil type [67,68]. Therefore, it is of great interest to learn how much we can further improve N management using alternative strategies that are more complex and accurate than the simple FNR and RONR strategies.
Across the two typical soils in this study region, with distinctly different soil properties, compared with FNR, the soil-specific EONR strategies would decrease the N application rates with no negative effect on maize yield, while increasing NR and NUE (Table 3 and Figure 6). When compared with RONR, the soil-specific EONR strategies still showed the potential to decrease the N application rates and increase NUE but with no negative effect on maize yield and NR. Meanwhile, because the EONR showed higher variability in aeolian sandy soil than in black soil across different weather conditions and planting densities (Figure 4), the soil-specific EONR strategies showed greater potential in decreasing N application rates and increasing NUE in aeolian sandy soil than in black soil. Therefore, the soil-specific EONR strategies have a great potential to be implemented to achieve high-yield and high-efficiency maize production in China. Furthermore, because of the variation in weather conditions, especially precipitation, EONR varied among different years (Figure 3). The SYS-EONR strategy would perform better in increasing NUE than the SS-EONR strategy. Although the planting density had no significant effects on grain yield and NR in this study (Table 1), the EONR was significantly affected by it and the interaction among soil type, weather conditions, and planting density (Figure 4). Therefore, the SYDS-EONR strategy would result in the highest potential benefits in reducing the N application rate, and increasing NUE than the SS-EONR and SYS-EONR strategies (Table 3 and Figure 6).
These results indicated that soil-specific N management had the potential to increase N management and improve NUE. The best improvement may be achieved in the coarse-textured aeolian sandy soils and implementing the soil-, year- and planting density-specific EONR strategy. However, it is a great challenge to determine soil- and year-specific planting densities and corresponding optimal N rates across different farmers’ fields. Future studies are needed to use crop-sensing technologies and crop growth modeling methods to guide in-season soil-specific N management under on-farm conditions [5,43,69,70].

5. Conclusions

The future direction of world agriculture is towards high yield, profitability and resource use efficiency. Due to the variation in soil properties, weather conditions, and planting densities, the optimal N rate should be adjusted according to specific soil, weather, and planting density combinations. The results of this study indicated that the average EONR in a fertile black soil field (265 kg ha−1) was higher than in an aeolian sandy soil field (186 kg ha−1). The variation in weather conditions and planting density had significant effect on EONR, resulting in CV of 10% and 30% in black and aeolian sandy soil fields, respectively. The optimal planting density was defined at 70,000 and 55,000 plants ha−1 for the black soil and aeolian sandy soil fields, respectively. The soil-specific EONR management strategy performed better than RONR in reducing N application rate and improving NUE. The best improvement was achieved using the SYDS-EONR strategy which considered the soil, weather, and planting density combinations. More studies are needed to develop practical in-season soil (site)-specific N management strategies to better account for soil, weather and planting density variation under diverse on-farm conditions.

Author Contributions

Y.M. and D.J.M. designed the experiment. X.W. conducted the experiment, performed the analysis, and wrote the original paper, R.D. and Z.C. assisted in the experiment, plant and soil sampling, and sample processing. Y.M., K.K., and G.M. reviewed and revised the manuscript. All authors have read and agreed to the published version of the manuscript.

Funding

The research was financially supported by National Key Research and Development Program of China (2016 YFD0200600, 2016YFD0200602), Norwegian Ministry of Foreign Affairs (SINOGRAIN II, CHN-17/0019), and the UK Biotechnology and Biological Sciences Research Council (BB/P004555/1).

Acknowledgments

We would like to thank Yanjie Guan, Xuezhi Yue, Zheng Fang, Weidong Lou, and Guiyin Jiang for their help with the field experiments.

Conflicts of Interest

The authors declare no conflict of interest.

References

  1. Dhital, S.; Raun, W.R. Variability in optimum nitrogen rates for maize. Agron. J. 2015, 108, 2165–2173. [Google Scholar] [CrossRef] [Green Version]
  2. Davidson, E.A.; Suddick, E.C.; Rice, C.W.; Prokopy, L.S. More food, low pollution (Mo Fo Lo Po): A grand challenge for the 21st century. J. Environ. Qual. 2015, 44, 305–311. [Google Scholar] [CrossRef]
  3. Zhang, X.; Davidson, E.A.; Mauzerall, D.L.; Searchinger, T.D.; Dumas, P.; Shen, Y. Managing nitrogen for sustainable development. Nature 2015, 528, 51–59. [Google Scholar] [CrossRef] [Green Version]
  4. Rockström, J.; Steffen, W.; Noone, K.; Persson, Å.; Chapin, F.S.; Lambin, E.F.; Lenton, T.M.; Scheffer, M.; Folke, C.; Schellnhuber, H.J.; et al. A safe operating space for humanity. Nature 2009, 461, 472–475. [Google Scholar] [CrossRef]
  5. Cao, Q.; Miao, Y.; Feng, G.; Gao, X.; Liu, B.; Liu, Y.; Li, F.; Khosla, R.; Mulla, D.J.; Zhang, F. Improving nitrogen use efficiency with minimal environmental risks using an active canopy sensor in a wheat-maize cropping system. Field Crop. Res. 2017, 214, 365–372. [Google Scholar] [CrossRef]
  6. Miao, Y.X.; Stewart, B.A.; Zhang, F.S. Long-term experiments for sustainable nutrient management in China: A review. Agron. Sustain. Dev. 2011, 31, 397–414. [Google Scholar] [CrossRef] [Green Version]
  7. Zhang, W.F.; Dou, Z.X.; He, P.; Ju, X.T.; Powlson, D.; Chadwick, D.; Norse, D.; Lu, Y.L.; Zhang, Y.; Wu, L.; et al. New technologies reduce greenhouse gas emissions from nitrogenous fertilizer in China. Proc. Natl. Acad. Sci. USA 2013, 110, 8375–8380. [Google Scholar] [CrossRef] [Green Version]
  8. Cui, Z.; Yue, S.; Wang, G.; Meng, Q.; Wu, L.; Yang, Z.; Zhang, Q.; Li, S.; Zhang, F.; Chen, X. Closing the yield gap could reduce projected greenhouse gas emissions: A case study of maize production in China. Glob. Chang. Biol. 2013, 19, 2467–2477. [Google Scholar] [CrossRef]
  9. Wu, L.; Chen, X.P.; Cui, Z.L.; Zhang, W.F.; Zhang, F.S. Establishing a regional nitrogen management approach to mitigate greenhouse gas emission intensity from intensive smallholder maize production. PLoS ONE 2014, 9, e98481. [Google Scholar] [CrossRef] [Green Version]
  10. Cao, Q.; Cui, Z.L.; Chen, X.P.; Khosla, R.; Dao, T.H.; Miao, Y.X. Quantifying spatial variability of indigenous nitrogen supply for precision nitrogen management in small scale farming. Precis. Agric. 2012, 13, 45–61. [Google Scholar] [CrossRef]
  11. Rabot, E.; Wiesmeier, M.; Schlüter, S.; Vogel, H.J. Soil structure as an indicator of soil functions: A review. Geoderma 2018, 314, 122–137. [Google Scholar] [CrossRef]
  12. Qian, P.; Schoenau, J.J. Assessing nitrogen mineralization from soil organic matter using anion exchange membranes. Fertil. Res. 1994, 40, 143–148. [Google Scholar] [CrossRef]
  13. Sogbedji, J.M.; Es, H.M.V.; Klausner, S.D.; Bouldin, D.R.; Cox, W.J. Spatial and temporal processes affecting nitrogen availability at the landscape scale. Soil Tillage Res. 2001, 58, 233–244. [Google Scholar] [CrossRef]
  14. Dharmakeerthi, R.S.; Kay, B.D.; Beauchamp, E.G. Spatial variability of in-season nitrogen uptake by corn across a variable landscape as affected by management. Agron. J. 2006, 98, 255–264. [Google Scholar] [CrossRef]
  15. Lishu County Bureau of Agriculture in Jilin Province, China. Soil J. Lishu Cty. 1985, 4, 33–37.
  16. Zhu, Q.; Schmidt, J.P.; Bryant, R.B. Maize (Zea mays, L.) yield response to nitrogen as influenced by spatio-temporal variations of soil–water-topography dynamics. Soil Tillage Res. 2015, 146, 174–183. [Google Scholar] [CrossRef]
  17. Schmidt, J.P.; Sripada, R.P.; Beegle, D.B.; Rotz, C.A.; Hong, N. Within-field variability in optimum nitrogen rate for corn linked to soil moisture availability. Soil Sci. Soc. Am. 2011, 75, 306–316. [Google Scholar] [CrossRef]
  18. Chantigny, M.H.; Rochette, P.; Angers, D.A.; Massé, D.; Côté, D. Ammonia volatilization and selected soil characteristics following application of anaerobically digested pig slurry. Soil Sci. Soc. Am. 2004, 68, 306–312. [Google Scholar] [CrossRef]
  19. Sahrawat, K.L. Factors affecting nitrification in soils. Commun. Soil Sci. Plant Anal. 2008, 39, 1436–1446. [Google Scholar] [CrossRef] [Green Version]
  20. St Luce, M.; Whalen, J.K.; Ziadi, N.; Zebarth, B.J. Chapter two—Nitrogen dynamics and indices to predict soil nitrogen supply in humid temperate soils. In Advances in Agronomy; Academic Press: Cambridge, MA, USA, 2011; Volume 112, pp. 55–102. [Google Scholar]
  21. Feng, G.Z.; Zhang, Y.J.; Chen, Y.L.; Li, Q.; Chen, F.J.; Gao, Q.; Mi, G.H. Effects of nitrogen application on root length and grain yield of rain-fed maize under different soil types. Agron. J. 2006, 108, 1656–1665. [Google Scholar] [CrossRef]
  22. Qiu, S.J.; He, P.; Zhao, S.C.; Li, W.J.; Xie, J.G.; Hou, Y.P. Impact of nitrogen rate on maize yield and nitrogen use efficiencies in northeast china. Agron. J. 2014, 107, 305–313. [Google Scholar] [CrossRef]
  23. Tremblay, N.; Bouroubi, Y.M.; Bélec, C.; Mullen, R.W.; Kitchen, N.R.; Thomason, W.E.; Ebelhar, S.; Mengel, D.B.; Raun, W.R.; Francis, D.D.; et al. Corn response to nitrogen is influenced by soil texture and weather. Agron. J. 2012, 104, 1658–1671. [Google Scholar] [CrossRef] [Green Version]
  24. Tremblay, N.; Pandalai, S.G. Determining nitrogen requirements from crops characteristics: Benefits and challenges. Recent Res. Dev. Agron. Hortic. 2004, 1, 157–182. [Google Scholar]
  25. Bélec, C.; Tremblay, N. Adapting nitrogen fertilization to unpredictable seasonal conditions with the least impact on the environment. Horttechnology 2006, 16, 408–412. [Google Scholar]
  26. Shanahan, J.F.; Kitchen, N.R.; Raun, W.R.; Schepers, J.S. Responsive in-season nitrogen management for cereals. Comput. Electron. Agric. 2008, 61, 51–62. [Google Scholar] [CrossRef] [Green Version]
  27. Kyveryga, P.M.; Blackmer, A.M.; Morris, T.F. Alternative benchmarks for economically optimal rates of nitrogen fertilization for corn. Agron. J. 2007, 99, 1057–1065. [Google Scholar] [CrossRef] [Green Version]
  28. Schröder, J.J.; Neeteson, J.J.; Oenema, O.; Stuik, P.C. Does the crop or soil indicate how to save nitrogen in maize production? Reviewing the state of the art. Field Crop. Res. 2000, 66, 151–164. [Google Scholar] [CrossRef]
  29. Kay, B.D.; Mahboubi, A.A.; Beauchamp, E.G.; Dharmakeerthi, R.S. Integrating soil and weather data to describe variability in plant available nitrogen. Soil Sci. Soc. Am. 2006, 70, 1210–1221. [Google Scholar] [CrossRef]
  30. Fiez, T.E.; Pan, W.L.; Miller, B.C. Nitrogen use efficiency of winter wheat among landscape positions. Soil Sci. Soc. Am. 1995, 59, 1666–1671. [Google Scholar] [CrossRef]
  31. Hergert, G.W.; Ferguson, R.B.; Shapiro, C.A.; Penas, E.J.; Anderson, F.B. Classical statistical and geostatistical analysis of soil nitrate-N spatial variability. In Site-Specific Management for Agricultural Systems; American Society of Agronomy; Crop Science Society of America; Soil Science Society of America: Madison, WI, USA, 1995; Volume 677, pp. 175–186. [Google Scholar]
  32. Mamo, M.; Malzer, G.L.; Mulla, D.J.; Huggins, D.R.; Strock, J. Spatial and temporal variation in economically optimum nitrogen rate for corn. Agron. J. 2003, 95, 958–964. [Google Scholar] [CrossRef] [Green Version]
  33. Scharf, P.C.; Kitchen, N.R.; Sudduth, K.A.; Davis, J.G.; Hubbard, V.C.; Lory, J.A. Field-scale variability in optimal nitrogen fertilizer rate for corn. Agron. J. 2005, 97, 452–461. [Google Scholar] [CrossRef] [Green Version]
  34. Miao, Y.; Mulla, D.J.; Hernandez, J.A.; Wiebers, M.; Robert, P.C. Potential impact of precision nitrogen management on corn yield, protein content, and test weight. Soil Sci. Soc. Am. J. 2007, 71, 1490–1499. [Google Scholar] [CrossRef]
  35. Miao, Y.X.; Mulla, J.D.; Batchelor, D.W.; Paz, O.J.; Robert, C.P.; Wiebers, M. Evaluating management zone optimal nitrogen rates with a crop growth model. Agron. J. 2006, 98, 545–553. [Google Scholar] [CrossRef]
  36. Tollenaar, M.; Lee, E.A. Yield potential, yield stability and stress tolerance in maize. Field Crop. Res. 2020, 75, 161–169. [Google Scholar] [CrossRef]
  37. Lee, E.A.; Tollenaar, M. Physiological basis of successful breeding strategies for maize grain yield. Crop Sci. 2007, 47, 202–215. [Google Scholar] [CrossRef]
  38. Yan, P.; Pan, J.; Zhang, W.; Shi, J.; Chen, X.; Cui, Z. A high plant density reduces the ability of maize to use soil nitrogen. PLoS ONE 2017, 12, e0172717. [Google Scholar] [CrossRef]
  39. Mahdi, A.H.; Ismail, S.K. Maize productivity as affected by plant density and nitrogen fertilizer. Int. J. Curr. Microbiol. Appl. Sci. 2015, 4, 870–877. [Google Scholar]
  40. Ciampitti, I.A.; Vyn, T.J. A comprehensive study of plant density consequences on nitrogen uptake dynamics of maize plants from vegetative to reproductive stages. Field Crop. Res. 2011, 121, 2–18. [Google Scholar] [CrossRef]
  41. Tokatlidis, I.S.; Koutroubas, S.D. A review of maize hybrids’ dependence on high plant populations and its implications for crop yield stability. Field Crop. Res. 2004, 88, 103–114. [Google Scholar] [CrossRef]
  42. Staff, S. Keys to Soil Taxonomy; United States Department of Agriculture, Natural Resources Conservation Services: Washington, DC, USA, 1998; p. 328.
  43. Wang, X.B.; Miao, Y.X.; Dong, R.; Chen, Z.C.; Guan, Y.J.; Yue, X.Z.; Fang, Z.; Mulla, D. Developing active canopy sensor-based precision nitrogen management strategies for maize in Northeast China. Sustainability 2019, 11, 706. [Google Scholar] [CrossRef] [Green Version]
  44. Colwell, J.D. Estimating Fertilizer Requirements: A Quantitative Approach; Centre for Agriculture and Bioscience International: Wallingford, UK, 1994. [Google Scholar]
  45. Nelson, D.W.; Sommers, L.E. Determination of total nitrogen in plant material. Agron. J. 1962, 65, 423–425. [Google Scholar] [CrossRef]
  46. Li, W.; He, P.; Jin, J. Critical nitrogen curve and nitrogen nutrition index for spring maize in North-East China. J. Plant Nutr. 2012, 35, 1747–1761. [Google Scholar] [CrossRef]
  47. Sun, Z.; Li, Z.; Lu, X.; Bu, Q.; Ma, X.; Wang, Y. Modeling soil type effects to improve rainfed corn yields in Northeast China. Agron. J. 2016, 108, 498–508. [Google Scholar] [CrossRef]
  48. Wu, D.; Xu, X.; Chen, Y.; Shao, H.; Sokolowski, E.; Mi, G. Effect of different drip fertigation methods on maize yield, nutrient and water productivity in two-soils in Northeast China. Agric. Water Manag. 2019, 213, 200–211. [Google Scholar] [CrossRef]
  49. Xia, T.T.; Miao, Y.X.; Wu, D.L.; Shao, H.; Khosla, R.; Mi, G.H. Active optical sensing of spring maize for in-season diagnosis of nitrogen status based on nitrogen nutrition index. Remote Sens. 2016, 8, 605. [Google Scholar] [CrossRef] [Green Version]
  50. Herrmann, A.; Taube, F. The range of the critical nitrogen dilution curve for maize (Zea mays L.) can be extended until silage maturity. Agron. J. 2004, 96, 1131–1138. [Google Scholar] [CrossRef]
  51. Alotaibi, K.D.; Cambouris, A.N.; St Luce, M.; Ziadi, N.; Tremblay, N. Economic optimum nitrogen fertilizer rate and residual soil nitrate as influenced by soil texture in corn production. Agron. J. 2018, 110, 2233–2242. [Google Scholar] [CrossRef]
  52. Zhao, Y.J. Limiting Factors Identification and Production System Design of Spring Maize for High Yield and High Nitrogen Use Efficiency in Smallholder Farmers’ Fields in the Northeast China—A Case Study in Lishu County. Ph.D. Thesis, China Agricultural University, Beijing, China, 2019. [Google Scholar]
  53. Dong, Q.; Li, M.; Liu, J.; Wang, C. Spatio-temporal evolution characteristics of drought of spring maize in northeast China in recent 50 years. Int. J. Nat. Disasters Health Secur. 2011, 20, 52–59. [Google Scholar]
  54. Lu, X.; Li, Z.; Bu, Q.; Cheng, D.; Duan, W.; Sun, Z. Effects of rainfall harvesting and mulching on corn yield and water use in the corn belt of Northeast China. Agron. J. 2014, 106, 2175–2184. [Google Scholar] [CrossRef]
  55. Chen, Y.; Xiao, C.; Wu, D.; Xia, T.; Chen, Q.; Chen, F.; Mi, G. Effects of nitrogen application rate on grain yield and grain nitrogen concentration in two maize hybrids with contrasting nitrogen remobilization efficiency. Eur. J. Agron. 2015, 62, 79–89. [Google Scholar] [CrossRef]
  56. Ziadi, N.; Cambouris, A.N.; Nyiraneza, J.; Nolin, M.C. Across a landscape, soil texture controls the optimum rate of N fertilizer for maize production. Field Crop. Res. 2013, 148, 78–85. [Google Scholar] [CrossRef]
  57. Power, J.F.; Wiese, R.; Flowerday, D. Managing farming systems for nitrate control: A research review from management systems evaluation areas. J. Environ. Qual. 2001, 30, 1866–1880. [Google Scholar] [CrossRef] [PubMed]
  58. Taylor, J.C.; Wood, G.A.; Earl, R.; Godwin, R.J. Soil factors and their influence on within-field crop variability: II. Spatial analysis and determination of management zones. Biosyst. Eng. 2003, 84, 441–453. [Google Scholar] [CrossRef]
  59. Armstrong, R.D.; Fitzpatrick, J.; Rab, M.A.; Abuzar, M.; Fisher, P.D.; O’Leary, G.J. Advances in precision agriculture in south-eastern Australia: III. Interactions between soil properties and water use help explain spatial variability of crop production in the Victorian Mallee. Crop Pasture Sci. 2009, 60, 870–884. [Google Scholar] [CrossRef]
  60. Shahandeh, H.; Wright, A.L.; Hons, F.M. Use of soil nitrogen parameters and texture for spatially-variable nitrogen fertilization. Precis. Agric. 2011, 12, 146–163. [Google Scholar] [CrossRef]
  61. Ciampitti, I.A.; Roger, W.E.; Joe, L. Corn Growth and Development. Kansas State University Agricultural Experiment Station and Cooperative Extension Service. MF3305. 2016. Available online: https://bookstore.ksre.ksu.edu/pubs/MF3305.pdf (accessed on 18 August 2020).
  62. Meng, Q.; Cui, Z.; Yang, H.; Zhang, F.; Chen, X. Establishing high-yielding maize system for sustainable intensification in China. Adv. Agron. 2018, 145, 85–109. [Google Scholar]
  63. Grundmann, G.L.; Renault, P.; Rosso, L.; Bardin, R. Differential effects of soil water content and temperature on nitrification and aeration. Soil Sci. Soc. Am. 1995, 59, 1342. [Google Scholar] [CrossRef]
  64. Hao, W.P. Influence of Water Stress and Re-Watering on Maize WUE and Compensation Effects. Ph.D. Thesis, Chinese Academy of Agricultural Sciences, Beijing, China, 2013. [Google Scholar]
  65. Xu, C.; Huang, S.; Tian, B.; Ren, J.; Meng, Q.; Wang, P. Manipulating planting density and nitrogen fertilizer application to improve yield and reduce environmental impact in Chinese maize production. Front. Plant Sci. 2017, 8, 1234. [Google Scholar] [CrossRef]
  66. Bean, G.M.; Kitchen, N.R.; Camberato, J.J.; Ferguson, R.B.; Fernandez, F.G.; Franzen, D.W.; Laboski, C.A.M.; Nafziger, E.D.; Sawyer, J.E.; Scharf, P.C.; et al. Improving an active-optical reflectance sensor algorithm using soil and weather information. Agron. J. 2018, 110, 2541–2551. [Google Scholar] [CrossRef] [Green Version]
  67. Pasuquin, J.M.; Pampolino, M.F.; Witt, C.; Dobermann, A.; Oberthür, T.; Fisher, M.J.; Inubushi, K. Closing yield gaps in maize production in southeast ASIA through site-specific nutrient management. Field Crop. Res. 2014, 156, 219–230. [Google Scholar] [CrossRef]
  68. Muschietti-Piana, M.D.P.; Cipriotti, P.A.; Urricariet, S.; Peralta, N.R.; Niborski, M. Using site-specific nitrogen management in rainfed corn to reduce the risk of nitrate leaching. Agric. Water Manag. 2018, 199, 61–70. [Google Scholar] [CrossRef]
  69. Thompson, L.J.; Ferguson, R.B.; Kitchen, N.; Franzen, D.W.; Mamo, M.; Yang, H.; Schepers, J.S. Model and sensor-based recommendation approaches for in-season nitrogen management in corn. Agron. J. 2015, 107, 2020–2030. [Google Scholar] [CrossRef] [Green Version]
  70. Sela, S.; Woodbury, P.B.; van Es, H.M. Dynamic model-based N management reduces surplus nitrogen and improves the environmental performance of corn production. Environ. Res. Lett. 2018, 13, 054010. [Google Scholar] [CrossRef] [Green Version]
Figure 1. The relationships between crop yield and aboveground biomass (a), plant N concentration (b), or N nutrition index (c) for two soils across three years and three planting densities. (Note: the “n” is the number of samples for each soil type, the first equation is for black soil, the second equation is for aeolian sandy soil, * indicate significance at p < 0.05 probability level).
Agronomy 10 01237 g001
Figure 2. The relationships between crop yield and aboveground biomass (a,d,g), plant N concentration (b,e,h), or N nutrition index (c,f,i) in year of 2015 (ac), 2016 (df), and 2017 (gi) for two soils across three planting densities. (Note: the “n” is the number of samples for each soil type, the first equation is for black soil, the second equation is for aeolian sandy soil, * indicate significance at p < 0.05 probability level.
Agronomy 10 01237 g002aAgronomy 10 01237 g002b
Figure 3. The responses of crop yield to N application rate across three years (a), and in specific year of 2015 (b), 2016 (c), and 2017 (d) in two soils across three planting densities. (Note: the “n” is the number of samples for each soil type, the first equation is for black soil, the second equation is for aeolian sandy soil, * indicate significance at p < 0.05 probability level, the lowercase letters in the table indicate the significant difference at 0.05 level).
Agronomy 10 01237 g003
Figure 4. The variation of economic optimal N rate (EONR) and N use efficiency (NUE) (partial factor productivity (PFP) and agronomic efficiency (AE)) in a specific soil (B: black soil, (a); S: aeolian sandy soil, (b), year (2015, 2016, and 2017), and planting density (D1: 55,000 plant ha−1, D2: 70,000 plant ha−1, and D3: 85,000 plant ha−1). (Note: the “n” is the number of samples for EONR, PFP, and AE respectively).
Agronomy 10 01237 g004
Figure 5. The relationships for measured and predicted soil-year-density specific economic optimal N rates (a) or yield (b) using soil, weather, and planting information (Note: the “n” is the number of samples, EONR = 101.24 × TN + 100.68 × GDD − 10.12 × APP + 0.57 × D − 164796.76, Y = 6.74 × TN + 0.91 × GDD − 0.09 × APP + 0.02 × D − 1486.83, where EONR is economic optimal N rate, Y is grain yield, TN is soil total N, GDD is growing degree days, APP is accumulated precipitation, D is planting density).
Agronomy 10 01237 g005
Figure 6. The comparison of the N rates (a), yield (b), net return (c), partial factor productivity (PFP, d), agronomic efficiency (AE, e), and recovery efficiency (RE, f) from different N management strategies at specific soil type across three years. (Note: CK: zero N rate, FNR: farmer application N rate, RONR: regional optimal N rate, SS-EONR: soil-specific economic optimal N rate, SYS-EONR: soil- year-specific economic optimal N rate, SYDS-EONR: soil-year- density-specific economic optimal N rate. The “n” is the number of samples for each N management strategies at specific soil type respectively. The lowercase letters in the table indicate the significant difference at 0.05 level (p < 0.05)).
Agronomy 10 01237 g006
Table 1. Significance of mean squares in the analysis of variance (ANOVA) of yield, aboveground biomass (AGB), plant N concentration (PNC), and N nutrition index (NNI) across two soil types (S), three years (Y), three densities (D), and six N rates (N).
Source of VariationDfSignificance of Mean Square
YieldAGBPNCNNI
Soil (S)1************
Year (Y)2************
Density (D)2ns***nsns
Nitrogen (N)5************
S × Y2************
S × D2nsns**
S × N5***********
Y × D4***nsns
Y × N9************
D × N10nsnsnsns
S × Y × D4nsnsns**
S × Y × N9ns*******
S × D × N10nsnsnsns
Y × D × N18nsnsnsns
S × Y × D × N18nsnsnsns
Note: *, **, and *** indicate significance at p < 0.05, p < 0.01, and p < 0.001 probability levels, respectively. ns was non-significant (p > 0.05).
Table 2. The multiple comparisons of maize yield, net return (NR), aboveground biomass (AGB), plant N concentration (PNC), N nutrition index (NNI), and N surplus (NS) at two soil types (S), three years (Y), three densities (D), and six N rates (N) respectively.
ItemsTreatmentsYieldAGBPNCNNI
(t ha−1)(t ha−1)(kg kg−1)
SoilB10.22 ± 0.24 a18.73 ± 0.45 a8.85 ± 0.11 b0.85 ± 0.01 a
S6.79 ± 0.17 b12.82 ± 0.32 b10.16 ± 0.15 a0.79 ± 0.01 b
Year20158.05 ± 0.30 b16.25 ± 0.53 a9.29 ± 0.18 b0.87 ± 0.01 a
20169.13 ± 0.31 a16.99 ± 0.59 a9.37 ± 0.15 ab0.78 ± 0.02 b
20178.26 ± 0.29 b14.16 ± 0.52 b9.82 ± 0.18 a0.81 ± 0.02 b
DensityD18.44 ± 0.29 a14.87 ± 0.53 b9.65 ± 0.18 a0.80 ± 0.02 a
D28.48 ± 0.32 a15.68 ± 0.56 ab9.45 ± 0.17 a0.82 ± 0.02 a
D38.59 ± 0.32 a16.78 ± 0.58 a9.41 ± 0.17 a0.83 ± 0.02 a
NitrogenN04.57 ± 0.28 e9.26 ± 0.50 e7.15 ± 0.09 e0.58 ± 0.02 e
N17.12 ± 0.21 d12.80 ± 0.42 d8.50 ± 0.14 d0.68 ± 0.01 d
N28.95 ± 0.30 c15.81 ± 0.58 c9.68 ± 0.16 c0.82 ± 0.01 c
N39.88 ± 0.34 b18.40 ± 0.59 b10.32 ± 0.17 b0.92 ± 0.01 b
N410.28 ± 0.35 ab19.58 ± 0.66 ab10.81 ± 0.16 a0.99 ± 0.01 a
N511.08 ± 0.37 a20.33 ± 0.74 a11.08 ± 0.19 a0.99 ± 0.01 a
Note: the notation for treatments within soil (B: black soil, S: aeolian sandy soil), year, density (D1: 55,000 plant ha−1, D2: 70,000 plants ha−1, and D3: 85,000 plants ha−1), and nitrogen (N0: 0 kg ha−1, N1: 60 kg ha−1, N2: 120 kg ha−1, N3: 180 kg ha−1, N4: 240 kg ha−1, and N5: 300 kg ha−1). The number behind “±” is the standard error, and numbers for the same item followed by different letters indicate significant differences (p < 0.05).
Table 3. The comparison of the N rate, yield, net return, partial factor productivity (PFP), agronomic efficiency (AE), and recovery efficiency (RE) from different N management strategies across soils and years.
ManagementN Rate
(kg ha−1)
Yield
(t ha−1)
Net Return ($ ha−1)PFP
(kg kg−1)
AE
(kg kg−1)
RE
(%)
CK0 ± 0 d4.77 ± 0.80 b459 ± 100 c
FNR300 ± 0 a10.07 ± 1.02 a1508 ± 155 b33.57 ± 3.40 c17.67 ± 3.12 b53.79 ± 7.71 a
RONR240 ± 0 b10.33 ± 1.16 a1612 ± 190 a43.03 ± 4.83 bc23.15 ± 4.28 ab57.48 ± 7.22 a
SS-EONR225 ± 18 bc10.45 ± 1.14 a1664 ± 167 a45.93 ± 2.18 b25.05 ± 3.81 ab56.18 ± 7.85 a
SYS-EONR211 ± 25 bc10.48 ± 1.14 a1685 ± 161 a51.15 ± 3.71 ab26.81 ± 3.15 ab56.50 ± 7.99 a
SYDS-EONR187 ± 25 c10.34 ± 1.13 a1671 ± 157 a57.46 ± 4.14 a29.52 ± 3.11 a58.23 ± 8.31 a
Note: CK: check, zero N rate; FNR: farmer N rate; RONR: regional optimal N rate, SS-EONR: soil-specific economic optimal N rate; SYS-EONR: soil-, and year-specific economic optimal N rate; SYDS-EONR: soil-, year- and density-specific economic optimal N rate. The number behind “±” is the standard error. Different lowercase letters in the same column indicate significant difference at 0.05 level (p < 0.05).

