Article

Biochar Application in Combination with Inorganic Nitrogen Improves Maize Grain Yield, Nitrogen Uptake, and Use Efficiency in Temperate Soils

1
Department of Plant and Soil Sciences, Oklahoma State University, Stillwater, OK 74078, USA
2
Department of Agronomy, Faculty of Agriculture and Environment, Gulu University, P.O. Box 166 Gulu, Uganda
*
Author to whom correspondence should be addressed.
Submission received: 26 July 2020 / Revised: 16 August 2020 / Accepted: 21 August 2020 / Published: 23 August 2020

Abstract

:
Biochar (B) has shown promise in improving crop productivity. However, its interaction with inorganic nitrogen (N) in temperate soils is not well-studied. The objective of this paper was to compare the effect of fertilizer N-biochar-combinations (NBC) and N fertilizer (NF) on maize (Zea mays L.) grain yield, N uptake, and N use efficiency (NUE). Trials were conducted in 2018 and 2019 at Efaw and Lake Carl Blackwell (LCB) in Oklahoma, USA. A randomized complete block design with three replications and ten treatments consisting of 50, 100, and 150 kg N ha−1 and 5, 10, and 15 Mg B ha−1 was used. At LCB, yield, N uptake, and NUE under NBC increased by 25%, 28%, and 46%, respectively compared to NF. At Efaw, yield, N uptake, and NUE decreased under NBC by 5%, 7%, and 19%, respectively, compared to NF. Generally, results showed a significant response to NBC at ≥10 Mg B ha−1. While results were inconsistent across locations, the significant response to NBC was evident at LCB with sandy loam soil but not Efaw with silty clay loam. Biochar application with inorganic N could improve N use and the yield of maize cultivated on sandy soils with poor physical and chemical properties.

1. Introduction

Nitrogen (N) fertilizer management is one of the most challenging tasks for cereal farmers around the world with agronomic, economic, and/or environmental complexities [1,2]. The increasing rate of nitrous oxide and other greenhouse gas emissions to the atmosphere, as a result of fertilizer N application, has called for numerous approaches to decrease the threat to the environment [3]. Current campaigns and strategies are geared toward reducing the emissions of greenhouse gases from agricultural fields alongside increasing crop yield [4,5,6]. The production of biochar is presently seen as a noble approach to lock carbon in a more stable form that can last in soil for an extended period of time [7,8]. Biochar is a stable carbon-rich and highly porous material formed through pyrolysis of bio-based or organic materials [9,10]. Generally, it is referred to as “biomass-derived black carbon” or “charcoal” with potential to act as a sink for atmospheric carbon dioxide over an extended period of time [11]. Due to recent interest in its use as a soil amendment, some researchers have referred to it as “agrichar” or charcoal for agricultural use [12,13,14]. Apparently, large-scale commercial application of biochar as a soil amendment is still limited mainly because it is not a very profitable soil-improving practice [15]. Earlier laboratory and/or greenhouse studies on the importance of biochar as a soil amendment have “set the stage” for field investigations with highly variable and hard-to-control environmental conditions.
Biochar is reported to offer immediate benefits to farmers by improving soil physical and chemical properties [11]. These include, among others, water retention capacity, cation exchange capacity, and soil pH that ultimately contribute to improved soil fertility [5,16]. These benefits directly translate to increased crop biomass and grain yield. For instance, Jeffery et al. [17], in a quantitative review, reported a 10% mean increase in crop yield in fields with applied biochar. The authors noted that the crop yield increase varied majorly depending on the type of soil and the materials used as pyrolysis feedstock. However, Asai et al. [18], while complementing the benefits of biochar as a soil amendment, noted that optimum crop grain yield can be achieved through application of biochar in combination with inorganic fertilizers. This is true, especially as N is always limited within the biochar fraction. Research conducted in the central great plain of China recorded increases in maize (Zea mays L.) grain yield of 8.8 and 12.1% when wheat straw biochar was applied at a rate of 20 and 40 Mg ha−1, respectively, in combination with a uniform rate of 300 kg N ha−1 [19]. In a four-year experiment, Major et al. [20] did not observe any significant yield increase within the first year when biochar was used as a sole source of soil amendment. At 20 Mg ha−1 of biochar, 20, 30, and 140% yield increases were observed in the second, third, and fourth years, respectively. The increases in crop yield have been generally attributed to improved soil fertilizer N uptake and N use efficiency (NUE). Omara et al. [21] recently estimated the NUE in cereal production to be low (35%). The low NUE is due to numerous loss pathways including leaching losses, run-off, volatilization, and denitrification among others. Biochar application to the soil is believed to greatly reduce N fertilizer loss because of its high sorption capacity [22]. In addition, biochar is also known to increase the anion exchange capacity of the soil due to the presence of pyridinium and oxonium groups, and the protonation of aromatic rings [23].
As much as biochar application to the soil contributes to crop grain yield increase, it is important to note that its ability to achieve the desired cereal crop grain yield in an intensive mono-cropping system is limited [18]. If biochar is a sole external crop nutrient source, one needs to apply unrealistically high rates to achieve certain desired yield levels. Some researchers have documented up to 100 Mg ha−1 of biochar application to obtain the desired optimum yield levels [17]. In the real world, no farmer will have time and resources to apply these rates while still expecting good returns on investments. Secondly, biochar is limited in the quality of nutrient content. The nature of the feedstock and pyrolysis parameters will largely dictate its plant nutrient status. Increasing process temperatures above 300 °C increases the availability of ash minerals like potassium, magnesium, and calcium, among others, while limiting volatile nutrients like nitrogen, chlorine, and sulfur within the biochar fraction [24,25]. Irrespective of pyrolysis conditions, and the type and nature of the feedstock, certain specific biochar properties responsible for improving crop productivity are compromised during its production. Hence, application of biochar alone as a soil amendment is not adequate to contribute to the improvement in crop production. Clare et al. [26] recommended that biochar research should shift away from on-farm production and application of pure biochar and toward a combined biochar-inorganic fertilizer product, as commercially produced biochar is uneconomical when used independently. In addition, use of pine-wood biochar as a soil amendment in temperate soils has not been widely investigated. Investigating different rates of fast-pyrolysis pine-wood biochar applied in combination with mineral fertilizer N could establish possible synergies from the two input sources. The objective of this study was to evaluate the effect of combined biochar-N fertilizer on maize grain yield, grain N uptake, and grain NUE.

2. Materials and Methods

2.1. Experimental Sites

Field trials were conducted for two years in the summer cropping season of 2018 and 2019 at two locations: Efaw Agronomy Research Station (36°08′12.6′′ N 97°06′25.8′′ W) and Lake Carl Blackwell research farm (36°08′58.0′′ N 97°17′19.3′′ W), all located near Stillwater, Oklahoma, USA. Efaw Agronomy Research Station is on an Ashport silty clay loam (fine-silty, mixed, superactive, thermic Fluventic Haplustoll) soil. Lake Carl Blackwell is situated on a Pulaski fine-sandy loam (coarse/loamy, mixed nonacid, thermic Udic Ustifluvent) soil [27]. Total rainfall and average air temperature at the experimental locations were computed for the maize growing period (April to September) using data obtained from The Oklahoma Mesonet, www.mesonet.org (Table 1). In addition, the 10 year-average (2008 to 2017) monthly rainfall and average temperature prior to the first year of the trial setup were compiled for both experimental sites.

2.2. Experimental Design

The study used a randomized complete block experimental design with three replications. The ten treatments used consisted of 3 levels of N fertilizers (50, 100, and 150 kg N ha−1) and three levels of biochar (5, 10, and 15 Mg B ha−1). Treatment 1 was a control; treatments 2, 3, and 4 consisted of 50, 100, and 150 kg N ha−1, respectively; treatment 5, 6, and 7 consisted of 5, 10, and 15 Mg B ha−1, respectively; treatment 8, 9, and 10 consisted of N-biochar-combinations 50, 100, and 150 kg N ha−1 and 5, 10, and 15 Mg B ha−1, respectively. Biochar was obtained from Wakefield Agricultural Carbon (Columbia, MO, USA), a USDA-certified biochar-producing company. Physical and chemical properties of the supplied soft wood (Southern Yellow Pine) biochar and the initial soil conditions are included in Table 2.
All the N and biochar treatments were applied prior to maize planting. Nitrogen was applied as urea ammonium nitrate—UAN (28:0:0). Following N application, biochar was surface-applied and incorporated into a 15 cm soil depth using a disc ripper. All N and biochar were applied pre-plant each year reported in this study. This incorporation ensured an in-depth mixing of the biochar-N fertilizer complex with soil materials for the respective treatment rates.

2.3. Experimental Management

Maize hybrid P1690AM (DuPont Pioneer, Johnston, IA, USA) was planted for all treatments with row and intra-row spacings of 0.76 and 0.17 m, respectively, using a John Deere MaxEmerge 2 Vacuum Planter (John Deere, Moline, IL, USA). Each plot consisted of four rows where the center 2 rows were harvested and the two outside were considered border rows. A uniform plot size for each treatment of 9 m2 was used across all replications and experimental sites. Post-emergence herbicide glyphosate was applied at a rate of 1.5 to 2 L as active ingredient and at 120 L ha−1 of solution, for each case depending on the weed pressure to suppress weed growth. At the V8 maize development stage, experimental plots were mechanically spot-weeded using a hand hoe.

2.4. Data Collection and Analysis

Maize grain was harvested from experimental plots at maturity using an 8-XP Kincaid Plot Combine (Kincaid, Haven, KS, USA). Grain yields were adjusted to 12.5% moisture content. Sub-samples, about ½ kg, were collected for each plot and dried in an oven at 65 °C for 48 h. Samples were ground to pass a 1 mm sieve size. Finely ground grain was achieved by rolling in a bottle with stainless-steel rods for 24 h before analysis for total N that was accomplished using dry combustion analysis [28]. A LECO Truspec CN dry combustion analyzer LECO CN628 (LECO Inc., St. Joseph, MI, USA) was used. In each case, 150 mg of the grain sample by treatment and replication was weighed, wrapped in aluminum foil, and combusted at 950 °C. Grain N uptake was determined by multiplying the percent grain N with the harvested grain yield according to Equation (1).
Grain   N   uptake = Harvested   yield   × Percent   N   content
Grain nitrogen use efficiency (NUE) was calculated according to Raun and Johnson [29]. The difference method was adopted as described by Equation (2).
NUE = Grain   N   uptake   ( fertilized ) Grain   N   uptake   ( unfertilized ) Total   fertilizer   N   applied   ×   100

2.5. Statistical Analysis

The GLM procedure from the SAS package was used for analysis of variance [30]. For all response variables, the difference between treatment means from biochar (B), nitrogen-biochar combination (NBC), and nitrogen fertilizer (NF) was compared using single-degree-of-freedom orthogonal contrasts [31,32]. The standard error (SE) of means for each treatment and the coefficient of variation (CV) were used to indicate the precision of measurement and the extent of variability within and between groups, respectively. Charts, produced using MS Excel (2016), were used to show visual differences in percentage difference (PD) in all response variables between NBC and NF calculated according to Equation (3). A positive difference indicates an NBC advantage over NF while a negative difference indicates an NF advantage over NBC.
PD   = NBC NF NBC   ×   100

3. Results

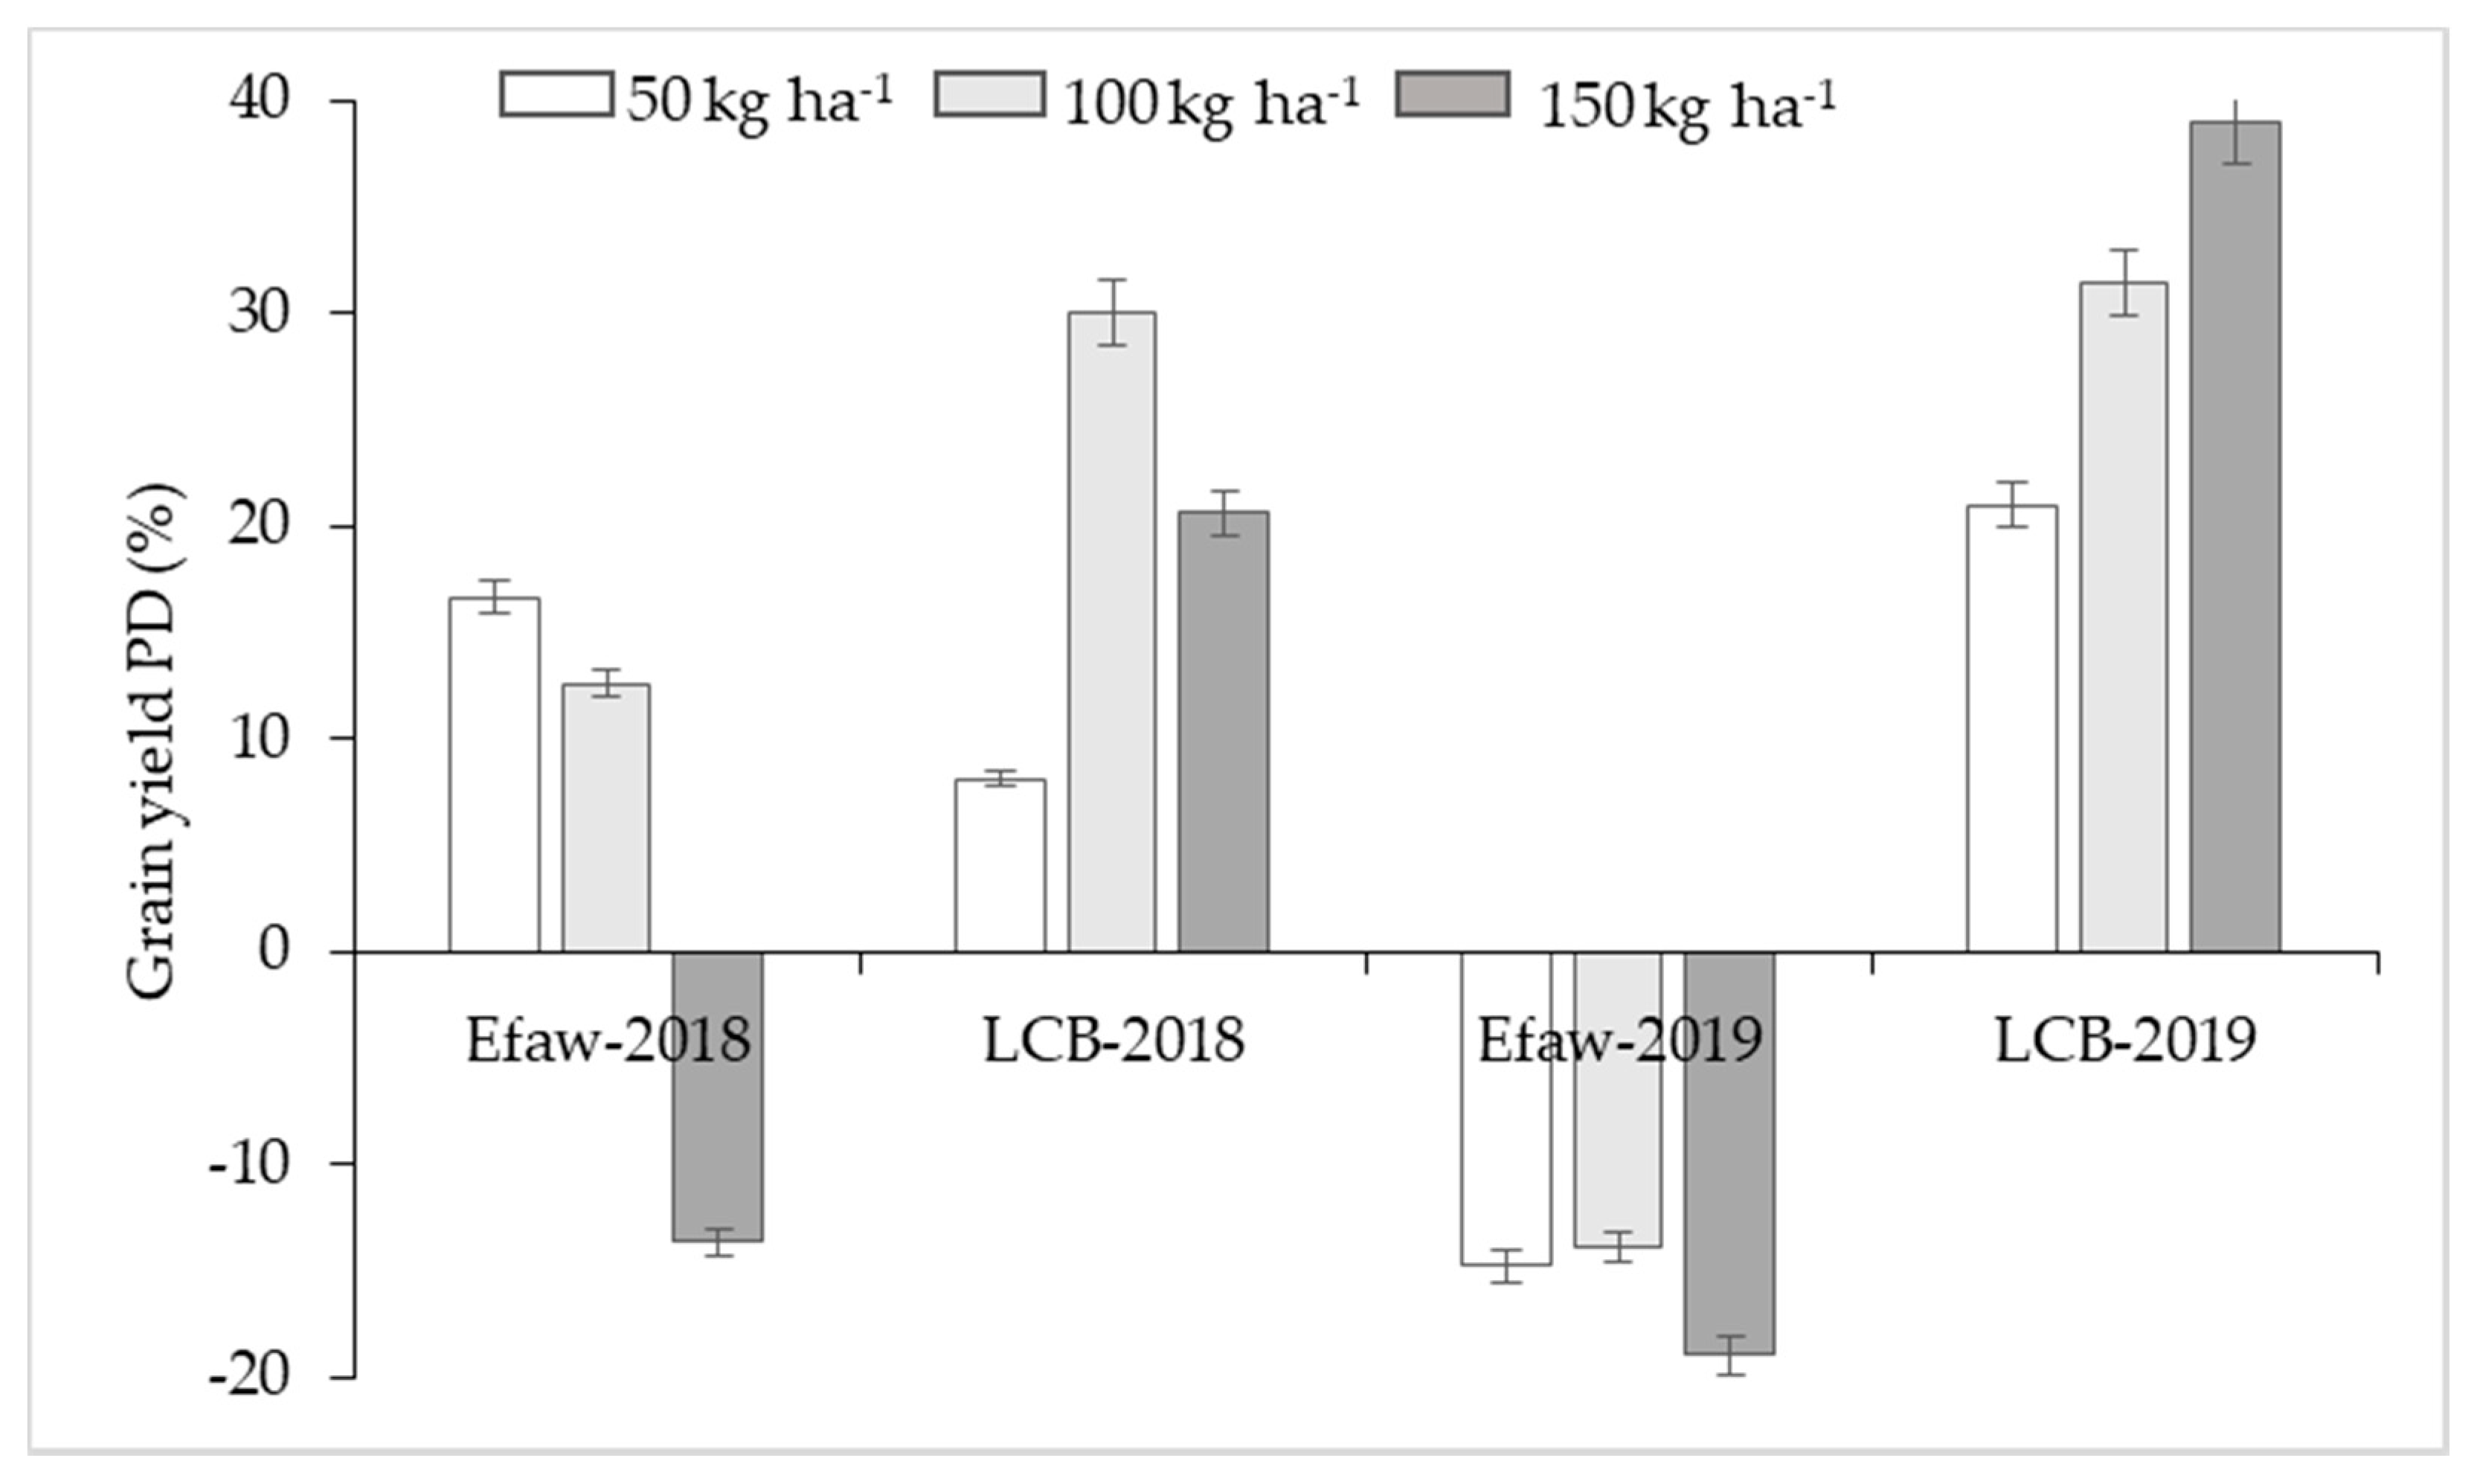
3.1. Maize Grain Yield

At Efaw, an analysis of variance for maize grain yield in 2018 showed an overall significant difference (p = 0.0023) between treatments (Table 3). However, differences between nitrogen-biochar-combination (NBC) and nitrogen fertilizer (NF) could not be established using orthogonal contrasts at each fertilizer rate. With N applied at 50 and 100 kg N ha−1, NBC increased the grain yield by 17 and 13%, respectively, when compared to the same rates under NF. At 150 kg N ha−1, grain yield was lower under NBC by 14% when compared to NF (Figure 1). Grain yield under both NBC and NF was significantly higher than observed at the control. The highest yield in 2018 of 7.3 Mg ha−1 was attained under NF at 150 kg N ha−1 and the lowest of 3.5 Mg ha−1 was obtained in the control plot with 0 kg N ha−1 and 0 kg biochar ha−1 applied.
In 2019, similar observations were made with an overall significant difference (p = 0.0124) in grain yield between treatments (Table 3). However, no difference could be established between NBC and NF using contrasts. At each fertilizer rate, NBC decreased the grain yield by 15, 14, and 19% at 50, 100, and 150 kg N ha−1, respectively (Figure 1). The grain yield under both NBC and NF was significantly higher than observed at the control. The highest yield in 2019 of 2.3 Mg ha−1 was harvested at 150 kg N ha−1 under NF while the lowest of 1.1 Mg ha−1 was achieved in the control plot. Overall, the observed grain yield in 2019 was lower than in 2018, and this is probably attributed to the water stress at the vegetative stage with up to 430 mm of rainfall in May of 2019 (Table 1). In addition, there was heavy precipitation with over 200 mm experienced in the month of August, which delayed harvest in 2019.
At the Lake Carl Blackwell (LCB) location, analysis of variance showed an overall significant difference (p < 0.0001) between treatments in 2018 (Table 3). Although contrasts did not result in observable differences (p = 0.327) between NBC and NF at 50 kg N ha−1, differences were observed at 100 kg N ha−1 (p = 0.0052) and 150 kg N ha−1 (p = 0.003). The differences at 100 and 150 kg N ha−1 correspond to yield benefits of 30 and 21%, respectively, under NBC compared to NF (Figure 1). While no significant difference was seen at 50 kg N ha−1, NBC still resulted in a yield advantage of 8% compared to NF. Generally, the yield increased with an increase in fertilizer rate where the highest of 5.0 Mg ha−1 was observed at 150 kg N ha−1 under NBC, while the least yield of 2.6 Mg ha−1 was harvested in the control plot and was significantly lower than observed under both NBC and NF.
In 2019, analysis of variance did not show an overall significant difference (p = 0.1264) in grain yield among treatments (Table 3). Contrast analysis did not show significant differences between NBC and NF at 50 kg N ha−1 (p = 0.4311) and 100 kg N ha−1 (p = 0.1544). However, a significant difference was observed at 150 kg N ha−1 (p = 0.0338). The observed differences correspond to yield benefits under an NBC of 21, 31, and 39% at 50, 100, and 150 kg N ha−1, respectively (Figure 1). As observed in 2018, grain yield increased with an increase in fertilizer rate where the highest yield of 2.2 Mg ha−1 was obtained at 150 kg N ha−1 under NBC. The lowest yield of 0.65 Mg ha−1 was obtained in the control plot and was significantly lower than the yield observed under both NBC and NF. Generally, yields at this location were lower in both years compared to Efaw. This is probably due to differences in soil type at the two locations.

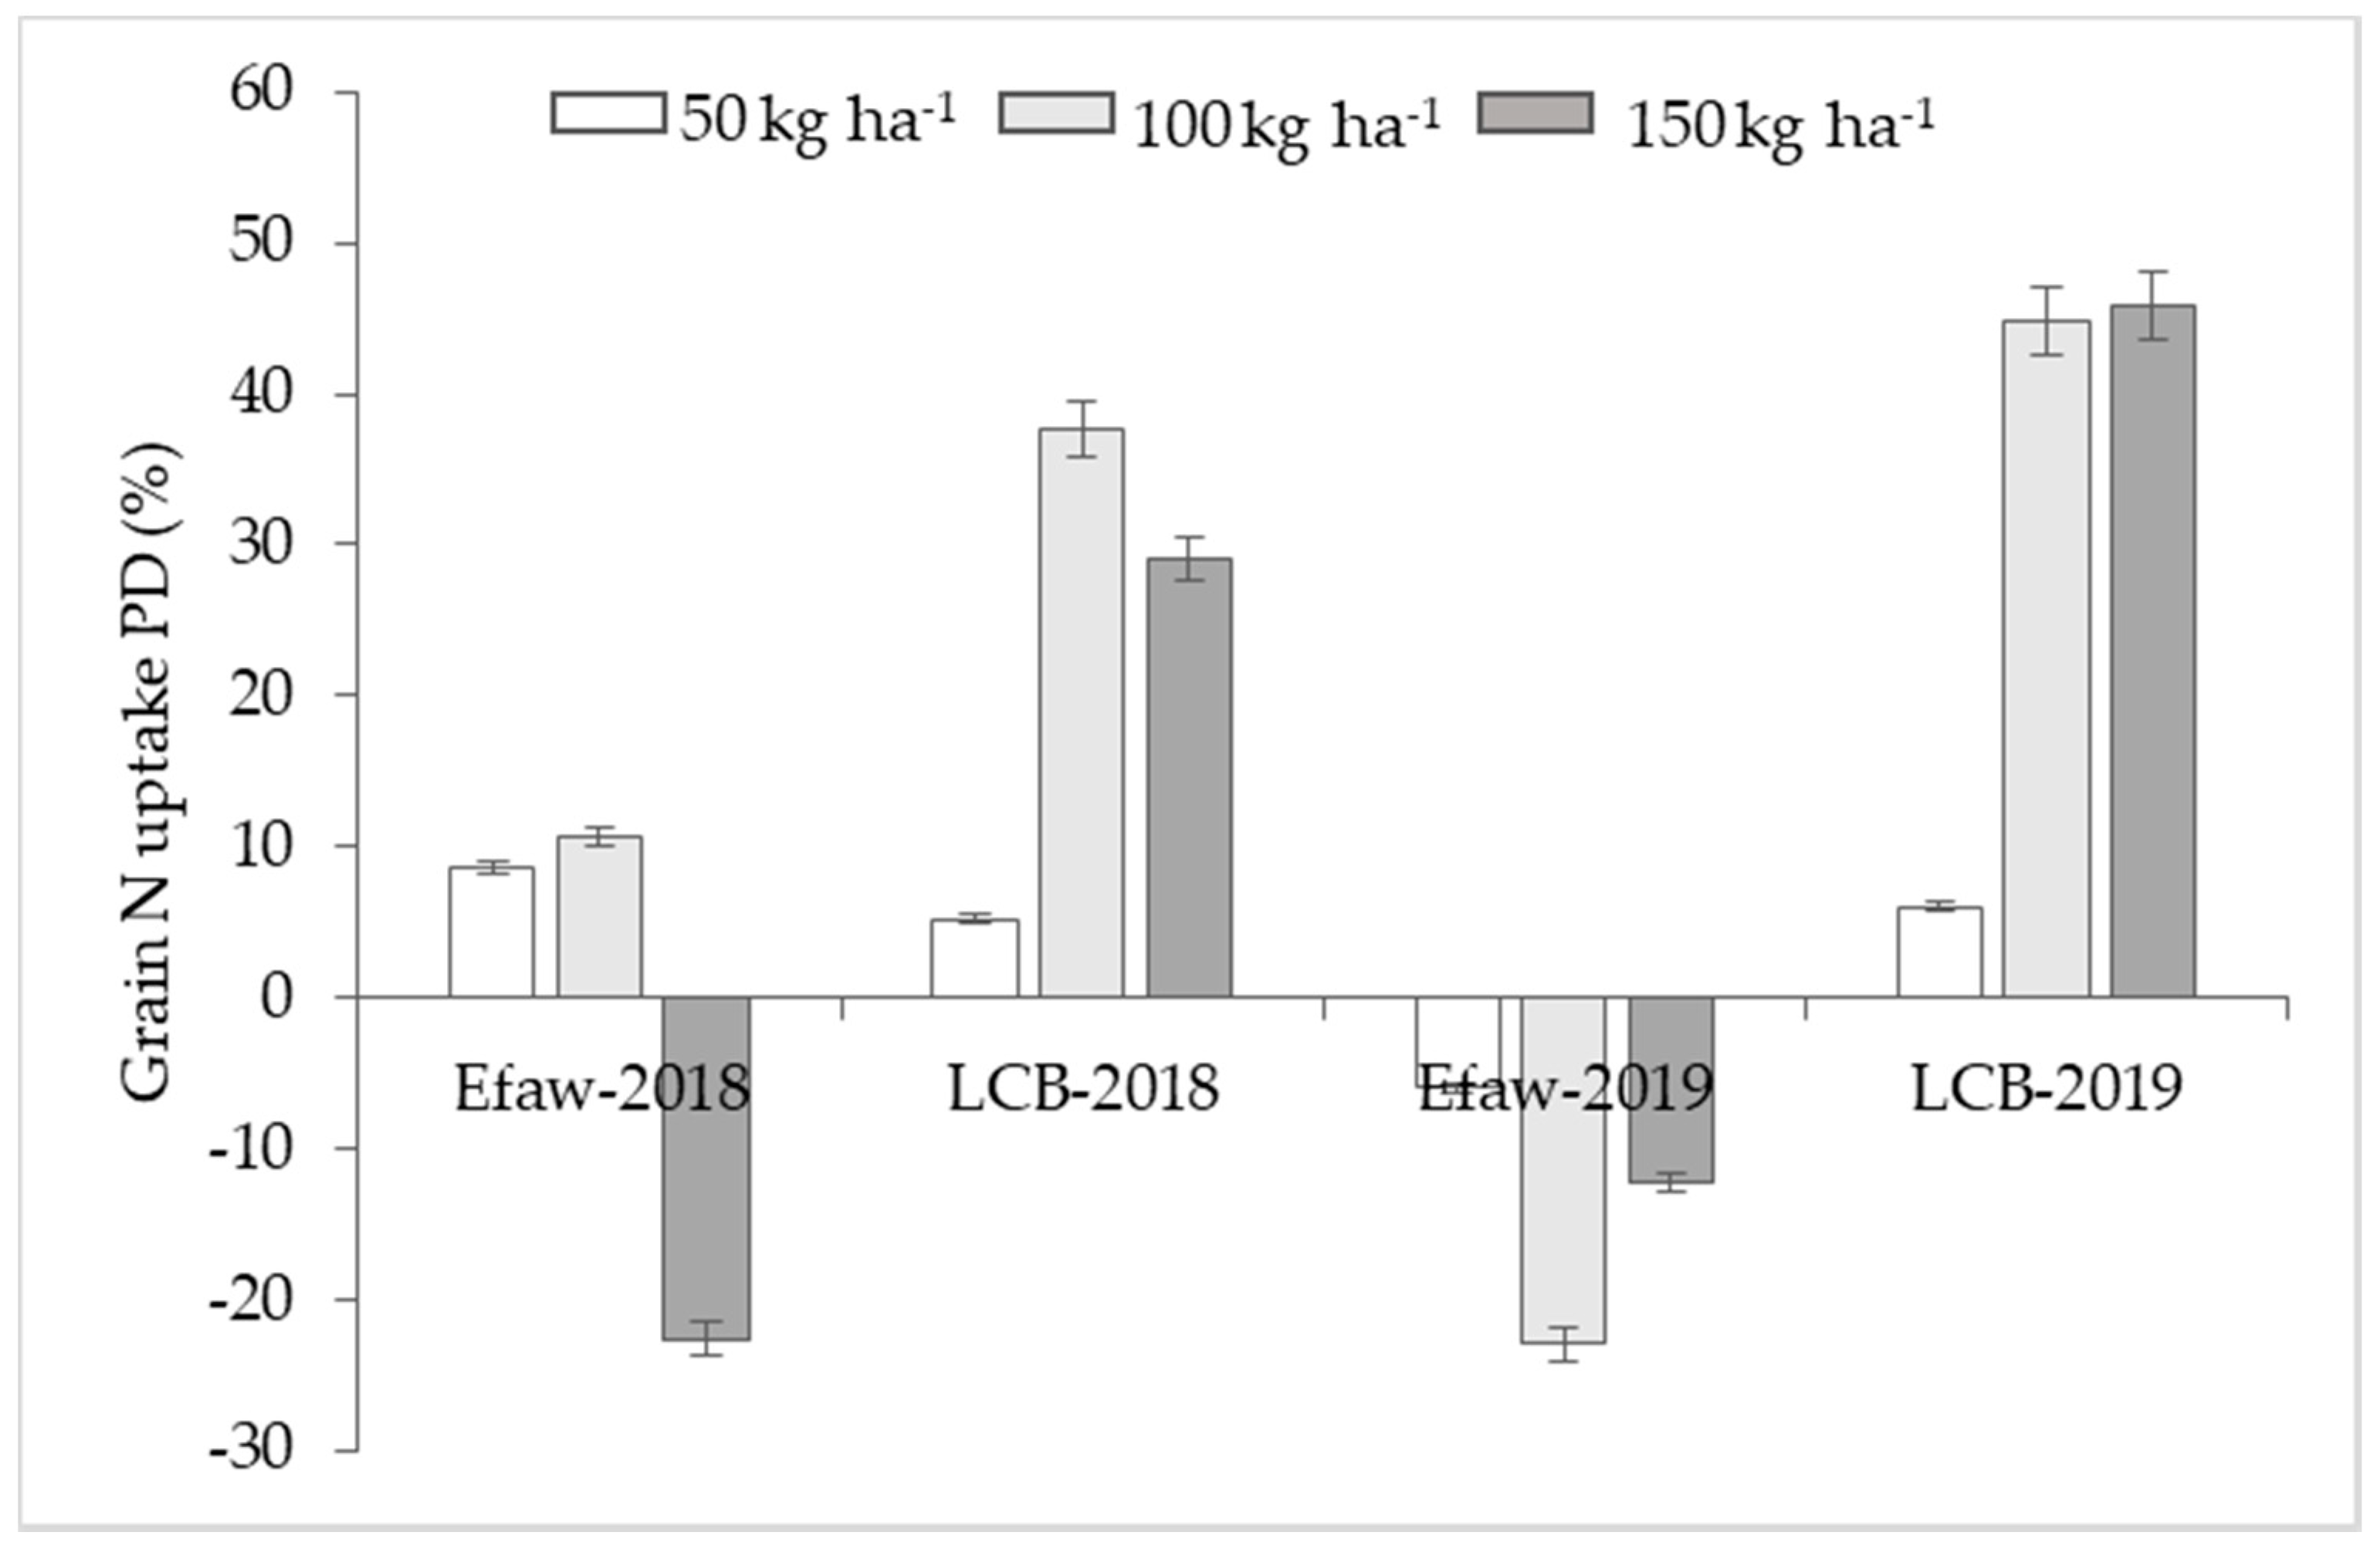
3.2. Grain Nitrogen Uptake

At Efaw, an analysis of variance in 2018 for grain N uptake showed an overall significant difference (p = 0.0003) between treatments (Table 4). However, contrasts did not reveal significant differences between NBC and NF. Nonetheless, when compared to NF at 50 and 100 kg N ha−1, grain N uptake increased with NBC by 9 and 11%, respectively (Figure 2). Conversely, grain N uptake decreased by 23% at 150 kg N ha−1 under NBC compared to NF. The highest grain N uptake in 2018 of 102 kg ha−1 was attained under NF at 150 kg N ha−1 and the lowest of 41 kg ha−1 was obtained in the control plot.
The results in 2019 mirrored those of 2018 with an overall significant difference (p = 0.001) in grain N uptake between treatments (Table 4). At each fertilizer rate, the NBC decreased grain N uptake by 6, 23, and 12% at 50, 100, and 150 kg N ha−1, respectively (Figure 2). The highest grain N uptake of 30 kg ha−1 in 2019 was obtained at 150 kg N ha−1 under NF while the lowest of 12 kg ha−1 was achieved in the control plot and was significantly lower than observed under both NBC and NF. There was an overall low grain N uptake in 2019 compared to 2018, and this can be attributed to the low grain yield harvested in that year.
Analysis of variance at LCB showed an overall significant difference (p < 0.0001) in grain N uptake between treatments in 2018 (Table 4). Using contrasts, significant differences were observed at 100 kg N ha−1 (p = 0.0006) and 150 kg N ha−1 (p = 0.0016), and these correspond to a grain N uptake advantage under an NBC of 38 and 29%, respectively, compared to NF. Although no significant difference (p = 0.6927) was seen at 50 kg N ha−1, the observed benefits under NBC were 5% greater than those under NF (Figure 2). Generally, grain N uptake increased with the increase in fertilizer rate where the highest of 67 kg ha−1 was observed at 150 kg N ha−1 under NBC, while the least grain N uptake of 28 kg ha−1 was obtained at the control plot.
In 2019, an overall significant difference (p = 0.0395) in grain N uptake was seen between treatments (Table 4). The contrast between NBC and NF in 2019 also showed significant differences at 100 kg N ha−1 (p = 0.0258) and 150 kg N ha−1 (p = 0.0071). The observed differences corresponded to a grain N uptake advantage under NBC of 45 and 46% at 100 and 150 kg N ha−1, respectively (Figure 2). Although no significant difference was seen at 50 kg N ha−1 (p = 0.8195), the NBC advantage over NF was still evident with 6% grain N uptake. Like in 2018, grain N uptake increased with an increase in fertilizer rate where the highest of 28 kg ha−1 was obtained at 150 kg N ha−1 under NBC, while the lowest N uptake of 7 kg ha−1 was observed in the control plot. Generally, the grain N uptake at this location was lower in both years compared to Efaw.

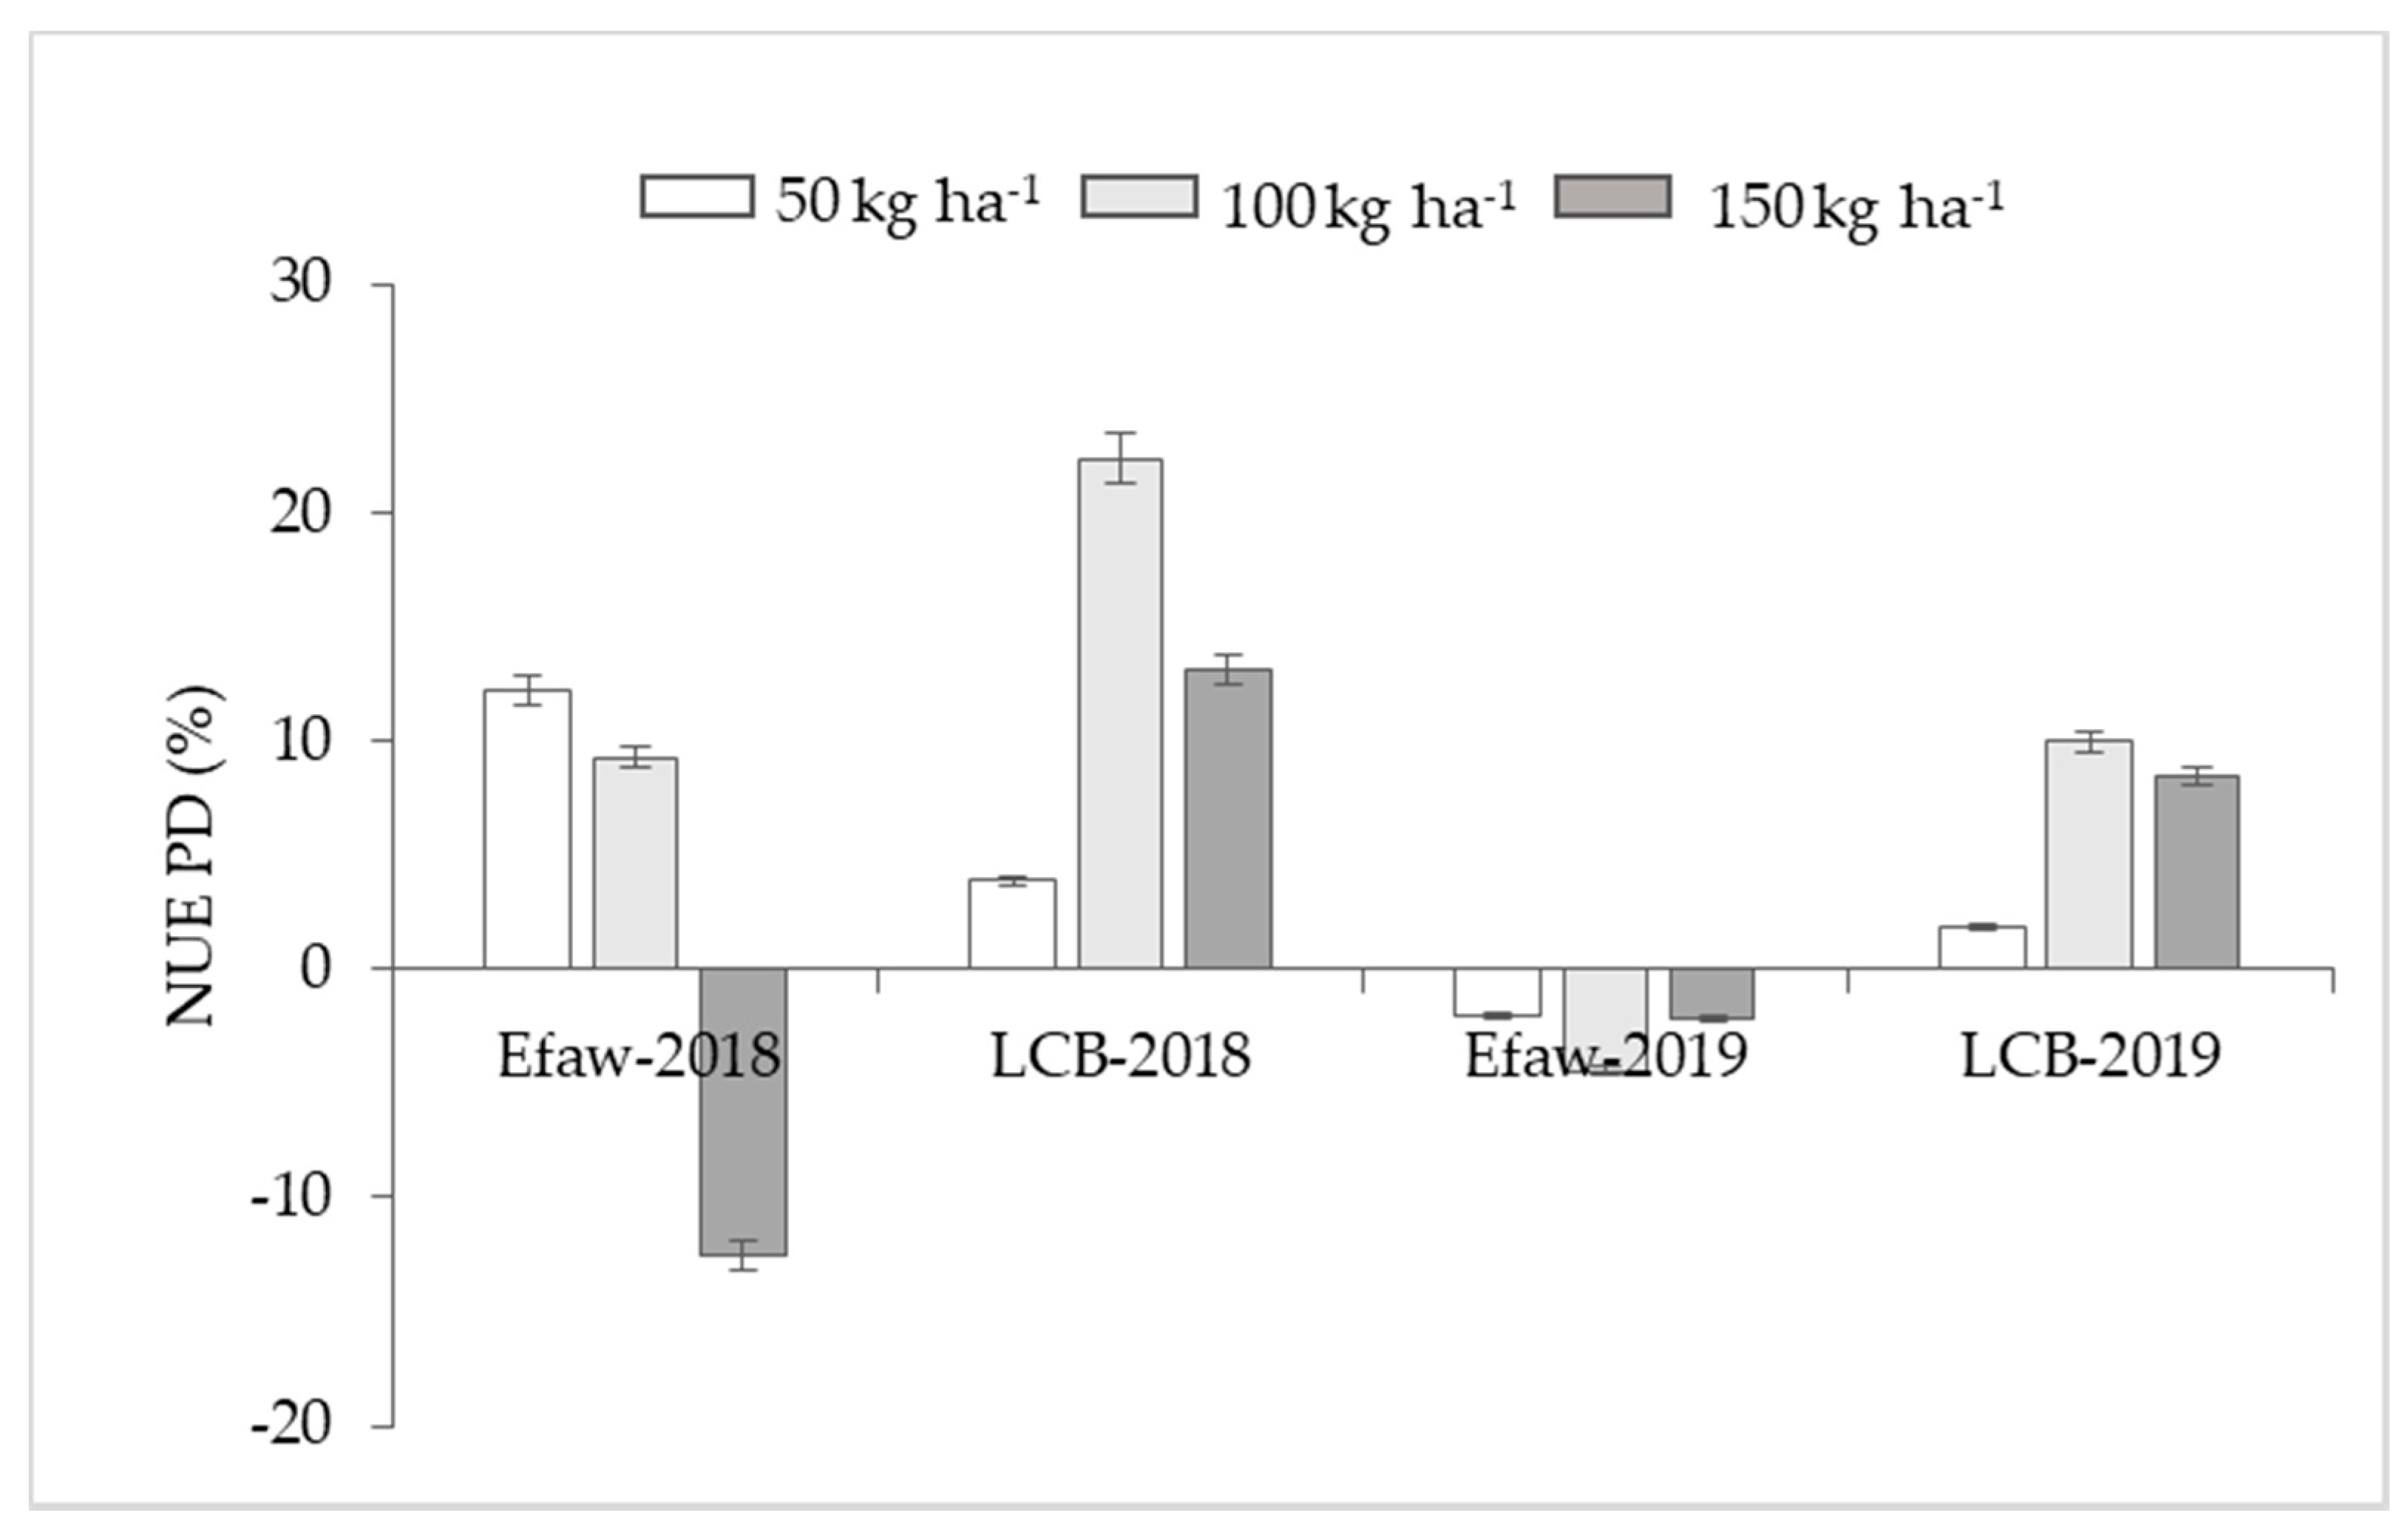
3.3. Grain Nitrogen Use Efficiency

The analysis of variance for the experiment conducted at Efaw in 2018 did not show a significant difference (p = 0.07) in nitrogen use efficiency (NUE) between treatments (Table 5). At each fertilizer rate, the difference between NBC and NF showed a higher NUE under NBC compared to NF at 50 and 100 kg N ha−1 by 12 and 9%, respectively. However, NUE at 150 kg N ha−1 was lower under NBC by 13% compared to NF (Figure 3). The highest NUE of 59% was observed under NBC at 50 kg N ha−1 while the lowest of 28% was also observed under NBC at 150 kg N ha−1. This trend was expected as the absorption and utilization efficiency decrease with fertilizer rate.
Results for the 2019 experiment mirrored those of 2018 where no significant difference (p = 0.85) was observed between treatments (Table 5). At each fertilizer rate, the difference showed that NUE was higher under NF than NBC by 2, 4, and 2% at 50, 100, and 150 kg N ha−1, respectively (Figure 3). No trend for an increase in NUE with fertilizer rate was seen under both NBC and NF. The highest NUE of 12% was observed under NF at 150 kg N ha−1 while the lowest of 7% was observed under NBC at 100 kg N ha−1.
At LCB, results for 2018 showed an overall significant difference (p = 0.0105) in NUE between treatments (Table 5). Contrast analysis showed significant differences between NBC and NF at 100 kg N ha−1 (p = 0.0012) and 150 kg N ha−1 (p = 0.0298). The percentage difference between NBC and NF corresponded to a 22 and 13% higher NUE under NBC compared to NF at 100 and 150 kg N ha−1, respectively. At 50 kg N ha−1, no significant difference (p = 0.4768) was observed but NBC still had a NUE 4% higher than observed under NF (Figure 3). Nitrogen use efficiency was highest (32%) under NBC at 100 kg N ha−1, while the lowest (10%) was also observed at 100 kg N ha−1 under NF.
Results for the 2019 experiment were similar to those of 2018 where analysis of variance showed an overall significant difference (p = 0.0034) in NUE between treatments (Table 5). At each N rate, contrast analysis did not show a significant difference (p = 0.5282) between NUE under NBC and NF at 50 kg N ha−1. However, NBC still had a higher NUE than NF by 1%. Significant differences were observed between NBC and NF at 100 kg N ha−1 (p = 0.0041) and 150 kg N ha−1 (p = 0.0109). The percentage difference between NBC and NF showed a higher NUE under NBC than observed under NF by 10 and 8% at 100 and 150 kg N ha−1, respectively (Figure 3). There was a general trend for NUE to decrease as the N rate was increased under both NBC and NF. This would be expected as the uptake and utilization efficiency reduce with N fertilizer rate. The highest NUE (17%) was observed under NBC at 50 kg N ha−1, while the lowest (6%) was observed under NF at both 100 and 150 kg N ha−1.

4. Discussion

4.1. Maize Grain Yield

The results from this study demonstrate the significant effect of applying a combination of biochar and inorganic nitrogen fertilizer on maize grain yield. However, the yield advantage consequential to the addition of biochar was not consistent across experimental locations. Several reports have documented positive and negative effects of biochar addition on maize grain yield [20,33,34,35]. The disparities in results of the maize grain yield response to biochar addition are attributed to different application rates, soil characteristics, biochar feedstock, and process parameters. For instance, in a greenhouse study, Uzoma et al. [34] observed up to a 150% increase in maize grain yield with 15 Mg ha−1 of cow-manure biochar. Averaged over sites and years, biochar addition in this study led to a 9.8% increase in maize grain yield. A grain yield advantage under biochar amendment was seen with 10 and 15 Mg ha−1 of biochar in combination with 100 and 150 kg N ha−1, respectively, and was more pronounced in a comparatively low-yielding environment (LCB) dominated by sand. This was probably due to the improvement in soil chemical properties such as soil organic carbon and cation exchange capacity that eventually contribute to plant nutrient retention. Agegnehu et al. [35] concluded that the increase in maize grain yield following biochar application was due to improvement in soil nutrient and organic carbon content. The researchers observed that maize grain yield was significantly correlated with soil nutrients. In the same light, Cornelissen et al. [36] found that the base saturation increased by over 50% as a result of the addition of biochar and that impacted maize grain yield. Furthermore, observations by Major et al. [20], who documented 77–320% more available Ca and Mg in the biochar-amended soil, support that increased maize grain yield is due to better nutrient uptake. Therefore, it is probable that the maize grain yield increase from biochar addition in this study was associated with improved soil chemical properties. In addition to enhancing plant nutrients, some authors attribute the increase in crop yield from biochar addition to its ability to raise soil pH, which has an indirect effect on crop nutrient availability [37,38,39]. Such indirect increases in plant nutrients are related to the reduction in toxic Al3+ availability. Although no evidence is presented here to demonstrate the detrimental effect of low pH on maize grain yield in the study sites, biochar significantly increased pH by nearly 0.5 units. However, it is considered unlikely that the observed increase in yield was due to an increase in soil pH following biochar amendment. Besides, similar increases in pH were observed at the site that did not show a significant response in maize yield to biochar addition.

4.2. Grain Nitrogen Uptake

Maize grain N uptake in this study significantly increased after biochar addition. Like those observed with grain yield, these increases were not consistent across experimental sites. Averaged over sites and years, biochar amendments resulted in a 10.3% increase in grain N uptake. This is similar to reports by several authors that documented a positive impact of biochar application on grain N uptake [40,41,42,43]. The improved grain N uptake in this study could have been a result of the positive impact of biochar on the retention of both soil and applied N. In addition to increased N retention in the soil, Zheng et al. [44] added that biochar soil amendment can improve N bioavailability within the soil system. Huang et al. [42] reported that biochar soil amendment resulted in a 25% increase in fertilizer N uptake. The authors measured fertilizer loss and established that biochar addition reduced fertilizer loss by 9.5%. Using just 2.6 Mg ha−1 of biochar pyrolyzed at 300 °C, Rajkovich et al. [41] reported a maize N uptake of 15% under biochar treatment compared to the fully fertilized control. The authors observed a higher N uptake (15%) with just 2.6 Mg ha−1 of biochar than in the current study (10%) probably because their study was conducted under a controlled environment. Therefore, the significant impact of the addition of biochar on grain N uptake in this study is attributed to the improvement in N retention within the soil system similar to findings by other authors. Generally, grain N uptake in 2019 was lower than that observed in 2018, and this is probably attributed to the water stress during the vegetative stage with up to 430 mm of rainfall in May. In addition, the high rainfall could have influenced leaching losses of nitrate leading to low N uptake in 2019.

4.3. Grain Nitrogen Use Efficiency

The positive influence of NUE following biochar soil amendment was not consistent across experimental locations like the observation for grain yield and N uptake. Averaged across sites and years, applying biochar in combination with inorganic N improved NUE by 13.5%. This positive influence of biochar soil amendment on NUE is consistent with reports from several authors [13,44,45,46]. With the premise that increased N retention or decreased N loss with biochar soil amendment enhances crop N uptake, NUE would be expected to improve under such condition. Zheng et al. [44] offered a similar interpretation that increased NUE under biochar soil amendment is credited to the reduction in N leaching and increased N retention. Furthermore, linking improved crop N uptake to increased N bioavailability, as asserted by Zheng et al. [44], suggests adequate justification for improved NUE under biochar soil amendment. Yao et al. [13] expounded that the increased retention of N is attributed to the high sorption capacity of biochar. This offers good agronomic and environmental benefits such as reduced demand of fertilizer for maize growth. Therefore, evidence from the study to support the improvement in NUE under biochar soil amendment is likened to that in the scientific literature.

5. Conclusions

This study examined possible synergistic relationships between biochar and inorganic N fertilizer while trying to optimize maize grain yield, grain N uptake, and NUE under field conditions. Results averaged across experimental sites, N rate, and years showed a positive effect of application of biochar in combination with inorganic N fertilizer as compared to inorganic N as a sole input. This combination increased maize grain yield, grain N uptake, and NUE by 10%, 11%, and 14%, respectively. The positive result was only observed at the LCB site with sandy loam soil at ≥10 Mg B ha−1. Therefore, it is evident from this study that application of biochar in combination with inorganic N vis-a-vis the latter as a sole input could improve N retention, N uptake, and yield of maize cultivated on sandy soils with poor physical and chemical properties. Farmers cultivating small acreages with high proportions of sand could take advantage of the by-product of gasification of pinewood to sustain nutrient use and improve maize yield by applying 15 Mg B ha−1 with 150 kg N ha−1. As there was no biochar advantage on the silty clay loam soil, it is unclear if increasing the rate of biochar in the combination could lead to a significant effect on such soils. On fertile temperate soils, future research could use “designer biochar” with the right mix of feedstock, appropriate pyrolysis conditions, and at higher rates than used in this study.

Author Contributions

Conceptualization, P.O. and W.R.R.; methodology, P.O.; formal analysis, P.O. and E.M.E.; writing—original draft preparation, P.O.; writing—review and editing, W.R.R., L.A., F.B.O. and J.C. All authors have read and agreed to the published version of the manuscript.

Funding

This research received no external funding.

Acknowledgments

The authors would like to acknowledge and sincerely thank Tyler Lynch and Robert Lemings for their assistance with field work.

Conflicts of Interest

The authors declare no conflict of interest.

References

  1. Tilman, D.; Cassman, K.G.; Matson, P.A.; Naylor, R.; Polasky, S. Agricultural sustainability and intensive production practices. Nature 2002, 418, 671–677. [Google Scholar] [CrossRef] [PubMed]
  2. Robertson, G.P.; Swinton, S.M. Reconsiling agricultural productivity and environmental integrity: A grand challange for agriculture. Front. Ecol. Environ. 2005, 3, 38–46. [Google Scholar] [CrossRef]
  3. Stavins, R.N. The costs of carbon sequestration: A revealed-preference approach. Am. Econ. Rev. 2017, 89, 994–1009. [Google Scholar] [CrossRef] [Green Version]
  4. Alluvione, F.; Bertora, C.; Zavattaro, L.; Grignani, C. Nitrous oxide and carbon dioxide emissions following green manure and compost fertilization in corn. Soil Sci. Soc. Am. J. 2010, 74, 384–395. [Google Scholar] [CrossRef]
  5. Singh, B.P.; Hatton, B.J.; Singh, B.; Cowie, A.L.; Kathuria, A. Influence of biochars on nitrous oxide emission and nitrogen leaching from two contrasting soils. J. Environ. Qual. 2010, 39, 1224. [Google Scholar] [CrossRef]
  6. Jones, C.M.; Kammen, D.M. Quantifying carbon footprint reduction opportunities for U.S. households and communities. Environ. Sci. Tech. 2011, 45, 4088–4095. [Google Scholar] [CrossRef]
  7. Crombie, K.; Mašek, O.; Sohi, S.P.; Brownsort, P.; Cross, A. The effect of pyrolysis conditions on biochar stability as determined by three methods. GCB Bioenergy 2013, 5, 122–131. [Google Scholar] [CrossRef] [Green Version]
  8. Jindo, K.; Mizumoto, H.; Sawada, Y.; Sánchez-Monedero, M.Á.; Sonoki, T. Physical and chemical characterization of biochars derived from different agricultural residues. Biogeosciences 2014, 6613–6621. [Google Scholar] [CrossRef] [Green Version]
  9. Chan, K.Y.; Zwieten, L.V.; Meszaros, I.; Downie, A.; Joseph, S. Agronomic values of green waste biochar as a soil amendment. Soil Res. 2007, 45, 629–634. [Google Scholar] [CrossRef]
  10. Woolf, D.; Amonette, J.E.; Street-Perrott, F.A.; Lehmann, J.; Joseph, S. Sustainable biochar to mitigate global climate change. Nat. Commun. 2010, 1, 1–9. [Google Scholar] [CrossRef] [Green Version]
  11. Lehmann, J.; Gaunt, J.; Rondon, M. Bio-Char sequestration in terrestrial ecosystems—A Review. Mitig. Adapt. Strat. Glob. 2006, 11, 403–427. [Google Scholar] [CrossRef]
  12. Laine, J. Perspective of the preparation of agrichars using fossil hydrocarbon coke. Renew. Sust. Energy Rev. 2012, 16, 5597–5602. [Google Scholar] [CrossRef]
  13. Yao, Y.; Gao, B.; Zhang, M.; Inyang, M.; Zimmerman, A.R. Effect of biochar amendment on sorption and leaching of nitrate, ammonium, and phosphate in a sandy soil. Chemosphere 2012, 89, 1467–1471. [Google Scholar] [CrossRef] [PubMed]
  14. Abewa, A.; Yitaferu, B.; Selassie, Y.G.; Amare, T.T. The role of biochar on acid soil reclamation and yield of teff (Eragrostis Tef [Zucc] Trotter) in Northwestern Ethiopia. J. Agric. Sci. 2013, 6, 1–12. [Google Scholar] [CrossRef]
  15. Maroušek, J.; Strunecký, O.; Stehel, V. Biochar farming: Defining economically perspective applications. Clean. Tech. Environ. Policy 2019, 21, 1389–1395. [Google Scholar] [CrossRef]
  16. Atkinson, C.J.; Fitzgerald, J.D.; Hipps, N.A. Potential mechanisms for achieving agricultural benefits from biochar application to temperate soils: A Review. Plant Soil 2010, 337, 1–18. [Google Scholar] [CrossRef]
  17. Jeffery, S.; Verheijen, F.G.A.; van der Velde, M.; Bastos, A.C. A quantitative review of the effects of biochar application to soils on crop productivity using meta-analysis. Agric. Ecosyst. Environ. 2011, 144, 175–187. [Google Scholar] [CrossRef]
  18. Asai, H.; Samson, B.K.; Stephan, H.M.; Songyikhangsuthor, K.; Homma, K.; Kiyono, Y.; Inoue, Y.; Shiraiwa, T.; Horie, T. Biochar amendment techniques for upland rice production in Northern Laos: 1. Soil physical properties, leaf SPAD and grain yield. Field Crop Res. 2009, 111, 81–84. [Google Scholar] [CrossRef]
  19. Zhang, A.; Liu, Y.; Pan, G.; Hussain, Q.; Li, L.; Zheng, J.; Zhang, X. Effect of biochar amendment on maize yield and greenhouse gas emissions from a soil organic carbon poor calcareous loamy soil from central china plain. Plant Soil 2012, 351, 263–275. [Google Scholar] [CrossRef]
  20. Major, J.; Rondon, M.; Molina, D.; Riha, S.J.; Lehmann, J. Maize yield and nutrition during 4 years after biochar application to a colombian savanna oxisol. Plant Soil 2010, 333, 117–128. [Google Scholar] [CrossRef]
  21. Omara, P.; Aula, L.; Oyebiyi, F.; Raun, W.R. World cereal nitrogen use efficiency trends: Review and current knowledge. Agrosyst. Geosci. Environ. 2019, 2, 1. [Google Scholar] [CrossRef]
  22. Mukherjee, A.; Zimmerman, A.R.; Harris, W. Surface Chemistry Variations among a Series of Laboratory-Produced Biochars. Geoderma 2011, 163, 247–255. [Google Scholar] [CrossRef]
  23. Lawrinenko, M.; Laird, D.A. Anion exchange capacity of biochar. Green Chem. 2015, 17, 4628–4636. [Google Scholar] [CrossRef] [Green Version]
  24. Gaskin, J.W.; Steiner, C.; Harris, K.; Das, K.C.; Bibens, B. Effect of low-temperature pyrolysis conditions on biochar for agricultural use. Transact. ASABE 2008, 51, 2061–2069. [Google Scholar] [CrossRef]
  25. Cantrell, K.B.; Hunt, P.G.; Uchimiya, M.; Novak, J.M.; Ro, K.S. Impact of pyrolysis temperature and manure source on physicochemical characteristics of biochar. Bioresour. Technol. 2012, 107, 419–428. [Google Scholar] [CrossRef]
  26. Clare, A.; Barnes, A.; McDonagh, J.; Shackley, S. From rhetoric to reality: Farmer perspectives on the economic potential of biochar in china. Int. J. Agric. Sustain. 2014, 4, 440–458. [Google Scholar] [CrossRef]
  27. Soil Survey Staff. Natural Resources Conservation Service, United States Department of Agriculture. Web Soil Survey. Available online: http://websoilsurvey.sc.egov.usda.gov/ (accessed on 24 June 2020).
  28. Schepers, J.S.; Francis, D.D.; Thompson, M.T. Simultaneous determination of total C, total N and 15N on soil and plant material. Commun. Soil Sci. Plant Anal. 1989, 20, 949–959. [Google Scholar] [CrossRef]
  29. Raun, W.R.; Johnson, G.V. Improving nitrogen use efficiency for cereal production. Agron. J. 1999, 91, 357–363. [Google Scholar] [CrossRef] [Green Version]
  30. SAS Institute Inc. Base SAS 9.4 Procedures Guide: Statistical Procedures, 2nd ed.; SAS Institute Inc.: Cary, NC, USA, 2013. [Google Scholar]
  31. Abdi, H.; Williams, L.J. Contrast analysis. Encycl. Res. Des. 2010, 1, 243–251. [Google Scholar]
  32. Nogueira, M.C.S. Orthogonal contrasts: Definitions and concepts. Sci. Agric. 2004, 61, 118–124. [Google Scholar] [CrossRef] [Green Version]
  33. Gaskin, J.W.; Speir, R.A.; Harris, K.; Das, K.C.; Lee, R.D.; Morris, L.A.; Fisher, D.S. Effect of peanut hull and pine chip biochar on soil nutrients, corn nutrient status, and yield. Agron. J. 2010, 102, 623–633. [Google Scholar] [CrossRef] [Green Version]
  34. Uzoma, K.C.; Inoue, M.; Andry, H.; Fujimaki, H.; Zahoor, A.; Nishihara, E. Effect of cow manure biochar on maize productivity under sandy soil condition. Soil Use Manag. 2011, 27, 205–212. [Google Scholar] [CrossRef]
  35. Agegnehu, G.; Bass, A.M.; Nelson, P.N.; Bird, M.I. Benefits of biochar, compost and biochar–compost for soil quality, maize yield and greenhouse gas emissions in a tropical agricultural soil. Sci. Total Environ. 2016, 543, 295–306. [Google Scholar] [CrossRef] [PubMed]
  36. Cornelissen, G.; Martinsen, V.; Shitumbanuma, V.; Alling, V.; Breedveld, G.D.; Rutherford, D.W.; Sparrevik, M.; Hale, S.E.; Obia, A.; Mulder, J. Biochar effect on maize yield and soil characteristics in five conservation farming sites in Zambia. Agronomy 2013, 3, 256–274. [Google Scholar] [CrossRef] [Green Version]
  37. Lehmann, J.; da Silva, J.P.; Steiner, C.; Nehls, T.; Zech, W.; Glaser, B. Nutrient availability and leaching in an archaeological Anthrosol and a Ferralsol of the Central Amazon basin: Fertilizer, manure and charcoal amendments. Plant Soil 2003, 249, 343–357. [Google Scholar] [CrossRef]
  38. Yamato, M.; Okimori, Y.; Wibowo, I.F.; Anshori, S.; Ogawa, M. Effects of the application of charred bark of Acacia mangium on the yield of maize, cowpea and peanut, and soil chemical properties in South Sumatra, Indonesia. Soil Sci. Plant Nutr. 2006, 52, 489–495. [Google Scholar] [CrossRef]
  39. Rondon, M.A.; Lehmann, J.; Ramírez, J.; Hurtado, M. Biological nitrogen fixation by common beans (Phaseolus vulgaris L.) increases with bio-char additions. Biol. Fertil. Soils 2007, 43, 699–708. [Google Scholar] [CrossRef]
  40. Laird, D.A.; Fleming, P.; Davis, D.D.; Horton, R.; Wang, B.; Karlen, D.L. Impact of biochar amendments on the quality of a typical midwestern agricultural soil. Geoderma 2010, 158, 443–449. [Google Scholar] [CrossRef] [Green Version]
  41. Rajkovich, S.; Enders, A.; Hanley, K.; Hyland, C.; Zimmerman, A.R.; Lehmann, J. Corn growth and nitrogen nutrition after additions of biochars with varying properties to a temperate soil. Biol. Fertil. Soils 2012, 48, 271–284. [Google Scholar] [CrossRef]
  42. Huang, M.; Yang, L.; Qin, H.; Jiang, L.; Zou, Y. Fertilizer nitrogen uptake by rice increased by biochar application. Biol. Fertil. Soils 2014, 50, 997–1000. [Google Scholar] [CrossRef]
  43. Syuhada, A.B.; Shamshuddin, J.; Fauziah, C.I.; Rosenani, A.B.; Arifin, A. Biochar as soil amendment: Impact on chemical properties and corn nutrient uptake in a Podzol. Can. J. Soil Sci. 2016, 96, 400–412. [Google Scholar] [CrossRef]
  44. Zheng, H.; Wang, Z.; Deng, X.; Herbert, S.; Xing, B. Impacts of adding biochar on nitrogen retention and bioavailability in agricultural soil. Geoderma 2013, 206, 32–39. [Google Scholar] [CrossRef]
  45. Mandal, S.; Thangarajan, R.; Bolan, N.S.; Sarkar, B.; Khan, N.; Ok, Y.S.; Naidu, R. Biochar-Induced concomitant decrease in ammonia volatilization and increase in nitrogen use efficiency by wheat. Chemosphere 2016, 142, 120–127. [Google Scholar] [CrossRef] [PubMed]
  46. de Sousa, L.J.R.; de Moraes, S.W.; de Medeiros, E.V.; Duda, G.P.; Corrêa, M.M.; Martins, F.A.P.; Clermont-Dauphin, C.; Antonino, A.C.D.; Hammecker, C. Effect of biochar on physicochemical properties of a sandy soil and maize growth in a greenhouse experiment. Geoderma 2018, 319, 14–23. [Google Scholar]
Figure 1. Percentage difference (PD) for maize grain yield between nitrogen-biochar combination (NBC) and nitrogen fertilizer (NF) in 2018 and 2019 at Efaw and Lake Carl Blackwell (LCB), Stillwater, Oklahoma, USA. Biochar rates were 5, 10, and 15 Mg ha−1 corresponding to application rates of 50, 100, and 150 kg N ha−1, respectively. Positive difference indicates NBC advantage over NF while negative difference indicates NF advantage over NBC.
Agronomy 10 01241 g001
Figure 2. Percentage difference (PD) for maize grain nitrogen uptake between nitrogen-biochar combination (NBC) and nitrogen fertilizer (NF) in 2018 and 2019 at Efaw and Lake Carl Blackwell (LCB), Stillwater, Oklahoma, USA. Biochar rates were 5, 10, and 15 Mg ha−1 corresponding to application rates of 50, 100, and 150 kg N ha−1, respectively. Positive difference indicates NBC advantage over NF while negative difference indicates NF advantage over NBC.
Agronomy 10 01241 g002
Figure 3. Percentage difference (PD) for nitrogen use efficiency between nitrogen-biochar combination (NBC) and nitrogen fertilizer (NF) in 2018 and 2019 at Efaw and Lake Carl Blackwell (LCB), Stillwater, Oklahoma, USA. Biochar rates were 5, 10, and 15 Mg ha−1 corresponding to application rates of 50, 100, and 150 kg N ha−1, respectively. Positive difference indicates NBC advantage over NF while negative difference indicates NF advantage over NBC.
Agronomy 10 01241 g003
Table 1. Total rainfall and average air temperature (April to September) in 2018 and 2019 at Lake Carl Blackwell (LCB) and Efaw Agronomy Research Station, Stillwater, Oklahoma.
MonthRainfall (mm)Temperature (°C)
2018201910 yr. avg *2018201910 yr. avg *
Stillwater
Apr52.3134.4122.212.316.116.0
May98.6439.4110.124.019.620.1
Jun151.6106.986.926.624.426.5
July79.219.396.427.827.428.2
Aug142.0209.878.526.227.227.0
LCB
Apr51.1111.0121.812.015.715.6
May75.7413.5125.823.719.219.7
Jun214.9102.6119.526.324.126.1
Jul71.433.394.527.126.927.9
Aug151.1208.073.125.927.026.6
Sept70.6163.668.422.625.822.3
* 10 year average (2008–2017) prior to the first year of initiating experiment.
Table 2. Physical and chemical properties of soft wood (Southern Yellow Pine) biochar supplied by Wakefield Biochar, Columbia, Missouri; the initial soil chemical properties at Lake Carl Blackwell (LCB) and Efaw research sites, Stillwater, Oklahoma.
Biochar/SitepHKCaMgBDTPTNTOC
mg kg−1mg kg−1mg kg−1g cm−1mg kg−1g kg−1g kg−1
Biochar7.4612412812250.484.535.9876.7
LCB5.7349804207x120.89.1
Efaw5.61531466354x130.76.8
TP, Total phosphate; TN, Total nitrogen; TOC, Total organic carbon; BD, Bulk density; x, values not determined. Initial soil properties were determined prior to first-year biochar application.
Table 3. Mean maize grain yield for treatments plus the associated contrasts between nitrogen fertilizer and biochar-nitrogen combinations at Efaw and LCB, Stillwater, Oklahoma, USA. 2018 and 2019.
TreatmentN Rate (kg ha−1)Biochar (Mg ha−1)Grain Yield (Mg ha−1) at EfawGrain Yield (Mg ha−1) at LCB
2018201920182019
mean±S.Emean±S.Emean±S.Emean±S.E
1003.480.741.080.042.590.150.650.21
25004.760.321.590.223.180.061.090.3
310005.840.511.880.213.550.211.180.27
415007.30.52.290.283.950.071.340.2
5053.510.281.40.23.250.061.40.42
60103.620.091.650.313.490.111.050.56
70153.850.951.130.164.180.091.080.22
85055.710.691.390.093.460.21.380.24
9100106.681.121.650.134.490.341.720.23
10150156.430.761.920.244.970.142.190.25
Pr > F 0.0023 0.0124 <0.0001 0.1264
C.V, % 23.1 22 7.7 41
Contrasts FPr > FFPr > FFPr > FFPr > F
2 vs. 8 0.890.36490.50.49461.040.3270.660.4311
3 vs. 9 0.690.42120.620.444911.590.00522.310.1544
4 vs. 10 0.750.4021.580.233213.770.0035.740.0338
2, 3, and 4 vs. 8, 9, and 10 0.270.61052.520.138422.070.00057.460.0182
C.V, Coefficient of variation between treatments; S.E, standard error for replicated means (±SE, n = 3). Nitrogen fertilizer was applied as urea ammonium nitrate—UAN (28:0:0). Biochar was applied immediately following UAN application and incorporated to a 15 cm depth.
Table 4. Mean maize grain nitrogen (N) for treatments uptake plus the associated contrasts between N fertilizer and biochar-N combinations at Efaw and LCB, Stillwater, Oklahoma, USA. 2018 and 2019.
TreatmentN Rate (kg ha−1)Biochar (Mg ha−1)Grain N Uptake (kg ha−1) at EfawGrain N Uptake (kg ha−1) at LCB
2018201920182019
mean±S.Emean±S.Emean±S.Emean±S.E
10041.348.5312.530.5827.492.836.652.05
250059.829.618.12.8235.361.1114.173.08
3100077.5210.1823.95237.031.5312.262.53
41500102.347.130.023.3447.722.6115.012.29
50542.111.9616.031.9639.564.0115.324.21
601042.871.5119.54.1445.635.113.098.01
701543.7910.7512.121.8952.942.510.891.97
850571.028.1317.081.5237.312.6315.081.84
91001086.7814.7619.481.1759.386.6722.213.5
101501583.488.4226.763.667.332.8227.693.03
Pr > F 0.0003 0.001 <0.0001 0.0395
C.V, % 23.3 22.5 13.7 41.9
Contrasts FPr > FFPr > FFPr > FFPr > F
2 vs. 8 0.20.66460.080.78410.160.69270.050.8195
3 vs. 9 0.460.51241.510.242921.480.00066.470.0258
4 vs. 10 1.890.19470.80.388916.530.001610.490.0071
2, 3, and 4 vs. 8, 9, and 10 0.020.88591.920.190627.640.000212.060.0046
C.V, Coefficient of variation between treatments; S.E, standard error for replicated means (±SE, n = 3); Nitrogen fertilizer was applied as urea ammonium nitrate—UAN (28:0:0). Biochar was applied immediately following UAN and incorporated to a 15 cm depth.
Table 5. Mean nitrogen use efficiency (NUE) for treatments plus the associated contrasts between N fertilizer and biochar-N combinations at Efaw and Lake Carl Blackwell, Stillwater, Oklahoma, USA. 2018 and 2019.
TreatmentN Rate (kg ha−1)Biochar (Mg ha−1)Nitrogen Use Efficiency (%) at EfawNitrogen Use Efficiency (%) at LCB
2018201920182019
mean±S.Emean±S.Emean±S.Emean±S.E
100xxxxxxxx
250053.4426.7611.144.6515.744.7215.032.07
3100036.183.1111.421.439.542.85.60.85
4150040.668.3411.662.0113.490.445.570.41
505xxxxxxxx
6010xxxxxxxx
7015xxxxxxxx
850559.364.989.13.6519.645.7316.861.28
91001045.446.676.951.7431.894.4515.563.48
101501528.090.99.492.7826.591.3414.022.18
Pr > F 0.0707 0.8522 0.0105 0.0034
C.V, % 35.5 51.1 33.4 28.4
Contrasts FPr > FFPr > FFPr > FFPr > F
2 vs. 8 1.050.32680.240.63220.540.47680.420.5282
3 vs. 9 0.60.45251.160.302917.670.001212.540.0041
4 vs. 10 1.110.31310.270.6116.070.02989.040.0109
2, 3, and 4 vs. 8, 9, and 10 0.190.67451.460.250818.260.001117.270.0013
C.V, Coefficient of variation between treatments; S.E, standard error for replicated means (±SE, n = 3); x, missing NUE value from plots with no fertilizer N applied. Nitrogen fertilizer was applied as urea ammonium nitrate—UAN (28:0:0). Biochar was applied immediately following UAN and incorporated to a depth of 15 cm.

