Article

Combined Linkage Mapping and Genome-Wide Association Study Identified QTLs Associated with Grain Shape and Weight in Rice (Oryza sativa L.)

1
Department of Southern Area Crop Science, National Institute of Crop Science, RDA, Miryang 50424, Korea
2
Department of Agricultural Research, Ministry of Agriculture, Livestock and Irrigation, MOALI, 36, NayPyiTaw 15011, Myanmar
*
Author to whom correspondence should be addressed.
These authors contributed equally to this work as first authors.
Submission received: 8 September 2020 / Revised: 29 September 2020 / Accepted: 4 October 2020 / Published: 9 October 2020
(This article belongs to the Special Issue Rice Genetics: Trends and Challenges for the Future Crops Production)

Abstract

:
In the current study, we used a linkage mapping–Genome-Wide Association Study (GWAS) joint strategy to investigate quantitative trait loci (QTLs) governing rice grain shape and weight in a doubled haploid (DH) population, using Kompetitive Allele-Specific PCR (KASP) markers. Results revealed the co-detection of the QTLs, qGLE-12-1 and qGLE-12-2 (Chromosome 12), qGTE-3-1 (Chromosome 3), and qGWL-5-1 and qLWRL-5-1 (Chromosome 5), associated with grain length, width, and length–width ratio, by both linkage mapping and GWAS. In addition, qGLL-7-1 (logarithm of the odds (LOD): 18.0, late-transplanted rice) and qGLE-3-1 (LOD: 8.1, early-transplanted rice), and qLWRL-7-1 (LOD: 34.5), detected only by linkage mapping, recorded a high phenotypic variation explained (PVE) of 32.5%, 19.3%, and 37.7% for grain length, and grain length–width ratio, respectively, contributed by the allele from 93-11. Meanwhile, qGWL-5-1 (LOD: 17.2) recorded a high PVE (31.7%) for grain width, and the allele from Milyang352 contributed to the observed phenotypic variation. Furthermore, qGTL-5-1 (LOD: 21.9) had a high PVE (23.3%) for grain thickness. Similarly, qTGWE-5-1 (LOD: 8.6) showed a high contribution to the PVE for grain weight (23.4%). Moreover, QTLs, qGW-5-1, qGT-5-1, qLWR-5-1, and qTGW-5-1 coincided on chromosome 5, flanked with KJ05_17 and KJ05_13 markers. Therefore, these QTLs are suggested to govern rice grain shape and weight. Additionally, the identified candidate genes could play active roles in the regulation of rice grain shape and weight, regarding their predicted functions, and similarity with previously reported genes. Downstream breeding and functional studies are required to elucidate the roles of these candidate genes in the regulation of grain shape and weight in rice.

1. Introduction

For several decades, many plant breeding programs have been essentially oriented towards the development of rice varieties with high yielding potential and improved productivity [1,2,3]. The interest in developing high yielding rice varieties has been sustained by the rapid increase in population worldwide, which is projected to reach about 9.8 billion people by 2050 [4]. In recent years, the trend in plant breeding has exhibited an emerging interest in the quality of grains, coupled with productivity, as part of the diversification process to meet the increasing food demands in terms of quantity and quality [5,6,7]. The advent of plant molecular breeding techniques and genomics approaches have contributed significantly to sustaining and accelerating the improvement of food crops, such as rice, in a relatively short time [8,9,10]. Despite the complexity of the food system and the diversity in the preference for various foods across the globe, rice remains the major cereal crop solely cultivated for human consumption, and the major food crop for more than half of the global population [11].
Recent advances in plant molecular breeding research and the emergence of genomics have significantly improved the understanding of the genetic contributions to the overall plant growth and development, seed formation, quality, and productivity. The use of strategic genetic approaches, such as Genome-Wide Association Studies (GWAS) [12,13,14] and OMICS [15], and the advent of genome sequencing technologies [16,17] have paved new paths towards the elucidation of the role of functional genetic components of plants underlying the phenotypic diversity and variability of complex traits between and within plant species.
In rice, grains are the ultimate target products of rice cultivation and consumption [18]; they also serve as an important commodity for trade [19]. Several reports have identified genes or protein families involved in the control of rice grain shape and weight, using natural variations and reverse genetics approaches [20,21,22,23,24]. Grain traits, such as grain length, grain width, grain thickness, thousand grain weight, are counted among the topmost agronomic traits with high potential for contributing to the yield of rice. Grain weight has been suggested to be affected by grain length, width and thickness; therefore, they are considered to be closely related, and controlled by multiple quantitative trait loci (QTLs) [25,26]. However, grain weight has been shown to be the most indicative, and the major determinant grain trait of rice yield [27]. In addition to grain weight, grain length and width, and thickness are considered as appearance quality, important for diverse uses or processing purposes [28,29,30,31]. The application of linkage mapping has been widely used for the detection of quantitative trait loci (QTLs) associated with various grain traits in rice in various types of mapping populations, which include advanced backcrossed (BC) lines [32], near isogenic lines (NILs) [33], recombinant inbred lines (RILs) [34], doubled haploid lines [35], with molecular markers that include amplified fragment length polymorphism (AFLP), simple sequence repeat (SSR) or microsatellite (RM) [36,37], single nucleotide polymorphism (SNP) [38], restriction fragment length polymorphism (RFLP) [39].
Many agronomic traits of rice are said to be controlled by multiple quantitative trait loci (QTLs) [40,41]. Several studies have proposed a large number of QTLs controlling grain traits in rice grown in single [18,42] or multiple environments [26,43,44]. Most of the reported QTLs (major and minor) associated with grain shape or weight are mapped to almost all chromosomes of rice (8–10), with diverse contributions to the overall phenotypic variation explained (PVE) [35,42,44,45,46]. However, of all the reported QTLs associated with grain shape or weight, only a few have been isolated and characterized so far [47]. Among these, some genes have been isolated and functionally characterized [48,49,50,51,52,53,54,55,56,57,58,59,60,61,62,63,64,65,66,67,68,69,70,71,72,73,74,75,76,77,78,79,80,81].
Fixed homozygous populations that include doubled haploid (DH) population [35] and recombinant inbred lines (RILs) [81] have been used widely for detecting major QTLs for various agronomic traits in rice. The indica and japonica rice subspecies are said to be independently domesticated from the wild ancestor [82,83,84]. The morphological difference between rice grains from indica and japonica varieties is evident; therefore, a mapping population derived from a cross between indica and japonica would offer the best cross combination to investigate QTLs associated with grain shape and weight.
Thus, from this perspective, the present study performed a linkage mapping on a doubled haploid (DH) population developed through anther culture of a cross between cv. 93-11 and cv. Milyang352, typical indica and japonica rice subspecies, grown under early-transplanting and late-transplanting field conditions, to investigate putative quantitative trait loci (QTLs) controlling phenotypic grain traits of rice using Kompetitive Allele-Specific PCR (KASP) markers. In addition, with the purpose of investigating QTLs associated with the control of complex rice grain traits, using two different approaches, we conducted a Genome-Wide Association Study (GWAS) on the same population. Additionally, this study identified candidate genes located in the co-detected genetic loci by linkage mapping–GWAS, with interesting predicted functions, suggested to have the potential to regulate various aspects of grain shape and weight in rice.

2. Materials and Methods

2.1. Mapping Population, Growth Conditions, and Phenotypic Measurements

The mapping population was a doubled haploid (DH) population developed though anther culture of the cross between cv. 93-11 and cv. Milyang352 (typical Oryza sativa L. indica (P1) and japonica (P2) subspecies, respectively) [85]. The japonica cv. Milyang352 was developed from a cross between C18/Ungwang. C18 is a cultivar originated from China, which was also the origin of the indica cv. 93-11 used as P1 in the study. In essence, 117 rice DH lines and both parental lines (P1 and P2) were used in the study. Initially, rice seeds were soaked in 0.7% nitric acid (HNO3) CAS: 7697-37-2, Lot No. 2016B3902; Junsei Chemical Co. Ltd., Tokyo, Japan) for 24 h to break the dormancy, and incubated at 32 °C for 48 h to induce germination. Germinated seeds were sown in 50-well trays, and grown until transplanting time. Seedlings with uniform height were transplanted at two different periods of the same cropping season, in the experimental field (altitude: 11 m, 35°29’31.4” N, and 128°44’30.0” E), located at the National Institute of Crop Science (NICS), Department of Southern Area Crop Science, Paddy Crop Division, Rural Development Administration, Miryang, Republic of Korea. One set of doubled haploid (DH) lines and parental lines were transplanted on 10 May 2018 (early-transplanting), and the other on 1 July 2018 (late-transplanting). A total of 100 seedlings per rice line were transplanted in four rows, with 25 plants per row and the spacing between and within the lines of 30   cm × 15   cm , respectively. Parental lines were planted after every 20 rice DH lines, starting from the initial rows. The weather parameters and conditions during the early- (first season) and late-transplanting (second season) periods can be found in Figure S1.
Soon after harvesting and postharvest processing, the rice grain traits of the mapping population were examined. Seven rice grain traits (major rice yield components) were measured from both early- and late-transplanted rice doubled haploid lines, which included grain length (GL), grain width (GW), grain thickness (GT) (measured with a Vernier Caliper, CD-20CP, Mitutoyo Corp, Tokyo, Japan), grain length–width ratio (LWR), and thousand grain weight (TGW). The grain length–width ratio was calculated as the grain length (GL) divided by grain width (GW). The thousand grain weight (TGW) was calculated as the [(average grain weight/the number of samples (n)) × 100]. Phenotype data of the DH lines were compared with the parental lines in each transplanting time. The samples for the phenotypic observations were randomly pooled from the inside rows, excluding the border rows to avoid the border effects on the traits studied and competition between lines. Ten individual panicles from different plants were used to evaluate the grain phenotype.

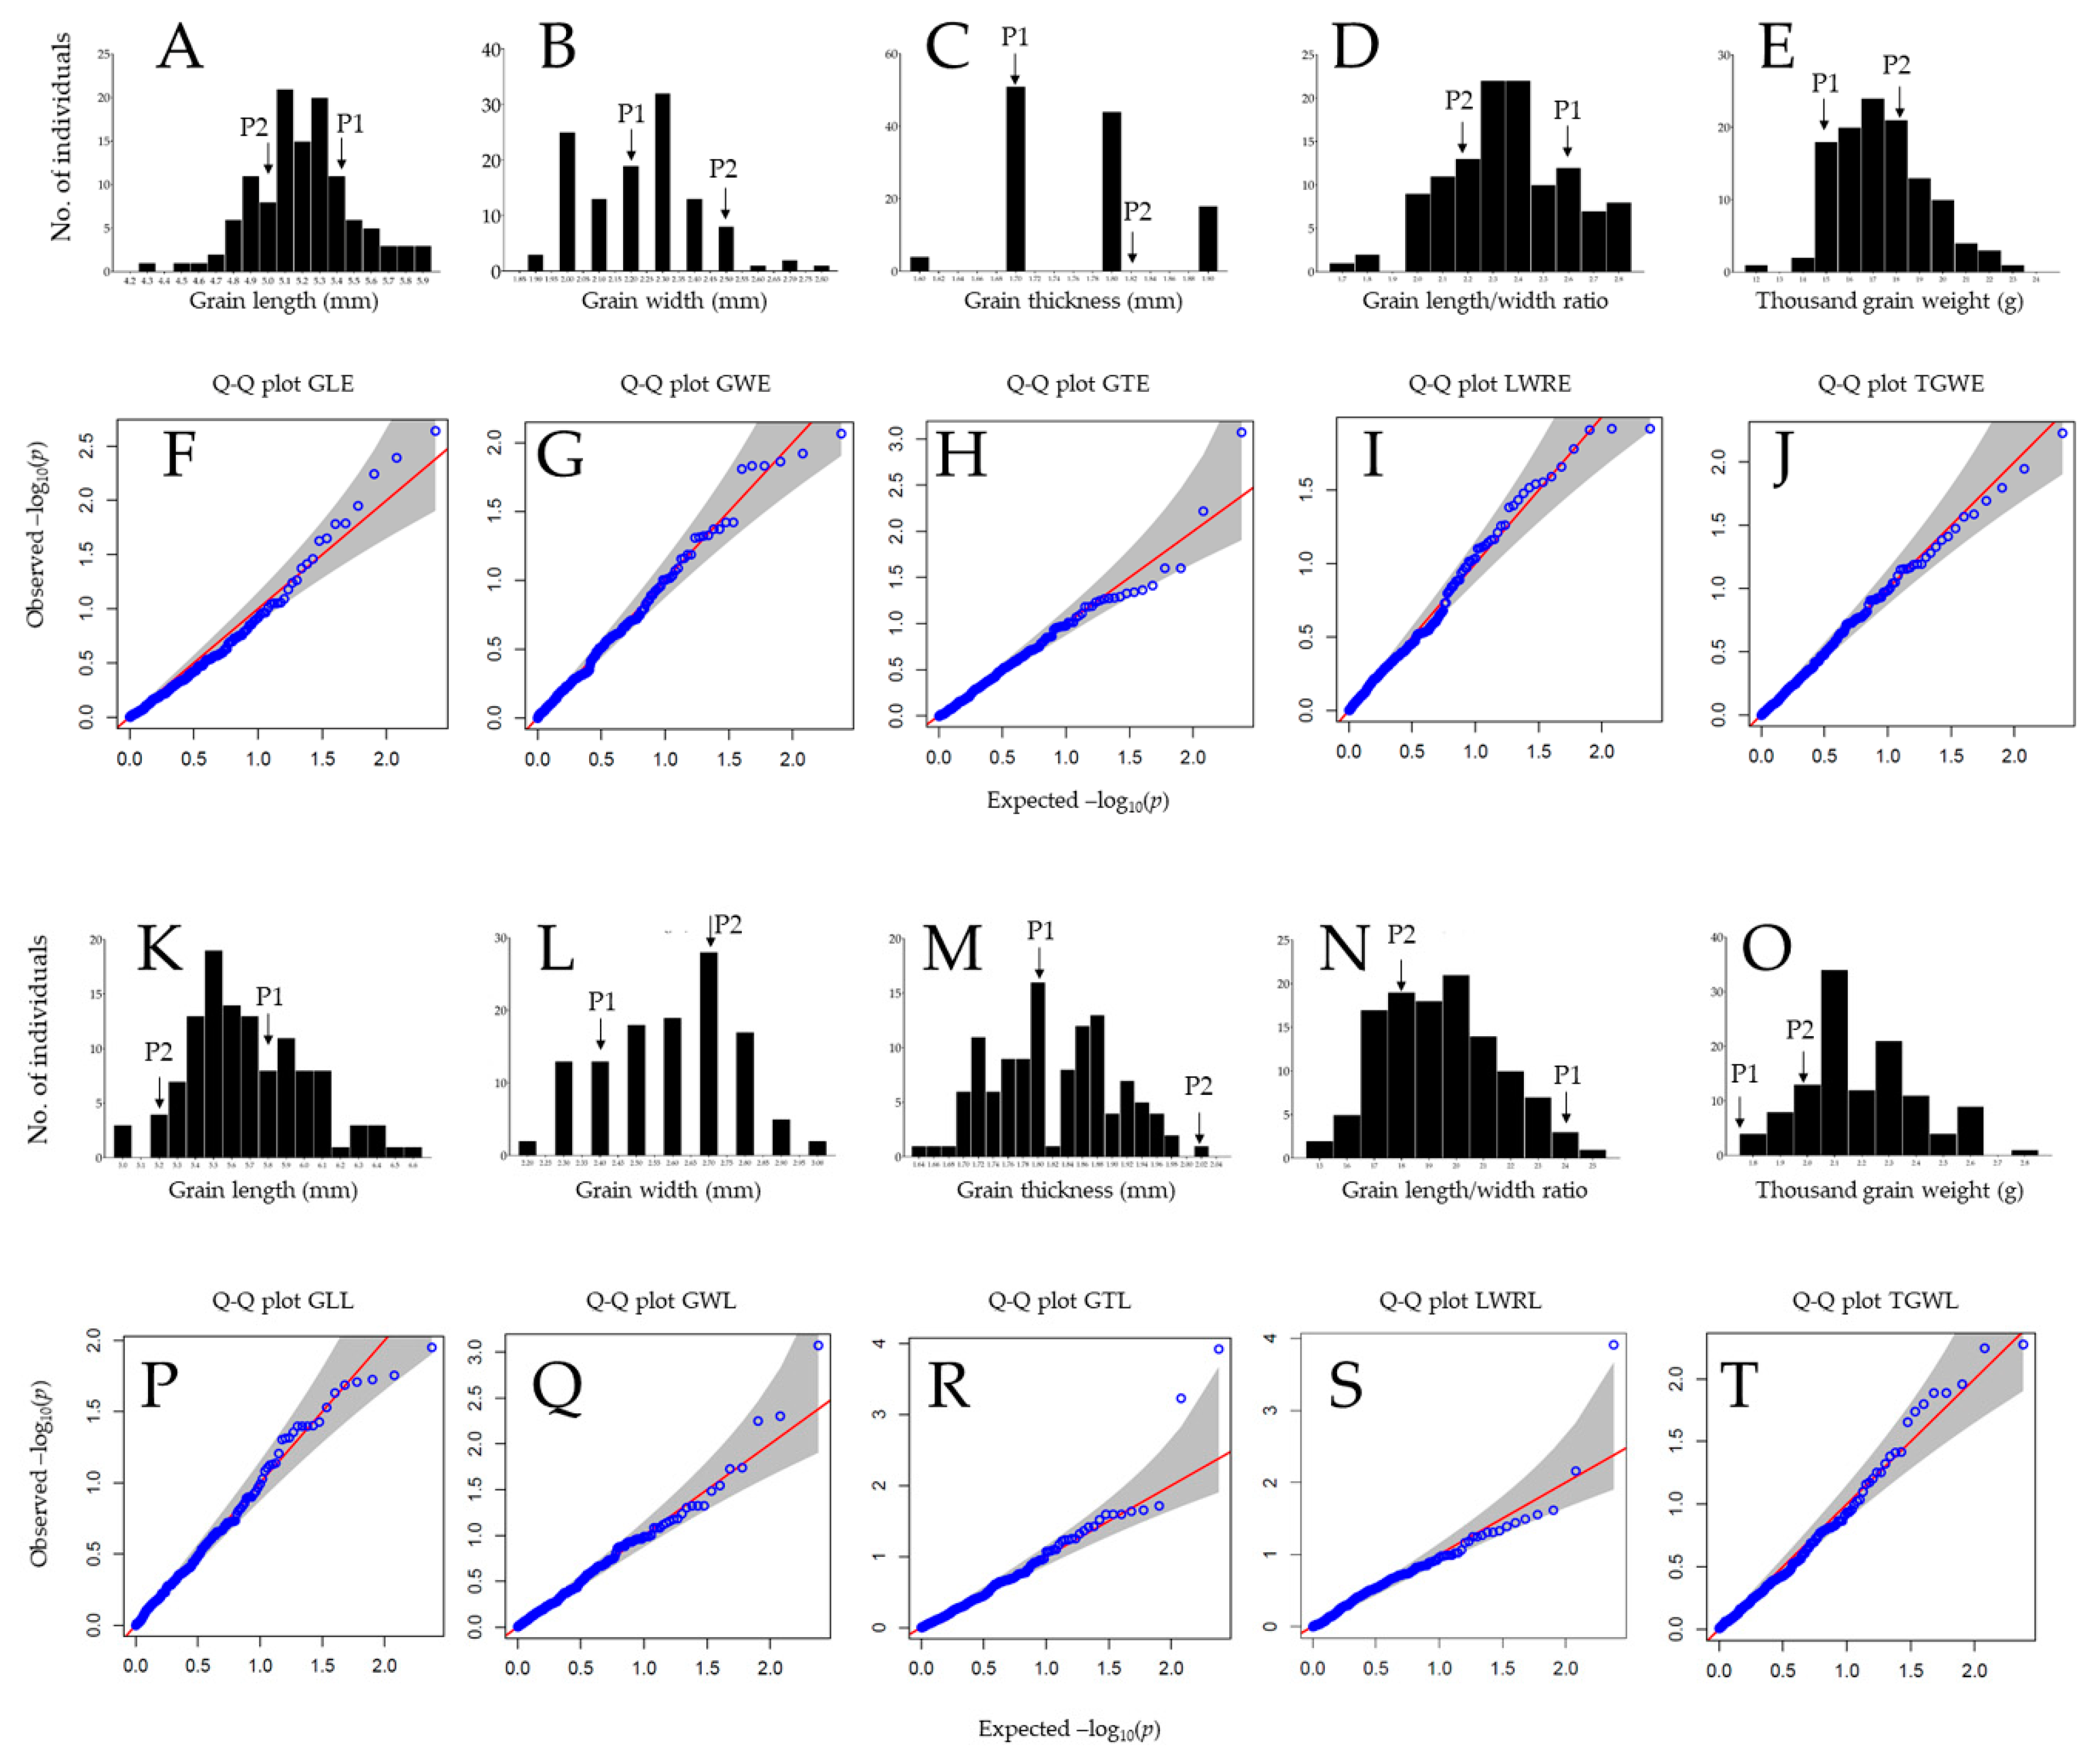
2.2. Frequency Distribution, Quantile–Quantile Plots, Correlation Analysis, and Principal Component Analysis

The frequency distribution, the Quantile–Quantile (Q–Q) plots, the correlation between traits, the principal component analysis of all phenotypes of the mapping population, the pairwise kinship matrix [86], and heat map, were generated using the hist, qqplotr, data functions (only for correlation analysis in Microsoft Excel 2016), ggplot2, tidiverse, cluster, and factoextra (for heat map only) R packages in RStudio [87,88].

2.3. Genomic DNA Extraction and Molecular Markers Analysis

The genomic DNA was extracted from rice leaf samples following the previously reported CTAB method [89] with slight modifications. Briefly, the frozen leaves samples were crushed in liquid nitrogen in 1.5 mL Eppendorf tubes (e-tubes), and 600 μL of 2× CTAB buffer (D2026, Lot D2618U12K, Biosesang, Seongnam-si, Korea) was added and the mixture was vortexed, and incubated at 65 °C for 30 min in a dry oven. Then 500 μL PCI (Phenol:Chloroform:Isoamylalcohol, 25:24:1, Batch No. 0888k0774; Sigma-Aldrich, St. Louis, MO, USA) solution was added, followed by gentle mixing by inversion. The tubes were centrifuged at 13,000 rpm for 15 min, and the supernatant was transferred to fresh e-tubes, and 500 μL of isopropanol (CAS: 67-63-0, Lot No. SHBC3600V; Sigma-Aldrich, St. Louis, MO, USA) was added, followed by mixing by inversion and incubation for 1 h at −20 °C. Then centrifugation was done at 13,000 rpm for 7 min. The supernatant was removed, and the pellets were washed with 70% ethanol (1 mL). Samples were centrifuged at 13,000 rpm for 5 min and ethanol was discarded, followed by drying at room temperature, and re-suspended in 100 mL 1× TE buffer (Lot No. 0000278325; Promega, Madison, WI, USA).
For the molecular markers analysis, Kompetitive Allele-Specific PCR (KASP) markers were amplified from genomic DNA and allelic discrimination was performed using the Nexar system (LGC Doublas Scientific, Alexandria, VA, USA) at the Seed Industry Promotion Center (Gimje, Korea) of the Foundation of Agri. Tech. Commercialization & Transfer in Korea. An aliquot (0.8 μL) of 2× master mix (LGC Genomics, London, UK), 0.02 μL of KASP assay mix (LGC Genomics), and 5 ng DNA template were mixed in 1.6 μL KASP reaction mixture in a 386-well array plate. KASP amplification was performed as described earlier.
Fluidigm markers for SNP genotypes were determined using the BioMarkTM HD system (Fluidigm, San Fancisco, CA, USA) and 96.96 Dynamic Array IFC (96.96 IFC) chip following the manufacturer’s instructions, at the National Instrumentation Center for Environmental Management, Seoul National University (Pyeongchang, Korea).

2.4. Construction of Linkage Maps, QTL Analysis, and GWAS

Genotype and the phenotype data consisting of 240 markers, including KASP markers previously reported [90] to be specific for detecting polymorphism between japonica ssp. and Fluidigm markers [91] specific for detecting polymorphism between indica and japonica subspecies, and 117 rice doubled haploid (DH) lines and the parental lines (93-11 and Milyang352) were used for detecting quantitative trait loci (QTLs) associated with rice grain length, width, thickness, grain length–width ratio, and thousand grain weight. The raw data (Genotype and phenotype) were initially formatted in RStudio (v.1.2.5042; 2009-2020; RStudio Inc., Boston, MA, USA) using fread, pheno.raw, geno.raw, and cbind functions. The linkage maps were constructed, and QTLs analyzed with IciMapping software v.4.1.0.0, for a bi-parental population using position mapping and Kosambi mapping functions [92]. The permutation (1000 times) parameters explaining the probability for detecting statistically significant QTLs associated with grain traits, were selected. The significant threshold for GWAS was selected using the Bonferroni correction in the GAPIT function: my_GAPIT <- GAPIT (Y = myY, G = myG, Model.selection = TRUE, PCA.total = 3, SNP.MAF = 0.05).
From the perspective of investigating the possibility for a dual approach linkage mapping–GWAS to detect similar genetic regions that could be associated with the control of rice grain traits, the same genotype and phenotype data that served to constructing linkage maps were used to conduct a Genome-Wide Association Study (GWAS) (multtest, gplots, LDheatmap, genetics, EMMREML, compiler, scatterplot3d, data.table, MASS, R packages, and GAPIT function in RStudio). The interactive Manhattan plots that help in the identification of physical positions and KASP tightly linked to the detected QTLs, with their respective logarithm of the odds (LOD) values, were built using the Manhattanly R package.
The publicly available rice genome annotation database (http://rice.plantbiology.msu.edu/) browser was used to identify candidate genes within the genetic region flanked by KASP marker KJ05_17 (4,783,888 bp) and KJ05_13 (5,984,919 bp) on chromosome 5 (major QTL).

3. Results

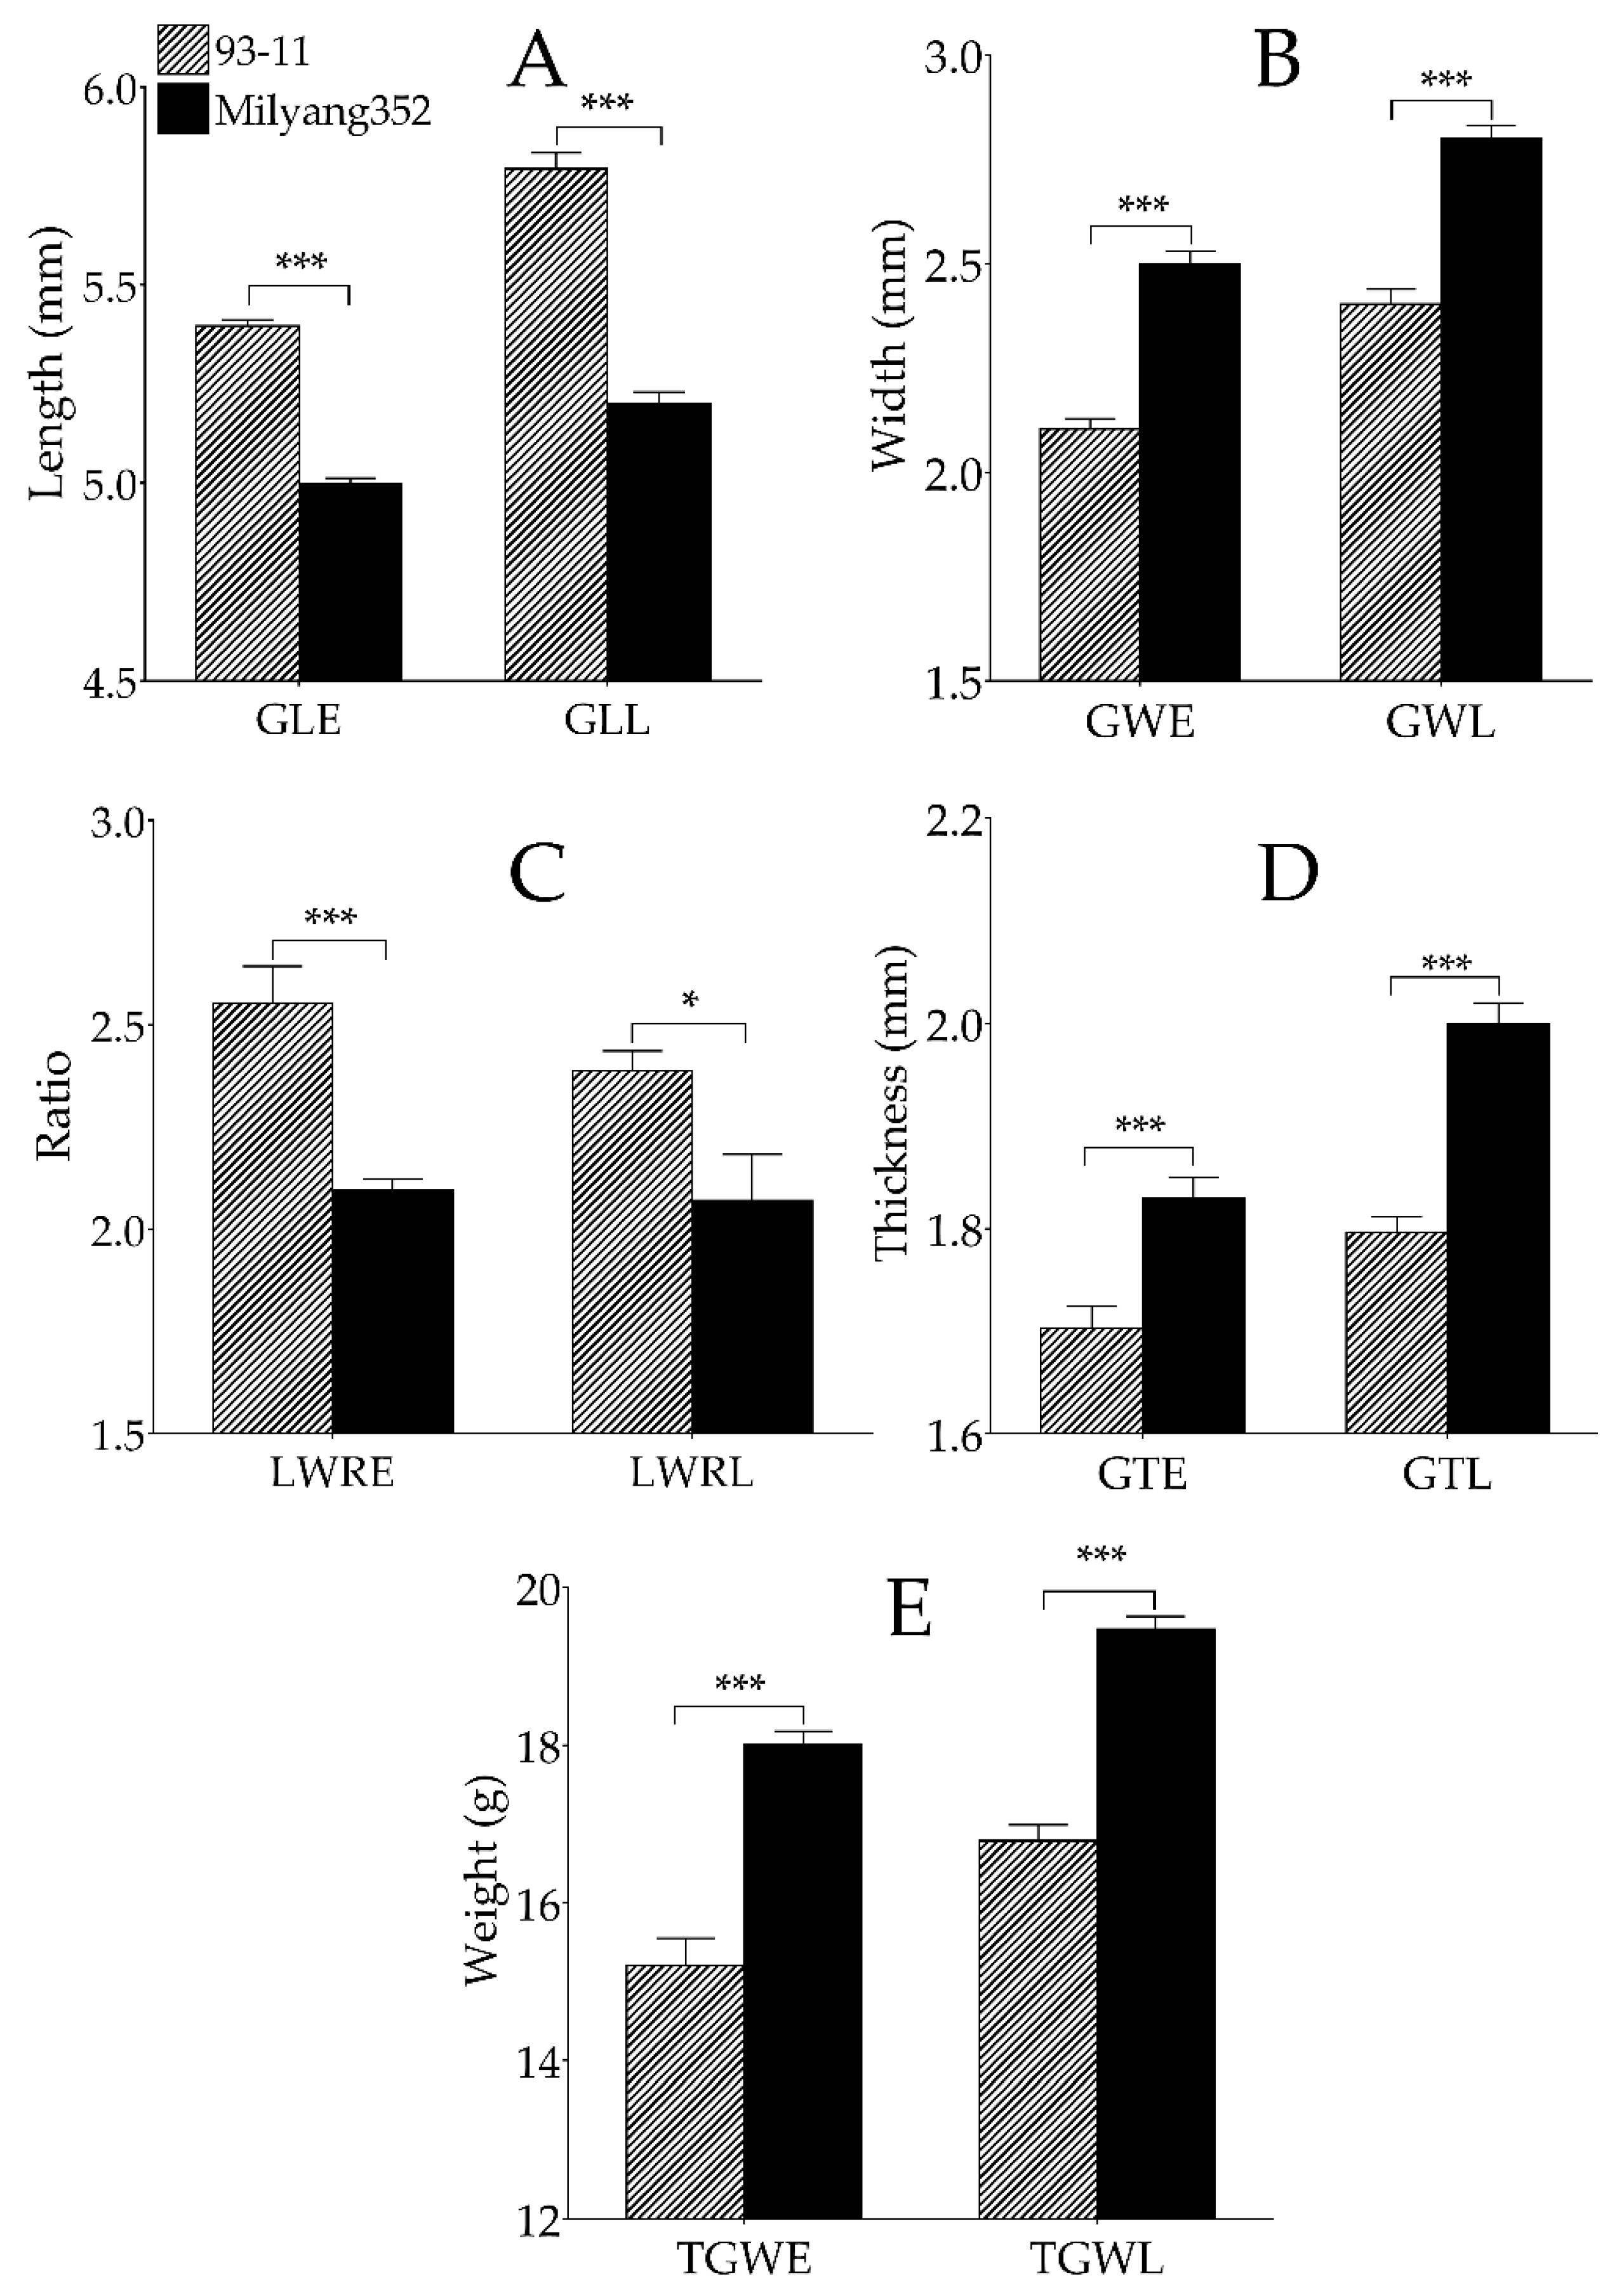
3.1. Differential Grain Traits of Parental Genotypes and DH Population

The mapping population (117 DH lines and parental lines) was evaluated for the phenotypic grain traits harvested from early- and late-transplanted rice, under field conditions. The results revealed a normal distribution for almost all evaluated grain traits (Figure 1A–E,K–O). The Quantile–Quantile (Q–Q) plots (observed quantiles plotted against theoretical quantile or z-scores) also indicate that the majority of the trait values fall on the predicted (reference) line, therefore suggesting a normal distribution for grain length (Figure 1A,K), grain length–width ratio (Figure 1D,N), thousand grain weight (Figure 1E,O) but grain width (Figure 1B,L), and grain thickness (Figure 1C,M) exhibited a positive skewness and negative skewness, respectively.
About 26.5% of the 117 DH lines grown under early-transplanting conditions had rice grains similar to P1-type (≥5.5 mm) against 73.5% with P2-type grain length (<5.5 mm), while about 37.6% and 62.4% of the DH lines cultivated under late-transplanting conditions had P1-type grain length (≥5.8 mm) and P2-type (<5.8 mm), respectively. In addition, about 10.3% of the DH lines had large grains (≥2.5 mm), and 89.7% showed narrow grains (<2.5 mm) under early-transplanting conditions. However, about 20.5% of the mapping population grown under late-transplanting conditions showed wide rice grains (≥2.8 mm), while 79.5% had narrow grains (<2.8 mm). Furthermore, around 53% of the early-transplanted mapping population had bold grain phenotype (≥1.8 mm), and 47% thin grains (<1.8 mm). Moreover, 0.9% of the DH lines showed bold or thick grains (≥2.0 mm), and 99.1% had thin grains (<2.0 mm) when grown under late-transplanting conditions. About 31.6% of the studied population, harvested under early-transplanting conditions, showed a high grain length–width ratio (LWR ≥ 2.5), against 68.4% with a low LWR (<2.5). The LWR of the late-transplanted rice revealed that about 21.4% of the DH lines had a high LWR (≥2.4) but only 78.6% recorded a low LWR (<2.4). Furthermore, the observed patterns of grain weight, here expressed as thousand grain weight (TGW), of the mapping population early-transplanted, indicated that about 34.2% recorded a high thousand grain weight (TGW) value (≥18 g), while 65.8% showed a low TGW value (<18 g). A similar pattern was observed for the late-transplanted rice, showing about 47.9% with a high TGW (≥19.5 g), and 52.1% with a low TGW (<19.5 g).
Additionally, we observed a highly significant difference in grain length (GL) between early- and late-transplanted DH lines (increase of GL in late-transplanted rice compared to early-transplanted rice) (Figure S2A). A similar increasing pattern was observed in grain width (GW, Figure S2B), grain thickness (GT, Figure S2D), and the thousand grain weight (TGW, Figure S2E), between the two transplanting periods. However, a contrasting pattern was observed in the grain length–width ratio (LWR, Figure S2C) (increased LWR of early transplanted rice, and decreased LWR of late-transplanted rice). In addition, the linear regression analysis revealed that there was a very weak correlation that could also be regarded as a non-existing correlation (R2 = 0.118) between grain length (GL) and thousand grain weight (TGW) for both early- and late-transplanted rice DH lines (Figure 2A, Table S1). However, panel B in Figure 1 shows that there was a strong positive correlation (R2 = 0.5313) between grain width (GW) and thousand grain weight (TGW). A similar positive correlation (R2 = 0.4226) was observed between grain thickness (GT) and TGW. In contrast, a very weak negative or non-existing correlation (R2 = 0.1656) was found between grain length–width ratio (LWR) and TGW.
The parental lines (93-11, indica (P1) and Milyang352, japonica (P2)) showed highly significant difference between all evaluated grain traits in both early-transplanted and late-transplanted rice. For instance, the typical indica cv 93-11 had longer grains (Figure 3A), with smaller width (Figure 3B) compared to its japonica counterpart. We also observed a high grain length–width ratio (LWR) (Figure 3C) and thin grains in cv. 93-11 compared to Milyang352 (shorter and bold grains) in both early- and late-transplanting periods (Figure 3D). We also observed that 93-11 recorded a significantly low TGW for the early-transplanted rice compared to Milyang352. A similar pattern was observed between the two parental lines in late-transplanted rice (Figure 3E).

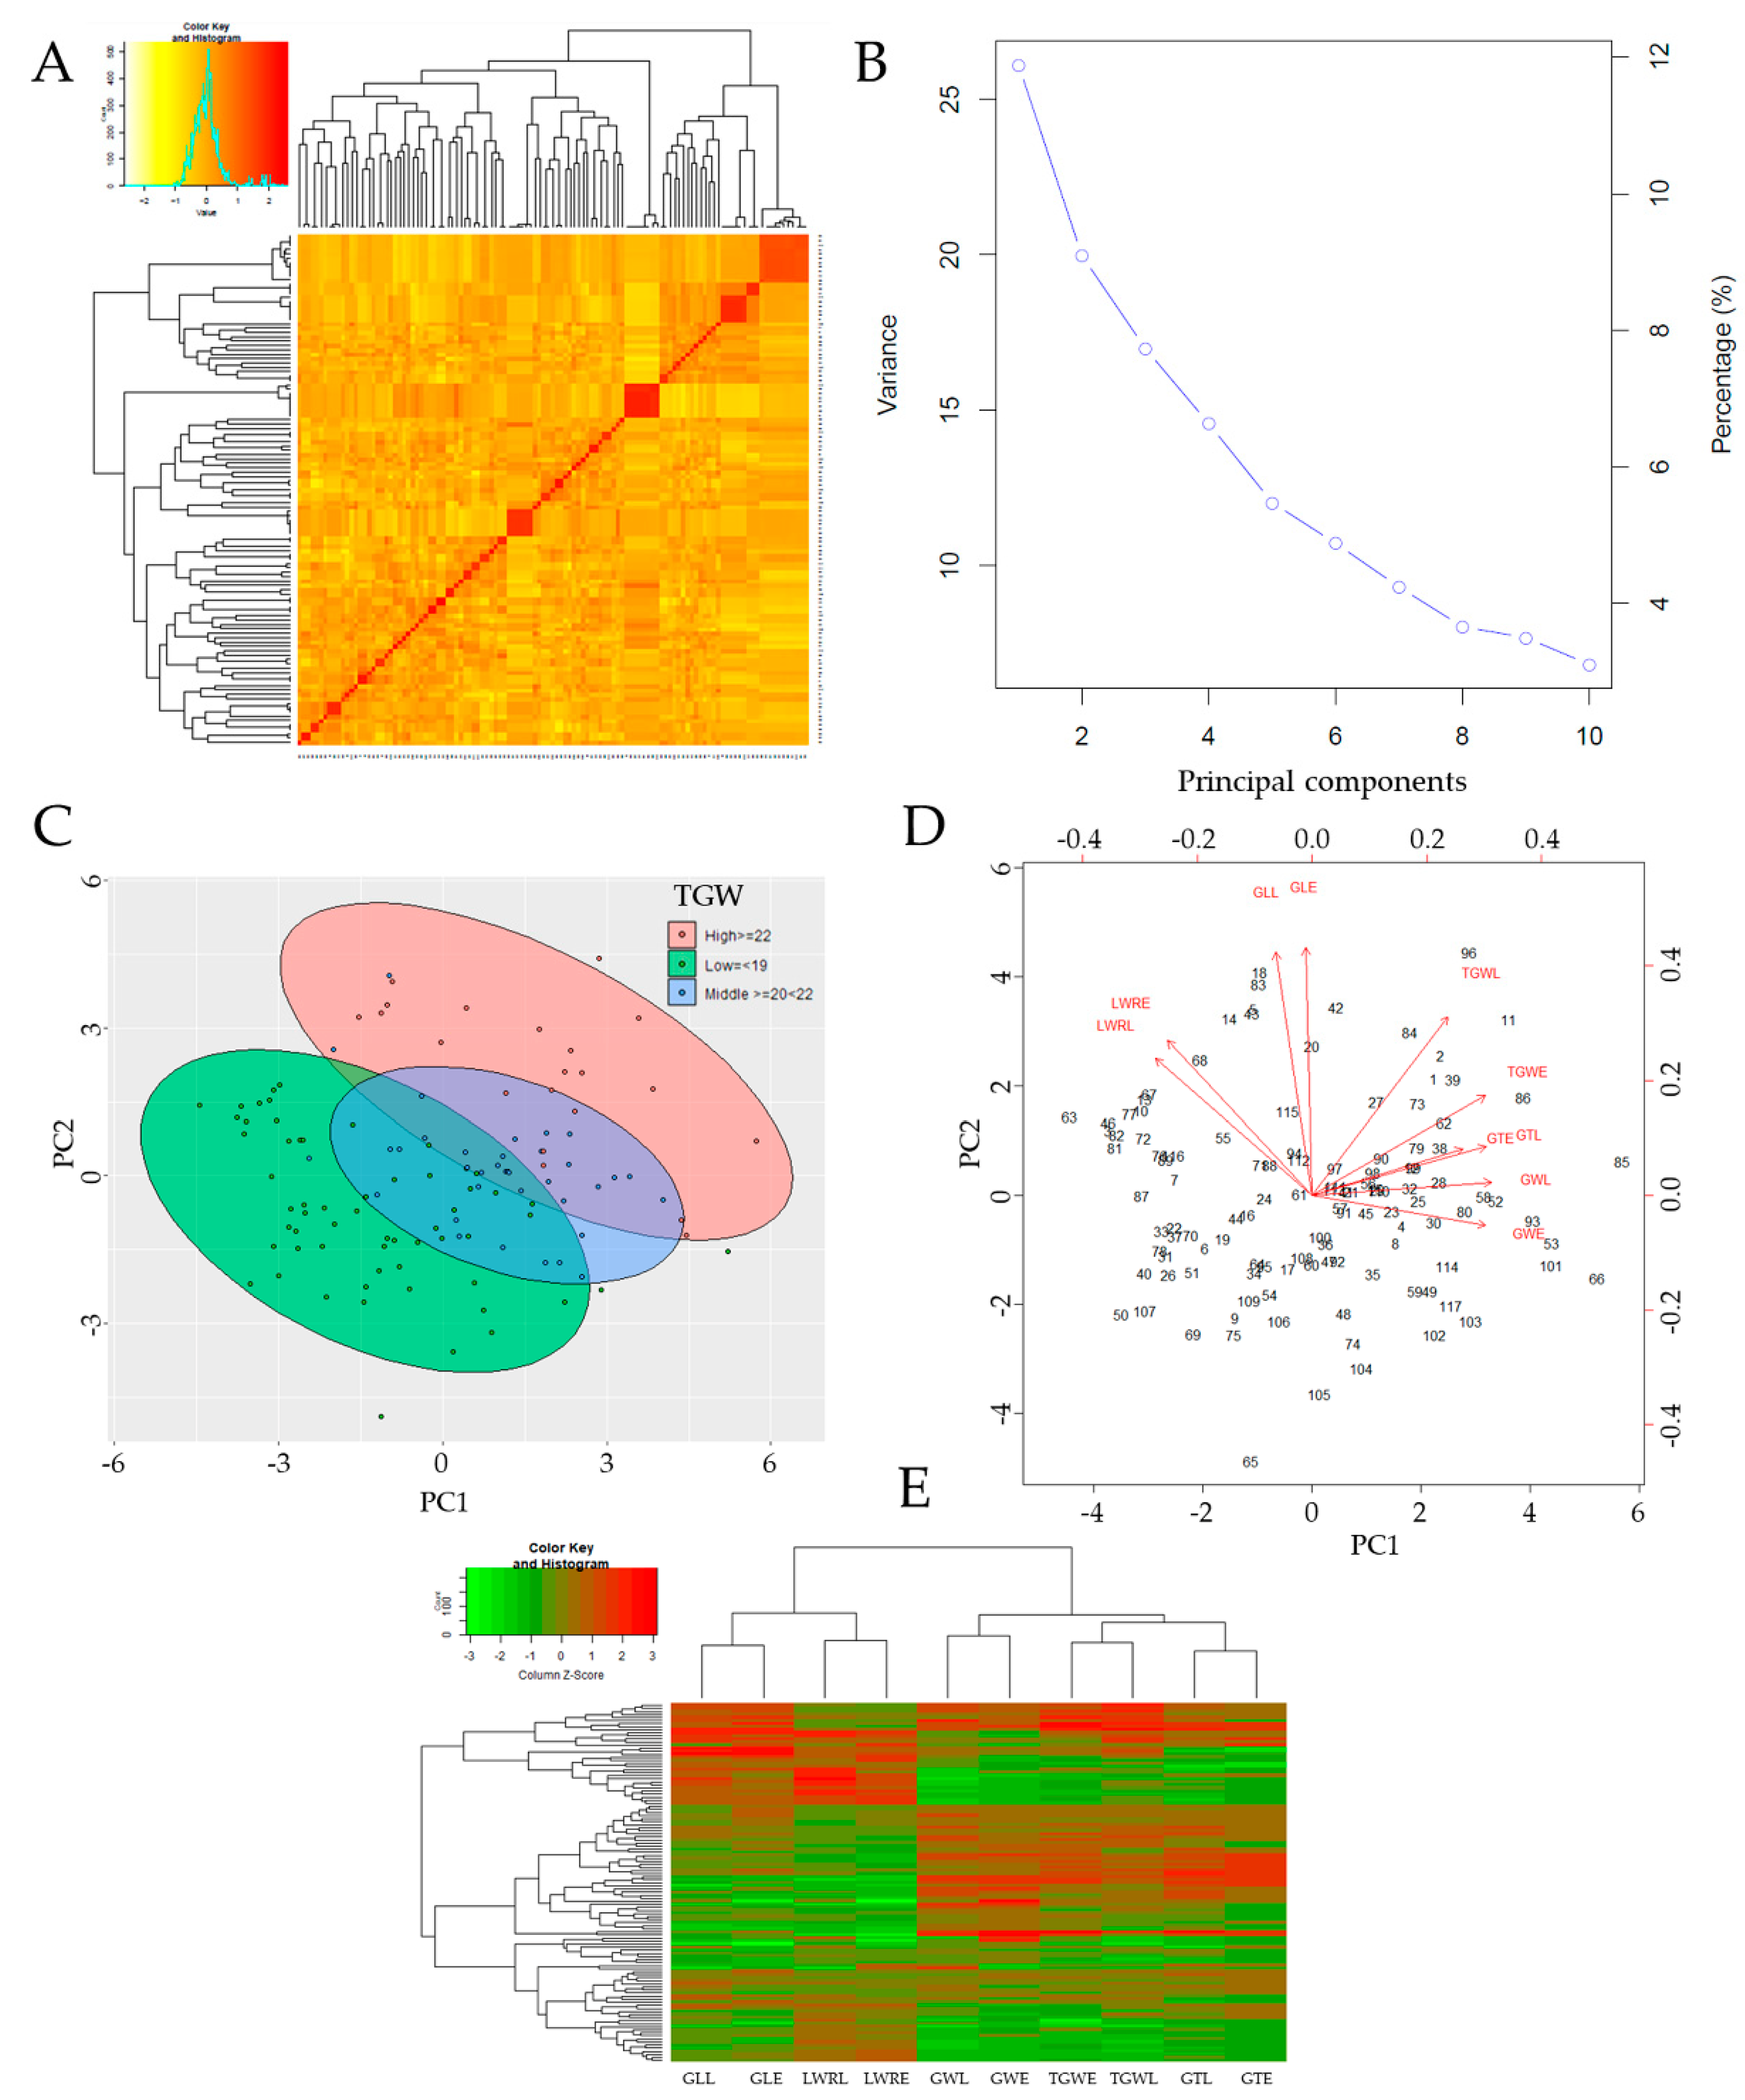
3.2. Relatedness and Principal Component Analysis (PCA)

The panel A in Figure 4 showed the Kompetitive Allele-Specific marker-based kinship matrix (co-ancestry or half relatedness), revealing the distribution of coefficients of co-ancestry of the doubled haploid lines used as the mapping population. In addition, the principal component analysis (PCA, eigenvalues) showed the contribution from three (3) principal components (PCs, Figure 4B). Furthermore, DH lines were grouped into three (3) different clusters with regard to their thousand grain weight (TGW) (Figure 4C). Moreover, panel D in Figure 4 indicates that the grain lengths (GL) of early- and late-transplanted DH lines were positively correlated. Similarly, grain thickness (GT), grain width (GW), and grain length–width ratio (LWR) showed a strong positive correlation for both transplanting periods. This was also verified for the thousand grain weight (TGW) in both early- and late-transplanting periods.
From another perspective, the data in panel E in Figure 4 groups GL and LWR in the same cluster, while GW, TGW, and GT are assigned to a different cluster (column dendrogram on top). Principal component 1 (PC1), 2 (PC2), and 3 (PC3) explained 26.4%, 18.4%, and 12.1% of the proportion of variance of the observed grain traits phenotypes, respectively, resulting in a cumulative proportion of 56.9%.

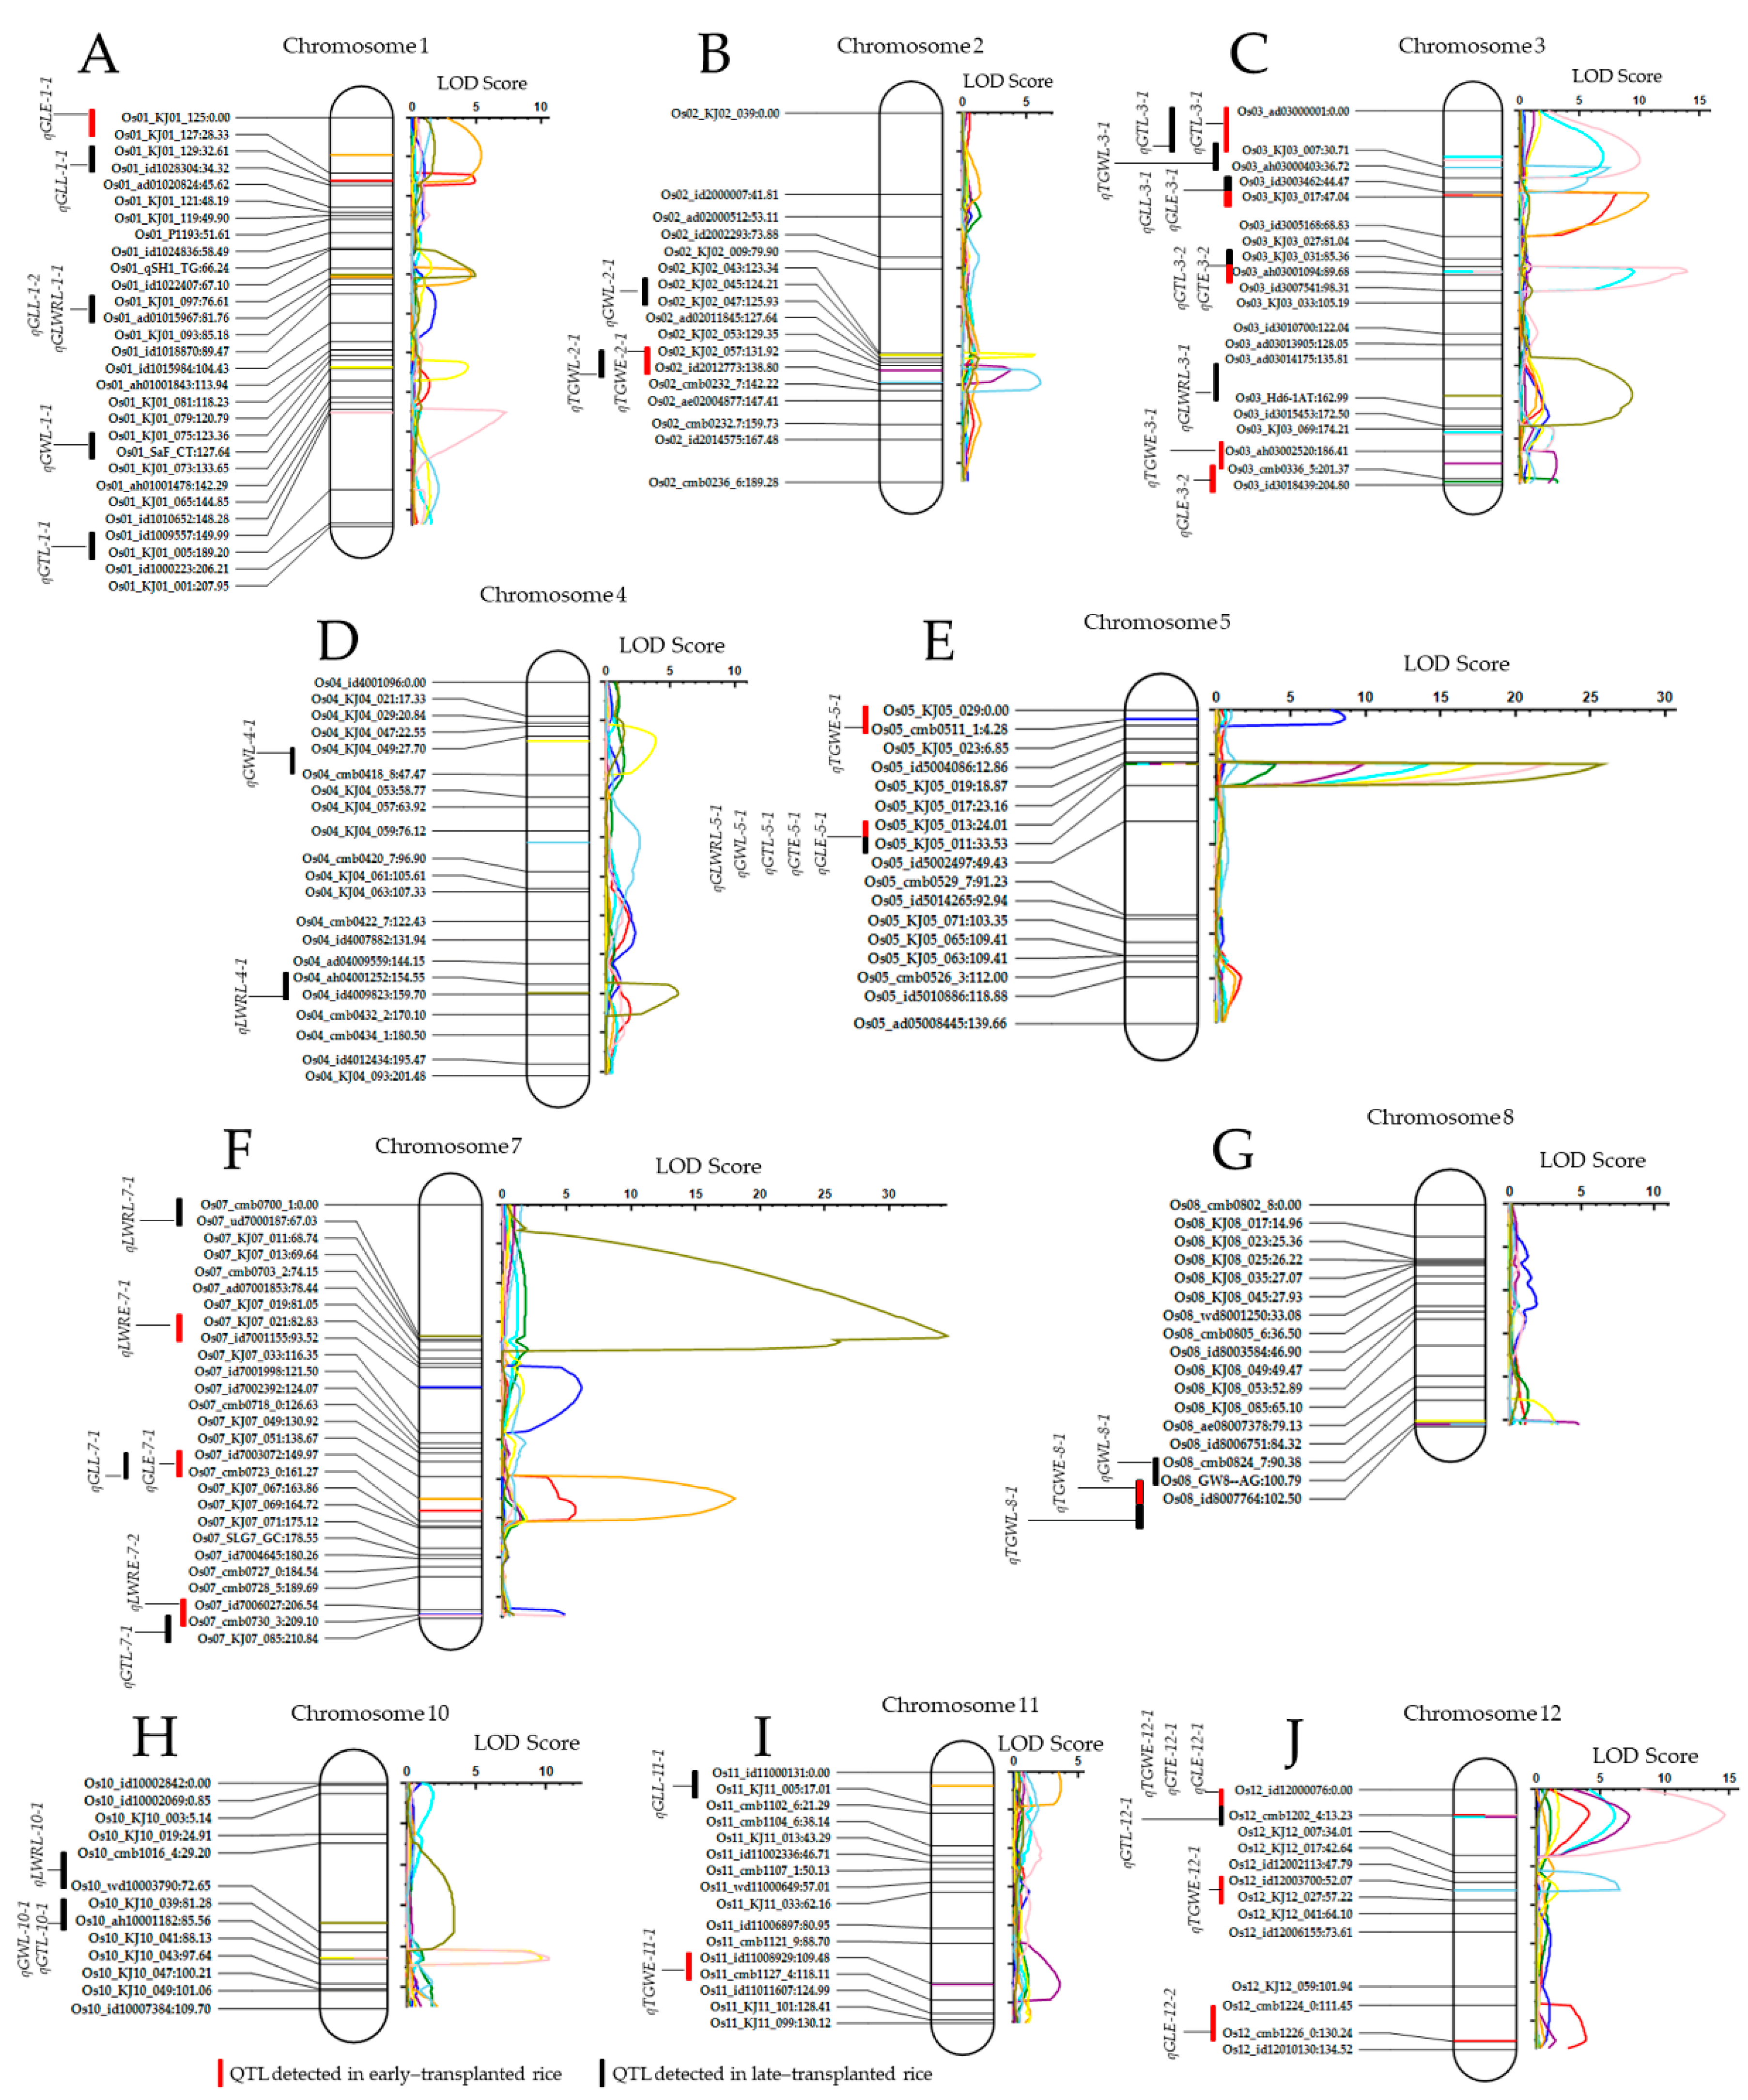
3.3. Detected Quantitative Traits Loci (QTLs) Associated with Rice Grain Traits Mapped on Different Chromosomes

The genotype and phenotype data were used to perform linkage mapping and QTL analysis. The results revealed that a total of 48 QTLs (all traits considered) associated with the studied grain traits, were mapped to all rice chromosomes, except chromosomes 6 and 9 (Table 1, Figure 5A–J). In essence, seven QTLs (qGLE-1-1, logarithm of the odds (LOD) of 4.85; qGLE-3-1, LOD: 8.1; qGLE-3-1, LOD: 8.1; qGLE-3-2, LOD of 3.1; qGLE-5-1, LOD of 3.9; qGLE-7-1, LOD: 5.7; qGLE-12-1, LOD: 4.1; and qGLE-12-2, LOD: 3.9) were associated with grain length (GLE) of early-transplanted rice DH lines (Table 1, Figure 5).
In the case of grain length of late-transplanted DH lines, five QTLs (qGLL-1-1, LOD: 5.4; qGLL-1-2, LOD: 4.6; qGLL-7-1, LOD: 18.0; and qGLL-11-1, LOD: 3.6) were detected. Of this number, qGLL-7-1, flanked by id7003072 and cmb0723_0 markers, accounted for 32.2% of the PVE. The additive effects of 0.116 (qGLE-3-1) and 0.1963 (qGLL-7-1) showed that the allele from 93-11 contributed the observed phenotypic variation for grain length in both early- and late-transplanted rice.
In addition, six QTLs (qGWL-1-1, LOD: 4.3; qGWL-2-1, LOD: 5.6; qGWL-4-1, LOD: 3.8; qGWL-5-1, LOD: 17.2; qGWL-8-1, LOD: 3.1; and qGWL-10-1, LOD: 9.6) associated with grain width were detected in late-transplanted rice, of which qGWL-5-1 was identified as the major QTL (LOD: 17.2), accounting for 31.7% of the PVE. For grain thickness of both early- and late-transplanted rice, four QTLs (qGTE-3-1, LOD: 9.9; qGTE-3-2, LOD: 9.5; qGTE-5-1, LOD: 14.2; and qGTE-12-1, LOD: 6.1) and seven QTLs (qGTL-1-1, LOD: 7.2; qGTL-3-1, LOD: 9.0; qGTL-3-2, LOD: 13.9; qGTL-5-1, LOD: 21.9; qGTL-7-1, LOD: 4.9; qGTL-10-1, LOD: 10.2; and qGTL-12-1, LOD: 14.6) were identified, respectively. Interestingly, the qGTE-5-1, flanked by KJ05_017 and KJ05_013 markers, was detected as the major QTL associated with grain thickness in both early- and late-transplanted rice; the LOD scores were of 9.5 and 21.9, and the PVE of about 20.3% and 23.3%, respectively. The recorded additive effects (−0.046) of the major QTL qGWL-5-1 indicated that the allele from Milyang352 contributed to the observed phenotypic variation for grain width.
Moreover, three QTLs associated with rice grain length–width ratio in early-transplanted rice (qLWRE-5-1, LOD: 9.8; qLWRE-7-1, LOD: 6.1; and qLWRE-7-2, LOD: 4.8) and late-transplanted rice (qLWRL-1-1, LOD: 4.9; qLWRL-3-1, LOD: 9.4; qLWRL-4-1, LOD: 5.6; qLWRL-5-1, LOD: 25.8; qLWRL-7-1, LOD: 34.5; and qLWRL-10-1, LOD: 3.4) were detected. Among them, qLWRE-5-1, flanked by KJ05_017 and KJ05_013 markers, and qLWRL-7-1, flanked by cmb0700_1 and ud7000187 markers, were identified as major QTLs accounting for 18.9% and 37.7% of the phenotypic variation explained (PVE), respectively. The recorded additive effects (LWRE, -0.894; LWRL: 0.1677) indicated that alleles from Milyang352 and 93-11 contributed to the observed LWR phenotypic variation in early- and late-transplanted rice, respectively.
Furthermore, six and four QTLs associated with thousand grain weight (TGW) in early- and late-transplanted rice were detected, and mapped to chromosomes 2, 3, 5, 8, 11, and 12 (for early-transplanted rice), and 2, 3, 8, and 12 (for late-transplanted rice). Of these QTLs, qTGWE-5-1, flanked by KJ05_029 and cmb0511_1 markers, and qTGWL-3-1, flanked by KJ03_007 and ah03000403 markers, accounted for 23.4% and 14.5% of the total phenotypic variation explained (PVE). The additive effects, 0.1099 (qTGWE-5-1) and 0.9248 (qTGWL-3-1), revealed that alleles from 93-11 contributed to the observed phenotypic variation for TGW in both early- and late-transplanted DH lines.

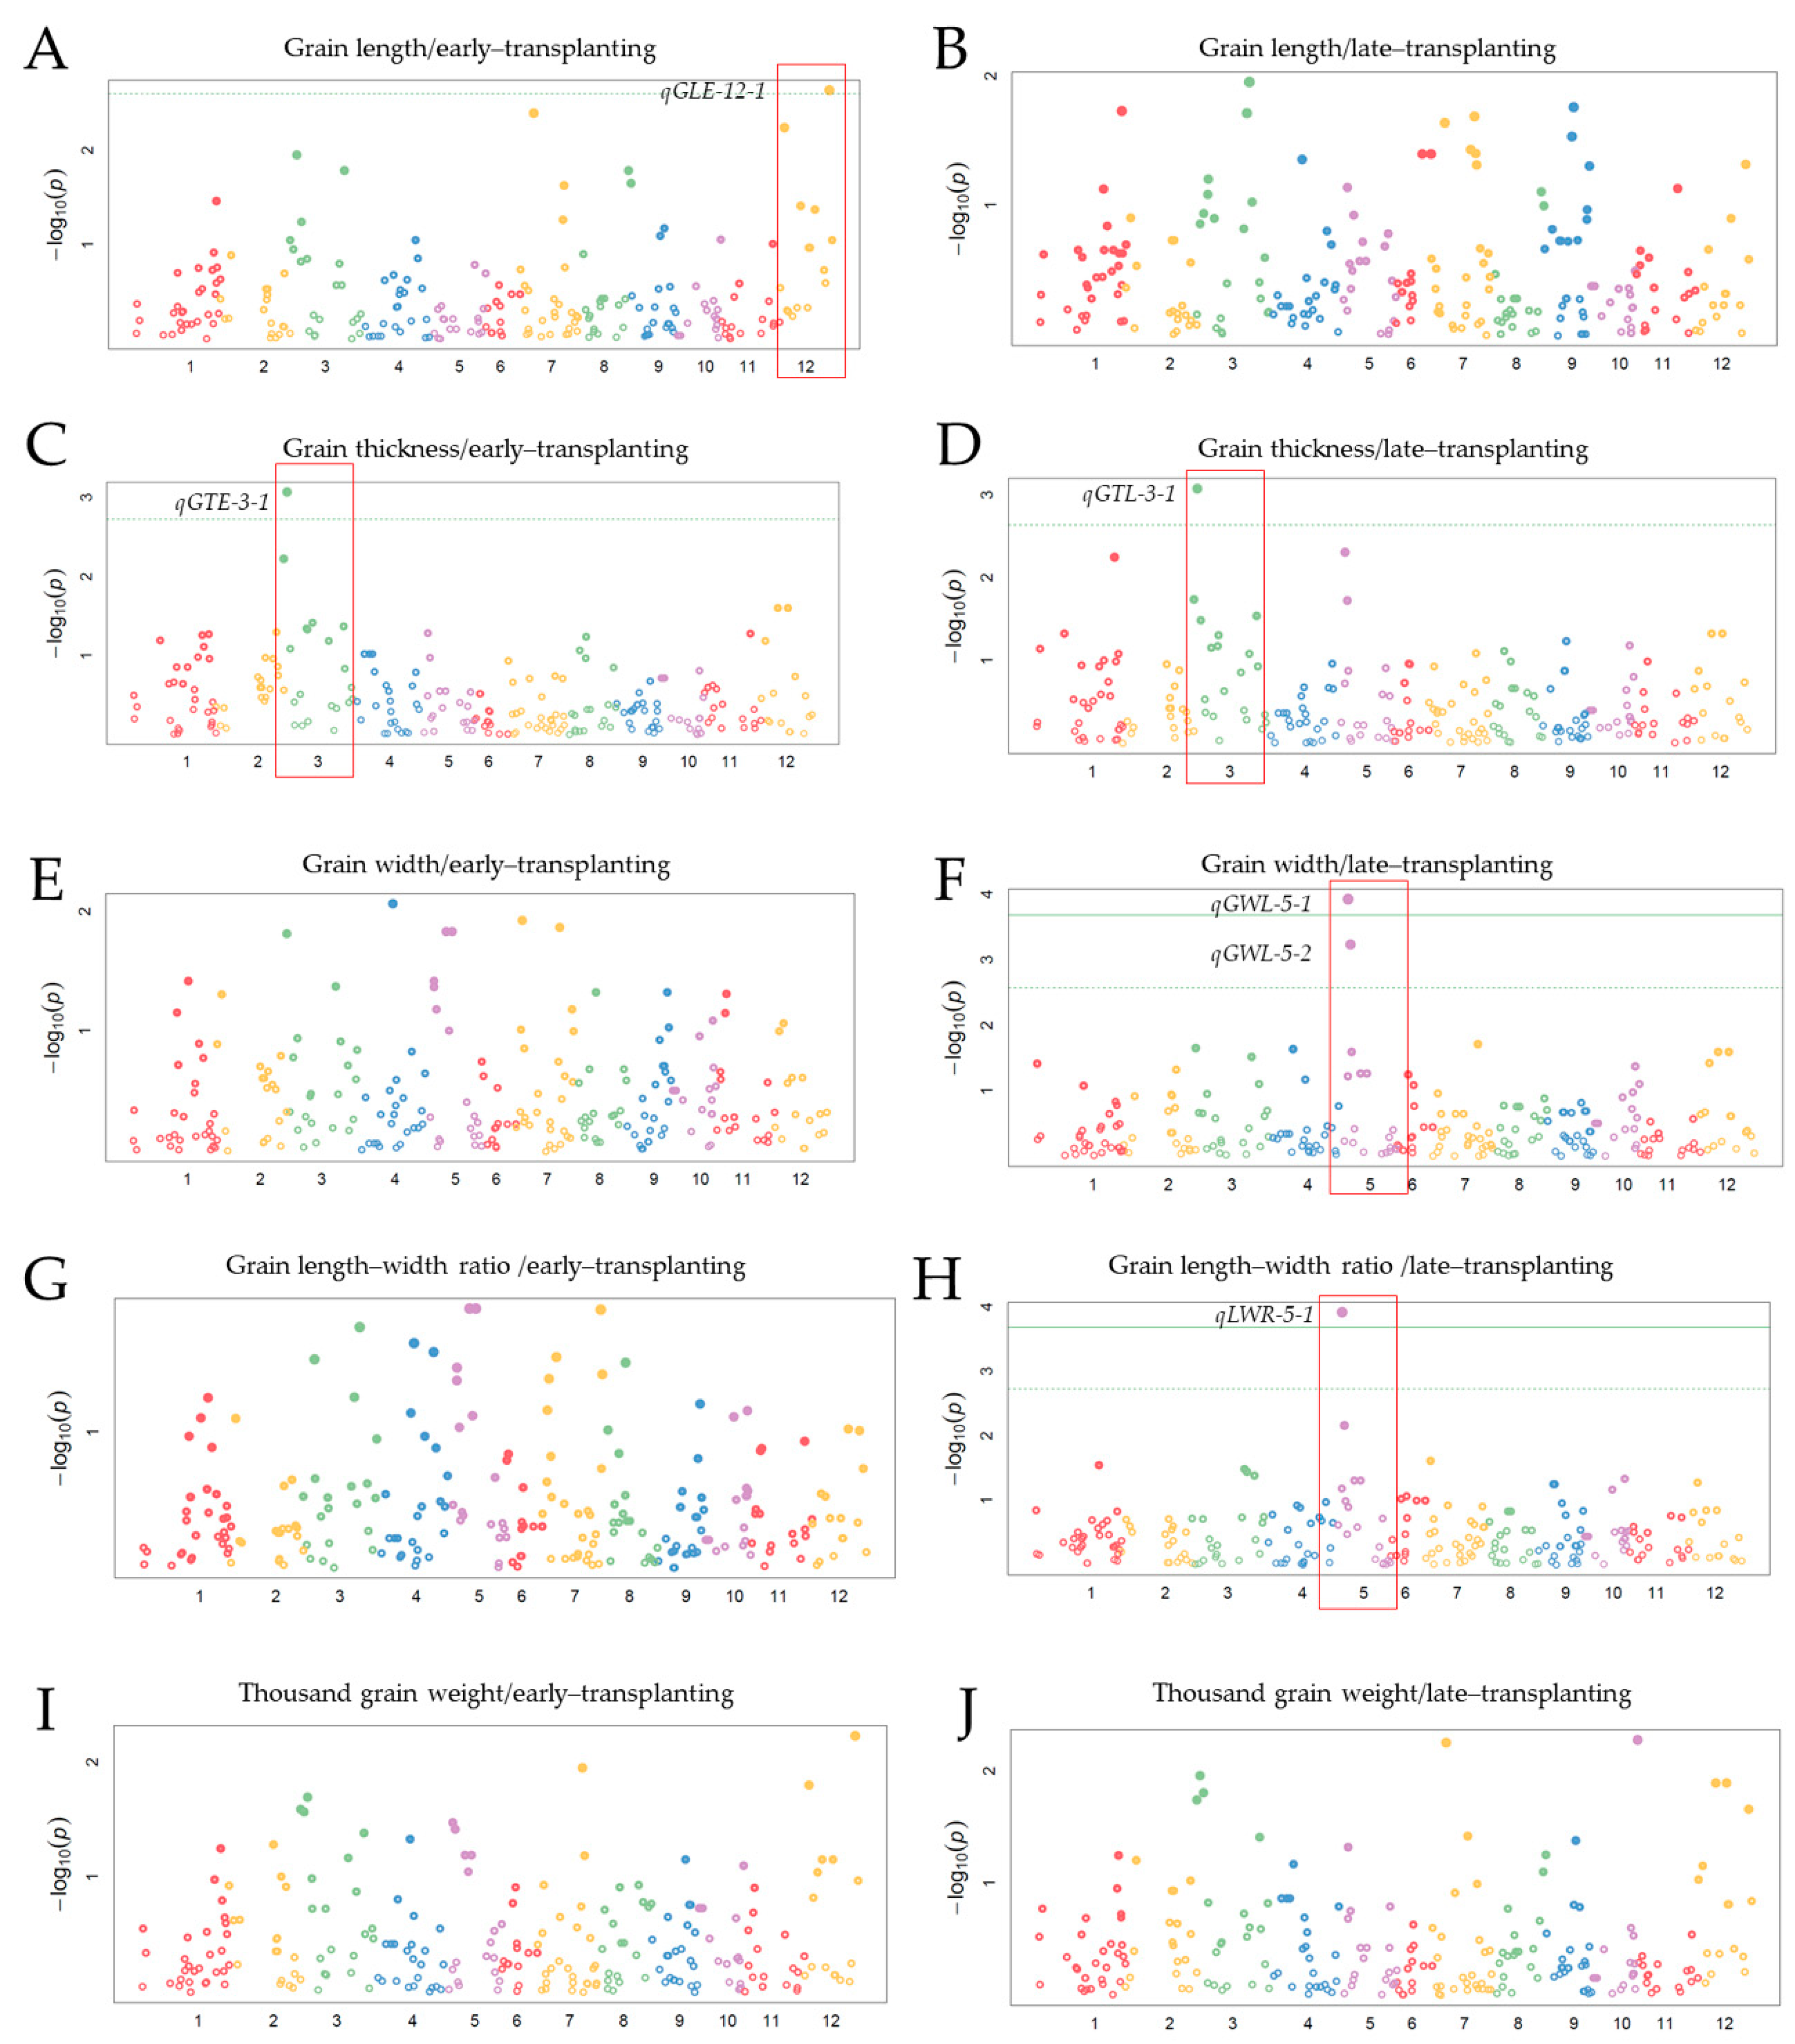
3.4. Detected QTLs by Genome-Wide Association Study (GWAS)

With the purpose of investigating the possibility for detecting genetic loci associated with complex rice grain traits, a joint linkage mapping–GWAS approach was employed. With the same raw data used for linkage mapping and QTL analysis, the GWAS results revealed that both approaches co-detected QTLs, qGLE-12-1 and qGLE-12-2, mapped to chromosome 12, associated with grain length, with cmb1202_4 and cmb1226_0 closely linked, respectively (Figure 6A). Similarly, using the same approach, the QTL qGTE-3-1 associated with grain thickness (GT), and mapped to chromosome 3, was detected with the same KASP marker linked to the QTL (KJ03_007) (Figure 6C,D). In the same way, qGWL-5-1, associated with grain width (GW) of late-transplanted rice, was similarly detected by linkage mapping and GWAS, with KJ05_013 KASP marker being closer to the QTL (Figure 6F). In addition, the QTL qLWRL-5-1 associated with grain length–width ratio of late-transplanted rice, was co-detected by both linkage mapping and GWAS on chromosome 5, with KJ05_017 maker linked to the QTL (Figure 6H). However, significant QTLs for thousand grain weight were only detected using linkage mapping but not GWAS in both early- and late-transplanted rice (Figure 6I–J).
Candidate genes (Table 2) were pooled from the genetic regions covered by the QTLs co-detected by both linkage mapping and Genome-Wide Association Studies (GWAS) on chromosome 5 flanked by KJ05_17 (4,783,888bp) and KJ05_13 (5,984,919) KASP markers.
Grain shape and weight have been shown to be regulated at different levels of the plant metabolism. It is said that carbohydrates regulate different aspects of plant growth via the modulation of cell division, and expansion. Among the identified candidate genes (Table 2), DUF581 (domain of unknown function-581 containing proteins) was reported to be a generic SnRK1 (Sucrose nonfermenting-1 (SNF1)-related protein kinase) interaction module and co-expressed with SnRK1 during plant cell signaling [93]. SnRK1 has also been suggested as a positive regulator of seed maturation and ABA signaling [95] and cell division [96]. In the same way, MFP1 (MAR-BINDING FILAMENT-LIKE PROTEIN 1, AT3G16000) was proposed to be involved in starch biosynthetic process in Arabidopsis [94]. Moreover, the cytochrome P450 encoding gene (LOC_Os05g08850) was also found within the region covered by qGW-5-1/qGT-5-1/qGLWR-5-1/qTGW-5-1, mapped to chromosome 5. In a study conducted by Tanabe and his colleagues [51], a cytochrome P450 (CYP724B1), located on chromosome 4, was found to be encoded by the DWARF11 gene (LOC_Os04g39430), proposed to be involved in the regulation of seed length in rice. The alignment of the protein sequences of both Cytochrome P450 encoding genes revealed that they were 93% similar (data not shown). Additionally, a gene encoding ubiquitin-conjugating enzyme E2, found in the same genetic region could play an important role in the regulation of grain shape and weight in rice. A recent study identified GW2 as a major QTL for grain width; GW2 encodes an E3 ubiquitin ligase possessing a new type RING domain, functioning as a negative factor for grain width by mediating the degradation of substrate in cell division [49].

4. Discussion

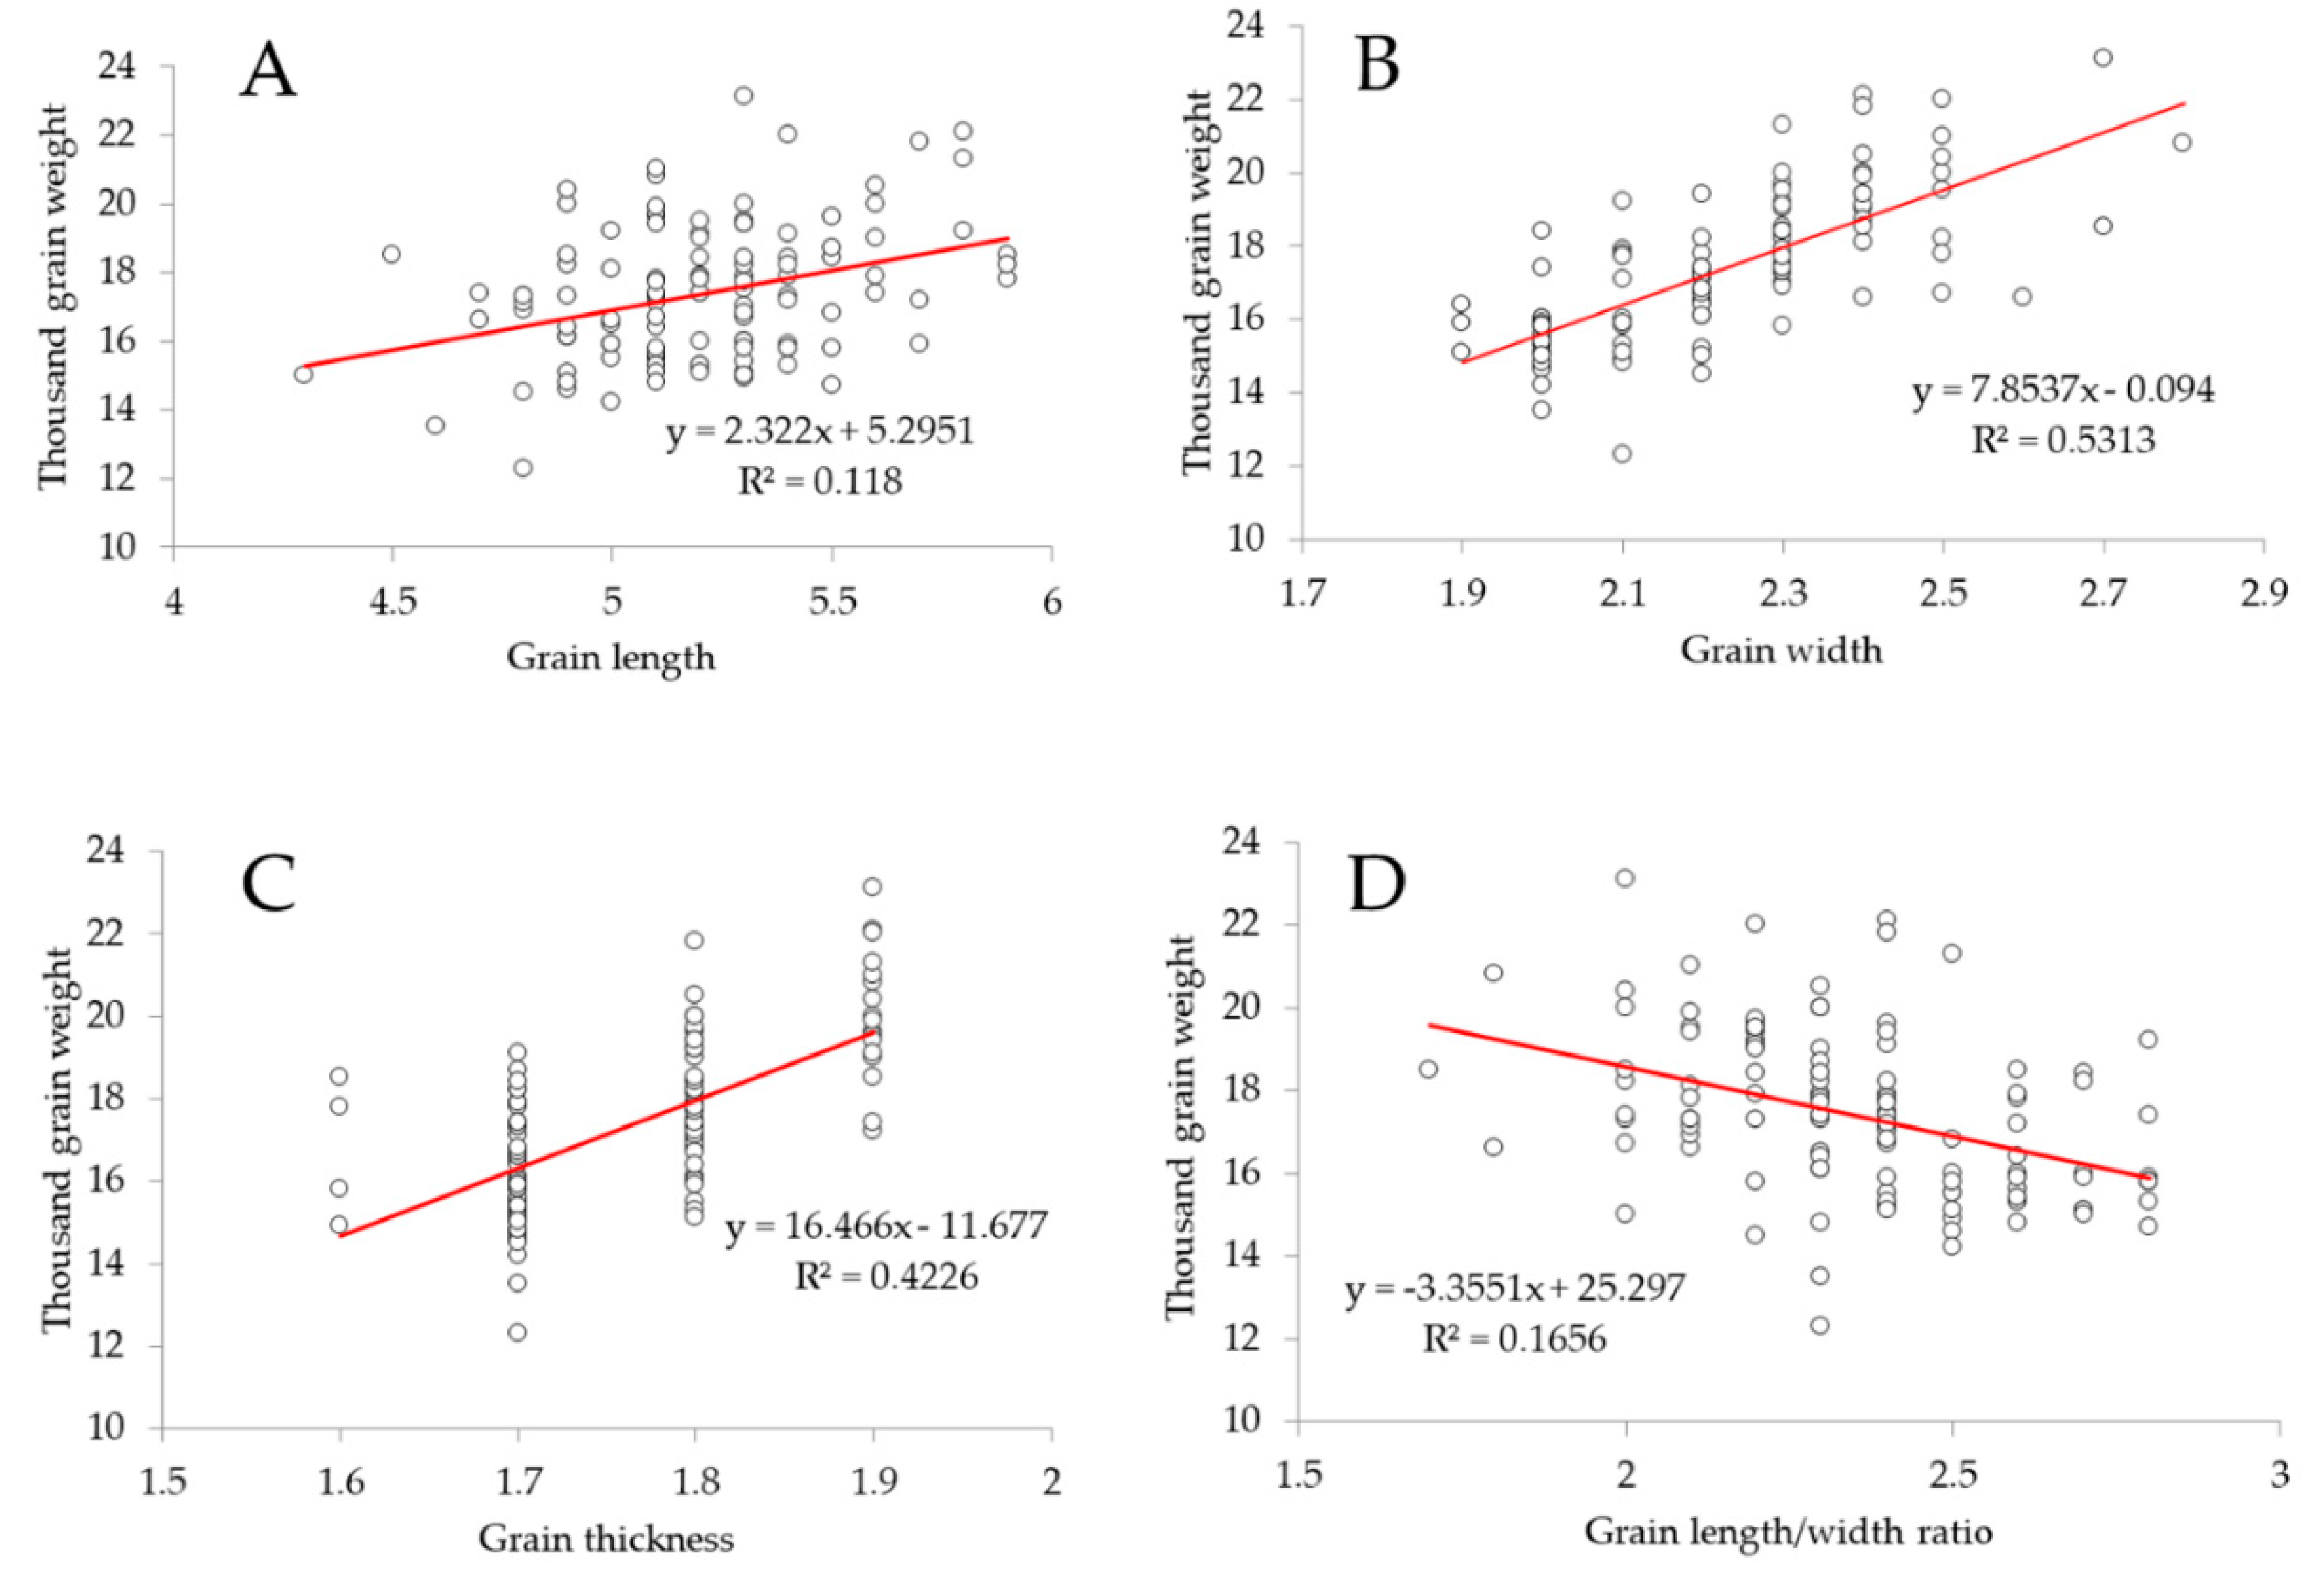
4.1. Grain Width and Thickness are Closely Related to Grain Weight in Rice

Previous reports have suggested that grain weight is affected by grain shape attributes, such as grain length, width, thickness, and grain length–width ratio. The results of the linear regression analysis (Figure 2) revealed that of all the evaluated rice grain traits, only grain width and grain thickness showed a strong positive correlation with grain weight (here expressed as thousand grain weight). On the contrary, a very weak positive correlation, which could also be regarded as a non-existing correlation, was observed between grain length and grain weight, while a very weak negative correlation was recorded between grain length–width ratio and grain weight. It is then suggested that a unit increase in grain width would result in an increase in grain weight by one unit. Similarly, an increase in grain thickness would increase grain weight by the same measure. In addition, changes in grain length or grain length–width ratio would not cause fundamental changes in rice grain weight.

4.2. Combined Linkage Map and Genome-Wide Association Study (GWAS) Detected Similar Genetic Loci Associated with Grain Shape and Weight in Rice

Many agronomic traits of rice are said to be controlled by multiple quantitative trait loci (QTLs) [40,41]. Permanent populations that include doubled haploid (DH) population [35], and recombinant inbred lines (RILs) [81] have been widely used for detecting QTLs associated with various agronomic traits in rice. Several studies have proposed a large number of QTLs controlling grain traits in rice in different environments [18,26,43,44]. Most of the reported QTLs (major and minor) related to grain shape or weight are mapped across 8–10 rice chromosomes, with diverse contributions to the overall phenotypic variation explained in rice [35,42,44,45,46]. However, out of the numerous reported QTLs associated with grain shape or weight, only a small number of QTLs have been isolated and characterized so far [47].
In the present study, a total of 48 QTLs associated with various grain traits were detected, using Kompetitive Allele-Specific PCR (KASP) markers in a doubled haploid (DH) population grown under two transplanting periods (early- and late-transplanting time). Results showed that only one QTL for grain length was similarly detected in both early- and late-transplanted DH lines, and mapped to chromosome 3 (qGLE-3 and qGLL-3) (Table 1); the other QTLs were specific to each transplanting time, and were mapped to chromosome 1 but different positions (qGLE-1-1, qGLL-1-1, and qGLL-1-2), chromosome 7 (qGLE-7, and qGLL-7-1), and chromosome 12 (qGLE-12-1, qGLE-12-2, only for early-transplanted rice). A study conducted by Zeng and colleagues reported that OsPPKL1 [48], RING-type E3 ubiquitin ligase [49], GS3 [50], Dwarf11 (reduced seed length) [51], GIF1 (Grain incomplete filling) [52], and FLO2 (Floury endosperm2) [53] were identified as important genes, covered by qGL3, qGW2, qGS3, and associated with grain length, grain weight, grain shape and weight, and grain size, respectively, and mapped to chromosome 4 in rice.
Furthermore, our study identified two QTLs associated with grain width in early-transplanted rice, which were mapped to chromosomes 3 (qGWE-3) and 5 (qGWE-5), the latter being similarly detected in late-transplanted rice (qGWL-5); whereas others, mapped to chromosomes 1, 2, 4, 8 and 10, were specific to late-transplanted rice. Similarly, GW5 (qGW5), [27,54], GS5 (qGS5) [55], SRS3 (small and round seed) [56], and Dwarf1 [57], previously characterized genes, have been suggested to be involved in the control of grain width and weight, the regulation of grain size, and the regulation of grain length, respectively, and mapped to chromosome 5.
For grain thickness, three QTLs associated with this trait were commonly detected in both early- and late-transplanted rice; of this number, two QTLs were mapped to chromosome 3 (qGT-3-1, and qGT-3-2), and one to chromosome 5 (qGT-5-1). Interestingly, the genetic region covered by qGT-5-1 was similarly associated with grain width in both early- and late-transplanted rice. The additional detected QTLs associated with grain thickness (4 QTLs), and mapped to chromosomes 7 (qGTL-7), 10 (qGTL-10), and 12 (qGTE-12-1, and qGTL-12-1), were specific to each transplanting period. Moreover, of all detected QTLs associated with grain length–width ratio (LWR), one QTL (qLWR-5; PVE: 22.9%) that was mapped to chromosome 5 in late-transplanted rice, was equally associated with grain width, and grain thickness. This would imply that grain width, thickness, and grain length–width are closely related, and could be controlled by the same QTL covered by qGW-5-1/qGT-5-1/qGLWR-5-1, with the phenotypic variation explained (PVE) ranging from 15.6%–31.7% for grain width (early- and late-transplanting, respectively), and 14.2%–21.9% for grain thickness (early- and late-transplanting, respectively), and 22.9% for grain length–width ratio of late-transplanted rice. In rice, grain weight has been reported to be affected by grain shape attributes (grain length, width, and thickness). With this consideration, rice grain weight and shape were said to be closely related [25,26]. Our data showed that qTGW-5-1 (PVE: 18.9%), associated with thousand grain weight of both early- and late-transplanted and mapped to chromosome 5, coincided with qGW-5-1/qGT-5-1/qGLWR-5-1, associated with grain shape, and flanked by same KASP markers, KJ05_17 and KJ05_13 markers (1.201Mbp), on chromosome 5. It is therefore becoming obvious that the genetic loci covered by the above-mentioned QTLs would be involved in the control of rice grain width, thickness, length–width ratio, and grain weight. In addition, qTGW-2, mapped to chromosome 2, and flanked by KJ02_057 and id2012773 markers, was similarly detected in both early- and late-transplanted rice. In the same way, qTGW-8 (PVE: 8.6%, and 6.7% in early-transplanted and late-transplanted rice, respectively), flanked by GW8-AG and id8007764 markers, which was mapped to chromosome 8, was similarly identified in both early- and late-transplanted rice. However, the QTLs, qTGWE-3-1, qTGWE-11, and qTGWE-12-1, associated with grain weight, and mapped to chromosomes 3, 11, and 12, were specific to early-transplanted rice, whereas qTGWL-3-1 and TGWL-12-1 were solely detected in late-transplanted rice. Additionally, when comparing the two transplanting periods (early- and late-transplanting), most of the detected QTLs associated with grain shape and size were shown to be specific to early- or late-transplanted rice growth conditions.
Other reports have suggested that the following genes, SRS1/DEP2 (regulating seed size) [58], OsSPL16-GW7 (qGW7/qGL7, associated with grain size and weight) [59,60], and OsSPL13-GLW7 (qGLW7, associated with grain length–width ratio) [61], located on chromosome 7, OsSPL16-GW8 (Controlling grain shape and quality) [62], SP1 (Short panicle 1) [63], and SRS5 [64], located on chromosome 11, play important roles in the control of grain shape or weight in rice. Moreover, fine-mapping of previously identified QTLs for grain shape and weight revealed that another set of genetic loci responsible for the changes in the major attributes of grain shape or weight, were mapped to chromosome 1 (qGW1-1, qGW1-2, qGRL1.1, qTGW1.1a, and qTGW1.1b) [65,66,67], chromosome 2 (qGS2) [68], chromosome 3 (qGL-3a, qGW3-1, qGW3, TGW3b/SPP3b, qTGW3-1, and qTGW3.2 [69,70,71,72,73,74], chromosome 4 (qGL4b,and Spr3) [75], Chromosome 6 (GW6, and spd6) [71,76], chromosome 7 (qGL7, GS7, and qSS7) [77,78,79], chromosome 8 (gw8.1) [97], chromosome 9 (gw9.1) [80], and chromosome 11 (tgw1.1) [98].
From another perspective, we were interested to investigate the possibility of detecting similar genetic loci, and sustain their association with rice grain shape or weight, using two widely known genetics approaches (linkage mapping and Genome-Wide Association Study, GWAS). We therefore performed a GWAS based on the same genotype and phenotype data used for linkage mapping and QTL analysis. It was interesting to see that qGLE-12-1 and qGLE-12-2, mapped to chromosome 12 (cmb1202_4 and cmb1226_0 are closest KASP markers, respectively) (Figure 6A) and associated with grain shape and weight, were detected equally by GWAS and linkage mapping. Similarly, using both approaches, qGTE-3-1 (associated with grain thickness) earlier detected by linkage mapping, was also identified by GWAS on chromosome 3, with the same KASP marker linked to the QTL (KJ03_007) (Figure 6C,D). In the same way, qGWL-5-1, associated with grain width (GW) of late-transplanted rice, was detected, and KJ05_013 KASP marker was linked to the QTL (Figure 6F). In addition, qLWRL-5-1, associated with grain length–width ratio in late-transplanted rice, was also detected by both linkage mapping and GWAS on chromosome 5, with KASP marker KJ05_017 being closer to the QTL (Figure 6H). In contrast, significant QTLs for grain weight (TGW) were only identified by linkage mapping but not GWAS, as observed in the study under both early- and late-transplanting periods.
Some of the identified candidate genes (Table 2), such as DUF581 was reported to be a generic SnRK1 interaction module and co-expressed with SnRK1 during plant cell signaling [93]. SnRK1 has previously been proposed to be a positive regulator of seed maturation and ABA signaling [95], and cell division [96]. In the same perspective, MFP1 was proposed to be involved in starch biosynthetic process in Arabidopsis [94]. In addition, the cytochrome P450 was similarly found within the region covered by qGW-5-1/qGT-5-1/qGLWR-5-1/qTGW-5-1 (Chromosome 5). Tanabe and his colleagues [51] reported that a cytochrome P450 (chromosome 4) encoded by the DWARF11 gene was involved in the regulation of seed length in rice. Interestingly, the alignment of the protein sequences of both Cytochrome P450 encoding genes revealed that they were 93% similar. Additionally, a ubiquitin-conjugating enzyme E2 encoding gene, found in the same genetic region, could play an important role in the regulation of grain shape and weight in rice. Recently, GW2 was identified as a major QTL for grain width; GW2 encodes an E3 ubiquitin ligase possessing a new type RING domain, functioning as a negative factor for grain width by mediating the degradation of substrate in cell division [49]. Thus, taken together, the candidate genes located in the genetic region covered by the QTLs, qGW-5-1/qGT-5-1/qGLWR-5-1/qTGW-5-1, could play active roles in the regulation of major rice grain shape and grain weight, with regard to their predicted functions and annotations, and similarity with previously reported genes.

5. Conclusions

Grain trait attributes, such as grain length, width, thickness, grain length–width ratio, and grain weight are major targets for many breeding programs, due to their importance in consumption, trade, and industry. In the current study, we investigated quantitative trait loci (QTLs) associated with grain shape and weight through a joint linkage mapping–Genome-Wide Association Study (GWAS) strategy in a rice doubled haploid population, using Kompetitive Allele-Specific PCR (KASP) markers. Results indicated that qGLE-12-1 and qGLE-12-2 mapped to chromosome 12, qGTE-3-1 mapped to chromosome 3, and qGWL-5-1 and qLWRL-5-1, mapped to chromosome 5, were co-detected by both linkage mapping and GWAS. In addition, qGLL-7-1, qGLE-3-1, and qLWRL-7-1, detected only by linkage mapping, recorded the highest phenotypic variation explained (PVE) of 32.5%, 19.3%, and 37.7% for grain length, and grain length–width ratio, respectively, contributed by the allele from 93-11. Similarly, qTGWE-5-1 showed the highest contribution to the PVE for grain weight (23.4%). This study also revealed that the QTLs qGW-5-1, qGT-5-1, qGLWR-5-1, and qTGW-5-1 were co-located on chromosome 5 and flanked by KJ05_17 (left) and KJ05_13 (right) KASP markers. Therefore, these QTLs are suggested to collectively govern grain shape and weight, and taken together, the candidate genes located in the above mentioned QTLs (chromosome 5) are proposed to play active roles in the regulation of grain shape and weight in rice, with regard to their predicted functions, similarity with previously reported genes, and their annotations. Thus, combined linkage mapping–GWAS could be used as a reliable strategy for detecting major QTLs controlling quantitative traits in rice.

Supplementary Materials

The following are available online at https://0-www-mdpi-com.brum.beds.ac.uk/2073-4395/10/10/1532/s1, Figure S1: Changes in weather parameters during the rice cropping season of 2018, Figure S2: Changes in rice grain traits phenotypes of a doubled haploid population of two transplanting periods, Table S1: Correlation analysis between traits at early and late transplanting

Author Contributions

Conceptualization, J.-H.L., J.-W.K., D.S., and J.H.C.; methodology, J.-H.L., Z.P., and J.-W.K.; validation, J.-M.K., J.-H.L., S.-M.L. and D.S.; formal analysis, J.-H.L., J.-W.K., J.-Y.L., D.-S.P., S.-M.L., and S.-Y.P.; investigation, J.-H.L., Z.P., S.-M.L., and J.-W.K.; resources J.-H.L., J.-W.K., S.-M.L. and J.H.C.; data curation, N.R.K., J.-W.K., and S.-Y.P.; writing—original draft preparation, N.R.K.; writing—review and editing, J.-H.L.; visualization, D.-S.P.; supervision, J.-H.L. and J.-M.K.; project administration, J.-H.L. and J.-M.K.; funding acquisition, J.-M.K and J.-H.L. All authors have read and agreed to the published version of the manuscript.

Funding

This work was supported by the Cooperative Research Program for Agriculture Science & Technology Development (Project No. PJ01506901) and “2019KoRAA Long-Term Training Program” of the Rural Development Administration, Republic of Korea.

Conflicts of Interest

The authors declare no conflict of interest.

References

  1. Yuan, L.; Denning, G.; Mew, T. Hybrid rice breeding for super high yield. In Proceedings of the China-IRRI Dialogue held in Beijing, Beijing, China, 7–8 November 1997; pp. 10–12. [Google Scholar]
  2. Kumar, A.; Dixit, S.; Ram, T.; Yadaw, R.; Mishra, K.; Mandal, N. Breeding high-yielding drought-tolerant rice: Genetic variations and conventional and molecular approaches. J. Exp. Bot. 2014, 65, 6265–6278. [Google Scholar] [CrossRef] [Green Version]
  3. Goto, A.; Sasahara, H.; Shigemune, A.; Miura, K. Hokuriku 193: A new high-yielding indica rice cultivar bred in Japan. Jpn. Agric. Res. Q. JARQ 2009, 43, 13–18. [Google Scholar] [CrossRef] [Green Version]
  4. UN DESA. World Population Projected to Reach 9.8 Billion in 2050, and 11.2 Billion in 2100. 2019. Available online: https://www.un.org/development/desa/en/news/population/world-population-prospects-2017.html (accessed on 9 October 2020).
  5. He, P.; Li, S.; Qian, Q.; Ma, Y.; Li, J.; Wang, W.; Chen, Y.; Zhu, L. Genetic analysis of rice grain quality. Theor. Appl. Genet. 1999, 98, 502–508. [Google Scholar] [CrossRef]
  6. Juliano, B.; Duff, B. Rice grain quality as an emerging priority in National rice breeding programmes. In Rice Grain Marketing and Quality Issues; IRRI: Laguna, Philippines, 1991; pp. 55–64. [Google Scholar]
  7. Hori, K. Genetic dissection and breeding for grain appearance quality in rice. In Rice Genomics, Genetics and Breeding; Springer: New York, NY, USA, 2018; pp. 435–451. [Google Scholar]
  8. Ahmar, S.; Gill, R.A.; Jung, K.-H.; Faheem, A.; Qasim, M.U.; Mubeen, M.; Zhou, W. Conventional and Molecular Techniques from Simple Breeding to Speed Breeding in Crop Plants: Recent Advances and Future Outlook. Int. J. Mol. Sci. 2020, 21, 2590. [Google Scholar] [CrossRef] [PubMed] [Green Version]
  9. Lenaerts, B.; Collard, B.C.; Demont, M. Improving global food security through accelerated plant breeding. Plant. Sci. 2019, 287, 110207. [Google Scholar] [CrossRef]
  10. Bhargava, A.; Srivastava, S. Participatory Plant Breeding: Concept and Applications; Springer: New York, NY, USA, 2019. [Google Scholar]
  11. Campbell, M.T.; Bandillo, N.; Al Shiblawi, F.R.A.; Sharma, S.; Liu, K.; Du, Q.; Schmitz, A.J.; Zhang, C.; Véry, A.-A.; Lorenz, A.J. Allelic variants of OsHKT1; 1 underlie the divergence between indica and japonica subspecies of rice (Oryza sativa) for root sodium content. PLoS Genet. 2017, 13, e1006823. [Google Scholar] [CrossRef] [PubMed]
  12. Bush, W.S.; Moore, J.H. Genome-wide association studies. PLoS Comput. Biol. 2012, 8, e1002822. [Google Scholar] [CrossRef] [Green Version]
  13. Hirschhorn, J.N.; Daly, M.J. Genome-wide association studies for common diseases and complex traits. Nat. Rev. Genet. 2005, 6, 95–108. [Google Scholar] [CrossRef] [PubMed]
  14. Famoso, A.N.; Zhao, K.; Clark, R.T.; Tung, C.-W.; Wright, M.H.; Bustamante, C.; Kochian, L.V.; McCouch, S.R. Genetic architecture of aluminum tolerance in rice (Oryza sativa) determined through genome-wide association analysis and QTL mapping. PLoS Genet. 2011, 7, e1002221. [Google Scholar] [CrossRef] [Green Version]
  15. Zargar, S.M.; Rai, V. Plant Omics and Crop Breeding; CRC Press: Boca Raton, FL, USA, 2017. [Google Scholar]
  16. Kim, S.; Tang, H.; Mardis, E.R. Genome Sequencing Technology and Algorithms; Artech House, Inc.: Norwood, MA, USA, 2007. [Google Scholar]
  17. Kasahara, M.; Morishita, S. Large-Scale Genome Sequence Processing; Imperial College Press: London, UK, 2006. [Google Scholar]
  18. Huang, R.; Jiang, L.; Zheng, J.; Wang, T.; Wang, H.; Huang, Y.; Hong, Z. Genetic bases of rice grain shape: So many genes, so little known. Trends Plant Sci. 2013, 18, 218–226. [Google Scholar] [CrossRef]
  19. Gnanamanickam, S.S. Rice and its importance to human life. In Biological Control of Rice Diseases; Springer: New York, NY, USA, 2009. [Google Scholar]
  20. Liu, X.; Wei, X.; Sheng, Z.; Jiao, G.; Tang, S.; Luo, J.; Hu, P. Polycomb protein OsFIE2 affects plant height and grain yield in rice. PLoS ONE 2016, 11, e0164748. [Google Scholar] [CrossRef] [PubMed]
  21. Guo, T.; Chen, K.; Dong, N.-Q.; Shi, C.-L.; Ye, W.-W.; Gao, J.-P.; Shan, J.-X.; Lin, H.-X. Grain size and number1 negatively regulates the OsMKKK10-OsMKK4-OsMPK6 cascade to coordinate the trade-off between grain number per panicle and grain size in rice. Plant Cell 2018, 30, 871–888. [Google Scholar] [CrossRef] [Green Version]
  22. Zhou, Y.; Miao, J.; Gu, H.; Peng, X.; Leburu, M.; Yuan, F.; Gu, H.; Gao, Y.; Tao, Y.; Zhu, J. Natural variations in SLG7 regulate grain shape in rice. Genetics 2015, 201, 1591–1599. [Google Scholar] [CrossRef] [PubMed] [Green Version]
  23. Li, N.; Xu, R.; Duan, P.; Li, Y. Control of grain size in rice. Plant Reprod. 2018, 31, 237–251. [Google Scholar] [CrossRef] [PubMed]
  24. Xue, W.; Xing, Y.; Weng, X.; Zhao, Y.; Tang, W.; Wang, L.; Zhou, H.; Yu, S.; Xu, C.; Li, X. Natural variation in Ghd7 is an important regulator of heading date and yield potential in rice. Nat. Genet. 2008, 40, 761–767. [Google Scholar] [CrossRef]
  25. Tan, Y.-F.; Xing, Y.-Z.; Li, J.-X.; Yu, S.-B.; Xu, C.-G.; Zhang, Q. Genetic bases of appearance quality of rice grains in Shanyou 63, an elite rice hybrid. Theor. Appl. Genet. 2000, 101, 823–829. [Google Scholar] [CrossRef]
  26. Zeng, Y.; Shi, J.; Ji, Z.; Wen, Z.; Liang, Y.; Yang, C. Combination of twelve alleles at six quantitative trait loci determines grain weight in rice. PLoS ONE 2017, 12, e0181588. [Google Scholar] [CrossRef] [Green Version]
  27. Weng, J.; Gu, S.; Wan, X.; Gao, H.; Guo, T.; Su, N.; Lei, C.; Zhang, X.; Cheng, Z.; Guo, X.; et al. Isolation and initial characterization of GW5, a major QTL associated with rice grain width and weight. Cell Res. 2008, 18, 1199–1209. [Google Scholar] [CrossRef] [PubMed]
  28. Unnevehr, L.; Duff, B.; Juliano, B. Consumer demand for rice grain quality: Introduction and major findings. In Consumer Demand for Rice Grain Quality; Unnevehr, L.J., Duff, B., Juliano, B.O., Eds.; International Rice Research Institute; International Development Research Center: Manila, Philippines; Ottawa, ON, Canada, 1992; pp. 5–19. [Google Scholar]
  29. Juliano, B.O.; Villareal, C. Grain Quality Evaluation of World Rices; IRRI: Manila, Philippines, 1993. [Google Scholar]
  30. Juliano, B. Rice Chemistry and Technology, 2nd ed.; American Association of Cereal Chemists, Incorporated: Saint Paul, MN, USA, 1985. [Google Scholar]
  31. Webb, B. Rice quality and grades. In Rice: Production and Utilization; Luh, B.S., Ed.; Avi Publishing Co., Inc.: Westport, CT, USA, 1980. [Google Scholar]
  32. Xia, D.; Zhou, H.; Qiu, L.; Jiang, H.; Zhang, Q.; Gao, G.; He, Y. Mapping and verification of grain shape QTLs based on an advanced backcross population in rice. PLoS ONE 2017, 12, e0187553. [Google Scholar] [CrossRef]
  33. Guo-Xin, Y.; Jin-Jie, L.; Zhang, Q.; Guang-Long, H.; Chao, C.; Bo, T.; Zhang, H.-L.; Zi-Chao, L. Mapping QTLs for Grain Weight and Shape Using Four Sister Near Isogenic Lines of Rice. Acta Agron. Sin. 2010, 36, 1310–1317. [Google Scholar]
  34. Xing, Y.; Tan, Y.-F.; Xu, C.-G.; Hua, J.-P.; Sun, X. Mapping quantitative trait loci for grain appearance traits of rice using a recombinant inbred line population. J. Integr. Plant Biol. 2001, 43, 721–726. [Google Scholar]
  35. Yoshida, S.; Ikegami, M.; Kuze, J.; Sawada, K.; Hashimoto, Z.; Ishii, T.; Nakamura, C.; Kamijima, O. QTL analysis for plant and grain characters of sake-brewing rice using a doubled haploid population. Breed. Sci. 2002, 52, 309–317. [Google Scholar] [CrossRef] [Green Version]
  36. Rabiei, B.; Valizadeh, M.; Ghareyazie, B.; Moghaddam, M.; Ali, A. Identification of QTLs for rice grain size and shape of Iranian cultivars using SSR markers. Euphytica 2004, 137, 325–332. [Google Scholar] [CrossRef]
  37. Bazrkar-Khatibani, L.; Fakheri, B.-A.; Hosseini-Chaleshtori, M.; Mahender, A.; Mahdinejad, N.; Ali, J. Genetic mapping and validation of quantitative trait loci (QTL) for the grain appearance and quality traits in rice (Oryza sativa L.) by using recombinant inbred line (RIL) population. Int. J. Genom. 2019, 2019. [Google Scholar] [CrossRef] [PubMed] [Green Version]
  38. Chen, J.; Zhou, H.; Gu, Y.; Xia, D.; Wu, B.; Gao, G.; Zhang, Q.; He, Y. Mapping and verification of grain shape QTLs based on high-throughput SNP markers in rice. Mol. Breed. 2019, 39, 42. [Google Scholar] [CrossRef]
  39. Jianlong, X.; Qingzhong, X.; Lijun, L.; Zhikang, L. Genetic dissection of grain weight and its related traits in rice (Oryza sativa L.). Zhongguo Shuidao Kexue 2002, 16, 6–10. [Google Scholar]
  40. Yano, M.; Sasaki, T. Genetic and molecular dissection of quantitative traits in rice. In Oryza: From Molecule to Plant; Springer: New York, NY, USA, 1997; pp. 145–153. [Google Scholar]
  41. Yamamoto, T.; Yonemaru, J.; Yano, M. Towards the understanding of complex traits in rice: Substantially or superficially? DNA Res. 2009, 16, 141–154. [Google Scholar] [CrossRef] [Green Version]
  42. Li, M.-M.; Lei, X.; Ren, J.-F.; Cao, G.-L.; Yu, L.-Q.; He, H.-H.; Han, L.-Z.; Koh, H.-j. Identification of quantitative trait loci for grain traits in japonica rice. Agric. Sci. China 2010, 9, 929–936. [Google Scholar] [CrossRef]
  43. Guangheng, Z.; Guoping, Z.; Qian, Q.; Luping, X.; Dali, Z.; Sheng, T.; Jingsong, B. QTL analysis of grain shape traits in different environments. Zhongguo Shuidao Kexue 2004, 18, 16–22. [Google Scholar]
  44. Hittalmani, S.; Shashidhar, H.; Bagali, P.G.; Huang, N.; Sidhu, J.; Singh, V.; Khush, G. Molecular mapping of quantitative trait loci for plant growth, yield and yield related traits across three diverse locations in a doubled haploid rice population. Euphytica 2002, 125, 207–214. [Google Scholar] [CrossRef]
  45. Yan, C.-J.; Liang, G.-H.; Chen, F.; Li, X.; Tang, S.-Z.; Yi, C.-D.; Tian, S.; Lu, J.-F.; Gu, M.-H. Mapping quantitative trait loci associated with rice grain shape based on an indica/japonica backcross population. Yi Chuan Xue Bao Acta Genet. Sinica 2003, 30, 711–716. [Google Scholar]
  46. Wacera, H.R.; Lee, H.-S.; Kim, K.-M. Biotechnology. Identification of Quantitative Trait Loci Associated with Grain Shape Using Cheongchenong/Nagdong Double Haploid Lines in Rice. Plant Breed. Biotechnol. 2016, 4, 188–197. [Google Scholar] [CrossRef]
  47. Yaobin, Q.; Peng, C.; Yichen, C.; Yue, F.; Derun, H.; Tingxu, H.; Xianjun, S.; Jiezheng, Y. QTL-Seq identified a major QTL for grain length and weight in rice using near isogenic F2 population. Rice Sci. 2018, 25, 121–131. [Google Scholar] [CrossRef]
  48. Zhang, X.; Wang, J.; Huang, J.; Lan, H.; Wang, C.; Yin, C.; Wu, Y.; Tang, H.; Qian, Q.; Li, J.; et al. Rare allele of OsPPKL1 associated with grain length causes extra-large grain and a significant yield increase in rice. Proc. Natl. Acad. Sci. USA 2012, 109, 21534–21539. [Google Scholar] [CrossRef] [PubMed] [Green Version]
  49. Song, X.-J.; Huang, W.; Shi, M.; Zhu, M.-Z.; Lin, H.-X. A QTL for rice grain width and weight encodes a previously unknown RING-type E3 ubiquitin ligase. Nat. Genet. 2007, 39, 623–630. [Google Scholar] [CrossRef]
  50. Fan, C.; Xing, Y.; Mao, H.; Lu, T.; Han, B.; Xu, C.; Li, X.; Zhang, Q. GS3, a major QTL for grain length and weight and minor QTL for grain width and thickness in rice, encodes a putative transmembrane protein. Theor. Appl. Genet. 2006, 112, 1164–1171. [Google Scholar] [CrossRef]
  51. Tanabe, S.; Ashikari, M.; Fujioka, S.; Takatsuto, S.; Yoshida, S.; Yano, M.; Yoshimura, A.; Kitano, H.; Matsuoka, M.; Fujisawa, Y.; et al. A Novel Cytochrome P450 Is Implicated in Brassinosteroid Biosynthesis via the Characterization of a Rice Dwarf Mutant, dwarf11, with Reduced Seed Length. Plant Cell 2005, 17, 776–790. [Google Scholar] [CrossRef] [PubMed] [Green Version]
  52. Wang, E.; Wang, J.; Zhu, X.; Hao, W.; Wang, L.; Li, Q.; Zhang, L.; He, W.; Lu, B.; Lin, H.; et al. Control of rice grain-filling and yield by a gene with a potential signature of domestication. Nat. Genet. 2008, 40, 1370–1374. [Google Scholar] [CrossRef]
  53. She, K.-C.; Kusano, H.; Koizumi, K.; Yamakawa, H.; Hakata, M.; Imamura, T.; Fukuda, M.; Naito, N.; Tsurumaki, Y.; Yaeshima, M.; et al. A Novel Factor FLOURY ENDOSPERM2 Is Involved in Regulation of Rice Grain Size and Starch Quality. Plant Cell 2010, 22, 3280–3294. [Google Scholar] [CrossRef] [Green Version]
  54. Shomura, A.; Izawa, T.; Ebana, K.; Ebitani, T.; Kajiya-Kanegae, H.; Konishi, S.; Yano, M. Deletion in a gene associated with grain size increased yields during rice domestication. Nat. Genet. 2008, 40, 1023–1028. [Google Scholar] [CrossRef]
  55. Li, Y.; Fan, C.; Xing, Y.; Jiang, Y.; Luo, L.; Sun, L.; Shao, D.; Xu, C.; Li, X.; Xiao, J.; et al. Natural variation in GS5 plays an important role in regulating grain size and yield in rice. Nat. Genet. 2011, 43, 1266–1269. [Google Scholar] [CrossRef] [PubMed]
  56. Kitagawa, K.; Kurinami, S.; Oki, K.; Abe, Y.; Ando, T.; Kono, I.; Yano, M.; Kitano, H.; Iwasaki, Y. A Novel Kinesin 13 Protein Regulating Rice Seed Length. Plant Cell Physiol. 2010, 51, 1315–1329. [Google Scholar] [CrossRef] [Green Version]
  57. Ashikari, M.; Wu, J.; Yano, M.; Sasaki, T.; Yoshimura, A. Rice gibberellin-insensitive dwarf mutant gene Dwarf 1 encodes the α-subunit of GTP-binding protein. Proc. Natl. Acad. Sci. USA 1999, 96, 10284–10289. [Google Scholar] [CrossRef] [PubMed] [Green Version]
  58. Abe, Y.; Mieda, K.; Ando, T.; Kono, I.; Yano, M.; Kitano, H.; Iwasaki, Y. The SMALL AND ROUND SEED1 (SRS1/DEP2) gene is involved in the regulation of seed size in rice. Genes Genet. Syst. 2010, 85, 327–339. [Google Scholar] [CrossRef] [PubMed] [Green Version]
  59. Wang, S.; Li, S.; Liu, Q.; Wu, K.; Zhang, J.; Wang, S.; Wang, Y.; Chen, X.; Zhang, Y.; Gao, C.; et al. The OsSPL16-GW7 regulatory module determines grain shape and simultaneously improves rice yield and grain quality. Nat. Genet. 2015, 47, 949–954. [Google Scholar] [CrossRef] [PubMed]
  60. Wang, Y.; Xiong, G.; Hu, J.; Jiang, L.; Yu, H.; Xu, J.; Fang, Y.; Zeng, L.; Xu, E.; Xu, J.; et al. Copy number variation at the GL7 locus contributes to grain size diversity in rice. Nat. Genet. 2015, 47, 944–948. [Google Scholar] [CrossRef]
  61. Si, L.; Chen, J.; Huang, X.; Gong, H.; Luo, J.; Hou, Q.; Zhou, T.; Lu, T.; Zhu, J.; Shangguan, Y.; et al. OsSPL13 controls grain size in cultivated rice. Nat. Genet. 2016, 48, 447–456. [Google Scholar] [CrossRef]
  62. Wang, S.; Wu, K.; Yuan, Q.; Liu, X.; Liu, Z.; Lin, X.; Zeng, R.; Zhu, H.; Dong, G.; Qian, Q.; et al. Control of grain size, shape and quality by OsSPL16 in rice. Nat. Genet. 2012, 44, 950–954. [Google Scholar] [CrossRef]
  63. Li, S.; Qian, Q.; Fu, Z.; Zeng, D.; Meng, X.; Kyozuka, J.; Maekawa, M.; Zhu, X.; Zhang, J.; Li, J.; et al. Short panicle1encodes a putative PTR family transporter and determines rice panicle size. Plant J. 2009, 58, 592–605. [Google Scholar] [CrossRef]
  64. Segami, S.; Kono, I.; Ando, T.; Yano, M.; Kitano, H.; Miura, K.; Iwasaki, Y. Small and round seed 5 gene encodes alpha-tubulin regulating seed cell elongation in rice. Rice 2012, 5, 4. [Google Scholar] [CrossRef] [Green Version]
  65. Yu, S.; Yang, C.-D.; Fan, Y.; Zhuang, J.; Li, X. Genetic dissection of a thousand-grain weight quantitative trait locus on rice chromosome. Sci. Bull. 2008, 53, 2326–2332. [Google Scholar] [CrossRef] [Green Version]
  66. Singh, R.; Singh, A.K.; Sharma, T.R.; Singh, A.; Singh, N.K. Fine mapping of grain length QTLs on chromosomes 1 and 7 in Basmati rice (Oryza sativa L.). J. Plant Biochem. Biotechnol. 2011, 21, 157–166. [Google Scholar] [CrossRef]
  67. Zhang, H.-W.; Fan, Y.-Y.; Zhu, Y.-J.; Chen, J.-Y.; Yu, S.; Zhuang, J. Dissection of the qTGW1.1 region into two tightly-linked minor QTLs having stable effects for grain weight in rice. BMC Genet. 2016, 17, 98. [Google Scholar] [CrossRef] [PubMed] [Green Version]
  68. Zhang, W.; Sun, P.; He, Q.; Shu, F.; Wang, J.; Deng, H. Fine mapping of GS2, a dominant gene for big grain rice. Crop. J. 2013, 1, 160–165. [Google Scholar] [CrossRef] [Green Version]
  69. Wan, X.Y.; Wan, J.M.; Jiang, L.; Wang, J.K.; Zhai, H.Q.; Weng, J.F.; Wang, H.L.; Lei, C.L.; Zhang, X.; Cheng, Z.J.; et al. QTL analysis for rice grain length and fine mapping of an identified QTL with stable and major effects. Theor. Appl. Genet. 2006, 112, 1258–1270. [Google Scholar] [CrossRef] [PubMed]
  70. Li, J.; Thomson, M.; McCouch, S.R. Fine Mapping of a Grain-Weight Quantitative Trait Locus in the Pericentromeric Region of Rice Chromosome. Genetics 2004, 168, 2187–2195. [Google Scholar] [CrossRef] [PubMed] [Green Version]
  71. Guo, L.; Ma, L.; Jiang, H.; Zeng, D.; Hu, J.; Wu, L.; Gao, Z.; Zhang, G.; Qian, Q. Genetic Analysis and Fine Mapping of Two Genes for Grain Shape and Weight in Rice. J. Integr. Plant Biol. 2009, 51, 45–51. [Google Scholar] [CrossRef]
  72. Liu, T.; Shao, D.; Kovi, M.R.; Xing, Y. Mapping and validation of quantitative trait loci for spikelets per panicle and 1,000-grain weight in rice (Oryza sativa L.). Theor. Appl. Genet. 2009, 120, 933–942. [Google Scholar] [CrossRef]
  73. Zhang, Q.; Yao, G.-X.; Hu, G.-L.; Chen, C.; Tang, B.; Zhang, H.; Li, Z.-C. Fine Mapping of qTGW3-1, a QTL for 1000-Grain Weight on Chromosome 3 in Rice. J. Integr. Agric. 2012, 11, 879–887. [Google Scholar] [CrossRef]
  74. Tang, S.-Q.; Shao, G.-N.; Wei, X.; Chen, M.-L.; Sheng, Z.-H.; Luo, J.; Jiao, G.-A.; Xie, L.-H.; Hu, P. QTL mapping of grain weight in rice and the validation of the QTL qTGW3. Gene 2013, 527, 201–206. [Google Scholar] [CrossRef]
  75. Kato, T.; Segami, S.; Toriyama, M.; Kono, I.; Ando, T.; Yano, M.; Kitano, H.; Miura, K.; Iwasaki, Y. Detection of QTLs for grain length from large grain rice (Oryza sativa L.). Breed. Sci. 2011, 61, 269–274. [Google Scholar] [CrossRef] [Green Version]
  76. Shan, J.-X.; Zhu, M.-Z.; Shi, M.; Gao, J.-P.; Lin, H.-X. Fine mapping and candidate gene analysis of spd6, responsible for small panicle and dwarfness in wild rice (Oryza rufipogon Griff.). Theor. Appl. Genet. 2009, 119, 827–836. [Google Scholar] [CrossRef] [PubMed]
  77. Bai, X.; Luo, L.; Yan, W.; Kovi, M.R.; Zhan, W.; Xing, Y. Genetic dissection of rice grain shape using a recombinant inbred line population derived from two contrasting parents and fine mapping a pleiotropic quantitative trait locus qGL7. BMC Genet. 2010, 11, 16. [Google Scholar] [CrossRef] [PubMed] [Green Version]
  78. Shao, G.; Wei, X.; Chen, M.; Tang, S.; Luo, J.; Jiao, G.; Xie, L.; Hu, P. Allelic variation for a candidate gene for GS7, responsible for grain shape in rice. Theor. Appl. Genet. 2012, 125, 1303–1312. [Google Scholar] [CrossRef] [PubMed]
  79. Qiu, X.; Gong, R.; Tan, Y.; Yu, S. Mapping and characterization of the major quantitative trait locus qSS7 associated with increased length and decreased width of rice seeds. Theor. Appl. Genet. 2012, 125, 1717–1726. [Google Scholar] [CrossRef] [PubMed]
  80. Xie, X.; Jin, F.; Song, M.-H.; Suh, J.-P.; Hwang, H.-G.; Kim, Y.-G.; McCouch, S.R.; Ahn, S.-N. Fine mapping of a yield-enhancing QTL cluster associated with transgressive variation in an Oryza sativa × O. rufipogon cross. Theor. Appl. Genet. 2007, 116, 613–622. [Google Scholar] [CrossRef]
  81. Onishi, K.; Horiuchi, Y.; Ishigoh-Oka, N.; Takagi, K.; Ichikawa, N.; Maruoka, M.; Sano, Y. A QTL Cluster for Plant Architecture and Its Ecological Significance in Asian Wild Rice. Breed. Sci. 2007, 57, 7–16. [Google Scholar] [CrossRef] [Green Version]
  82. Khush, G.S. Origin, dispersal, cultivation and variation of rice. Plant Mol. Biol. 1997, 35, 25–34. [Google Scholar] [CrossRef]
  83. Zhu, Q.; Ge, S. Phylogenetic relationships among A-genome species of the genus Oryza revealed by intron sequences of four nuclear genes. New Phytol. 2005, 167, 249–265. [Google Scholar] [CrossRef]
  84. Kato, S. On the affinity of rice varieties as shown by fertility of hybrid plants. Bull. Sci. Fac. Agric. Kyushu Univ. 1928, 3, 132–147. [Google Scholar]
  85. Lee, S.-M.; Kang, J.-W.; Lee, J.-Y.; Seo, J.; Shin, D.; Cho, J.-H.; Jo, S.; Song, Y.-C.; Park, D.-S.; Ko, J.-M.; et al. QTL Analysis for Fe and Zn Concentrations in Rice Grains Using a Doubled Haploid Population Derived from a Cross between Rice (Oryza sativa) Cultivar 93-11 and Milyang. Plant Breed. Biotechnol. 2020, 8, 69–76. [Google Scholar] [CrossRef]
  86. Kabange, N.R.; Park, S.-Y.; Shin, D.; Lee, S.-M.; Jo, S.-M.; Kwon, Y.; Cha, J.-K.; Song, Y.-C.; Ko, J.-M.; Lee, J.-H. Identification of a Novel QTL for Chlorate Resistance in Rice (Oryza sativa L.). Agriculture 2020, 10, 360. [Google Scholar] [CrossRef]
  87. Thorpe, R.S. Multiple group principal component analysis and population differentiation. J. Zool. 1988, 216, 37–40. [Google Scholar] [CrossRef]
  88. R Core Team. R: A Language and Environment for Statistical Computing; R Foundation for Statistical Computing: Vienna, Austria, 2013. [Google Scholar]
  89. Keb-Llanes, M.; Gonzalez, G.; Chi-Manzanero, B.; Infante, D. A rapid and simple method for small-scale DNA extraction inAgavaceae and other tropical plants. Plant Mol. Boil. Rep. 2002, 20, 299. [Google Scholar] [CrossRef]
  90. Cheon, K.-S.; Baek, J.; Cho, Y.-I.; Jeong, Y.-M.; Lee, Y.-Y.; Oh, J.; Won, Y.J.; Kang, D.-Y.; Oh, H.; Kim, S.L.; et al. Single Nucleotide Polymorphism (SNP) Discovery and Kompetitive Allele-Specific PCR (KASP) Marker Development with Korean Japonica Rice Varieties. Plant Breed. Biotechnol. 2018, 6, 391–403. [Google Scholar] [CrossRef]
  91. Seo, J.; Lee, G.; Jin, Z.; Kim, B.; Chin, J.H.; Koh, H.-J. Development and application of indica–japonica SNP assays using the Fluidigm platform for rice genetic analysis and molecular breeding. Mol. Breed. 2020, 40, 1–16. [Google Scholar] [CrossRef] [Green Version]
  92. Meng, L.; Li, H.; Zhang, L.; Wang, J. QTL IciMapping: Integrated software for genetic linkage map construction and quantitative trait locus mapping in biparental populations. Crop. J. 2015, 3, 269–283. [Google Scholar] [CrossRef] [Green Version]
  93. Nietzsche, M.; Schießl, I.; Börnke, F. The complex becomes more complex: Protein-protein interactions of SnRK1 with DUF581 family proteins provide a framework for cell-and stimulus type-specific SnRK1 signaling in plants. Front. Plant Sci. 2014, 5, 54. [Google Scholar] [CrossRef] [Green Version]
  94. Seung, D.; Schreier, T.B.; Bürgy, L.; Eicke, S.; Zeeman, S.C. Two Plastidial Coiled-Coil Proteins Are Essential for Normal Starch Granule Initiation in Arabidopsis. Plant Cell 2018, 30, 1523–1542. [Google Scholar] [CrossRef] [Green Version]
  95. Tsai, A.Y.-L.; Gazzarrini, S. Trehalose-6-phosphate and SnRK1 kinases in plant development and signaling: The emerging picture. Front. Plant Sci. 2014, 5, 119. [Google Scholar] [CrossRef] [Green Version]
  96. Krasnoperova, E.E.; Buy, D.D.; Goriunova, I.I.; Isayenkov, S.; Karpov, P.A.; Blume, Y.B.; Yemets, A.I. The Potential Role of SnRK1 Protein Kinases in the Regulation of Cell Division in Arabidopsis thaliana. Cytol. Genet. 2019, 53, 185–191. [Google Scholar] [CrossRef]
  97. Xie, X.; Song, M.-H.; Jin, F.; Ahn, S.-N.; Suh, J.-P.; Hwang, H.-G.; McCouch, S.R. Fine mapping of a grain weight quantitative trait locus on rice chromosome 8 using near-isogenic lines derived from a cross between Oryza sativa and Oryza rufipogon. Theor. Appl. Genet. 2006, 113, 885–894. [Google Scholar] [CrossRef] [PubMed]
  98. Oh, J.-M.; Balkunde, S.; Yang, P.; Yoon, D.-B.; Ahn, S.-N. Fine mapping of grain weight QTL, tgw11 using near isogenic lines from a cross between Oryza sativa and O. grandiglumis. Genes Genom. 2011, 33, 259–265. [Google Scholar] [CrossRef]
Figure 1. Frequency distribution of traits and quantile-quantile plots. (AE) Frequency distribution of grain length (GLE), grain width (GWE), grain thickness (GTE) grain length–width ratio (LWRE), and thousands grain weight (TGWE) of 117 rice doubled haploid lines for early-transplanting. (FJ) Quantile–Quantile (Q–Q) plots for GLE, GWE, GTE, LWRE, and TGWE for early-transplanting period, (KO) frequency distribution of grain length (GLL), grain width (GWL), grain thickness (GTL), grain length–width ratio (LWRL), and thousands grain weight (TGWL) at late-transplanting. (PT) Q-Q plots for GLL, GWL, GTL, LWRL, and TGWL for late transplanting period. –log10(p) is the negative logarithm base 10 quantile-quantile (Q-Q) of the P-values (expected and observed) for traits.
Agronomy 10 01532 g001
Figure 2. Correlation between rice grain traits. (A) Predicted correlation (very weak positive or non-existing correlation) between grain length (GL) and thousand grain weight (TGW). (B) Predicted strong positive correlation between grain width (GW) and thousand grain weight (TGW). (C) Predicted positive correlation between grain thickness (GT) and thousand grain weight (TGW). (D) Predicted negative correlation (very weak or non-existing correlation) between grain length–width ratio (LWR) and thousand grain weight (TGW). Data are phenotypes of early-transplanted rice DH lines. A similar correlation pattern was observed in late-transplanted rice (data not shown).
Agronomy 10 01532 g002
Figure 3. Distinctive rice grain traits of 93-11 (P1, indica) and Milyang352 (P2, japonica). (A) Length of rice grains of parental lines, 93-11 (P1) compared to Milyang352 (P2), at early- and late-transplanted rice. (B) Grain weight of P1 and P2 recorded at early- (GLE) and late- (GLL) transplanting periods. (C) Grain length–width ratio (LWRE, for early-transplanted rice; LWRL, for late-transplanted rice) of P1 and P2. (D) Grain thickness (GTE, for early-transplanted rice; GTL, for late-transplanting) of P1 and P2. (E) Thousand grain weight (TGWE, for early- transplanting, and TGWL, for late-transplanting) of parental lines. Bars are mean values ±SD. *** P < 0.001, * P < 0.05.
Agronomy 10 01532 g003
Figure 4. Kinship matrix and principal component analysis (PCA) results. (A) The density map of pairwise kinship matrix values generated based on 240 KASP markers on a doubled haploid (DH) population of 117 lines following the VanRaden algorithm. The color key with a histogram indicates the distribution of coefficients of co-ancestry. The color density shows the level of relatedness of DH lines. (B) Eigenvalue accumulation variance among the principal components (PCs) revealing the contribution to 3 PCs only. (C) Scattered plot of PCA of the DH population, calculated from 240 KASP markers, and clustered based on thousand grain weight (TGW). High, middle, and low TGW are grouped into brown (top ellipse), blue (middle ellipse), and green (bottom ellipse). (D) The principal components indicating the correlation variables at early- and late-transplanting. (E) Heat map with dendrograms showing the affinity between grain traits at early and late transplanting.
Agronomy 10 01532 g004
Figure 5. Linkage maps and detected QTLs associated with various grain traits mapped to different chromosomes of rice. Seven (7) QTLs (qGLE-1-1, 32 cM; qGLE-3-1, 46 cM; qGLE-3-2, 203 cM; qGLE-5-1, 24 cM; qGLE-7-1, 156 cM; qGLE-12-1, 13 cM; and qGLE-12-2, 130 cM) associated with rice grain length were mapped on four (4) chromosomes, for early-transplanting; and four (4) QTLs (qGLL-1-1, 19 cM; qGLL-1-2, 81 cM; qGLL-7-1, 150 cM; and qGLL-11-1, 7 cM) associated with rice grain length detected at different positions for late-transplanting. The QTLs associated with rice grain weight were mapped on two chromosomes (qGWE-3-1, 203 cM; qGWE-5-1, 24 cM) for early-transplanted rice, and for late transplanting, six (6) QTLs (qGWL-1-1, 127 cM; qGWL-2-1, 124 cM; qGWL-4-1, 30 cM; qGWL-5-1, 24 cM; qGWL-8-1, 100 cM; and qGWL-10-1, 85 cM) associated with rice grain width, were mapped. For both early- and late-transplanting, four QTLs (qGTE-3-1, 25 cM; qGTE-3-2, 88 cM; qGTE-5-1, 24 cM; and qGTE-12-1, 14 cM) and seven QTLs (qGTL-1-1, 150 cM; qGTL-3-1, 27 cM; qGTL-3-2, 88 cM; qGTL-5-1, 24 cM; qGTL-7-1, 210 cM; qGTL-10-1, 85 cM; and qGTL-12-1, 13 cM) associated with rice grain thickness were detected, respectively. QTLs for grain length–width ratio (LWR) were detected on two chromosomes (qLWRE-5-1, 4 cM; qLWRE-7-1, 93 cM; and qLWRE-7-2, 209 cM) for early-transplanted rice, and mapped to six chromosomes (qLWRL-1-1, 80 cM; qLWRL-3-1, 156 cM; qLWRL-4-1, 159 cM; qLWRL-5-1, 24 cM; qLWRL-7-1, 67 cM; and qLWRL-10-1, 68 cM) for late-transplanting. Finally, QTLs associated with thousand grain weight in rice, were mapped to six (6) chromosomes for early-transplanting (qTGWE-2-1, 132 cM; qTGWE-3-1, 193 cM; qTGWE-5-1, 24 cM; qTGWE-8-1, 102 cM; qTGWE-11-1, 110 cM; and qTGWE-12-1, 14 cM), and four chromosomes for late-transplanted rice (qTGWL-2-1, 138 cM; qTGWL-3-1, 31 cM; qTGWL-8-1, 102 cM; and qTGWL-12-1, 52 cM). (AJ) Chromosomes 1, 2, 3, 4, 5, 7, 8, 10, 11, and 12.
Agronomy 10 01532 g005
Figure 6. Genome-wide Manhattan plots for grain traits of a DH population. (A) QTL for grain length (GLE) on chromosome 12, cmb1226_0 (closest marker), and cmb1202_4 (Closest marker). (B) QTLs with low the logarithm of the odds (LOD) below the predicted genome line were considered as non-significant. (C,D) identical QTL associated with rice grain thickness (GT) detected on chromosome 3 with KJ03_007 being closest marker. (E,F) two major QTLs for grain weight (GW), qGWL-5-1, closer marker: KJ05_013); and qGWL-5-2, closer marker: KJ05_017). (G,H) QTL for rice grain length/width ratio (qLWRL-5-1, closer marker: KJ05_013), and qLWRL-5-2, closer marker: KJ05_17). (I,J) QTLs associated with thousand grain weight, qTGWE-12, closer marker: cmb1226_0), and qTGWL-7 (LOD: 2.3, closest marker: id7001155) and qTGWL-10, closest marker: id10007384).
Agronomy 10 01532 g006
Table 1. Quantitative trait loci (QTLs) associated with various grain traits in rice.
Traits (a)QTL (b)Chr (c)Position (cM) (d)Left Marker (e)Right Marker (f)LOD (g)PVE (%) (h)Add (i)
GLEqGLE-1-1132Os01_KJ01_127Os01_KJ01_1294.845110.808−0.087
qGLE-3-1346Os03_id3003462Os03_KJ03_0178.056219.2940.116
qGLE-3-23203Os03_cmb0336_5Os03_id30184393.143613.146−0.058
qGLE-5-1524Os05_KJ05_017Os05_KJ05_0133.942615.579−0.064
qGLE-7-17156Os07_id7003072Os07_cmb0723_05.694313.7510.1019
qGLE-12-11213Os12_id12000076Os12_cmb1202_44.09849.18720.0801
qGLE-12-212130Os12_cmb1224_0Os12_cmb1226_03.86958.4563−0.077
GLLqGLL-1-1119Os01_KJ01_125Os01_KJ01_1275.35019.0539−0.107
qGLL-1-2181Os01_KJ01_097Os01_ad010159674.58916.23370.091
qGLL-3-1346Os03_id3003462Os03_KJ03_01710.67616.4130.136
qGLL-7-17150Os07_id7003072Os07_cmb0723_018.01732.1510.1963
qGLL-11-1117Os11_id11000131Os11_KJ11_0053.60335.15240.0766
GTEqGTE-3-1325Os03_ad03000001Os03_KJ03_0076.949710.0810.032
qGTE-3-2388Os03_KJ03_031Os03_ah030010949.491412.644−0.036
qGTE-5-1524Os05_KJ05_017Os05_KJ05_01314.18820.25−0.046
qGTE-12-11214Os12_cmb1202_4Os12_KJ12_0076.08087.52650.0277
GTLqGTL-1-11150Os01_id1009557Os01_KJ01_0057.20955.5653−0.025
qGTL-3-1327Os03_ad03000001Os03_KJ03_0079.99099.0270.0291
qGTL-3-2388Os03_KJ03_031Os03_ah0300109413.93412.367−0.034
qGTL-5-1524Os05_KJ05_017Os05_KJ05_01321.99623.347−0.047
qGTL-7-17210Os07_cmb0730_3Os07_KJ07_0854.91143.7314−0.019
qGTL-10-11085Os10_KJ10_039Os10_ah1000118210.1598.4954−0.029
qGTL-12-11213Os12_id12000076Os12_cmb1202_414.61313.2420.0353
GWLqGWL-1-11127Os01_KJ01_075Os01_SaF_CT4.29956.26450.0568
qGWL-2-12124Os02_KJ02_043Os02_KJ02_0455.56258.0429−0.05
qGWL-4-1430Os04_KJ04_049Os04_cmb0418_83.83615.7157−0.042
qGWL-5-1524Os05_KJ05_017Os05_KJ05_01317.21331.664−0.098
qGWL-8-48100Os08_cmb0824_7Os08_GW8--AG3.07474.3320.0377
qGWL-10-11085Os10_KJ10_039Os10_ah100011829.59715.122−0.07
LWREqLWRE-5-1524Os05_KJ05_017Os05_KJ05_0139.813218.992−0.894
qLWRE-7-1793Os07_KJ07_021Os07_id70011556.132615.950.0883
qLWRE-7-27209Os07_id7006027Os07_cmb0730_34.830212.150.0797
LWRLqLWRL-1-1180Os01_KJ01_097Os01_ad010159674.86792.79770.0496
qLWRL-3-13156Os03_ad03014175Os03_Hd6-1AT9.39386.60070.0717
qLWRL-4-14159Os04_ah04001252Os04_id40098235.61563.272−0.053
qLWRL-5-1524Os05_KJ05_017Os05_KJ05_01325.74722.9350.1315
qLWRL-7-1767Os07_cmb0700_1Os07_ud700018734.45637.6650.1677
qLWRL-10-11068Os10_cmb1016_4Os10_wd100037903.36792.05340.0422
TGWEqTGWE-2-12132Os02_KJ02_057Os02_id20127733.79036.4953−0.525
qTGWE-3-13193Os03_ah03002520Os03_cmb0336_53.09865.6929−0.488
qTGWE-5-154Os05_KJ05_029Os05_cmb0511_18.587423.4050.1099
qTGWE-8-18102Os08_GW8--AGOs08_id80077644.86118.56320.6181
qTGWE-11-111110Os11_id11008929Os11_cmb1127_43.50756.0367−0.526
qTGWE-12-11214Os12_cmb1202_4Os12_KJ12_0077.213613.5250.7519
TGWLqTGWL-2-12138Os02_KJ02_057Os02_id20127736.064912.667−0.886
qTGWL-3-1331Os03_KJ03_007Os03_ah030004037.432514.5140.9248
qTGWL-8-18102Os08_GW8--AGOs08_id80077643.44186.74190.6509
qTGWL-12-11252Os12_id12002113Os12_id120037006.431413.0210.9115
(a) rice grain traits evaluated: grain length (GLE), grain width (GWE), grain thickness (GTE), grain length/width ratio (LWRE), and thousand grain weight (TGWE) for early-transplanting; grain length (GLL), grain width (GWL), grain thickness (GTL), grain length/width ratio (LWRL), and thousand grain weight (TGWL) for late-transplanting; (b) Detected QTLs names; (c) chromosome number; (d) absolute position of the QTLs from top of the linkage map in centimorgan (cM); (e) left flanking KASP markers; (f) right flanking KASP markers; (g) logarithm of the odds scores; (h) phenotypic variation explained (PVE) by the QTLs, in percentage; (i) additive effects: the negative value indicates that the allele from Milyang352 (P2) increased the corresponding trait value, while the positive value shows that the allele from 93-11 (P1) increased the trait value.
Table 2. List of candidate genes.
No.Locus NameGene NameDescriptionSimilar Papers
1Os05g08800DUF581DUF581 domain containing protein, expressed[93]
2Os05g08790MFP1MAR-binding filament-like protein 1, putative, expressed[94]
3Os05g08810PPL3-Kphosphatidylinositol 3-kinase, root isoform, putative, expressed-
4Os05g08840DnaKDnaK family protein, putative, expressed-
5Os05g08850CP450cytochrome P450, putative, expressed[51]
6Os05g08870Ty1-copiaretrotransposon protein, putative, Ty1-copia subclass, expressed-
7Os05g08920LEALate embryogenesis abundant protein, putative, expressed, LEA, TF-
8Os05g08930Clo-lumenchloroplast lumen common family protein, putative, expressed-
9Os05g08940MarinerTransposon protein, putative, Mariner sub-class, expressed-
10Os05g08960Ubiquitin E2Ubiquitin-conjugating enzyme, E2 putative, expressed[49]
11Os05g08970SSRP1SSRP1-like FACT complex subunit, putative, expressed, TF-
12Os05g09020WRKY67WRKY67 Transcription factor, expressed-
13Os05g09050MLOMLO domain containing protein, putative, expressed-
14Os05g09080Ty3-gyspsyRetrotransposon protein, putative, Ty3-gypsy subclass, expressed-
15Os05g10210HADHAD superfamily phosphatase, putative, expressed-
16Os05g10230En-SpmTransposon protein, putative, CACTA, En/Spm sub-class, expressed-
17Os05g10380RWP-RKRWP-RK, putative, expressed-
18Os05g10580CullinCullin family domain containing protein, putative, expressed-
19Os05g10620NAMno apical meristem protein, putative, expressed-
20Os05g10650PFK66-phosphofructokinase, putative, expressed-
21Os05g10670Zinc fingerZinc finger CCCH type family protein, putative, expressed-

